Embed Size (px)
Citation preview

FROM NATURE TO YOU
H1 2017 RESULTS14 September 2017
Paris

2
Agenda
H1 highlightsA first-half focused on simplification and execution
H1 2017 resultsIn line with our roadmap
Developments and outlookActivating growth drivers
1.
2.
3.

3
On track for delivering Bright2020 CARE - EXECUTE - GROW
Focus and disciplineGovernance
2015
First levers for profitability
2016
Focus on the product portfolio and the business
project portfolio
2017

4
H1 2017 financial highlights
Acceleration ofsimplification measures
€207.5mSales
€34.5m16.6%EBITDA(% of sales)
Emergingmarkets
40.5%
NPD6%
Inventory-to-salesratio
22.2%

5
H1 HIGHLIGHTS
A first-half focused on simplification and execution

6
Progress in our priority lines of actionCare: People & Pathfinder
Focus on safety
Managing talent
Promoting the adoption of our culture
Increasing ownership of the Pathfinder programme
Improving our environmental footprint
CAREPeople & Culture Sustainable Development
Strongengagement
Performancedriver
Creatingvalue

7
Progress in our priority lines of actionExecute: Simplification and efficacy
Reducing complexity
Lean Management
Global management of indirect procurement
Improving Working Capital Requirements
EXECUTE
Reductionin the number
of SKUs
Improvingprocesses
and internal flows
Implementingan S&OP strategy

8SteerVision Center™ is a registered trademark of Ka Maté Strategy
La SteerVision Center™Steering the Bright2020 strategy
Steering theBright2020
strategy
Decision-making and
implementation of these
decisions
Monitoringand control
of the operations
Involvement of all Directions

9
Analysis of causes and estimates of forecasts
WARNING: Red Graph ESTIMATED FORECASTS: Orange Graph
Action planbased on the Root Causes
TEAM WORKAnalysis of the Root Causes
of Pareto

10
Analysis of causes and estimates of forecasts
WARNING: Red Graph
Action planbased on the Root Causes
TEAM WORKAnalysis of the Root Causes
of Pareto

11
Stronger foundations
The roadmap has been charted
The execution plans have been implemented

12
H1 2017RESULTS
In line with our roadmap

13
H1 2017 financial highlights
€207.5m
REVENUE
(current exch. rates)-0.3%
EBITDA*
NET INCOME
€10.7m5.1%(% of sales)
ACCOUNTSRECEIVABLE
53DSO
INVENTORY-TO-SALESRATIO
40.5%
* Recurring operating EBITDA
16.6%(% of sales)
€34.5m
(current exchange rates)

14
H12017
Revenue 207.5 208.0 -0.3%
Gross margin on COGS 59.4 57.8 +2.8%
Gross margin on COGS (%) 28.7% 27.8%
Recurring operating EBITDA 34.5 33.2 +3.8%
Recurring operating EBITDA margin (%) 16.6% 16.0%
Current operating income 18.1 18.6 -2.6%
Current operating margin (%) 8.7% 8.9%
Net operating income 17.5 19.1 -8.3%
Operating margin (%) 8.4% 9.2%
Net income attributableto Naturex shareholders 10.7 12.2 -12.7%
Net margin (%) 5.1% 5.9%
H12016
Change %
Income statement highlights
IFRSIn €m

REVENUEH1 2017
OPTIMISATION OF THE PRODUCT MIX
16
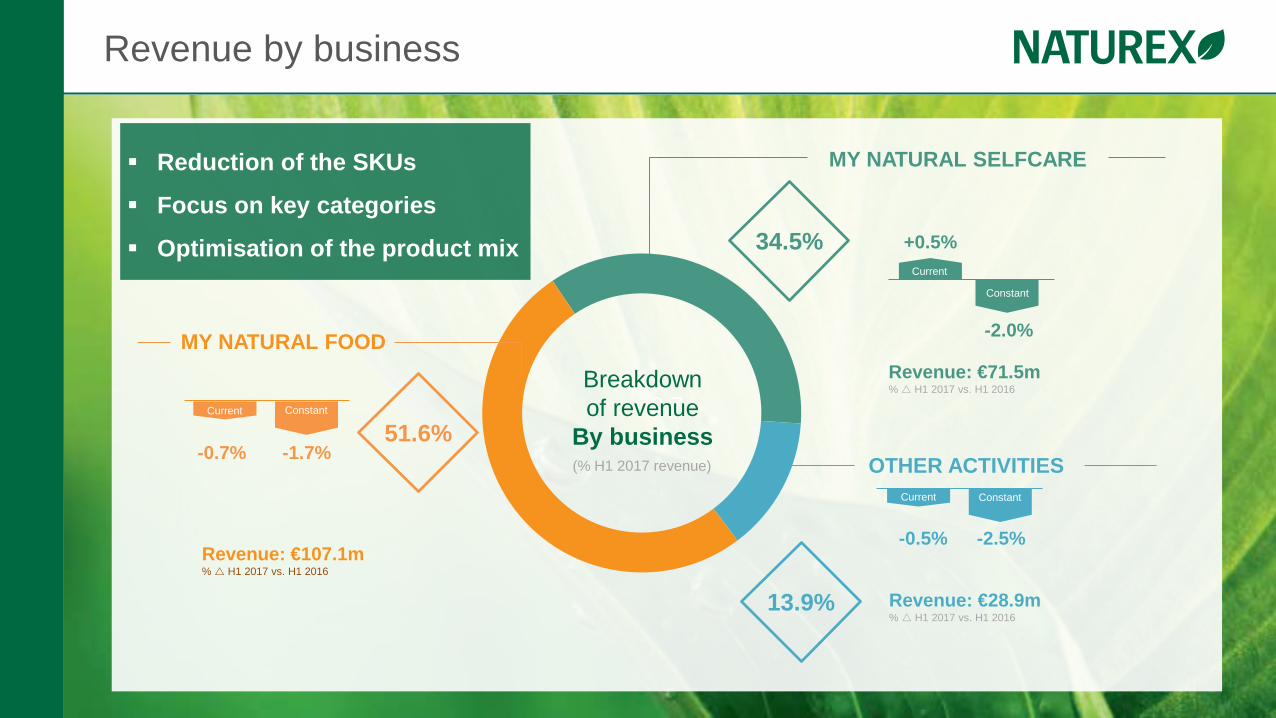
Revenue by business
0.7
MY NATURAL FOOD
MY NATURAL SELFCARE
Revenue: €107.1m% H1 2017 vs. H1 2016
Revenue: €71.5m% H1 2017 vs. H1 2016
OTHER ACTIVITIES
Revenue: €28.9m% H1 2017 vs. H1 2016
Breakdownof revenue
By business(% H1 2017 revenue)
51.6%
34.5%
13.9%
Reduction of the SKUs
Focus on key categories
Optimisation of the product mix
Current
-0.5% -2.5%
Constant
Current
+0.5%
-2.0%
Constant
-1.7%-0.7%
Current Constant

17
NorthAmerica
€91.4m
AsiaPacific
€31.6m
EuropeAfrica
Middle East
€69.8m
+25.1%
15.2%(% of sales)
-10.3%
33.7%(% of sales)
+0.5%
44.1%(% of sales)
Latin America
€14.6m
+4.1%
7.0%(% of sales)
Revenue by regionOur strong original organisation is impacted by the disparities and volatility of our markets
H1 2017 revenue Changes at current exchange ratesCurrency effect: €3.4m (Positive impact: USD and AUD. Negative impact: GBP)
OPERATING PROFITABILITY
Activating ourperformance drivers

19
Expenses by functionEffective cost-containment measures and the allocation of our resources
5.9
15.2
18.4
7.4
14.916.5
Research and Development Marketing and Sales General and Administrative
of sales2.8% 3.6%
of sales7.3%of sales
7.2%of sales
8.8%of sales
7.9%of sales
Accelerating innovation
Deployinga regional salesforce
Rationalisingthe support functions
Reductionin operating expenses
CHANGE IN EXPENSES BY FUNCTION(€m)
H1 2016 H1 2017

FINANCIALPOSITION
Focus and disciplinefor an improvedmanagement of our flows

21
Working capital requirementsImpact of the inventory categorisation process
DSO53 days
Inventories40.5%
of sales (favourable currency effect)
CHANGE IN WORKING CAPITAL REQUIREMENTS(€m)
186.1196.4
182.4
30.06.2016 31.12.2016 30.06.2017
46%of sales
45%of sales
49%of sales
22
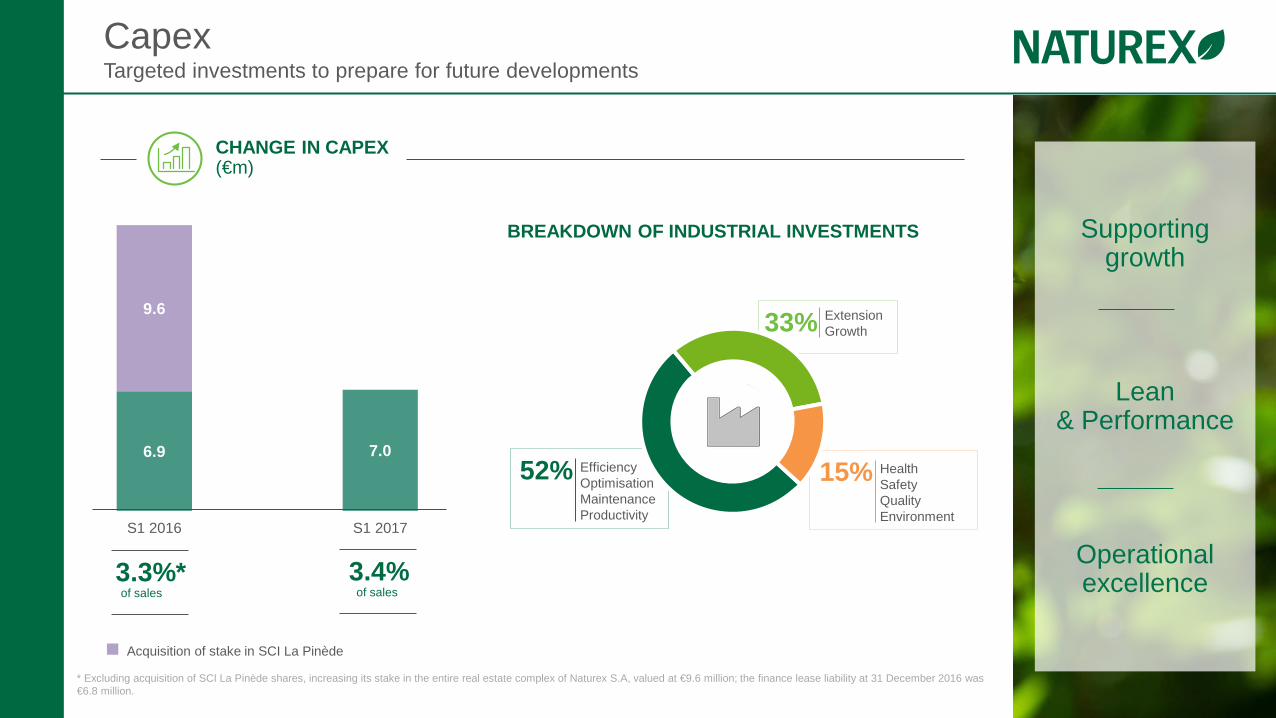
HealthSafetyQualityEnvironment
15%
ExtensionGrowth33%
CapexTargeted investments to prepare for future developments
Supporting growth
Lean& Performance
Operational excellence
CHANGE IN CAPEX(€m)
6.9 7.0
9.6
S1 2016 S1 2017
Acquisition of stake in SCI La Pinède
BREAKDOWN OF INDUSTRIAL INVESTMENTS
* Excluding acquisition of SCI La Pinède shares, increasing its stake in the entire real estate complex of Naturex S.A, valued at €9.6 million; the finance lease liability at 31 December 2016 was €6.8 million.
3.3%*of sales
3.4%of sales
EfficiencyOptimisationMaintenanceProductivity
52%

23
CHANGE IN NET FINANCIAL DEBT(€m)
Net financial debt A new structured credit facility providing greater flexibility
173.9
147.0
31.12.2016 30.06.2017
Cost of the structured credit facility: 2.48%
Financial leverage: 2.34
vs. 2.83 at 31/12/2016
Gearing40.3%
vs. 46.7% at 31/12/2016
Bank covenants are respected
Maximum capacity€280m
Full amount repayable on
maturity
Maturityextendedto 2022
Increaseflexibility

24
An improving financial position
Controlled cost structureand well-managed WCR
Negotiation of financial capacitiesto prepare our future developments

25
DEVELOPMENTSAND OUTLOOK
Activatingthe growth engines
26
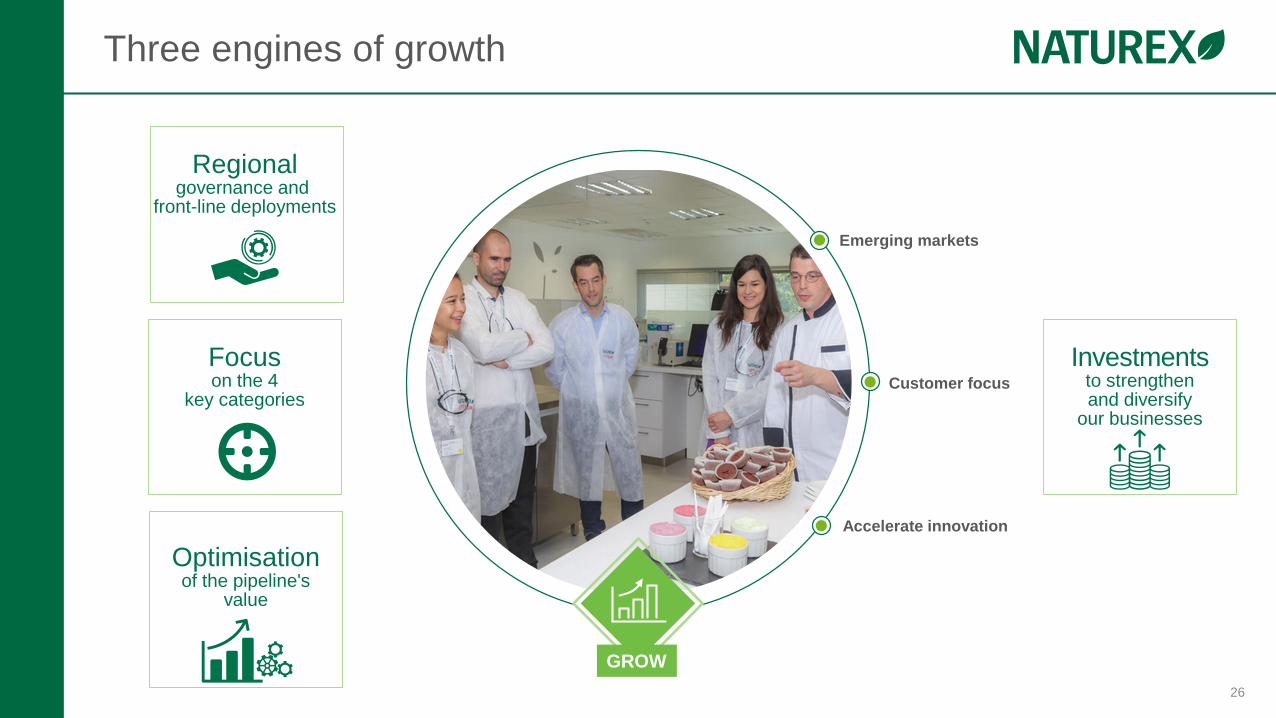
Three engines of growth
Emerging markets
Customer focus
Accelerate innovation
GROW
Regionalgovernance and
front-line deployments
Focuson the 4
key categories
Optimisationof the pipeline's
value
Investmentsto strengthenand diversify
our businesses

27
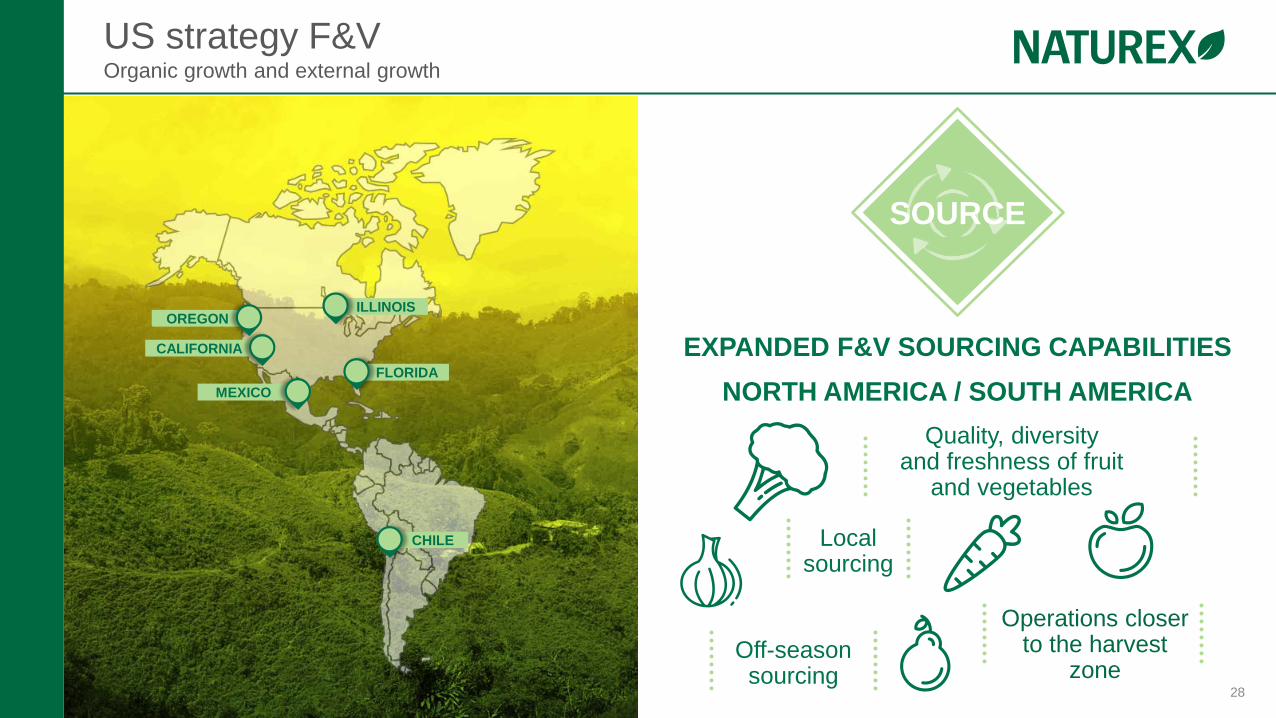
US strategy F&VOrganic growth and external growth
Acquisition of the selected industrial technologies and operations of Haliburton Intl Foods
Acquisition of new technologies Natural vegetable-based solutions
(purees, sauces, roasted veggies) Acquiring a new industrial footprint Exclusive negotiations to acquire business
and manufacturing operations in the US Natural fruit-based specialties
Drum dryer capabilities (VJI) Additional technology to transform
vegetable and fruit-based juices and purees into powder
Buyout of Chile Botanics' minority shareholders
Agreement to buy out their stake F&V off-season sourcing synergies
and development of application solutions
ORGANIC GROWTH EXTERNAL GROWTH
28
SOURCE
US strategy F&VOrganic growth and external growth
EXPANDED F&V SOURCING CAPABILITIESNORTH AMERICA / SOUTH AMERICA
CHILE
MEXICO
CALIFORNIA
OREGONILLINOIS
FLORIDA
Localsourcing
Quality, diversityand freshness of fruit
and vegetables
Off-seasonsourcing
Operations closerto the harvest
zone
29
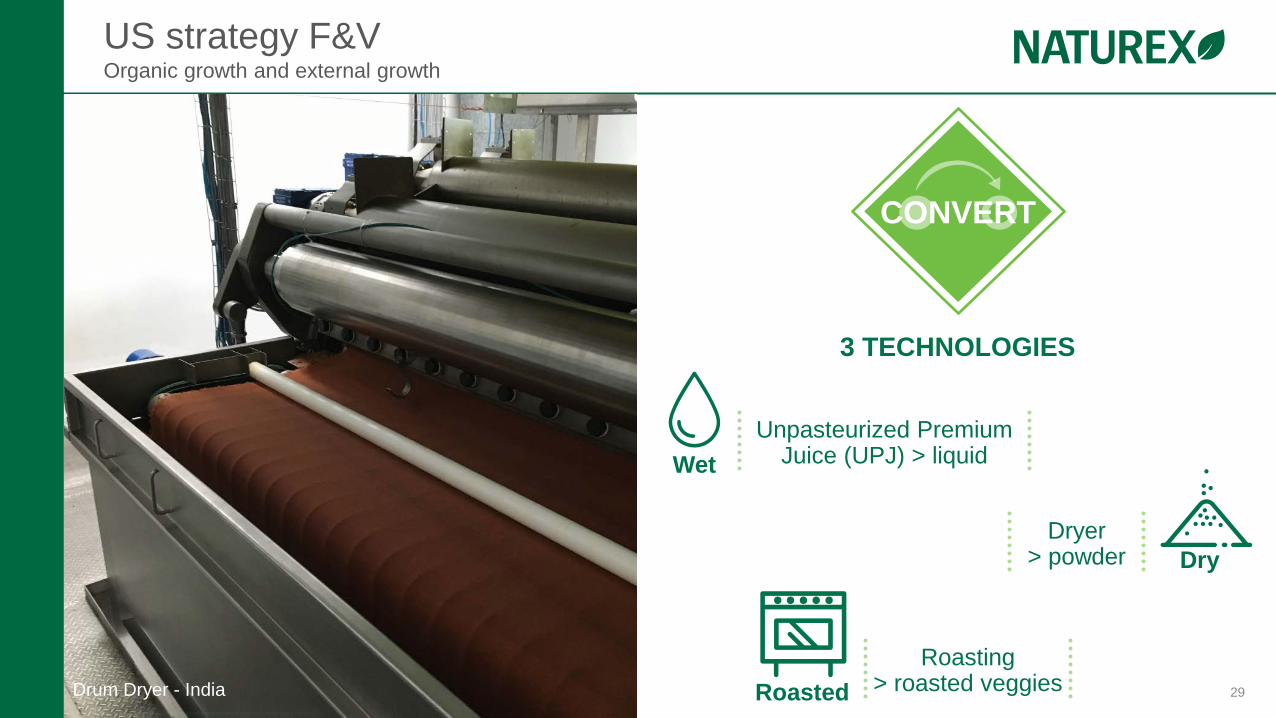
CONVERT
Drum Dryer - India
US strategy F&VOrganic growth and external growth
3 TECHNOLOGIES
WetUnpasteurized Premium
Juice (UPJ) > liquid
RoastedRoasting
> roasted veggies
DryDryer
> powder
30
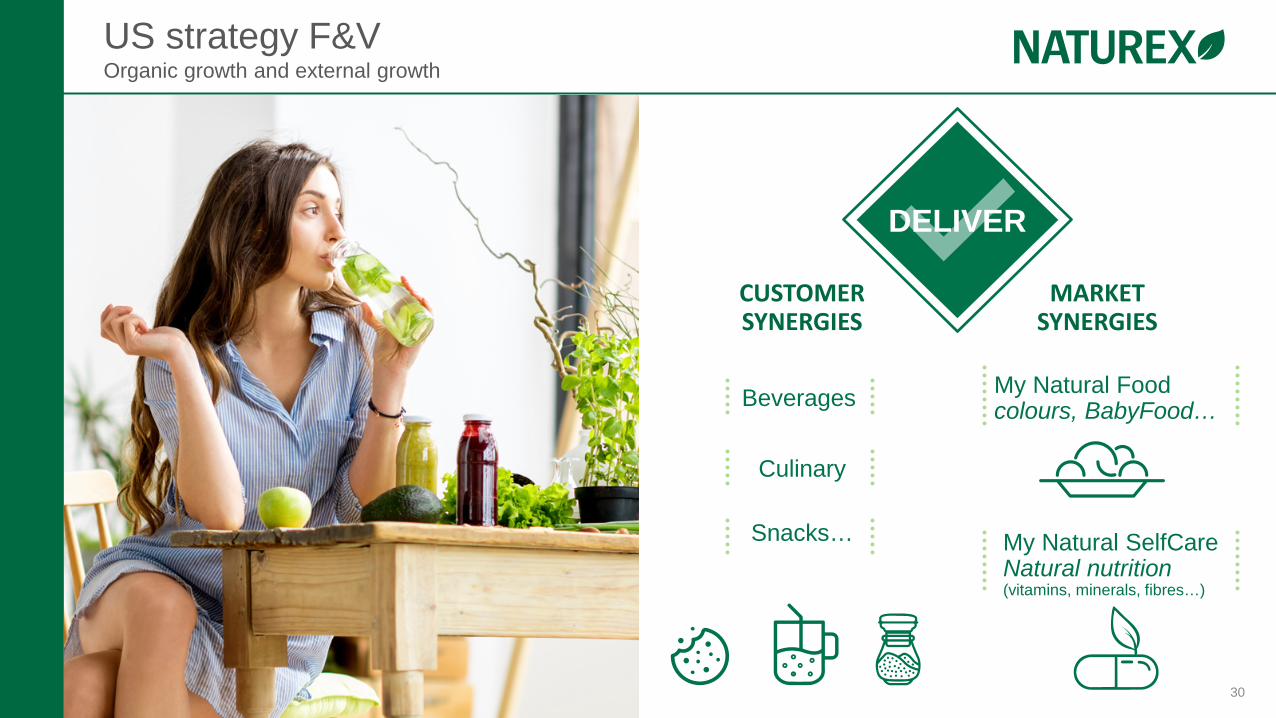
DELIVER
CUSTOMERSYNERGIES
My Natural SelfCareNatural nutrition(vitamins, minerals, fibres…)
US strategy F&VOrganic growth and external growth
MARKETSYNERGIES
My Natural Foodcolours, BabyFood…Beverages
Culinary
Snacks…

31
NEW NATURAL ANTIMICROBIAL SOLUTION FOR SAFETY AND CLEAN LABELS IN MEAT
Natural preservatives strategyOrganic growth
RosemaryAtlas Mountains, Morocco
Innovation de rupture
STRONG MARKET TRENDS IN FAVOROF NATURAL PRESERVATIVES
Naturalness Clean label Regulations
PROMOTING THE SHIFT FROM SYNTHETIC TO NATURAL Aligning our industrial capabilities with market
growth on rosemary Completing our range with antimicrobials Fostering breakthrough innovations
AcerolaAlternative to synthetic ascorbic acid

32
ChicagoIllinois - USA Birmingham
UK
AvignonFRANCE
Sao PauloBRAZIL Sydney
AUSTRALIA
MumbaiINDIA
MoscowRUSSIA
ShanghaiCHINA
FOOD & BEVERAGEPERSONAL CARE
Mexico CityMEXICO
Singapore
SpringlabsDriver of performance and differentiation
SUPPORTING THE SALE AND DEVLOPMENTOF THE PIPELINE OF SOLD BUSINESS PROJECTS Customer support and market expertise
Accelerating innovation and improving time-to-market
Promoting our technical expertise in natural ingredients Supporting the development of specific solutions
11 APPLICATION LABORATORIESTHROUGHOUT THE WORLD
Latest openings: Chicago (expansion), Mexico, Singapore Springlab Chicago

33
Diversifying our portfolio to expandand strengthen our presence in our markets
Bolster the commercial pipeline to create value
Investments to fueland accelerate our organic growth

34
Solid foundationsfor the compositionof the organic portfolio
Structural efforts appliedto the running operations
Regional organisationfor greater agility and better allocation of resources
Optimising our financing capacities in preparationfor future developments
Supporting momentum of key categories F&V: Organic growth + M&A
AOX: Organic growth
• Replicating the same strategic review process Colours and Phytoactives
• Focus on innovationand Open innovation
Growth dynamics
P H A S E 1 . P H A S E 2 .
SIMPLIFICATIONCOMPLETED
ENERGISING THECOMMERCIAL PIPELINE
Fully focused on executingour Bright2020 roadmap
Focus on the product portfolio and business pipeline
For a gradual returnto growth in H2 2017
FY 2017

THANK YOU
Q&A