Embed Size (px)
Citation preview

From Mill Town to Board Room: TheRise of Women’s Paid Labor
Dora L. Costa
I n the United States and in other OECD countries of the twenty-first century,women are likely to be active participants in the labor force, holding the fullrange of unskilled, professional and managerial jobs. Widespread work for
pay outside of the home and work in the highest echelons of society would havebeen unheard of for the women of a century ago. In the United States, only20 percent of all women worked for pay in 1900. Less than 6 percent of all marriedwomen older than 15 labored for pay. Those who did work came from predomi-nately working-class families. By the century’s end, the labor force participation ofall women older than 16 had risen to 60 percent, participation of all marriedwomen older than 16 had risen to 62 percent, and participation rates were higheramong college educated women than among those with a high school education orless.
This dramatic change in women’s social and economic status can only beunderstood by looking to the past. In the first few decades of the twentieth century,the “factory girl” set the stage for the unmarried “office girl.” The unmarried officegirl paved the way for the entry of married women into the labor force in the late1950s, even though this entry was primarily in dead-end jobs in the clerical sector.In turn, the married women in the labor force paved the way for the rise of themodern career woman, doing work that requires a lengthy period of training andthat offers genuine opportunities for promotion. As late as 1970, only 14 percent ofall doctoral degrees were awarded to women, only 8 percent of all students enrolledin law schools were women, and only 8 percent of all medical school graduates werewomen. By the end of the 1990s, women earned 40 percent of all doctoral degreesand represented over 40 percent of all graduates from medical and law schools
y Dora L. Costa is Associate Professor of Economics, Massachusetts Institute of Technology,Cambridge, Massachusetts.
Journal of Economic Perspectives—Volume 14, Number 4—Fall 2000—Pages 101–122

(National Science Foundation, 1999; American Medical Association; American BarAssociation).
This increase in women’s paid work has had enormous social and politicalsignificance. Increased retirement has decreased the paid labor of older men andincreased education has reduced the paid labor of the young. The one majorcountervailing trend in the twentieth century that has expanded the labor forceparticipation rate has been the increased participation of women. During thetwentieth century, the rising labor force participation of women has increased theaggregate labor force participation rate of 25 to 44 year-olds by about 50 percent(Goldin, 1986). Women’s greater participation has also led to the growth of marketsubstitutes for such home-produced goods as food and clothing. Women’s greaterwork for pay has altered the power relationships between husbands and wives, hasinfluenced family formation and dissolution, and has affected the distribution ofresources within the family (Lundberg and Pollak, 1996). One husband in a studyof working-class families gave an inadvertently memorable flavor of the changeswrought by women’s entry into the workforce when he complained that his wife“doesn’t know how to give respect . . . Because she’s working and making money,she thinks she can argue back whenever she feels like it” (cited in Goldin, 1990,p. 11).
We have not yet seen the full social and political impact of the rise in women’spaid labor, because the more fundamental changes come from women’s entry intocareers, and this entry is still a relatively recent phenomenon. Work for money,regardless of type of work, generates different attitudes and relationships amongfamily members. Two careers, by bringing true equality into marriage, generate yetanother set of attitudes and relationships between husband and wife. The increasedimportance that both husbands and wives attach to her career has been felt in allsectors of the economy. The rise of dual career households has benefited largemetropolitan areas and has hurt the ability of smaller cities to attract highly skilledindividuals because these individuals are increasingly bundled with an equallyskilled spouse and need the larger labor markets offered by larger metropolitanareas to solve their colocation problem (Costa and Kahn, forthcoming). Since the1960s labor force participation rates have increased fastest among the wives ofcollege educated men (Juhn and Murphy, 1997), the rise of the dual careerhousehold has affected household income inequality. The increased supply ofprofessional women has benefited firms needing highly skilled workers, but wom-en’s expanding career opportunities have hurt such fields as education that tradi-tionally depended upon women’s labor (Flyer and Rosen, 1997).
This essay begins with a description of trends in women’s labor force partici-pation rates in the United States, France, and Great Britain over more than 100years. Britain and France present two extreme cases: Britain was highly industrial-ized early in the twentieth century, while a large proportion of France’s populationat that time worked in agriculture. It examines the types of jobs women held andthe life cycle of paid work in the United States over the last two centuries. It alsodescribes trends in several OECD countries since 1960, with a particular focus on
102 Journal of Economic Perspectives

the growth in the labor force participation of married women. It concludes with alook towards the future.
Trends
Long-Run Labor Force Participation RatesThe history of women’s participation in market work is complicated by issues
of measurement. The basic concept of being “in the labor force” is fraught withambiguities. In the United States prior to 1940, only women who claimed to havehad an occupation during the year just prior to the census were considered to be“gainfully employed” and therefore enumerated as being in the labor force. Be-ginning in 1940, the definition of the labor force changed to include all individualsworking for pay, unpaid family workers, and the unemployed seeking work duringthe survey week. These differences in definition are unlikely to affect the enumer-ation of the adult male labor force by much. However, they will definitely affect theenumeration of female labor at a time when many women worked as unpaidfarmwives, boardinghouse-keepers, and industrial homeworkers. Although consis-tency suggests that these women should be included in the definition of the laborforce, their exclusion does not affect the measurement of women’s paid workoutside of the home.
Figure 1 shows the growth in women’s labor force participation rates in theUnited States. In 1890 only 18 percent of women worked for pay, and that figurehad risen only to 26 percent by 1930. By 1998, the participation rate for women was60 percent. Most of the growth prior to 1940 was in the labor force participation ofwhite women. Labor force participation rates for black women were constant atabout 43 percent prior to 1940, fell during the Depression, and then began theirmodern rise. Participation rates were traditionally higher for black than for whitewomen in part because black household incomes were lower, making the incomeearned by women more important, and also because the legacy of slavery may havemade paid work less socially stigmatized among black than among white marriedwomen (Goldin, 1977). Figure 1 overstates the increase in women’s economicactivity rates during the nineteenth and early twentieth century because, prior to1940, the largest shift for women in the labor force was movement from unpaidfamily businesses to paid jobs outside of the home. Correcting the 1890 figure toaccount for the omission of unpaid family farm labor, of boardinghouse-keepers,and of manufacturing workers suggests that broader participation in market workin 1890 was about the same in 1890 as in 1940 among all women and was higher in1890 than in 1940 among married women (Goldin, 1990, p. 44).
Figure 2 shows labor force participation rates in Great Britain and Francereaching back to the early nineteenth century. In Great Britain, women’s partici-pation rates were the same in 1881 and 1961. But by 1998, labor force participationrates for women were 53 percent. In contrast, labor force participation rates forFrench women trended upwards during the nineteenth century to reach a peak of
Dora L. Costa 103

48 percent in 1911, declined with the industrialization of the first half of thetwentieth century (as did those of men), and then rose beginning in the 1960s.French labor force participation rates for women may have been higher than theBritish because French agriculture employed many women and France industrial-ized only very slowly. France may also not have developed the male breadwinnerideology associated in Britain with industrialization (Marchand and Thelot, 1991;Horrell and Humphries, 1995). As in the American case, British and French laborforce participation rates prior to the second half of the twentieth century areprobably understated because they undercount employment in family enterprisesand casual labor (Higgs, 1987; Grantham and Grimard, 1999). Joshi and Owen(1987) argue that because even the later censuses do not fully enumerate marriedwomen working only a few hours a week, the rise in women’s participation ratesafter 1951 may be overstated, reflecting a movement from part-time to full-timework rather than a true increase in labor force participation rates.
In the United States and in Great Britain, the biggest increase in participationrates in the twentieth century has been for married women. In both countries, most ofthe increase was after 1940, as shown in Table 1, but was unrelated to World War II.1
Among British women of working age, the participation rate of unmarried women was
1 In the United States, empirical work shows that the direct impact of the war was small. The majorityof women who entered the labor force during the war exited it after the war (Goldin, 1991). Fineganand Margo (1994) argue that in the 1930s married women were very unresponsive to short-runmovements in aggregate demand but that their responsiveness to sustained increases in aggregate
Figure 1Labor Force Participation Rates by Race, United States, 1870–1999
Note: Rates for 1890–1980 are from Goldin (1990, p. 17). Rates for 1870 and 1880 were estimatedfrom the integrated public use micro census samples (Ruggles and Sobeck, 1997). Rates for 1990and 1999 are from the Bureau of Labor Statistics website.
104 Journal of Economic Perspectives

roughly constant between 1911 and 1998; in contrast, the participation of marriedwoman hovered at about 10 percent between 1911 and 1931 but by 1998 surpassed thatof unmarried women. In the United States, the labor force participation rate of singlewomen older than 15 or 16 rose from 41 to 51 percent between 1890 and 1970 andthen to 68 percent in 1998. The participation rate of married women in the same agegroup was less than 5 percent at the end of the nineteenth century and by 1940 was stillonly 14 percent. Between 1950 and 1998, it rose from 22 to 62 percent, with particularlylarge increases between 1950 and 1980. The growth of labor force participation ratesfor women has continued in the 1990s, but at a markedly lower rate. The time trendamong black women is similar, but participation rates were initially higher for marriedblack women (Goldin, 1990, p. 17).
As seen in Table 1, labor force participation rates of married women have alwaysbeen very similar in Britain and the United States, while those of single women havediffered. However, in the United States, participation rates increased for single women,while the same increase in unmarried women’s labor force participation rates is notobserved in Britain because unmarried women’s participation rates were high even atthe beginning of the century. Around 1920, 62 percent of unmarried British women
demand, such as that during World War II, was quite large. Note also that Figure 2 shows no direct effectof the war in either Britain or France.
Figure 2Labor Force Participation Rates in Great Britain and France
Note: French participation rates for 1820–1990 are from Marchand and Thelot (1991, p. 175). TheFrench participation rate for 1995 is from the INSEE website. British participation rates for1891–1961 are from Matthews, Feinstein, and Odling-Smee (1982, pp. 563–65). Those for 1971–1998are from the Office for National Statistics website. Participation rates for 1891–1971 are for agesolder than 14 and those for 1981–1998 are for ages older than 15.
From Mill Town to Board Room: The Rise of Women’s Paid Labor 105
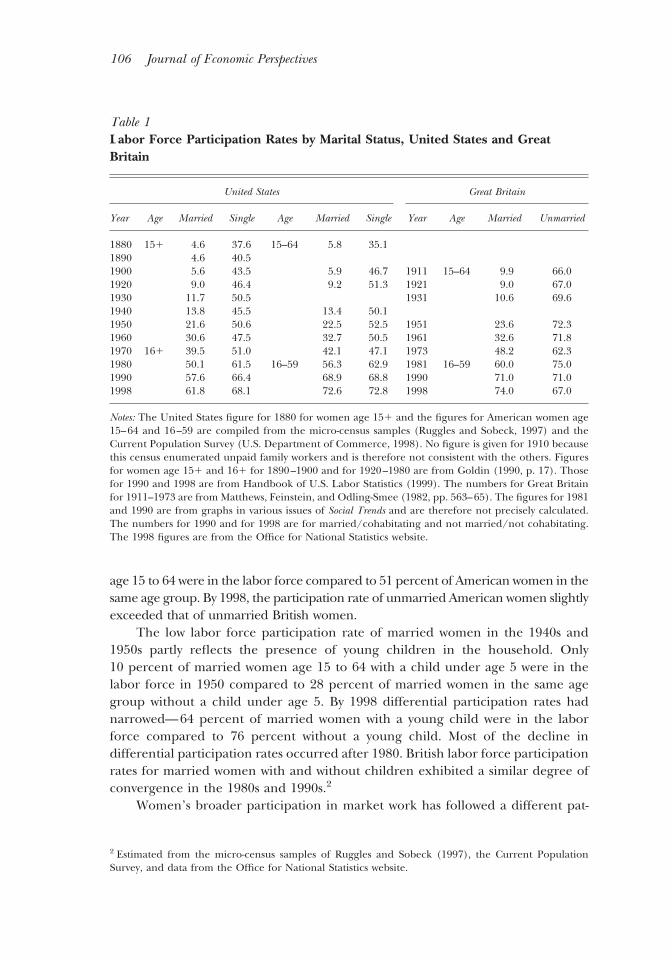
age 15 to 64 were in the labor force compared to 51 percent of American women in thesame age group. By 1998, the participation rate of unmarried American women slightlyexceeded that of unmarried British women.
The low labor force participation rate of married women in the 1940s and1950s partly reflects the presence of young children in the household. Only10 percent of married women age 15 to 64 with a child under age 5 were in thelabor force in 1950 compared to 28 percent of married women in the same agegroup without a child under age 5. By 1998 differential participation rates hadnarrowed—64 percent of married women with a young child were in the laborforce compared to 76 percent without a young child. Most of the decline indifferential participation rates occurred after 1980. British labor force participationrates for married women with and without children exhibited a similar degree ofconvergence in the 1980s and 1990s.2
Women’s broader participation in market work has followed a different pat-
2 Estimated from the micro-census samples of Ruggles and Sobeck (1997), the Current PopulationSurvey, and data from the Office for National Statistics website.
Table 1Labor Force Participation Rates by Marital Status, United States and GreatBritain
United States Great Britain
Year Age Married Single Age Married Single Year Age Married Unmarried
1880 151 4.6 37.6 15–64 5.8 35.11890 4.6 40.51900 5.6 43.5 5.9 46.7 1911 15–64 9.9 66.01920 9.0 46.4 9.2 51.3 1921 9.0 67.01930 11.7 50.5 1931 10.6 69.61940 13.8 45.5 13.4 50.11950 21.6 50.6 22.5 52.5 1951 23.6 72.31960 30.6 47.5 32.7 50.5 1961 32.6 71.81970 161 39.5 51.0 42.1 47.1 1973 48.2 62.31980 50.1 61.5 16–59 56.3 62.9 1981 16–59 60.0 75.01990 57.6 66.4 68.9 68.8 1990 71.0 71.01998 61.8 68.1 72.6 72.8 1998 74.0 67.0
Notes: The United States figure for 1880 for women age 151 and the figures for American women age15–64 and 16–59 are compiled from the micro-census samples (Ruggles and Sobeck, 1997) and theCurrent Population Survey (U.S. Department of Commerce, 1998). No figure is given for 1910 becausethis census enumerated unpaid family workers and is therefore not consistent with the others. Figuresfor women age 151 and 161 for 1890–1900 and for 1920–1980 are from Goldin (1990, p. 17). Thosefor 1990 and 1998 are from Handbook of U.S. Labor Statistics (1999). The numbers for Great Britainfor 1911–1973 are from Matthews, Feinstein, and Odling-Smee (1982, pp. 563–65). The figures for 1981and 1990 are from graphs in various issues of Social Trends and are therefore not precisely calculated.The numbers for 1990 and for 1998 are for married/cohabitating and not married/not cohabitating.The 1998 figures are from the Office for National Statistics website.
106 Journal of Economic Perspectives

tern over time from women’s work for pay outside the home (documented in thefigures and the table). Goldin (1995) argues that women’s labor force participa-tion, when measured to include unpaid family workers, is U-shaped. When incomesare low, women are in the labor force as unpaid workers in family farms orbusinesses. As incomes rise, women’s participation first falls and then rises as theireducational levels grow and their market work becomes more valuable than theirhousehold work. In Britain, the contribution of wives and daughters to householdincomes declined between 1790 and 1865, coinciding with the commercializationof agriculture and the decline of such domestic outwork activities as spinning forpay inside the home (Horrell and Humphries, 1995). Revised estimates of thecensus figures for England and Wales that account for women’s roles as unpaidworkers show that participation rates declined between 1851 and 1891 (Higgs,1987). The enumeration of unpaid family workers in the French census of 1851implies that women’s participation fell with the contraction of agriculture between1850 and 1950 (Grantham and Grimard, 1999). If we go back even further in time,women’s participation may have more of an N-shape. De Vries (1994) and Voth(1998) argue that prior to the industrial revolution, there was an “industriousrevolution” because the increased availability of consumer goods led both men andwomen to increase their hours of work.
Women’s WorkCohorts of women differ in their education and wealth, their fertility, their
accumulation of labor market experience, and their socialization experiences whenyoung. In the United States, labor force participation rates among women in their40s increased sharply beginning with the cohort born between 1906 and 1915.Among women in their 20s and 30s, labor force participation rates have beenincreasing for all cohorts born since the 1940s (Goldin, 1990, pp. 21–23). In thefollowing paragraphs I will therefore describe the experiences of American womenwho worked before 1890, between 1890 and 1940, 1940 and 1970, and after 1970,drawing heavily upon Goldin (1990).
At the beginning of the nineteenth century when the United States was still aheavily agricultural nation, wives and daughters of farmers who were economicallyactive were most likely to be unpaid workers on the family farm. Industrializationdivided the workplace and the home and decreased the economic activity ofmarried women. It increased the participation of young, single women in paidlabor prior to 1850 because the spread of new large-scale methods of productionfacilitated the substitution of unskilled for skilled labor. Farmers’ daughters flockedto the newly established mill towns where they earned higher wages than as servantsand worked shorter hours. In the Northeast in 1820 approximately 9 percent ofworkers in manufacturing were women. This figure reached a peak of 33 percentin 1832 before falling (Goldin and Sokoloff, 1982).
The mill town declined as industry became progressively urbanized. Whereasthe mill girls worked at factories built at water sites and some even lived inboardinghouses built by factory owners, the working girl of the second half of the
Dora L. Costa 107

nineteenth century was more likely to live at home and to give more of her earningsto her family. Beginning in the 1840s, working women were more likely to beimmigrants, and hours, wages, and conditions of work probably worsened.
The rise of the clerical sector transformed women’s work. At the end of thenineteenth century most working women were employed in either the service orthe manufacturing sector and most men were employed in either agriculture ormanufacturing, as shown in Table 2. By 1930, the service, clerical, and manufac-turing sectors had become the most important sectors of employment for women,whereas manufacturing and agriculture remained so for men. Women also enteredinto the professions, particularly teaching.
At the end of the nineteenth century, clerks and secretaries were trusted maleemployees familiar with the entire operations of the firm. They were also employeeswho could be promoted to the top echelons of the company. As firm size increased,as accounting departments within firms grew, and as departments run by middlemanagers were created, demand for clerical staff increased. The division of laborand specialization increased because the typewriter and other machines, includingthose for bookkeeping, accounting, and duplicating, allowed firms to hire workerswho had either attended commercial schools or taken commercial classes in highschool and to put them to work with very little on-the-job training. Many of theseworkers were women, because the growth in high school education between the1890s and the 1940s provided them with the necessary general skills. The clericalsector provided them with better pay and cleaner, less arduous work than manu-facturing. But because women were expected to leave the labor force upon mar-riage, they worked at jobs from which they were never promoted, whereas mencould rise from office boy to president of the company. It is therefore in this sectorthat we first observe substantial wage discrimination (Goldin, 1990, pp. 110–117).
The clerical sector transformed the work of married women. Female manu-facturing workers were heavily penalized for changes in both occupation and firm,retaining only 20 percent of their experience-related increase in earnings. Womenin the clerical sector who changed both occupation and firm kept more than60 percent (Goldin, 1990, p. 108). Women in the clerical sector could thereforeleave the labor force when their first child was born and then re-enter the laborforce when their children were of school age without paying a heavy penalty fortime spent out of the labor force. Members of the cohort born between 1906 and1915 were among the first to follow this pattern of exit when their children wereyoung and re-entry when they were in their 40s. By 1970, 35 percent of all workingwomen were in the clerical sector, compared to 8 percent of men, as shown inTable 2. This sector drew not only from the ranks of high school graduates, but alsofrom those of college graduates.
The emergence of part-time work after 1950 altered the paid work opportunitiesof married women. A working woman in 1890 was faced with an average work day of9.5 hours (Costa, 2000), six days a week. The length of the work day was rigid, withpenalties for tardiness (Atack and Bateman, 1992). Only outwork, with its low pay, orboardinghouse-keeping, with its requirement of home ownership, provided opportu-
108 Journal of Economic Perspectives

nities for part-time work. This set of work opportunities changed after 1950, when firmswere faced with a declining supply of young, unmarried female workers because ofincreases in school attendance, declines in age at first marriage, and the baby boom.Firms sought to accommodate the work schedule demands of married women (Goldin,1990, p. 175, 181). Much of the growth in women’s employment between 1950 and1970 consisted of growth in part-time work. In 1950, 23 percent of all working marriedwomen in couples where both spouses were between ages 25 to 39 were working fewerthan 35 hours a week. By 1970 this proportion was 35 percent and in 1998 was still33 percent.3 In Britain, the increase in women’s part-time employment between 1950and 1970 was even larger (Joshi, Layard and Owen, 1985). The proportion of womenworking part-time is now greater in Britain than in the United States—40 percentin the U.K. versus 20 percent in the United States working less than 30 hours a weekin 1997—whereas the proportion of men working part-time is about 8 percentworking less than 30 hours a week in 1997 in both countries, according to data fromthe OECD website.
Since 1970, women have begun to enter careers in large numbers. The collegeeducated women who graduated in the 1950s majored in such fields as education andnursing where few men got degrees. Upon graduation, these women were tracked intotraditionally female sectors, regardless of their majors. They left the labor force whentheir first child was born and only re-entered when all children were in school. Goldin(1997) characterizes their experience as “family then job,” while the cohorts whograduated 20 years later, aspired to “career then family” or “career and family.”Women’s college majors and their graduate degrees became more similar to those ofmen. In 1970, only 10 percent of undergraduate economics degrees were awarded towomen, but by 1996 the figure was 30 percent. The fraction of economics doctoraldegrees that went to women rose from 5 to 22 percent between these years. The
3 Estimated from the integrated public use census samples (Ruggles and Sobeck, 1998) and the 1998Current Population Survey.
Table 2Occupational Distributional, 1890–1999
1890/1900 1930 1970 1999
Men Women Men Women Men Women Men Women
Professional 10.2% 9.6% 13.6% 16.5% 24.9% 18.9% 31.5% 35.9%Clerical 2.8 4.0 5.5 20.9 7.6 34.5 5.5 23.4Sales 4.6 4.3 6.1 6.8 6.8 7.4 11.3 13.0Manufacturing 37.6 27.7 45.2 19.8 48.1 17.9 37.9 9.2Service 3.1 35.5 4.8 27.5 8.2 20.5 9.9 17.4Agricultural 41.7 19.0 24.8 8.4 4.5 0.8 3.8 1.1
Note: The figures for 1890/1900–1970 are from Goldin (1990, p. 64). Those for 1999 are from theBureau of Labor Statistics website.
From Mill Town to Board Room: The Rise of Women’s Paid Labor 109

increase in the proportion of professional degrees awarded to women was evensharper. In 1970, 6 percent of all first-professional degrees (degrees requiring at leastsix years of college work and two years of pre-professional training) awarded in healthwent to women but by 1996 the figure was 43 percent (National Science Foundation,1999). Women are now more likely to be in nontraditional professions. In 1970 only 10percent of all physicians were women; by 1998, 29 percent were.4
Table 3 illustrates trends in married women’s labor force participation ratesand part-time work since 1940 by examining their participation rates by their ownand their spouse’s education. Since 1960, labor force participation rates haveincreased more sharply among college educated women married to college edu-cated men than among high school educated women married to high schooleducated men. This phenomenon of increasing participation among women mar-ried to high wage men was first pointed out in the U.S. case by Juhn and Murphy(1997); it is also observed in Britain and in France (for example, Dex, Walters, andAlden, 1993). Wives’ labor force participation rates also increased sharply amongcouples in which only one spouse had a college education because the proportionof couples in which the wife was college educated rose from 27 percent in 1940 to50 percent in 1998. In 1960 and 1970, when most college educated women enteredeither nonprofessional jobs in the clerical or sales sector or traditional professionaljobs such as that of nurse, schoolteacher, librarian, or social worker, part-time workwas more common among college educated women married to college educatedmen than among high school educated women married to high school educatedmen. After 1970, when college education became increasingly associated withcareers, the proportion of wives working part-time no longer varied by their ownand their spouse’s education. The fraction of wives (and also of husbands) workingpart-time increased between 1990 and 1998.
International Trends Since 1960How unique is the recent American story of rising women’s labor force participa-
tion rates? Figure 3 and Figure 4 paint a picture of women’s labor force participationrates in the paid, formal sector. Figure 3 compares the United States and Canada withAustralia and Japan. Figure 4 compares the United States with various Europeancountries. Most of the countries show sizable increases in women’s labor force partic-ipation rates since 1960, and in most countries this change was primarily a result ofchanges in the participation of married women. Naturally, Figures 3 and 4 showdifferences across countries; for example, the French increase in aggregate participa-tion rates since 1960 was smaller than that observed in Australia, Canada, Sweden, theNetherlands, and the United Kingdom, but was higher than that in Germany (once therise in participation rates with unification is excluded) or Italy.
But three countries stand out as special cases in these figures. In Sweden,women’s labor force participation rates were consistently higher than any other
4 Estimated from the integrated public use census sample (Ruggles and Sobek, 1997) and the BLS website.
110 Journal of Economic Perspectives

country, before dipping in the 1990s. Sweden has both actively encouraged paidfemale labor force participation and promoted pronatalism since the 1930s. Swed-ish taxation provides substantial incentives to be a dual earner couple whereas, incontrast, taxation in Germany penalizes dual earner couples and taxation in theNetherlands penalized dual earner couples until 1990 and is now neutral (Gustafs-son and Bruyn-Hundt, 1991). Subsidized child care in Sweden reduces the negativeeffect of children on women’s earnings (Gustafsson and Stafford, 1992). Sweden’srecent decline in labor force participation seems to be primarily related to itsrecession of the early 1990s; the percentage point decline in labor force participa-tion since then has been the same for men as for women.
Italy stands out as the country in the figure with the consistently lowest laborforce participation rate for women, although participation rates for women aresimilarly low in Spain and Greece. The Italian pattern does show a mild U-shape:women’s participation rates fell as the size of the agricultural sector declined andthen rose as women’s educational levels rose and as the service sector and manu-facturing industries that employed women became more important (del Boca,1988). But the labor force participation rate of married women has barely changedin Italy. Low Italian (and Spanish and Greek) participation rates may arise fromundercounting women in the informal sector or from the high costs to employersof part-time work (determined by legislation and by union contracts) and the heavyexpectations placed upon mothers (even those with only one child) combined withlittle support (del Boca, 1988).
Japan is the one case in the two figures where the graph does not offer a goodindicator of women’s participation in the paid, formal labor force. In Japan,women’s participation rates have been relatively high because a large fraction of the
Table 3Participation Rates and Part-time Work Among Married American Women byOwn and Husband’s Education
1940 1960 1970 1980 1990 1998
Wife’s labor force participationBoth spouses college educated 19.7% 28.1% 40.8% 63.8% 72.9% 76.7%Only one spouse college educated 18.4 22.2 33.1 56.8 70.3 78.2Neither spouse college educated 16.7 27.3 36.7 52.5 64.8 69.3
Couples in which wife works:% wives working part-time
Both spouses college educated 26.7% 36.7% 39.4% 30.6% 28.3% 33.4%Only one spouse college educated 22.0 33.3 38.5 33.1 29.7 30.1Neither spouse college educated 23.0 29.8 33.7 31.4 29.9 33.8
Note: The data consist of matched couples where both spouses are between ages 25–39. The figures for1940–1990 were estimated from the integrated public use census samples (Ruggles and Sobek, 1997).The 1950 census provides information on the education of only one spouse. The 1998 figures wereestimated from the Current Population Survey (U.S. Department of Commerce, 1998). Populationweights are used for 1940 and 1990. Part-time work is defined as less than 35 hours per week.
Dora L. Costa 111

female labor force—21 percent in 1984 compared to 1 percent in the UnitedStates—consists of family workers (Hill, 1988). The participation rates for Japaneseare now lower than they were in 1960 because of the decline of family enterprises,and because discrimination and social norms have hindered the movement ofmarried women into paid labor.
Additional explanations, some potentially endogenous, for the low female laborforce participation rates observed in some countries include relatively low wages forwomen (the difference between male and female earnings in 1997 was highest in Japanat 40 percent and lowest in Sweden and France at less than 20 percent); highunemployment rates (rates that among the countries of continental Europe are higherfor women than for men); the dominance of the manufacturing sector and of tool-making and machine-building in Germany; laws regulating store hours; school hours(including children being sent home from school for lunch); and weak or unenforcedantidiscrimination legislation.5
Women’s experiences across countries have differed not just in terms of theirlabor force participation rates, but also in terms of their jobs and careers. Blau andKahn (this issue) show that once adjustments are made for the more unequal U.S.wage distribution, the gender gap in wages is lowest in the United States. There are
5 For relative wages and unemployment rates by sex, see OECD in Figures, 1999, on the OECD website.
Figure 3Labor Force Participation Rates in North America, Australia, and Japan, 1960–1998
Note: Rates are from the Bureau of Labor Statistics website and were adjusted by the bureau to becomparable to the American concepts of the labor force, except in the treatment of age cutoffs and oflayoffs. The U.S. data relate to the population older than 15. The Canadian, Australian, and Japanesedata relate to the population older than 14. The data are for the civilian noninstitutionalized working agepopulation, except for Japan, where the institutionalized working population is included.
112 Journal of Economic Perspectives

differences in other dimensions as well. Rates of part-time work vary widely. TheNetherlands had the highest percentage of women working less than 30 hours aweek in 1997—55 percent—followed by the United Kingdom and Australia at40 percent each. The United States, Italy, and Sweden had the lowest rates ofwomen working part-time: 20, 24, and 25 percent, respectively (OECD in Figures,1999). Among men, the highest part-time rates in 1997 were in Australia, Japan,and the Netherlands—4, 13, and 11 percent, respectively—and the lowest inGermany, Italy, and France—3, 5, and 6 percent, respectively.
The types of jobs held by women also vary widely. Occupational segregation ishigher in the Nordic countries than in other OECD countries. In the Nordiccountries, women are mainly employed in education, health care, child day care,and social services, all of which are monopolized by the state. In these countries, thepublic sector accounted for 58 percent of total female employment in 1992 (Melkasand Anker, 1998). Occupational segregration is lowest in the United States (Anker,1998, p. 176). Women’s shares of administrative and managerial jobs in 1994–95(jobs that range from the chief executive of a major corporation to the manager of
Figure 4Labor Force Participation Rates in Selected European Countries and the UnitedStates, 1960–1998
Note: Rates are from the Bureau of Labor Statistics website and were adjusted by the Bureau to becomparable to the American concepts of the labor force, except in the treatment of age cutoffs andof layoffs. The French, German, and Swedish data relate to the population older than 15. TheBritish data relate to the population older than 14 prior to 1972 and older than 15 thereafter. TheDutch data relate to the population older than 13 before 1975 and older than 14 thereafter. Italiandata relate to the population older than 13 before 1992 and older than 14 thereafter. The Swedishstatistics were adjusted to include persons older than the upper age limit. The data are for thecivilian noninstitutionalized working age population, except for Germany, where the institutionalizedworking population is included. Beginning in 1991 the German data are for a unified Germany. TheFrench and British figures differ from those presented in Figure 2 because of differences in thelabor force concept.
From Mill Town to Board Room: The Rise of Women’s Paid Labor 113

a local fast food store) were 43 percent in the United States and Australia,28 percent in Sweden, and 9 percent in Japan (International Labour Organization,1997, p. 15).
Whether women have achieved positions of power differs across countries anddiffers depending upon whether one examines the public or private sector. Womenhave a larger role in government in the Nordic countries than elsewhere. InSweden, women held 30 percent of ministerial level positions in 1994 compared to16 percent in Germany, 12 percent in Italy, 9 percent in the United Kingdom, and7 percent in France (International Labor Organization, 1997, p. 28). However,positions of power in the governments of Nordic countries do not translate intopositions of power in the private sector. For example, in 1990 in Finland womenheld 39 percent of all seats in parliament, but only 6 percent of all board seats ofthe 100 largest private firms (International Labour Organization, 1997, p. 27).
Although comparisons of women’s success in business are harder to makeacross countries, the available data suggest that women in the United States farerelatively well. The number of chief executives who are women is tiny in allcountries. But a comparison of the boards of major corporations—ranking com-panies by total revenues in the United States and Canada and by market capitali-zation in the United Kingdom—shows that women hold more seats in the UnitedStates than in Canada or the United Kingdom. In the United States in 1999 womenheld 11 percent of all board seats of the first 500 companies of the Fortune 1000,up from 9 percent in 1994, and 9 percent of the seats of the next 500 companies.In contrast, in Canada women held only 6 percent of the board seats of theFinancial Post 500 in 1998.6 In the United Kingdom, a 1995 survey of over 300enterprises reported that 3 percent of board members were women (InternationalLabor Organization, 1997, p. 20). Another survey that examined Times Top 200companies plus a number of leading Building Societies (thrifts) reported that6 percent of board members were women (McRae, 1996).
Explaining the Growth in Labor Force Participation of MarriedWomen
The increase in married American women’s work for pay outside of the homein the second half of the twentieth century represents a dramatic break withwomen’s past experience. Why did this change occur? On the supply side, morewomen may have been willing to enter the labor market because they were havingfewer children (though better job opportunities may have helped lower fertilityrates); because their time spent producing such household goods as food orcleanliness was falling thanks to new household technologies such as washing
6 Findings are from 1999 Catalyst Census of Women Board Directors of Fortune 1000 and Catalyst Census ofWomen Board Directors of Canada. Excerpts can be found on the Catalyst website. See this site for the1994 figures as well.
114 Journal of Economic Perspectives

machines, cleaner lighting, vacuum cleaners and prepared foods; because theirconditions, hours, and status of work were improving; and because their prefer-ences for work may have changed. On the demand side, firms may have been morewilling to hire women because of the rise of the clerical and sales sector; thedevelopment of technologies that allowed firms to substitute the labor of womenfor that of men; the growth of formal education that could replace on-the-jobtraining; and changes in the tastes of employers and their male employees orreduced discrimination.
Provided that we know women’s elasticity of labor supply with respect to wagesand income, we can determine whether demand or supply factors were moreimportant in increasing married women’s participation, as shown formally byGoldin (1990, p. 119–158). Inelastic labor supply with respect to wages means thatchanges in participation are most likely due to movements of supply. Conversely, amore elastic labor supply with respect to wages would suggest that substantialmovements in participation are more likely to be driven by demand.
Numerous cross-city studies provide evidence on labor supply wage and in-come elasticities for married women over the entire twentieth century (see refer-ences in Goldin, 1990, p. 132). Although cross-city studies are not the ideal way toestimate women’s labor supply elasticities, they offer the only consistent way ofdoing so for the whole century. Consistency is important because estimates of laborsupply can vary widely with changes in sample composition or in estimation method(Pencavel, 1986; Killingsworth and Heckman, 1986). These estimates from cross-city studies suggest dividing the twentieth century labor force experience of womeninto three time periods.
For the first three decades of the twentieth century, married women’s uncom-pensated wage elasticities of labor force participation were close to zero. At thistime, women’s income elasticities of labor force participation were negative andsubstantially greater than one. Goldin (1990, pp. 133–135) points out that in 1900,most women were employed in either service, manufacturing, or agriculturaloccupations. The working conditions in these occupations were poor and the hourslong. A working wife implied that the household was in financial crisis, eitherbecause the husband was too poor to provide adequately for his wife, or he wasunemployed or ill. Income elasticities were large and wage elasticities small becausethe only women in the paid labor force were those pushed in because theirhusbands’ incomes were low. Goldin (pp. 136–138) thus argues that supply ex-plains virtually all of the increase in married women’s participation between 1890and 1930.
At mid-century, women’s uncompensated wage elasticities were quite high—up to 1.5 in some studies. However, the absolute value of their income elasticitieshad fallen below one. By 1950 the rise of the clerical sector, with its betterconditions of labor, and the entry of college educated women into the clericalsector reduced the social stigma that had been associated with a working wife. Nowa woman might be working because her value of time was high. The increasedavailability of market goods that could substitute for home goods weakened the
Dora L. Costa 115

income effect even further. The income effect weakened and the wage elasticityrose. Thus, Golden (1990) argues that demand explains almost all of the increasein women’s labor force participation between 1940 and 1960.
In the final decades of the twentieth century, women’s wage elasticities weresmaller, although not zero, as were their income elasticities. After mid-century, theincrease in divorce rates (which made a husband’s income undependable), theincreased status and meaning found in work, and the increased cost of intermit-tency in the labor market made women’s labor force experiences more like thosemen and reduced both the income and substitution effect. Demand and supplyshare in causing the increase in women’s labor force participation between 1960and 1980.
Estimates from national surveys of individuals suggest that in the past fewdecades the relationship between wife’s employment and husband’s earnings hasgrown weaker, while the relationship between wife’s employment and her wages hasgrown stronger, though it is still small (Juhn and Murphy, 1997). Examining the1975–94 period, Pencavel (1998) finds that increases in own wages account forabout one-quarter of the increased employment of women at younger ages andabout half of the increase in employment at older ages. He concludes that marketwork has become relatively more hospitable and household activity less attractive towomen for reasons beyond that provided by movements in wages.
This line of argument suggests that changes in women’s labor force participa-tion rates may be fairly slow, because they must await the movement of cohorts, withtheir different set of expectations and characteristics. For example, the increase inlabor force participation for cohorts born around the turn of the century isconnected to their particularly sharp fertility declines and to the expansion of highschool education from 1900 to 1930. Because this cohort of women had relativelyhigh participation rates in the clerical sector when single, re-entry into the laborforce when they were in their 40s was easier. Of course, in retrospect, these cohortsmay have underinvested in on-the-job training and in formal schooling. Becausethey could use only the experience of their mothers and grandmothers as a guide,they could not have predicted their re-entry into the labor force when theirchildren were grown (Goldin, 1990, pp. 138–157). Change will therefore take timebecause expectations need to adjust.
Change in women’s participation rates may also be slow because the socialnorms of cohorts regarding work and family evolve over time. Eighty-two percent ofAmericans (both male and female) told pollsters in a Gallup poll of November 15,1936, that a married woman should not earn money if her husband was capable ofsupporting her. Seventy-three percent of married women of childbearing age in1970 agreed that preschool children suffered if the mother works. That figuredeclined to 58 percent by 1977, 37 percent in 1985, and 34 percent by 1991(Rindfuss, Brewster and Kavee, 1996).
Finally, change in women’s labor force participation may also be slow becauseof discrimination. This discrimination was institutionalized in the first part of the20th century in the “marriage bars” in school districts and firms that in the United
116 Journal of Economic Perspectives

States and Britain simply prohibited the employment of married women. Demo-graphic change that reduced the supply of young female employees led to thedisappearance of the marriage bar (Goldin, 1990, pp. 160–179). Discriminationalso affected the willingness of employees to work with women and the willingnessof employers to hire women. Pressure from the feminist movement and govern-ment antidiscrimination policy may therefore have played a role in increasingwomen’s labor force participation.
Women’s Labor Force Participation in Future Generations
The relatively small size of married women’s wage and income elasticitiessuggests that those women who are out of the labor force today may very well havea very strong taste for remaining at home, which implies that unless these tasteschange, the labor force participation rate of married women may not increasemuch above its current rate of 62 percent. But looking to the past suggests thatthese tastes may very well change—greater proportions of women have beenlooking more like men in their career investments and in their responsiveness toeconomic incentives. Additional factors that might increase their labor force par-ticipation include the greater availability of child care, including that provided byfathers, and improvements in household technology. Another frequently citedfactor that might increase women’s participation includes tighter labor markets—apossibility if aggregate labor supply declines when the baby bust generation comesof age and if aggregate consumer demand remains roughly constant.
Regardless of future trends in women’s labor force participation rates, the ways inwhich women participate in the paid labor market appear likely to undergo consider-able change in the next few decades. The entry of women into the professions andother nontraditional careers did not really begin until 1970 or later, and the history ofthis change is still being written. On one side, many more women are acquiring theeducation, skills and experience that make them well-suited for nontraditional careers.On the other hand, women continue to face serious conflicts between work and family,and the legacy of discriminatory attitudes.
The early 1970s were a turning point in women’s entry into graduate andprofessional schools. In 1970, according to the American Medical Associationwebsite, only 9 percent of all applicants to medical school were women; by 1976,24 percent were; and by the end of the 1990s, 43 percent. Trends in law schoolswere similar. In 1970, according to the American Bar Association website, only10 percent of all first-year law school students were women; by 1976, 28 percentwere; and by the end of the 1990s, almost 50 percent. Other social trends of theearly 1970s also may have contributed to the rise in women’s professional educationas well, including the widespread availability of the birth control pill (Goldin andKatz, 2000); the availability of legal abortion; and the passage of Title IX in 1972which applied civil rights legislation to universities and thus may have exerteddirect pressure on graduate and professional school admissions committees.
From Mill Town to Board Room: The Rise of Women’s Paid Labor 117
Despite the increasing proportion of women graduating from professional andgraduate programs, however, many believe that a glass ceiling limits the advance ofwomen to the highest professional levels. Among Ph.D. economists who entertenure-track positions in academia, women have a harder time achieving tenureand take longer achieving it, controlling for other factors (Kahn, 1993).
While both college men and women majoring in business believe that they willstart with the same salaries, women anticipate lower earnings in subsequent years(Blau and Ferber, 1991). These expectations reflect experience. Among individualswho received their MBAs between 1975 and 1980 there were no gender differencesinitially in income, but six years later the women were earning 9 percent less thanthe men (Schneer and Reitman, 1995; see also Stroh, Brett and Reilly, 1992). In1973 and 1978, Fortune reported that only 0.2 percent of the highest paid officersand directors in the top 1,000 industrial and 300 service companies were women(Robertson, 1978). By 1990 the fraction had risen only to 0.5 percent (for a slightlydifferent sample of companies) (Fierman, 1990). By 1995, women held 1.2 percentof the top-earner spots at the Fortune 500, although that share did jump to 3.3percent in 1999.7
The difficulty of combining career and family partially explains the slowadvancement of women into positions of power. Career advancement may requirerelocation and frequent travel, which is difficult when both spouses have careers.Higher earners today work more hours than low earners (Costa, 2000; Colemanand Pencavel, 1993a, b). Managers in Fortune 500 companies work an average of56 hours a week (Brett and Stroh, 1999). There is no job-sharing or part-time workat the top, so time with children may be squeezed. Among college educated womenwho were age 34 to 44 in 1988, only 13 percent achieved career and family, wherea woman was said to have “achieved a career” if in 1985, 1987, and 1988 she hadhourly earnings exceeding that of the 25th percentile of college educated men(Goldin, 1997). Among executives at the vice president level and above surveyedcirca 1990, 37 percent of the women were childless compared to 5 percent of themen (Korn/Ferry International and UCLA Anderson Graduate School of Manage-ment, as cited in Weeks, 1993).
The significant negative impact on earnings and promotions of taking time offfrom work to care for children is well-documented. Nonetheless, many women stilldo take time off. A study of University of Michigan Law School graduates concludesthat even among lawyers who have invested heavily in their careers, women aremore willing than men to sacrifice wages and promotions for the joys of parenting(Wood, Corcoran and Courant, 1993).
Women’s prospects of combining career and family are improving, but theystill face a difficult task. Their continued progress in careers may well depend uponmen’s willingness to share child-rearing responsibilities. Although the gender gapin housework has narrowed since the 1960s both in the United States and in the
7 See the 1995 and 1999 Catalyst Census of Women Corporate Officers and Top Earners on the Catalyst website.
118 Journal of Economic Perspectives
United Kingdom (it is narrower in the United States where women spend less timein domestic work and men spend more time shopping), even women who work stilldisproportionately bear the brunt of domestic chores (Gershuny and Robinson,1988; Blau, 1998). Among dual career households, men are somewhat more likelythan women to classify their careers as equal (58 versus 49 percent), but they arealso more likely than women to say their own careers are primary (33 versus6 percent).8 The fraction of female executives who are childless fell from 61 to37 percent between 1982 and 1992 (Korn/Ferry International and UCLA AndersonGraduate School of Management, as cited in Weeks, 1993). But more than a thirdis still a high number, particularly given that the fraction of male executives whowere childless remained a constant 5 percent.
Not all of the glass ceiling phenomenon is attributable to children; some of itprobably results from discriminatory attitudes. It is always difficult to prove discrim-ination with statistical studies, of course. But among Michigan law school graduates,women earned 61 percent as much as men 15 years after graduation. Even con-trolling for child care, work history, labor supply, school performance, and jobsettings, one-quarter of the gap in male and female salaries was still unexplained(Wood, Corcoran and Courant, 1993). However, as more women successfullycombine career and family and as the attitudes of employers, co-workers, andhusbands change, discrimination is likely to fall. Certainly, the amount of discrim-ination perceived by women has fallen. In 1982, 39 percent of female executivesconsidered sexism the biggest obstacle to achieving success. By 1992, this figure wasdown to 27 percent (Korn/Ferry International and UCLA Anderson GraduateSchool of Management, cited in Weeks, 1993).
Conclusion
The biggest changes in women’s labor force participation in recent decadeshas been in careers that were nontraditional for women in the past. In 1960 only7 percent of all lawyers and judges were women and 9 percent of all physicians; by1998 women were 29 percent of lawyers and judges and 26 percent of doctors.9 Butdespite their breakthroughs in the professions and in management, women areonly slowly moving to the top. Women lawyers, physicians, and managers earn lessthan men. In 1999 women held only 3 percent of the top-earner spots in theFortune 500. Nor are women currently well-positioned to break through to the top.In 1999, 28 percent of women corporate officers in the Fortune 500 held line jobs(posts with profit-and-loss or direct client responsibility) compared to 50 percent ofmen corporate officers; but of all line jobs, only 7 percent were held by women.10
8 See Two Careers, One Marriage on the Catalyst website.9 Estimated from the 1960 public use micro census sample (Ruggles and Sobek, 1997) and from the BLSwebsite.10 See the 1999 Catalyst Census of Women Corporate Officers and Top Earners on the Catalyst website.
Dora L. Costa 119

The difficulty of combining work and family has slowed women’s move to thetop. More women than men are willing to sacrifice their careers for time spent withchildren and those women who reach the top are disproportionately childless. Thishas led to calls for more family-friendly policies, such as generous parental leave.But an overly generous policy may raise the labor force participation of women,while leading to cohorts of women with less experience, lower relative wages andlimited career advancement (Ruhm, 1998).
History suggests that changes in women’s labor force experience can befrustratingly slow. Progress may have to wait for the entry of new cohorts of women,with different characteristics and expectations, into the labor market. It may alsohave to wait for the entry of new cohorts of men with different expectationsregarding work and family into the labor market.
y I have benefitted from the comments of Francine Blau, Brad De Long, Claudia Goldin,Lawrence Kahn, Alan Krueger, Matthew Kahn, and Timothy Taylor. I gratefully acknowl-edge the support of NIH grant AG12658 and the Russell Sage Foundation through theirVisiting Scholar program.
120 Journal of Economic Perspectives

References
American Bar Association. ^http://www.abanet.org/legaled/stats.html&.
American Medical Association. ^http://www.ama-assn.org&.
Anker, Richard. 1998. Gender and Jobs: Sex Seg-regation of Occupations in the World. Geneva: Inter-national Labor Office.
Atack, Jeremy and Fred Bateman. 1992. “HowLong was the Workday in 1880?” Journal of Eco-nomic History. 52:1, pp. 129–60.
Blau, Francine D. 1998. “Trends in the Well-Being of American Women, 1970–1995.” Journalof Economic Literature. 36:1, pp. 112–65.
Blau, Francine D. and Marianne A. Ferber.1991. “Career Plans and Expectations of YoungWomen and Men: The Earnings Gap and LaborForce Participation.” Journal of Human Resources.26:4, pp. 581–607.
Brett, Jeanne M. and Linda K. Stroh. 1999.“Women in Management: How Far have WeCome and What Needs to Be Done as We Ap-proach 2000?“ Journal of Management Inquiry. 8:4,pp. 392–97.
Bureau of Labor Statistics. ^http://www.bls.gov/&.
Catalyst. ^http://www.catalystwomen.org/&.Coleman, Mary T. and John Pencavel. 1993a.
“Changes in Work Hours of Male Employees,1940–1988.” Industrial and Labor Relations Review.46:2, pp. 262–83.
Coleman, Mary T. and John Pencavel. 1993b.“Trends in Work Behavior of Women since1940.” Industrial and Labor Relations Review. 46:4,pp. 653–76.
Costa, Dora L. 2000. “The Wage and the Lengthof the Work Day: From the 1890s to 1991.” Journalof Labor Economics. 18:1, pp. 156–81.
Costa, Dora L. and Matthew E. Kahn. Forth-coming. “Power Couples: Changes in the Loca-tional Choice of the College Educated, 1940–1990.” Quarterly Journal of Economics.
del Boca, Daniela. 1988. “Women in a Chang-ing Workplace: The Case of Italy,“ in Feminizationof the Labor Force. Jane Jenson, Elisabeth Hagen,and Ceallaigh Reddy, eds. New York-Oxford: Ox-ford University Press, pp. 120–36.
Dex, Shirley, Patricia Walters, and David M.Alden. 1993. French and British Mothers at Work.Houndsmills, Basingstoke, Hampshire: Macmil-lan Press.
De Vries, Jan. 1994. “The Industrial Revolu-tion and the Industrious Revolution.” Journal ofEconomic History. 54:2, pp. 249–70.
Fierman, J. 1990. “Why Women Still Don’t Hitthe Top.” Fortune. July 30, 1990: 41–62.
Finegan, T. Aldrich and Robert A. Margo.1994. Journal of Economic History. 54:1, pp. 64–84.
Flyer, Frederick and Sherwin S. Rosen. 1997.“The New Economics of Teachers and Educa-tion.” Journal of Labor Economics. 15:1 (Part 2),pp. S104–39.
The Gallup Poll; Public Opinion. Wilmington,DE: Scholarly Research.
Gershuny, Jonathan and John P. Robinson.1988. “Historical Changes in the Household Di-vision of Labor.” Demography. 25:4, pp. 537–52.
Goldin, Claudia. 1986. “The Female Labor Forceand American Economic Growth: 1890 to 1980,“ inLong-Term Factors in American Economic Growth,Conference on Income and Wealth, Volume 51.Stanley Engerman and Robert Gallman, eds. Chi-cago: University of Chicago Press, pp. 557–604.
Goldin, Claudia. 1990. Understanding the Gen-der Gap: An Economic History of American Women.New York-Oxford: Oxford University Press.
Goldin, Claudia. 1991. “The Role of WorldWar II in the Rise of Women’s Employment.”American Economic Review. 81:4, pp. 741–56.
Goldin, Claudia. 1995. “The U-Shaped FemaleLabor Force Function in Economic Develop-ment and Economic History,“ in Investment inWomen’s Human Capital and Economic Development.T. Paul Schultz, ed. Chicago: University of Chi-cago Press, pp. 61–90.
Goldin, Claudia. 1997. “Career and Family:College Women Look to the Past,“ in Gender andFamily in the Workplace. Francine D. Blau andRonald Ehrenberg, eds. New York: Russell SagePress, pp. 20–58.
Goldin, Claudia and Lawrence F. Katz. 2000.“The Power of the Pill: Oral Contraceptives andWomen’s Career and Marriage Decisions.” Na-tional Bureau of Economic Research WorkingPaper Number W7527.
Goldin, Claudia and Kenneth Sokoloff. 1982.“Women, Children, and Industrialization in theEarly Republic: Evidence from the Manufactur-ing Censuses.” Journal of Economic History. De-cember, 42:4, pp. 741–74.
Grantham, George and Franque Grimard.1999. “Female Labour Force Participation inNineteenth Century France and the 1851 Cen-sus of Population: A Quantitative Analysis.” Un-published manuscript. McGill University.
Gustafsson, S.S. and M. Bruyn-Hundt. 1991. “In-centives for Women to Work: A Comparison be-
From Mill Town to Board Room: The Rise of Women’s Paid Labor 121

tween The Netherlands, Sweden, and West Germa-ny.” Journal of Economic Studies. 18:5/6, pp. 30–65.
Gustafsson, S. and Frank Stafford. 1992. “ChildCare Subsidies and Labor Supply in Sweden.” Jour-nal of Human Resources. 27:1, pp. 204–30.
Handbook of U.S. Labor Statistics: Employ-ment, Earnings, Prices, Productivity, and OtherLabor Data. 1999. Lanham, MD: Bernan Press.
Higgs, Edward. 1987. “Women’s Occupationsand Work in the Nineteenth Century Censuses.”History Workshop. 23, pp. 60–80.
Hill, Anne M. 1988. “Female Labor Supply inJapan: Implications of the Informal Sector ForLabor Force Participation and Hours of Work.”Journal of Human Resources. 24:1, pp. 143–61.
Horrell, Sara and Jane Humphries. 1995. “Wom-en’s Labour Force Participation and the Transi-tion to the Male-Breadwinner Family, 1790–1865.”Economic History Review. 48:1, pp. 89–117.
INSEE. ^http://www.insee.fr/&.International Labour Organization. Sectoral
Activities Programme. 1997. Breaking through theGlass Ceiling: Women in Management. Geneva: In-ternational Labour Office.
Joshi, Heather E., Richard Layard and SusanJ. Owen. 1985. “Why Are More Women Workingin Britain?” Journal of Labor Economics. 3:1 (pt. 2),pp. S147–S176.
Joshi, Heather and Susan Owen. 1987. “How Longis a Piece of Elastic? The Measurement of FemaleActivity Rates in British Censuses, 1951–1981.”Cambridge Journal of Economics. 11:1, pp. 55–74.
Juhn, Chinhui and Kevin M. Murphy. 1997.“Wage Inequality and Family Labor Supply.”Journal of Labor Economics. 15:1 (pt.1), pp. 72–97.
Kahn, Shulamit. 1993. “Gender Differences inAcademic Career Paths of Economists.” AmericanEconomic Review. 83:2, pp. 52–56.
Killingsworth, Mark R. and James J. Heckman.1986. “Female Labor Supply: A Survey.” in Hand-book of Labor Economics. Orley Ashenfelter andRichard Layard, eds. Amsterdam: North-Hol-land, pp. 103–204.
Lundberg, Shelly J. and Robert A. Pollak. 1996.“Bargaining and Distribution in Marriage.” Journalof Economic Perspectives. 10:4, pp. 139–56.
Marchand, Olivier and Claude Thelot. 1991.Deux Siecles de Travail en France: Populationactive et structure social, duree et productivitedu travail}. Paris: INSEE.
McRae, Susan. 1996. “Women at the Top:Progress after 5 Years.” King-Hall Paper, No. 2.London: The Hansard Society for ParliamentaryGovernment.
Melkas, Helina and Richard Anker. 1998. GenderEquality and Occupational Segregation in Nordic La-bour Markets. Geneva: International Labor Office.
National Science Foundation. Division of Si-cen Resource Studies. 1999. Science and Engineer-ing Degrees: 1966–96. NSF 99-330. Arlington, VA.^http://www.nsf.gov&.
OECD. ^http://www.oecd.org/&.Office for National Statistics. ^http://www.
ons.gov.uk/&.Pencavel, John. 1986. “Labor Supply of Men:
A Review.” in Handbook of Labor Economics. OrleyAshenfelter and Richard Layard, eds. Amster-dam: North-Holland, pp. 3–102.
Pencavel, John. 1998. “The Market Work Be-havior and Wages of Women, 1975–94.” Journalof Human Resources. 38:4, pp. 771–804.
Rindfuss, Ronald R., Karin L. Brewster andAndrew L. Kavee. 1996. “Women, Work, andChildren: Behavioral and Attitudinal Change inthe United States.” Population and DevelopmentReview. 22:3, pp. 457–82.
Robertson, Wyndham. 1978. “The TopWomen in Big Business.” Fortune. July 17, 58.
Ruggles, Steven and Matthew Sobek. 1997.Integrated Public Use Microdata Series,IPUMS-98 Version 2.0, Social History ResearchLaboratory. Minneapolis, MN: Department ofHistory, University of Minnesota, ^http://www.ipums.umn.edu/&.
Ruhm, Christopher J. 1998. “The EconomicConsequences of Parental Leave Mandates: Les-sons from Europe.” Quarterly Journal of Economics.113:1, pp. 285–318.
Schneer, Joy A. and Frieda Reitman. 1995. “TheImpact of Gender as Managerial Careers Unfold.”Journal of Vocational Behavior. 47:3, pp. 290–316.
Social Trends: A Publication of the GovernmentStatistical Service. Various issues. London:HMSO.
Stroh, Linda K., Jeanne M. Brett and Anne H.Reilly. 1992. “All the Right Stuff: A Comparison ofFemale and Male Mangers’ Career Progression.”Journal of Applied Psychology. 77:3, pp. 251–60.
United States Department of Commerce, Bu-reau of the Census. 1998. Current PopulationSurvey: Annual Demographic File, 1998, ICPSR2573. Ann Arbor, MI: Inter-university Consor-tium for Political and Social Research.
Voth, Hans-Joachim. 1998. “Time and Work inEighteenth-Century London.” Journal of EconomicHistory. 58:1, pp. 29–58.
Weeks, Julie R. 1993. “Women in Business:Dramatic Work-Force Change.” The Public Per-spective. 5:1, pp. 31–34.
Wood, Robert G., Mary E. Corcoran and Paul N.Courant. 1993. “Pay Differences among the HighlyPaid: The Male-Female Earnings Gap in Lawyers’Salaries.” Journal of Labor Economics. 11:3, pp. 417–41.
122 Journal of Economic Perspectives


![Rise of-the-small-town-indian[1]](https://img.dokumen.tips/doc/110x75/54794863b479599a098b46dd/rise-of-the-small-town-indian1.jpg)


