Embed Size (px)
Citation preview

From financial wisdom, better stewardship.SM
Copyright © 2015 AMDG Services Inc.
MANAGING INVESTMENTS IN TURBULENT TIMES

2
Investor Discipline
I. Humans Are Not Wired for Disciplined Investing
II. Many Investors Follow Their Emotions
III. Reacting Can Hurt Performance
IV. Markets Have Rewarded Discipline
V. Focus on What You Can Control
IP2400

3
Humans Are Not Wired for Disciplined Investing
When people follow their natural instincts, they tend to apply faulty reasoning to investing.
IP2400

4
Many Investors Follow Their Emotions
People may struggle to separate their emotions from their investment decisions.
Following a reactive cycle of excessive optimism and fear may lead to poor decisions at the worst times.
IP2410
5
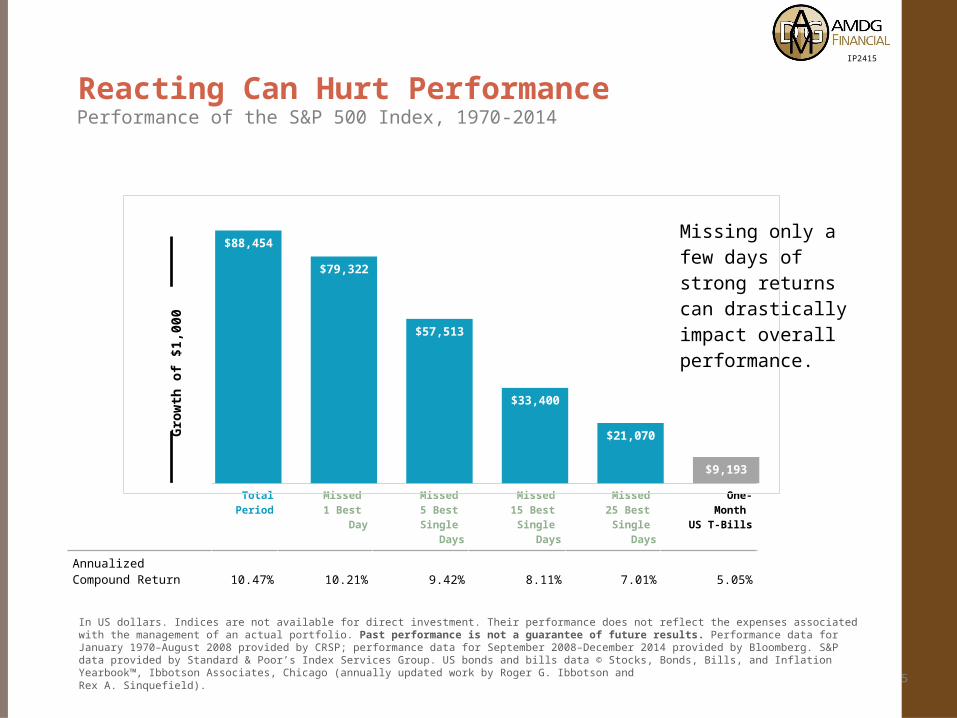
Reacting Can Hurt Performance
In US dollars. Indices are not available for direct investment. Their performance does not reflect the expenses associated with the management of an actual portfolio. Past performance is not a guarantee of future results. Performance data for January 1970–August 2008 provided by CRSP; performance data for September 2008–December 2014 provided by Bloomberg. S&P data provided by Standard & Poor’s Index Services Group. US bonds and bills data © Stocks, Bonds, Bills, and Inflation Yearbook™, Ibbotson Associates, Chicago (annually updated work by Roger G. Ibbotson and Rex A. Sinquefield).
Performance of the S&P 500 Index, 1970 - 2014
IP2415
Missing only a few days of strong returns can drastically impact overall performance.
Total Period
Missed 1 Best
Day
Missed 5 Best Single
Days
Missed 15 Best Single
Days
Missed 25 Best Single
Days
One-Month
US T-Bills
Annualized Compound Return 10.47% 10.21% 9.42% 8.11% 7.01% 5.05%
$88,454
$79,322
$57,513
$33,400
$21,070
$9,193
Gro
wth
of
$1,0
00

Markets Have Rewarded Discipline
6In US dollars. Indices are not available for direct investment. Their performance does not reflect the expenses associated with the management of an actual portfolio. Past performance is no guarantee of future results. MSCI data © MSCI 2015, all rights reserved.
Growth of a dollar—MSCI World Index (net dividends), 1970–2014
IP2420
$0
$1
$10
$100
$43
US home prices hit bottom
Fiscal cliff worries
Euro zone debt crisis
S&P 500 down 46%
Subprime mortgage crisis
Hurricanes Katrina and Rita
Iraq war begins
Dotcom stock crash
9/11 terrorist attack
Y2K Scare
Russian financial
crisisAsian
currency crisis
Income tax rates rate
Iraq invades Kuwait
Savings and loan crisis
Dow drops 23% on Black Monday
US inflation at 13.5%
BusinessWeek: “The Death of Equities”
Gold hits record high
S&P 500 down 43%
Oil prices quadruple
Arab oil embargo
1970 1980 1990 2000 2010 2013
1
A disciplined investor looks beyond the concerns of today to the long-term growth potential of markets.
$0
$1
$10
$100
$45
US home prices hit bottom
Fiscal cliff worries
Eurozone debt crisis
S&P 500 down 46%
Subprime mortgage
crisis
Hurricanes Katrina and Rita
Iraq war begins
Dotcom stock crash
9/11 terrorist attacks
Y2K Scare
Russian financial
crisisAsian
currency crisis
Income tax rates rise
Iraq invades Kuwait
Savings and loan crisis
Dow drops 23% on Black Monday
US inflation at 13.5%
BusinessWeek: “The Death of Equities”
Gold hits record high
S&P 500 down 43%
Oil prices quadruple
Arab oil embargo
1970 1980 1990 2000 2010 2014
7
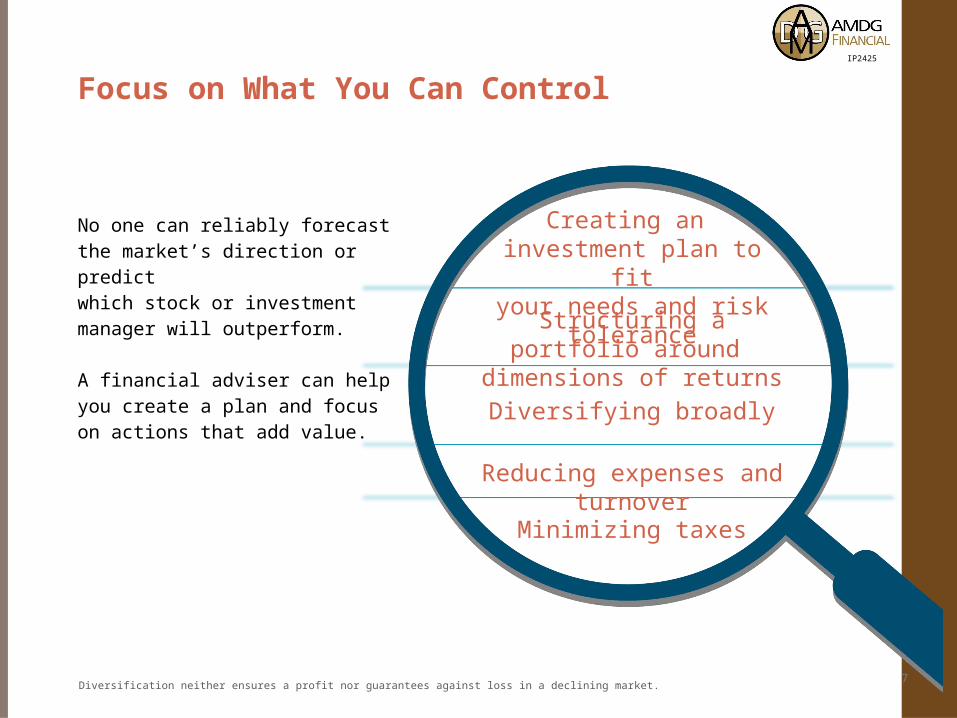
Focus on What You Can Control
Diversification neither ensures a profit nor guarantees against loss in a declining market.
No one can reliably forecast the market’s direction or predict which stock or investment manager will outperform.
A financial adviser can help you create a plan and focus on actions that add value.
IP2425
Creating an investment plan to fit
your needs and risk tolerance
Structuring a portfolio around dimensions of returns
Diversifying broadly
Reducing expenses and turnover
Minimizing taxes

8
IP2135
Likewise, trying to anticipate the movement of the market adds anxiety and undue risk.
Picking the Fastest Lane Isa Stressful Guessing Game
9
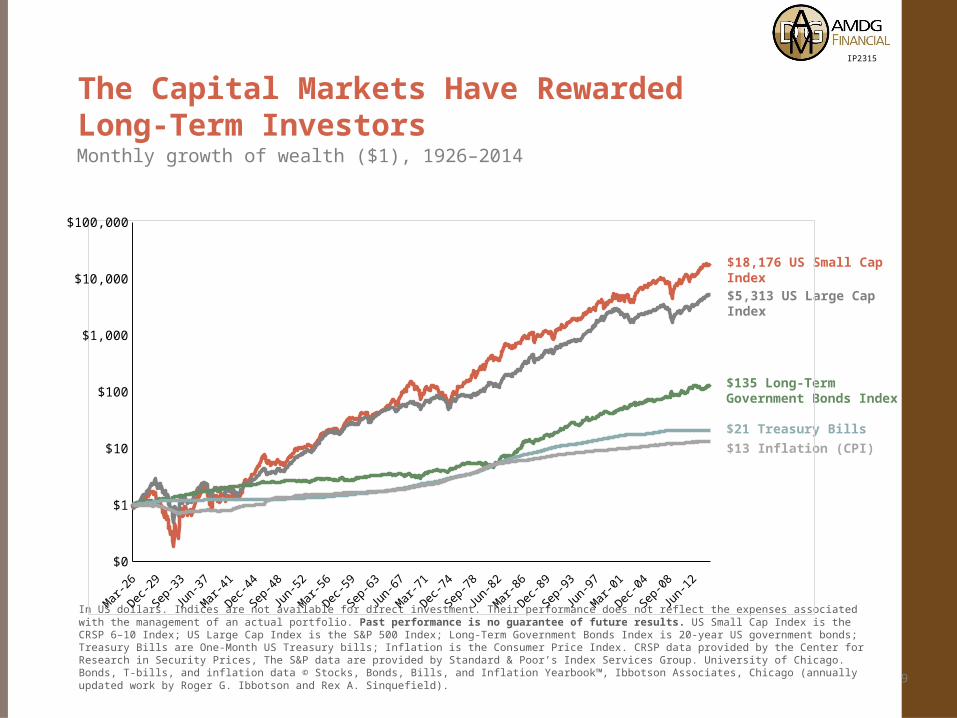
The Capital Markets Have Rewarded Long-Term InvestorsMonthly growth of wealth ($1), 1926–2014
$18,176 US Small Cap Index
$5,313 US Large Cap Index
$135 Long-TermGovernment Bonds Index
$21 Treasury Bills$13 Inflation (CPI)
IP2315
In US dollars. Indices are not available for direct investment. Their performance does not reflect the expenses associated with the management of an actual portfolio. Past performance is no guarantee of future results. US Small Cap Index is the CRSP 6–10 Index; US Large Cap Index is the S&P 500 Index; Long-Term Government Bonds Index is 20-year US government bonds; Treasury Bills are One-Month US Treasury bills; Inflation is the Consumer Price Index. CRSP data provided by the Center for Research in Security Prices, The S&P data are provided by Standard & Poor’s Index Services Group. University of Chicago. Bonds, T-bills, and inflation data © Stocks, Bonds, Bills, and Inflation Yearbook™, Ibbotson Associates, Chicago (annually updated work by Roger G. Ibbotson and Rex A. Sinquefield).
1926 1934 1942 1950 1958 1966 1974 1982 1990 1998 2006 2014$0
$1
$10
$100
$1,000
$10,000
$100,000

10
Diversification
I. Diversification Helps You Capture What Global Markets Offer
II. Diversification Reduces Risks That Have No Expected Return
III. Diversification May Prevent You from Missing Opportunity
IV. Diversification Smoothes Out Some of the Bumps
V. Diversification Helps Take the Guesswork out of Investing
IP2200
Diversification does not eliminate the risk of market loss.
11
IP2140
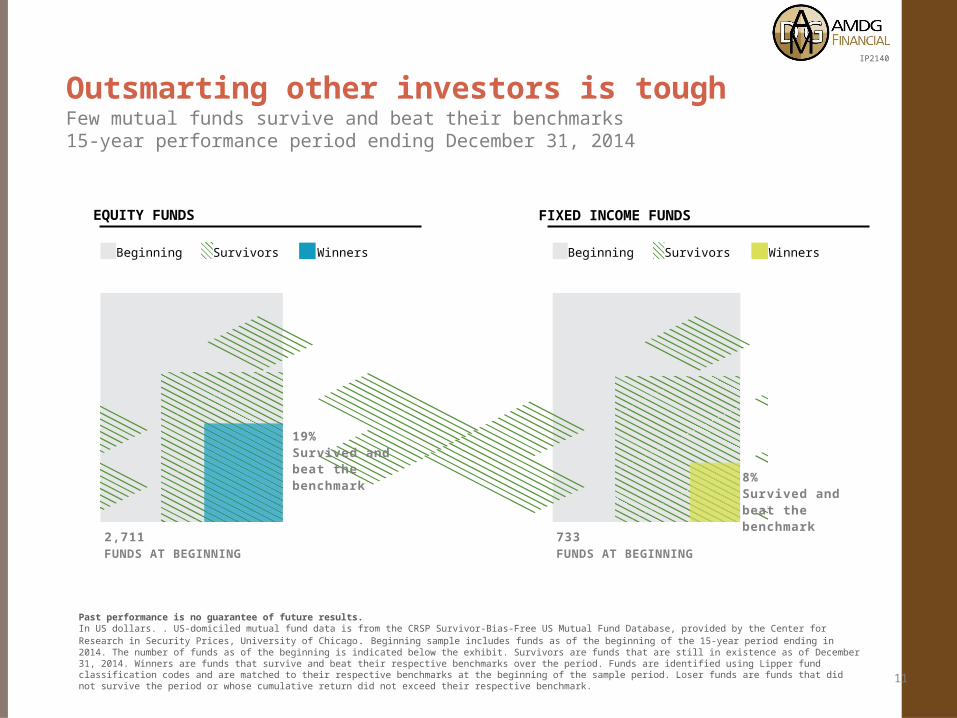
Outsmarting other investors is tough
Past performance is no guarantee of future results. In US dollars. . US-domiciled mutual fund data is from the CRSP Survivor-Bias-Free US Mutual Fund Database, provided by the Center for Research in Security Prices, University of Chicago . Beginning sample includes funds as of the beginning of the 15-year period ending in 2014. The number of funds as of the beginning is indicated below the exhibit. Survivors are funds that are still in existence as of December 31, 2014. Winners are funds that survive and beat their respective benchmarks over the period. Funds are identified using Lipper fund classification codes and are matched to their respective benchmarks at the beginning of the sample period. Loser funds are funds that did not survive the period or whose cumulative return did not exceed their respective benchmark.
Few mutual funds survive and beat their benchmarks15-year performance period ending December 31, 2014
2,711FUNDS AT BEGINNING
733FUNDS AT BEGINNING
19%Survived and beat the benchmark
8%Survived and beat the benchmark
EQUITY FUNDS FIXED INCOME FUNDS
Beginning Survivors Winners Beginning Survivors Winners

12
Diversification Helps You Capture What Global Markets Offer
The global equity market is large and represents a world of investment opportunity.
In US dollars. Diversification does not eliminate the risk of market loss. Market cap data is free-float adjusted from Bloomberg securities data. Many nations not displayed. Total may not equal 100% due to rounding. For educational purposes; should not be used as investment advice. China market capitalization excludes A-shares, which are generally only available to mainland China investors.For educational purposes; should not be used as investment advice.
Percent of world market capitalization as of December 31, 2014
• 44 countries
• Approximately 12,000 publicly traded stocks
• $46.8 trillion market value
IP2205

13
Diversification Reduces Risks That Have No Expected Return
Diversification does not eliminate the risk of market loss.
Concentrating in one stock exposes you to unnecessary risks.
Diversification reduces the impact of any one company’s performance on your wealth.
IP2210

14
Diversification May Prevent You from Missing Opportunity
Source: Bloomberg, London Share Price Database, and Centre for Research in Finance. Compound average annual returns are in US dollars. The returns are from the following developed and emerging markets: Australia, Austria, Belgium, Brazil, Canada, Chile, China, Colombia, Czech Republic, Denmark, Egypt, Finland, France, Germany, Greece, Hong Kong, Hungary, India, Indonesia, Ireland, Israel, Italy, Japan, Republic of Korea, Malaysia, Mexico, Netherlands, New Zealand, Norway, Peru, Philippines, Poland, Portugal, Russia, Singapore, South Africa, Spain, Sweden, Switzerland, Taiwan, Thailand, Turkey, United Kingdom, and the United States. Diversification does not eliminate the risk of market loss. Indices are not available for direct investment; therefore, their performance does not reflect the expenses associated with the management of an actual portfolio. Past performance is no guarantee of future results. Investing involves risks, including fluctuating values and potential loss of principal.
Compound average annual returns: 1994-2014
Attempting to identify that group of future winners is a guessing game.
Diversification improves the odds of holding the best performers.
IP2215
7.5%
3.2%
-6.0%
All stocksExcluding the
top 10% of performers
each yearExcluding the
top 25%of performers
each year

Diversification Smoothes Out Some of the Bumps
15
Illustrative examples. Diversification does not eliminate the risk of market loss.
A well-diversified portfolio can provide the opportunity for a more stable outcome than a single security.
IP2220

16
Diversification Helps Take the Guesswork out of Investing
In US dollars. Diversification does not eliminate the risk of market loss. Past performance is not a guarantee of future results. Indices are not available for direct investment. Their performance does not reflect expenses associated with the management of an actual portfolio. Source: S&P data provided by Standard & Poor's Index Services Group. Russell data copyright © Russell Investment Group 1997-2015, all rights reserved. Dow Jones data provided by Dow Jones Indexes. Dimensional Index data compiled by Dimensional. MSCI data © 2015, all rights reserved. The BofA Merrill Lynch Indices are used with permission; copyright 2015 Merrill Lynch, Pierce, Fenner & Smith Incorporated; all rights reserved. Merrill Lynch, Pierce, Fenner & Smith Incorporated is a wholly owned subsidiary of Bank of America Corporation. Barclays Capital data is provided by Barclays Bank PLC. Citigroup bond indices © 2015 by Citigroup.
You never know which markets will outperform from year to year.
By holding a globally diversified portfolio, investors are positioned to capture returns wherever they occur.
Annual returns (%): 2000–2014
IP2200
2000 2001 2002 2003 2004 2005 2006 2007 2008 2009 2010 2011 2012 2013 2014
31.0 12.3 7.6 60.6 33.8 34.5 36.0 39.8 8.8 79.0 28.1 9.4 18.6 38.8 32.0
9.0 8.4 5.1 56.3 33.2 23.5 32.6 8.2 6.6 44.8 26.9 3.4 17.9 32.4 13.7
8.3 7.3 3.6 47.3 26.0 13.8 25.2 7.2 4.7 28.5 20.9 2.3 17.1 25.8 4.9
7.3 6.4 3.4 36.2 18.3 4.9 18.4 6.3 -33.8 27.2 19.2 2.1 16.3 1.2 1.9
-3.0 2.5 -2.0 28.7 10.9 4.6 15.8 5.9 -37.0 26.5 15.1 0.6 16.0 0.6 1.2
-9.1 -2.4 -6.0 2.0 2.7 3.1 4.3 5.5 -39.2 2.3 3.7 -4.2 2.1 0.3 0.2
-9.9 -11.9 -20.5 1.9 1.3 2.4 4.1 -1.6 -45.8 0.8 2.0 -14.7 0.9 -0.1 -1.8
-30.6 -13.6 -22.1 1.5 0.8 1.3 3.8 -17.6 -53.2 0.2 0.8 -18.2 0.2 -2.3 -5.5
S&P 500 Index
Russell 2000 Index
Dow Jones US Select REIT Index
Dimensional International Small Cap index
MSCI Emerging Markets Index (gross div.)
BofA Merrill Lynch One-Year US Treasury Notes Index
Barclays Treasury Bond Index 1-5 Years
Citigroup World Government Bond Index 1-5 Years (hedged to USD)
Higher Return
Lower Return