Embed Size (px)
Citation preview

Kevin P. Rosenblatt, M.D., Ph.D.Kevin P. Rosenblatt, M.D., Ph.D.Associate Professor of Molecular MedicineAssociate Professor of Molecular MedicineDirector, Center for Clinical ProteomicsDirector, Center for Clinical Proteomics
Centers for Proteomics and Systems BiologyCenters for Proteomics and Systems BiologyBrown Foundation Institute of Molecular MedicineBrown Foundation Institute of Molecular Medicine
&&CoCo‐‐Director, Proteomics CoreDirector, Proteomics Core
Center for Clinical and Translational ScienceCenter for Clinical and Translational ScienceDepartment of PathologyDepartment of Pathology
UTUT‐‐Health Science Center HoustonHealth Science Center Houston
Phone: (713) 500Phone: (713) 500‐‐3611 3611 Fax: (713) 500Fax: (713) 500‐‐24202420EE‐‐mail: mail: [email protected]@UTH.TMC.edu
Sarofim Research BuildingSarofim Research Building1825 Pressler Street1825 Pressler StreetHouston, Texas 77030Houston, Texas 77030

Disclosure:Disclosure:Dr. Rosenblatt is a founder of Dr. Rosenblatt is a founder of
Risk Assessment Laboratories, LLCRisk Assessment Laboratories, LLC
RAL, LLC has a sponsored research agreement RAL, LLC has a sponsored research agreement with UT HSC and the IMMwith UT HSC and the IMM
RAL, LLC received funding from PerkinElmer RAL, LLC received funding from PerkinElmer InternationalInternational

From Discovery to Clinical Assay From Discovery to Clinical Assay
Clinical Proteomics: Translating Biomarkers from Clinical Proteomics: Translating Biomarkers from Bench to BedsideBench to Bedside

Discovery, Verification and Validation of Circulating Discovery, Verification and Validation of Circulating Biomarkers for Predicting PreBiomarkers for Predicting Pre‐‐Term DeliveryTerm Delivery

Pre term birthsPre term birthsCLINICAL IMPLICATIONSCLINICAL IMPLICATIONS
Impacts 12% of all deliveries and rising: Impacts 12% of all deliveries and rising: ‐‐ 500,000 cases per year. To 500,000 cases per year. To date, no strategies have been effective; rate is higher in certadate, no strategies have been effective; rate is higher in certain in populations (e.g. African Americans, >18% in some studies).populations (e.g. African Americans, >18% in some studies).
Costs the US over $40 Billion per yearCosts the US over $40 Billion per year
Preterm babies are far more likely to suffer from cerebral palsyPreterm babies are far more likely to suffer from cerebral palsy and and other lifelong, debilitating conditions (learning disabilities)other lifelong, debilitating conditions (learning disabilities)
TheThe accurateaccurate identification of mothers at high risk for PTB will drive identification of mothers at high risk for PTB will drive medical decisions that actually prolong pregnancy and prevent demedical decisions that actually prolong pregnancy and prevent delivery livery of premature babiesof premature babies
The The accurateaccurate identification of patients that are not at high risk for identification of patients that are not at high risk for premature birth will support medical decisions to let the patienpremature birth will support medical decisions to let the patient go t go home and will save millions of dollars per yearhome and will save millions of dollars per year
The The accurateaccurate identification of patients at high risk will support modern identification of patients at high risk will support modern clinical trials by selecting the right patientsclinical trials by selecting the right patients

Significant Public CostsSignificant Public Costs
March of Dimes (2003)March of Dimes (2003)
Cost of uncomplicated birth and hospital stay; $1700Cost of uncomplicated birth and hospital stay; $1700
Cost of pre term birth and hospital stay; $77,000Cost of pre term birth and hospital stay; $77,000
Subsequent cost per infant; >$100,000Subsequent cost per infant; >$100,000

High Risk WomenHigh Risk Women1.2 Million/Year1.2 Million/Year
Routine testingRoutine testingPhysicianPhysician’’s Offices Office
Annual Health Care SavingsAnnual Health Care SavingsTBDTBD
Negative Test ResultsNegative Test ResultsMaintain pregnancy at homeMaintain pregnancy at home
Positive Test Results1. Admit to Hospital
2. Ambulatory with treatment
Low Risk WomenLow Risk Women2.8 Million/Year2.8 Million/Year
PrePre‐‐Term LaborTerm Labor
4 Million Births/Year4 Million Births/Year

Assay development
Assay development
Biomarker Discovery & Development PipelineBiomarker Discovery & Development Pipeline
EndEnd‐‐Use Clinical AssayUse Clinical Assay

The declining rate of introduction of new protein tests, for allThe declining rate of introduction of new protein tests, for all diseases. The data are plotted diseases. The data are plotted to indicate the declining rate of introduction of new protein anto indicate the declining rate of introduction of new protein analytes in alytes in
FDAFDA‐‐approved or approved or ‐‐cleard clinical tests.cleard clinical tests.Revised: FDARevised: FDA‐‐cleared or cleared or ‐‐approved protein tests approved under CLIA regulations since 199approved protein tests approved under CLIA regulations since 19933
The Declining Rate of FDAThe Declining Rate of FDA‐‐Approved or Approved or ‐‐Cleared Blood Cleared Blood Borne Biomarkers to Reach the Clinical Lab Borne Biomarkers to Reach the Clinical Lab
Anderson and Anderson (2002)Anderson and Anderson (2002)Molecular & Cellular ProteomicsMolecular & Cellular ProteomicsVol. 1: 845Vol. 1: 845‐‐867. 867.

New Serum/Plasma Biomarker Discovery: A Dynamic ProblemNew Serum/Plasma Biomarker Discovery: A Dynamic Problem

Serum/Plasma Protein Pattern Serum/Plasma Protein Pattern DiagnosticsDiagnostics
ProteinsProteins
PatientPatient
Mass SpectroscopyMass Spectroscopy
Proteomic Proteomic ImageImage Pattern Pattern
RecognitionRecognitionLearning Learning AlgorithmAlgorithm
Early Early diagnosis of diagnosis of diseasedisease
Early Early warning of warning of toxicitytoxicity

Collisional CoolingCollisional Cooling
OrthogonalOrthogonalTime of flight tubeTime of flight tube
OrthogonalOrthogonalQuadrupoleQuadrupoleSELDI/MALDISELDI/MALDI
LaserLaser
Protein ChipProtein Chip
IonsIons
SourceSource
Ana
lyzer
Ana
lyzer
Detector
Detector
Biomarker DiscoveryBiomarker DiscoveryprOTOF 2000: Orthogonal MALDI and SELDIprOTOF 2000: Orthogonal MALDI and SELDI

Cibachron Blue Affinity Enrichment of Biomarkers Cibachron Blue Affinity Enrichment of Biomarkers Bound to Carrier ProteinsBound to Carrier Proteins……

Serum BiomarkerSerum Biomarker ProfilingProfiling PlatformPlatform
••Automated Sample Automated Sample Preparation Using Preparation Using MULTIPROBE IIMULTIPROBE II
••Affinity capture Albumin Affinity capture Albumin carrying biomarkerscarrying biomarkers
••Desalt and Concentrate Desalt and Concentrate Biomarkers ZipPlateBiomarkers ZipPlate™™
••Direct transfer onto Direct transfer onto MALDI plateMALDI plate
prOTOF prOTOF AnalysisAnalysis
Protein Samples (Serum)Protein Samples (Serum)
NormalNormal
CancerCancer
Discrim
inatory
Discrim
inatory
Analysis
Analysis
Biom
arker
Biom
arker
Barcod
esBa
rcod
es
AlbuminAlbumin
ROBOTICSROBOTICS
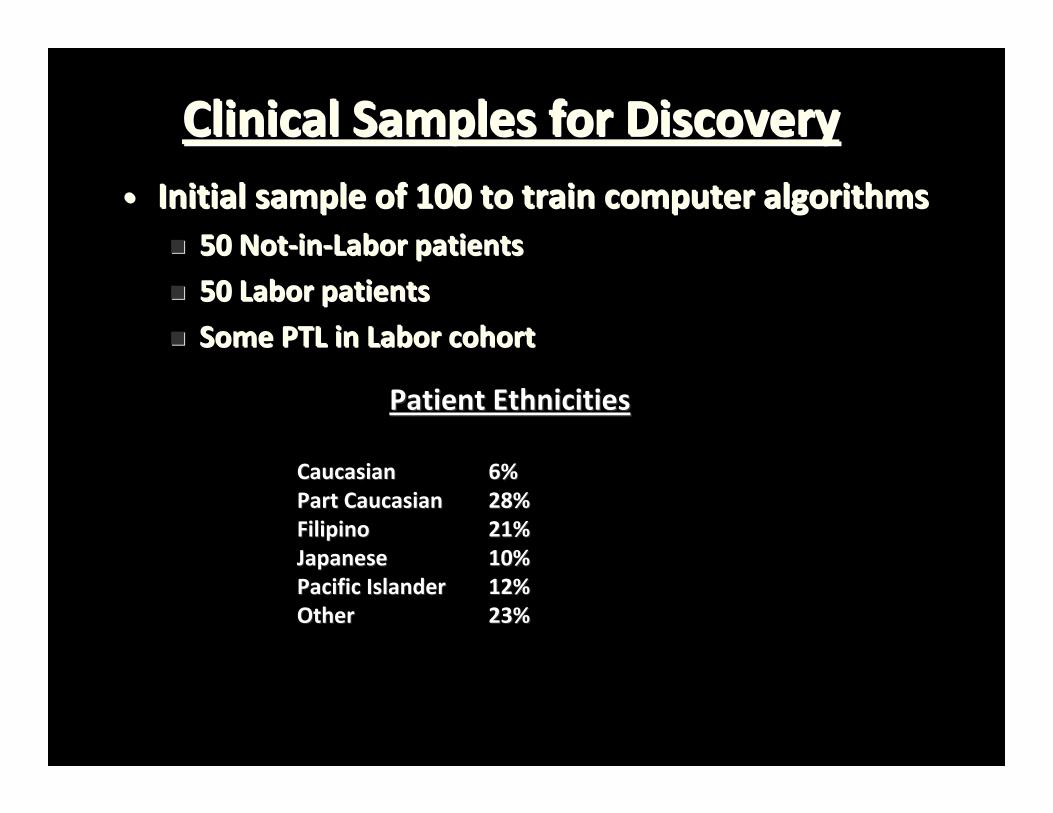
Clinical Samples for DiscoveryClinical Samples for Discovery•• Initial sample of 100 to train computer algorithmsInitial sample of 100 to train computer algorithms
50 Not50 Not‐‐inin‐‐Labor patientsLabor patients
50 Labor patients50 Labor patients
Some PTL in Labor cohortSome PTL in Labor cohort
Patient EthnicitiesPatient Ethnicities
CaucasianCaucasian 6%6%Part CaucasianPart Caucasian 28%28%FilipinoFilipino 21%21%JapaneseJapanese 10%10%Pacific IslanderPacific Islander 12%12%OtherOther 23%23%

Term Delivery vs. PTDTerm Delivery vs. PTD
•• Term Labor (Term Labor (>>37 wks)37 wks) n=39n=39
•• PTD Labor(<37 wks)PTD Labor(<37 wks) n=11 n=11 2424‐‐28 wks28 wks 11
2828‐‐32 wks32 wks 88
3232‐‐34 wks34 wks 22
•• NotNot‐‐inin‐‐LaborLabor n=50n=50includes includes ““symptomatic termssymptomatic terms”” or R/O PTLor R/O PTL

Patient CharacteristicsPatient Characteristics
MeanMeanAverage ageAverage age 27.2 yrs27.2 yrs
EGA at delEGA at del 36 wks 5 days36 wks 5 days
Birth WeightBirth Weight 3200 g3200 g
EGA at drawEGA at draw 35 wks35 wks

Biomarker DiscoveryBiomarker Discovery

# SVM + Markov Blanket# SVM + Markov Blanket
hyperplane
hyperplane
optimalhyperplane
Maximummargin )(
1i
l
iii xyW
Oh, J.H., Nandi, A., Gurnani, P., Bryant-Greenwood, P., Rosenblatt, K.P., and Gao, J. (2006) Prediction of labor for pregnant women using high-resolution mass spectrometry data. Proceedings of the Sixth IEEE International Symposium on BioInformatics and BioEngineering (BIBE 2006) 2006: 332-339, 16-18 October 2006, Arlington, Virginia, USA.

BioInformaticsBioInformatics
Oh et al. (2006) Sixth IEEE Symposium on BionInformatics and BioOh et al. (2006) Sixth IEEE Symposium on BionInformatics and BioEngineering (BIBE'06)Engineering (BIBE'06)

0
5
10
15
20
25
30
35
40
45
0 1000 2000 3000 4000 5000 6000 7000
Non-laborLabor
Four Marker PTD PanelFour Marker PTD PanelRe
lative In
tensity
Relative In
tensity
m/z Values in Daltonsm/z Values in Daltons

Mass Spectrometry Methods for Discovery Mass Spectrometry Methods for Discovery and Protein Identificationand Protein Identification
m/z

1.1. PBEF: PBEF: Differentiation factor, enzyme (Nampt), adipokine (? aka Differentiation factor, enzyme (Nampt), adipokine (? aka Visfatin), released from stretched fetal membranes, recently Visfatin), released from stretched fetal membranes, recently discovered by other labs, discovered by other labs, MSMS‐‐based discovery, verificationbased discovery, verification
2.2. APO C1: APO C1: Lipid metabolism, protects Tg mice from obesity and Lipid metabolism, protects Tg mice from obesity and
insulin resistance, discovered by other labsinsulin resistance, discovered by other labs, , MSMS‐‐based discovery, based discovery, verificationverification
3.3. RBP4: RBP4: Adipokine, recently independently discovered by other Adipokine, recently independently discovered by other labs, labs, MSMS‐‐based discovery, verificationbased discovery, verification
4.4. ILIL‐‐6: 6: Inflammatory cytokine, adipokine, insulin sensitivity Inflammatory cytokine, adipokine, insulin sensitivity literature, verificationliterature, verification
5.5. Relaxin 2: Relaxin 2: Peptide hormone, insulin sensitivity, Peptide hormone, insulin sensitivity, discovery & discovery & literature, verificationliterature, verification
6.6. ILIL‐‐8:8: Inflammatory cytokine, Inflammatory cytokine, literature, verificationliterature, verification
7.7. CARD12:CARD12: Apoptosis regulator, Apoptosis regulator, discovery discovery
8.8. Transferrin: Transferrin: Iron metabolism, Iron metabolism, discovery discovery
Markers Selected via Biased and Unbiased ApproachMarkers Selected via Biased and Unbiased Approach

P
PP
P
P
P
Laser
Biomarker Qualification: ImmunoBiomarker Qualification: Immuno‐‐Mass SpectrometryMass Spectrometry

P
PP
PP
PrePre‐‐Term Labor Term Labor PrePre‐‐EclampsiaEclampsia Term LaborTerm Labor
MicroArray Spotted Patient SpecimensMicroArray Spotted Patient Specimens
Quantum DotQuantum Dot‐‐Labeled Labeled
AntibodiesAntibodies
PPP
P
P P
PP
P
PP
Phosphorylated Phosphorylated Target ProteinTarget Protein
High Throughput Marker VerificationHigh Throughput Marker Verification

LaborLabor
NILNIL
PE, PIHPE, PIH
Labor MarkerLabor Marker
Patient SamplesPatient Samples
Labor MarkerLabor Marker
Verification: HT Parallel Quantitative ScreeningVerification: HT Parallel Quantitative Screening

Clinical Samples for VerificationClinical Samples for Verification
•• 325 Patients of mixed ethnic groups from 24 325 Patients of mixed ethnic groups from 24 ‐‐38 38 weeksweeks 155 In labor within 48 hours of sample155 In labor within 48 hours of sample
168 Not in labor within 48 hours of sample168 Not in labor within 48 hours of sample
Including about 50 preIncluding about 50 pre‐‐term labor samples term labor samples

Term Delivery vs. PTDTerm Delivery vs. PTD
•• Term (Term (>>37 wks)37 wks) n=268n=268
•• PTD (<37 wks)PTD (<37 wks) n=57 n=57 –– 2424‐‐2828 33
2828‐‐3232 88
3232‐‐3434 88
>>3434 38 (4 questionable EDC38 (4 questionable EDC’’s)s)

Patient CharacteristicsPatient Characteristics
MeanMean Std devStd devAverage ageAverage age 27.47 yrs27.47 yrs (6.182)(6.182)
EGA at delEGA at del 36.70 wks36.70 wks (4.635)(4.635)
Birth WeightBirth Weight 3175 g3175 g (729.3789)(729.3789)
EGA at drawEGA at draw 35.06 wks35.06 wks (6.02)(6.02)
Total number of samples = 325Total number of samples = 325
Preeclampsia= 22Preeclampsia= 22
Intrauterine infection (histologic confirmation)= 14Intrauterine infection (histologic confirmation)= 14
Gestational diabetes= 37Gestational diabetes= 37

Patient EthnicitiesPatient Ethnicities
# # % %
CaucasianCaucasian 2121 6.46%6.46%
Part CaucasianPart Caucasian 9292 28.31%28.31%
FilipinoFilipino 7070 21.54%21.54%
JapaneseJapanese 3434 10.46%10.46%
Pacific IslanderPacific Islander 4040 12.31%12.31%
Other AsianOther Asian 6868 20.92%20.92%

No Labor at Draw (n=112)No Labor at Draw (n=112)
Average age Average age 27.227.2 yrsyrs (6.067)(6.067)EGA at drawEGA at draw 32.1wks32.1wks (5.356)(5.356)EGA at delEGA at del 38.838.8 wkswks (1.8673)(1.8673)Birth WeightBirth Weight 3356g3356g (698.8)(698.8)PTD (<37wks)PTD (<37wks) n=3n=3(+) ruptured membranes(+) ruptured membranes(+) advanced cervical dilation(+) advanced cervical dilation excludedexcluded
(+) strong persistent contractions(+) strong persistent contractions

Verification: HT Parallel Quantitative ScreeningVerification: HT Parallel Quantitative Screening

QDot Protein Array Serum Assays
PTL Labor GBS+ NIL
PBEF
Recombinant StDLabor PTD

Not in Labor ROC plot In Labor ROC plot
Classification and Regression TreesClassification and Regression Trees
Class
NCases
N Mis-Classe
d
PctError
Cost
L 142 20 14.08 0.14NIL 166 11 6.63 0.07
Misclassification for Learn DataMisclassification for Learn DataClas
sN
CasesN Mis-Classe
d
PctError
Cost
L 142 66 46.48 0.46NIL 166 74 44.58 0.45
Misclassification for Test DataMisclassification for Test Data
ActualClass
TotalCases
PercentCorrect
LN=133
NILN=175
L 142 85.915 85.915 14.085
NIL 166 93.373 6.627 93.373
Prediction SuccessPrediction Success
VariableVariable ScoreScoreME3ME3 100.00 ||||||||||||||||||||||||||||||||||||||||||
PBEFPBEF 75.39 |||||||||||||||||||||||||||||||
PBG2PBG2 62.18 ||||||||||||||||||||||||||
JL7JL7 59.55 |||||||||||||||||||||||||
BG4BG4 58.65 ||||||||||||||||||||||||
KPR5KPR5 58.44 ||||||||||||||||||||||||

1.1. PBEF: PBEF: Differentiation factor, enzyme (Nampt), adipokine (? aka Differentiation factor, enzyme (Nampt), adipokine (? aka Visfatin), released from stretched fetal membranes, recently Visfatin), released from stretched fetal membranes, recently discovered by other labs, discovered by other labs, MSMS‐‐based discovery, verificationbased discovery, verification
2.2. APO C1: APO C1: Lipid metabolism, protects Tg mice from obesity and Lipid metabolism, protects Tg mice from obesity and
insulin resistance, discovered by other labsinsulin resistance, discovered by other labs, , MSMS‐‐based discovery, based discovery, verificationverification
3.3. RBP4: RBP4: Adipokine, recently independently discovered by other Adipokine, recently independently discovered by other labs, labs, MSMS‐‐based discovery, verificationbased discovery, verification
4.4. ILIL‐‐6: 6: Inflammatory cytokine, adipokine, insulin sensitivity Inflammatory cytokine, adipokine, insulin sensitivity literature, verificationliterature, verification
5.5. Relaxin 2: Relaxin 2: Peptide hormone, insulin sensitivity, Peptide hormone, insulin sensitivity, discovery & discovery & literature, verificationliterature, verification
Markers Selected via Biased and Unbiased ApproachMarkers Selected via Biased and Unbiased Approach
6.6. ILIL‐‐8:8: Inflammatory cytokine, Inflammatory cytokine, literature, verificationliterature, verification
7.7. CARD12:CARD12: Apoptosis regulator, Apoptosis regulator, discovery discovery
8.8. Transferrin: Transferrin: Iron metabolism, Iron metabolism, discovery discovery

0.0
0.2
0.4
0.6
0.8
1.0
0.0 0.2 0.4 0.6 0.8 1.0
Sens
itivi
ty1 - Specif icity
ROC Integral0.982
NIL
0.0
0.2
0.4
0.6
0.8
1.0
0.0 0.2 0.4 0.6 0.8 1.0
Sens
itivi
ty
1 - Specif icity
ROC Integral0.982
L
Verification: HT Parallel Quantitative ScreeningVerification: HT Parallel Quantitative Screening
PBG2PBG2
ME3ME3
BG4BG4
KPR5KPR5

Fetal FibronectinFetal Fibronectin SENSSENS SPECSPEC PPVPPV NPVNPV
Current Gold Standard testCurrent Gold Standard test 21.4%21.4% 94.5%94.5% 30%30% 91.6%91.6%
If Spec is set at 95%, and prevalence of preIf Spec is set at 95%, and prevalence of pre‐‐term birth = term birth = 12% then a fair comparison can be made12% then a fair comparison can be made
Statistical ComparisonsStatistical Comparisons
FDA Approved TestFDA Approved Test
MultiMarker Blood Test: BirthStatMultiMarker Blood Test: BirthStatPredicts Birth in <48 hoursPredicts Birth in <48 hours
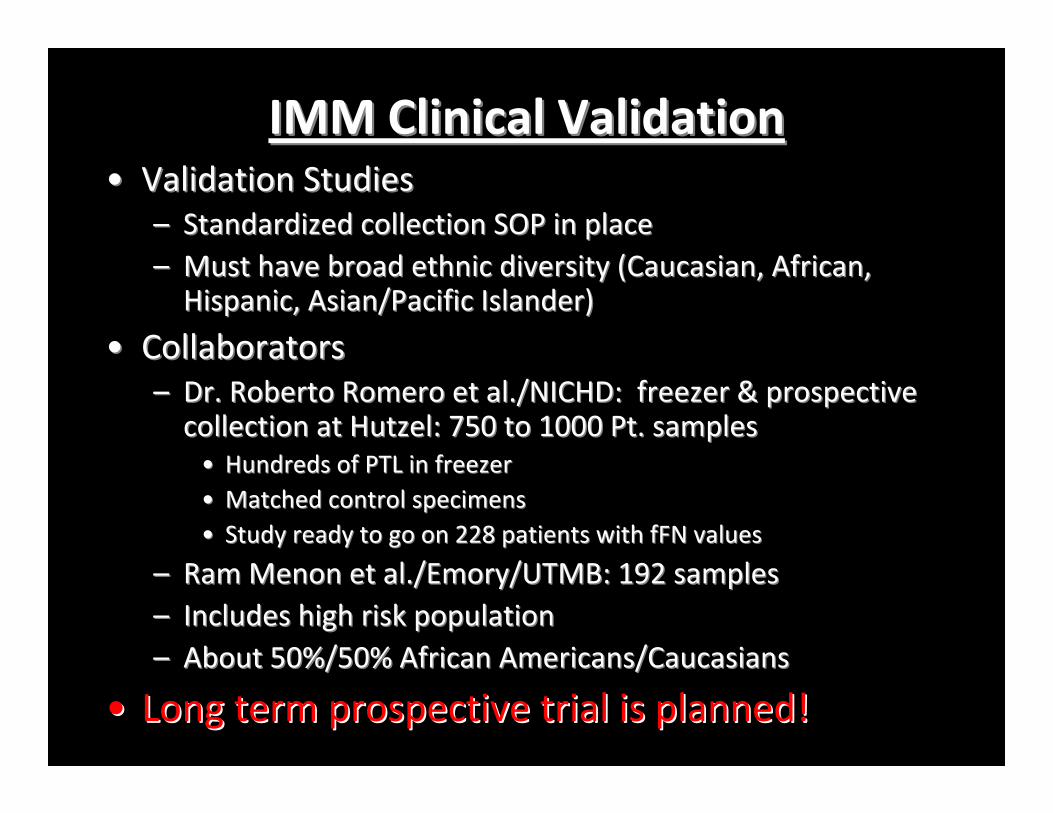
IMM Clinical ValidationIMM Clinical Validation•• Validation StudiesValidation Studies
–– Standardized collection SOP in placeStandardized collection SOP in place–– Must have broad ethnic diversity (Caucasian, African, Must have broad ethnic diversity (Caucasian, African, Hispanic, Asian/Pacific Islander)Hispanic, Asian/Pacific Islander)
•• CollaboratorsCollaborators–– Dr. Roberto Romero et al./NICHD: freezer & prospective Dr. Roberto Romero et al./NICHD: freezer & prospective collection at Hutzel: 750 to 1000 Pt. samplescollection at Hutzel: 750 to 1000 Pt. samples•• Hundreds of PTL in freezerHundreds of PTL in freezer•• Matched control specimensMatched control specimens•• Study ready to go on 228 patients with fFN valuesStudy ready to go on 228 patients with fFN values
–– Ram Menon et al./Emory/UTMB: 192 samples Ram Menon et al./Emory/UTMB: 192 samples –– Includes high risk population Includes high risk population –– About 50%/50% African Americans/CaucasiansAbout 50%/50% African Americans/Caucasians
•• Long term prospective trial is planned!Long term prospective trial is planned!

Reaction Monitoring Increases Signal:Noise for Target Reaction Monitoring Increases Signal:Noise for Target DetectionDetection
m/z
m/z

Q3 monitors only characteristic fragments 158 and 191 from ion 210 for quant and qual.
160
158
Multiple/Selective Reaction Monitoring (MRM/SRM)Multiple/Selective Reaction Monitoring (MRM/SRM)
Quad Mass Filter (Q3)Quad Mass Filter (Q1)
Collision Cell
170 210 250 290
210
222
268 280165
Spectrum with background ions(from ESI)
Q1 lets only target ion 210 pass through
190 210
210
Collision cell breaks ion 210 apart
150 170 190 210
210158
191
190
191
minimized chemical background
Ion source
214 214
160 193 160 193
= Isotope Standards

Serum ImmunoSerum Immuno‐‐SRM assays: Validation PlatformSRM assays: Validation Platform(SRM: Selected Reaction Monitoring)(SRM: Selected Reaction Monitoring)
Serum/plasma Samples
ProcessingProcessing
Wash and EluteWash and Elute
Agilent 6430Agilent 6430
AnalysisAnalysis

ApoC1ApoC1
VisfVisf‐‐AA
VisfVisf
RBP4RBP4
Dynamic range : 5X 101 to 2 x 10⁵

VisfatinVisfatin
LOD: 112 amol (7.11nM)LOQ: 500 amol (31.7 nM)Analyte response (slope): 0.835Correlation coefficient: 0.997CV: 0.79 -18.30 %CV (mean): 5.54%Linear dynamic range:>500

36 SRM transitions of tryptic digested peptides from patient sam36 SRM transitions of tryptic digested peptides from patient samplesples
ApoC1ApoC1 IL6IL6 PBEFPBEF‐‐bb PBEFPBEF‐‐aa Relaxin2Relaxin2 RBP4RBP4

Plasma SRM assays: 3 Replicates of a Plasma SRM assays: 3 Replicates of a Patient Sample and 3 Different SamplesPatient Sample and 3 Different Samples
4


FIRST PASS: FIRST PASS: DELIVERY IN 2 DAYSDELIVERY IN 2 DAYS
•• FRESH run ffN vs up to 12 FRESH run ffN vs up to 12 years for SRM assayyears for SRM assay
•• 128 specimens128 specimens
•• BirthStat algorithm requires BirthStat algorithm requires more iterations before more iterations before completecomplete
PRELIMARY COMPARISIONPRELIMARY COMPARISION
ffN RAL
Sensitivity 66.7% 66.7%
Specificity 73.9% 99.2%
PPV 16.2% 85.7%
NPV 96.7% 97.5%

FIRST PASS: FIRST PASS: DELIVERY IN 7 DAYSDELIVERY IN 7 DAYS
•• FRESH run ffN vs up to 12 FRESH run ffN vs up to 12 years for SRM assayyears for SRM assay
•• 128 specimens128 specimens
•• RAL algorithm (here with RAL algorithm (here with only 2 parameters) only 2 parameters) designed to maximize designed to maximize sensitivity at expense of sensitivity at expense of specificityspecificity–– requires more iterations requires more iterations
before completebefore complete
PRELIMARY COMPARISIONPRELIMARY COMPARISION
ffN RAL
Sensitivity 73.7% 100%
Specificity 78.9% 25.7%
PPV 37.8% 19.0%
NPV 94.5% 100%
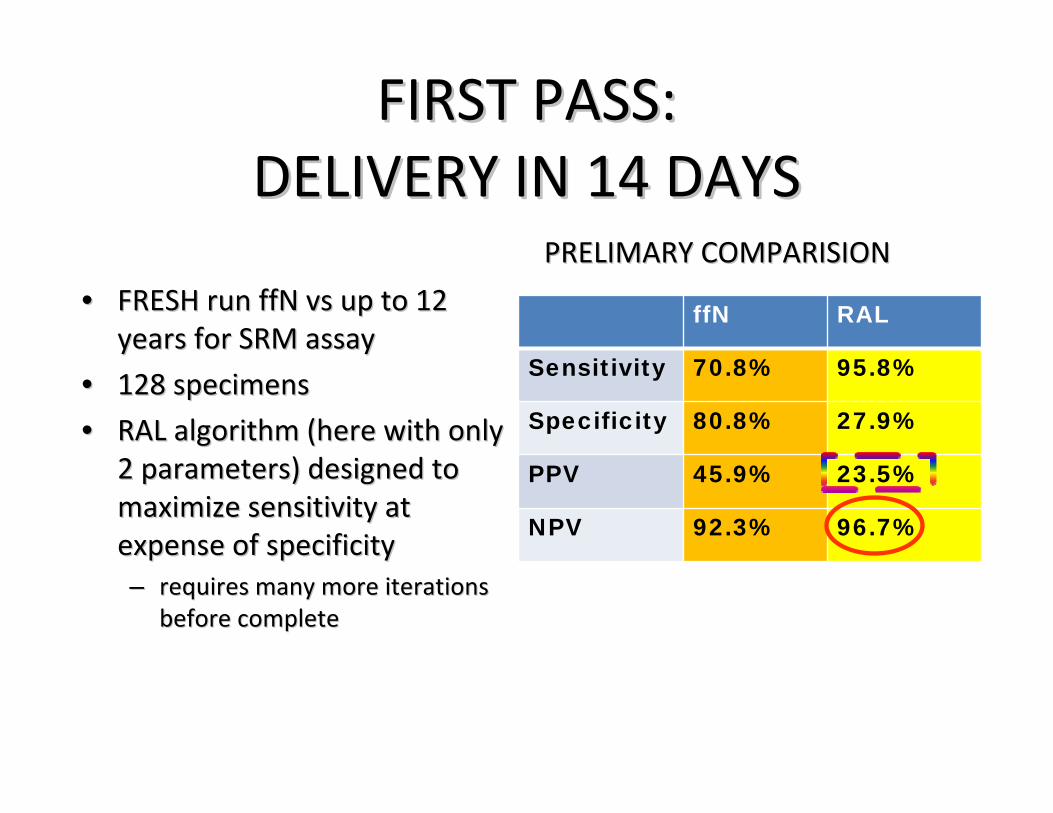
FIRST PASS: FIRST PASS: DELIVERY IN 14 DAYSDELIVERY IN 14 DAYS
•• FRESH run ffN vs up to 12 FRESH run ffN vs up to 12 years for SRM assayyears for SRM assay
•• 128 specimens128 specimens
•• RAL algorithm (here with only RAL algorithm (here with only 2 parameters) designed to 2 parameters) designed to maximize sensitivity at maximize sensitivity at expense of specificityexpense of specificity–– requires many more iterations requires many more iterations
before completebefore complete
PRELIMARY COMPARISIONPRELIMARY COMPARISION
ffN RAL
Sensitivity 70.8% 95.8%
Specificity 80.8% 27.9%
PPV 45.9% 23.5%
NPV 92.3% 96.7%


2011 SRM 2011 SRM ValidationValidation of BirthStat: of BirthStat: Predicts PTB <48 hrsPredicts PTB <48 hrs
ffN RAL
Sensitivity 66.7% 66.7%
Specificity 73.9% 99.2%
PPV 16.2% 85.7%
NPV 96.7% 97.5%
2007 Protein Microarray 2007 Protein Microarray VerificationVerification of BirthStatof BirthStatPredicts PTB <48 hoursPredicts PTB <48 hours

2011 SRM 2011 SRM Phase II ValidationPhase II Validation of BirthStat: New Cohort of BirthStat: New Cohort
(192 Patients from Emory) (192 Patients from Emory)
Predicts PTB <48 hrs by RacePredicts PTB <48 hrs by Race

Newest SRM Newest SRM AssaysAssays for Biomarker Validation for Biomarker Validation Down to Zeptomole SensitivityDown to Zeptomole Sensitivity
SRM
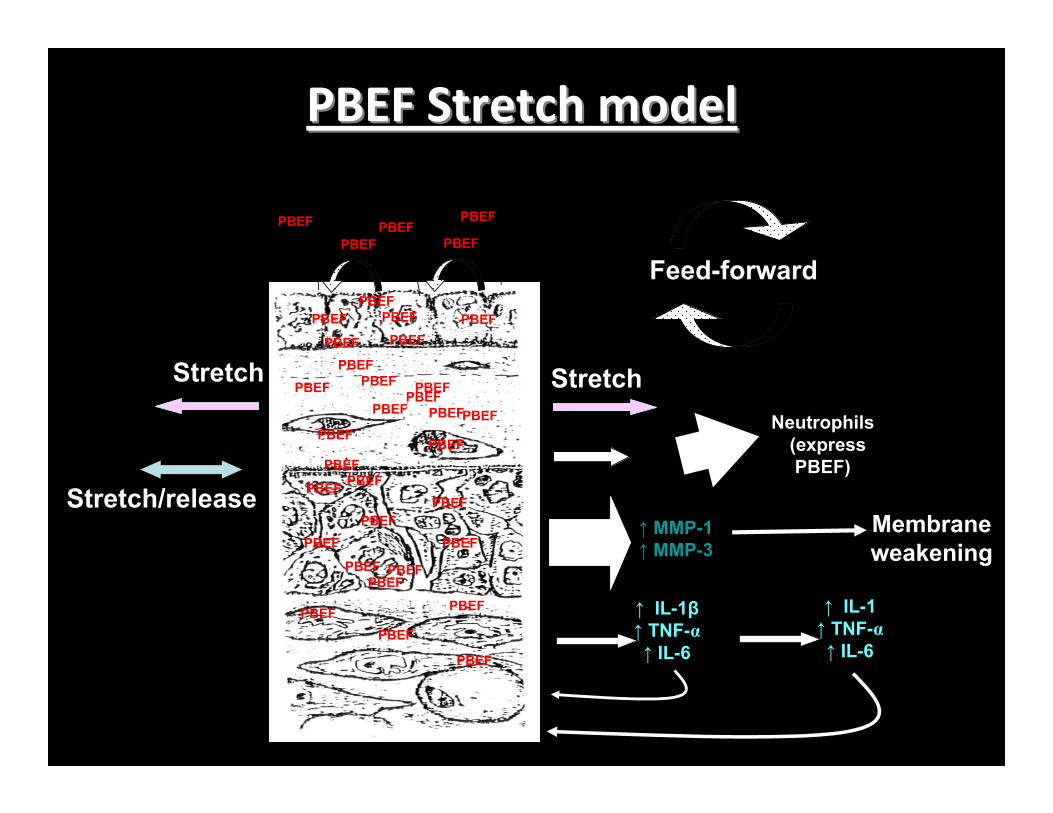
PBEF Stretch modelPBEF Stretch model
PBEF
PBEF
PBEF
PBEF
PBEF
PBEF
PBEF
PBEF
PBEF
PBEF
PBEF
PBEF
PBEF
PBEF
PBEF
PBEF
PBEF
PBEF
PBEF
PBEF
PBEF
PBEF
PBEF
PBEF
PBEF
PBEF
PBEF
PBEF
PBEF
PBEF
PBEF
↑ MMP-1↑ MMP-3
↑ IL-1β↑ TNF-α↑ IL-6
Feed-forward
↑ IL-1↑ TNF-α↑ IL-6
PBEFPBEFPBEF
PBEF
Stretch Stretch
Membrane weakening
Stretch/releaseIL-8
Neutrophils(express PBEF)

Build theSRM Table
Interrogate Interrogate clinical clinical samples samples LCLC‐‐MS/MSMS/MS
OrbiTrapOrbiTrap
SRMs SRMs Triple QuadrupolesTriple Quadrupoles
DiscoveryDiscovery VerificationVerification‐‐Validation Validation ClinicClinic
SRM Workflow SW
Discovery SW
Collect raw Collect raw msms
discovery discovery datadata
Agilent 6430Agilent 6430
Thermo VantageThermo Vantage
IMM/RAL, LLC: Discovery to Clinical ValidationIMM/RAL, LLC: Discovery to Clinical Validation
LCLC‐‐MS/MSMS/MS6538 QToF6538 QToF

Biomarker Discovery and Development Timeline
1 2 3 4 5 6 7Discovery > Proof of Principle > Clinical Configuration > Biomarker Validation > CLIA Home Brew > IVD > PCO
1 Year 1 Year 0.5 Year
Q1-4, Q3 Q4 Q1 Q1 Completed Completed Completed 2010-11 2011 2013 2014
>300 SamplesPublication
750-1000 SamplesSympt. and Asympt.Statistical analysisPublications
FDA Submission
POCSubmission
Operations/ManagementFinal Assay DevelopmentClinical TrialsPublication/Marketing
Home Brew Marketing
FDA Trial
IVD Manufacturing
IVD MarketingPOC ManufacturingPOC Marketing
$??M$??M$??M
$??M
$??M
$??M$??M
$??M

ConclusionsConclusions1.1. Biomarker discovery should follow a carefully designed Biomarker discovery should follow a carefully designed
workflow separated into different clinical phases.workflow separated into different clinical phases.
2.2. Well selected samples clinical samples, with increasing Well selected samples clinical samples, with increasing numbers, should be used in each phase, generalizing to a numbers, should be used in each phase, generalizing to a broader patient population.broader patient population.
3.3. Research and clinical assays and assay platforms should be Research and clinical assays and assay platforms should be carefully designed to suit the particular clinical phase of a carefully designed to suit the particular clinical phase of a studystudy——an endan end‐‐use clinical platform is not a research platform use clinical platform is not a research platform and vice versa.and vice versa.
4.4. SRM technologies can move protein markers into the SRM technologies can move protein markers into the commercialization phase.commercialization phase.
5.5. A consortium of experts, including clinicians, basic scientists,A consortium of experts, including clinicians, basic scientists,bioinformaticists and biostatisticians, technologists, industry,bioinformaticists and biostatisticians, technologists, industry,and regulatory experts is needed to properly develop the next and regulatory experts is needed to properly develop the next generation of screening markers for the clinic.generation of screening markers for the clinic.

Acknowledgements: UTHSC/IMM, UTMB, and UTSW LabsAcknowledgements: UTHSC/IMM, UTMB, and UTSW Labs
•• Reynolds BrobeyReynolds Brobey
•• Proteomics discovery workProteomics discovery work
•• Proteomics signaling assaysProteomics signaling assays
•• Nataliya Bulayeva and Li LiNataliya Bulayeva and Li Li
•• PTB SRM/MRMsPTB SRM/MRMs
•• Sample PrepsSample Preps
•• Mehdi DehghaniMehdi Dehghani
•• Sample PrepsSample Preps
•• Proteomics signaling assays and SRMsProteomics signaling assays and SRMs
NIH Funding: AG025326‐01, AG19712‐5, RFP‐NIH BAA‐HL‐02‐04 NSF: 04‐528 (#0612214)
IMM and UTMB
Prem Gurnani, Johanne Pastor, Animesh Nandi, Kiran Sikder, Dwight German, and “Skip” Garner UT Southwestern
Jean Gao, Jun Ho Oh, Young Bun Kim UT Arlington

4 Key Measures4 Key Measures
•• SensitivitySensitivity•• SpecificitySpecificity•• Positive predictive valuePositive predictive value•• Negative predictive valueNegative predictive value

TestTest
DiseaseDisease
++
++
--
AA BB
CC DD
--

Proportion of people with the disease whoProportion of people with the disease whotest positive.test positive.
SensitivitySensitivity
++
++
--
AA BB
CC DD
--
A A A + CA + C

Probability that a person without the disease Probability that a person without the disease will be correctly identified by the test.will be correctly identified by the test.
SpecificitySpecificity
++
++
--
AA BB
CC DD
--
DDB + DB + D

Probability of actually being affected withProbability of actually being affected withdisease given a positive test result.disease given a positive test result.
Positive Predictive ValuePositive Predictive Value
++
++
--
AA BB
CC DD
--
AAA + BA + B

Probability of actually being unaffected withProbability of actually being unaffected withdisease given a negative test result.disease given a negative test result.
Negative Predictive ValueNegative Predictive Value
++
++
--
AA BB
CC DD
--
DDC + DC + D

TestTest
DiseaseDisease
++
++
--
AA BB
CC DD
--
Sens.Sens. Spec.Spec.
PPVPPV
NPVNPV

TestTest
DiseaseDisease
++
++
--
AA BB
CC DD
--
Sens.Sens. Spec.Spec.
PPVPPV
NPVNPV
Columns give Sens. & Spec.Columns give Sens. & Spec.Rows give PPV and NPVRows give PPV and NPV

Sensitivity & SpecificitySensitivity & SpecificityDo Not Vary With Do Not Vary With
PrevalencePrevalence
Predictive Values DoPredictive Values Do

CLINICAL INTERPRETATIONCLINICAL INTERPRETATION
••DEPENDS NOT ONLY ON THE DEPENDS NOT ONLY ON THE TEST RESULT, TEST RESULT, ––PER SE,PER SE,
•• BUT ALSO UNDERSTANDING BUT ALSO UNDERSTANDING THE POPULATION TESTEDTHE POPULATION TESTED

““A COIN FLIPA COIN FLIP””•• Disease X: Disease X:
–– Population incidence 20 per Population incidence 20 per 10001000
–– New test: flip coinNew test: flip coin–– Expect 10 of 20 disease Expect 10 of 20 disease positivepositive
–– Expect 490 of 980 normals Expect 490 of 980 normals negativenegative

COIN FLIPCOIN FLIP
++
++
--
AA BB
CC DD
--
1010
1010 490490
490490Sensitivity = 10/ 20 = 50%Sensitivity = 10/ 20 = 50%
Positive Predictive ValuePositive Predictive Value= 10 / 500 = 2%= 10 / 500 = 2%
Specificity = 490 / 980 = 50%Specificity = 490 / 980 = 50%
Negative Predictive ValueNegative Predictive Value= 490 / 500 = 98%= 490 / 500 = 98%

COIN FLIPCOIN FLIP
++
++
--
AA BB
CC DD
--
6060
6060 440440
440440Sensitivity = 60/ 120 = 50%Sensitivity = 60/ 120 = 50%
Positive Predictive ValuePositive Predictive Value= 60 / 500 = 12%= 60 / 500 = 12%
Specificity = 440 / 880 = 50%Specificity = 440 / 880 = 50%
Negative Predictive ValueNegative Predictive Value= 440 / 500 = 88%= 440 / 500 = 88%
For fFN w/Prevalence 12%For fFN w/Prevalence 12%120 out of 1000 True +ves120 out of 1000 True +ves

BEWARE OF NPVBEWARE OF NPV•• If there is a low prevalence of a condition, If there is a low prevalence of a condition, even a useless test will have a great NPVeven a useless test will have a great NPV
–– 9090’’s: s: ““Genetic sonogramGenetic sonogram”” reported to reported to have 99% NPVhave 99% NPV
••Problem: before they turned on the Problem: before they turned on the US Machine, they had a 98% NPVUS Machine, they had a 98% NPV

VALUE OF TESTSVALUE OF TESTS•• A test is useful if the odds of having the A test is useful if the odds of having the disease after the test are increased compared disease after the test are increased compared to general populationto general population–– (does not by itself mean cost effective)(does not by itself mean cost effective)
•• A test is useless if the odds of having the A test is useless if the odds of having the disease after the test are unchangeddisease after the test are unchanged
•• A test is worse than useless if the odds of A test is worse than useless if the odds of having the disease after the test are lowerhaving the disease after the test are lower
VALUE OF TESTSVALUE OF TESTS
••With a disorder of low With a disorder of low prevalenceprevalence––Even a great test will have a Even a great test will have a low positive predictive valuelow positive predictive value

Build theSRM Table
Interrogate clinical
samples
LC-MS/MSOrbiTrap
MRMs Triple Quadrupoles
Discovery Verification-Validation Clinic
SRM Workflow SW
Discovery SW
Collect raw ms
discovery data
Agilent 6460
Thermo Vantage
IMM: Discovery to Clinical ValidationIMM: Discovery to Clinical Validation

EGFR ImmunoEGFR Immuno‐‐ vs. Aptamervs. Aptamer‐‐PrecipitationPrecipitation
Aptam
er
mAb

1 Keratin, type II cytoskeletal 1
2 Keratin, type I cytoskeletal 10
3 Keratin, type I cytoskeletal 9
4 Epidermal growth factor receptor
5 Keratin, type II cytoskeletal 2 epidermal
6 Keratin, type II cytoskeletal 6B
7 52 kDa Ro protein
8 60 kDa heat shock protein, mitochondrial
9 Heat shock cognate 71 kDa protein
10 DnaJ homolog subfamily C member 13
11 40S ribosomal protein S19
12 Keratin, type I cytoskeletal 14
13 Multidrug resistance protein 1
14 Arf-GAP with SH3 domain, ANK repeat and PH domain-containing protein 2
15 Brain-specific angiogenesis inhibitor 2
16 MAGUK p55 subfamily member 5
17 Zinc finger protein 473
18 Probable helicase senataxin
Proteins Identified from EGFR antibody-Co-IP
5

1 Leucine-rich PPR motif-containing protein, mitochondrial 27 40S ribosomal protein S19
2 Trifunctional enzyme subunit alpha, mitochondrial 28 Keratin, type I cytoskeletal 9
3 40S ribosomal protein S3 29 60S ribosomal protein L9
4 Ras GTPase-activating-like protein IQGAP1 30 Tubulin beta-3 chain
5 Trifunctional enzyme subunit beta, mitochondrial 31 Peptidyl-prolyl cis-trans isomerase B
6 Heat shock cognate 71 kDa protein 32 Plasminogen activator inhibitor 1 RNA-binding protein
7 78 kDa glucose-regulated protein 33 Probable ATP-dependent RNA helicase DDX46
8 ATP synthase subunit alpha, mitochondrial 34 DNA-binding protein A
9 Keratin, type II cytoskeletal 1 35 40S ribosomal protein S24
10 40S ribosomal protein S4, X isoform 36 Beta-actin-like protein 2
11 Nucleolin 37 General transcription factor II-I
12 60 kDa heat shock protein, mitochondrial 38 Keratin, type I cytoskeletal 10
13 Tubulin alpha-1C chain 39 Neuroblast differentiation-associated protein AHNAK
14 Sulfide:quinone oxidoreductase, mitochondrial 40 Actin, aortic smooth muscle
15 Tubulin beta chain 41 Heat Heat shock protein HSP 90-beta
16 Tubulin beta-2C chain 42 28 kDa heat- and acid-stable phosphoprotein
17 Probable ATP-dependent RNA helicase DDX5 43 40S ribosomal protein S18
18 Annexin A2 44 Stress-70 protein, mitochondrial
19 Pre-B-cell leukemia transcription factor-interacting protein 1 45 Keratin, type II cytoskeletal 2 epidermal
20 Actin, cytoplasmic 1 46 40S ribosomal protein S20
21 Nuclease-sensitive element-binding protein 1 47 40S ribosomal protein S2
22 Very long-chain specific acyl-CoA dehydrogenase, mitochondrial 48 Transcription factor A, mitochondrial
23 Myosin light polypeptide 6 49 Keratin, type II cytoskeletal 6B
24 6-phosphofructokinase type C 50 High mobility group protein B2
25 Phenylalanyl-tRNA synthetase alpha chain 51 Acyl-coenzyme A thioesterase 9, mitochondrial
26 40S ribosomal protein S16 52 60S ribosomal protein L11
Proteins Identified from EGFR aptamer-Co-IP
1

53 Heterogeneous nuclear ribonucleoprotein U 79 Heterogeneous nuclear ribonucleoprotein
54 tRNA (cytosine-5-)-methyltransferase NSUN2 80 Arginine/serine-rich coiled-coil protein 2
55 60S ribosomal protein L10 81 Epidermal growth factor receptor
56 Putative RNA-binding protein Luc7-like 2 82 60S ribosomal protein L19
57 SAP domain-containing ribonucleoprotein 83 Brain acid soluble protein 1
58 SRA stem-loop-interacting RNA-binding protein, mitochondrial 84 ATP synthase subunit gamma, mitochondrial
59 Elongation factor Tu, mitochondrial 85 RNA-binding protein EWS
60 CD44 antigen OS=Homo sapiens 86 Sarcoplasmic/endoplasmic reticulum calcium ATPase 1
61 40S ribosomal protein S14 87 Heterogeneous nuclear ribonucleoprotein H
62 ATP synthase subunit delta, mitochondrial 88 Long-chain-fatty-acid--CoA ligase 4
63 RNA-binding protein FUS 89 Keratin, type II cytoskeletal 75
64 Calnexin 90 Keratin, type II cytoskeletal 5
65 ATP-dependent RNA helicase DDX3X 91 Keratin, type II cytoskeletal 79
66 High mobility group protein B1 92 60S ribosomal protein L22
67 Putative 40S ribosomal protein S10-lik 93 ATP synthase subunit O, mitochondrial
68 Vesicle-trafficking protein SEC22b 94 60S ribosomal protein L30
69 Putative elongation factor 1-alpha-like 3 95 Eukaryotic translation initiation factor 5B
70 Heat shock 70 kDa protein 1A/1B 96 ATP synthase subunit e, mitochondrial
71 ADP/ATP translocase 2 97 Dolichol-phosphate mannosyltransferase
72 Luc7-like protein 3 98 UDP-glucose 6-dehydrogenase
73 60S ribosomal protein L23a 99 Receptor tyrosine-protein kinase erbB-4
74 Isoleucyl-tRNA synthetase, 100 Reticulon-4
75 40S ribosomal protein S28 101 Keratin, type I cytoskeletal 28
76 GTP-binding nuclear protein Ran 102 Uncharacterized protein C19orf43
77 Signal recognition particle receptor subunit beta 103 28S ribosomal protein S15, mitochondrial
78 DNA-dependent protein kinase catalytic subunit 104 Protein LYRIC
2

105 Transcription intermediary factor 1-beta 130 Peroxiredoxin-1
106 Nicotinamide phosphoribosyltransferase 131 40S ribosomal protein S3a
107 40S ribosomal protein S9 132 40S ribosomal protein S11
108 Ubiquitin-associated protein 2-like 133 Protein FAM103A1
109 60S ribosomal protein L13 134 Janus kinase and microtubule-interacting protein 3
110 40S ribosomal protein S5 135 40S ribosomal protein S29
111 Putative 60S ribosomal protein L13a-like MGC87657 136 Rho-related GTP-binding protein RhoC
112 60S ribosomal protein L38 137 Uncharacterized protein C6orf125
113 Heterogeneous nuclear ribonucleoprotein U-like protein 2 138 Transmembrane protein 192
114 Microtubule-associated protein 4 139 Inactive ubiquitin carboxyl-terminal hydrolase 53
115 40S ribosomal protein S27 140 60S ribosomal protein L12
116 Nucleolar transcription factor 1 141 Dolichyl-diphosphooligosaccharide-protein glycosyltransferase 48 kDa subunit
117 Eukaryotic translation initiation factor 1A 142 E3 ubiquitin-protein ligase SHPRH
118 THO complex subunit 4 143 60S ribosomal protein L27a
119 Probable dimethyladenosine transferase 144 60S ribosomal protein L23
120 40S ribosomal protein S25 145 Ras GTPase-activating protein nGAP
121 28S ribosomal protein S7 mitochondrial 146 Mannosyl-oligosaccharide glucosidase
122 ATP synthase subunit b, mitochondrial 147 Putative mitochondrial carrier protein FLJ44862
123 Translational activator of cytochrome c oxidase 1 148 KN motif and ankyrin repeat domain-containing protein 2
124 Coatomer subunit alpha 149 Histone-lysine N-methyltransferase SUV420H1
125 Pyruvate kinase isozymes M1/M2 150 40S ribosomal protein S30
126 Probable saccharopine dehydrogenase 151 Putative high mobility group protein B3-like-1
127 Long-chain-fatty-acid--CoA ligase 1 152 Rab11 family-interacting protein 1
128 60S ribosomal protein L35 OS=Homo sapiens 153 Meiosis-specific nuclear structural protein 1
129 Myosin light chain 1/3, skeletal muscle isoform 154 E3 ubiquitin-protein ligase UBR3
3

155 NADH dehydrogenase [ubiquinone] 1 alpha subcomplex subunit 10, mitochondrial
156 Solute carrier family 22 member 7
157 Werner syndrome ATP-dependent helicase
158 Oxidoreductase NAD-binding domain-containing protein 1
159 40S ribosomal protein S13
160 Cytosolic carboxypeptidase 4
161 Cyclin-dependent kinase-like 1
162 Histone acetyltransferase p300
163 Uncharacterized protein C2orf72
164 Myosin-XIX
4
AntibodyAntibody AptamerAptamer
1818 164164

Serum Serum AptamerAptamer‐‐SRM assays: Validation PlatformSRM assays: Validation Platform(SRM: Selected Reaction Monitoring)(SRM: Selected Reaction Monitoring)
Serum/plasma Samples
ProcessingProcessing
Wash and EluteWash and Elute
Agilent 6430Agilent 6430
AnalysisAnalysis

Fixed Tissue (FFPE) Fixed Tissue (FFPE) SRM SRM AssaysAssays for Cancer Biomarker Validation for Cancer Biomarker Validation


![NanoQuant Plate - Tecanww3.tecan.com/mandant/files/doc/219/NanoQuant_FAQ... · (4a) Sample 260 Ref = OD 260 Sample – OD 340_Sample – Blank 260 Ref [OD] (4b) Sample 280 Ref = OD](https://img.dokumen.tips/doc/110x75/5f6ae723e649c37b8621ec5d/nanoquant-plate-4a-sample-260-ref-od-260-sample-a-od-340sample-a-blank.jpg)


