Embed Size (px)
Citation preview

Oct
ober
2021
A project of the Robert Wood Johnson Foundation
From Crisis to OpportunityReforming Our Nation’s Policies to Help All Children Grow Up Healthy
DRAFTEmbargoed for:
12:01 a.m. ET, Wednesday, October 13, 2021

ABOUT THE ROBERT WOOD JOHNSON FOUNDATION
The Robert Wood Johnson Foundation (RWJF) is committed to improving health and health equity in the United States. In partnership with others, we are working to develop a Culture of Health rooted in equity, that provides every individual with a fair and just opportunity to thrive, no matter who they are, where they live, or how much money they have. For more information,visit www.rwjf.org.
Follow the Foundation on Twitter at www.rwjf.org/twitter or on Facebook at www.rwjf.org/facebook.
STATE of CHILDHOOD OBESITY 1
Introduction 3
Overview 4
Childhood Obesity Rates and Trends 9
Recommendations & Policies 19
Priority Policy Recommendations 20
Child Nutrition Reauthorization 22
School Meals 24
Women, Infants, and Children Program 32
Child and Adult Care Food Program 40
Farm Bill 42
SNAP 43
Descriptions of Obesity Rate Datasets 48
State-by-State Obesity Rates 50
References 52
ContentsFind this report and interactive
data features with the latest
childhood obesity rates and
trends, as well as policies and
recommendations for helping
all children grow up healthy, at
stateofchildhoodobesity.org.


STATE of CHILDHOOD OBESITY 3
Introduction
IntroductionA letter from Jamie Bussel
Friends,Friends,
As I reflect on the year that’s gone by and on our work to prioritize children’s health during this pandemic, I’m struck both by the progress we’ve seen and the relentless challenges we’ve faced.
And yet, despite ongoing shutdowns, dangerous virus variants, economic uncertainty, and rising childhood obesity rates, we can point to policy solutions that are already supporting the health of children and families.
Schools are providing all kids with healthy, free meals—whether they are open for in-person learning or operating virtually. Families face fewer barriers to enrolling in nutrition assistance programs and using their benefits. Policymakers have increased monthly benefit levels in nutrition programs and are providing child tax credits to help families meet their kids’ needs.
These changes have the potential to significantly decrease child hunger and poverty in this country. But many of these provisions are temporary emergency relief measures. We need to think bigger and bolder about permanent solutions that will strengthen our nation’s policies and expand support for kids and families for the long term.
We also know that racist policies and discriminatory practices put kids of color, and children and families who live furthest from economic opportunity, at high risk for obesity. We must continue to work across all sectors to address these issues.
That means building fair and sustainable food systems that not only improve access to healthy, affordable food, but also support Indigenous leaders, empower communities, and address the effects of climate change. It also means improving access to healthcare for all, and ensuring parents and caregivers have child-care options that work for their families.
These challenges are deep-rooted, systemic, and interconnected—but they are not intractable.
As I think about the Robert Wood Johnson Foundation’s enduring commitment to addressing childhood obesity, I am reminded that it is also a commitment to ensure that every child in America has a fair shot to grow up as healthy as possible. And I’m looking ahead with a renewed sense of hope for new thinking, new collaboration, and lots of learning.
Whether you’re working on health, racial equity, hunger, fair wages, climate change, obesity, or something else, I welcome your ideas for how we can change policies and systems to help all children grow up healthy. Please email us at [email protected].
With gratitude,
Jamie BusselSenior Program Officer, RWJF

4 STATE of CHILDHOOD OBESITY
The COVID-19 pandemic continues to have a The COVID-19 pandemic continues to have a significant impact on our lives and our health.significant impact on our lives and our health.
Recent studies confirm the surge in childhood obesity predicted by experts a year ago, documenting rising rates during the pandemic, with the largest increase among children younger than age 12.1,2,3 The latest national data continue to show significant and persistent disparities, with rates of obesity highest among children of color and children from families with low incomes.4
This is an urgent call to action for leaders at all levels and across all sectors.
Childhood obesity is a symptom of larger challenges families face in their communities and a sign that our nation’s policies are failing our kids.
Millions of families struggle with food insecurity, meaning they do not have consistent access to enough food to
live a healthy life.5 Our nation’s safety net is fragile, outdated, and out of reach for millions of eligible kids and caregivers.6 Safe, affordable housing is scarce, forcing families to make hard choices about how to spend limited resources.7 And underlying all of these challenges is the structural racism that has been embedded in our policies and practices for decades.
The pandemic exacerbated these issues. It has disrupted and stressed the systems that affect every aspect of our daily lives—economic, education, healthcare, food, housing—resulting in profound consequences for the health and well-being of children and families.
To build a healthier nation for the next generation, we must work to dismantle structural racism and reform our policies.
Overview

STATE of CHILDHOOD OBESITY 5
Overview
How do we move forward?How do we move forward?
As we continue to address the pandemic, we must ensure federal programs such as school meals, the Supplemental Nutrition Assistance Program (SNAP), and the Special Supplemental Nutrition Program for Women, Infants, and Children (WIC) prioritize equity and health—and reach as many kids as are eligible.
We must also look upstream and approach this issue more broadly with far-reaching changes that make our food, housing, education, employment, and healthcare systems more fair, just, and sustainable. This will require public and private sector partners to collaborate on bold systemic solutions that address
structural racism, poverty, food insecurity, and other challenges at the same time. Further, we must look to and learn from other countries that are passing strong policies to protect children’s health.
This report highlights the latest childhood obesity rates and trends and provides expert insights, relevant research, and policy recommendations. It also presents emerging opportunities and promising strategies for moving forward from the crisis of the pandemic and closer to a nation where every child has a fair shot to live the healthiest life possible.

Expert Perspective
6 STATE of CHILDHOOD OBESITY
Fighting for Food Justice
Malik YakiniMalik YakiniCo-Founder and Executive Director of
the Detroit Black Community Food
Security Network
In the United States, we have the technology and the know-how to grow enough food to feed all human beings. But that isn’t happening. Hunger is real for millions in America, particularly in Black and Brown communities. And while hunger is not a new issue in America, what does feel new is the sense of urgency to address hunger that COVID has ushered in.
We need to focus on the root causes of hunger that put high-quality nutritious food out of reach for so many, including the tremendous disparities in wealth and the legacy of slavery. We need to break away from the industrial food system we have now and build more fair, resilient, and localized food systems.
That’s why, in Detroit, we’re working to create a food system that is shaped, defined, and controlled by the people who are producing and consuming the food.
It starts with food production.
Most people are concentrated in urban areas, and it makes more sense—both in terms of getting nutrient-dense food to people quickly and also in terms of doing the least harm to the environment—to grow food closer to centers of population density.
That’s why we started D-Town Farm, a seven-acre farm in the city where we grow more than 30 different fruits, vegetables, and herbs.
Next, we need to examine how we buy and sell food.
We need co-ops on all levels. We need them for farmers and producers, distribution, and grocery stores, such as the Detroit People’s Food Co-op, which has 1,300 member owners and is scheduled to begin construction soon. Co-op businesses foster economic strength in neighborhoods and empower residents with more equitable pay and ownership in the company. We also need to look at how municipal governments, colleges, churches, and other institutions buy food, because they have tremendous purchasing power.
And if we want the food justice movement to be sustainable, we must intentionally engage young people by teaching them about the food system so they become empowered to make decisions that benefit their health, their communities, and the environment for generations to come.
Learn more about Detroit’s food justice movement at stateofchildhoodobesity.org.
“Access to good, clean, sustainably grown food is a basic human right.”

Expert Perspective
STATE of CHILDHOOD OBESITY 7
In Mexico, Healthy Food Is a Child’s Right
Ana LarrañagaAna LarrañagaWorks with Salud Crítica, a public health
advocacy organization based in Mexico City
“With these bans, Mexico is taking a huge step in protecting and guaranteeing a child’s right to a healthy
future and recovery from the pandemic.”
Last year, during the pandemic, legislators in Mexico banned the sale of unhealthy foods and beverages to children in three states: Oaxaca, Tabasco, and Colima. Many other states have introduced similar bills.
The laws prohibit donations, sales, or supplies of sugary drinks and high-calorie packaged foods such as chips and candy, to children under 18.
These bans were initially part of a strategy to regulate advertisements by food and beverage companies. But the local congresses decided to advance this measure by autonomously enacting a nationwide labeling law that introduced warning symbols for all packaged food and beverages that are high in sugars, calories, salt, and saturated or trans fat.
The symbols—stark black stop signs with written warnings such as “excess sugar” and “excess sodium”—must be placed on the front of the package where it’s easy to see.
Momentum for the bans was triggered by the ministry of health’s
communication around COVID-19 prevention, including the important role food plays in promoting health and preventing disease.
What’s striking about these bans is that they were conceived within a framework of children’s rights.
This tells us a lot about how the health of a child is viewed in Mexico. It’s not just a matter of health or disease prevention, but also about the right of a child to be in environments that are health-promoting and free of unhealthy foods and drinks.
These laws are not perfect and have encountered pushback from food and beverage industries. They also require a lot of political will.
But across the country, there is consensus that junk food and sugary drinks won’t help us move forward from the pandemic.
Learn more about Mexico’s efforts to protect children’s health at stateofchildhoodobesity.org.
8 STATE of CHILDHOOD OBESITY
9
Childhood Obesity Rates and Trends
This section includes the latest data from ongoing federal surveys that track obesity rates among children and teens, including the National Health and Nutrition Examination Survey, the National Survey of Children’s Health, the WIC Participant and Program Characteristics Survey, and the Youth Risk Behavior Surveillance System. Because research shows that children who have obesity at an early age are more likely to have obesity later in life,8,9 this report also includes the latest findings from the Behavioral Risk Factor Surveillance System, which tracks adult obesity rates.
When describing differences by race and ethnicity, this section uses the racial and ethnic terms provided by the original dataset. More information about the datasets, a complete listing of state-by-state rates for each major survey, and a definition of body mass index (BMI), the measure used in tracking obesity rates, is available in the appendix.

10 STATE of CHILDHOOD OBESITY
Childhood Obesity Rates and Trends
Key FindingsKey Findings
Childhood obesity continues to be a national epidemic, putting millions of children at greater risk for type 2 diabetes, high blood pressure, and other serious conditions.10 Black and Latinx youth have disproportionately higher obesity rates compared with White children. In addition, early evidence is beginning to show that the COVID-19 pandemic and recession are likely contributing to rising childhood obesity rates.
The newest available data from the National Survey of Children's Health show that in 2019-20, 16.2 percent of youth ages 10 to 17 had obesity, a rate that has held steady for the last five years.11 The 2020 data were collected from June 2020 until January 2021 and do not yet indicate any significant change in rates associated with the COVID-19 pandemic.
Emerging evidence from other studies shows that the COVID-19 pandemic may be contributing to rising childhood obesity rates.
A national study based on electronic health records from over 430,000 people ages 2-19 nationwide show that the obesity rate for this group rose from 19.3 percent in August 2019 to 22.4 percent in August 2020. The monthly rate of increase in BMI nearly doubled from pre-pandemic to during the pandemic. The rates of BMI increase were greater for young people who were already overweight or had obesity, and among children ages 6-11, than among kids in other age groups.12
A study conducted in the Philadelphia region concluded that childhood obesity rates rose between 2019 and 2020 and that existing racial and ethnic disparities in rates worsened.13 Researchers analyzed data from over 500,000 clinic visits of youth ages 2-17. The overall obesity rate rose from 13.7 percent to 15.4 percent. Increases were greater among youth who were Hispanic or non-Hispanic Black than among White youth, and among those from families with lower incomes, than for those from families with higher incomes.
Research based on electronic health records from more than 190,000 California youth tracked over time found that the obesity rate rose significantly during the pandemic.14 Before the pandemic, 36.2 percent of 5- to 11-year-olds were overweight or had obesity, a rate that increased to 45.7 percent during the pandemic (from March 2020 to January 2021). The study attributes most of the increase due to a rise in obesity. Study authors did not report obesity rates by race and ethnicity, but the cohort measured was diverse: 50.4 percent Hispanic, 25.3 percent White, 10.4 percent Asian and Pacific Islander, and 7 percent Black youth.
CHILDHOOD OBESITY SPIKES DURING PANDEMIC
PHILADELPHIA, PENNSYLVANIA
13.7% 15.4% 2019 2020
Increase in obesity rate among youth ages 2-17
NATIONWIDE
19.3% 22.4% 2019 2020
Increase in obesity rate among youth ages 2-19
CALIFORNIA
18.8% 26.1% 2020 2021
Increase in obesity rate among youth ages 5-11
16.2%of youth ages 10-17 nationwide
have obesity

STATE of CHILDHOOD OBESITY 11
Childhood Obesity Rates and Trends
Additional DataAdditional Data
The data measuring obesity rates among youth ages 10-17, which come from the 2019-2020 National Survey of Children’s Health, include additional findings on national and state-by-state obesity rates.
National data for 10-17 year olds:
Between 2016 and 2019-2020, obesity rates have held steady; there have not been any significant changes over time.
Disparities by race and ethnicity persist. In 2019-2020, non-Hispanic Asian children had the lowest obesity rate (8.1%), followed by non-Hispanic White children (12.1%). Obesity rates were significantly higher for Hispanic (21.4%), non-Hispanic Black (23.8%), and non-Hispanic American Indian/Alaska Native (28.7%) children.
There were also significant differences based on household income. In 2019-2020, obesity rates ranged from 8.6 percent among youth in the highest income group to 23.1 percent among youth in the lowest income group.
State-by-state data for 10-17 year olds:
Kentucky had the highest youth obesity rate (23.8%) while Montana had the lowest (10.0%).
Six states had youth obesity rates significantly higher than the national rate (16.2%): Kentucky (23.8%), Mississippi (22.3%), Louisiana (22.2%), West Virginia (21.9%), Alabama (21.8%), and Tennessee (20.8%).
Eleven states had youth obesity rates significantly lower than the national rate (16.2%): Montana (10%), Arizona (10.2%), Utah (10.3%), North Dakota (10.5%), Wyoming (11.0%), Colorado (11.2%), New York (11.5%), Kansas (11.7%), Minnesota (11.7%), Massachusetts (12.2%), and Nebraska (12.6%).
Declining obesity rates among children participating in WIC, prior to the pandemic:
The national obesity rate among children ages 2-4 participating in WIC has dropped in recent years, from 15.9 percent in 2010 to 14.4 percent in 2018. This decline was statistically significant among all racial and ethnic groups studied: American Indian/Alaska Native, Asian/Pacific Islander, Black, Hispanic, and White.
OBESITY RATES BY RACE, ETHNICITY AND HOUSEHOLD INCOME AMONG YOUTH AGES 10-17 NATIONWIDE
AMERICAN INDIAN/ALASKA
NATIVE
28.7%
BLACK
23.8%
HISPANIC
21.4%
WHITE
12.1%
ASIAN
8.1%
LOWEST INCOME
23.1%
HIGHEST INCOME
8.6%

12 STATE of CHILDHOOD OBESITY
Childhood Obesity Rates and Trends
YOUTH AGES 10-17 NSCH, 2019-2020
STUDENTS IN GRADES 9-12 YRBS, 2019
WIC PARTICIPANTS AGES 2-4 WICPCC, 2018
ADULTS AGES 20 AND OLDER BRFSS, 2020
0–9.9%
0–9.9%10–14.9%
10–14.9%
10–14.9%15–19.9%
15–19.9%
15–19.9%
30–34.9%35%+
20–24.9%20–24.9%
20–24.9%20–24.9%
no data25–29.9%
VTNHMACTRINJDEMDDC
VTNHMACTRINJDEMDDC
VTNHMACTRINJDEMDDC
VTNHMACTRINJDEMDDC
STATE-BY-STATE OBESITY RATES

STATE of CHILDHOOD OBESITY 13
Childhood Obesity Rates and Trends
NATIONAL OBESITY RATES BY AGE GROUP
National Survey of Children’s Health
Youth Risk Behavior Surveillance System
WIC Participant and Program Characteristics Survey
National Health and Nutrition Examination Survey
Age range studied Youth ages 10-17 High school students Children ages 2-4 participating in WIC
Children and youth ages 2-19
Most recent year of data available
2019-20 2019(Released Aug. 2020)
2018(Released Aug. 2021)
2017-18(Released Apr. 2020)
National obesity rate
16.2% 15.5%(a) 14.4% (b) 19.3%(c)(d)
Black 23.8% 21.1% 11.80% 22%
Hispanic 21.4% 19.2% 17.20% 25.8%
White 12.1% 13.1% 12.40% 14.1%
Asian American 8.1% 6.5%(e) 10.40%(f) 11%
American Indian/ Alaska Native
28.7% (g) 21.3% 18.80% N/A
Native Hawaiian/ other Pacific Islander
14.3% N/A 10.40%(f) N/A
Notes:a. The national obesity rate is significantly
higher than it was in 1999.b. The national obesity rate declined
significantly between 2010 and 2016. This trend was significant for all racial and ethnic groups studied, and in 41 states and territories.
c. The national obesity rate data is from 2017-18. The racial and ethnic breakdowns are from 2015-16.
d. Youth obesity rates rose significantly from 1999–2000 to 2015-16. Rates have plateaued from 2013-14 to 2015-16.
e. The YRBS uses the racial/ethnic group Asian instead of Asian American.
f. This survey combines Asian American and Pacific Islander, which is why the obesity rate is the same for those groups.
g. The confidence interval for this measure is very wide and so the data should be interpreted with caution.

Expert Perspective
14 STATE of CHILDHOOD OBESITY
COVID-19 is likely to affect obesity rates in children in a significant way. With so many families dealing with financial challenges due to the pandemic, the connection between food insecurity, unhealthy eating habits, and obesity have become even more evident.
For example, disruptions in the food supply chain meant changes in what was available in stores. Loss of jobs and disruptions in income increased food insecurity rates. Parents’ shopping patterns changed, with less frequent trips and increased reliance on non-perishable foods. All of these changes disproportionately impact households with children.
The pandemic also highlighted the crucial role schools play in supporting kids’ health and protecting against obesity. Schools provide structure, access to nutritious meals, opportunities for physical activity, and limits to sedentary time.
Further, research suggests particular benefits for students from families furthest from economic opportunity. Among those children who eat meals at school, doing so is associated with a lower risk of obesity.15 Other studies find that school-age children gain weight at a rapid rate when school is out during summer.16 So absence of regular school attendance over extended periods is a major concern.
Children and their families most certainly need support now and will continue to do so over time—this is necessary to protect children from long-term negative impacts of the pandemic.
Learn more about the impact of COVID-19 on childhood obesity at stateofchildhoodobesity.org.
Impact of the COVID-19 Pandemic on Childhood Obesity
Dr. Punam Ohri-VachaspatiDr. Punam Ohri-VachaspatiProfessor of Nutrition at the College of Health
Solutions at Arizona State University
“Finding ways to support the health of children year-round—whether during a pandemic or
not—must be a priority for our nation.”
Dr. Lindsey TurnerDr. Lindsey TurnerDirector of Initiative for Healthy Schools at
Boise State University

Featured Story
STATE of CHILDHOOD OBESITY 15
Our People Will Walk With Good Health
The “Bountiful Backpacks” program started at the St. Francis Indian School on the Rosebud Indian Reservation in South Dakota in 2014, and since then, it has taken root in other communities as a smart, scalable approach for combating child poverty, hunger, and malnutrition. The program is funded in part through SNAP-Ed.
Karla Trautman, director of extension at South Dakota State University, explains that students learned how to cook healthy recipes in their classrooms on a Friday, and then were equipped with the ingredients and newfound skills to role model to their parents, siblings and grandparents over the weekend.
For many kids, their excitement could not be contained—“What’s the secret ingredient today?” “What new twist are we putting on the recipe?”
It took years to get the recipes just right and ground cultural teaching in the nutrition lessons—and the effects were wide-reaching. Bountiful Backpacks boosted food security by ensuring kids and families had enough to eat. Beyond this, it transformed diets by increasing fruit and vegetable consumption,
providing nutrition and cooking education, and improving not only the health of the students, but their immediate and extended families.
Parents proudly posted photos of their kids preparing meals on Facebook—their kids were willing to try new foods and enjoyed healthy cooking. Grandmas raising their grandkids said their diabetes symptoms improved because of the program.
At the Yankton Sioux Tribe, 79 percent of students participating reported improving their diet; more than a third said they choose healthier snacks and eat vegetables and fruit more often.
In fact, this modest program that was launched eight years ago has now reached more than 1,000 families participating in Federally Recognized Tribal Education Programs across South Dakota. And nationally, through its Well Connected Communities initiative, the Cooperative Extension Service continues to support innovations like these.
Find the full version of this story at stateofchildhoodobesity.org.
$1.28average cost per meal provided
~70%of SNAP participants in South
Dakota are in families with children
95%of students at the St. Francis
Indian School qualify for free or reduced-price lunch
“Unki-ye Wo-i-ha-bde Kin Ogna Oyate Zani
Mani Pi Kte”—as translated, “Our vision:
Our people will walk with good health.”
—Robert Flying Hawk, Yankton
Sioux Tribal Chairman

Expert Perspective
16 STATE of CHILDHOOD OBESITY
Consuming sugary drinks poses potential health risks to kids because of its connection with excess weight gain, tooth decay, and preventable diseases, including obesity.17,18
For years, beverage companies have been marketing in schools, hiring athletes and music stars, and advertising in traditional and digital media to promote sugary drinks to kids. Black and Latinx children have been disproportionately targeted. These efforts are strikingly similar to tactics used by tobacco companies to get young people hooked on their products.
While their practices may seem benevolent—funding playgrounds in communities of color or sponsoring Black and Latinx celebrities and sports figures—they are targeted, strategic advertising techniques aimed at specific populations consistently and at an early age.
Food and beverage companies have engaged in many activities central to the tobacco industry’s playbook. Funding research that favors their products. Funding lobbying efforts to support industry-friendly policies—and prevent measures they oppose. Securing contracts to prominently
place marketing and products where kids frequent, including in schools and at sports fields.
Fortunately, public health advocates have made great strides in exposing and countering beverage company (and tobacco) marketing tactics—from implementing labeling laws and sugary drink taxes to raising awareness about how consumption of these products is related to negative health outcomes and how much marketing is directed at kids of color.
But there’s much more to be done. We need to empower communities, and hold companies and public officials accountable. It’s more important than ever for community leaders, advocates, and partners to come together and find bold, new ways to prevent harmful marketing tactics that put kids’ health and future at risk.
Learn more about the impact of sugary drinks on kids’ health at stateofchildhoodobesity.org.
Sugary Drinks and Tobacco:Different Industries, Same Playbook
Kelly Brownell, PhDKelly Brownell, PhDDirector of the World Food Policy Center,
Professor of Public Policy, and Former Dean
of the Sanford School of Public Policy at
Duke University
Matthew L. MyersMatthew L. MyersPresident of the Campaign for Tobacco-
Free Kids
“We need to be thinking not only of legislative, regulatory, and legal approaches, but of ways to mobilize public opinion to defend the health and
well-being of our children.”
$1 billion in ads spent by beverage companies in 2018, disproportionately targeting Black and Hispanic youth19

Exploring the Evidence
PROTECTING KIDS FROM HARMFUL FOOD AND BEVERAGE MARKETING IN THE DIGITAL ENVIRONMENTFood and beverage companies leverage the pandemic as an opportunity to target children online with ads for their unhealthy products
An analysis released in 2021 finds that increasing collaboration between the food and tech industries has resulted in a digital environment that is harming children’s health and furthering health inequities.20
From social influencers and online gaming to streaming video and using AI to follow customers, industry giants have invested heavily in major tech platforms, including Facebook, Google, and Amazon, to understand and track how young people behave online during the pandemic. Leading food and beverage companies gather data from mobile apps, YouTube channels, websites, video games, and more to create personalized, targeted ads.
And they emphasize data collection and marketing in communities of color, capitalizing on Black and Brown youth as digital trendsetters. These actions are especially concerning as Black and Latinx youth experience higher rates of obesity and have suffered disproportionately during the pandemic.21
Other governments, including in the United Kingdom, Europe, Canada, and Latin America, have limited or banned unhealthy food marketing to kids, while the United States offers only minimal protections for the youngest children and relies on an outdated self-regulatory model.
Experts are calling for policy changes and corporate responsibility initiatives to build a healthier digital environment for youth, including limits on the collection and use of data, elimination of digital racial discrimination, and uniform, global, science-based nutritional criteria.
Find the full report, Big Food, Big Tech, and the Global Childhood Obesity Pandemic, at democraticmedia.org.

19
Recommendations & Policies
Childhood obesity is driven by systemic, interconnected factors, so policy solutions must be broad and systems-based too. Some solutions will naturally focus on improving access to healthy, affordable food for all children and families. Others must go beyond those immediate factors, strengthening supports so that parents and caregivers have the resources they need to help all children grow up healthy.
20 STATE of CHILDHOOD OBESITY
Reccomendations & Policies
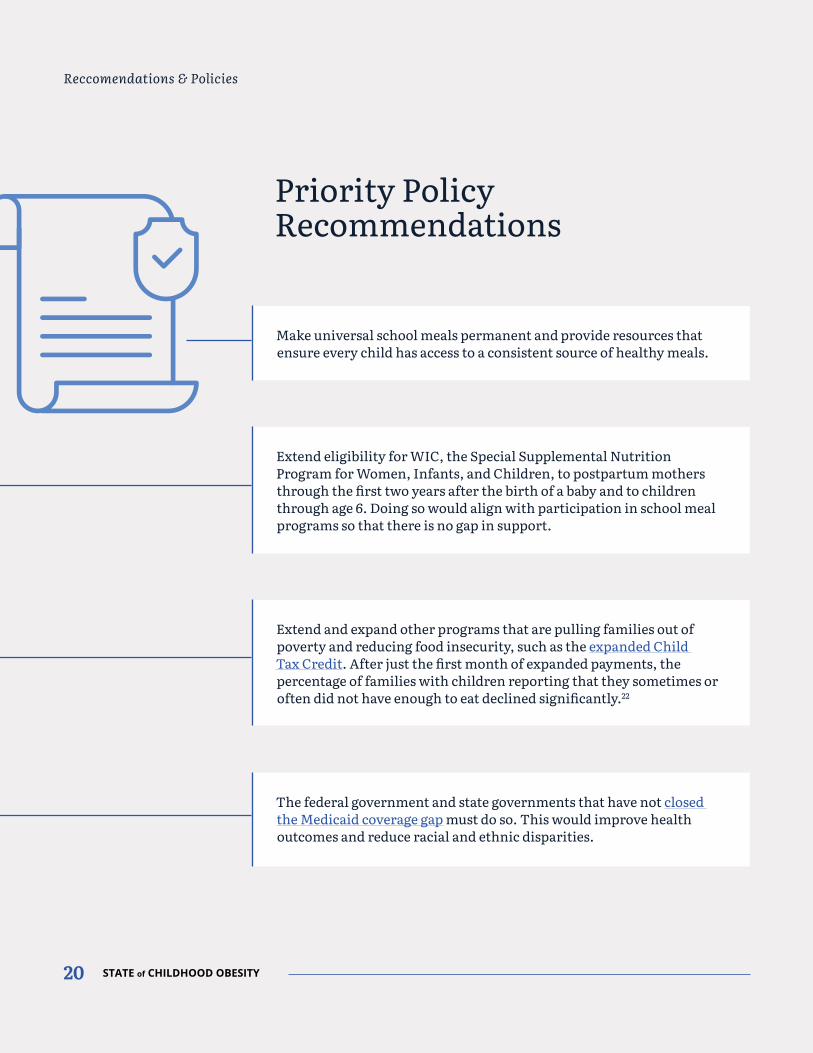
Make universal school meals permanent and provide resources that ensure every child has access to a consistent source of healthy meals.
Extend eligibility for WIC, the Special Supplemental Nutrition Program for Women, Infants, and Children, to postpartum mothers through the first two years after the birth of a baby and to children through age 6. Doing so would align with participation in school meal programs so that there is no gap in support.
Extend and expand other programs that are pulling families out of poverty and reducing food insecurity, such as the expanded Child Tax Credit. After just the first month of expanded payments, the percentage of families with children reporting that they sometimes or often did not have enough to eat declined significantly.22
The federal government and state governments that have not closed the Medicaid coverage gap must do so. This would improve health outcomes and reduce racial and ethnic disparities.
Priority Policy Recommendations
STATE of CHILDHOOD OBESITY 21
Reccomendations & Policies
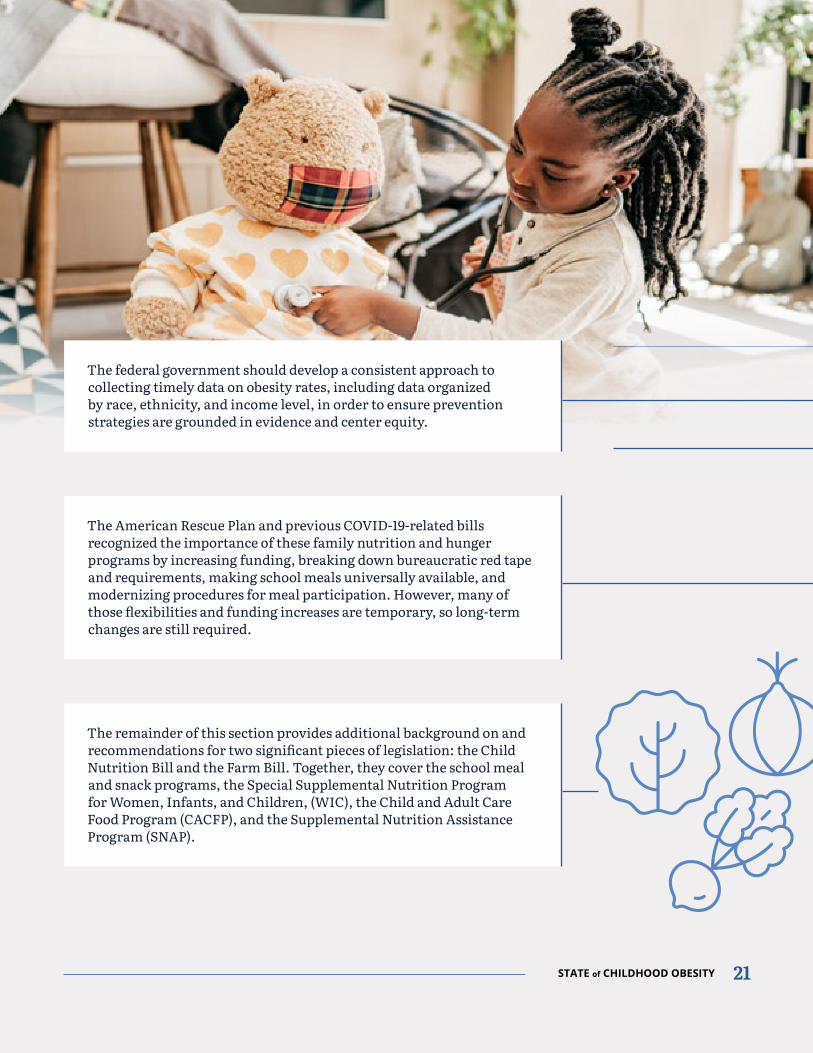
The federal government should develop a consistent approach to collecting timely data on obesity rates, including data organized by race, ethnicity, and income level, in order to ensure prevention strategies are grounded in evidence and center equity.
The American Rescue Plan and previous COVID-19-related bills recognized the importance of these family nutrition and hunger programs by increasing funding, breaking down bureaucratic red tape and requirements, making school meals universally available, and modernizing procedures for meal participation. However, many of those flexibilities and funding increases are temporary, so long-term changes are still required.
The remainder of this section provides additional background on and recommendations for two significant pieces of legislation: the Child Nutrition Bill and the Farm Bill. Together, they cover the school meal and snack programs, the Special Supplemental Nutrition Program for Women, Infants, and Children, (WIC), the Child and Adult Care Food Program (CACFP), and the Supplemental Nutrition Assistance Program (SNAP).

22 STATE of CHILDHOOD OBESITY
Reccomendations & Policies
Child Nutrition Reauthorization
The most recent reauthorization of child nutrition programs was over 10 years ago, when the Healthy, Hunger-Free Kids Act of 2010 (HHFKA) was signed into law. This landmark legislation made significant investments to update the nutrition standards for school meals and snacks, bringing them more in line with then-current dietary standards. That legislation also expanded afterschool meal programs and created the Community Eligibility Provision, which allows schools in areas furthest from economic opportunity to provide free meals to all students.


24 STATE of CHILDHOOD OBESITY
OverviewOverview
School meals are essential to tens of millions of children, especially those from families with lower incomes.23 These programs provide critical nutrients that children need to grow up healthy,24 lift families out of poverty,25 and alleviate food insecurity,26 which occurs when families have limited or uncertain access to adequate food.
COVID-19 ResponseCOVID-19 Response
As the COVID-19 pandemic forced nationwide school closures, and hunger and food insecurity spiked, relief measures passed by Congress in March 2020 enabled the United States Department of Agriculture (USDA) to issue nationwide waivers permitting schools to serve meals to all students free of charge (also known as universal school meals). These waivers have since been extended through June 2022.27
These waivers enable schools to serve meals to all students, but also mean that those meals follow the less-stringent nutrition standards of the Summer Food Service Program.
In addition to the extension, schools are receiving increased reimbursement rates for meals served that meet current nutrition standards, which will help them recover from major food service revenue losses that occurred in districts nationwide due to pandemic-related school closures. Finally, the Pandemic Electronic Benefit Transfer (P-EBT) provided students with temporary nutrition benefits if they could not receive school meals because of school closures.
School Meals

STATE of CHILDHOOD OBESITY 25
Reccomendations & Policies
School Meals by the Numbers
students participate in the National School Lunch Program
30M
↑44%breakfast
~15M
↑41%lunch
students participate in the School Breakfast Program
increase in the nutritional quality of school meals since implementation of the Healthy Hunger-Free Kids Act
of meals served by schools were free or reduced-price
75%

26 STATE of CHILDHOOD OBESITY
Reccomendations & Policies
Proven BenefitsProven Benefits
Decades of research demonstrate that school meals:
Reach kids who need them most. School breakfast reduces food insecurity28 among elementary school children and participating in the school lunch program can reduce the risk of food insufficiency29 among participating households by 14 percent.
Alleviate poverty. In 2019 alone, the school lunch program lifted 1.2 million people out of poverty.30
Support healthy eating. Students who participate in school meals programs are more likely to consume fruits, vegetables, and milk at breakfast and lunch.31
Protect against obesity. Nutritious school meals help reduce risk of obesity, which is higher32 among children of color and children from families with low incomes.33
Improve kids’ learning and school attendance. Chronically hungry students are more likely to be absent, struggle to pay attention during class, have behavioral problems, or need mental health counseling.34

STATE of CHILDHOOD OBESITY 27
Reccomendations & Policies
Policy RecommendationsPolicy Recommendations
^ Make universal school meals permanent and provide resources that ensure every child has access to free school meals.
^ USDA should strengthen nutrition standards for school meals to align with the current Dietary Guidelines for Americans, particularly for added sugars.
^ USDA should withdraw a rule proposed in January 2020 that would weaken school nutrition standards and adversely affect student health and academic performance.
^ USDA should increase the reimbursement rate schools receive for each meal served that meets current nutrition standards.
^ Congress should increase funding to support schools’ efforts to offer healthy meals, including resources for new school kitchen equipment, and training and technical assistance for school food service staff.
^ States should work to make universal school meals permanent and implement nutrition standards that go beyond the federal standards.
^ States and local districts should make safe, appealing drinking water free and available to all students by ensuring that every school has at least one water bottle filling station in a high-traffic area that is accessible throughout the day, with filtration if needed.
^ Local, state, and federal governments should work together to ensure safe drinking and cooking water in all schools, including by requiring and funding testing and remediation for lead in school cafeteria and kitchen tap water, and requesting that USDA report to Congress on specific checkpoints USDA has added to on-site administrative review to ensure that there is effective oversight of drinking water safety and access.

28 STATE of CHILDHOOD OBESITY
Exploring the Evidence
BENEFITS OF HEALTHY SCHOOL MEALS FOR ALLIn response to the COVID-19 pandemic, all schools participating in our nation’s school meals programs may serve free meals to every student for the 2021-22 school year, regardless of their family’s income.
Research shows that offering healthy, free school meals for all students is a sound and vital investment that benefits kids, especially those living furthest from economic opportunity.
Providing healthy school meals for all students:82
Increases the number of children participating in school meals programs in nearly all cases.
Improves kids’ diet quality in the majority of circumstances, especially when schools have strong nutrition standards in place for fruits, vegetables, or whole grains.
Reduces levels of food insecurity among children from families with lower incomes.
Can have positive impacts on children’s academic achievement and school attendance.
Does not increase children’s body mass index.
Helps schools financially, especially schools with a high percentage of students from households with low incomes.
Find the full review of 47 studies at mdpi.com/journal/nutrients.

Featured Story
STATE of CHILDHOOD OBESITY 29
Nearly a quarter of Baltimore’s young residents experience food insecurity. That’s why, since the pandemic started, Elizabeth Marchetta, executive director of food and nutrition services, and her team at Baltimore City Public Schools (BCPS) in Baltimore, Maryland, have made it their mission to ensure local families have a regular source of healthy meals.
Since July 1, 2020, BCPS has served more than 4.5 million grab-and-go meals at their 80 sites around Baltimore. That’s more than 30,000 meals every day.
Doing so has required constant innovation to adapt to changing COVID rules and varying family needs. One way they’ve done so is to run a food truck program with trucks that are designed and run by local teens. These food trucks serve a dual purpose: delivering meals to families in need and involving older youth, who can sometimes be harder to reach.
It also means delivering more than 5,000 “ag-tivity” and “plant-a-seed” kits to homes, to teach kids about gardening and fresh produce, while
engaging many students who were chronically absent during the 2020-21 school year because of COVID-19.
BCPS even offers “FaceTime with a Farmer,” live virtual field trips to more than 3,700 students from 63 area schools, providing lessons from home that connect the dots between agriculture and healthy foods to science, math, social studies, and English Language Arts.
With funding from the city, BCPS has also served more than 75,000 pre-packed 20-pound produce boxes to families from more than 25 distribution sites. And last summer, thanks to a partnership with World Central Kitchen, they served another 10,000 boxes with recipe ideas to local families.
BCPS staff take their commitment seriously to ensure students are fed under any circumstances and Elizabeth says she knows from conversations with families that they’re making a real difference.
Learn more about the importance of school meals at stateofchildhoodobesity.org.
How Baltimore Public Schools Are Innovating to Stop Hunger
Since July 1, 2020, BCPS has served more than 4.5 million grab-and-go meals at their 80
sites around Baltimore. That’s more than 30,000
meals every day.

Expert Perspective
30 STATE of CHILDHOOD OBESITY
Obesity, hunger, and climate change are inextricably connected.
These three pandemics represent the “Global Syndemic” and much of what drives them is the same. For example, our food systems, or how we grow, transport, sell, consume, and dispose of food, are fueling the Global Syndemic.
That’s because they’re unhealthy—designed to support a diet high in ultra-processed foods, sugary beverages, and red meat, which promotes diseases, including obesity. And they’re unsustainable—how we produce food, especially foods from animals, drives greenhouse gas emissions that harm the environment and contribute to conditions such as extreme weather and drought, which impact crops and the food supply.35
While the Global Syndemic affects all of us, people of color and children and families living in poverty and experiencing food insecurity are particularly impacted.36 We can—and must—address these global challenges together.
One of the best things people can do is shift to a diet with more fresh, minimally processed, and plant-based foods. That’s better for us and the planet.
Aligning school meals with a planet-friendly diet has great potential. In the United States alone, school meals reach up to 30 million kids, including a high percentage who are from families with low incomes.37 If we do a better job of offering and marketing appealing, healthy plant-based meals in schools, kids will eat them.
We also need our governments to reconsider their dietary guidelines. Other countries—such as Brazil, Canada, Denmark, France, Germany, Norway, and Qatar—have incorporated environmental sustainability principles into their guidelines. That hasn’t happened in the United States.
These ideas are just a start. We must apply the science and collaborate across borders to create bold new solutions that prioritize children’s health and reverse the impacts of climate change.
Learn more about the Global Syndemic at stateofchildhoodobesity.org.
Bold Solutions for Healthier Kids and a Healthier Planet
“Children have the right to grow up in a healthy environment. It’s our responsibility as adults and leaders
to protect their health and our planet now—and for generations to come.”
Dr. Vivica KraakDr. Vivica KraakAssociate Professor in the Department
of Human Nutrition, Foods, and Exercise,
Virginia Tech
34%of greenhouse gas emissions are
driven by the world’s food systems83

STATE of CHILDHOOD OBESITY 31
Reccomendations & PoliciesExploring the Evidence
PUTTING PLANT-FORWARD MEALS ON THE MENU IN CALIFORNIA SCHOOLS
Research shows that a diet rich in plant-based foods, such as whole grains, fruits, vegetables, nuts, and legumes, can provide important benefits, not just for our health, but for our planet.38 And in California, where nearly 4 million students participate in the school lunch program, schools are innovating to provide more nutritious and climate-friendly meals.
Some California school districts have started reducing the carbon footprint of their food by serving healthy plant-based entrees, which often run out quickly because they are so popular.39
In addition, districts offer support for staff training, student engagement, and recipe development. In some places, efforts are also underway to provide farm-to-school whole grains for pasta, tortillas, and bread.
If every district in the state followed suit with more plant-focused meals, even doing as little as replacing a beef burger with a black bean burger once a month, carbon emissions would be reduced by nearly 222 million pounds—equivalent to taking 22,000 cars off the road each year.
This is an approach backed by research. Experts find that aligning our national nutrition standards for school meals with the EAT-Lancet Commission’s planetary health diet would provide high-quality nutrition for kids, reduce food costs, and benefit the environment.40 According to an analysis of more than 5,000 lunches served during 2014-2015, school meals exceeded EAT-Lancet targets for dairy, red meat, refined grains, starchy vegetables, and fruit—and lacked sufficient whole grains, legumes, vegetables, and nuts.
Average amount in grams prepared for lunch in U.S. elementary, middle, and high schools
298.9g 19.1g 15.6g 41.3g 2.8g68.9g 3.9g 8.0g 113.2g 18.6g
DAIRY BEEF, LAMB, AND PORK
CHICKEN AND OTHER POULTRY
WHOLE GRAINS LEGUMES
National School Lunch ProgramEAT-Lancet (planetary health diet)
Find the full study at healthaffairs.org.

32 STATE of CHILDHOOD OBESITY
OverviewOverview
The Special Supplemental Nutrition Program for Women, Infants, and Children (WIC) is one of the nation’s largest federal nutrition programs, serving millions of people41 each month, including nearly half of all infants42 born in the United States. Specifically, WIC supports expectant and new mothers, babies and children up to the age of 5 who have specific nutrition risks, such as anemia, poor diet, or other medical or dietary-based health conditions, and who are from families with low incomes.
The targeted, time-limited services offered through WIC are designed to influence lifelong nutrition and healthy behaviors. For example, the program helps participants purchase healthy food,43 at grocery stores, farmers’ markets, convenience stores, and other locations, with an electronic benefit transfer (EBT) or e-WIC card. It also provides nutrition services, health screenings, breastfeeding support, and referrals for health care and social services.
COVID-19 ResponseCOVID-19 Response
Emergency relief bills approved by Congress allocated nearly $1 billion to WIC to boost access to nutritious foods among women and children, while enabling them to avoid in-person clinic visits that might have increased their exposure to COVID-19. Federal relief laws have increased flexibility by allowing newly eligible mothers to enroll virtually,44 permitting food package substitutions45 when WIC-approved versions are not available, and enabling more widespread use of telehealth technology to deliver nutrition education and breastfeeding supports. The American Rescue Plan Act provided funding to states to temporarily boost the monthly fruit and vegetable benefit up to $35 per child and adult per month. The legislation allocates an additional $390 million until September 30, 2024, to modernize WIC and promote the program.
Women, Infants, and Children Program
STATE of CHILDHOOD OBESITY 33
Reccomendations & Policies
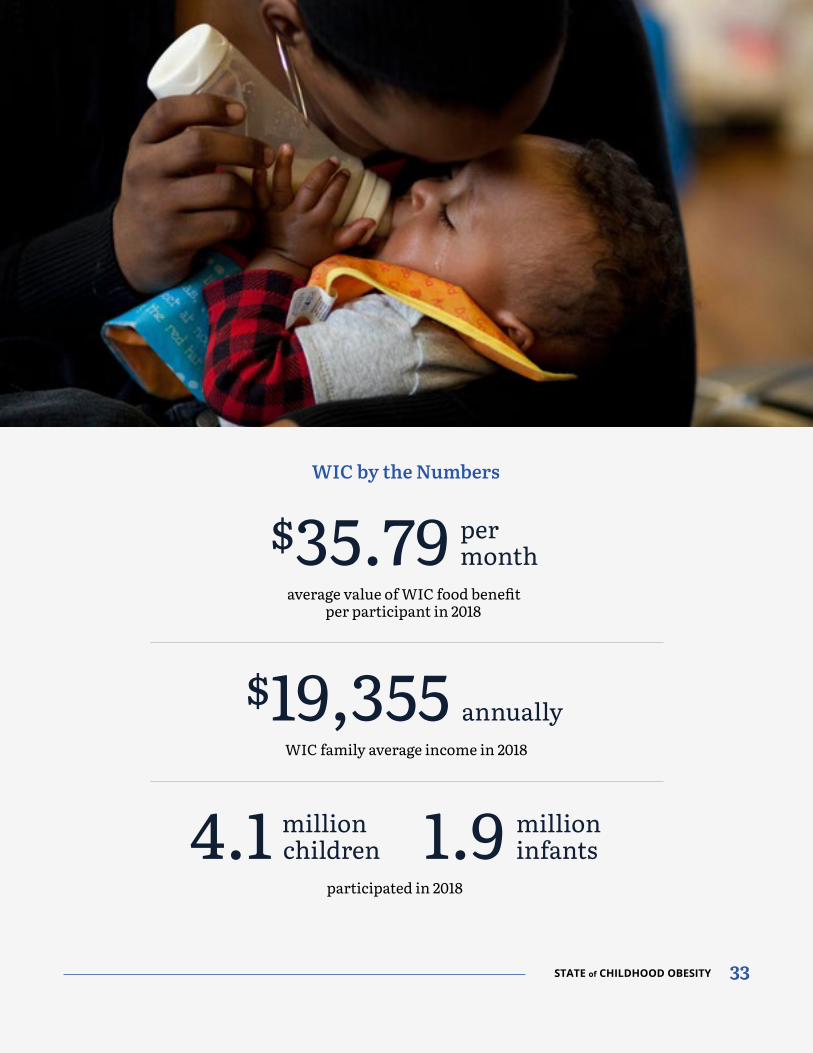
WIC by the Numbers
WIC family average income in 2018
$19,355 annually
average value of WIC food benefit per participant in 2018
$35.79 permonth
participated in 2018
4.1 1.9millionchildren
millioninfants

34 STATE of CHILDHOOD OBESITY
Reccomendations & Policies
Proven BenefitsProven Benefits
A growing body of evidence shows that WIC:
Encourages healthier choices and improves nutrition. Children who have participated in WIC for their first 24 months of life score higher on the Healthy Eating Index,46 a measure of diet quality used to assess how well a set of foods aligns with key recommendations of the Dietary Guidelines for Americans.
Improves pregnancy outcomes and the health of newborns. Participating in WIC reduces the risk47 of preterm birth, low birthweight, and is even linked with a 33 percent reduction in the risk of infant death within one year of birth.48
Is associated with a lower risk of childhood obesity. The obesity rate among children ages 2 to 4 who participate in WIC declined from 15.9 percent in 2010 to 14.4 percent in 2018.49 The decline was statistically significant among all racial and ethnic groups studied: American Indian, Alaska Native, Asian/Pacific Islander, Black, Hispanic, and White.
Improves children’s health outcomes. Participation is associated with a higher likelihood50 of families showing up at well-child visits, higher rates of childhood immunization,51 and higher rates of accessing dental care.52
Reduces food insecurity. Participation reduces the prevalence of child food insecurity by at least 20 percent.53

36 STATE of CHILDHOOD OBESITY
Reccomendations & Policies
Policy RecommendationsPolicy Recommendations
The Robert Wood Johnson Foundation recommends these evidence-based actions to strengthen and modernize the WIC program. The Foundation believes such actions will help to ensure better support for young children, who are at risk of hunger and malnutrition, and will help families recover from the impacts of the COVID-19 pandemic.
^ Extend WIC eligibility to postpartum mothers through the first two years after the birth of a baby, to children through age 6, to align with participation in school meal programs so there is no gap in supports. Policymakers should also enable infants and children to participate for two years before having to reapply. Currently an eligible individual can receive benefits for six months to one year before they need to reapply.
^ Ensure that the current waivers that enable families to access WIC services during the pandemic remain in place for as long as needed. These include allowing certification via phone or drive-thru clinics, extending certification periods so children and families receive benefits for longer periods of time, expanding the allowable food items for WIC shoppers, and continuing telehealth models.
^ Ensure that all women who qualify for WIC based on income and nutritional risk are able to participate, regardless of citizenship and immigration status.

STATE of CHILDHOOD OBESITY 37
Reccomendations & Policies
Policymakers should work to advance racial equity in WIC participation, including:
^ Making approved foods within the WIC packages more culturally relevant.
^ Providing targeted support based on health disparities.
^ Establishing a process for equitable beneficiary participation in program design, implementation, and evaluation.
^ Providing breastfeeding support that is inclusive and relevant for people of color who participate in WIC.
^ Ensuring WIC outreach materials are available in multiple languages.
^ Recruiting service providers who speak participants’ native languages.
^ Increasing accountability, cultural humility, and cultural sensitivity of frontline staff to promote racial equity.
^ Strengthening the collection and disaggregation of WIC participation data.
^ Support and fund efforts to streamline and modernize WIC services through technology, including advancing the congressional mandate for
all states to implement WIC Electronic Benefit Transfer (EBT) and expanding online purchasing options for the food package.
^ As USDA updates the WIC food package (required by Congress to do so every 10 years), USDA should ensure that the process is grounded in the latest, most sound nutritional science, such as the updated Dietary Guidelines for Americans.
^ Increase the Cash Value Benefit that allows for the purchase of fruits and vegetables. The WIC program currently provides a monthly cash value benefit of $9 for children ages 5 and under and $11 for women to redeem for fruits and vegetables.

38 STATE of CHILDHOOD OBESITY
Reccomendations & Policies
Prior to the pandemic, researchers at the University of Tennessee partnered with the Food City regional grocery store chain to make
it easier for WIC customers to shop for WIC products online. They used a three-step Click & Collect model.
WIC customers placed an online order using the grocery
store’s website. Customers then chose the option to “pay at pickup” for their groceries.
Store sta prepared the order and saved the transaction.
When the WIC customers arrived at the store, they used their
WIC benefits to pay.
Store sta then loaded groceries in the WIC customers’ cars and they were ready to go!
Reducing Barriers for WIC Participants
While WIC provides much-needed food and support to families, participants report significant challenges to WIC shopping and redeeming benefits, including stigma and shame in the checkout lane, difficulty finding and identifying WIC-approved items in the store, and lack of cashier training. The pandemic exacerbated these challenges and introduced new ones: limited stock, reduced store hours, and social distancing guidelines.
Prior to the pandemic, the University of Tennessee partnered with the Food City regional grocery store chain to make it easier for WIC customers to shop for WIC products online. They tested a promising low-cost model that could be a sustainable, scalable innovation for WIC vendors beyond the pandemic.
This infographic was funded by Healthy Eating Research, a national program of the Robert Wood Johnson Foundation. The Click & Collect pilot study was funded by No Kid Hungry. Find the full brief at healthyeatingresearch.org.

Featured Story
STATE of CHILDHOOD OBESITY 39
During the early days of the COVID-19 pandemic, Bo-Yee Poon and her children returned home to Vermont, after years spent studying Tai Chi in China. What she thought would be a short stay before returning to her studies turned into a much longer one as all flights back to China were grounded indefinitely.
With a home but no immediate job prospects in Vermont, Bo-Yee managed to access insurance through Vermont Health Connect, which fortunately made her and her family eligible for WIC.
Since it began in 1974, the WIC program has helped millions of families eat healthier foods on a lower budget, providing a sense of relief during difficult times. The pandemic has underscored how vital the program was and continues to be.
The unprecedented rise in unemployment and hunger, along with increases in food prices and
shortages of staple grocery items, such as milk, formula, eggs, bread, and beans, have a profound impact on pregnant and postpartum women, infants, and young children, all of whom have unique nutritional needs. WIC enrollment has grown significantly during the pandemic and experts expect this trend to continue for years.
WIC turned out to be just what Bo-Yee and her children needed. It provided access to healthy groceries and tips on how to feed her children vegetables and fruit.
But more importantly, it helped alleviate her stress and anxiety around providing nutritious food for her family. She knew that even though she couldn’t work or afford child care, her family would be taken care of.
Find the full version of this story at stateofchildhoodobesity.org.
WIC Gives Families a Sense of Relief Amid the Pandemic
“[WIC] has been really helpful for alleviating the stress and anxiety
of: Am I going to be able to provide proper
healthy food for my kids?”
Bo-Yee Poon

40 STATE of CHILDHOOD OBESITY
The Child and Adult Care Food Program (CACFP) provides federal funding to states to reimburse providers for the cost of providing nutritious meals and snacks to children and adults in their care. More than 4.3 million children and 130,000 adults participate each year,54 and providers (i.e., early care and education providers and out-of-school time providers) must serve meals that meet minimum nutrition standards to receive reimbursement. Many of the waivers and flexibilities USDA has issued in response to COVID-19 apply to CACFP as well.
Research shows that participating in CACFP moderately increases consumption of milk and vegetables among children and may reduce the prevalence of overweight.55 Updated nutrition standards for CACFP took effect in 2017, the first major changes in nearly 50 years. These standards require more whole grains, a wider variety of fruits and vegetables, fewer added sugars, and less saturated fat. Early research on the impact of that change shows that participating centers are serving healthier foods, including fewer sugary drinks and more whole grains.56 One study conducted in early care and education centers in Native American communities found that fiber consumption increased and sugar consumption decreased following implementation of the updated standards.57
The Pandemic-EBT program, in addition to covering meals missed due to school closures, provides benefits to children in families who participate in SNAP whose covered child-care center may be closed due to the pandemic. Another provision, the Community Eligibility Provision, enables schools and child-care centers to provide free meals to all students in areas where a certain percentage of children who come from families furthest from economic opportunity. Both changes should help ensure more children have access to healthy foods in child-care settings through CACFP.
Child and Adult Care Food Program
Policy RecommendationsPolicy Recommendations
^ USDA should expand CACFP to allow the option of a third meal service, and Congress should appropriate additional funding if required.
^ USDA should continue streamlining CACFP program operations and paperwork to allow for easier enrollment for providers to serve as sponsors of the program.
^ USDA should ensure that CACFP can fund nutrition and wellness education and program efforts.


42 STATE of CHILDHOOD OBESITY
Reccomendations & Policies
Farm Bill
The Farm Bill guides the nation’s overall agricultural policy and is reauthorized by Congress roughly every five years. The last Farm Bill was passed in 2018 and reauthorization discussions will likely begin in 2022. SNAP is by far the largest single component of the Farm Bill, accounting for more than 75 percent of the Farm Bill’s total authorized funding.

STATE of CHILDHOOD OBESITY 43
OverviewOverview
More than 42 million people in the United States participate in SNAP, which has seen a significant spike in participation during the pandemic.58 Unlike other programs such as school meals and WIC, SNAP does not have nutrition standards for purchases made with program benefits. Aside from a relatively small list of prohibited items such as hot foods or alcohol,59 participants may purchase any foods or beverages with their benefits. The Supplemental Nutrition Assistance Program-Education (SNAP-Ed) is a nutrition education component of the program through which USDA provides grants to states to encourage participants to make healthy purchases with their benefits.60
Most people who receive benefits only do so temporarily, such as when they are between jobs or suffering some other economic hardship. Two-thirds of SNAP participants are children, older adults, and people with disabilities.61 Approximately 36 percent of participants are White, 25 percent are Black, and 25 percent are Asian, Hispanic, or Native American.62 As of 2019, about 92 percent of SNAP benefits went to households with incomes at or below the poverty line, and 55 percent went to households at or below half of the poverty line (about $10,390 per year for a family of three in 2019).63 In 2018 alone, SNAP lifted more than 3 million people out of poverty by making it easier for them to access affordable food.
Ensuring that SNAP benefits are adequate, and that participants are able to make healthy choices with their benefits, is essential to supporting health equity. The Healthy Incentives Pilot (HIP), also created in 2008, provided SNAP participants with 30 cents back for every dollar in SNAP benefits spent on select fruits and vegetables.64 The HIP was intentionally short-term—it ended in 2012—and was designed to test the efficacy of nutrition incentive programs. The Food Insecurity and Nutrition Incentive (FINI), created in 2014, encourages participants to purchase the most nutritious foods, such as fresh fruits and vegetables, with financial incentives. The program was authorized permanently as the Gus Schumacher Nutrition Incentive Program (GusNIP) in 2018.65
SNAP
44 STATE of CHILDHOOD OBESITY
Reccomendations & Policies
COVID-19 Response and Other Recent ChangesCOVID-19 Response and Other Recent Changes
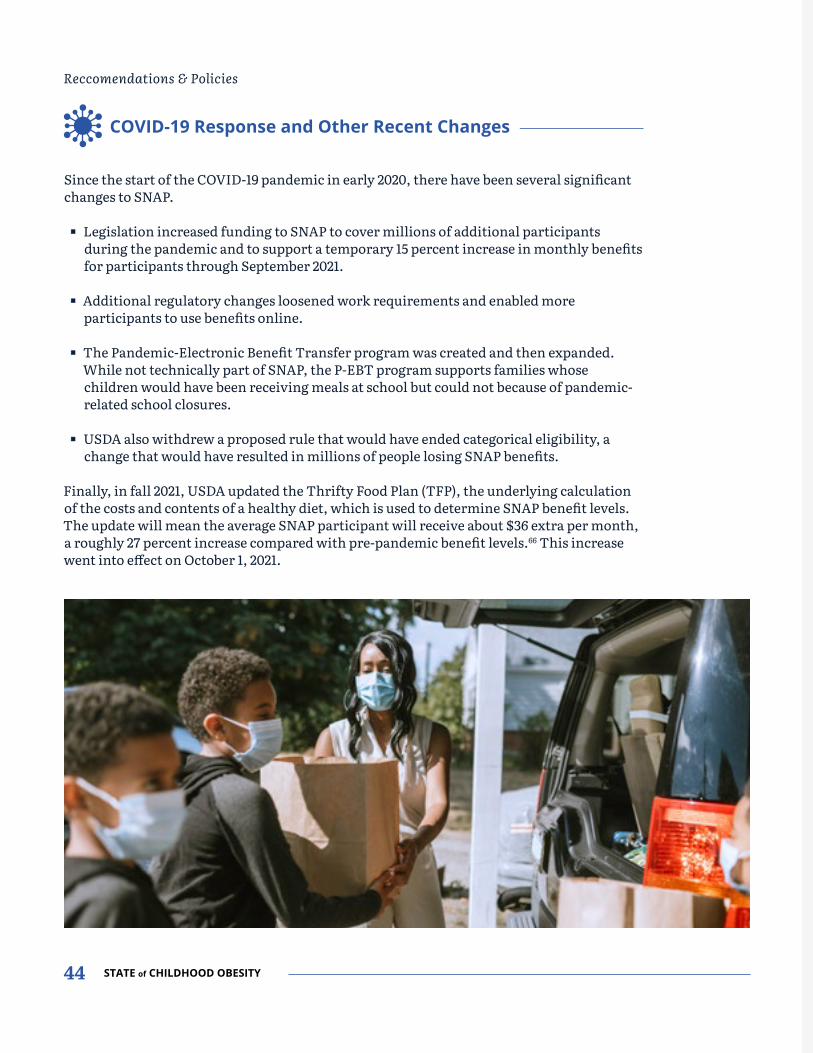
Since the start of the COVID-19 pandemic in early 2020, there have been several significant changes to SNAP.
Legislation increased funding to SNAP to cover millions of additional participants during the pandemic and to support a temporary 15 percent increase in monthly benefits for participants through September 2021.
Additional regulatory changes loosened work requirements and enabled more participants to use benefits online.
The Pandemic-Electronic Benefit Transfer program was created and then expanded. While not technically part of SNAP, the P-EBT program supports families whose children would have been receiving meals at school but could not because of pandemic-related school closures.
USDA also withdrew a proposed rule that would have ended categorical eligibility, a change that would have resulted in millions of people losing SNAP benefits.
Finally, in fall 2021, USDA updated the Thrifty Food Plan (TFP), the underlying calculation of the costs and contents of a healthy diet, which is used to determine SNAP benefit levels. The update will mean the average SNAP participant will receive about $36 extra per month, a roughly 27 percent increase compared with pre-pandemic benefit levels.66 This increase went into effect on October 1, 2021.

STATE of CHILDHOOD OBESITY 45
Reccomendations & Policies
SNAP by the Numbers
44%
3.1M
$1B → $1.54B
of all SNAP participants are children
people lifted out of poverty by SNAP in 2018 alone
Increasing SNAP benefits by $1B during an economic downturn would increase the GDP by $1.54B and support 13,000+ jobs
for the average SNAP participant in October 2021, reflecting both revisions to the Thrifty Food Plan and pandemic-related boost in benefits
monthlybenefit$251

46 STATE of CHILDHOOD OBESITY
Reccomendations & Policies
Proven BenefitsProven Benefits
Research shows SNAP:
Improves food security. The largest and most rigorous examination of the relationship between SNAP participation and food security, conducted by USDA, found that food insecurity among children fell by approximately 33 percent after their families received SNAP benefits for six months.67
Boosts children’s health and academic performance. Studies show that when children have access to SNAP, their risk of developing high blood pressure, heart disease, diabetes, and other poor health outcomes later in life decreases.68 Participants also improved their reading and math skills69 and have a greater chance of graduating from high school.70
Supports the economy. Increasing SNAP benefits by $1 billion during an economic downturn would increase the gross domestic product by $1.54 billion, support more than 13,000 jobs, and create $32 million in farm income.71
STATE of CHILDHOOD OBESITY 47
Reccomendations & Policies
Policy RecommendationsPolicy Recommendations
The Robert Wood Johnson Foundation urges these actions to prevent hunger and increases in poverty:
^ Streamline eligibility and enrollment processes and focus enrollment efforts on communities with low participation, including immigrants, people of color, and rural residents.
^ Broaden SNAP eligibility to cover more college students, unemployed adults without children, and lawfully residing immigrants.
^ Eliminate the lifetime ban on SNAP participation for convicted drug felons.
^ Continue authorization and funding for the Gus Schumacher Nutrition Incentive Program (GusNIP) beyond 2023, to provide incentives for healthier SNAP purchases.

48 STATE of CHILDHOOD OBESITY
Appendices
Descriptions of Obesity Rate Datasets
Defining Obesity Among Defining Obesity Among Children and TeensChildren and Teens
Body mass index (BMI) is a measure commonly used to determine overweight and obesity. BMI is calculated by dividing a child’s weight (in kilograms) by height (in square meters). According to the CDC, obesity is defined as a BMI that is at or above the 95th percentile for children and teens of the same age and sex. Overweight is defined as a BMI that is at or above the 85th percentile and below the 95th percentile for children and teens of the same age and sex. A child’s weight status is determined using an age- and sex-specific percentile for BMI, which is different from BMI categories used for adults. Because children’s body fat levels change over the course of childhood and vary between boys and girls, their BMI levels are expressed relative to other children of the same age and sex.
The National Survey of The National Survey of Children’s HealthChildren’s Health
The National Survey of Children’s Health (NSCH) collects health information for children ages 0 to 17 in the United States. Parents or caregivers are asked to report their child’s height and weight, which is used to calculate body mass index (BMI) for children ages 10 to 17 years. BMI-for-age percentiles are then used to identify children who have obesity (i.e., BMI at or above the 95th percentile).
An advantage of the NSCH is that it supports both national and state-by-state estimates, so obesity rates among states can be compared. A limitation is that the survey collects parents’ reports of their child’s height and weight, not direct measurement; parents may not always report accurate numbers, which impacts the assessment of obesity.72 In addition, parent-reported data are more
reliable for children ages 10 to 17 than for younger children, which is why the survey does not provide BMI calculations for children ages 0 to 9.
In recent years, the NSCH was significantly redesigned, and the 2016 survey was the first to reflect those changes. Due to changes in the survey’s mode of data collection and sampling frame, it is not possible to directly compare results from the 2016 NSCH or later years to earlier iterations. Since 2016, the NSCH has been conducted as an annual survey and will continue to collect new data each year going forward, so trends over time can be evaluated, with 2016 data serving as a new baseline.
In order to increase sample size and enable more reliable state-level estimates, after a large initial sample size in 2016, data are pooled for analyses across two collection years, in this case 2019 and 2020. The Health Resources and Services Administration’s Maternal and Child Health Bureau (HRSA MCHB) funds and directs the NSCH and develops survey content in collaboration with a national technical expert panel and the U.S. Census Bureau,73 which then conducts the survey on behalf of HRSA MCHB. The survey is conducted via web and mail, and data collection was not disrupted by the COVID-19 pandemic.74
WIC Participant and Program WIC Participant and Program CharacteristicsCharacteristics
About half of all infants born in the United States are served by the Special Supplemental Nutrition Program for Women, Infants, and Children (WIC).75 WIC provides qualifying women and children with healthy food, healthcare referrals, and nutrition education. Children are eligible for WIC up to their 5th birthday. WIC is administered by USDA. The WIC Participant and Program Characteristics (WICPPC) survey gathers data from all states on all participants.76 A strength of these data is that they are a census of all WIC participants and not just a sample of them. The data include height and weight measurements for children, which are collected by medical staff during certification visits, and then are used to calculate BMI and obesity rates among children ages 2 to 4. The data are gathered in April of even-numbered years, and analyzed by the CDC.

STATE of CHILDHOOD OBESITY 49
Appendices
Youth Risk Behavior Youth Risk Behavior Surveillance SystemSurveillance System
The Youth Risk Behavior Surveillance System (YRBSS) collects a wide range of health data on students in grades 9 through 12.77 The survey is conducted every two years by the CDC nationally and by state departments of health and education. It is usually conducted during the spring. Results are available for most states, though Minnesota, Oregon, Washington, and Wyoming do not participate and sometimes other states are not able to collect enough responses to adequately report results.78
The survey asks students to self-report their height and weight and uses those data to calculate BMI rates and the percentage of students who have obesity. A limit of self-reported data is that people tend to over-report their height and under-report their weight, meaning the obesity rates may be underestimates. Because of sampling methodology, it is not possible to compare national rates with specific state-level rates.
National Health and Nutrition National Health and Nutrition Examination SurveyExamination Survey
The National Health and Nutrition Examination Survey (NHANES) is conducted every two years by the National Center for Health Statistics within the Centers for Disease Control and Prevention. The survey has been conducted periodically since the 1970s and produces a wide range of health data for both children and adults.79 Children and youth ages 2 to 19 are included in the survey.
The survey includes direct measures of participants’ height and weight, making it the most accurate source of national obesity trends. However, it also has a relatively small sample size, which means it is important to look at data trends over time rather than on individual reporting periods. The most recent NHANES includes obesity rate data from 2017-18.
Behavioral Risk Factor Behavioral Risk Factor Surveillance SystemSurveillance System
The Behavioral Risk Factor Surveillance System (BRFSS) tracks adult obesity rates at the state level each year. The BRFSS is a health survey conducted via telephone, collecting health data from adults ages 18 and older from all 50 states, the District of Columbia, and participating U.S. territories.80 The survey is administered by the states and the Division of Population Health in the National Center for Chronic Disease Prevention and Health Promotion. The survey includes questions asking respondents for their height and weight; these data are not directly measured.81
The self-reported height and weight data are then used to calculate obesity rates for each state, territory, and Washington, D.C. A limit of self-reported data is that people tend to over-report their height and under-report their weight, meaning the obesity rates may be underestimates.

50 STATE of CHILDHOOD OBESITY
Appendices
STATE-BY-STATE OBESITY RATES
Youth Ages 10-17(NSCH, 2019-2020)
Students in Grades 9-12(YRBSS, 2019)
WIC Participants Ages 2-4(WICPCC, 2018)
Adults Ages 20+(BRFSS, 2020)
National 16.2% 15.5% 14.4% –
Alabama 21.8 17.2 16.2 39%
Alaska 17.8 14.8 20.2 31.9
Arizona 10.2 13.3 12.5 30.9
Arkansas 20.6 22.1 13.1 36.4
California 15.2 15.9 15.8 30.3
Colorado 11.2 10.3 8.6 24.2
Connecticut 15.3 14.4 14.5 29.2
Delaware 18.9 – 16.3 36.5
Washington, D.C. 14.2 – 12.8 24.3
Florida 15.8 14.0 13.3 28.4
Georgia 18 18.3 13.6 34.3
Hawaii 15.5 16.4 10.7 24.5
Idaho 13.3 12.1 12.0 31.1
Illinois 17.4 15.2 15.2 32.4
Indiana 15.6 - 13.5 36.8
Iowa 16.9 17.0 15.6 36.5
Kansas 11.7 15.1 13.7 35.3
Kentucky 23.8 18.4 16.3 36.6
Louisiana 22.2 16.5 13.0 38.1
Maine 13.7 14.9 14.6 31.0
Maryland 16.7 12.8 16.4 31.0
Massachusetts 12.2 14.2 16.3 24.4
Michigan 15.7 15.3 13.7 35.2
Minnesota 11.7 – 12.5 30.7
Mississippi 22.3 23.4 14.8 39.7
Missouri 19.6 18.4 13.0 34.0

STATE of CHILDHOOD OBESITY 51
Appendices
Youth Ages 10-17(NSCH, 2019-2020)
Students in Grades 9-12(YRBSS, 2019)
WIC Participants Ages 2-4(WICPCC, 2018)
Adults Ages 20+(BRFSS, 2020)
Montana 10 11.5 11.9 28.5
Nebraska 12.6 13.3 14.7 34.0
Nevada 16 12.3 11.7 28.7
New Hampshire 13.5 12.7 17.2 29.9
New Jersey 13.8 11.9 14.9 27.7
New Mexico 15.3 15.2 13.0 30.9
New York 11.5 13.4 14.0 26.3
North Carolina 19.8 15.4 15.0 33.6
North Dakota 10.5 14.0 15.4 33.1
Ohio 17.2 16.8 12.6 35.5
Oklahoma 18.7 17.6 13.8 36.4
Oregon 13.7 – 14.6 28.1
Pennsylvania 15.1 15.4 12.8 31.5
Rhode Island 16.7 14.3 17.1 30.1
South Carolina 20.1 16.6 12.7 36.2
South Dakota 15.2 14.1 16.0 33.2
Tennessee 20.8 20.9 15.2 35.6
Texas 20.3 16.9 15.9 35.8
Utah 10.3 9.8 8.5 28.6
Vermont 14.0 13.1 12.9 26.3
Virginia 14.9 14.8 15.8 32.2
Washington 13.2 – 13.8 28.0
West Virginia 21.9 22.9 16.5 39.1
Wisconsin 14.6 14.5 14.4 32.3
Wyoming 11 – 10.6 30.7
More information: stateofchildhoodobesity.org/children1017/
stateofchildhoodobesity.org/ high-school-obesity/
stateofchildhoodobesity.org/wic/
stateofchildhoodobesity.org/adult-obesity/

52 STATE of CHILDHOOD OBESITY
Appendices
References1 Lange, Samantha J, Lyudmyla Kompaniyets, David S Freedman,
et al. 2021. “Longitudinal Trends in Body Mass Index Before and During the COVID-19 Pandemic Among Persons Aged 2–19 Years — United States, 2018–2020.” MMWR Morbidity Mortality Weekly Report 70:1278–1283. doi:10.15585/mmwr.mm7037a3.
2 Jenssen, Brian P, Mary Kate Kelly, Maura Powell, et al. 2021. Pediatrics 147(5):e2021050123. Accessed September 15, 2021. doi:10.1542/peds.2021-050123.
3 Woolford, Susan J, Margo Sidell, Xia Li, et al. 2021. “Changes in Body Mass Index Among Children and Adolescents During the Covid-19 Pandemic.” JAMA. Accessed September 15, 2021. doi:10.1001/jama.2021.15036.
4 Maternal and Child Health Bureau of the Health Resources and Services Administration. 2020. “National Survey of Children’s Health (NSCH).” Accessed October 5. https://www.census.gov/programs-surveys/nsch/data/datasets.html
5 USDA Economic Research Service. 2021. “Key Statistics & Graphics.” Accessed September 20. https://www.ers.usda.gov/topics/food-nutrition-assistance/food-security-in-the-us/key-statistics-graphics.aspx
6 Trisi, Danilo and Matt Saenz. 2021. “Economic Security Programs Reduce Overall Poverty, Racial and Ethnic Inequities.” Accessed September 20. https://www.cbpp.org/research/poverty-and-inequality/economic-security-programs-reduce-overall-poverty-racial-and-ethnic
7 RWJF Issue Brief. 2021. “Improving Housing Affordability and Stability to Advance Health Equity.” Accessed September 20. https://www.rwjf.org/en/library/research/2021/01/federal-policy-recommendations-to-advance-health-equity-from-rwjf.html
8 Cunningham, Solveig, Michael Kramer, and Venkat Narayan. 2014. “Incidence of Childhood Obesity in the United States.” New England Journal of Medicine 370:403-411.
9 Wang, Li Yan, David Chyen, Sarah Lee, et al. 2008. “The Association Between Body Mass Index in Adolescence and Obesity in Adulthood.” Journal of Adolescent Health 42:512-518.
10 Centers for Disease Control and Prevention. 2021. “Childhood Obesity Causes & Consequences.” Accessed September 21, 2021. https://www.cdc.gov/obesity/childhood/causes.html
11 Maternal and Child Health Bureau of the Health Resources and Services Administration. 2020. “National Survey of Children’s Health (NSCH).” Accessed October 5. https://www.census.gov/programs-surveys/nsch/data/datasets.html
12 Lange, Samantha J, Lyudmyla Kompaniyets, David S Freedman, et al. 2021. “Longitudinal Trends in Body Mass Index Before and During the COVID-19 Pandemic Among Persons Aged 2–19 Years — United States, 2018–2020.” MMWR Morbidity Mortality Weekly Report 70:1278–1283. doi:10.15585/mmwr.mm7037a3.
13 Jenssen, Brian P, Mary Kate Kelly, Maura Powell, et al. 2021. Pediatrics 147(5):e2021050123. Accessed September 15. doi:10.1542/peds.2021-050123.
14 Woolford, Susan J, Margo Sidell, Xia Li, et al. 2021. “Changes in Body Mass Index Among Children and Adolescents During the Covid-19 Pandemic.” JAMA. Accessed September 15. doi:10.1001/jama.2021.15036.
15 Kenney, Erica L, Jessica L Barrett, Sara N Bleich, et al. 2020. “Impact Of The Healthy, Hunger-Free Kids Act On Obesity Trends.” Health Affairs 39(7). Accessed September 20, 2021. doi:10.1377/hlthaff.2020.00133.
16 Tanskey, Lindsay A, Jeanne Goldberg, Kenneth Chu, et al. 2018. “The State of the Summer: a Review of Child Summer Weight Gain and Efforts to Prevent It.” Current Obesity Reports 7(2):112-121. Accessed September 21, 2021. doi:10.1007/s13679-018-0305-z.
17 Muth, Natalie D, William H Dietz, Sheela N Magge, et al. 2019. “Public Policies to Reduce Sugary Drink Consumption in Children and Adolescents.” Pediatrics 143(4):e20190282. Accessed September 21, 2021. doi:10.1542/peds.2019-0282.
18 Bleich, Sara N and Kelsey A Vercammen. 2018. “The Negative Impact of Sugar-Sweetened Beverages on Children’s Health: An Update of the Literature.” BMC Obesity 5(6). Accessed September 21, 2021. doi:10.1186/s40608-017-0178-9.
STATE of CHILDHOOD OBESITY 53
Appendices
19 Harris, Jennifer L, Frances Fleming-Milici, Ahmad Kibwana-Jaff, et al. 2020. “Sugary Drink FACTS 2020; Sugary Drink Advertising to Youth: Continued Barrier to Public Health Progress.” UConn Rudd Center for Food Policy & Obesity. Accessed September 21, 2021. https://www.sugarydrinkfacts.org/resources/Sugary%20Drink%20FACTS%202020/Sugary_Drink_FACTS_Full%20Report_final.pdf
20 Center for Digital Democracy. 2021. “Big Food” and “Big Data” Online Platforms Fueling Youth Obesity Crisis as Coronavirus Pandemic Rages.” Accessed September 21. https://www.democraticmedia.org/article/big-food-big-tech-and-global-childhood-obesity-pandemic
21 Artiga, Samantha, Latoya Hill, Nambi Ndugga. 2021. “Racial Disparities in COVID-19 Impacts and Vaccinations for Children.” Kaiser Family Foundation. Accessed September 21. https://www.kff.org/racial-equity-and-health-policy/issue-brief/racial-disparities-in-covid-19-impacts-and-vaccinations-for-children/
22 Perez-Lopez, Daniel J. 2021. “Economic Hardship Declined in Households With Children as Child Tax Credit Payments Arrived.” U.S. Census Bureau. Accessed September 21. https://www.census.gov/library/stories/2021/08/economic-hardship-declined-in-households-with-children-as-child-tax-credit-payments-arrived.html
23 USDA Food and Nutrition Service. 2021. “Program Data Overview.” Accessed September 21. https://fns-prod.azureedge.net/pd/overview
24 Food Research & Action Center. 2019. “School Meals are Essential for Student Health and Learning.” Accessed September 15, 2021. https://frac.org/wp-content/uploads/School-Meals-are-Essential-Health-and-Learning_FNL.pdf
25 U.S. Census Bureau. 2018. “The Supplemental Poverty Measure: 2017.” Accessed September 15, 2021. https://www.census.gov/content/dam/Census/library/publications/2018/demo/p60-265.pdf
26 Food Research & Action Center. 2019. “School Meals are Essential for Student Health and Learning.” Accessed September 15, 2021. https://frac.org/wp-content/uploads/School-Meals-are-Essential-Health-and-Learning_FNL.pdf
27 USDA Food and Nutrition Service. 2021. “USDA Issues Pandemic Flexibilities for Schools and Day Care Facilities through June 2022 to Support Safe Reopening and Healthy, Nutritious Meals.” Accessed September 15. https://www.usda.gov/media/press-releases/2021/04/20/usda-issues-pandemic-flexibilities-schools-and-day-care-facilities
28 Fletcher, Jason M and David E Frisvold. 2017. “The Relationship Between the School Breakfast Program and Food Insecurity.” Journal of Consumer Affairs 51(3):481-500. Accessed September 15, 2021. doi:10.1111/joca.12163.
29 Huang, Jin and Ellen Barnidge. 2016. “Low-income Children’s Participation in the National School Lunch Program and Household Food Insufficiency.” Social Science & Medicine 150: 8-14. Accessed September 15, 2021. doi:10.1016/j.socscimed.2015.12.020.
30 U.S. Census Bureau. 2020. “The Supplemental Poverty Measure: 2019.” Accessed September 15, 2021. https://www.census.gov/content/dam/Census/library/publications/2020/demo/p60-272.pdf
31 Food Research & Action Center. 2016. “Positive Impacts of New School Nutrition Standards.” https://frac.org/wp-content/uploads/school-nutrition-brief.pdf
32 Centers for Disease Control and Prevention. 2021. “Prevalence of Childhood Obesity in the United States.” Accessed September 15, 2021. https://www.cdc.gov/obesity/data/childhood.html
33 Kenney, Erica L, Jessica L Barrett, Sarah N Bleich, et al. 2020. “Impact Of The Healthy, Hunger-Free Kids Act On Obesity Trends.” Health Affairs 39(7). Accessed September 20, 2021. https://www.healthaffairs.org/doi/10.1377/hlthaff.2020.00133
34 Food Research & Action Center. 2018. “The Connections Between Food Insecurity, the Federal Nutrition Programs, and Student Behavior.” https://frac.org/wp-content/uploads/breakfast-for-behavior.pdf
35 EAT Forum. “Summary Report of the EAT-Lancet Commission.” Accessed September 21, 2021. https://eatforum.org/content/uploads/2019/07/EAT-Lancet_Commission_Summary_Report.pdf

54 STATE of CHILDHOOD OBESITY
Appendices
36 Swinburn, Boyd A, Vivica I Kraak, Steven Allender, et al. 2019. “The Global Syndemic of Obesity, Undernutrition, and Climate Change: The Lancet Commission Report.” Lancet Commissions 393(10173):791-846. Accessed September 21, 2021. doi:10.1016/S0140-6736(18)32822-8.
37 USDA Food and Nutrition Service. 2021. “Program Data Overview.” Accessed September 21. https://fns-prod.azureedge.net/pd/overview
38 Poole, Mary Kathryn, Aviva A Musicus, Erica L Kenney. 2020. “Alignment Of US School Lunches With The EAT-Lancet Healthy Reference Diet’s Standards For Planetary Health.” Health Affairs 39(12). Accessed September 21, 2021. doi:10.1377/hlthaff.2020.01102.
39 Friends of the Earth. 2021. “The State of School Lunch in California.” Accessed September 21. https://1bps6437gg8c169i0y1drtgz-wpengine.netdna-ssl.com/wp-content/uploads/2021/03/SchoolFoodReport_ExecutiveSummary.pdf
40 Poole, Mary Kathryn, Aviva A Musicus, Erica L Kenney. 2020. “Alignment Of US School Lunches With The EAT-Lancet Healthy Reference Diet’s Standards For Planetary Health.” Health Affairs 39(12). Accessed September 21, 2021. doi:10.1377/hlthaff.2020.01102.
41 USDA Food and Nutrition Service. 2021. “Special Supplemental Nutrition Program for Women, Infants, and Children (WIC)” Accessed September 21. https://www.fns.usda.gov/wic
42 USDA Food and Nutrition Service. 2021. “WIC Eligibility and Coverage Rates - 2018.” Accessed September 15. https://www.fns.usda.gov/wic/eligibility-and-coverage-rates-2018
43 USDA Food and Nutrition Service. “The Special Supplemental Nutrition Program for Women, Infants and Children (WIC Program).” Accessed September 15. https://fns-prod.azureedge.net/sites/default/files/wic/wic-fact-sheet.pdf
44 USDA Food and Nutrition Service. 2020. “Q&As related to COVID-19: WIC and the Food Distribution Programs.” Accessed September 15, 2021. https://www.fns.usda.gov/covid-19/qas-related-covid-19-and-special-supplemental-nutrition-program-women-infants-and-children
45 Dunn, Caroline, Erica Kenney, Sara Bleich, Sheila Fleischhacker. 2020. “Strengthening WIC’s Impact During and After the COVID-19 Pandemic.” Healthy Eating Research. Accessed September 15, 2021. https://healthyeatingresearch.org/research/strengthening-wics-impact-during-and-after-the-covid-19-pandemic/
46 Plank, Kaela, Lauren Au, Nancy Weinfield, et al. 2019. “Duration of WIC Participation Is Associated with Higher Dietary Quality at 24 Months (P11-048-19).” Current Developments in Nutrition 3(1):nzz048.P11-048-19. Accessed September 15, 2021. doi:10.1093/cdn/nzz048.P11-048-19.
47 Blakeney, Erin. L, Jerald R Herting, Brenda Kaye Zierler, et al. 2020. “The Effect of Women, Infant, and Children (WIC) Services on Birth Weight Before and During the 2007–2009 Great Recession in Washington State and Florida: A Pooled Cross-Sectional Time Series Analysis. BMC Pregnancy Childbirth 20(252). Accessed September 15, 2021. doi:10.1186/s12884-020-02937-5.
48 Soneji, Samir and Hiram Beltrán-Sánchez. 2019. “Association of Special Supplemental Nutrition Program for Women, Infants, and Children With Preterm Birth and Infant Mortality.” JAMA Network Open 2(12):e1916722. Accessed September 15, 2021. doi:10.1001/jamanetworkopen.2019.16722.
49 Centers for Disease Control and Prevention. 2021. “Obesity Among Young Children Enrolled in WIC.” Accessed September 15. https://www.cdc.gov/obesity/data/obesity-among-WIC-enrolled-young-children.html
50 Bersak, T and Lyudmyla Sonchak. 2018. The Impact of WIC on Infant Immunizations and Health Care Utilization. Health Services Research 53:2952-2969. Accessed September 15, 2021. doi:10.1111/1475-6773.12810.
51 Thomas, Tracy N, Maureen S Kolasa, Fan Zhang, et al. 2014. “Assessing Immunization Interventions in the Women, Infants, and Children (WIC) Program.” American Journal of Preventive Medicine 47(5): 624-628. Accessed September 15, 2021. doi:10.1016/j.amepre.2014.06.017.
52 Lee, Jessica Y, R Gary Rozier, Edward C Norton, et al. 2004. “Effects of WIC Participation on Children’s Use of Oral Health Services.” American Journal of Public Health 94:772_777. Accessed September 15, 2021. doi:10.2105/AJPH.94.5.772.
53 Kreider, Brent, John V Pepper, Manan Roy. 2016. “Identifying the Effects of WIC on Food Insecurity Among Infants and Children.” Southern Economic Journal 82:1106-1122. Accessed September 15, 2021. doi:10.1002/soej.12078.

STATE of CHILDHOOD OBESITY 55
Appendices
54 USDA Food and Nutrition Service. “Child and Adult Care Food Program.” Accessed September 16, 2021. https://www.fns.usda.gov/cacfp
55 Korenman, Sanders, Kristin S Abner, Robert Kaestner, et al. 2013. “The Child and Adult Care Food Program and the Nutrition of Preschoolers.” Early Childhood Research Quarterly 28(2):325-336. Accessed September 16, 2021. doi:10.1016/j.ecresq.2012.07.007.
56 Chriqui, Jamie F, Julien Leider, Rebecca M Schermbeck, et al. 2020. “Changes in Child and Adult Care Food Program (CACFP) Practices at Participating Childcare and Education Centers in the United States Following Updated National Standards, 2017-2019.” Nutrients 12(9):2818. Accessed September 16, 2021. doi:10.3390/nu12092818.
57 Sisson, Susan B, Sleet, Kaysha, Rickman, Rachel, et al. 2020. “Impact of the 2017 Child and Adult Care Food Program Meal Pattern Requirement Change on Menu Quality in Tribal Early Care Environments: The Food Resource Equity and Sustainability for Health Study.” Current Developments in Nutrition 4(1):12–22. Accessed September 16, 2021. doi:10.1093/cdn/nzz094.
58 USDA Food and Nutrition Service, Budget Division, Program Data Branch. 2020. “Program Information Report (KeyData).” Accessed September 16, 2021. https://fns-prod.azureedge.net/sites/default/files/data-files/Keydata-September-2020.pdf
59 USDA Food and Nutrition Service. 2013. “What Can Snap Buy?” Accessed September 16, 2021. https://www.fns.usda.gov/snap/eligible-food-items
60 United States Department of Agriculture. 2021. “SNAP Education.” Accessed September 21, 2021. https://snaped.fns.usda.gov/
61 Cronquist, Kathryn and Sarah Lauffer. 2019. “Characteristics of USDA Supplemental Nutrition Assistance Program Households: Fiscal Year 2018.” USDA Food and Nutrition Service. Accessed September 16, 2021. https://fns-prod.azureedge.net/sites/default/files/resource-files/Characteristics2018-Summary.pdf
62 Cronquist, Kathryn and Sarah Lauffer. “Characteristics of Supplemental Nutrition Assistance Program Households: Fiscal Year 2017.” USDA Food and Nutrition Service. Accessed September 16, 2021. https://fns-prod.azureedge.net/sites/default/files/resource-files/Characteristics2017.pdf
63 Center on Budget and Policy Priorities. 2019. “Policy Basics: The Supplemental Nutrition Assistance Program (SNAP).” Accessed September 16, 2021. https://www.cbpp.org/research/food-assistance/the-supplemental-nutrition-assistance-program-snap
64 Bartlett, Susan, Jacob Klerman, Parke Wilde, et al. 2014. “Evaluation of the Healthy Incentives Pilot (HIP) Final Report.” United States Department of Agriculture, Food and Nutrition Service. Accessed September 16, 2021. https://mafoodsystem.org/media/resources/pdfs/PilotFinalReport.pdf
65 USDA Food and Nutrition Service. “Gus Schumacher Nutrition Incentive Program.” Accessed September 21, 2021. https://nifa.usda.gov/program/gus-schumacher-nutrition-incentive-grant-program
66 USDA Food and Nutrition Service. 2021. “Thrifty Food Plan Re-evaluation Puts Nutrition in Reach for SNAP Participants.” Accessed September 16, 2021. https://www.fns.usda.gov/tfp/blog-083021
67 Center on Budget and Policy Priorities. 2016. “The Relationships Among SNAP Benefits, Grocery Spending, Diet Quality, and the Adequacy of Low-Income Families’ Resources.” Accessed September 16, 2021. https://www.cbpp.org/research/food-assistance/the-relationships-among-snap-benefits-grocery-spending-diet-quality-and
68 Gundersen, Craig, Brent Kreider, John V Pepper. 2018. “Reconstructing the Supplemental Nutrition Assistance Program to More Effectively Alleviate Food Insecurity in the United States.” Russell Sage Foundation Journal of the Social Sciences 4(2):113–30.
69 Hoynes, Hilary W, Diane Whitmore Schanzenbach, Douglas Almond. 2016. “Long-Run Impacts of Childhood Access to the Safety Net.” American Economic Review 106 (4):903-34. Accessed September 16, 2021. doi:10.3386/w18535.
70 Frongillo, Edward A, Diana F Jyoti, Sonya J Jones. 2006. “Food Stamp Program Participation Is Associated with Better Academic Learning Among School Children.” Journal of Nutrition 136(4):1077-80. Accessed September 16, 2021. doi:10.1093/jn/136.4.1077.
71 Russek, Frank and Kim Kowalewski. 2015. “How CBO Estimates Automatic Stabilizers.” Working Paper. Accessed September 16, 2021. https://www.cbo.gov/sites/default/files/114th-congress-2015-2016/reports/51005-AutomaticStabilizers.pdf

56 STATE of CHILDHOOD OBESITY
Appendices
72 Akinbami, Lara J and Cynthia L Ogden. 2009. “Childhood Overweight Prevalence in the United States: The Impact of Parent-Reported Height and Weight.” Obesity 17:1574-1580.
73 Data Resource Center for Child & Adolescent Health. 2020. “The National Survey of Children’s Health.” https://www.childhealthdata.org/learn-about-the-nsch/NSCH
74 U.S. Census Bureau. 2021. “2020 National Survey of Children’s Health: Methodology Report.” https://www2.census.gov/programs-surveys/nsch/technical-documentation/methodology/2020-NSCH-Methodology-Report.pdf
75 USDA Food and Nutrition Service. “Special Supplemental Nutrition Program for Women, Infants, and Children (WIC).” Accessed September 16. https://www.fns.usda.gov/wic
76 Thorn, Betsy, Nicole Kline, Chrystine Tadle, et al. 2018. “WIC Participant and Program Characteristics 2016.” USDA Food and Nutrition Service. Accessed September 16, 2021. https://www.fns.usda.gov/wic/wic-participant-and-program-characteristics-2016
77 Centers for Disease Control and Prevention. 2018. “Youth Risk Behavior Surveillance System (YRBSS) Overview.” Accessed September 16, 2021. https://www.cdc.gov/healthyyouth/data/yrbs/overview.htm
78 Kann, Laura, Tim McManus, William A Harris, et al. 2018. “Youth Risk Behavior Surveillance — United States, 2017.” MMWR Surveill Summ 67(8). Accessed September 16, 2021. https://www.cdc.gov/healthyyouth/data/yrbs/pdf/2017/ss6708.pdf
79 Centers for Disease Control and Prevention. 2017. “About the National Health and Nutrition Examination Survey.” Accessed September 16, 2021. https://www.cdc.gov/nchs/nhanes/about_nhanes.htm
80 Centers for Disease Control and Prevention. 2014. “BRFSS Today: Facts and Highlights.” Accessed September 16, 2021. https://www.cdc.gov/brfss/about/brfss_today.htm
81 Centers for Disease Control and Prevention. 2019. “Overall Version Data Weighted with _LLCPWT; Behavioral Risk Factor Surveillance System.” Accessed September 16, 2021. https://www.cdc.gov/brfss/annual_data/2018/pdf/codebook18_llcp-v2-508.pdf
82 Cohen, Juliana FW, Amelie A Hecht, Gabriella M McLoughlin, et al. 2021. “Universal School Meals and Associations with Student Participation, Attendance, Academic Performance, Diet Quality, Food Security, and Body Mass Index: A Systematic Review.” Nutrients 13(3):911. Accessed September 15. doi:10.3390/nu13030911.
83 Crippa, Monica, Efisio Solazzo, D Guizzardi, et al. 2021. “Food Systems Are Responsible for a Third of Global Anthropogenic GHG Emissions.” Nature Food 2:198–209. Accessed September 21. doi:10.1038/s43016-021-00225-9.


© 2021 Robert Wood Johnson Foundation