Embed Size (px)
Citation preview

" FROM COMMUNITY SUPERVISION TO PRISON
A Study of Felony Probation and Parole Revocations
Oregon Department of Corrections
September 1992
,
~---------------------
If you have issues viewing or accessing this file contact us at NCJRS.gov.

FROM COMMUNITY SUPERVISION TO PRISON
A Study of Felony Probation and Parole Revocations
Oregon Department of Corrections
September 1992
The research described in this report was supported by Grant 91-0016 through the Criminal Justice Services Division of the Oregon Executive Department from the Office of Justice Programs of the U. S. Department of Justice. The views or opinions stated herein are those of the policy analyst consultant and do not necessarily reflect the official position or policies of the U. S. Department of Justice or the Oregon Department of Corrections.

U.S. Department of Justice National Institute of Justice
144274
This document has been :eproduced exactly as received from the person or organization originating it. Points of view or opinions stated in this document are those of the authors and do not necessarily represent the official position or policies of the National Institute of Justice.
Permission to reproduce this ! aaieJVd material has been
gr~ic Danain/OJP u. S. DepdI l1llenL of Jus Lice
to the National Criminal Justice Reference Service (NCJRS).
Further reproduction outside of the NCJRS system requires permission of the ~owner.

Don Baird Ann Benefiel Keith Benefiel Dawn Bruce Lynn Cokely Ron Glynn Gordon Hanson Peggy Humbert Chris Jaber Christine Jensen David Landis Gail Newman Dave Randall Jim Stewart Susan Taylor Mary Tegner Saundra Wedge PJ Wiley Roy Wright Kathy Zimmerman
Policy Analyst: Nora Harlow
study Team
Project Coordinator: Gary Weeber Classification and Transfer Division Oregon Department of Corrections
Project Researcher: Michael Karecki
Tanna Reynolds, Executive Assistant Community Services Branch
Oregon Department of Corrections
Randy Ireson, Research Analyst Oregon Department of Corrections
Sample File Review Team
Parole/probation Officer Parole/Probation Officer
Project Coordinator ParolelProbation Officer Parole/Probation Officer Parole/Probation Officer 'Parole/Probation Officer Parole/Probation Officer Parole/Probation Officer Parole/Probation Officer Parole/Probation Officer Parole/Probation Officer Parole/Probation Officer
Supervisor Parole/Probation Officer
Supervisor Parole/Probation Officer Parole/Probation Officer Parole/probation Officer Parole/Probation Officer
Multnomah County Linn County Parole Board Polk County Polk County Multnomah County Deschutes County Yamhill County Multnomah County Multnomah County Multnomah County Benton County Douglas County Washington County Multnomah County Marion County Multnomah County Lane County Coos County Multnomah County
Text Editor: Norm Solomon, Oregon Department of Corrections
For further information contact Elyse Clawson, Assistant Director, Community Services Br.anch, Oregon Department of Corrections, (503) 378-8805.
CONTENTS
Summary ..............................•.................. i
The Revocation Study ....................... M •••••••••••••• 2
Study Questions and Findings ................................... 3
Characteristics of Revoked and General Populations .. .. __ . . .. 4
Treatment and Service Needs ............................ 6
Violation Behaviors and Prior Sanctions ......... M M _. • • • • • •• 8
Variations Among Counties ............................. 10
Appropriateness of Revocations ............••••......... 12
Policy Implications and Data Needs ............................ 13
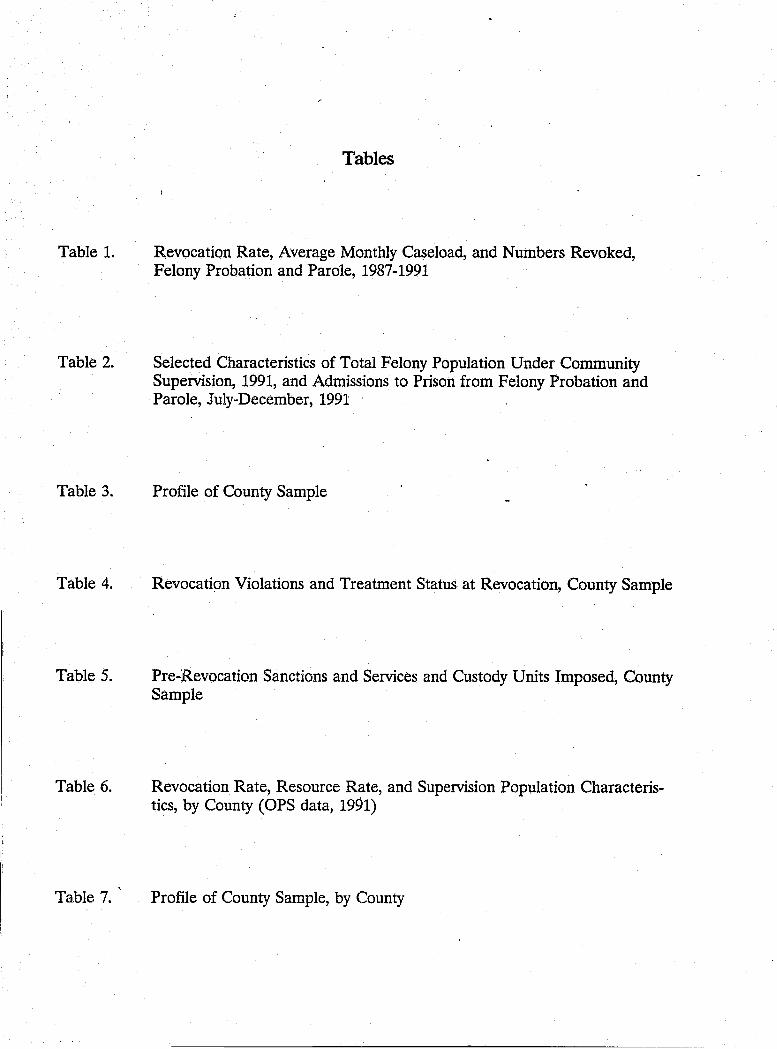
Table 1.
Table 2.
Table 3.
Table 4.
Table 5.
Table 6.
Table 7.
Tables
Revocation Rate, Average Monthly Ca~eload, and Numbers Revoked, Felony Probation and Parole, 1987-1991
Selected Characteristics of Total Felony Population Under Community Supervision, 1991, and Admissions to Prison from Felony Probation and Parole, July-December, 1991
Profile of County Sample
Revocation Violations and Treatment Status at Revocation, County Sample
Pre-Revocation Sanctions and Services and Custody Units Imposed, County Sample
Revocation Rate, Resource Rate, and Supervision Population Characteristics, by County COPS data, 1991)
Profile of County Sample, by County

SUM:MARY
More than 80 percent of all prison admissions in Oregon in 1991 were revoked community supervision cases. More than half the prison population had been on probation or parole immediately prior to incarceration. Increasing numbers of probationers and parolees are being revoked for new crimes or for other supervision violations, and the percentage of prison admissions due to revocations is growing.
Prison populations are near capacity and still rising, and state budget cuts are expected to follow on the heels of Measure 5. In this context it makes sense to consider ways of reducing revocations and to seek less costly approaches to dealing effectively with supervision violations. To provide a foundation for policy development in this area, the Department of Corrections obtained federal funds through the Oregon Criminal Justice Services Division for a study of revocations.
TIIE REVOCATION STUDY
Data were collected on two populations: felony offenders under community supervision and prison admissions on parole or probation immediately prior to admission. Information also was obtained for a sample of probationers and parolees admitted to prison fIom selected counties. The study sought to identify offender characteristics and behaviors, as well as system responses to them. It was hoped that this would help explain why some offenders are revoked to prison while others are continued under community supervision.
An underlying assumption of the study is that correctional workloads, populations, and costs are not primarily the result of crime rates and offender characteristics. The key determinants instead are choices made by decision-makers in the legislature and at key justice system decision points. Community supervision caseloads and occupancy levels of correctional facilities can be controlled without compromising public safety if purposefully developed policy is supported by targeted funding. The study was designed to provide basic information for policy development and funding decisions around the issue of c:''Jpervision revocations.
The study found a number of differences between revoked offenders and those in the general supervision population. There was also wide variation among counties in rates of
- i -

revocation and use of alternative sanctions. Among the most important findings are the following:
• Revoked offenders are more likely than the general supervision population to be young black males under supervision for property crimes. They are more likely to be on parole or combined parole/probation supervision rather than on probation only. Other distinguishing characteristics are high risk scores and multiple prior convictions and incarcerations (pp. 4-6).
• Revoked offenders are somewhat more likely than the general supervision population to have treatment or service requirements as special conditions of their supervision. They are much more likely to be substance abusers and to be underemployed or unemployed (pp. 6-7).
• The vast majority of revocations are for a combination of behaviors, including technical violations of supervision conditions, criminal behaviors, and new crime convictions. Some kind of criminal behavior, with or without conviction, was recorded for more than 80 percent of the sample population. Property offenses are the most common new crime convictions. Drug offenses account for the largest percentage of criminal law violations without conviction (pp. 8-9).
• Revoked offenders are receiving few services prior to revocation, and few have had sanctions applied for supervision violations prior to revocation. Less than half the sample population was receiving support services at the time of revocation. A little over half showed at least one formal hearing prior to the hearing that resulted in revocation, and many of these had resulted in increased supervision. But less than one-third of the sample had experienced any additional sanctions prior to revocation (pp. 8-10).
• Except for a much higher incidence of supervision conditions involving alcohol and drug treatment, there were few significant differences between male and female offenders (p. 7). This may have been due to the small number of women in the sample, and further research in this area is 'warranted.
• Rates of revocation and use of alternative sanctions vary widely among the counties, but few patterns emerge that would reliably explain the differences. Percentages of parolees in the general supervision population (and associated average risk score) seem to bear some relationship to the revocation rate. Other factors that might be expected to influence revocations, including rates of resource use, show no clear relationships (pp. 10-12).
-ll-

POUCY IMPUCATIONS
Study findings suggest that decisions to revoke are not made capriciously or without due cause. Revoked offenders differ from those in the general supervision population on a number of characteristics reflecting criminal history and behavior. Nonetheless, over 70 . percent of the revoked population is sent to prison without having experienced any community-based sanctions for violation behaviors. For the vast majority of those who receive any sanction prior to revocation, that sanction is jail. Other sanctions are seldom used. Also, while most revoked offenders show a combination of behaviors that includes criminal activity, 16 percent of all revocations are for technical violations only.
The wide variation in county rates of revocation and resource use strongly suggests the need for state policy to promote wider and more consistent use of intermediate sanctions. But without policy control over the ways in which intermediate sanctions are used, it cannot be assumed that revocations will decline if alternative sanctions are made more available. Nor will reducing revocations necessarily have no negative impacts on the rest of the correctional system. In a system as complex as criminal justice and corrections, it is critical that proposed policy changes in anyone area be seen in the larger context. Goals for the system as a whole must be constantly kept in mind.
It will also be important to continue to monitor the impacts of changes in policy and practice to ensure that they are having the intended effects. This is especially important whenever efforts are made to limit the use of more costly approaches by providing less restrictive or less formal alternatives. The well-known phenomenon of "widening the net" has often been traced to the ready availability and reduced cost of less restrictive sanctions and alternatives to official processing.
Given these caveats, there are two primary ways in which revocations to prison may be reduced. The first concentrates on offender characteristics, with a goal of reducing violations. The second focuses on system responses, with a goal of reducing revocations for violation behaviors.
Reducing Violations
Available information and experience suggest several approaches to reducing supervision violations. These include offering the kinds of practical assistance most needed by offenders and providing real deterrents to violation behavior. Deterrence is evident in such programs as the state-level Parole Violators Project and the DROP (Drug Reduction of Probationers) program in use in many Oregon counties. Both of these programs have demonstrated the deterrent effects of "swift and certain" sanctions for violation behaviors.
Down-playing the emphasis on surveillance and offering more practical assistance to probationers and parolees are elements of the transition services now provided to some
- iii -

Oregon prison inmates. These characteristics are also found in the pre-release training and post-release services provided by the Pre-start program in Illinois (p. 16).
The shift from surveillance to voluntary services, as seen in Illinois, has important implications for efforts to reduce supervision violations while enhancing offender reintegration. The characteristics of revoked offenders in this study suggest that more treatment programs are needed. But when involuntary treatment is provided in a framework of surveillance and sanctions, such programs may increase rather than reduce violations.
Reducing Revocations
Approaches to reducing revocations focus on expanding the availability of intermediate sanctions and promoting their more consistent use. Providing less costly sanctions at lower levels can reduce overall system costs and allow more immediate responses to supervision violations. Intermediate sanctions are one element of a balanced response that combines sanctions with services and surveillance.
Expanding the use of alternative sanctions while reducing overall costs will require some reallocation of resources to higher risk cases throughout the corrections system. Additional funding may be required to manage a higher risk population in the community. However, as state and local budgets contract, some portion of the resources now allocated to low-risk offenders also will need to be redirected.
Among the most promising proposals for reducing revocations to prison is the development of intervention guidelines for probation violations. Sentencing guidelines have been in use in Oregon since 1989. Parole intervention guidelines are being piloted in selected counties throughout the state. Probation is the major area in which guidelines 'are still lacking, and this is where revocation rates have continued to climb.
Probation intervention guidelines would institutionalize the use of intermediate sanctions statewide and promote greater consistency in their application. Following the parole guidelines model, sanctioning ranges likely would be established for various combhlations of violation seriousness and offender risk. Flexibility within these ranges would allow sanctions to be tailored to individual cases. .
There are several ways in which probation guidelines could be implemented. One option is statutorily approved guidelines applied by the courts. This is how sentencing guidelines generally are implemented. Alternatively, policy-level guidelines could be applied within an administrative hearings process under the direction of the parole board or state corrections. Administrative guidelines are used for parole violations in Oregon and for parole and ,probation violations in South Carolina. Advantages and disadvantages of each of these approaches need to be carefully weighed (pp. 16-18).
-iv-

However they are implemented, probation guidelines would allow much needed system control over decisions about how scarce correctional resources are used. They also would increase the equity and predictability of sanctions for supervision violations. Over time, as fewer probation violators are revoked to prison, guidelines also may encourage local jurisdictions to use correctional resources in new ways. With higher risk violators retained in the community, counties may begin to shift funding to sanctions that have proved effective with these offenders. These sanctions might include more restrictive programs such as electronic monitoring/home custody, probation centers with work release, day reporting, intensive supervision, and revocation centers (p. 18).
Significant use of custody-oriented local sanctions may require statutory and/or policy changes governing the assignment and use of custody units for probationers sentenced under sentencing guidelines. Further study of this issue is needed before policy changes are considered. It is widely assumed that custody units tend to be fully imposed up front, and that this leaves no alternative to revocation when violations OCC1,lr. '\:"et the findings of this study suggest that in many cases assigned custody units have not been fully used at the time of revocation (p. 19).
The custody unit issue highlights the need for good information, for education of decision makers, and for a system-wide approach to policy change in criminal justice and corrections. In the absence of information on how and why custody units are used, changes in ceilings or in units reserved for violations may have wholly unintended effects. Without planning from a system-wide perspective, those effects likely would extend to both prisons and jails. And lacking the support of prosecutors and judges, policy changes around custody units may have no effects at all. As is true for the rest of the corrections and criminal justice system, policy changes in this area must be comprehensively planned. They also must be based on good information and supported by those whose decisions and actions will largely determine their success.
-v-

FROM COMMUNITY SUPERVISION TO PRISON
A Study of Felony Probation and Parole Revocations
Over the past ten years Oregon experienced explosive growth in state plison populations, and overcrowding was a problem throughout the decade. Prison admissions increased 164 percent, from 2,076 in 1981 to 5,484 in 1990. In 1985 the system was at 106 percent of capacity, and in 1989 space designed for 2,800 inmates was occupied by a population of 5,305. Despite a substantial building program, which since 1987 has added more than 3,000 beds, the system currently is operating at 99 percent of capacity, and the incarcerated population is expected to continue to grow.
The increased demand on the prison system cannot be explained by growth in the state population, which has increased only 8 percent since 1980. Nor can the cause be found in changes in the youthful population most at risk for committing crimes (ages 18 to 25), since that population has decreased by 20 percent. Some portion of the growth in prison populations may be due to an increase in certain kinds of crime .. In the last half of the decade there has been an overall increase in adult arrests, especially for drug offenses, and the percentage of drug convictions resulting in prison sentences also has risen.1
Even a casual examination of the data, however, shows that the most significant impact on prison populations comes from felony probation and parole revocations. More than 80 percent of all prison admissions in 1991 were revoked community supervision cases, and more than half the prison population had been under community supervision immediately prior to incarceration. The percentage of prison admissions from probation and parole supervision has increased in recent years, from 61.7 percent in 1987 to 80.9 percent in 1990 to 81.3 percent in 1991. .
From 1986 to 1990, arrests for property crimes remained stable, but arrests for both person-to-person and behavioral crimes increased by 23 percent and 45 percent, respectively. The percentage of prison admissions where the most serious offense was a drug offense increased from 19.2 percent in 1986 to 38.2 percent in 1990. In 1986, seven percent of such convictions, and in 1990, 12 percent resulted in prison sentences. There is some evidence that this trend may be turning around since implementation in 1989 of the state's sentencing guidelines: in 1991, eight percent of convicted drug offenders were sentenced to prison.
- 1 -

The rising number of prison admissions from community supervision appears to be due primarily to absolute increases in felony probation and parole populations, rather than to changes in field revocation rates. From 1987 through 1991 the probation revocation rate increased from 0.6 percent to 1 percent per month, but parole revocations dropped from 7.2 percent to 3.7 percent (see Table 1). Caseloads, meanwhile, continued to rise: the average monthly felony caseload increased by 36.3 percent and the parole caseload grew by 261 percent. It is clear from these figures that, even with a sharp reduction in the rate of parole revocation, there has been a substantial increase in the numbers of admissions to prison
. from community supervision.
Revocations to prison impact the correctional system not only by their large numbers but because of the short terms and rapid turnover associated with this population. While short lengths of stay may help to contain institutional populations, the sheer volume of paperwork and processing occasioned by repeated changes in offender status adds to costs and workloads in institutions, the courts, and community corrections offices.
Workloads and costs, along with the perennial problem of prison crowding, have assumed even greater urgency since passage of Measure 5 in 1990, which reduces property taxes statewide and shifts state funds to schools at the local level. To accommodate a potential reduction of 20 percent in the next biennial budget, the Department of Corrections has been considering a range of options, from closure of facilities to reduction in parole terms to restriction of field supervision to high- and medium-risk offenders. In this context it makes sense to consider ways of reducing the number of admissions to prison from probation and parole supervision and to find effective but less costly ways of holding offenders responsible for their behavior.
THE REVOCATION STUDY
In April 1992 the Department of Corrections obtained federal funds through the Oregon Criminal Justice Services Division for a descriptive study of felony probation and parole revocations.2 The purpose of the study was to provide basic information for policy makers on the characteristics and behaviors of offenders revoked from community supervision, system responses to offender behaviors, and, to the extent possible, the appropriateness of revocations to prison.
2 Revocation is used to describe a status change when an offender is admitted to prison from felony probation or parole supervision. These offenders were not necessarily revoked by the releaSing authOrity.
-2-
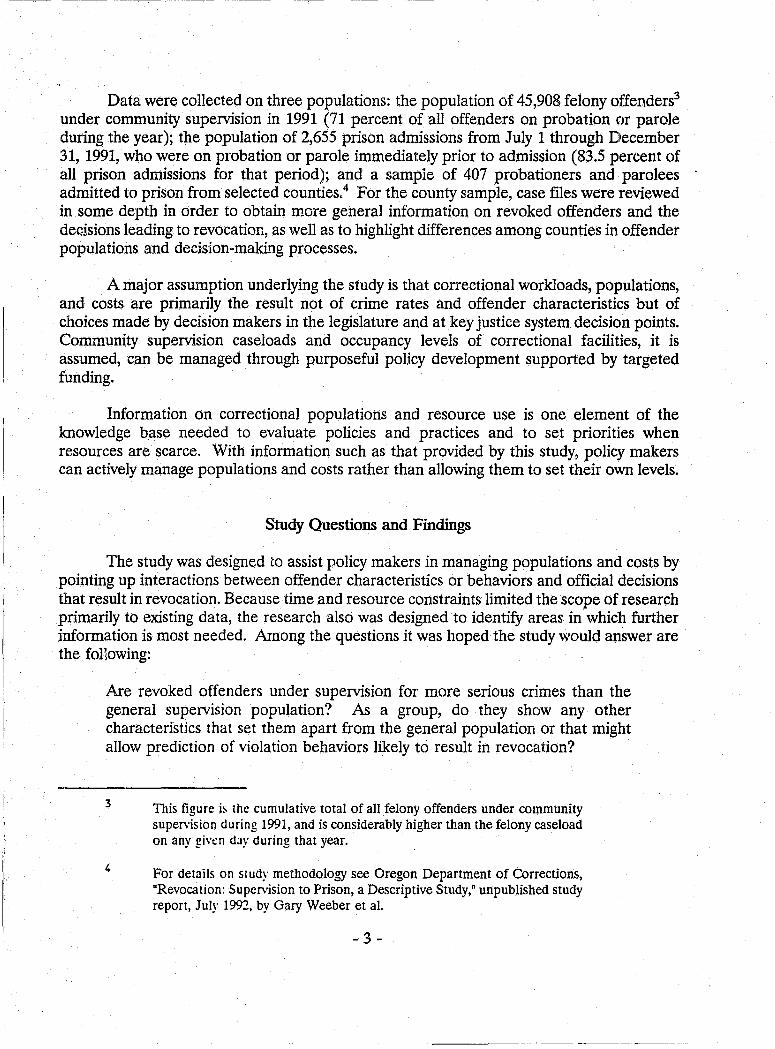
Data were collected on three populations: the population of 45,908 felony offenders3
under community supervision in 1991 (71 percent of all offenders on probation or parole during the year); the population of 2,655 prison admissions from July 1 through December 31, 1991, who were on probation or parole immediately prior to admission (83.5 percent of all prison admissions for that period); and a sample of 407 probationers and parolees admitted to prison from selected counties,4 For the county sample, case files were reviewed in some depth in order to obtain more general information on revoked offenders and the dec.isions leading to revocation, as well as to highlight differences among counties in offender populations and decision-making processes.
A major assumption underlying the study is that correctional workloads, populations, and costs are primarily the result not of crime rates and offender characteristics but of choices made by decision makers in the legislature and at key justice system decision points. Community supervision caseloads and occupancy levels of correctional facilities, it is assumed, can be managed through purposeful policy development supported by targeted funding.
Information on correctional populations and resource use is one element of the knowledge base needed to evaluate policies and practices and to set priorities when resources are scarce. With information such as that provided by this study, policy makers can actively manage populations and costs rather than allowing them to set their own levels.
Study Questions and Findings
The study was designed to assist policy makers in managing populations and costs by pointing up interactions between offender characteristics or behaviors and official decisions that result in revocation. Because time and resource constraints limited the scope of research primarily to existing data, the research also was designed to identify areas, in which further information is most needed. Among the questions it was hoped the study would answer are the fonowing:
Are revoked offenders under supervision for more serious crimes than the general supervision popUlation? As a group, do they show any other characteristics that set them apart from the general population or that might allow prediction of violation behaviors likely to result in revocation?
3
4
This figure b the cumulative total of all felony offenders under community supervision during 1991, and is considerably higher than the felony caseload on any given day during that year.
For details on study methodology see Oregon Department of Corrections, "Revocation: SuperviSion to Prison, a Descriptive Study," unpublished study report, July 1992, by Gary Weeber et al.
- 3 -

Compared to the general supervlSlon population, do revoked offenders experience more substance abuse, mental illness, unemployment, or other problems? Are they receiving the treatment or services they need to succeed under supervision?
How serious are the violations for which community supervision cases are revoked? How many offenders are revoked to prison for criminal behaviors or convictions and how many are admitted, for technical violations only?
Are offenders revoked at their first hearing on a supervision violation, or are intermediate sanctions tried before an offender is sent to prison?
Do jurisdictions vary in rates of revocation? If so, can these variations be explained by differences in offender populations, in violation behaviors, or in resource availability and use?
Considering offender characteristics and behaviors, public safety issues, and available resources, is the number of revocations to prison appropriate?
What kinds of data and analysis are needed to answer the most pressing policy-related questions raised by this study? What changes in policy and practice might be made with existing information to allow better control of the size and nature of the revocation population?
study Findings: Are revoked offenders different from the community supervision population in general?
As a group, do felony probationers and parolees revoked to prison show any characteristics that set them apart from the general population under community supervision? Do characteristics of age, race, gender, risk level, or criminal history differ for
. this group? Were they placed under supervision for mpre serious crimes?
As shown in Table 2, revoked offenders are more likely than the general supervision population to be young black males under supervision for property offenses; to be on parole or combined parole/probation supervision rather than probation only; and to have high risk scores and multiple prior convictions and incarcerations.
The data suggest that not only are young people between the ages of 18 and 25 more at risk for arrest and conviction, but this group also is more likely, once sentenced to community supervision, to be revoked for violations. Of the general supervision population, 20.9 percent falls within the "at risk" group, while 31 percent of revocation admissions are in this age category. Of all admissions in this group, 57.2 percent are probationers, and of all probation revocations for new crimes, 47 percent are between the ages of 18 and 25.
-4-

Blacks also are more likely to be under community supervision than would be suggested by their numbers in the state population, and they are revoked at a rate higher than that suggested by their percentage of the general supervision caseload. The trend for caucasians is just the opposite: While accounting for 91 percent of the state population and 83 percent of the population under community supervision, caucasians represent only 75 percent of revoked supervision cases. Blacks comprise 2 percent of the state population, but represent 8 percent of the population under supervision and 15 percent of supervision revocations. Hispanics show a similar but less striking pattern, with 4 percent of the state population, 6 percent of the supervision population, and 7 percent of the revoked population.
Men are much more likely than women to be under supervision and somewhat more likely to experience revocation;, 81 percent of the general supervision population and 89.6 percent of admissions to prison from community supervision are male.
Compared with the general supervision population, the revoked population also is a higher risk group with more prior convictions and incarcerations. Parolees and probationers differ significantly along all these dimensions. The average (mean) risk score for the general supervision population is 7.6, with parolees showing an average score of 4.9 and probationers a much less serious5 average score of 8.7. Within the revoked population, which had a mean risk score of 5.8, parolees had an average score of 4.0 compared to 7.6 for probationers. Of the general supervision population, only 28.4 percent are high risk, while 58.7 percent of the revoked population falls within this category.
The higher average risk score for revoked offenders is due in large part to the proportion of parolees within this population. Parolees constitute 26.5 percent of the general supervision population and 56.1 percent of revoked offenders.
Prior history shows a similar breakdown when comparing the general supervision population with revoked probationers and parolees. Within the supervision population, 58.7 percent had no prior felony convictions and 67.3 percent had no prior incarcerations of more than ninety days. For the revoked population, these f;igures were 32.4 percent and 41.2 percent, respectively. Slightly over one-quarter of the general population (26.3 percent) and half (50.2 percent) the revoked population had two or more prior felony convictions; less than 10 percent of the general supervision population and one-quarter of the revoked population had three or more prior incarcerations of more than ninety days. .
Interestingly, although the revoked population had significantly more prior incarcerations, jail as a condition of the current supervision is no more common for this group (27.8 percent) than for the general supervision population (27.9 percent).
Lower numerical scores indicate higher risk. Within a range of 11, High risk is considered 0-6, Medium Risk is 7-9, while Low Risk is 10-11.
- 5 -

In general, the major crime for which offenders are under supervision does not distinguish the revoked and general supervision populations as sharply as do prior convictions or incarcerations. Class C felonies are somewhat more common in the general supervision population (67.2 percent) than in the revoked population (59.4 percent). Revoked offenders also are slightly more likely to be under supervision for a property crime -rather than for person or behavioral crimes6
: property crimes are the major crime category for 40.5 percent of the general supervision population and 47.8 percent of revoked offenders.
Revoked offenders are considerably less likely than the general population to be serving supervision sentences for behavioral crimes (28.2 percent versus 40.1 percent) and somewhat more likely to be under supervision for crimes against persons (23.9 percent versus 19.4 percent). Within the general category of person crimes, rates for the offense groups of Kidnapping I, Burglary I, and Robbery I are almost twice as high for revoked offenders as for the general population (17.6 percent versus 9.2 percent).
Revoked offenders also are more likely than the general supervision population to be serving sentences for sex offenses (7.3 percent versus 4.8 percent) and less likely to be sentenced for drug offenses (19.4 percent versus 28.6 percent). By status, 36.7 percent of felony probationers and 6 percent of parolees in the general population were under supervision for a drug offense.
study Findings: Do revoked offenders experience more health or employment related problems, and are they receiving the services they need?
Do revoked offenders experience more substance abuse, mental health, unemployment, or other problems than the general supervision popUlation? If so, are they receiving the treatment or services they need to succeed under supervision?
As shown in Table '2, revoked offenders are somewhat more likely than the general supervision population to have treatment or service requirements as special conditions of their supervision and much more likely to be substance abusers and to be underemployed or unemployed.
A higher percentage of revoked offenders than offenders in the general supervision population show special conditions of alcohol/drug (72.9 percent versus 44.3 percent), sex offender (4.8 percent versus 2.3 percent), or mental health (22.8 percent versus 15.3 percent) treatment and urine/blood/polygraph testing (86.3 percent versus 59.2 percent). Revoked offenders also are more likely to have more than one special condition attached (86.9 percent versus 71.7 percent).
6 Behavioral crimes are violations of laws relating to personal conduct and public order, including weapons, liquor, drug, prostitution, and gambling laws, disorderly conduct, and driving while intoxicated.
- 6-

Although a smaller percentage of the revoked population is under supervision for a drug offense, substance abuse is considerably more evident among revoked offenders than in the general supervision population. For offenders in the general population, substance abuse was documented for 34 percent while under supervision. In contrast, 66.8 percent of revoked offenders were found to be experiencing substance abuse problems prior to -revocation.
Employment problems also are more evident among the revoked population: while 43.5 percent of the general supervision population are less than 60 percent employed, that figure is 71.9 percent for revoked offenders.
For the total population of prison admissions from community supervision there are no data to indicate whether treatment or services were delIvered prior to revocation. However, case files on the sample of 407 revoked offenders from selected counties provide some of this information for that sample.
In terms of service or treatment needs, the county sample (see Table 3) differs somewhat from the total revoked population. Sample cases show a higher percentage of supervision conditions requiring alcohol/drug (80.3 percent versus 72.9 percent) or sex offender (7.6 percent versus 4.8 percent) treatment and a lower percentage of conditions requiring urine/blood/polygraph testing (81.3 percent versus 86.3 percent) or mental health treatment (14.7 percent versus 22.8 percent). Substance abuse problems at time of revocation were documented for 61.7 percent of the sample cases, and only 8 percent were found to be more than 60 percent employed.7
'
Conditions of supervision for the county sample also reveal the only significant difference between male and female offenders found in this study: women are much more likely than men to have alcohol/drug treatment as a supervision condition (92 percent versus 78.7 percent).8
Information on treatment status at revocation for the county sample shows that some offenders with treatment conditions had not been referred to treatment programs and a significant proportion of those referred were failing treatment (Table 4). Failing treatment at time of revocation were 56.7 percent of those referred for sex offender treatment, 73.9
7
8
Employment figures for the total revoked population and the county sample are not directly comparable, since this information was not available for 31 percent of the sample population.
Table 3 also shows that women are less likely to be under supervision for a person offense and to have received any prior sanction other than jail and more likely to be substance abusers and to be less than 60 percent employed. For the small group of women in the sample, however, these differences are not statistically Significant.
- 7-

-----_. ----------------------------------------------------
percent of those in treatment for substance abuse, and 58.8 percent of mental health treatment cases.
No referrals were recorded for 12.9 percent of sex offender treatment cases, 17.7 percent of substance abuse treatment cases, and 23.3 percent of mental health treatment cases. It is not known whether supervising staff neglected to make referrals in these cases, whether treatment programs were unavailable, or whether these offenders had absconded and could not be located.
Absconding is a serious problem in itself, and absconders are a high risk group for revocation. Of the total revocation population, 37.9 percent had absconded prior to prison admission (Table 2). Absconding was noted as a revocation violation in 50.6 percent of the county sample (Table 3), and 23.3 percent had absconded during the supervision period prior to revocation.
study Findings: How serious are the violations for which community supervision is revoked, and have intermediate sanctions already been tried?
How many revocations are for criminal behaviors or convictions and how many are for technical violations only? Are offenders sent to prison at their first hearing on a supervision violation or are intermediate sanctions imposed before an offender is revoked?
Case files on the county sample were examined to shed light on revocation violations, as well as offender behaviors and system responses prior to revocation. The vast majority of revocations among the sample population are for a combination of behaviors, including technical violations of supervision conditions such as absconding or treatment failure, criminal behaviors such as substance abuse, and convictions for new crimes.
Less than half the county sample of revoked offenders were receiving support services at the time of revocation. A little over half had experienced at least one formal hearing prior to the hearing that resulted in revocation, and increased supervision conditions had been applied to a large proportion of these cases. For less than one-third of the sample, however, had any additional sanctions been imposed prior to revocation. Among sentencing guidelines probation cases, a large proportion were revoked to prison before maximum local custody units had been imposed.
Of the sample of 407 revocations in selected counties, 16.2 percent are for technical violations only, 3.2 percent are for criminal behavior only, and 2.9 percent are for new criminal convictions only (see Table 3). The largest percentages of technical-only violations are found for probation cases (22.1 percent) and absconders (22.3 percent). Some kind of criminal behavior (convicted or non-convicted) was recorded for 83.8 percent of the sample population.
- 8-

More than three-quarters of the sample (77.4 percent) were revoked for a combination of behaviors. Viewing violations non-exclusively, it is apparent that, while most offenders also had technical violations, combination violations included a substantial number of new crimes (see Table 4). Technical violations were recorded for 89.9 percent of the sample, but criminal behaviors were found for 71 percent, and 37.1 percent had new criminal convictions.
Significant percentages of the sample cases show more than one revocation violation even within a single category. Three to six technical violations were reported for 33.2 percent of all revoked offenders; 22.9 percent had more than two criminal behavior violations; and 7.6 percent had two to four criminal convictions at revocation.
Treatment failure and absconding are the most common technical violations (52.1 percent and 50.6 percent, respectively), followed by failure to comply with instructions of the supervising officer (45.2 percent). Person crimes without conviction were reported for 16 percent of the cases, and 9.3 percent were convicted of such offenses. Property crimes without conviction were reported for 23.3 percent, and 16 percent were convicted of such crimes. The largest percentage of revocations for criminal behaviors involved drug abuse (39.6 percent), while 9.3 percent were convicted of new drug offenses.
For a little over half the county sample, this was not the first time that the offender's behavior had elicited a system response (see Table 3). Of the 407 cases, 51.6 percent had experienced at least one formal hearing prior to the hearing that resulted in revocation. For 15.5 percent of these two such hearings were recorded, and 10.7 percent had experienced between three and eight prior hearings.
Of the 592 prior hearings recorded for this group, 68.1 percent had resulted in increased supervision conditions, for 2.2 percent conditions were reduced, while in 27 percent there was no change. Increased supervision conditions were much more common for probation cases (81.4 percent) than parole (47.9 percent).
Most significantly, new sanctions were imposed for only 30 percent of all revoked cases in the sample prior to revocation. Most of these are probation-only cases, of which 50 percent experienced at least one sanction. In only 10 percent of parole-only cases were any new sanctions imposed.
In 81.3 percent of all sample cases in which any kind of sanction was imposed for a pre-revocation behavior, that sanction was jail. Other available sanctions were rarely used (see Table 5): only 3 percent of the revoked sample received community service orders as a sanction for pre-revocation behavior; 2 percent were given work release and/or referral to a community corrections center; no cases experienced application of a curfew; and in only one case was home custody or electronic monitoring applied. Urine/blood/polygraph testing was used in 6.8 percent of the cases as a response to pre-revocation behavior, but this low
- 9-
rate probably reflects the fact that a large percentage of the sample cases already had such testing as a supervision condition.
Looking only at the total of 164 probationers sentenced under sentencing guidelines and revoked, thirty-one of these cases appeared to have had no custody units assigned at sentencing. Of the remaining 133 cases, 69.9 percent received a ceiling of 90/309 but had an average of only sixty-one days imposed; 24.8 percent were assigned a ceiling of 120/60 but had an average of ninety days imposed; and 13.5 percent received a ceiling of 180/90 but had an average of 137 days imposed. This suggests that revocation to prison is ordered for many cases in which local custody units are still available.
study Findings: Do counties vary in rates of prison admissions from community supervision? If so, can this variation be explained by differences in offender populations or in system responses to violation behaviors?
Rates of revocation vary widely among the counties, but few patterns emerge that would reliably explain the differences observed. Percentages of parolees in the general supervision population (and associated average risk score) seem to bear some relationship to revocation rate, although the trend is not consistent across all jurisdictions. Other factors that might be expected to influence revocation rates, including new crime convictions, incidence of substance abuse, resource ratelO
, and percentage of the supervision population more than 60 percent employed, show no clear relationships.
Looking at the data for all counties (Table 6), Umatilla County has one of the lowest revocation rates (.59), but resource rate, percentage of the revoked population with new crime convictions, and most characteristics of the general supervision population (e.g., average risk score, percentage employed more than 60 percent, abscond rate) are not far from the norm. Only the proportion of the general supervision population on parole (14 percent) stands out as much lower than average for the counties as a whole.
Klamath County, however, shows the same percentage of parolees in the supervision population as Umatilla County but a much higher revocation rate (1.02). Klamath County also shows a higher abscond rate (26.6 percent versus 22.4 percent) and a higher percentage of cases under supervision for person offenses (17.1 percent versus 15.5 percent) than Umatilla County, thou5~1 not far from the statewide average. Resource rate, percentage
9
10
The first number represents the maximum number of custody units may be imposed; the second is the maximum number of jail d~ys.
A rough estimate of resource rate. for each county was obtained by dividing the 1991 total number of slots in tp~tment and sanction programs funded under the Community Correctionii Act by the number of felony offenders supervised.
- 10-

revoked for new crimes, and percentage of felons in the general supervision population are all lower in Klamath than in Umatilla County, and lower than the average for all counties.
At the other end of the spectrum, Marion County has one of the highest revocation rates (1.83) and much larger than average percentages of parolees (34.9 percent) and high-risk cases (36 percent) in the general supervision population. Higher than average percentages of parolees also are found for Lane (30.6 percent) and Multnomah (29.9 percent) counties, where percentages of high-risk cases are similar (31.6 and 31.9, respectively), though lower than Marion County, and average risk scores are identical (7.4) and less serious than in Marion County (7.1). Revocation rates for Lane (1.52) and Multnomah (1.61) are lower than in Marion County but higher than the statewide average. Resource rates are similar for Marion (.92) and Lane (.97) counties and considerably higher, though not far from the statewide average, in Multnomah County (1.52).
One of the highest resource rates (3.32) is found for Douglas County, which shows a moderate revocation rate of 1.16. Douglas County has lower than average percentages of parolees (20.8 percent) and high-risk cases (18.4 percent), and a very low percentage of revocations for new crimes (13.4 percent). With the same revocation rate, Washington County has a similar percentage of parolees in the supervision population (19 percent), but a lower percentage of high-risk cases (24.5 percent) and a less serious average risk score (7.9). Percentage of revocations for new crime convictions is much higher in Washington (35.4 percent) than in Douglas County and the resource rate is considerably lower (1.80), though higher than the statewide average.
Data from case files on the sample population in selected counties (Table 7) also show few clear trends that might explain the wide variation in revocation rates. The most unusual profile emerges for Umatilla County, which also had the lowest rate of revocation. The revoked population in this county is heavily weighted toward the supervision status of probation only (61.8 percent), with a much lower percentage of prior supervisions (23.5 percent) and a lower average risk (5.6) than other counties in the sample, but much higher percentages of cases under supervision for crimes against persons (32.4 percent) and with more than one year under supervision (67.7 percent).
Umatilla County also shows much higher percentages for the supervision conditions of electronic monitoring/home custody (rarely used in other counties), community service, sex offender and mental health treatment, and financial obligations. Jail was imposed as a supervision condition in this county no more often than the norm. However, jail was imposed in 100 percent of documented violations for which any sanction was ordered prior to revocation, although a relatively high percentage of prior violations (26.5 percent) were technical only. Umatilla County also had an exceptionally small percentage of cases in which there were no violations prior to revocation (8.8 percent) and a higher than average percentage of cases in which prior violations resulted in more than one sanction (77.8 percent).
- 11 -

Marion County, with the highest revocation rate of the sample counties and the second highest percentage of cases under supervision for crimes against persons (25.7 percent), shows the lowest use of jail as a supervision condition (19.5 percent), the highest use of work release (a condition rarely used in other sample counties except Multnomah), and the second highest use of sex offender treatment (14.9 percent). In Marion County also, jail was less often used as a sanction for -violations prior to revocation, although other sanctions were imposed more often than in other counties. The only other area in which this county differs markedly from the norm is in the high percentage of revocations with no prior violations (40.2 percent).
study Findings: Taking into consideration offender characteristics and behaviors, public safety issues, and available resources, is the number of revocations to prison appropriate?
Although this was among the questions it was hoped the study would be able to address, the data provide no easy answer. Study findings suggest that decisions to revoke are not made capriciously or without due cause: revoked offenders differ from those in the general supervision population on a number of characteristics reflecting criminal history and behavior. However, the study was not designed to assess the extent to which public safety has been protected by incarcerating these offenders and thus whether their incarceratjon was justifiable or "appropriate." .z'
Part of the problem is that the definition of appropriateness--and even of public safety--will vary with agency mission and societal ,expectations, as well as with changes in the overall level and kinds of resources a jurisdiction is able and willing to commit to offender management. In times of scarce and diminishing resources, the balance between public safety and the costs associated with assuring it may shift in the direction of higher tolerance for certain kinds of offender behavior, including new crime. When resources are plentiful, that tolerance level may decline.
Assessing the appropriateness of revocations to prison thus requires not only an estimation of what might have occurred if those cases had not been revoked (by comparing revocations with supervision violators continued under supervision, for example) but judgments of the acceptability of those outcWJmes in light of the costs of obtaining them. Assessments of the appropriateness of !"f.s;5ource use cannot be made once and then forgotten. Purposeful management of populations and costs requires continual adjustments in policy and practice to achieve acceptable outcomes with available resources.
Given the drastically shrinking pool of correctional resources, then, are revocation rates too high? Could more probation and parole violators be continued under community supervision without jeopardizing public safety? The wide variation in revocation rates suggests that some countie;~ are finding it possible to accommodate the continued presence of some supervision violators. However, it is not clear whether such jurisdictions have lower
- 12-
rates of violation, less serious violation behaviors, a better match between treatment programs and offender needs, or a more complete array of local sanctions.
This study provided considerable information on probation and parole violators revoked to prison but little about their counterparts continued under supervision. -Longitudinal comparisons of these two groups (including offender characteristics and behaviors, the nature of supervision violations, the sanctions, services, and casework actions associated with each case, and outcome measures) would provide one basis for determining whether revocation rates are "too high." Other elements of the equation would include assessments of public and official tolerance of outcomes associated with the decision not to revoke and the availability and relative costs of alternative sanctions and services sufficient to produce those outcomes.
POLICY IMPUCATIONS AND DATA NEEDS
What other data are needed to answer policy-related' questions raised by study findings? What changes in policy and practice might be made now, with existing information, to allow better control of the size and characteristics of the revocation population?
Information in a number of areas would be useful in clarifying the reasons behind the large numbers of admissions to prison from community supervision. These include: the specific nature and seriousness of violation behaviors and system responses to them; any other differences between revoked and non-revoked supervision violators that might explain why some offenders are sent to prison and others are not or why some counties have much lower revocation rates than others; the availability of intermediate sanctions and services at the local level, including kinds, capacities, and rates of use; and the extent to which these resources are applied successfully in cases where violators are continued under supervision. Such information could provide a foundation for efforts to reduce the size of the revocation population statewide,u
It also will be important to continue to monitor the impacts of recent changes in policy and practice that may dramatically alter probation and parole populations and revocation rates. Initial studies of the state's sentencing guidelines, in place since 1989, suggest that the mix of offenders sent to prison now includes a larger percentage of crimes against persons and fewer drug offenses, with consequent impacts on probation and parole
11 The Department of Corrections' Directory of Correctional Services, is a step in this direction, although self-reporting by counties has meant that information is incomplete. The Integrated Supervision Information System (ISIS), being implemented in 1992-93, will automate information on programs, offenders, and outcomes in a database format that will yield information on program effectiveness with different offender populations.
- 13 -
------- --

populations.12 The average probation term, at 24 months in 1991, is half as long as it was before implementation of sentencing guidelines, and shorter terms may affect rates of revocation by reducing time under supervision.
Intervention guidelines recently developed by the Board of Parole and Post-Prison . Supervision and now being piloted around the state also are likely to impact parole revocation rates. Along with these guidelines, authority has been given to administrative hearings officers and staff at the line level to impose community-based sanctions for some supervision violations without referring the case to the parole board. The expectation is that the use of intermediate sanctions will short-circuit the process that leads to prison admission, while also reducing delays and costs associated with violation hearings.
Other policy changes have been implemented or are being considered to accommodate budget cuts that may follow from Measure 5. In March 1992 the parole board reduced the length of parole revocation sanctions from 180 to ninety days for new crime convictions or criminal beh~viors and from ninety to sixty days for technical violations. This is expected to impact both prison and parole populations and likely will require increased local services and sanctions to maintain these offenders in the community. Other policy changes under consideration also could affect revocation rates by increasing the proportions of higher risk offenders under community supervision while reducing the length of revocation sanctions ana restricting the offender classes to which they are appIiedP
Several findings of the present study suggest additional areas for policy changes to directly impact revocation rates. Foremost among these is the fact that over 70 percent of the revoked population is sent to prison without having experienced an intermediate sanction in response to violation behavior. For the vast majority (81.3 percent) of those who receive any sanction, that sanction is jail; other sanctions are seldom used. Also, whi)e most revoked offenders show a combination of behaviors that includes criminal activity of som~ kind, 16 percent are revoked for technical violations only.
The wide variation in county rates of revocation and resource use strongly suggests the need for state policy, incentives, and guidelines to promote wider and more consistent use of intermediate sanctions. But it would be a mistake to assume that revocations necessarily will decline if alternative sanctions are made more available and their use is encouraged, or that reducing revocations will have no negative impacts on the rest of the correctional system. In a system as complex as criminal justice and corrections, it is critical that proposed policy changes in anyone area be seen in the larger context and that goals for the entire system be kept constantly in mind.
12
13
Second lear Rt'pon on Implementation of Sentencing Guidelines, 1991.
Department of Corrections, Impact of Policy Considerations to Reduce Offender Workload for Ballot Measure 5 Reductions, April 1992.
- 14-

The implications for Oregon at this juncture are twofold. First, efforts to promote alternatives to revocation should be undertaken with a goal of protecting public safety while controlling resource use and costs system··wide. Second, any policy changes should be accompanied by comprehensive efforts to articulate, communicate, and convince decision makers at all levels--from line staff to legislators--to buy into the idea that prioritizing is essential when resources are scarce. Decades of experience nationwide have shown that the best intentions can be subverted when the agendas of decision makers do not coincide, and that resolving problems at one point in the system can create equally serious problems at another. Controlling prison populations may overload jails, and the ready availability of intermediate sanctions and alternatives to official processing may increase overall costs by ''widening the net." This does 110t mean that the system is beyond control; indeed, populations and workloads are highly sensitive to changes in policy and practice. The difficulty is in obtaining those--and only those--results that are intended.
Given these caveats, there would seem to be two primary ways in which revocations to prison may be reduced. The first concentrates on offender characteristics and behaviors, with a goal of reducing violations. The second focuses on system responses, with a goal of reducing revocations for violation behaviors.
Reducing Violations
Available information and experience suggest several approaches to reducing supervision violations, including offering the kinds of practical assistance and services most needed by offenders and providing real deterrents to violation behavior. Deterrence is evident in both the state-level Parole Violators Project and the DROP (Drug Reduction of Probationers) program for drug abusers in use in many counties. DROP provides for immediate arrest and well defined terms of jail detention, along with drug treatment, for offenders who test positive on random urinalysis. The Parole Violators Project adopts a lower tolerance for violations for selected parolees and revokes violators to prison programs with stringent rules and few privileges.14 Both of these programs have demonstrated the deterrent effects of "swift and certain" sanctions for violation behaviors.
Down-playing the emphasis on surveillance and providing more practical assistance to probationers and parolees may be another means of reducing supervision violations. Some elements of this are evident in the transition services now being provided to some Oregon prison inmates ninety to 120 days prior to parole, with a focus on increasing the continuity of service and arranging for post-release housing and employment.
14 Department of Corrections, Information Systems Division, Evaluation of First Phase of Parole Violators Project, March 1991.
- 15 -

Illinois has taken this approach several steps further with its Pre-start program, which limits surveillance following release and provides pre-release training and voluntary post-release services. Inmates go through a thirty-hour pre-release curriculum centered around such pragmatic matters as dealing with the effects of incarceration and finding a job. With the assistance of community services officers, they also learn to take responsibility for their own lives and set specific goals for the first week, month, six months, and two years of living on the outside. Once released, parolees are required only to fulfill legal reporting requirements, but they may opt to take advantage of a range of advocacy and referral services offered by community service centers. The number of offenders electing to use these voluntary services suggests that they are meeting a real demand: participation rates are three times as high as the 10 percent anticipated for the program.
The shift from surveillance to voluntary services is an important one, with implications for efforts to reduce supervision violations. High rates of substance abuse, mental health, and other problems among revoked offenders in this study suggest high needs for services or treatment, but treatment failure was a source of revocation for more than half this population. As long as treatment is required as a condition of supervision, and failure in treatment can lead to revocation, programs and services aimed at reducing crime by treating underlying conditions actually may compound the problem by treating the conditions themselves as crimes.
It is tempting to conclude from the characteristics of revoked offenders that more treatment programs are needed, but, provided within a framework of surveillance and sanctions, such programs may increase, not reduce, the number of violations. The goal of reducing some kinds of violations may be more effectively met by redefining violation behaviors than by attempting to change them.
Reducing Revocations
If revocation to prison is to be used less often as a sanction for probation and parole violations, it is clear that intermediate sanctions must be more widely available. Expanding the use of intermediate sanctions while reducing overall costs will require some reallocation of resources to higher risk cases throughout the corrections system. As prisons increasingly are' reserved for the most serious and intractable offenders, felony probation and parole populations will contain more individuals needing higher levels of service and more restrictive and more costly sanctions. Additional funding may be required to manage this higher risk population in the community, but as state and local budgets contract, some portion of the resources now allocated to low-risk offenders will need to be redirected.
In addition to the availability of a range of intermediate sanctions, there must be fiscal incentives and/or statewide policies and procedures that promote their use. Fiscal incentives are a common mechanism for promoting change at the local level, and they may
- 16-
be necessary if alternative means of reducing revocations are unsuccessful. However, experience with payback requirements for Class C felony commitments has suggested that fiscal penalties unfairly burden those counties that, for various reasons beyond their control, have more high-risk offenders under their jurisdiction. Although fiscal and other incentives certainly should be considered, it may be difficult to design mechanisms that equitably distribute responsibilities for reducing revocations statewide. IS
Among the most promising proposals for reducing revocations to prison, increasing the use of intermediate sanctions, and encouraging reallocation of correctional resources is the development of intervention guidelines for probation violations similar to those being tested for parole. Following the model of both parole intervention and sentencing guidelines, probation guidelines would establish sanctioning ranges based on a combination of violation seriousness and offender risk. Within those ranges, sanctions would be tailored to individual offenders and available resources.
Guidelines not only contribute equity and predictability to decision making, but allow policy makers greater control over resource use and thus enhanced ability to cut costs in times of shrinking budgets. Sentencing guidelines and parole intervention guidelines both increase state-level policy control around the issue of who will be incarcerated in state prisons. The missing element is control over responses to probation violations, and this is the area in which revocation rates are still rising.
There are a number of ways in which intervention guidelines for probation could be implemented, including statutorily approved guidelines applied by the courts (as occurs at sentencing) and policy-level guidelines applied within an administrative hearings process (as for parole) under the direction of the parole board and/or state' corrections. Probation guidelines applied by the courts may provide more stringent due process protection and more predictable control over prison populations, but this approach does not address the high costs of violation hearings or the issue of delays between violation behavior and system response. Guidelines applied by field staff and administrative hearings officers may allow swifter and more certain responses to violations, as well as more direct control over the use of correctional resources, but overall system costs may rise if intermediate sanctions and the hearings process are overused.
South Carolina has had considerable success with probation and parole revocation guidelines applied both at the line level and by administrative hearings officers. According to corrections officials in that state, not only do field staff feel that they have more control over outcome in cases they supervise, but formerly crowded prisons have empty beds for the first time in ten years and judicial hearings for supervision violations have been cut by one-third in some jurisdictions. One key to success reportedly has been intensive training
15 Percentage reductions in revocations are one possibility, but these may penalize juriSdictions with already low revocation rates.
- 17-

---~-~-----
for line staff and supervisors in case management and risk control, along with the development of policies and procedures for staffing cases in which violations occur. Both training and procedures stress use of the least restrictive (and lowest cost) sanction that can safely be applied and reliance on the hearings process only for the most serious cases and those that have failed under sanctions applied at the line level.
However probation intervention guidelines are implemented, they will result in substantially fewer revocations to prison only if judicial and correctional decision makers (and the public) are confident that violators can be managed successfully in the community. Where effective alternatives do not exist, or where policy and procedure or budgets do not facilitate their use with these offenders, guidelines will not be consistently followed.
The development of intervention guidelines for probation will need to be accompanied by increased investments in, and evaluation of, those intermediate sanctions known or believed to be most effective with higher risk offenders. Currently under-used sanctions that can serve as alternatives to prison include electronic monitoring and home custody, probation centers with work release, and day reporting or intensive supervision programs. Studies of intensive supervision have shown that programs in which offenders are more closely monitored often are associated with an increase in violation behaviors, especially technical violations, and also with an increase in revocations.16 If such programs are to reduce revocations to prison, their use must be accompanied by policy that restricts the use of incarceration to the most serious violations, as well as by broad-based training and education to ensure that policies and procedures are followed.
Detention centers are an emerging alternative to prison for supervision violators who cannot be managed in the community. Georgia has had success with its state-run probation detention centers, which serve as front-end custodial sanctions for probationers as well as revocation centers for probation violators. These minimum-security residential facilities combine daily work detail under supervision with evening programming that includes substance abuse treatment, education, and training in life skills. These centers are part of a continuum of sanctions, from community service through intensive supervision to military-style boot camp for younger offenders. Georgia waited until a full range of local
16 RAND, Evaluating Intensive Supervision Probation/Parole (ISP): Results of a Nationwide Experiment, working draft, Santa Monica, california, August 1992. The researchers concluded that ISP, as well as other intermediate sanctions such as boot camps, electronic monitoring, house arrest, and day fine centers cannot be expected to reduce prison crowding or overall system costs, but nonetheless may be worthwhile first steps toward creating a more comprehensive and graduated sentencing structure that matches punishments to crimes.
- 18-
alternatives was in place, and then passed state legislation banning revocation to prison for technical violations.17
If custody-oriented local sanctions such as these are to be used to any significant extent, there may need to be statutory and/or policy changes governing the assignment and use of custody units for probationers sentenced under sentencing guidelines. However, further study of this ar~a is needed before any policy changes are considered. There is a widely held perception that judges tend to impose all custody units up front, rather than reserving some portion for violations, and that this leaves no alternative to prison when violations occur. Yet the findings of this study show that in many cases assigned custody units have not been fully used at the time of revocation. The reasons for this are not clear: Are jails overcrowded? Are alternative sanctions unavailable? Are judges unconvinced .of the effectiveness bf those sanctions that exist? And would raising the ceilings on custody units, or mandating that some portion of the total be reserved, have any effect on the number of revocations? .
The issue of custody units highlights the need for good information, for education of decision makers, and for a system-wide approach to policy change in any area of criminal justice and corrections. In the absence of information on how and why custody units are used, any changes in ceilings or in units reserved for violations may have wholly unintended effects. Without planning from a system-wide perspective, those effects likely would extend to both prisons and jails. And lacking the support of prosecutors and judges, policy changes around custody units may have no effects at all.
Changing custody units without looking at other elements of the state's sentencing guidelines could result in an imbalance in the relative severity of sanctions for presumptive prison and presumptive probation cases, with prison sentences becoming less onerous than more uncertain and possibly longer tenns under probation. Raising ceilings without modifying the ways in which custody units are used could have no effects if judges chose to ignore the increase, or could lead to jail crowding if they chose to use the new custody units made available. As is true for the rest of the corrections and criminal justice system, policy changes in this area must be comprehensively planned, based on good information, and supported by those whose decisions and actions will largely determine their success.
17 Technical violators subsequently can be revoked if they violate regulations of alternative programs.
- 19-

Table 1 Revocation Rate, Average Monthly Caseload, and Numbers Revoked
Felony Probation and Parole, 1987-91 -
PAROLE
Total Institutional % Rev. # Rev. Avg Admits Avg Monthly Percent A vg Monthly Percent
Year Admits Return Admits per Month Case10ad Return Intake Return
1987 3,959 36.4% 1,441 120 1,660 7.2% 247 48.5%
1990 5,802 43.7% 2,535 211 4,589 4.6% 458 45.8%
1991 6,091 43.7% 2,659 222 5,996 3.7% 478 46.4%
Change 53.9% 7.3% 84.5% 261.2% -3.5% 93.5% -2.l%
FELONY PROBATION
Total Institutional % Rev. # Rev. Avg Admits Avg Monthly Percent Avg Monthly Percent
Year Admits Return Admits per Month Case10ad Return Intake Return
1987 3,959 25.3% 1,001 83 13,606 0.60% 503 16.5%
1990 5,802 29.5% 1,710 143 17,282 0.83% 664 21.5%
1991 6,091 36.7% 2,238 187 18,540 1.00% 640 29.2%
Change 53.9% 11.4% 123.6% 36.3% 0.4% 27.2% 12.7%

Table 2 Selected Characteristics of Total Population under Community Supervision, 1991
Admissions to Prison from Felony Probation and Parole, July-December 1991·
General Revoked General Revoked Ponulation Ponulation Ponulation Ponulation
Race Supervision Offense Caucasian 83% 75% Sex offense 4.8% Black 8% 15% Felony Class A 16.1% Hispanic 6% 7% Felony Class B 16.5% Other 2% 3% Felony Class C 67.2%
Age 18-25 20.9% 31.0% Supervision Offense (Forecast Model) a Group A 0.17%
Gender GroupB 1.70% Male 81.0% 89.6% GroupC 9.20% Female 19.0% 10.4% GroupD 0.90%
GroupE 1.30% Average Risk GroupF 33.70%
Mean 7.6 5.8 GroupG 14.50% Median 8.0 6.0 GroupH 7.40% Parole 4.9 4.0 Group I 28.60% Probation 8.7 7.6 GroupJ 3.30%
High Risk 28.4% 58.7% Supervision Conditions Jail 27.9%
Parolees 26.5% 56.1% Alcohol/Drug Treatment 44.3% Sex Offender Treatment 2.3%
Prior History Mental Health Treatment 15.3% No convictions 58.7% 32.4% Community Service 12.8% 1 conviction 15.1% 17.3% Urinelblood/poly 59.2% 2+ convictions 26.3% 50.2% Financial 65.3% No incarcerations * 67.3% 41.2% 1-2 incarcerations 23.4% 33.4% Nwnber of Conditions 3+ incarcerations 9.3% 25.4% 0-1 29.3%
2-3 50.3% Supervision Crime Type 4+ 21.4%
Person 19.4% 23.9% Property 40.5% 47.8% Behavioral Issues Behavioral 40.1% 28.2% > 60% employed 56.5%
Substance abuse 34.0% Abscond 25.9%
Notes:
* Incal'Cerations of more than 90 days.
a Forecast model groupings were created 10 indicate length of stay in prison and do not reflect progressive seriousness. Groups A·E by law
must serve full sentences when certain circumstances exist; Group F (reclass) includes crimes that may be subject to legislative action to
reduce severity; Groups G·] include all others. Group C includes Kidnapping I. Burglary I. and Robbery I; Group I includes all drug crimes.
7.3% 24.3% 16.2% 59.4%
0.10% 1.90%
17.60% 1.20% 1.70%
29.30% 16.80%
8.60% 19.40%
3.30%
27.8% 72.9% 4.8%
22.8% 8.9%
86.3% 57.1%
13.1% 56.1% 30.8%
28.1% 66.8% 37.9%

Table 3 Profile of County Sample
Data provided by DOC Research: 6 July 1992 Percentages of subgroups (status, gender, etc.) are printed in boldface where intergroup differences are statistically significant at p < .05.
Total Su ervision Status Gender rusk Score In field More than Sample Parole Probation Parole + Probati nl Male 1 Female I Absconders I High I Medium k 7 months 1 offense
Overall Number 407 163 145 99 357 50 206 239 98 138 265 Supervision Status
Parole Only 40.0% 100.0% 40.6% 36.0% 33.5% 38.5% 37.8% 56.5% 39.6% Probation Only 35.6% 100.0% 34.5% 44.0% 38.3% 27.2% 51.0% 21.0% 23.4% Parole + Probation 24.3% 100.0% 21.9% 20.0% 28.2% 34.2% 11.2% 22.5% 37.0%
Crime Type Person-Person 20.5% 28.5% 15.9% 14.1% 22.1% 10.0% 13.1% 14.2% 25.5% 20.8% 15.1% Property 54.8% 52.8% 44.8% 72.7% 54;6% 56.0% 62.1% 63.2% 39.8% 55.1% 65.7% Statute 23.6% 17.2% 37.9% 13.1% 22.4% 32.0% 23.8% 22.2% 31.6% 23.9% 19.2%
Time Supervised 0-6 months 33.9% 47.9% 20.0% 31.3% 33.6% 36.0% 32.0% 37.2% 26.5% 100.0% 34.7% 7-12 months 27.8% 25.1% 26.2% 34.3% 26.9% 34.0% 28.6% 28.9% 26.5% 27.5% 13 months or more 38.3% 27.0% 53.8% 34.6% 39.5% 30.0% 39.3% 33.9% 46.9% 37.7%
Supervision Conditions ElectroniclHome Arrest 1.2% 0.0% 2.8% 1.0% 1.1% 2.0% 1.5% 0.8% 1.0% 0.0% 1.1% Jail 32.4% 3.7% 55.2% 46.5% 32.5% 32.0% 35.9% 33.5% 37.8% 23.9% 33.6% DROP Program 1.7% 0.6% 2.8% 2.0% 1.7% 2.0% 1.5% 1.7% 1.0% 0.0% 1.9% Work Release 3.9% 0.0% 8.3% 4.0% 4.2% 2.0% 5.3% 1.7% 7.1% 1.4% 3.4% UAlBloodIPolygr Tests 81.3% 77.9% 77.2% 92.9% 80.7% 86.0% 81.1% 85.4% 78.6% 84.1% 85.7% Community Service 16.2% 0.0% 34.5% 16.2% 14.8% 26.0% 16.5% 17.2% 14.3% 5.1% 15.5% Sex Offender Treatment 7.6% 9.8% 10.3% 0.0% 8.7% 0.0% 3.9% 1.7% 13.3% 7.2% 3.0% AlcoholJD.rug Treatment 80.3% 75.5% 78.6% 90.9% 78.7% 92.0% 85.4% 85.8~~ 72.4% 78.3% 83.4% Mental Health Treatment 14.7% 18.4% 11.0% 14.1% 15.4% 10.0% 10.2% 12.1% 17.4% 20.3% 14.0% Financial Obligation 66.3% 31.9% 91.7% 85.8% 67.5% 58.0% 69.9% 66.5% 70.4% 47.8% 69.4%
Prior Supervisions % with previous ProbationlParole 58.7% 75.5% 23.4% 82.8% 57.7% 66.0% 57.8% 66.1% 44.9% 77.5% 64.4% Avg # of previous supervisions 2.4 2.6 1.2 2.5 2.4 2.2 2.4 2.6 1.8 2.6 2.5
Current Offenses % with more than 1 active offense 65.1% 64.4% 42.8% 98.9% 66.1% 58.0% 68.9% 76.2% 48.0% 66.7% 100.0% Avg # offenses if> 1 3.7 3.4 3.2 4.3 3.6 3.9 3.6 4.0 3.3 3.5 3.7 % with new probations, this cycle 28.3% 11.0% 35.9% 45.5% 29.4% 20.0% 29.6% 32.6% 22.4% 16.7% 37.7%

~'''''.--<::";"''')- '''' _" - •• -." - .. ',~,;:~ ,.., ,,'., ">_~.', ',,'0>, ""'~ .' .",' .• ",' .. '." '''';~ ,", ",',." ~_''''''' ,~ .... ~
Table 3 (continued) Data provided by DOC Research: 6 July 1992
Percentages of subgroups (status, gender, etc.) are printed in boldface where intergroup differences are statistically significant at p < .05.
Total Su ervision Status Gender Risk Score In field More than Sample Parole Probation Parole + Probatio Male I Female I Absconders I High I Medium I< 7 months 1 offense
Overall Number 407 163 145 99 357 50 206 239 98 138 265 Reason for Revocation
Technical Only 16.2% 14.7% 22.1% 10.1% 16.2% 16.0% 22.3% 12.6% 12.2% 15.2% 12.5% Criminal Behavior 3.2% 5.5% 1.4% 2.0% 3.6% 0.0% 0.0% 3.3% 3.1% 3.6% 3.8% New Conviction Only 2.9% 2.9% 3.1% 2.8% 3.0% 2.0% 0.0% 2.9% 4.1% 4.3% 3.0% Combination 77.4% 76.7% 73.1% 84.9% 76.8% 82.0% 77.7% 81.2% 80.0% 76.8% 80.8%
Behi:!vior Issues Substance Abuse 61.7% 62.6% 56.6% 67.7% 59.9% 74.0% 59.2% 65.3% 59.2% 62.3% 63.8% Employment < 60% * 89.7% 90.2% 87.3% 92.5% 88.7% 97.1% 93.7% 92.5% 87.8% 92.6% 91.2%
Average Risk Score 5.1 4.9 6.5 3.5 5.2 4.9 4.9 3.5 7.7 4.6 4.4 Hearings before Revocation
% with any hearing 51.6% 43.6% 59.3% 53.5% 51.5% 52.0% 53.4% 54.0% 53.1% 68.1% 53.6% % hearings with increased conditions 0 68.10/0 47.9% 81.4% 73.6% 67.9% 69.2% 62.2% 69.0% 75.0% 56.8% 64.1% A vg # hearings IJ 1.9 1.6 2.1 1.9 1.9 1.6 1.9 1.9 1.9 1.3 1.3
Sanctions Imposed Number with any sanction 123 17 ( 10% ) 72 ( 50% ) 34 ( 34% ) III 12 64 77 30 21 81 Percent with Jail IJ 81.3% 58.8% 88.9% 76.5% 79.3% 100.0% 79.7% 81.8% 80.0% 52.4% 81.5% Percent with any other IJ 35.0% 47.1% 34.7% 29.4% 87.8% 8.3% 42.2% 35.1% 40.0% 47.6% 48.3% Percent with> 1 sanction IJ 38.1% 17.7% 52.8% 17.7% 38.7% 33.3% 40.6% 37.7% 46.7% 19.0% 35.8%
Violations before Revocation Technical Only 14.0% 17.2% 13.1% 10.1% 13.2% 20.0% 15.5% 12.6% 12.2% 10.9% 11.7% Criminal Behavior Only 6.1% 5.5% 6.2% 7.1% 6.4% 4.0% 3.4% 6.3% 10.2% 5.1% 5.3% New COllviction Only 1.7% 1.8% 0.7% 3.0% 1.7% 2.0% 1.0% 1.7% 2.0% 0.7% 2.3% Combination 46.7% 39.9% 53.1% 48.5% 46.8% 46.0% 47.6% 50.2% 48.0% 30.4% 32.5% None Cited 31.5% 35.6% 26.9% 31.3% 31.9% 28.0% 32.5% 29.2% 27.6% 52.1% 32.5%
Support Services Provided Percent receiving any service 41.5% 46.6% 31.3% 49.5% 42.9% 32.0% 43.2% 47.3% 38.8% 44.2% 42.3%
Notes: * Percent of cases where employment could be determined (126 were missing)
IJ Percent of cases only where hearings occurred or any sanction was imposed.

Table 4
Revocation Violations and Treatment Status at Revocation
Revocation Violation
Technical Fail treatment Fail to complete sanction Fail fmancial obligation Alcohol abuse Abscond Failure to comply
1-2 violations 3-6 violations
Criminal behavior Person offense Property offense Drug offense Other
1 violation 2-4 violations
Criminal Conviction Person offense Property offense Drug offense Other
1 violation 2-4 violations
County Sample
Share of Sample Cases
89.9% 52.1% 11.3% 21.4% 23.6% 50.6% 45.2%
56.8% 33.1%
71.0% 16.0% 23.3% 39.6% 18.7%
48.2% 22.9%
37.1% 9.3%
16.0% 9.3%
11.5%
29.5% 7.6%
Share of Treatment Status at Revocation Sample Cases
Supervision conditions/not referred Sex offender 12.9% Substance abuse 17.7% Mental Health 23.3%
Failing treatment at revocation Sex offender 56.7% Substance abuse 73.9% Mental Health 58.8%
----- ----------

Table 5 Pre-revocation Sanctions & Services and Custody Units Imposed
County Sample
Percent of Sanctions for Violations Sample Cases
Jail 24.6% I sanction 18.7% 2 sanctions 8.4% 3+ sanctions 2.3%
Probation center/work release 2.0% Electronic monitoringlhome custody 0.2% Curfew 0.0% Community service 3.0% Urine/blood/poly 6.8%
Percent of Staff Responses to Problem Behavior Sample Cases
Informal curfewlhome restrictions 0.5% Increased verification requirements 11.3% Informal urinelblood/poly requirements 8.4% Informal community service requirements 0.2% Cite to appear for hearings 4.9% Placement in DROP program 3.3% Arrest for (non-DROP) 'custody 9.3% Increase supervision level 29.2% Submit violation report 58.0%
Percent of Support Services Provided Sample Cases
Food 8.6% Child care 0.7% Housing 19.2% Transportation 9.3% Employment 19.2% Education 2.2% Other 15.5%
Average Percent of Time (days)
Custody Unit Category Guideline Cases * Imposed
90/30 69.9% 61 120/60 24.8% 90 180/90 13.5% 137
Note: * Total is greater than 100 percent because some probationers had more than one guideline offense.

County
------=--- --~~ - ---
Table 6 Revocation Rate, Resource Rate, and Supervision Population Characteristics
By County (OPS data, 1991)
Revoke Rate
Resource Rate
Cases {ttl
Felons (%)
Parolees
00 Average
Risk % High su~ervision Crime Behavioral Issues Revoke Pop
Risk I Person Property I Behavior 11>60% Empl Drugs I Abscond fro New Crime
Average 1.34 1.57 2,073 71.1% 26.5% 7.6 28.4% 19.4% 40.5% 40.1% 56.5 34.1 25.9 35.2%

Table 7 Profile of County Sample, by County
Total Counties Sample I Coos Douglas Jackson I Marion I Multnomah I Umatilla]
Overall Number 407 45 41 56 87 138 34 Supervision Status
Parole Only 40.0% 51.1% 36.6% 37.5% 44.6% 38.4% 29.4% Probation Only 35.6% 22.2% 48.8% 37.5% 35.6% 29.7% 61.8% Parole + Probation 24.3% 26.7% 14.6% 25.0% 19.5% 31.9% 8.8%
Crime Type Person-Person 20.6% 17.8% 14.6% 15.1% 28.7% 17.4% 32.4% Property 54.8% 62.2% 51.2% 55.4% 49.4% 54.3% 61.8% Statute 23.6% 20.2% 34.2% 25.0% 20.7% 27.5% 6.9%
Time Supervised 0-6+ months 33.9% 25.6% 43.9% 44.6% 34.5% 31.2% 8.8% 7-12+ months 27.8% 22.2% 31.7% 23.2% 25.3% 33.3% 23.5% 13 months or more 38.3% 42.2% 24.4% 32.1% 40.2% 35.5% 67.7%
Supervision Conditions ElectroniclHome Arrest 1.2% 0.0% 0.0% 1.8% 1.2% 0.0% 6.9% Jail 32.4% 42.2% 46.3% 50.0% 19.2% 26.1% 35.3% DROP Program 1.7% 11.1% 0.0% 1.8% 1.2% 0.0% 0.0% Work Release 3.9% 0.0% 2.4% 0.0% 8.1% 5.1% 0.0% UAIBloodIPolygraph Tests 81.3% 86.7% 73.2% 85.7% 74.7% 85.5% 76.5% Community Service 16.2% 4.4% 9.8% 12.5% 12.6% 15.9% 50.0% Sex Offender Treatment 7.6% 4.4% 4.9% 3.6% 14.9% 2.2% 26.5% AlcohollDrug Treatment 80.3% 86.7% 82.9% 87.5% 74.7% 84.1% 58.8% Mental Health Treatment 14.7% 13.3% 7.3% 19.6% 12.6% 13.8% 23.6% Financial Obligation 66.3% 73.3% ,,6.1% 64.3% 63.2% 65.2% 85.3%
Prior Supervisions % with previous Probation or Parole 53.8% 68.9% 46.3% 50.0% 56.3% 52.6% 23.5% Avernge Nwnber of Previous Supervisions 2.4 2.6 1.9 2.0 2.8 2:8 1.8
Current Offenses % with> 1 active offenses 65.1% 62.2% 48.8% 57.1% 66.7% 73.2% 52.9% Average # if> 1 offenses 3.7 3.9 3.5 3.3 3.4 3.7 4.2 % with new probations, this cycle 28.3% 17.8% 24.4% 28.6% 26.4% 30.4% 41.2%
Reasons for Revocation Technical Only 16.2% 20.0% 14.6% 17.9% 17.2% 12.3% 28.5% Criminal Behavior Only 3.2% 2.2% 4.9% 5.4% 1.2% 1.5% 5.9% New Conviction Only 2.9% 4.4% 0.0% 3.6% 4.6% 2.2% 0.0% Combination 77.4% 73.3% 78.1% 73.2% 70.0% 84.1% 67.7%
Behavior Issues Substance Abuse 61.7% 68.9% 65.9% 62.5% 58.6% 63.8% 47.1% Employment < 60% * 89.7% 86.1% 92.6% 90.9% 83.0% 93.6% 85.2%
Average Risk Score 5.1 4.3 6.2 4.6 5.6 5.0 5.6 Hearings Before Revocation
% with any hearing 51.6% 57.8% 46.3% 55.4% 46.0% 51.4% 58.8% % hearings with increased conditions 0 68.1% 73.1% 78.9% 80.1% 65.0% 59.2% 65.0% Average Number of Hearings a 1.9 2.2 1.5 1.7 1.9 1.9 2.0
Sanctions Imposed Number with any sanction 123 22 II 20 13 45 9 Percent with Jail a 81.3% 86.4% 90.9% 85.0% 69.2% 73.3% 100.0% % with any other sanction a 35.0% 27.3% 18.2% 30.0% 46.2% 42.2% 22.2% % with more than 1 sanction a 38.1% 40.9% 27.3% 25.0% 30.8% 37.8% 77.8%
Violations before Revocation Technical Only 14.0% 13.3% 17.1% 12.5% 14.9% 10.9% 23.5% Criminal Behavior Only 6.1% 0.0% 9.8% 14.3% 6.9% 2.9% 8.8% New Conviction Only 1.7% 0.0% 4.9% 1.8% 2.3% 0.7% 2.9% Combination 46.7% 53.3% 34.2% 42.9% 35.6% 55.1% 55.9% None Cited 31.5% 33.3% 34.2% 28.7% 40.2% 30.4% 8.8%
Support Services Provided Percent receiving any service 41.5% 44.4% 24.4% 41.1% 35.6% 49.3% 44.1%
Notes: * Percent of cases where employment could be determined (126 were missing). a Percent of cases only where hearings occurred or any sanction was imposed.