Embed Size (px)
Citation preview

HAL Id: hal-00616783https://hal.archives-ouvertes.fr/hal-00616783
Submitted on 13 Mar 2013
HAL is a multi-disciplinary open accessarchive for the deposit and dissemination of sci-entific research documents, whether they are pub-lished or not. The documents may come fromteaching and research institutions in France orabroad, or from public or private research centers.
L’archive ouverte pluridisciplinaire HAL, estdestinée au dépôt et à la diffusion de documentsscientifiques de niveau recherche, publiés ou non,émanant des établissements d’enseignement et derecherche français ou étrangers, des laboratoirespublics ou privés.
From CIE 2006 Physiological Model to ImprovedAge-Dependent and Average Colorimetric ObserversAbhijit Sarkar, Florent Autrusseau, Françoise Viénot, Patrick Le Callet,
Laurent Blondé
To cite this version:Abhijit Sarkar, Florent Autrusseau, Françoise Viénot, Patrick Le Callet, Laurent Blondé. From CIE2006 Physiological Model to Improved Age-Dependent and Average Colorimetric Observers. Journalof the Optical Society of America. A Optics, Image Science, and Vision, Optical Society of America,2011, 28 (10), pp.2033-2048. <10.1364/JOSAA.28.002033>. <hal-00616783>
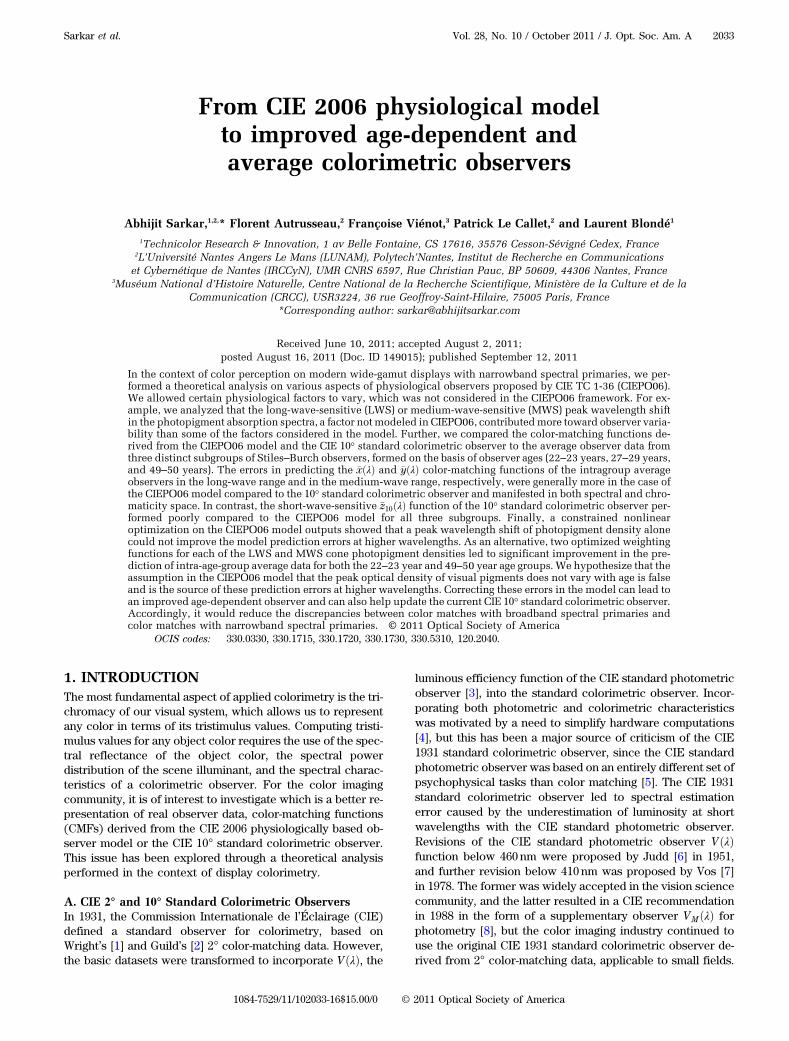
From CIE 2006 physiological modelto improved age-dependent andaverage colorimetric observers
Abhijit Sarkar,1,2,* Florent Autrusseau,2 Françoise Viénot,3 Patrick Le Callet,2 and Laurent Blondé1
1Technicolor Research & Innovation, 1 av Belle Fontaine, CS 17616, 35576 Cesson-Sévigné Cedex, France2L’Université Nantes Angers Le Mans (LUNAM), Polytech’Nantes, Institut de Recherche en Communicationset Cybernétique de Nantes (IRCCyN), UMR CNRS 6597, Rue Christian Pauc, BP 50609, 44306 Nantes, France
3Muséum National d’Histoire Naturelle, Centre National de la Recherche Scientifique, Ministère de la Culture et de laCommunication (CRCC), USR3224, 36 rue Geoffroy-Saint-Hilaire, 75005 Paris, France
*Corresponding author: [email protected]
Received June 10, 2011; accepted August 2, 2011;
posted August 16, 2011 (Doc. ID 149015); published September 12, 2011
In the context of color perception on modern wide-gamut displays with narrowband spectral primaries, we per-formed a theoretical analysis on various aspects of physiological observers proposed by CIE TC 1-36 (CIEPO06).We allowed certain physiological factors to vary, which was not considered in the CIEPO06 framework. For ex-ample, we analyzed that the long-wave-sensitive (LWS) or medium-wave-sensitive (MWS) peak wavelength shiftin the photopigment absorption spectra, a factor notmodeled in CIEPO06, contributedmore toward observer varia-bility than some of the factors considered in the model. Further, we compared the color-matching functions de-rived from the CIEPO06 model and the CIE 10° standard colorimetric observer to the average observer data fromthree distinct subgroups of Stiles–Burch observers, formed on the basis of observer ages (22–23 years, 27–29 years,and 49–50 years). The errors in predicting the �xðλÞ and �yðλÞ color-matching functions of the intragroup averageobservers in the long-wave range and in the medium-wave range, respectively, were generally more in the case ofthe CIEPO06 model compared to the 10° standard colorimetric observer and manifested in both spectral and chro-maticity space. In contrast, the short-wave-sensitive �z10ðλÞ function of the 10° standard colorimetric observer per-formed poorly compared to the CIEPO06 model for all three subgroups. Finally, a constrained nonlinearoptimization on the CIEPO06 model outputs showed that a peak wavelength shift of photopigment density alonecould not improve the model prediction errors at higher wavelengths. As an alternative, two optimized weightingfunctions for each of the LWS and MWS cone photopigment densities led to significant improvement in the pre-diction of intra-age-group average data for both the 22–23 year and 49–50 year age groups.We hypothesize that theassumption in the CIEPO06 model that the peak optical density of visual pigments does not vary with age is falseand is the source of these prediction errors at higher wavelengths. Correcting these errors in the model can lead toan improved age-dependent observer and can also help update the current CIE 10° standard colorimetric observer.Accordingly, it would reduce the discrepancies between color matches with broadband spectral primaries andcolor matches with narrowband spectral primaries. © 2011 Optical Society of America
OCIS codes: 330.0330, 330.1715, 330.1720, 330.1730, 330.5310, 120.2040.
1. INTRODUCTION
The most fundamental aspect of applied colorimetry is the tri-chromacy of our visual system, which allows us to representany color in terms of its tristimulus values. Computing tristi-mulus values for any object color requires the use of the spec-tral reflectance of the object color, the spectral powerdistribution of the scene illuminant, and the spectral charac-teristics of a colorimetric observer. For the color imagingcommunity, it is of interest to investigate which is a better re-presentation of real observer data, color-matching functions(CMFs) derived from the CIE 2006 physiologically based ob-server model or the CIE 10° standard colorimetric observer.This issue has been explored through a theoretical analysisperformed in the context of display colorimetry.
A. CIE 2° and 10° Standard Colorimetric ObserversIn 1931, the Commission Internationale de l’Éclairage (CIE)defined a standard observer for colorimetry, based onWright’s [1] and Guild’s [2] 2° color-matching data. However,the basic datasets were transformed to incorporate VðλÞ, the
luminous efficiency function of the CIE standard photometricobserver [3], into the standard colorimetric observer. Incor-porating both photometric and colorimetric characteristicswas motivated by a need to simplify hardware computations[4], but this has been a major source of criticism of the CIE1931 standard colorimetric observer, since the CIE standardphotometric observer was based on an entirely different set ofpsychophysical tasks than color matching [5]. The CIE 1931standard colorimetric observer led to spectral estimationerror caused by the underestimation of luminosity at shortwavelengths with the CIE standard photometric observer.Revisions of the CIE standard photometric observer VðλÞfunction below 460nm were proposed by Judd [6] in 1951,and further revision below 410nm was proposed by Vos [7]in 1978. The former was widely accepted in the vision sciencecommunity, and the latter resulted in a CIE recommendationin 1988 in the form of a supplementary observer VMðλÞ forphotometry [8], but the color imaging industry continued touse the original CIE 1931 standard colorimetric observer de-rived from 2° color-matching data, applicable to small fields.
Sarkar et al. Vol. 28, No. 10 / October 2011 / J. Opt. Soc. Am. A 2033
1084-7529/11/102033-16$15.00/0 © 2011 Optical Society of America

In 1964, CIE recommended a large-field standard colori-metric observer based on the work of Stiles and Burch [9]and Speranskaya [10]. Stiles and Burch maintained highphotopic luminance of the matching fields and incorporatedmathematical corrections to exclude the effect of rod intru-sion in long-wavelength color matches. The CMF �yðλÞ repre-sents the relative spectral luminous efficiency function of theCIE 10° standard colorimetric observer, but the photometricstandard still uses �y2ðλÞ from the CIE 2° standard colorimetricobserver to define luminance, even for large-field stimuli.
For many practical industrial applications, the use of the 2°standard colorimetric observer is questionable, as the field ofview is typically much larger than 2°. Indeed, many industrialengineers have chosen to use �y10ðλÞ in colorimetric applica-tions. However, because of the absence of rod contribution,and more importantly, because of individual differences in thevisual system, it has been observed that even the CIE 10° stan-dard colorimetric observer does not always correspond to realobserver matches for large fields.
B. CIE 2006 Physiologically Based ObserverIn 2006, CIE’s technical committee TC 1-36 published a report[11] (described hereafter as CIEPO06, an abbreviated form ofCIE 2006 physiological observer) on the choice of a set ofCMFs and estimates of cone fundamentals for the color-normal observer. The CIEPO06 model is largely based onthe work of Stockman and Sharpe [12]. Starting from 10°CMFs of 47 Stiles–Burch observers [9], the model defines2° and 10° fundamental observers and provides a convenientframework for calculating average cone fundamentals for anyfield size between 1° and 10° and for an age between 20and 80.
C. Individual Cone FundamentalsIn its approach to construct a fundamental observer, technicalcommittee CIE TC 1-36 has ignored individual variability[11,13]. A few studies have dealt with individual variationsof CMFs, analyzing the data collected by Stiles and Burchusing 10° fields [14], examining the differences between theCMFs of the CIE 1931 standard colorimetric observer, theJudd’s revision of this set, and the set of 2° CMFs collectedby Stiles and Burch [15], comparing interindividual and in-traindividual variability of experimental CMFs [16]. Wyszeckiand Stiles [17] (p. 348) produced a global statistical analysis ofthe dispersion of the data collected by Stiles and Burch using10° fields. In the past 10 years, a few sets of matching resultshave been generated at low or moderate luminance levels toinvestigate intraobserver and interobserver variability [18,19]and test additivity and transformability of color matches[20,21]. One study of nine observers’ CMFs concluded thata main cause of the individual difference was the differenceof individual spectral lens density [22]. Individual variations ofRayleigh matches have also been examined experimentally[23–26] or theoretically [27]. Although these studies strivedto relate the variation of color matches to underlying physio-logical factors, they failed to model individual effects of thesefactors in a practical manner that could be implemented inindustrial applications.
In this paper, we take advantage of the framework devel-oped in CIEPO06 to examine through theoretical analysis
the effect of age on the CMFs of individual observers andon individual color matches as viewed on displays.
D. General Colorimetric TransformsEach set of CIEPO06 cone fundamentals can be converted toCMFs through a linear transformation. At the time of thiswork, the final 3 × 3 transformation matrix for such con-version was not yet made available by CIE TC 1-36. Twoapproaches could yield a proper linear transformation. Wecomputed an approximate 3 × 3 LMS-to-XYZ transformationmatrix from the available CIE 1964 10° �x10ðλÞ, �y10ðλÞ, �z10ðλÞstandard colorimetric observer functions and the average�lNSB10
ðλÞ, �mNSB10
ðλÞ, �sNSB10ðλÞ cone fundamentals of 47 Stiles–
Burch observers, each normalized to unity. The transforma-tion matrix is
2
4
�x10ðλÞ�y10ðλÞ�z10ðλÞ
3
5¼
2
4
1:905378 −1:321620 0:419512
0:698648 0:333043 −0:013360
−0:024300 0:040453 2:073582
3
5
2
6
6
4
�lNSB10ðλÞ
�mNSB10
ðλÞ
�sNSB10ðλÞ
3
7
7
5
:
ð1Þ
The above matrix was used at all times for converting any nor-malized L, M, S cone fundamentals from the Stiles–Burchdataset into CIE XYZ-like CMFs similar to 10° �x10ðλÞ, �y10ðλÞ,�z10ðλÞ functions. It is reasonably close to the matrix publishedearlier by other researchers [28]. Note that, in [28], a negativesign was accidentally omitted in the first row, second columnof the transformation matrix [Eq. (1)].
We computed another approximate 3 × 3 LMS-to-XYZ trans-formation matrix from the CIE 10° standard colorimetric ob-server functions and the CIEPO06 model cone fundamentals�lCIE0610ðλÞ, �mCIE0610ðλÞ, �sCIE0610ðλÞ applicable for an age of 32and a 10° field size without any normalization of the conefundamentals:
2
4
�x10ðλÞ�y10ðλÞ�z10ðλÞ
3
5¼
2
4
0:006873 −0:005386 0:005550
0:002520 0:001358 −0:000181
−0:000089 0:000167 0:027432
3
5
2
6
4
�lCIE0610ðλÞ�mCIE0610ðλÞ�sCIE0610ðλÞ
3
7
5:
ð2Þ
This transformation matrix was used in the analysis of the ef-fect of various physiological factors on CIEPO06 cone funda-mentals, where normalization is not desirable. If normalizedCIEPO06 cone fundamentals are used, the resulting transfor-mation matrix is very close to that of Eq. (1).
E. CIEPO06 ModelThe CIEPO06 model is a convenient and effective mathema-tical tool for understanding how various physiological factorsaffect the cone fundamentals, and thus the CMFs. A brief re-view of the model will be helpful in better understanding theanalysis that follows.
CIEPO06 framework [11], shown in Fig. 1, involves twoparameters, namely, the field size, varying between 1° and10°, and the observer age, varying between 20 and 80. Threephysiological factors have been incorporated in the CIEPO06model, in the form of spectral optical density functions for:(a) lens and other ocular media absorption, (b) macular pig-ment absorption, and (c) visual pigments in the outer seg-ments of photoreceptors. Out of these, the ocular media
2034 J. Opt. Soc. Am. A / Vol. 28, No. 10 / October 2011 Sarkar et al.
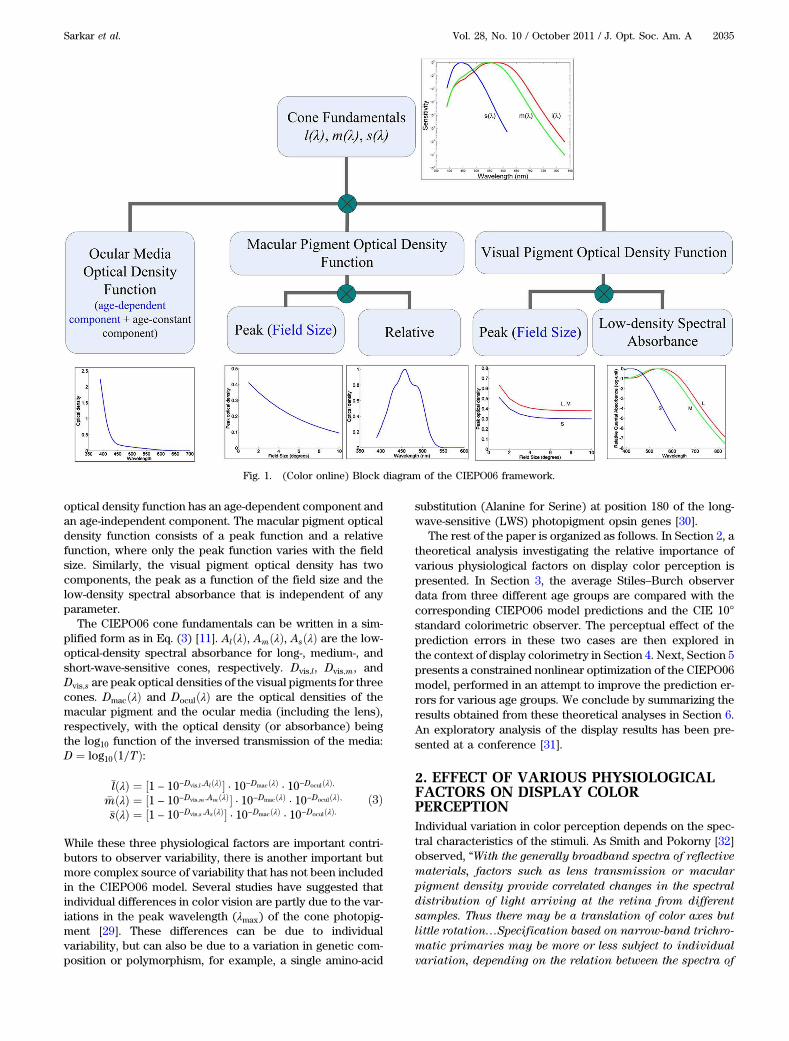
optical density function has an age-dependent component andan age-independent component. The macular pigment opticaldensity function consists of a peak function and a relativefunction, where only the peak function varies with the fieldsize. Similarly, the visual pigment optical density has twocomponents, the peak as a function of the field size and thelow-density spectral absorbance that is independent of anyparameter.
The CIEPO06 cone fundamentals can be written in a sim-plified form as in Eq. (3) [11]. AlðλÞ, AmðλÞ, AsðλÞ are the low-optical-density spectral absorbance for long-, medium-, andshort-wave-sensitive cones, respectively. Dvis;l, Dvis;m, andDvis;s are peak optical densities of the visual pigments for threecones. DmacðλÞ and DoculðλÞ are the optical densities of themacular pigment and the ocular media (including the lens),respectively, with the optical density (or absorbance) beingthe log10 function of the inversed transmission of the media:D ¼ log10ð1=TÞ:
�lðλÞ ¼ ½1 − 10−Dvis;l:AlðλÞ� · 10−DmacðλÞ · 10−DoculðλÞ;
�mðλÞ ¼ ½1 − 10−Dvis;m:AmðλÞ� · 10−DmacðλÞ · 10−DoculðλÞ;
�sðλÞ ¼ ½1 − 10−Dvis;s:AsðλÞ� · 10−DmacðλÞ · 10−DoculðλÞ:
ð3Þ
While these three physiological factors are important contri-butors to observer variability, there is another important butmore complex source of variability that has not been includedin the CIEPO06 model. Several studies have suggested thatindividual differences in color vision are partly due to the var-iations in the peak wavelength (λmax) of the cone photopig-ment [29]. These differences can be due to individualvariability, but can also be due to a variation in genetic com-position or polymorphism, for example, a single amino-acid
substitution (Alanine for Serine) at position 180 of the long-wave-sensitive (LWS) photopigment opsin genes [30].
The rest of the paper is organized as follows. In Section 2, atheoretical analysis investigating the relative importance ofvarious physiological factors on display color perception ispresented. In Section 3, the average Stiles–Burch observerdata from three different age groups are compared with thecorresponding CIEPO06 model predictions and the CIE 10°standard colorimetric observer. The perceptual effect of theprediction errors in these two cases are then explored inthe context of display colorimetry in Section 4. Next, Section 5presents a constrained nonlinear optimization of the CIEPO06model, performed in an attempt to improve the prediction er-rors for various age groups. We conclude by summarizing theresults obtained from these theoretical analyses in Section 6.An exploratory analysis of the display results has been pre-sented at a conference [31].
2. EFFECT OF VARIOUS PHYSIOLOGICALFACTORS ON DISPLAY COLORPERCEPTION
Individual variation in color perception depends on the spec-tral characteristics of the stimuli. As Smith and Pokorny [32]observed, “With the generally broadband spectra of reflective
materials, factors such as lens transmission or macular
pigment density provide correlated changes in the spectral
distribution of light arriving at the retina from different
samples. Thus there may be a translation of color axes but
little rotation…Specification based on narrow-band trichro-
matic primaries may be more or less subject to individual
variation, depending on the relation between the spectra of
Fig. 1. (Color online) Block diagram of the CIEPO06 framework.
Sarkar et al. Vol. 28, No. 10 / October 2011 / J. Opt. Soc. Am. A 2035

the biological variables and the spectra of the colorimetric
primaries” (p. 27). In view of this observation, two questionsarise. (i) How do various physiological factors described inSection 1 affect the color perception on a given display?(ii) How do these effects vary between a display with broad-band primaries and another with narrowband primaries? Thepurpose of the analysis described in this section was to inves-tigate these two issues.
A. Displays Used in the AnalysisWe compared the effect of various factors in terms of colorperception on two displays with different spectral character-istics. The first was a Sony BVM32 cathode ray tube (CRT)display widely used as a reference studio display (hereafterreferred to as Ref-CRT). The second was a Hewlett-PackardDreamColor LP2480zx professional 30bit wide-gamut liquidcrystal display (LCD) with LED backlight (hereafter referredto as WG-LCD).
The spectral power distributions of the primaries of the twodisplays are shown in Fig. 2. There is a significant differencein the spectral characteristics between the two displays. WG-LCD is representative of modern wide-gamut displays withpeaky primaries, and Ref-CRT is representative of a typicalCRT display, and of HDTV broadcasting standard references.3 × 3 primary tristimulus matrices of the two displays werecomputed that represented the linear relationship betweenthe XYZ tristimulus values and the RGB channel values. Notethat, normally, the digital counts first need to be corrected(linearized) for the display nonlinearity (gamma correction)before computing the primary tristimulus matrix. However,since this analysis is strictly theoretical, and since gamma cor-rection does not affect the rest of the computations, displaynonlinearity has been ignored in this work. Thus, using theprimary tristimulus matrix of a given display, any set of XYZvalues could be converted into the corresponding set of RGBchannel values and vice versa.
B. Method of AnalysisIn this work, the relative importance of the four physiologicalfactors described earlier on the cone fundamentals were
explored within the framework of CIEPO06. Cone fundamen-tals for 10° field size and an observer age of 32 were computedby independently modifying the contribution of individual fac-tors. In the first analysis published previously [31], we com-pletely removed the contribution of various factors one at atime, by setting the optical density term to zero in case of ocu-lar media and macular pigment absorption, by setting the peakoptical density to unity in the case of low-density absorptionspectra (signifying very high absorption taking place in theouter segments of visual pigments), and by shifting the peakwavelength of the LWS photopigment optical density by250 cm−1 toward shorter wavelengths in case of peak wave-length shift. In the second analysis presented in this paper,we independently modified the contributions of variousphysiological factors as follows:
i. mean optical density of ocular media varied by �25%,ii. peak optical density of macular pigment varied
by �25%,iii. peak optical density term for low-density photo-
pigment relative absorption spectra varied by �25% (0.38 isnominal), and
iv. peak wavelength shift of the cone photopigmentoptical density in the outer segment of the photoreceptor:(a) LWS peak shift by −4nm (toward a shorter wavelength)and (b) medium-wave-sensitive (MWS) peak shift by þ4 nm(toward a longer wavelength).
Such modifications of optical densities by the same percen-tage allowus to compare the effect of various factors. For cases(i) and (iv), themodifications are the same as those reported bySmith and Pokorny [32]. A high optical density in case (iii) sig-nifies higher photoreceptor self-screening, resulting in thebroadening of the photopigment relative absorption spectra[33] (pp. 65–66), while case (iv) signifies LWS and MWS poly-morphismdescribed earlier. For case (iv), the peakwavelengthλwas first shifted in thewavenumber scale (ν ¼ 107=λ, where νis in cm−1 and λ is in nanometers), the cone absorptance spec-tra were resampled, modified cone fundamentals were com-puted and converted from the quanta to energy units, and,finally, were renormalized. Note that case (iv) considersLWS and MWS peak wavelength shifts independently.
For each planned variation of these four factors, a set ofmodified CIEPO06 cone fundamentals was computed, andwere compared to corresponding CIEPO06 cone fundamen-tals under normal conditions. The difference between thetwo sets of functions indicates the contribution of a givenphysiological factor. The difference was computed in terms ofEuclidean distance in the cone fundamental space. Note alsothat we use CIEPO06 10° cone fundamentals, unlike Smithand Pokorny 2° cone fundamentals as in [32].
In order to simulate the effect of various physiological fac-tors when viewing color stimuli on different displays, chroma-ticities of these stimuli for a given display and a given set ofmodified CIEPO06 cone fundamentals must be computed. Inthis analysis, seven test stimuli were selected from variousparts of the common gamut of the CRT and the LCD. Thesestimuli were chosen such that they covered the whole com-mon display gamut in the CIE 1976 (u0, v0) coordinate system(Fig. 3). The chromaticity of the seventh stimulus was close tothat of display white. These coordinates were converted to the
Fig. 2. (Color online) Spectral power distributions of the twodisplays used in the analysis.
2036 J. Opt. Soc. Am. A / Vol. 28, No. 10 / October 2011 Sarkar et al.
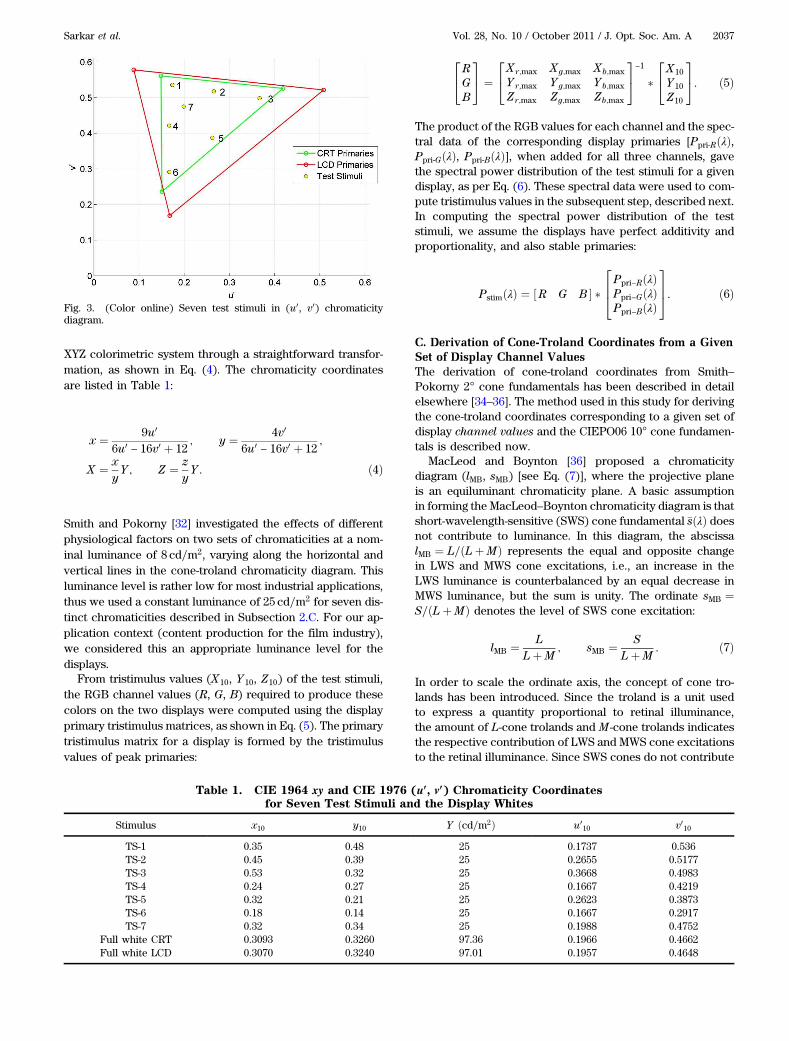
XYZ colorimetric system through a straightforward transfor-mation, as shown in Eq. (4). The chromaticity coordinatesare listed in Table 1:
x ¼9u0
6u0− 16v0 þ 12
; y ¼4v0
6u0− 16v0 þ 12
;
X ¼x
yY; Z ¼
z
yY: ð4Þ
Smith and Pokorny [32] investigated the effects of differentphysiological factors on two sets of chromaticities at a nom-inal luminance of 8 cd=m2, varying along the horizontal andvertical lines in the cone-troland chromaticity diagram. Thisluminance level is rather low for most industrial applications,thus we used a constant luminance of 25 cd=m2 for seven dis-tinct chromaticities described in Subsection 2.C. For our ap-plication context (content production for the film industry),we considered this an appropriate luminance level for thedisplays.
From tristimulus values (X10, Y 10, Z10) of the test stimuli,the RGB channel values (R, G, B) required to produce thesecolors on the two displays were computed using the displayprimary tristimulus matrices, as shown in Eq. (5). The primarytristimulus matrix for a display is formed by the tristimulusvalues of peak primaries:
2
4
R
G
B
3
5 ¼
2
4
Xr;max Xg;max Xb;max
Y r;max Y g;max Y b;max
Zr;max Zg;max Zb;max
3
5
−1
�
2
4
X10
Y 10
Z10
3
5: ð5Þ
The product of the RGB values for each channel and the spec-tral data of the corresponding display primaries [Ppri-RðλÞ,Ppri-GðλÞ, Ppri-BðλÞ], when added for all three channels, gavethe spectral power distribution of the test stimuli for a givendisplay, as per Eq. (6). These spectral data were used to com-pute tristimulus values in the subsequent step, described next.In computing the spectral power distribution of the teststimuli, we assume the displays have perfect additivity andproportionality, and also stable primaries:
PstimðλÞ ¼ ½R G B � �
2
6
4
Ppri−RðλÞPpri−GðλÞPpri−BðλÞ
3
7
5: ð6Þ
C. Derivation of Cone-Troland Coordinates from a GivenSet of Display Channel ValuesThe derivation of cone-troland coordinates from Smith–Pokorny 2° cone fundamentals has been described in detailelsewhere [34–36]. The method used in this study for derivingthe cone-troland coordinates corresponding to a given set ofdisplay channel values and the CIEPO06 10° cone fundamen-tals is described now.
MacLeod and Boynton [36] proposed a chromaticitydiagram (lMB, sMB) [see Eq. (7)], where the projective planeis an equiluminant chromaticity plane. A basic assumptionin forming the MacLeod–Boynton chromaticity diagram is thatshort-wavelength-sensitive (SWS) cone fundamental �sðλÞ doesnot contribute to luminance. In this diagram, the abscissalMB ¼ L=ðLþMÞ represents the equal and opposite changein LWS and MWS cone excitations, i.e., an increase in theLWS luminance is counterbalanced by an equal decrease inMWS luminance, but the sum is unity. The ordinate sMB ¼
S=ðLþMÞ denotes the level of SWS cone excitation:
lMB ¼L
LþM; sMB ¼
S
LþM: ð7Þ
In order to scale the ordinate axis, the concept of cone tro-lands has been introduced. Since the troland is a unit usedto express a quantity proportional to retinal illuminance,the amount of L-cone trolands and M-cone trolands indicatesthe respective contribution of LWS and MWS cone excitationsto the retinal illuminance. Since SWS cones do not contribute
Fig. 3. (Color online) Seven test stimuli in (u0, v0) chromaticitydiagram.
Table 1. CIE 1964 xy and CIE 1976 (u0, v0) Chromaticity Coordinatesfor Seven Test Stimuli and the Display Whites
Stimulus x10 y10 Y ðcd=m2Þ u010 v010
TS-1 0.35 0.48 25 0.1737 0.536TS-2 0.45 0.39 25 0.2655 0.5177TS-3 0.53 0.32 25 0.3668 0.4983TS-4 0.24 0.27 25 0.1667 0.4219TS-5 0.32 0.21 25 0.2623 0.3873TS-6 0.18 0.14 25 0.1667 0.2917TS-7 0.32 0.34 25 0.1988 0.4752
Full white CRT 0.3093 0.3260 97.36 0.1966 0.4662Full white LCD 0.3070 0.3240 97.01 0.1957 0.4648
Sarkar et al. Vol. 28, No. 10 / October 2011 / J. Opt. Soc. Am. A 2037

to luminance, S-cone troland must be appropriately defined.In the representation proposed by Boynton and Kambe [37],one troland of the equal-energy spectrum amounts to one S-cone troland.
In that case of CIEPO06 cone fundamentals that are thesame as Stockman–Sharpe 10° cone fundamentals, eachscaled to unity peak, the luminous efficiency function is givenby Eq. (8) [38]. However, as our analysis involves comparingnormal and modified cone fundamentals, any normalizationmust be avoided since it can unduly shift the peak wavelengthof modified cone fundamentals, making it difficult to inferwhether such shift is due to a physiological factor or becauseof normalization.
When cone fundamentals are not normalized to unity peak,the luminous efficiency function can be obtained by addingLWS andMWS cone fundamentals in a 1:98∶1 ratio [same ratioas in Eq. (8)]; thus LWS cone fundamentals were scaled by1.98 to begin with [Eq. (9)]. No scaling was used for SWS conefundamentals. Next, the product of scaled cone fundamentalsand the test stimulus spectral power distribution [PstimðλÞ] ob-tained from Eq. (6) were computed for each wavelength andsummed over the whole wavelength range, resulting in LMStristimulus values in the cone fundamental space [Eq. (10)].The resulting tristimulus values were specific to a given dis-play and a given set of modified cone fundamentals, computedfrom various normal and modified CIEPO06 10° cone funda-mentals. Macleod–Boynton chromaticity coordinates (lMB,sMB) were then obtained from LMS tristimulus values asdescribed before [Eq. (7)]:
VSS;10ðλÞ ¼ 0:692839�lðλÞ þ 0:349676 �mðλÞ; ð8Þ
lSCðλÞ ¼ �lðλÞ � 1:98; ð9Þ
2
4
L
M
S
3
5 ¼
2
6
4
lSCðλÞmðλÞsðλÞ
3
7
5� PstimðλÞ: ð10Þ
Again, to comply with the definition of S-cone trolands,Macleod–Boynton s coordinates (sMB) were scaled such thats coordinate of equal-energy white would be equal to unity. Inthe case of CIEPO06 10° cone fundamentals, the computedscale factor was 21.7209.
The luminance values [Y stim] of the test stimuli were ob-tained by vectorially adding the peak primary luminance val-ues [YRmax, YGmax, YBmax] scaled by the respective channelvalues, as shown in Eq. (11):
Y stim ¼ ½R G B � �
2
4
YRmax
YGmax
YBmax
3
5: ð11Þ
Using the above method, relative cone trolands were com-puted for the seven test stimuli and are plotted in Fig. 4.
Using an observer model different from the 10° standardcolorimetric observer is likely to distort the uniformity ofu0v0Y color space, the extent of which depends on the specificobserver model used. However, in our analysis we hypothe-size that, in a small region of three-dimensional space around
a given color, the Euclidean distances for various observerCMFs can be compared. Because of this issue, use of a morecomplex color space like CIELAB and color difference equa-tions was avoided as they could possibly amplify uniformitydistortions. u0v0Y was chosen over xyY because of bettervisual uniformity.
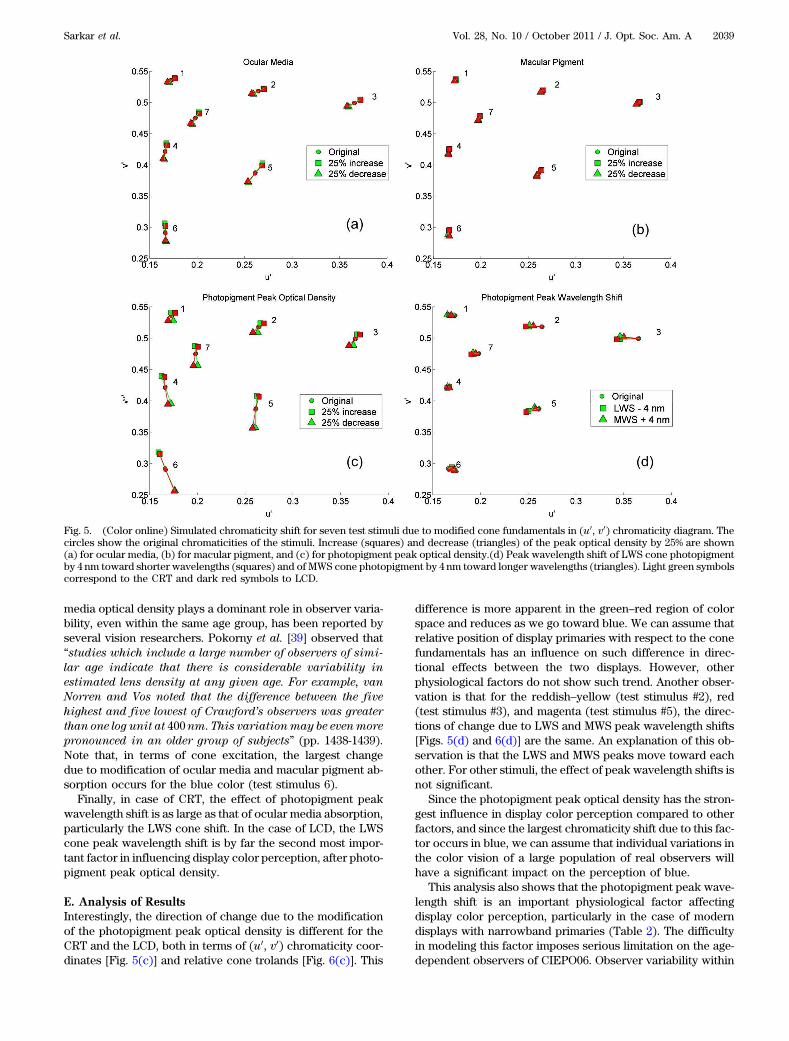
D. ResultsIn Fig. 5, the (u0, v0) chromaticity shifts of the seven test stimuliare shown, depicting the effects of modified cone fundamen-tals on color perception on the CRT (light green symbols)and the LCD (dark red symbols). The squares represent a 25%increase in the optical density of the ocularmedia [Fig. 5(a)], ofthe macular pigment [Fig. 5(b)], and of the cone photo-pigment [Fig. 5(c)], and in Fig. 5(d), a shift of the peak LWScone wavelength by 4nm toward shorter wavelengths (seeSubsection 3.B). The triangles represent a 25% decrease inthe optical density of the ocular media [Fig. 5(a)], of the macu-lar pigment [Fig. 5(b)] andof the conephotopigment [Fig. 5(c)],and in Fig. 5(d), a shift of the peak MWS cone wavelength by4 nm toward longer wavelengths. Figure 6 shows the samechromaticity shifts in the cone-troland chromaticity diagram.Table 2 represents the root mean square (RMS) of the (u0,v0) coordinate shifts of seven displayed stimuli due to eachof the four factors (scaled by 1000). Mean and maximumRMS differences are shown for both displays.
All four factors do not affect the target specification to thesame extent. Out of all four factors, photopigment peak opti-cal density affects the observer color perception the most, asevident from Table 2. In the case of ocular media and macularpigment absorption, the change in color perception occursalong the same direction: toward yellow–green when the op-tical density is increased and toward blue when it is decreased[Figs. 5(a) and 5(b)]. This is true even for the test stimulusclose to the display white. These directions of change arein line with Wyszecki and Stiles’ results [17] (p. 352). However,the effect of macular pigment absorption is significantly lessthan ocular media absorption; in fact, it is the least significantphysiological factor when compared to the others, as perTable 2. The change due to macular pigment absorption ismarginally larger for LCD as compared to the CRT, and is theopposite in the case of ocular media absorption. That ocular
Fig. 4. (Color online) Seven test stimuli in Boynton–Kambe relativecone-troland coordinates based on CIEPO06 10° cone fundamentals.
2038 J. Opt. Soc. Am. A / Vol. 28, No. 10 / October 2011 Sarkar et al.
media optical density plays a dominant role in observer varia-bility, even within the same age group, has been reported byseveral vision researchers. Pokorny et al. [39] observed that“studies which include a large number of observers of simi-
lar age indicate that there is considerable variability in
estimated lens density at any given age. For example, van
Norren and Vos noted that the difference between the five
highest and five lowest of Crawford’s observers was greater
than one log unit at 400nm. This variationmay be evenmore
pronounced in an older group of subjects” (pp. 1438-1439).Note that, in terms of cone excitation, the largest changedue to modification of ocular media and macular pigment ab-sorption occurs for the blue color (test stimulus 6).
Finally, in case of CRT, the effect of photopigment peakwavelength shift is as large as that of ocular media absorption,particularly the LWS cone shift. In the case of LCD, the LWScone peak wavelength shift is by far the second most impor-tant factor in influencing display color perception, after photo-pigment peak optical density.
E. Analysis of ResultsInterestingly, the direction of change due to the modificationof the photopigment peak optical density is different for theCRT and the LCD, both in terms of (u0, v0) chromaticity coor-dinates [Fig. 5(c)] and relative cone trolands [Fig. 6(c)]. This
difference is more apparent in the green–red region of colorspace and reduces as we go toward blue. We can assume thatrelative position of display primaries with respect to the conefundamentals has an influence on such difference in direc-tional effects between the two displays. However, otherphysiological factors do not show such trend. Another obser-vation is that for the reddish–yellow (test stimulus #2), red(test stimulus #3), and magenta (test stimulus #5), the direc-tions of change due to LWS and MWS peak wavelength shifts[Figs. 5(d) and 6(d)] are the same. An explanation of this ob-servation is that the LWS and MWS peaks move toward eachother. For other stimuli, the effect of peak wavelength shifts isnot significant.
Since the photopigment peak optical density has the stron-gest influence in display color perception compared to otherfactors, and since the largest chromaticity shift due to this fac-tor occurs in blue, we can assume that individual variations inthe color vision of a large population of real observers willhave a significant impact on the perception of blue.
This analysis also shows that the photopigment peak wave-length shift is an important physiological factor affectingdisplay color perception, particularly in the case of moderndisplays with narrowband primaries (Table 2). The difficultyin modeling this factor imposes serious limitation on the age-dependent observers of CIEPO06. Observer variability within
Fig. 5. (Color online) Simulated chromaticity shift for seven test stimuli due to modified cone fundamentals in (u0, v0) chromaticity diagram. Thecircles show the original chromaticities of the stimuli. Increase (squares) and decrease (triangles) of the peak optical density by 25% are shown(a) for ocular media, (b) for macular pigment, and (c) for photopigment peak optical density.(d) Peak wavelength shift of LWS cone photopigmentby 4 nm toward shorter wavelengths (squares) and of MWS cone photopigment by 4 nm toward longer wavelengths (triangles). Light green symbolscorrespond to the CRT and dark red symbols to LCD.
Sarkar et al. Vol. 28, No. 10 / October 2011 / J. Opt. Soc. Am. A 2039

a given age group due to such factors cannot be predicted,even though this variability can be more significant than theeffects of some of the factors already included in the model.
This analysis has some inevitable constraints. It is difficultto predict the extent to which various physiological factorsaffect the color perception of an individual observer. It is alsodifficult to ascertain what amount of peak wavelength shiftshould physiologically correspond to a 25% change in peakoptical densities. We chose a peak wavelength shift of 4nmsince this is the largest shift observed due to the serine–alanine amino acid substitution at position 180 of thephotopigment opsin genes, a common form of polymorphism[30]. We hypothesize that the conditions analyzed here all re-present extreme changes in four physiological factors, andthus are reasonable to compare. In spite of the above con-straint, this analysis highlights the relative importance ofvarious factors in affecting color perception on displays.
3. INTRA-AGE-GROUP AVERAGEOBSERVER PREDICTION WITH CIEPO06MODEL AND THE CIE 10° STANDARDCOLORIMETRIC OBSERVER
Based on the foregoing discussion, a question arises whetherit could be worthwhile to explore if the observed intersubject
differences in color matches could be predicted by adjustmentof more of the CIEPO06 parameters. In this study, experimen-tal data from the 1959 Stiles–Burch study [9] involving 47observers were re-examined, since this is the most compre-hensive visual dataset for color vision available to date.
A. CIEPO06 Age Parameters for Real ObserversThe age parameter was introduced in the CIEPO06 model totake into account the difference in absorption in the ocularmedia, in particular the lens, between the aged and the youngobservers. At that time, the age dependencies of theabsorption by the macular pigment as well as the densitiesof the visual pigments were considered of minor influence.The two-component age function of the CIEPO06 model ori-ginated from several experimental bases that were thought tobe representative of large groups of observer [39]. Thus, theCIEPO06 age parameter does not necessarily correspond tothe age of the real Stiles–Burch observers. In other words, pre-dicted model functions that best match the real observer datamay not always be obtained using real observer ages. Thismay happen because of random observer variability, and/orbecause of the exclusion of one or more physiological factorsfrom the CIEPO06 model. These factors could be age indepen-dent, like the peak wavelength shift of the LWS or MWS cone
Fig. 6. (Color online) Simulated chromaticity shift for seven test stimuli due to modified cone fundamentals in relative cone-troland space. Thecircles show the original chromaticities of the stimuli. Increase (squares) and decrease (triangles) of the peak optical density by 25% are shown(a) for ocular media, (b) for macular pigment, and (c) for photopigment peak optical density. (d) Peak wavelength shift of LWS cone photopigmentby 4 nm toward shorter wavelengths (squares) and of MWS cone photopigment by 4 nm toward longer wavelengths (triangles). Light green symbolscorrespond to the CRT and dark red symbols to LCD.
2040 J. Opt. Soc. Am. A / Vol. 28, No. 10 / October 2011 Sarkar et al.

photopigment as discussed in Subsection 2.B, or these couldbe age-dependent physiological factors not considered inCIEPO06. CIE committee TC 1-36 also recognized this restric-tion by pointing out that the CIEPO06 fundamental observerwas a theoretical construct [11]. In this analysis, we deter-mined the CIEPO06 age parameters that resulted in the bestpredictions of each individual Stiles–Burch observer cone fun-damental data. For each individual Stiles–Burch observer,three CIEPO06 age parameters were derived so as to fit asclosely as possible the three cone fundamentals, respectively.Two different methods were used. In the first method, wecomputed the correlation coefficients between the normal-ized cone fundamentals for each Stiles–Burch observer, usingEq. (1) as explained in Subsection 1.D, and those correspond-ing to all possible CIEPO06 age parameter values between 20and 80 (a total of 61). The corresponding CIEPO06 age was theone yielding the highest correlation coefficient for a givencone fundamental. This process was repeated for all threecone fundamentals and for all 47 Stiles–Burch observers. Inthe second method, the corresponding CIEPO06 age for eachStiles–Burch observer was predicted by minimizing the RMSerrors between the normalized cone fundamentals for eachStiles–Burch observer, and those corresponding to all possi-ble CIEPO06 age parameter values between 20 and 80.
B. Comparison of CIEPO06 Predicted and Real Ages ofStiles–Burch ObserversIn Fig. 7, the CIEPO06 predicted ages obtained using the cor-relation coefficient (CORR) method have been plotted against
the actual ages of 47 Stiles–Burch observers. The secondmethod (RMS error, RMSE) produced very similar results.No direct correspondence was found between the real andpredicted ages.
The gain offered by the adjusted CIEPO06 age over the realage could be validated by examining the prediction of matchesof equal-energy white. Figure 8 shows ðx; yÞ chromaticity ofequal-energy white computed with CMFs derived fromCIEPO06 cone fundamentals for each Stiles–Burch observer.CIEPO06 cone fundamentals were obtained by using corre-sponding ages from both methods (CORR and RMSE) as wellas by using actual observer ages. Matches obtained with realobserver cone fundamentals are also plotted. While CIEPO06with age correspondence (with either method) yields greaterobserver variability than CIEPO06 with actual observer ages,it fails to explain all the variability in the real observer data,particularly along the ordinate.
The mean standard deviations of the CIEPO06 cone funda-mentals from the 47 Stiles–Burch observer data averaged overall observers are plotted in Fig. 9. The LWS, MWS, and SWScone fundamentals obtained by using corresponding agesfrom the two methods (CORR and RMSE) and by using actualobserver ages are shown. Mean (central mark), as well as the25th and 75th percentiles (dotted bars) of standard deviationsare higher when real observer ages are used in the model. Theerror is higher for LWS and MWS cone fundamentals thanfor the SWS cone fundamental. This further shows that, by
Fig. 7. (Color online) Age correspondence between CIEPO06model’s best prediction and 47 Stiles–Burch observers.
Fig. 8. (Color online) Chromaticities of matches of equal-energywhite, computed using cone fundamentals from the 47 Stiles–Burchobserver data and CIEPO06 predictions, with two adjustment meth-ods for age (CORR and RMSE) as well as with actual observer age.
Table 2. (u0, v0) RMS Distance (×1000) from Average Cone Fundamental
RMS (×1000) [CRT] RMS (×1000) [LCD]
Source of Variability Mean Max Mean Max
Ocular media peak optical density 0.25% 10.25 16.45 9.40 14.53−0:25% 11.28 17.79 9.68 14.86
Macular pigment peak optical density 0.25% 2.93 4.69 3.25 5.04−0:25% 2.96 4.72 3.29 5.08
Photopigment peak optical density 0.25% 13.51 26.59 13.85 25.60−0:25% 20.23 36.57 20.31 35.47
Photopigment peak wavelength shift L−4 nm 8.42 19.97 10.00 22.50Mþ4 nm 8.72 20.01 5.84 15.09
Sarkar et al. Vol. 28, No. 10 / October 2011 / J. Opt. Soc. Am. A 2041

adjusting the age parameter, the CIEPO06 prediction of realStiles–Burch observer data is improved.
C. Grouping Stiles–Burch Observers with Respect to AgeTo conform to the age-dependent observer model of CIEPO06,three dominant age groups among the Stiles–Burch observerswere identified. The groups were formed in such a way thatthe age difference between observers within any group wasnot more than 2 years. This constraint allowed grouping ofonly 22 out of 47 observers. Six observers with ages between22 and 23 formed Group 1, ten observers with ages between 27and 29 formed Group 2, and another six observers with agesbetween 49 and 50 were placed in Group 3. In the rest of theanalysis, these three observer groups are used. For eachgroup, CIEPO06 age correspondence for the average data wasestablished using the correlation coefficient method for theaverage Stiles–Burch cone fundamentals for the group andCIEPO06 cone fundamentals for all possible ages. In the fol-lowing sections, we obtained two sets of CIEPO06 CMFs foreach observer group, CIEPO06 CMFs obtained by using ad-justed age parameter values given by the correlation coeffi-cient method and CIEPO06 CMFs obtained by using actualaverage observer ages.
D. Comparing CIEPO06 Model Prediction and 10°
Standard Colorimetric Observer with IntragroupAverageOnce three groups of observers were identified, the variabilityof CMFs was examined within each group. The examinationput more emphasis on the regions of the spectrum where�x10ðλÞ, �y10ðλÞ, �z10ðλÞ peak. In Fig. 10, intragroup minimum,maximum, and average CMF values are shown along withthe 10° standard colorimetric observer CMFs, the CIEPO06model predictions, and with age correspondence and with realages. Table 3 lists the results of a statistical comparison of theStiles–Burch observer CMFs, 10° standard colorimetric obser-ver, and CIEPO06model predictions with age correspondenceand with real ages. Values corresponding to �x10ðλÞ, �y10ðλÞ,�z10ðλÞ functions, in the corresponding long-, medium-, and
short-wavelength ranges for each group, are shown. The thirdcolumn in Table 3 shows the intragroup standard deviation ofthe Stiles–Burch data (note that standard deviation has thesame units as the data), signifying intragroup observer varia-bility. The following three columns list absolute difference ofvarious functions from the intragroup mean, averaged over allwavelengths. The three functions considered here are (i) the10° standard colorimetric observer, (ii) CIEPO06 with real ob-server ages as input, and (iii) adjusted CIEPO06 ages with agecorrespondence as input. The absolute differences of thefunctions were multiplied by three weighting functions (forLWS, MWS, and SWS, respectively) before averaging overall wavelengths. The weighting functions were computed bydividing the three intragroup average Stiles–Burch observerCMFs by their respective sum over all wavelengths. The roleof the weighting functions was to assign more weights to thevalues around the peak than those in the lower end of the or-dinate, while ensuring the weights were proportional to origi-nal observer data. Note that, since the �x10ðλÞ, �y10ðλÞ, �z10ðλÞCMFs do not have the same ordinate scale, the rows shouldnot be compared as such.
As shown in Fig. 10 and Table 3, in the case of x CMFs forGroups 1 and 3, both the original CIEPO06 model predictionswith real ages and the 10° standard colorimetric observer de-viate from the intragroup average. The CIEPO06 model withreal observer ages generally performs similar to or worse thanthe 10° standard colorimetric observer �x10ðλÞ and �y10ðλÞ
CMFs. For Groups 1 and 3, the age correspondence methodmostly improves CIEPO06 predictions, and is mostly betterthan the standard colorimetric observer. For Group 2, the pre-diction error is relatively low, even without age correspon-dence, indicating that the CIEPO06 model’s age parameterworks well for the age group of 27–29. This is not surprisingsince the average observer age in the Stiles–Burch study, onwhich CIEPO06 is based, was 32. For Group 3, concerningaged observers, CIEPO06 performs worse than the standardcolorimetric observer for �x10ðλÞ and �y10ðλÞ CMFs. The errorsin the original model prediction are comparable to the in-tragroup standard deviation, indicating that the predictionerrors are statistically significant.
As far as the �z10ðλÞ CMF is concerned, the CIEPO06 modelproduces markedly better results compared to the CIE 10°standard colorimetric observer, even without age correspon-dence. On an average, the reduction in mean absolute differ-ence is more than 50%. �z10ðλÞ CMF also shows high standarddeviation compared to �x10ðλÞ and �y10ðλÞ, indicating that thehigh prediction error of the standard colorimetric observeris, at least partially, due to observers having short-wavelengthcone sensitivity significantly different from the average. As ex-plained in Subsection 2.D, there is high variability in ocularmedia optical density among observers, which is more pro-nounced among higher-age-group observers [39]. Presumably,this variability will manifest more significantly in the blue re-gion of color space. It is logical to hypothesize that, in the pro-cess of averaging over the whole population of all ages,observers significantly different from the majority unduly af-fect the average. Within the constraints of the current analysis,CIEPO06 seems to offer an improvement over the 10°standard colorimetric observer in predicting intra-age-groupaverage z functions.
Fig. 9. (Color online) Mean standard deviation of CIEPO06 cone fun-damentals from the 47 Stiles–Burch observer data, with two adjust-ment methods for age (CORR and RMSE) as well as with actualobserver age. On each box, the central mark is the median, the edgesof the box are the 25th and 75th percentiles, and the whiskers extendto the most extreme data points that are not considered outliers, whileoutliers are plotted individually as small circles.
2042 J. Opt. Soc. Am. A / Vol. 28, No. 10 / October 2011 Sarkar et al.

4. DISPLAY COLORIMETRY: COMPARISONOF CIEPO06 CMFS AND THE CIE 10°
STANDARD COLORIMETRIC OBSERVER
Any statistical method used to compare the model predictionswith real observer data is incompletewithout an analysis of theperceptual effect of the prediction errors. Thus, an additionalanalysis was performed to simulate the effect of the deviationsof CIEPO06 model predictions and the CIE 10° standard
colorimetric observer from the average intragroup observerdata on display color perception. The same method of compu-tation of (u0, v0) tristimulus values for the seven test stimuli wasfollowed aswasused for analyzing the effect of various psycho-logical factors described in Subsection 2.B. The only differencein this case is in the last step. The spectral power distributionsof the test stimuli, obtained from the channel values and thespectral data of the display primaries, were integrated with
Fig. 10. (Color online) CMFs for the Stiles–Burch intragroup average observer (green curve with squares), CIEPO06 model predictions (bluetriangles), CIEPO06 model predictions with age correspondence (red solid circles) and CIE 10° standard colorimetric observer (black stars)for Groups 1 (top row), 2 (middle row), and 3 (bottom row). Stiles–Burch observers’ intragroup minimum (solid black curve) and maximum (blackcurve with open circles) are also shown. Each plot shows the CMFs around the peak only.
Sarkar et al. Vol. 28, No. 10 / October 2011 / J. Opt. Soc. Am. A 2043

either the CIEPO06 CMFs with age correspondence, theCIEPO06 CMFs with real ages, or the CIE 10° standard colori-metric observer to obtain the (u0, v0) specification. (u0, v0) RMSdistances were computed between coordinates correspondingto Stiles–Burch intragroup average (u0
av;SB, v0av;SB) and thosecorresponding to various model predictions (u0
pred, v0pred),as shown in Eq. (12). In this equation, the distances are normal-ized by (u0
av;SB, v0av;SB), the coordinates for Stiles–Burch in-tragroup average data. Such normalization allows us acomparison of relative magnitudes of various distances:
rms ¼ 100 ·
ffiffiffiffiffiffiffiffiffiffiffiffiffiffiffiffiffiffiffiffiffiffiffiffiffiffiffiffiffiffiffiffiffiffiffiffiffiffiffiffiffiffiffiffiffiffiffiffiffiffiffiffiffiffiffiffiffiffiffiffiffiffiffiffiffiffiffiffiffiffiffiffiffiffiffiffiffiffiffiffiffi
�
u0pred − u0
av;SB
u0av;SB
�
2
þ
�
v0pred − v0av;SB
v0av;SB
�
2
s
: ð12Þ
Table 4 lists these normalized distances computed for the LCD.For the CRT, the RMS distance differences between chromati-cities predicted by the CIE 10° standard colorimetric observerand the CIEPO06model were less apparent and are not shown.Note that all these distances are computational color differ-ences between actual and model-predicted chromaticities,
and simply help us compare model prediction errors in a per-ceptual space. The distances in different parts of the colorspace are not comparable since the (u0, v0) space is not percep-tually uniform, but small distances corresponding to variousCMFs can be compared. So the values in Table 4 should becompared row-wise, and not column-wise.
The shaded entries in Table 4 represent the cases where theoriginal CIEPO06 model with real ages predicted the in-tragroup averages better than those of the CIE 10° standardcolorimetric observer (italics), as well as cases whereCIEPO06 model with age correspondence predicted the in-tragroup averages better than the original CIEPO06 model(bold). While for Groups 1 and 3, the original CIEPO06 modelpredictions are generally better than the CIE 10° standard col-orimetric observer, the model mostly performs worse in thecase of Group 2. Applying the age correspondence generallyimproves the model prediction in case of Groups 1 and 2. ForGroup 3, however, age correspondence mostly degrades theoriginal model prediction quite significantly. This shows thatreducing the overall RMS error in the cone fundamental ortristimulus space does not necessarily result in improved pre-diction of color perception in a chromaticity space. Anotherpossible explanation is that the observer variability in higher-age-group observers is not well modeled in CIEPO06 (seeFig. 10), thus intragroup average prediction is adversely af-fected by the poor prediction of color matches for observerssignificantly different from the average.
Now, how could we correlate the observations from Table 3(see Subsection 3.D) and Table 4? Note that Table 3 listsscaled prediction errors around the peak regions of individualx, y, and z CMFs, while Table 4 lists normalized RMS distancesin predicting several test stimuli reproduced on the LCD intwo-dimensional (u0, v0) chromaticity space. Although it isnot surprising that the observations are not always congruentwith each other, two inferences can be drawn by taking intoaccount results from both analyses.
Overall, the CIEPO06 model in its original form does notalways offer an improvement over the 10° standard colori-metric observer in predicting intra-age-group average obser-ver data. Using values different from actual observer agesin the CIEPO06 model can achieve better overall correlationbetween actual and model-predicted CMFs in the tristimulusor cone fundamental space, but does not necessarily result in
Table 3. Deviations of CMF Data from IntragroupAverage Stiles–Burch Observer, 10° StandardColorimetric Observer, and CIEPO06 Model
Predictions with Age Correspondenceand with Real Ages
CMFGrp.No.
MeanIntragroupStiles–Burch
Std. Dev.
Mean Scaled Abs. Diff.From Mean Intragroup
Stiles–Burch Data
CIE 10°Std. Col.Obs.
CIEPO06
Model withReal Ages
Model withAge Corres.
�xðλÞ 1 10.11 5.68 6.53 2.512 11.28 2.54 1.74 1.993 9.12 9.93 10.58 6.06
�yðλÞ 1 6.02 2.81 4.73 1.132 6.68 2.28 2.42 2.433 5.41 2.12 4.21 2.5
�zðλÞ 1 22.7 19.25 8.22 7.552 25.54 10.88 6.2 6.173 21.43 11.71 5.21 3.99
Table 4. (u0, v0) Normalized RMSDistances (×100) of Predicted Chromaticity Values from Stiles–Burch IntragroupAverage CMFs, Computed for Seven Test Stimuli as Viewed on the LCD
a
TestStim.
Group 1 Group 2 Group 3
CIE 10°Std. Col.Obs.
CIEPO06with realages
CIEPO06With AgeCorres.
CIE 10°Std. Col.Obs.
CIEPO06with realages
CIEPO06with AgeCorres.
CIE 10°Std. Col.Obs.
CIEPO06with realages
CIEPO06with AgeCorres.
TS-1 4.52 5.23 2.00 2.89 2.80 2.43 1.79 0.41 3.70TS-2 2.36 1.85 1.90 1.47 1.84 1.74 1.77 1.79 1.83TS-3 1.11 0.49 1.40 0.82 1.16 1.22 1.46 1.89 0.79
TS-4 4.19 4.34 0.61 2.68 2.72 1.84 0.81 0.63 4.62TS-5 1.97 0.81 0.92 1.29 1.91 1.42 1.30 2.15 2.59TS-6 3.54 3.13 1.15 2.27 2.64 1.23 1.80 1.47 5.42TS-7 3.51 3.35 1.48 2.22 2.43 1.96 1.37 0.68 3.35aPredicted chromaticity values were obtained using CIE 10° standard colorimetric observer CMFs, CIEPO06 model CMFs with real ages, and CIEPO06 model CMFs
with age correspondence. Highlighted values indicate improvement in the prediction of chromaticities corresponding to intragroup average CMFs, either by theCIEPO06 original model compared to the CIE 10° standard colorimetric observer (italics), or by the CIEPO06 model with age correspondence compared to the originalCIEPO06 model (bold).
2044 J. Opt. Soc. Am. A / Vol. 28, No. 10 / October 2011 Sarkar et al.

improved prediction of individual color matches, particularlywhen the stimuli do not have flat spectral characteristics.While the short-wavelength CIEPO06 CMFs consistently per-form better than the 10° standard colorimetric observer for allthree age groups, the model’s prediction errors in medium andlong wavelengths are significantly higher for Group 3. Whydoes the model not work well for higher-age-group Stiles–Burch observers at longer wavelengths? This issue is furtherinvestigated in the next section.
5. OPTIMIZED CIEPO06 CONEFUNDAMENTALS FOR STILES–BURCHOBSERVER GROUPS
As discussed in the preceding sections, the CIEPO06 modeldoes not satisfactorily predict the intragroup Stiles–Burchaverage observer CMFs �x10ðλÞ and �y10ðλÞ in the long- andmedium- wavelength ranges, particularly for higher-age-groupobservers. These observations thus raise the question: can weimprove the model performance in the longer wavelengths? Ifso, how can we achieve that?
This prediction error can result from many potentialsources. For example, it could be due to individual observer’sLWS or MWS photopigment peak-wavelength shift resultingfrom genetic polymorphism (as discussed in Section 2), orit could be due to poor modeling of cone absorptance spectrain longer wavelengths. As far as the prediction error at higherwavelengths is concerned, we can rule out the role of ocularmedia and macular pigment optical density factors, since theirinfluences are insignificant beyond 550 nm. Note that ocularmedia optical density is the only physiological factor in theCIEPO06 model that changes with age. To probe possibleways to improve the CIEPO06 model prediction at higherwavelengths, a constrained nonlinear optimization was per-formed under two different conditions.
A. Method of OptimizationIn the first case, only the peak wavelength shifts of the LWS orMWS photopigments were allowed to vary, keeping all otherparameters constant. In the second case, a weighting functionfor the low-optical-density absorption spectra was introduced,which was then optimized. In both cases, the originalCIEPO06 functions at the short wavelengths were not altered.
The equations for CIEPO06 cone fundamentals were intro-duced in Eq. (3). In the first optimization, only the peakwavelength shifts of AlðλÞ and AmðλÞ functions were allowedto vary, keeping all other parameters constant. The optimizedcone fundamentals can thus be represented by Eq. (13):
�loptðλÞ ¼ ½1 − 10−Dvis;l:Ashifted;lðλÞ� · 10−DmacðλÞ · 10−DoculðλÞ;
�moptðλÞ ¼ ½1 − 10−Dvis;m:Ashifted;mðλÞ� · 10−DmacðλÞ · 10−DoculðλÞ: ð13Þ
Here, the [Dvis;lAshifted;lðλÞ] and [Dvis;mAshifted;mðλÞ] terms aremathematical representations of the peak wavelength shiftdue to polymorphism. In the actual implementation of the op-timization method, the peak wavelength λ was first shifted inthe wavenumber scale (ν ¼ 107=λ, where ν is in cm−1 and λ isin nanometers) independently for LWS and MWS photopig-ment. Next, the cone absorptance spectra were resampled,then modified cone fundamentals were computed and con-verted from the quanta to energy units, and finally wererenormalized. In the objective function, the RMSE over the
whole wavelength range was computed between the modifiedCIEPO06 cone fundamentals and Stiles–Burch intragroupaverage cone fundamentals, and was minimized iterativelyby changing the amount of peak λ shift. This shift was con-strained between þ250 and −250 cm−1, with a starting valueof 100 cm−1. Thus, the optimization process left the contribu-tions of macular pigment and ocular media unaltered; only thecontributions of LWS and MWS cone absorption spectra werechanged. The SWS cone fundamental was not modified. Theoptimization was terminated after 10,000 iterations, or belowan error of 10−6, whichever was earlier.
In the second optimization, weighting functions wlðλÞ andwmðλÞ for the low-optical-density spectral absorbance termsAlðλÞ and AmðλÞ, respectively, were introduced beyond550nm [Eq. (14)]. As before, the SWS cone fundamentalwas unaltered:
�loptðλÞ ¼ ½1 − 10−Dvis;l ·AlðλÞ·wðλ
lÞ� · 10−DmacðλÞ · 10−DoculðλÞ;
�moptðλÞ ¼ ½1 − 10−Dvis;m :AmðλÞ·wðλmÞ� · 10−DmacðλÞ · 10−DoculðλÞ: ð14Þ
While some authors have already questioned the CIEPO06SWS cone fundamental at short wavelengths [40], for ourwork, there are two reasons for restricting optimization above550nm. First, we are primarily interested in reducing predic-tion errors at higher wavelengths. Second, the ocular mediaand macular pigment optical densities have significant contri-butions to the cone fundamentals below 550 nm. Thus, even ifwe introduce a weighting function below 550nm and obtainbetter results, it is difficult to isolate a single physiologicalfactor as the source of prediction error.
As in the first optimization, the RMSE between the modifiedCIEPO06 cone fundamentals and the Stiles–Burch intragroupaverage cone fundamentals were minimized in the objectivefunction.
B. ResultsAs a result of the first optimization, the peak wavelengths ofAlðλÞ and AmðλÞ functions were shifted differently for differentgroups. For Group 1, LWS and MWS peak wavelength shiftswere 3.6 and 1:3 nm, respectively, both toward shorter wave-lengths. For Group 2, only the LWS function was shifted by0:1 nm toward shorter wavelengths. For Group 3, on the otherhand, the shifts were toward longer wavelengths, 4.1 and0:3 nm for, respectively, LWS and MWS, functions.
The second optimization resulted in different LWS andMWSweighting functions for the three groups. These functions areshown in Fig. 11. The optimized function is obtained by multi-plying the original CIEPO06 model function by the respectiveweighting function. Thus a weighting of unity does not affectthe original model function. As shown in Fig. 11, the LWSweighting functions have higher values than those of theMWS cones. What is interesting is that, for both LWS andMWS, theweighting functions forGroups 1 and3 are somewhatsymmetrical around the unity weights. To remind the reader,these two groups consist of younger (22–23 years) and older(49–50 years) observers, respectively, while Group 2 observershave average age in the middle (27–29 years). For higher-age-group observers, peak optical density is reduced by the optimi-zation process, and is increased for the lower age group.
Results of both optimization processes are incorporated inTable 5, introduced earlier in Subsection 3.D (see Table 3).
Sarkar et al. Vol. 28, No. 10 / October 2011 / J. Opt. Soc. Am. A 2045

Both �xðλÞ and �yðλÞ intra-age-group average CMFs of Stiles–Burch observers of Groups 1 and 3 are better predicted bythe optimized model.
The improvement in model performance is also substan-tiated in Table 6. The shaded entries in Table 6 representthe cases where the original CIEPO06 model with real agespredicted the intragroup average data better than those ofthe CIE 10° standard colorimetric observer (italics), as wellas cases where the optimized CIEPO06 model predicted theintragroup averages better than the original CIEPO06 model,as well as the CIE 10° standard colorimetric observer (bold).These values were computed in the same way as described inSection 4. Overall, the peak wavelength shift optimization didnot lead to better prediction of average data. An effect of poly-morphism on the average data is not apparent in any of thethree groups. This supports Webster’s conclusion [29] thatno polymorphism effect among the Stiles–Burch observerscould be confirmed. However, this depends on the observergroup involved in the study. Viénot et al. [25] showed thata shift in the wavelength of peak sensitivity of the cone photo-pigments could account for the variability in multiple Rayleighmatches from color-normal observers.
In our analysis, significant improvement was achieved byoptimizing the low-density photopigment spectral absorbancefunctions for Groups 1 and 3. On an average, for Group 1, theaverage RMS prediction error for the seven stimuli reduced bymore than 70% as compared to the CIE 10° standard colori-metric observer, while for Group 3, the improvement wasaround 45%. The only exception is the blue test color (TS-6)for Group 3, which, in any case, does not have significantspectral power in the wavelengths beyond 550nm. In general,in the case of Group 2, the optimization did not improve theresults.
C. DiscussionThe foregoing discussion leads to a hypothesis that a majorsource of the CIEPO06 model prediction errors at higherwavelengths is in the model’s cone absorptance spectra,which has two components, photopigment low-density spec-tral absorbance function and the peak optical density of visualpigment. Figure 11 indicates that cone absorptance spectrashould have an age-dependent component, which wouldcause the cone absorptance spectra to reduce as the age isincreased. This component should have different values inthe long- and medium-wavelength range.
What could be the physiological explanation for such acomponent, which is missing from the model? As explainedin Section 5.8 of the CIE TC 1-36 report [11], there are someindications that the peak optical density of the visual pigmentdecreases gradually as a function of age. However, because ofinsufficient or contradictory data to support this hypothesis[41–43], such dependence has been ignored in the model. Alogical argument would be that the age dependence of thisfactor has a significant effect on cone fundamentals and colormatches, and that its exclusion from the CIEPO06 model leadsto prediction errors of intra-age-group average at higherwavelengths. This argument appears to contradict Websterand MacLeod’s [44] observation that none of the factors ex-tracted through a factor analysis of the Stiles–Burch 10° datacorresponded to differences in photopigment density, andonly a weak role of density differences was suggested bythe fits to the correlation matrix. They concluded the peakwavelength shift of photopigment density was a more salientdeterminant of individual differences in the matches. A keydifference between that study and our analysis is that Websterand MacLeod were investigating individual variability without
Fig. 11. (Color online) Weighting functions for optimizing the LWS (left) and MWS (right) low-density spectral absorbance. Optimization wasperformed above 550nm.
Table 5. Comparison of Deviations of CMF Data fromIntragroup Average Stiles–Burch Observer, 10°
Standard Colorimetric Observer, CIEPO06 OriginalModel Predictions, and Optimized CIEPO06 Modelwith Modified Low-Density Absorbance Spectra
CMFGroupNo.
MeanIntragroupStiles–Burch
Std. Dev.
Mean ScaledAbs. Diff. From Mean
Intragroup Stiles–Burch Data
CIE 10°Std. Obs.
CIEPO06 Model
Original
Optimized(LowDensity
Abs.Spectra)
�xðλÞ 1 10.11 5.68 6.53 2.012 11.28 2.54 1.74 2.173 9.12 9.93 10.58 2.01
�yðλÞ 1 6.02 2.81 4.73 1.342 6.68 2.28 2.42 1.43 5.41 2.12 4.21 1.12
2046 J. Opt. Soc. Am. A / Vol. 28, No. 10 / October 2011 Sarkar et al.

regard to age groups, while we focused on intra-age-groupaverage prediction. For the latter, differences in photopigmentoptical density does seem to be an important factor.
It should be emphasized that the optimization method de-scribed in this section is purely mathematical. Deriving a phys-iologically based correction function was beyond the scope ofthe current study. However, we believe this analysis isolatesthe likely source of a major flaw in the CIEPO06 model,correcting which can lead to a significant improvement inmodel performance, particularly for observers in higher agegroups compared to the Stiles–Burch observers’ averageage of 32.
6. CONCLUSIONS
In this paper, we presented a theoretical analysis on variousaspects of the physiologically based observer model proposedby CIE TC 1-36 (CIEPO06). In the context of color perceptionon modern narrowband displays, we evaluated the perfor-mance of the CIEPO06 model in predicting the average datafor three different age groups of Stiles–Burch observers andcompared the results with the CIE 10° standard colorimetricobserver. Our goal was to determine if an age-dependent ob-server provides an advantage over a single average observer.Several conclusions can be drawn from our study as listedbelow.
i. The photopigment peak optical density has the stron-gest influence in display color perception compared to otherphysiological factors. This finding assumes further signifi-cance in light of Smith et al.’s [45] observation that a variationof �0:2 unit of photopigment optical density from the meancould account for 99% of the individual variance in theStiles–Burch pilot data [9]. Photopigment peak wavelengthshift is another factor having significant contribution to obser-ver variability, but is not within the scope of the CIEPO06model.
ii. Using real observer ages in the model leads to largeerrors in intra-age group average observer CMF prediction,making it difficult to apply this model directly in practicalapplications.
iii. The CIE 10° standard colorimetric observer z functionhas a large error with respect to intra-age-group average z
functions of all three Stiles–Burch age groups studied, namelysix, 10, and six observers in age ranges or 22–23, 27–29, and49–50 years, respectively; in all three cases, the CIEPO06model provides significant improvement.
iv. x and y CMFs derived from the CIEPO06 model for theobserver age group of 49–50 years show high deviation fromthe intragroup average, the error being comparable to in-tragroup standard deviation.
v. In terms of predicting average color perception for dif-ferent age groups on a display with narrowband primaries, theCIEPO06 model in its original form does not always offer animprovement over the 10° standard colorimetric observer.This limitation is particularly apparent for higher age groupobservers in the red–green part of the color space.
vi. A constrained nonlinear optimization of the CIEPO06model shows that only peak wavelength shifts of the LWS andMWS photopigment density fails to improve intra-age-groupaverage prediction, while weighting functions for the photo-pigment density functions above 550nm significantly improvethis prediction both in the spectral domain and chromaticityspace, for both age groups of 22–23 and 49–50 years. Thisweighting function is different for different age groups andalso different for LWS and MWS cone photopigment densities.We propose that the peak optical density of visual pigmentsshould be an age-dependent function in the CIEPO06 modeland should be defined independently for LWS and MWS conephotopigments.
REFERENCE1. W. D. Wright, “A re-determination of the trichromatic coeffi-
cients of the spectral colors,” Trans. Opt. Soc. 30, 141–164(1929).
2. J. Guild, “The colorimetric properties of the spectrum,” Phil.Trans. R. Soc. A 230, 149–187 (1932).
3. CIE, Sixième Session, Genève, Juillet, 1924, Recueil des
Travaux et Compte Rendu de Séances (Cambridge University,1926), pp 67–69.
4. R. S. Berns, Billmeyer and Saltzman’s Principles of Color
Technology, 3rd ed. (Wiley, 2000).5. V. C. Smith and J. Pokorny, “Color matching and color
discrimination,” in The Science of Color, 2nd ed, S. K. Shevell,ed. (Elsevier, , 2003), pp. 103–148.
6. D. B. Judd, “Colorimetry and artificial daylight,” in Technical
Committee No. 7 Report of Secretariat United States Commis-sion (International Commission on Illumination, 1951), pp. 1–60.
Table 6. (u0, v0) Normalized RMS Distances (×100) from Stiles–Burch Intragroup Average Chromaticities Computedfor Seven Test Stimuli as Viewed on the LCD
a
Group 1 Group 2 Group 3
TestStim.
CIE 10°Std. Col.Obs. CIEPO06
CIEPO06Optim.(Peak λ
Shift)
CIEPO06Optim.(LD AbsSpectra)
CIE 10°Std. Col.Obs. CIEPO06
CIEPO06Optim.(Peak λ
Shift)
CIEPO06Optim.(LD AbsSpectra)
CIE 10°Std. Col.Obs. CIEPO06
CIEPO06Optim.(Peak λ
Shift)
CIEPO06Optim.(LD AbsSpectra)
TS-1 4.52 5.23 5.21 0.58 2.89 2.80 3.54 2.96 1.79 0.41 2.18 0.11
TS-2 2.36 1.85 3.88 0.25 1.47 1.84 2.23 1.12 1.77 1.79 2.23 0.26
TS-3 1.11 0.49 2.86 0.72 0.82 1.16 1.08 0.11 1.46 1.89 1.60 0.46
TS-4 4.19 4.34 3.99 0.86 2.68 2.72 3.06 2.84 0.81 0.63 0.97 0.73TS-5 1.97 0.81 2.70 0.77 1.29 1.91 2.25 1.30 1.30 2.15 1.78 1.10
TS-6 3.54 3.13 2.47 0.86 2.27 2.64 2.36 2.43 1.80 1.47 2.16 2.36TS-7 3.51 3.35 4.18 0.52 2.22 2.43 2.95 2.23 1.37 0.68 1.76 0.36
aResults are shown for the CIE 10° standard colorimetric observer, original CIEPO06 model predictions and optimized model prediction through peak-wavelengthshift and weighted low-density photopigment spectral absorbance. Highlighted values indicate improvement in the prediction of chromaticities corresponding to in-tragroup average CMFs, either by the CIEPO06 original model compared to the CIE 10° standard colorimetric observer (italics), or by the optimized CIEPO06 modelcompared to both original CIEPO06 model and CIE 10° standard colorimetric observer (bold).
Sarkar et al. Vol. 28, No. 10 / October 2011 / J. Opt. Soc. Am. A 2047

7. J. J. Vos, “Colorimetric and photometric properties of a 2° fun-damental observer,” Color Res. Appl. 3, 125–128 (1978).
8. CIE 1988, “2° spectral luminous efficiency function for photopicvision,” CIE 86-1990 (Commission Internationale de l’Éclairage,1990).
9. W. S. Stiles and J. M. Burch, “N.P.L. colour-matching investiga-tion: final report,” Opt. Acta 6, 1–26 (1959).
10. N. I. Speranskaya, “Determination of spectral color co-ordinatesfor twenty-seven normal observers,” Opt. Spectrosc. 7, 424–428(1959).
11. “Fundamental chromaticity diagram with physiological axes–Part I,” CIE Technical Report 170-1 (CIE, 2006).
12. A. Stockman and L. T. Sharpe, “The spectral sensitivities ofthe middle- and long- wavelengthsensitive cones derived frommeasurements in observers of known genotype,” Vision Res.40, 1711–1737 (2000).
13. A. Stockman, D. I. A. MacLeod, and N. E. Johnson, “Spectralsensitivities of human cones,” J. Opt. Soc. Am. A 10, 2491–2521(1993).
14. D. I. A. MacLeod and M. A. Webster, “Factors influencing thecolor matches of normal observers,” in Colour Vision: Physiol-ogy and Psychophysics, J. D. Mollon and L. T. Sharpe, eds.(Academic, 1983), pp. 81–92.
15. V. C. Smith, J. Pokorny, and Q. Zaidi, “How do sets of color-matching functions differ?” in Colour Vision: Physiology andPsychophysics, J. D. Mollon and L. T. Sharpe, eds. (Academic,1983).
16. F. Viénot, “Relations between inter- and intra-individual variabil-ity of color matching functions. experimental results,” J. Opt.Soc. Am. 70, 1476–1483 (1980).
17. G. Wyszecki and W. S. Stiles, Color Science: Concepts and
Methods, Quantitative Data and Formulae, 2nd ed. (Wiley,1982).
18. A. North and M. Fairchild, “Measuring color-matching functions.Part I,” Color Res. Appl. 18, 155–162 (1993).
19. A. North and M. Fairchild, “Measuring color-matching functions.Part II. New data for assessing observer metamerism,” ColorRes. Appl. 18, 163–170 (1993).
20. B. Oicherman, M. R. Luo, B. Rigg, and A. R. Robertson, “Effect ofobserver metamerism on colour matching of display and surfacecolours,” Color Res. Appl. 33, 346–359 (2008).
21. C. Oleari and M. Pavesi, “Grassmann’s laws and individualcolor-matching functions for nonspectral primaries evaluatedby maximum saturation technique in foveal vision,” ColorRes. Appl. 33, 271–281 (2008).
22. Y. Nakano, Y. Nakayasu, H. Morita, K. Suehara, J. Kohda, andT. Yano, “Individual difference of color matching functionsand its cause,” presented at the ISCC/CIE Expert Symposium,Ottawa, Ontario, Canada, 16–17 May 2006.
23. J. Neitz and G. H. Jacobs, “Polymorphism in normal human colorvision and its mechanism,” Vision Res. 30, 621–636 (1990).
24. J. C. He and S. K. Shevell, “Individual differences in cone photo-pigments of normal trichromats measured by dual Raleigh-typecolor matches,” Vision Res. 34, 367–376 (1994).
25. F. Viénot, L. Serreault, and P. P. Fernandez, “Convergence ofexperimental multiple Rayleigh matches to peak L- and M-photopigment sensitivity estimates,” Visual Neurosci. 23,1–8 (2006).
26. J. L. Barbur, M. Rodriguez-Carmona, J. A. Harlow, K.Mancuso, J. Neitz, and M. Neitz, “A study of unusual Rayleigh
matches in deutan deficiency,” Visual Neurosci. 25, 507–516(2008).
27. P. B. M. Thomas and J. D. Mollon, “Modelling the Rayleighmatch,” Visual Neurosci. 21, 477–482 (2004).
28. P. Csuti and J. Schanda, “Colour matching experiments withRGB-LEDs,” Color Res. Appl. 33, 108–112 (2008).
29. M. A. Webster, “Reanalysis of λmax variations in the Stiles-Burch10° color-matching functions,” J. Opt. Soc. Am. A 9, 1419–1421(1992).
30. L. T. Sharpe, A. Stockman, H. Jägle, and J. Nathans, “Opsingenes, cone photopigments, color vision, and color blindness,”in Color Vision: From Genes to Perception, 1st ed.,K. R. Gegenfurtner, L. T. Sharpe, and B. B. Boycott, eds.(Cambridge University, 2001), pp. 3–52.
31. A. Sarkar, L. Blondé, P. L. Callet, F. Autrusseau, J. Stauder, andP. Morvan, “Study of observer variability in modern display col-orimetry: an analysis of CIE 2006 model,” in Proceedings of the11th Congress of the International Colour Association (AIC),D. Smith, P. Green-Armytage, M. A. Pope, and N. Harkness, eds.(CD) (Colour Society of Australia, 2009).
32. V. C. Smith and J. Pokorny, “Chromatic-discrimination axes,CRT phosphor spectra and individual variation in color vision,”J. Opt. Soc. Am. A 12, 27–35 (1995).
33. O. Packer and D. R. Williams, “Light, the retinal image andphotoreceptors,” in The Science of Color, 2nd ed., S. K. Shevell,ed. (Elsevier, 2003), pp. 41–102.
34. V. C. Smith and J. Pokorny, “The design and use of a cone-chromaticity space,” Color Res. Appl. 21, 375–383 (1996).
35. E. Miyahara, V. C. Smith, and J. Pokorny, “How surrounds affectchromatic discrimination,” J. Opt. Soc. Am. A 10, 545–553(1993).
36. D. I. A. MacLeod and R. M. Boynton, “Chromaticity diagramshowing cone excitation by stimuli of equal luminance,” J.Opt. Soc. Am. A 69, 1183–1185 (1979).
37. R. M. Boynton and N. Kambe, “Chromatic difference steps ofmoderate size measured along theoretically critical axes,” ColorRes. Appl. 5, 13–23 (1980).
38. A. Stockman, Colour & Vision Research Laboratory website,http://www.cvrl.org/.
39. J. Pokorny, V. C. Smith, and M. Lutze, “Aging of the human lens,”Appl. Opt. 26, 1437–1440 (1987).
40. P. Csuti and J. Schanda, “A better description of metameric ex-perience of LED clusters,” in Proceedings of Light and Lighting
Conference with Special Emphasis on LEDs and Solid State
Lighting (Commission Internationale de l’Éclairage, 2009).41. A. E. Elsner, L. Berk, S. A. Burns, and P. R. Rosenberg, “Aging
and human cone photopigments,” J. Opt. Soc. Am. A 5,2106–2112 (1988).
42. W. H. Swanson and G. E. Fish, “Age-related changes in the col-our-match-area effect,” Vision Res. 36, 2079–2085 (1996).
43. A. B. Renner, H. Knau, M. Neitz, J. Neitz, and J. S. Werner,“Photopigment optical density of the human foveola and aparadoxical senescent increase outside the fovea,” VisualNeurosci, 21, 827–834 (2004).
44. M. A. Webster and D. I. A. MacLeod, “Factors underlyingindividual-differences in the color matches of normal obser-vers,” J. Opt. Soc. Am. A 5, 1722–1735 (1988).
45. V. C. Smith, J. Pokorny, and S. J. Starr, “Variability of color mix-ture data—I. Interobserver variability in the unit coordinates,”Vision Res. 16, 1087–1094 (1976).
2048 J. Opt. Soc. Am. A / Vol. 28, No. 10 / October 2011 Sarkar et al.


![Acrich MJT 5050 Series - seoulsemicon.comSpecification]SAW0L60A_R3.0_1712.pdf · 0.3373 0.3534 0.3293 0.3384 0.3369 0.3451 C0 C1 C2 CIE x CIE y CIE x CIE y CIE x CIE y 0.3376 0.3616](https://img.dokumen.tips/doc/110x75/5bf955f609d3f2ab7d8cc0ef/acrich-mjt-5050-series-specificationsaw0l60ar301712pdf-03373-03534.jpg)
![emmanuel.maggiori@inria.fr arXiv:1608.03440v2 [cs.CV] 26 ... · Emmanuel Maggiori Inria - TITANE emmanuel.maggiori@inria.fr Guillaume Charpiat Inria - TAO Yuliya Tarabalka Inria -](https://img.dokumen.tips/doc/110x75/5ed105940742b00927548a1b/inriafr-arxiv160803440v2-cscv-26-emmanuel-maggiori-inria-titane-inriafr.jpg)