Embed Size (px)
Citation preview

Stage 4 Distribution, April 21, 2009
UCPRC-TM-2006-10
December 2006
Technical Memorandum: UCPRC-TM-2006-10
FFFrrriiiccctttiiiooonnn TTTeeessstttiiinnnggg ooofff PPPaaavvveeemmmeeennnttt
PPPrrreeessseeerrrvvvaaatttiiiooonnn TTTrrreeeaaatttmmmeeennntttsss::: LLLiiittteeerrraaatttuuurrreee RRReeevvviiieeewww
Authors:Qing Lu and Bruce Steven
Work Conducted Under Name of Program “Friction Testing of Pavement Preservation Treatments”
as part of Maintenance Task Order FY06/07
PREPARED FOR: California Department of Transportation (Caltrans) Office of Roadway Research and Division of Maintenance Office of Pavement Preservation
PREPARED BY:
University of California Pavement Research Center
Davis and Berkeley

Stage 4 Distribution, April 21, 2009
UCPRC-TM-2006-10 ii
DOCUMENT RETRIEVAL PAGE
Technical Memorandum No.: UCPRC-TM-2006-10
Title: Friction Testing of Pavement Preservation Treatments: Literature Review
Authors: Qing Lu and Bruce Steven
Prepared for: California Department of Transportation Div. of Research and Innovation Office of Roadway Research and Division of Maintenance Office of Pavement Preservation
FHWA No.: Work Submitted:
April 30, 2008
Date:November 1,
2006
Strategic Plan Element No:
Status: Draft
Version No:1
Abstract: This memorandum reviews the different devices used to measure pavement surface friction, and the correlation between friction results measured using CTM 342 (California Skid Tester), the British Pendulum Tester, and other devices. It also reviews the methods used to calibrate friction results measured at different pavement temperatures, and the performance of fog seals, including the friction on fog seals.
Keywords: friction, skid resistance, fog seal, British Pendulum Tester, California Skid Tester
Proposals for implementation: • That the International Friction Index be used to allow comparison of friction measured from the
California Portable Skid Tester, British Pendulum Tester, Dynamic Friction Tester, and Locked Wheel Skid Trailer.
• That macrotexture be measured in conjunction with friction measurements to allow calculation of the International Friction Index.
Related documents:
Signatures:
Q. Lu 1st Author
B. Steven Technical Review
D. Spinner Editor
J. T. Harvey Principal Investigator
M. Samadian Caltrans Contract Manager

Stage 4 Distribution, April 21, 2009
UCPRC-TM-2006-10 iii
DISCLAIMER The contents of this report reflect the views of the authors who are responsible for the facts and accuracy of
the data presented herein. The contents do not necessarily reflect the official views or policies of the State of
California or the Federal Highway Administration. This report does not constitute a standard, specification,
or regulation.
PROJECT OBJECTIVES
The Office of Pavement Preservation of the Division of Maintenance of the California Department of
Transportation (Caltrans) has identified a need for a correlation between California Test Method (CTM)
342 and the British Pendulum Tester (BPT, ASTM E 303-93). The Division wants this correlation so fog
seals can be tested to determine whether they meet minimum requirements for friction prior to opening to
traffic. If those requirements are not met, the project contractor would be required to perform work that
brings friction above the minimum requirement.
The primary goal of this research is to determine whether the friction measurements made with CTM 342
and the British Pendulum Tester correlate, and, if they do, how strongly they correlate. A secondary goal of
this research is to investigate the change in friction caused by fog seals by measuring friction just before
placement of the fog seal and just after. Additional goals, to be completed if time and budget permit, are to
investigate the friction change in the two-month period after a fog seal is placed; and, to compare friction
measured using CTM 342, the BPT, and the Dynamic Friction Tester.
This memorandum provides a literature survey that summarizes the information available regarding
previously developed correlations between CTM 342, the BPT, and other friction measuring devices, and
the application and performance of fog seals.

Stage 4 Distribution, April 21, 2009
UCPRC-TM-2006-10 iv

Stage 4 Distribution, April 21, 2009
UCPRC-TM-2006-10 v
TABLE OF CONTENTS
List of Tables .............................................................................................................................................vii List of Figures............................................................................................................................................vii Abbreviations, Terms, and Standards Used in the Text......................................................................... ix
Referenced Standards ............................................................................................................................... x 1 Pavement Friction Testers and Correlations ............................................................................. 1
1.1 The PIARC Model and the International Friction Index (ASTM E 1960-03)................................ 1 1.2 Friction Measurement Devices ....................................................................................................... 3
1.2.1 California Portable Skid Tester (CTM 342)............................................................................ 3 1.2.2 British Pendulum Tester (ASTM E 303)................................................................................. 3 1.2.3 Drag Tester.............................................................................................................................. 4 1.2.4 Locked-Wheel Skid Trailer (ASTM E 274)............................................................................ 4 1.2.5 Mu-Meter (ASTM E 670-94).................................................................................................. 5 1.2.6 Automobile Method (ASTM E 445 / E 445M-88).................................................................. 5 1.2.7 GripTester ............................................................................................................................... 5 1.2.8 Dynamic Friction Tester (ASTM E 1911-98) ......................................................................... 5 1.2.9 Summary ................................................................................................................................. 6
1.3 Texture Measurement Methods ...................................................................................................... 6 1.3.1 Volumetric “Sand Patch” Test (ASTM E 965-96).................................................................. 7 1.3.2 Circular Track Meter (ASTM E2157-01) ............................................................................... 7 1.3.3 High-Speed Texture Lasers..................................................................................................... 7
1.4 Correlation of Testers ..................................................................................................................... 7 1.4.1 California Skid Tester (CTM 342) .......................................................................................... 8 1.4.2 British Pendulum Tester (ASTM E 303-93) ......................................................................... 10 1.4.3 Locked-Wheel Skid Trailer (ASTM E274)........................................................................... 11
1.5 Temperature Effect ....................................................................................................................... 12 1.6 Summary....................................................................................................................................... 15
2 Fog Seals ...................................................................................................................................... 17 2.1 Fog Seal Basics............................................................................................................................. 17 2.2 Fog Seal Performance................................................................................................................... 17 2.3 Summary....................................................................................................................................... 19
References.................................................................................................................................................. 21

Stage 4 Distribution, April 21, 2009
UCPRC-TM-2006-10 vi

Stage 4 Distribution, April 21, 2009
UCPRC-TM-2006-10 vii
LIST OF TABLES Table 1.1. IFI Calculations for Three Devices at the Same Location......................................................... 3 Table 1.2: Friction Measuring Devices......................................................................................................... 6 Table 1.3: Temperature Corrections for BPN Readings Using the TRL Rubber Slider (British Standard
7976)................................................................................................................................................... 14
LIST OF FIGURES Figure 1. The Friction Curve. (3).............................................................................................................. 24 Figure 2. The relationship between speed and friction for a given macrotexture..................................... 24 Figure 3. A California portable skid tester. (5)......................................................................................... 25 Figure 4. A typical British Pendulum Tester. ........................................................................................... 25 Figure 5. A Penn State DragTester. (5) .................................................................................................... 26 Figure 6. A typical ASTM standard skid trailer. (19)............................................................................... 26 Figure 7. A Mu-Meter. (5) ........................................................................................................................ 27 Figure 8. Grip Tester................................................................................................................................. 28 Figure 9. A Dynamic Friction Tester. (21) ............................................................................................... 28 Figure 10. Measurement of macrotexture using a volumetric method (4)................................................ 29 Figure 11. Correlation of California Skid Tester and British Portable Tester. (8) ................................... 30 Figure 12. Correlation of California Skid Tester and Pennsylvania State Drag Skid Tester.(10) ............ 31 Figure 13. Correlation of California Skid Tester and U.S. Bureau of Public Roads Skid Trailer
(BPR Skid Trailer with rib tire at 64 km/h). (11) ............................................................................... 32 Figure 14. Correlation of California Skid Tester and U.S. Bureau of Public Roads Skid Trailer
(BPR Skid Trailer with rib tire at 80 km/h). (11) ............................................................................... 33 Figure 15. Correlation of California Skid Tester and U.S. Bureau of Public Roads Skid Trailer
(BPR Skid Trailer with smooth tire at 80 km/h). (11)........................................................................ 34 Figure 16. Correlation of California Skid Tester and ASTM E 274 Skid Trailer (ASTM Skid
Trailer with rib tire at 64 km/h). (13) ................................................................................................. 35 Figure 17. Correlation of California Skid Tester and ASTM E 274 Skid Trailer (ASTM Skid
Trailer with rib tire at 80 km/h). (13) ................................................................................................. 36 Figure 18. Correlation of California Skid Tester and ASTM E 274 Skid Trailer (ASTM Skid
Trailer with smooth tire at 64 km/h). (13).......................................................................................... 37 Figure 19. Correlation of California Skid Tester and ASTM E 274 Skid Trailer (ASTM Skid
Trailer with smooth tire at 80 km/h). (13).......................................................................................... 38

Stage 4 Distribution, April 21, 2009
UCPRC-TM-2006-10 viii
Figure 20. Correlation of California Skid Tester (smooth tire) and Arizona Mu-Meter (re-plot
from data in Reference 14). ................................................................................................................ 39 Figure 21. Correlation of California Skid Tester (rib tire) and Arizona Mu-Meter (re-plot from
data in Reference 14).......................................................................................................................... 39 Figure 22. Correlation of coefficient of friction by California Skid Tester and Sand Patch texture
depth. (15) .......................................................................................................................................... 40 Figure 23. Correlation of British Pendulum Number to dynamic friction tester for sites at the NASA
Wallops Flight Facility. (2) ................................................................................................................ 40 Figure 24. Correlation of British Pendulum Number to GripTester (a – towed, b – pushed). (16) .......... 41 Figure 25. Correlation between stopping distance friction factor and skid number. (5) .......................... 42 Figure 26. Relationship between SN40 and BPN measured on open-graded asphalt concrete
pavements. (19) .................................................................................................................................. 42 Figure 27. Correlation between Mu-Meter and trailer conforming to ASTM E 274. (5) ......................... 43 Figure 28. Linear regression fit to BPN versus temperature for ten study sites when specimens were
intermediately polished. (23).............................................................................................................. 43 Figure 29. Temperature correction factors for British Pendulum Numbers suggested by different
researchers. ......................................................................................................................................... 44

Stage 4 Distribution, April 21, 2009
UCPRC-TM-2006-10 ix
ABBREVIATIONS, TERMS, AND STANDARDS USED IN THE TEXT ASTM American Society for Testing and Materials AC Asphalt concrete BPT British Pendulum Tester BPN British Pendulum Number RRL British Road Research Laboratory (now known as the Transport Research
Laboratory, TRL) CST, also referred to with CTM 342-95
California Portable Skid Tester
CT Meter Circular Track Meter DGAC Dense-graded asphalt concrete DF Tester Dynamic Friction Tester FHWA Federal Highway Administration FPP Foundation for Pavement Preservation F60 Friction component of IFI at 60 km/h FRS Friction measurement of a device at a slip speed S IFI International Friction Index IRI International Roughness Index MPD Mean profile depth MTD Mean texture depth NCHRP National Cooperative Highway Research Program OGAC Open-graded asphalt concrete PIARC Permanent International Association of Road Congresses PCC Portland cement concrete SFC Sideways Force Coefficient SCRIM Sideways Force Coefficient Routine Investigation Machine SN Skid number S Slip Speed Sp Speed Constant T Temperature, degrees Celsius T(K) Temperature, degrees Kelvin Tx Texture t Time BPR Skid Trailer U.S. Bureau of Public Roads Skid Trailer

Stage 4 Distribution, April 21, 2009
UCPRC-TM-2006-10 x
Referenced Standards
• ASTM E 274-97, “Standard Test Method for Skid Resistance of Paved Surfaces Using a Full-Scale Tire”
• ASTM E 303-98, “Standard Test Method for Measuring Surface Frictional Properties Using the British Pendulum Tester”
• ASTM E 501-94, “Standard Specification for Standard Rib Tire for Pavement Skid-Resistance Tests” • ASTM E 524-94, “Standard Specification for Standard Smooth Tire for Pavement Skid-Resistance
Tests” • ASTM E 965-01, “Standard Test Method for Measuring Pavement Macrotexture Depth Using a
Volumetric Technique” • ASTM E 1845-96, “Standard Test Practice for Calculating Pavement Macrotexture Mean Profile
Depth” • ASTM E 1911-02, “Standard Test Method for Measuring Paved Surface Frictional Properties Using
the Dynamic Friction Tester” • ASTM E 1960-98, “Standard Practice for Calculating International Friction Index of a Pavement
Surface” • ASTM E 2157-01, “Standard Test Method for Measuring Pavement Macrotexture Properties Using the
Circular Track Meter” • ISO/CD 13473: Characterization of Pavement Texture Utilizing Surface Profiles: Estimation of Mean
Profile Depth, Committee Draft from ISO/TC 43/SC 1/WC 39, ISO 1994
Stage 4 Distribution, April 21, 2009
UCPRC-TM-2006-10 1
1 PAVEMENT FRICTION TESTERS AND CORRELATIONS Pavement friction depends on both the microtexture of aggregates and the macrotexture of the overall
pavement surface. Microtexture, usually defined as small-scale texture up to 0.5 mm wavelengths, is
largely a function of the surface texture of aggregate particles, while macrotexture is a larger texture
between about 0.5 mm and 50 mm wavelengths (1, 2). Of the two texture types, microtexture affects the
adhesion area between aggregate and tire rubber and controls the pavement friction level at low speeds,
while macrotexture has a greater effect on hysteresis friction. Unlike microtexture, macrotexture also helps
to provide a drainage channel for water to escape. Macrotexture assumes a greater role at high speeds and is
the controlling factor in the speed dependency of friction (1). To adequately assess the pavement friction for
operational vehicles, the effects of both the micro- and macrotexture need to be evaluated in testing and
analysis. It is important to provide both microtexture and macrotexture parameters to ensure appropriate
frictional characteristics on wet pavements (2). In pavement engineering, a number of devices have been
developed to measure and characterize pavement surface friction, with different degrees of consideration of
the two texture types. Because each device measures friction in a different way, mainly due to the
mechanical action employed and the characteristic or response that is measured, it can be difficult to
directly compare the output from different devices.
An important parameter that influences the measurement of friction is slip speed, which is defined as the
velocity of a test tire surface relative to the pavement surface. The slip ratio is the ratio of the slip speed to
the device/vehicle speed. A free rolling wheel has a slip speed and slip ratio of zero; whilst a fully locked
wheel has a slip speed equal to the vehicle speed and a slip ratio of unity. The maximum value of friction is
usually obtained when the slip ratio is between 10 and 20 percent (3). The general relationship between
friction and slip ratio is shown in Figure 1.
1.1 The PIARC Model and the International Friction Index (ASTM E 1960-03)
The PIARC (Permanent International Association of Road Congresses) International Experiment to
Compare and Harmonize Texture and Skid Resistance Measurement, conducted in Belgium and Spain in
the fall of 1992, developed the International Friction Index (IFI). This index allows for the harmonizing of
friction measurements taken with different equipment and/or at different slip speeds to a common
calibrated index. ASTM E 1960-03 provides for harmonization of friction reporting for devices that use a
smooth-tread test tire. The IFI includes measurements of both macrotexture and friction on wet pavements:
a speed constant derived from the macrotexture measurement that indicates the speed-dependence of the
friction and a friction number corresponding to a slip speed of 60 km/h (38 mph).
Stage 4 Distribution, April 21, 2009
UCPRC-TM-2006-10 2
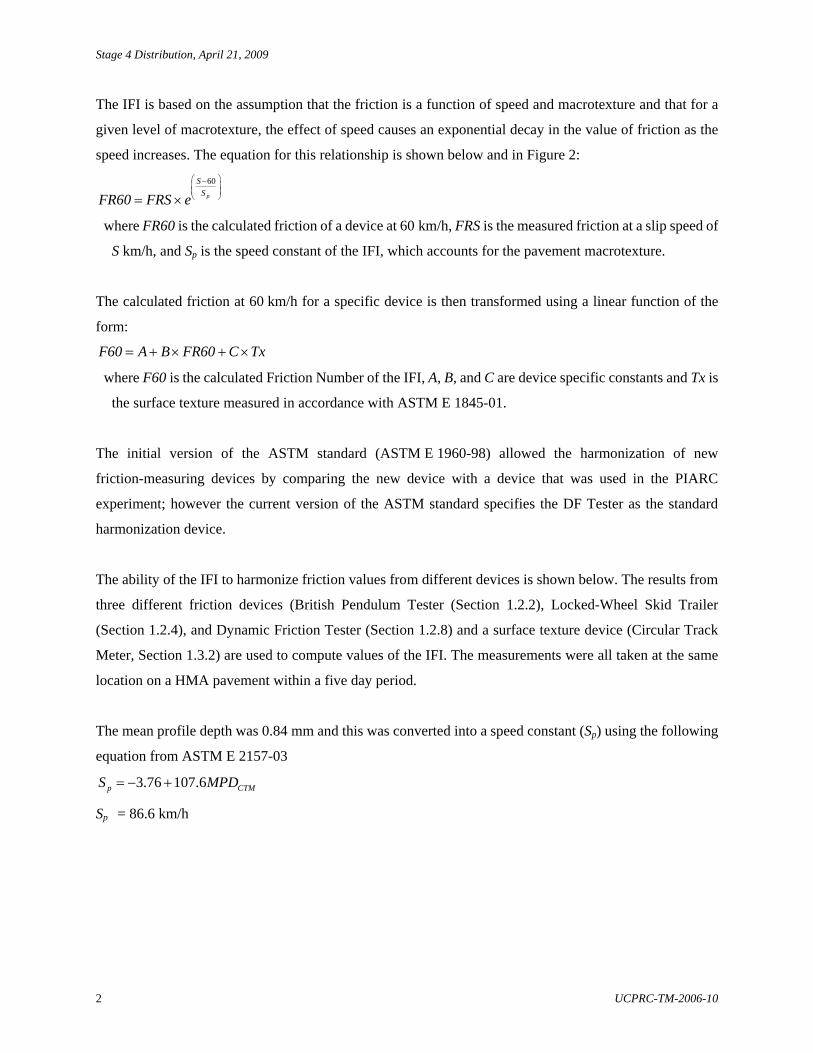
The IFI is based on the assumption that the friction is a function of speed and macrotexture and that for a
given level of macrotexture, the effect of speed causes an exponential decay in the value of friction as the
speed increases. The equation for this relationship is shown below and in Figure 2:
60
p
SSFR60 FRS e
⎛ ⎞−⎜ ⎟⎜ ⎟⎝ ⎠= ×
where FR60 is the calculated friction of a device at 60 km/h, FRS is the measured friction at a slip speed of
S km/h, and Sp is the speed constant of the IFI, which accounts for the pavement macrotexture.
The calculated friction at 60 km/h for a specific device is then transformed using a linear function of the
form:
F60 A B FR60 C Tx= + × + ×
where F60 is the calculated Friction Number of the IFI, A, B, and C are device specific constants and Tx is
the surface texture measured in accordance with ASTM E 1845-01.
The initial version of the ASTM standard (ASTM E 1960-98) allowed the harmonization of new
friction-measuring devices by comparing the new device with a device that was used in the PIARC
experiment; however the current version of the ASTM standard specifies the DF Tester as the standard
harmonization device.
The ability of the IFI to harmonize friction values from different devices is shown below. The results from
three different friction devices (British Pendulum Tester (Section 1.2.2), Locked-Wheel Skid Trailer
(Section 1.2.4), and Dynamic Friction Tester (Section 1.2.8) and a surface texture device (Circular Track
Meter, Section 1.3.2) are used to compute values of the IFI. The measurements were all taken at the same
location on a HMA pavement within a five day period.
The mean profile depth was 0.84 mm and this was converted into a speed constant (Sp) using the following
equation from ASTM E 2157-03
3.76 107.6p CTMS MPD= − +
Sp = 86.6 km/h
Stage 4 Distribution, April 21, 2009
UCPRC-TM-2006-10 3
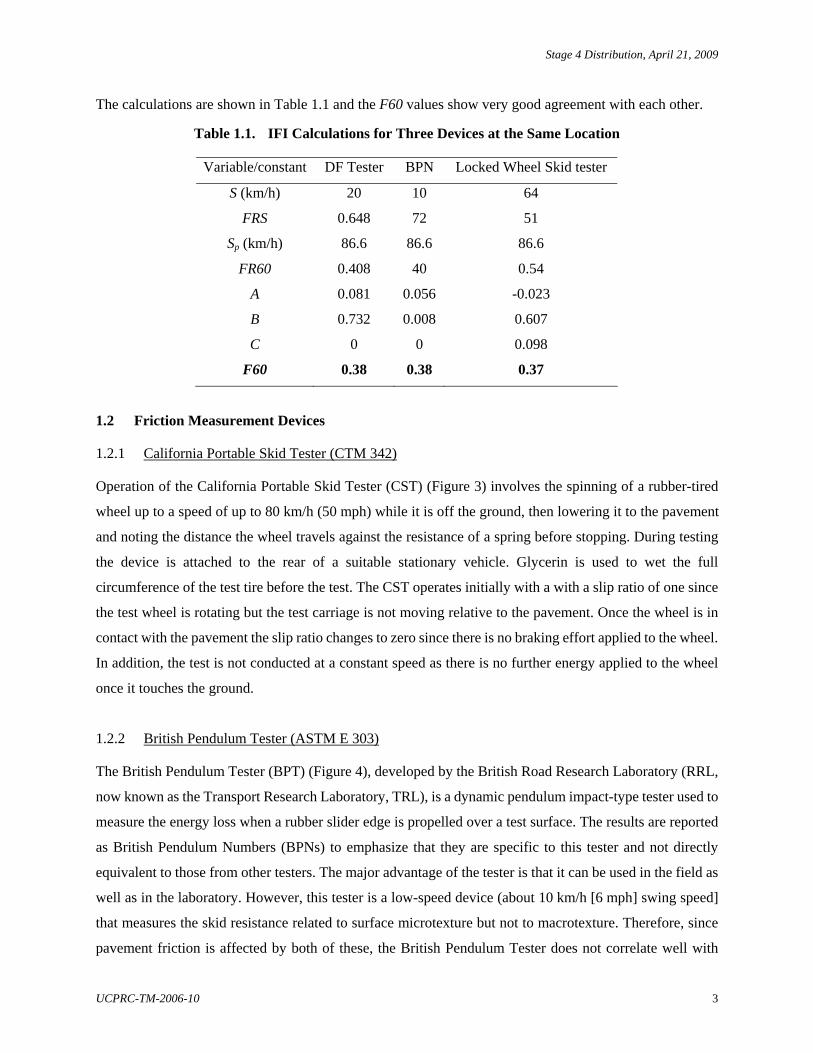
The calculations are shown in Table 1.1 and the F60 values show very good agreement with each other.
Table 1.1. IFI Calculations for Three Devices at the Same Location
Variable/constant DF Tester BPN Locked Wheel Skid tester
S (km/h) 20 10 64
FRS 0.648 72 51
Sp (km/h) 86.6 86.6 86.6
FR60 0.408 40 0.54
A 0.081 0.056 -0.023
B 0.732 0.008 0.607
C 0 0 0.098
F60 0.38 0.38 0.37
1.2 Friction Measurement Devices
1.2.1 California Portable Skid Tester (CTM 342)
Operation of the California Portable Skid Tester (CST) (Figure 3) involves the spinning of a rubber-tired
wheel up to a speed of up to 80 km/h (50 mph) while it is off the ground, then lowering it to the pavement
and noting the distance the wheel travels against the resistance of a spring before stopping. During testing
the device is attached to the rear of a suitable stationary vehicle. Glycerin is used to wet the full
circumference of the test tire before the test. The CST operates initially with a with a slip ratio of one since
the test wheel is rotating but the test carriage is not moving relative to the pavement. Once the wheel is in
contact with the pavement the slip ratio changes to zero since there is no braking effort applied to the wheel.
In addition, the test is not conducted at a constant speed as there is no further energy applied to the wheel
once it touches the ground.
1.2.2 British Pendulum Tester (ASTM E 303)
The British Pendulum Tester (BPT) (Figure 4), developed by the British Road Research Laboratory (RRL,
now known as the Transport Research Laboratory, TRL), is a dynamic pendulum impact-type tester used to
measure the energy loss when a rubber slider edge is propelled over a test surface. The results are reported
as British Pendulum Numbers (BPNs) to emphasize that they are specific to this tester and not directly
equivalent to those from other testers. The major advantage of the tester is that it can be used in the field as
well as in the laboratory. However, this tester is a low-speed device (about 10 km/h [6 mph] swing speed]
that measures the skid resistance related to surface microtexture but not to macrotexture. Therefore, since
pavement friction is affected by both of these, the British Pendulum Tester does not correlate well with

Stage 4 Distribution, April 21, 2009
UCPRC-TM-2006-10 4
measurements from full-scale tires that operate at high speeds (64 km/h [40 mph]) or more (5). The BPT
operates with a slip ratio of unity.
1.2.3 Drag Tester
The Drag Tester (Figure 5), a.k.a., the Penn State Drag Tester, is a hand-carried portable field tester,
developed by H.W. Kummer in 1963 at Pennsylvania State University. As the operator walks the tester, it
slides a rubber shoe (the same type used on the British Pendulum Tester) along the pavement. The friction
resistance experienced by the rubber shoe is measured through a hydraulic system and displayed on a
gauge. It is unknown whether this device is still being used. The description of the Drag Tester is included
in this technical memorandum as it was used in a Caltrans study in the 1960s and correlations between this
device and the California Portable Skid Tester are presented in Section 1.4.1.2.
1.2.4 Locked-Wheel Skid Trailer (ASTM E 274)
The Locked-Wheel Skid Trailer (ASTM E 274-97) measures the steady-state friction force on a locked test
wheel as it is dragged under constant load and at constant speed ([typically at 64 km/h [40 mph]) over a wet
pavement surface. In this test, water is sprayed on the pavement surface in front of the test tire when the tire
reaches test speed in order to simulate wet conditions. Friction of the pavement surface is determined from
the resulting force or torque and is reported as skid number (SN). A higher SN indicates greater frictional
resistance (6). Friction measured from this device is related to braking without antilock brakes. The
Locked-Wheel Skid Trailer operates with a slip ratio of unity.
Both rib and smooth tires can be used in the test, and they have been standardized by ASTM E 501-94 and
ASTM E 524-88, respectively. The friction measurements with a rib tire are insensitive to macrotexture
because the grooves in the tire tread provide channels much larger than the macrotexture of pavement
surfaces. Friction measurements with a smooth tire, however, are sensitive to both the microtexture and
macrotexture.
The skid resistance of paved surfaces in the U.S. is often determined using the Locked-Wheel Skid Trailer
(Figure 6). From a survey conducted in the NCHRP Synthesis 291 it was found that almost all (39 out of 50)
state highway agencies are using the locked-wheel device in field pavement friction testing (2). Two
significant advantages of this device are that it (a) produces a nearly continuous measure of skid resistance,
and (b) it operates at near to highway speeds, enabling the measurement of large sections of roadway
without the need for lane closures.

Stage 4 Distribution, April 21, 2009
UCPRC-TM-2006-10 5
1.2.5 Mu-Meter (ASTM E 670-94)
The Mu-Meter (Figure 7), which is primarily used on airport runways in the United States (2), measures the
side force friction of paved surfaces by pulling two freely rotating test wheels angled to the direction of
motion (7.5°) over a wetted pavement surface at a constant speed (typically 64 km/h [40 mph]) while the
test wheels are under a constant static load. Friction measured from this device is related to the ability of a
vehicle to maintain control on curves. The Mu-Meter operates with a slip ratio of 0.13.
1.2.6 Automobile Method (ASTM E 445 / E 445M-88)
The automobile method is the most natural way to determine the skid resistance of a pavement. In this
method, an automobile is driven on wet pavement at a typical speed of 64 km/h (40 mph), and then its
wheels are locked until the vehicle comes to a stop. The stopping distance is measured to represent the
non-steady skid resistance. In this test procedure, the slip ratio is unity.
1.2.7 GripTester
The GripTester is a fixed slip device commonly used in Europe (Figure 8). The test wheel rotates with a
constant slip, i.e., the wheel is lightly braked to provide a difference in velocity between the test wheel and
the speed of the tester. The slip ratio is usually between 10 and 20 percent. This is usually accomplished by
incorporating a gear reduction of the test wheel drive shaft from the drive shaft of the host vehicle, or
through hydraulic retardation of the test wheel (2). Friction measured with this device is related to braking
with anti-lock brakes. The GripTester can either be pushed by an operator (<5 km/h [3 mph]) or towed
behind a vehicle at higher speeds (50+ km/h [30 mph]).
1.2.8 Dynamic Friction Tester (ASTM E 1911-98)
The Dynamic Friction Tester (DF Tester) is a portable device for measuring dynamic coefficient of friction
(Figure 9). The tester consists of a horizontal spinning disk fitted with three rubber sliders that are made of
the same materials as the friction test tires (ASTM E 501-94). Usually the disk rotates at a tangential
velocity of 90 km/h (55 mph), and is then lowered onto the wet pavement surface. Friction is measured
continuously as the disk slows. The DF Tester operates with a slip ratio of unity. The DF Tester is relatively
small and can test a site in a few minutes. When used with pavement macrotexture measurement, such as
the mean profile depth (MPD), DF Tester results can be used to calculate the IFI and to calibrate other
friction testers that use a smooth-tread tire, as described in ASTM E 1960-03.

Stage 4 Distribution, April 21, 2009
UCPRC-TM-2006-10 6
1.2.9 Summary
The friction measurement devices described in this section can be summarized in terms of spot
measurement versus continuous measurement, partial or fully fixed slip mode, and high or low speed. Spot
measurements require lane closures in which to operate and are subject to operator bias when selecting test
locations. Likewise low-speed devices require some form of traffic control (either lane or rolling closure),
but it might not be possible to operate high-speed devices in a construction zone due to physical limitations
on run lengths or other safety factors. The productivity of the device needs to be considered as well in order
to obtain a suitable number of measurements so that a representative value for a test section can be obtained.
With the exceptions of the California Portable Skid Tester (CST), the Drag Meter, and the Automobile
Method, all the other devices have been harmonized (in conjunction with macrotexture measurements) to
calculate a common friction index, the IFI. A harmonizing equation for the CST could be developed by
using the device in parallel with the DFT and a macrotexture measurement. A comparison of the devices,
except for the Drag Meter and the Automobile Method, are presented in Table 1.2.
Table 1.2: Friction Measuring Devices
Device Stationary (spot) /Continous measurement
Operational Mode
Slip Ratio
Test Speed (km/h)
California PortableSkid Tester Stationary Free wheel 1.0 80
British Pendulum Tester Stationary Slider 1.0 10
Locked Wheel Skid Trailer Continous Locked Wheel 1.0 64
Mu-Meter Continous Side force 0.13 20–80
GripTester Continous Fixed Slip 0.145 30–90
Dynamic Friction Tester Stationary Slider 1.0 0–90
1.3 Texture Measurement Methods
Texture measurement methods are described in this technical memorandum because the pavement
macrotexture depth is required to calculate the International Friction Index. Macrotexture is defined as
texture that has wavelengths between 0.5 mm and 50 mm and peak-to-peak amplitudes normally vary from
0.01 to 20 mm.

Stage 4 Distribution, April 21, 2009
UCPRC-TM-2006-10 7
1.3.1 Volumetric “Sand Patch” Test (ASTM E 965-96)
The “Sand Patch” test measures the average depth of the pavement surface macrotexture. In this test, a
known volume of material (typically sand (100% passing #50 sieve and 0% passing #100 sieve) or glass
spheres of a uniform size (0.2 mm) is carefully spread in a circle on the pavement surface so that all the
surface voids are filled with sand. The surface of the material should be level with the highest points of the
aggregate (Figure 10). The average macrotexture depth is calculated by dividing the volume of material by
the average diameter of the circle. The calculated texture depth is called the mean texture depth (MTD).
1.3.2 Circular Track Meter (ASTM E2157-01)
The Circular Track Meter (CT Meter) uses a high frequency laser to measure surface profile. The laser head
travels around a circular path with a radius of 142 mm; the perimeter of the circle is divided into eight
segments with a length of 100 mm. This allows the calculation of the MPD in accordance with ISO 13473.
The CT Meter is often used in conjunction with the DF Tester in order to allow the IFI to be determined.
1.3.3 High-Speed Texture Lasers
High-speed texture lasers are usually used in conjunction with longitudinal profile measuring equipment to
measure pavement roughness. A laser operating at a frequency of 16 kHz generally provides sufficient
accuracy for calculating pavement roughness (IRI) when the test vehicle is operating at highway speeds. In
order to obtain data of sufficient accuracy and quantity to measure macrotexture, a laser needs to operate at
a frequency of at least 32 kHz for data collection at highway speeds. The use of a high frequency laser
allows the collection of both pavement roughness and macrotexture metrics. The ASTM standard
(E1845-01) provides a process to calculate the MPD from longitudinal profile data.
1.4 Correlation of Testers
Different testers measure different aspects of pavement friction. Even when the same tire or slider is used,
other details may vary, such as speed, mode of operation, and water film control. Therefore, it is impossible
to obtain a 1:1 correlation between friction measurement results from different types of testers. NCHRP
Synthesis 14 (5) discussed the reasons for the difficulty in obtaining good correlation, which mainly lie in
the complexities of the friction behavior of rubber and tires. The friction of a tire on pavement consists of
two components: adhesion and hysteresis. The relative contribution of the two components changes with
the micro- and macrotexture of pavement surface. Microtexture affects the adhesion component most
strongly, while macrotexture has a greater affect on the hysteresis component. The adhesion component can
disappear if the surface is completely covered by a water film, whereas the hysteresis component can

Stage 4 Distribution, April 21, 2009
UCPRC-TM-2006-10 8
disappear on a perfectly smooth surface. Both components change with speed and temperature and other
factors in a complex way. Therefore, as stated in NCHRP Synthesis 14:
“…general correlations are, at least in a practical sense, not possible and that when correlations are found, it is either because the surfaces on which they were obtained included only a limited range of types, or the testers do not differ significantly in operating principles, or the expected precision of the correlation is low. In short, when a correlation is found this should be considered fortuitous, rather than as fulfillment of a justified expectation.”
1.4.1 California Skid Tester (CTM 342)
1.4.1.1 California Skid Tester versus British Pendulum Tester
In 1968, Caltrans studied the correlation between the California Skid Tester (CST) (CTM 342) and the
British Pendulum Tester (BPT) (8). To provide a large range of friction values, different pavement surfaces
were tested, including portland cement concrete (PCC), dense- and open-graded asphalt concrete (AC), and
screening seal coats. In the study the California Skid Tester was first calibrated against UC Berkeley
Professor Moyer’s skid trailer to simulate the worst conditions encountered by traffic (locked wheel,
smooth tire, wet pavement, and a speed of 80 km/h [50 mph]). A linear relationship was developed between
the results measured with the CST and the BPT, as shown in Figure 11. However, the report neither
presented any of the data that was used to develop the correlation nor discussed the goodness of correlation
and the range of scatter of the data.
Figure 11 shows the recommended British Pendulum Tester values with the tentative California Skid Tester
minimum. The figure also shows the minimum acceptable friction in Virginia, which was obtained from
D. C. Mahone’s chart of correlation (7) between the British Portable Tester and a Virginia skid test car at
64 km/h (40 mph). Using D. C. Mahone’s chart, a friction value of 0.45 in Virginia is equivalent to about a
friction value of 0.30 on the California scale. This led to the conclusion that readings on the California tester
above 0.28 should probably be satisfactory for all sites, with the possible exception of curves (8).
1.4.1.2 California Skid Tester versus Drag Tester
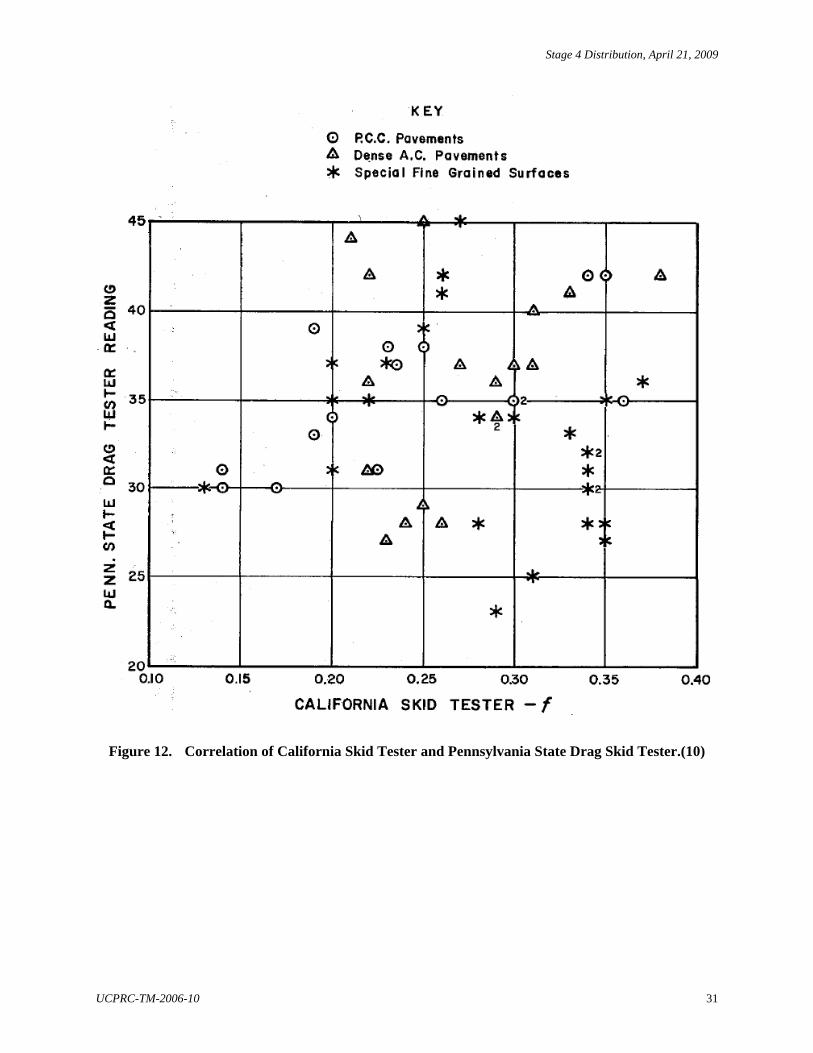
In a 1967 study in California, Skog (10) found the correlation between the CST and the Penn State Drag
Tester to be poor when different types of surfaces were compared (Figure 12). A significant correlation
existed when only PCC surfaces were used in the analysis. This is not surprising in view of the totally
different configurations and test speeds of the two testers. The Drag Tester was operated at a low speed
while the CST was calibrated for 80 km/h, so the skid number/speed gradient could significantly affect the
correlation.

Stage 4 Distribution, April 21, 2009
UCPRC-TM-2006-10 9
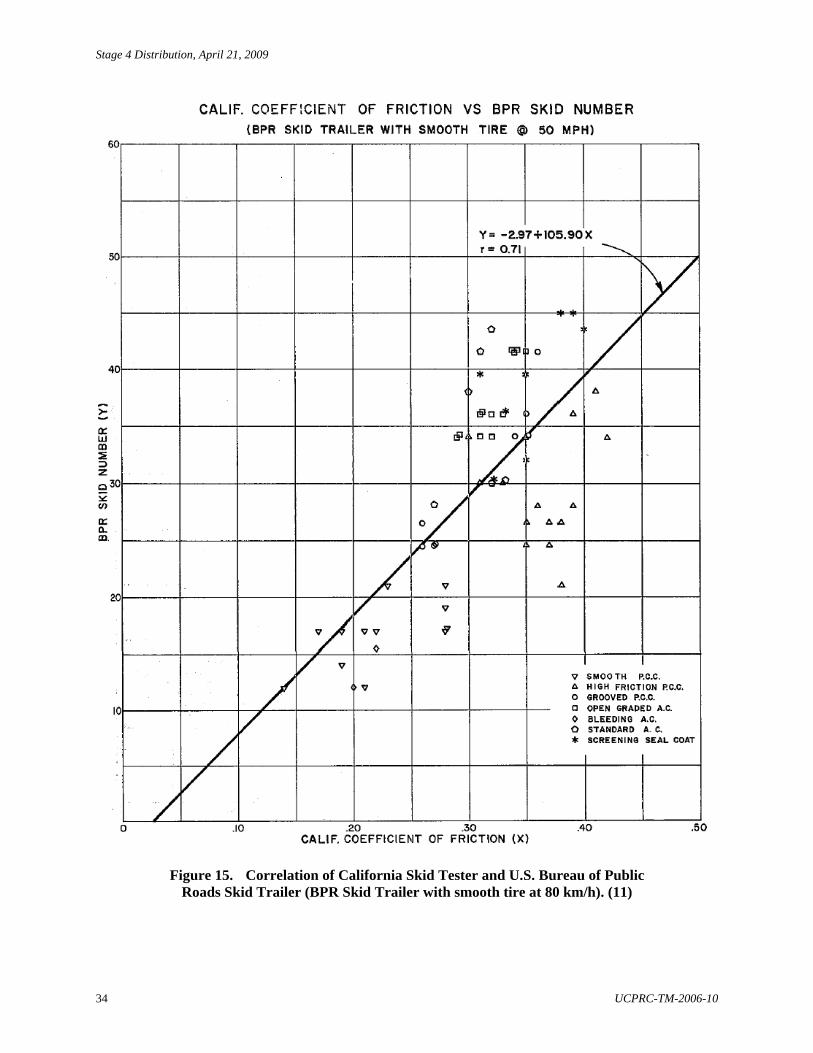
1.4.1.3 California Skid Tester versus Locked-Wheel Skid Trailer
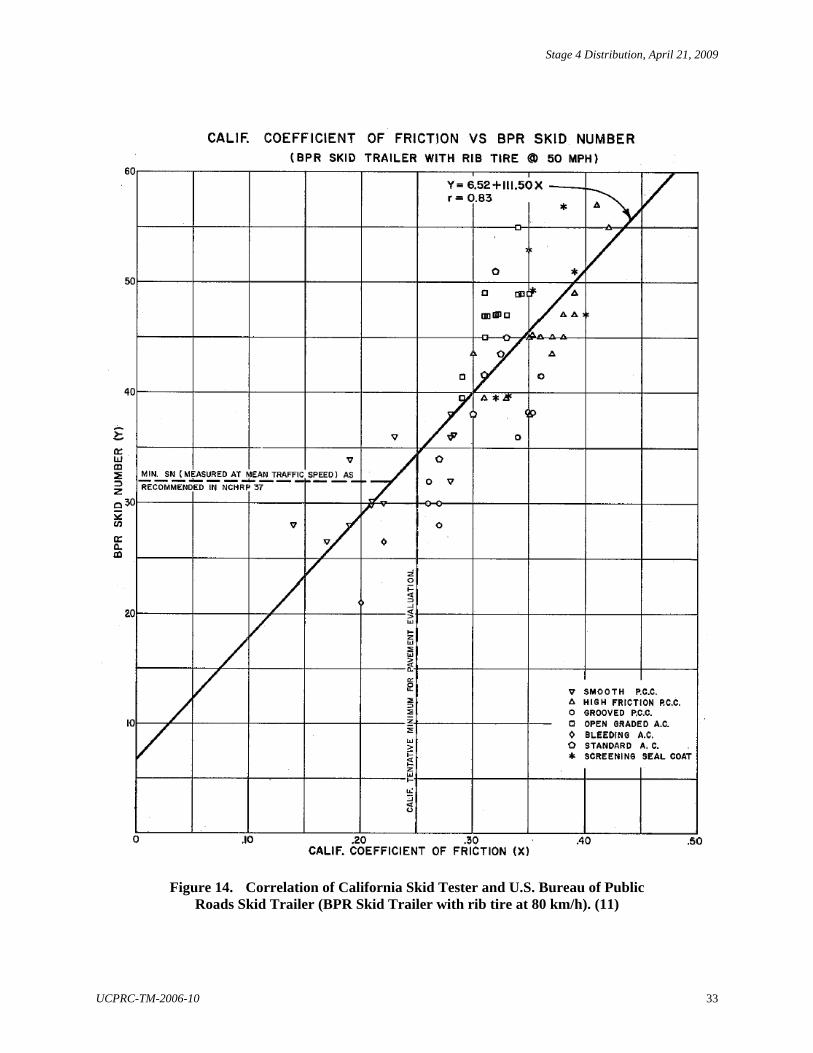
In 1968 Skog and Johnson (11) studied the correlation between the CST and the U.S. Bureau of Public
Roads (BPR) Skid Trailer (a locked-wheel skid trailer essentially in accordance with ASTM E 274) by
measuring the friction results of seven types of pavement surfaces, including PCC and AC, at eleven
locations in the vicinity of Sacramento, California. The BRP Skid Trailer used two rib tires and tested at a
speed of 64 km/h (40 mph). The CST was first calibrated against Professor Moyer’s skid trailer unit (12)
with its standard test conditions: locked wheels, smooth tires, wet pavement and a speed of 80 km/h
(50 mph). For a better comparison, additional testing was performed using the BPR unit with its speed
changed to 80 km/h (50 mph) and its rib tires replaced by smooth tires. For all the test conditions
investigated, correlations indicated that the CST results could be used to predict the BPR skid number
(Figure 13 through Figure 15). The study found that the California tentative minimum coefficient of
friction, 0.25, which was based on a skid-resistance inventory of a large number of different pavements in
the California Highway System and had been checked against those used in England, Virginia, and Florida,
corresponded quite well to the tentative minimum skid number (37) for main rural highways as
recommended in NCHRP 37 (Figure 14).
During 1969 and 1970, the California Division of Highways conducted a correlation study between the
CST and the ASTM E 274 Skid Tester (13). Two ASTM skid trailer units (A and B) were purchased and
included in the study, the purpose of which was to further determine the adequacy of the tentative California
minimum coefficient of friction, as checked in an earlier correlation study with the BPR Skid Trailer (11).
These tests were conducted as follows: ASTM Skid Trailer A ran three skid tests as rapidly as possible,
attempting to get the middle skid test at a specified location. The three tests were then averaged and
considered as one. This procedure was repeated both at 64 km/h (40 mph) and 80 km/h (50 mph), and also
with the skid tester using standard rib tires and smooth tires. Once this series of tests was done, the CST
tested the sites in accordance with California Test Method (CTM) 342. A total of five tests, 7.5 m apart,
were run at each site and averaged as one.
Good correlations were obtained between the CST and ASTM Skid Trailer A for the four test conditions
investigated in the study, as shown in Figure 16 through Figure 19.
A correlation study was also conducted between the two ASTM Skid Testers. Excellent correlation was
obtained at the standard ASTM test conditions. Excellent correlations were also obtained for SN
conversions of different test speeds to the 64 km/h standard speed.

Stage 4 Distribution, April 21, 2009
UCPRC-TM-2006-10 10
Test results also revealed that the standard error of the ASTM skid tester is 0.9–1.5 SN for asphalt
pavements and 1.1–2.0 for portland concrete pavements.
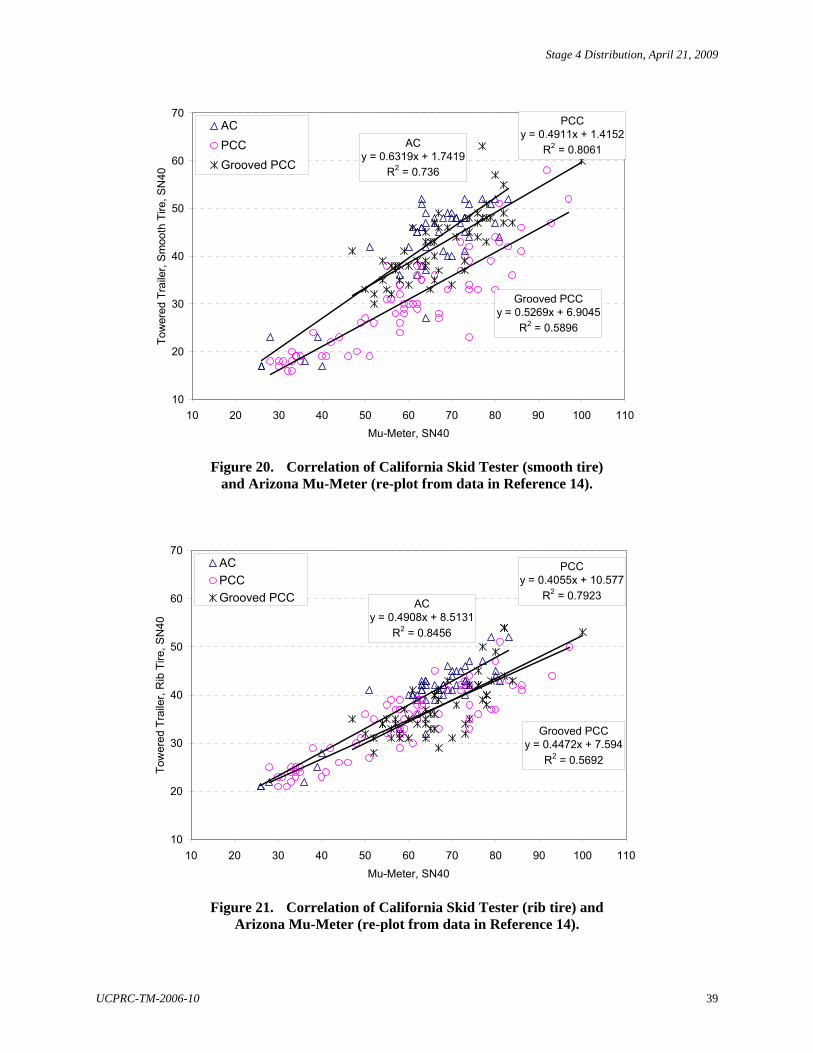
1.4.1.4 California Skid Tester versus Mu-Meter
In 1972, California Division of Highways conducted a correlation study between the CST and Arizona’s
Mu-Meter for a variety of surfaces (14). All tests were performed at 64 km/h (40 mph) with a water film on
the surface approximately 1 mm thick. It was found that a linear correlation exists between the skid
resistance values obtained by the two testers, and that the correlation is best on PCC pavements, as shown in
Figure 20 and Figure 21. The report also noted that although a reasonable correlation exists, “it appears that
the Mu-Meter values become somewhat erratic on the rougher surfaces.”
1.4.1.5 California Skid Tester versus Sand Patch Test
In 1974, Caltrans investigated methods to measure surface macrotexture and their correlations with skid
resistance data acquired using the CST (15). Pavement surface macrotexture was measured by the Sand
Patch test. A variety of pavement surfaces were tested, including open-graded asphalt concrete (OGAC),
dense-graded asphalt concrete (DGAC), chip-sealed and fog-sealed AC, and new, polished, and grooved
PCC. The results showed a general trend toward a higher skid number with increasing texture depth. The
relationship, however, was neither clear nor definitive, as illustrated in Figure 22.
1.4.2 British Pendulum Tester (ASTM E 303-93)
As stated in ASTM E 303-93, the British Pendulum Number (BPN) from the British Pendulum Tester
(BPT) does not necessarily agree or correlate with other slipperiness measuring equipment. If a relationship
between observed BPN and some “true” value of skid resistance exists, it has not and probably cannot be
studied.
1.4.2.1 British Pendulum Tester versus Drag Tester
The Penn State University Drag Tester uses the same slider as the BPT, but it is normally operated at a
lower speed than the BPT. Kummer reported good correlation when using a slider made from
ASTM E 249-64T rubber (5).

Stage 4 Distribution, April 21, 2009
UCPRC-TM-2006-10 11
1.4.2.2 British Pendulum Tester versus Dynamic Friction Tester
The DF Tester measures the friction between three rubber sliders and a wet pavement surface. When the
rotating speed is slow, the working mechanism between the DF Tester and the BPT tends to be similar. In
NCHRP Synthesis 291, it was found that when the slip speed is 20 km/h (12 mph), the DF Tester friction
correlates highly with BPN values, as shown in Figure 23. The measurements at the annual National
Aeronautics and Space Administration (NASA) Friction Workshops (1993–1999), however, showed that
BPT values are significantly more variable than DF Tester values (2).
1.4.2.3 British Pendulum Tester versus GripTester
The correlation between BPT and the GripTester was studied in Australia and the results were presented at
the 2005 International Surface Friction Conference in New Zealand (16). A limited number of data show a
correlation between measurements of the two testers when the GripTester was either towed at 50 km/h
(30 mph) or pushed at 5 km/h (3 mph), as shown in Figure 24. The paper, however, did not give the details
of the data, such as the pavement surface type and the test temperature.
1.4.3 Locked-Wheel Skid Trailer (ASTM E274)
As stated in ASTM E274-97, the relationship of SN values to some “true” value of locked-wheel sliding
friction has not been established, and the SN values do not necessarily agree or correlate directly with those
obtained by other pavement friction measuring methods. Therefore, the SN values are intended for use in
evaluating the skid resistance of a pavement relative to that of other pavements or for evaluating changes in
the skid resistance of a pavement with the passage of time.
1.4.3.1 ASTM E 274 Skid Trailer versus Automobile Method
In general, pavement friction measured with the ASTM E274 skid trailer is numerically higher than that
represented by the stopping distance measured by the automobile method. This is because the skid number
in ASTM E274 is typically determined at a constant speed of 64 km/h (40 mph), but the stopping distance
in the automobile method is measured after the vehicle decelerates from 64 to 0 km/h (40 to 0 mph).
Friction on wet pavements increases as wheel speed decreases. Correlation between the skid number and
the stopping distance, however, can be found due to the commonality of the test procedure in both methods.
Figure 25 shows the correlation obtained by Mahone and Runkie, as referred to in NCHRP Synthesis 14 (5).

Stage 4 Distribution, April 21, 2009
UCPRC-TM-2006-10 12
1.4.3.2 ASTM E 274 Skid Trailer versus British Pendulum Tester
NCHRP Synthesis 14 (5) warned that any correlation between BPT and ASTM E 274 would be “purely
fortuitous” because the BPT not only measures friction at low speeds, but it also brings the edge of a rubber
shoe (instead of a tire) into contact with the pavement. NCHRP Report 37 (17) gave a correlation that was
based on Dillard and Mahone, but cautioned that the correlation “is not very satisfactory”.
In 2002 Caltrans measured the skid resistance of some 25-mm and 12.5-mm OGAC pavements in District 1
using both the ASTM E274 skid trailer and the BPT. The skid trailer ran at a speed of 64 km/h (40 mph).
The reported value for a given section was determined by averaging the measurements made along the
entire section. The reported BPN values were averages of three measurements obtained from randomly
selected stations on each section. Testing was performed between September 23 and 25, 2002, at six
different sites along three routes and in three counties. The data from this study did not produce a
meaningful correlation between the two tests due to the considerable scatter and the limited range of data
(Figure 26). However, the report suggested that it would be possible to develop a meaningful correlation
between SN and BPN when more data were added and distinctions were made between the different types
of mixes (19).
1.4.3.3 ASTM E274 Skid Trailer versus Mu-Meter
Gallaway et al. (20) showed that the Mu-Meter and an ASTM E274 tester had a good correlation when both
testers used tires without tread and both operated with the pavement wetted by sprinkler truck (Figure 27),
but the correlation was not very good when the ASTM E274 tester strictly followed the specifications. In
either case, the average maximum deviation from the correlation line was ± 5 SN at 64 km/h (40 mph) for
tests on the same pavement.
1.5 Temperature Effect
Friction measurement changes not only with testing method and pavement surface type but also with
uncontrollable climate variables, one of which is temperature. Temperature affects the measured friction
properties because it changes the physical properties of tire rubber and asphalt pavement surfaces, which
are both viscoelastic materials. Seasonal variation of pavement friction has long been noticed in the field by
researchers (22). The general trend of the variation is that skid resistance decreases during seasons with
warmer temperatures and increases during seasons with colder temperatures (23). These variations should
be considered when comparing different pavement surfaces.

Stage 4 Distribution, April 21, 2009
UCPRC-TM-2006-10 13
Hill and Henry (24) developed a model to account for short-term and long-term seasonal effects based on
the analysis of friction and climate data collected on experimental test sites in Pennsylvania from 1978 to
1980, as shown below (24, 25):
FLSt SNSNSNSN ++= (1)
where SNt = Skid number at time t SNS = Short-term weather-related variation SNL = Long-term seasonal variation SNF = Skid resistance independent of short- and long-term effects
Short- and long-term variations were modeled by regression as functions of rainfall, traffic, pavement
temperature, and other factors.
Oliver (26) investigated the seasonal variation of skid resistance in Australia using the Sideways Force
Coefficient Routine Investigation Machine (SCRIM) and found that pavement friction decreased with
temperature according the following Equation (26):
25/ 0.563 45.9 /( 80)TSFC SFC T= + + (R2 = 0.83) (2)
where SFCT = Side force coefficient of SCRIM at tire temperature T (°C) SFC25 = Side force coefficient of SCRIM at a tire temperature of 25°C
Oliver (26) also studied the temperature effect on friction using a British Pendulum Tester. A set of
laboratory-prepared surfaces, covering a range of BPNs between 15 and 90 and a range of surface textures
between 0 and 1.5 mm, were tested outdoors with temperatures ranging from 7°C to 59°C. A good
correlation between the BPN and the pavement temperature was observed, as follows (26):
20/ 1 0.00525 ( 20)TBPN BPN T= − × − (3)
where BPNT = Skid resistance value obtained at pavement surface temperature T (°C) BPN20 = Skid resistance value obtained at a pavement surface temperature of 20°C T = Pavement surface temperature (°C)
In ASTM E 303, it is required that the rubber compound for the slider pad shall be natural rubber meeting
the requirements of the RRL (TRL) or synthetic rubber as specified in ASTM E 501-94 and
ASTM E 524-88. In the British Standard 7976, standard simulated shoe sole (Four-S) rubber and TRL
rubber are the two most common types of slider pad material. If the TRL rubber slider is used, a temperature
correction factor (Table 1.3) is applied to correct the test results to a standard temperature of 20°C because

Stage 4 Distribution, April 21, 2009
UCPRC-TM-2006-10 14
natural rubber friction is temperature dependent. The ASTM-specified synthetic rubber was formulated to
be independent of temperature and therefore no temperature correction is made.
Table 1.3: Temperature Corrections for BPN Readings Using the TRL Rubber Slider (British Standard 7976)
Surface Temperature (°C) Correction Factor (BPN units)
8 to 11 -3 12 to 15 -2 16 to 18 -1 19 to 22 0 23 to 28 +1 29 to 35 +2
In tropical climates, the TRL recommends that the BPN should be corrected to a standard temperature of
35°C using the following relation (27):
BPN35 = (100+T) / 135BPNT (4)
where BPN35 = Skid resistance value at 35°C BPNT = Measured skid resistance value at temperature T T = Temperature of test (°C)
At this standard temperature, the corrected values will be 3–5 units lower than comparable surfaces at 20°C.
In a survey on motor vehicle tires and related aspects commissioned by the European Commission of the
United Nations, a British Pendulum Tester was used to measure the surface friction of wet tracks in
accordance with ASTM E 303-93 using the rubber specified in ASTM E 501-94. The following formula
was used for temperature correction (28):
BPN = BPNT + 0.34T – 0.0018T2 – 6.1 (5)
where BPN = Corrected skid resistance value BPNT = Measured skid resistance value T = Wetted track surface temperature (°C)
Recently Bazlamit et al. in Ohio conducted laboratory experiments to isolate and quantify the temperature
effect on friction (23). British pendulum tests were performed on ten mixes at five temperatures (0, 10, 20,
30, and 40°C). By regression analysis, it was found that a one degree increase in temperature causes a
0.232 decrease in British Pendulum Number for intermediately polished surfaces (Figure 28), and the
following equation was developed to predict the BPN at any temperature if the BPN is known at 20°C:

Stage 4 Distribution, April 21, 2009
UCPRC-TM-2006-10 15
( ) 68.0108 0.232 ( )T KBPN T KΔ = − (6) where∆BPNT(K) = number to be added to the BPN reading at T(K)=293.15 K (20°C) to get the BPN
number at temperature T(K) T(K) = temperature in Kelvin
It should be noted that Bazlamit et al. did not state whether they used the rubber specified in
ASTM E 501-94 or the TRRL rubber. Based on a correlation equation between BPN and SN developed by
Kissoff (29),
0.862 9.69SN BPN= − (7)
Bazlamit et al. derived a similar equation to adjust the SN at any temperature:
( ) 58.453 0.1994 ( )T KSN T KΔ = − (8)
where ∆SNT(K) = number to be added to the SN reading at T(K) = 293.15 K T(K) = temperature in Kelvin
Luo (2003) studied the effect of pavement temperature on friction using the SN data measured by a
Locked-Wheel Skid Trailer (ASTM E 274-97) in Virginia (30). Pavement and air temperatures were
measured using thermocouples located 38 mm below the surface and close to the pavement surface,
respectively. It was found that at low speeds (less than 35 km/h [22 mph] for the smooth tire and 50 km/h
[30 mph] for the rib tire), pavement friction tends to decrease mildly as pavement temperature increases. At
higher speeds, friction measurements are mostly insensitive to pavement temperature. Limited data also
revealed that the friction measurements on the open-graded friction course (OGFC) surfaces are insensitive
to temperature changes.
The different temperature correction factors suggested in the literature for the British Pendulum Number
(BPN) are plotted together for comparison (Figure 29). It can be seen that the correction factors suggested
in British Standard 7976 are slightly smaller than those suggested by Bazlamit and the European
Commission, and those suggested by Oliver when BPN is around 40. For the temperature range of 15°C to
50°C, the correction factors suggested by Bazlamit, the European Commission, and Oliver (BPN=40) are
similar.
1.6 Summary
The literature review reveals that good correlation between different friction testers may be obtained only
when the test conditions and working principles of the testers are similar. Previous studies and research in
Stage 4 Distribution, April 21, 2009
UCPRC-TM-2006-10 16
the literature show that good correlation exists between the California Skid Tester, the Locked-Wheel Skid
Tester (ASTM E 274), and the Arizona Mu-Meter. The British Pendulum Tester values have good
correlation with the Drag Tester and the Dynamic Friction Tester operated at a low speed. The correlation
between the testers that utilize a test wheel and those that use a rubber slider, however, is generally poor.
The International Friction Index (IFI) that was an outcome of the 1992 PIARC Experiment produced a
workable method to allow comparison of different test devices by the combination of friction and texture
measurements. Any future comparisons between the California Skid Tester, the Locked-Wheel Skid Tester,
and any other device should be undertaken through the use of the IFI.
Temperature affects friction measurement, and generally higher temperature leads to lower friction value.
The temperature effect, however, is dependent on vehicle speed and pavement surface type.

Stage 4 Distribution, April 21, 2009
UCPRC-TM-2006-10 17
2 FOG SEALS 2.1 Fog Seal Basics
A fog seal is a dilute emulsion applied without an aggregate cover. The purpose of applying a fog seal is to
seal and to enrich an under-asphalted surface, to waterproof an open-texture pavement and prevent raveling
under traffic, or simply to improve the surface appearance (31). Fog seals are suitable for treating raveled
and aged pavements in otherwise good condition, but they are not recommended on high-speed roadways or
pavements with severe structural damage. Fog seals can also be used as pre-seals or on chip seals to hold
chips in place and prevent flying ones from damaging vehicles.
The materials used in fog seals are asphalt emulsion and water, and, in some cases, additives for special
purposes. The emulsion types may be cationic or anionic. The most common asphalt emulsions used are
Cationic Slow Seal (CSS-1), CSS-1h, SS-1, or SS-1h, and the typical dilution ratio is one part asphalt
emulsion to one part water. Polymers are not commonly used with fog seals.
After construction, traffic should be kept off the fog seal until the emulsion cures. If immediate use is
required, traffic should travel at a reduced speed to prevent skidding and/or splashing the emulsion on cars.
Fog seal may reduce the skid resistance of pavements by filling the surface texture of pavements. In the
Caltrans Fog Seal Guideline, it is recommended that skid resistance shall be measured using CTM 342 after
fog seal has cured, and the measured coefficient of friction shall be no less than 0.30 (32). After opening to
traffic for a certain period, pavement friction may increase due to the wear-off of some asphalt from the
pavement surface (31). King and King reported the findings of a Federal Highway funded pavement
preservation project that included two sites in California. They found that the friction dropped by 33 percent
immediately
2.2 Fog Seal Performance
Fog seals have been used for pavement preservation and maintenance for many years. However, the
number of literature references that discuss fog seal performance is limited. Following are some results
found in the literature.
Estakhri and Agarwal studied the effects in Texas of a fog seal on chip seal applications, regular asphalt
pavements, and laboratory molded asphalt specimens (33, 34). In their study, four test roads were treated
with a fog seal on chip seals and observed for two years. It was found that fog seal improved the aggregate

Stage 4 Distribution, April 21, 2009
UCPRC-TM-2006-10 18
retention rates over the corresponding control surfaces for every test road, and a fog seal application to a
chip seal should be applied before the first winter after chip seal application. Estakhri and Agarwal also
monitored for two years the performance of regular asphalt pavements treated with a fog seal, and found no
visual difference between treated and control sections. They also performed laboratory experiments, in
which laboratory compacted cores were treated with fog seal and aged at 60°C for 42 days. The resilient
modulus of the aged cores showed no significant effect of the fog seal in reducing the hardening rate of the
mixtures. Estakhri and Agarwal finally concluded that fog seals applied at a rate of 0.05 gallon per square
yard are not effective at reducing the aging rate but can effectively correct specific surface problems such as
raveling.
Outcalt conducted a field experiment in Colorado to study the effects of chip seal and fog seal (35). Four
test sections were built as follows:
• Section I: Lightweight chips
• Section II: Standard chips
• Sections III: Standard chips with a fog seal of High Float Rapid Set (HFRS-2P) emulsion dilute
1:1 and applied at a rate of 0.05 gallon per square yard
• Section IV: Untreated control section
After four years’ observation of performance, Outcalt concluded that:
• Overall the treated sections were in better condition than the control section.
• Skid resistance was high for all sections at the time of final evaluation.
• Fog seals showed a significant improvement in short-term performance in terms of
waterproofing and chip retention. However, there was no apparent long-term advantage to
applying a fog seal over a standard chip seal.
Asphalt Systems, Inc. used GSP (an emulsified liquid asphalt containing Gilsonite, resin, and
asphalt) as a fog seal on Ohio Logan County Rd 154 and monitored the skid resistance and conditions of the
road for five years (36). It was found that the treated section experienced 23 percent less oxidation than the
untreated section and showed little sign of cracking after five years. Skid resistance over the five-year
period showed no significant difference between the treated and untreated sections.
Currently, the Federal Highway Administration (FHWA) and the Foundation for Pavement Preservation
(FPP) have a five-year study underway to evaluate the effects of spray-applied sealer/rejuvenators on the
long-term performance of asphalt pavements. The study includes a national workshop to identify the

Stage 4 Distribution, April 21, 2009
UCPRC-TM-2006-10 19
state-of-practice use of fog seals and other rejuvenators, and test section construction and evaluation. The
test sections are to be built in multiple states to evaluate different products and different pavement surface
types (dense-graded surface, friction course surface, and chip seal surface). A comprehensive testing plan is
used to monitor and to evaluate treatment performance, by four approaches:
• Chemical and rheological analysis
• Nondestructive testing
• Destructive testing
• Pavement performance assessment
The chemical and rheological analysis, to be conducted by the Western Research Institute, will determine
the chemical compatibility between rejuvenator/sealant and roadway asphalt, predict oxidation and aging
propensity of roadway asphalt before and after treatment, and assess whether the sealer/rejuvenators can
improve the rheological properties of the pavement.
The nondestructive testing will evaluate pavement stiffness before and after treatment using a portable
seismic pavement analyzer, and determine the degree of pavement oxidation using a portable magnetic
resonance device.
The destructive testing will take cores from the field, and then cut and test them in a dynamic shear
rheometer.
Functional pavement performance assessment will measure the pavement texture using a Circular Texture
Meter (CT Meter), the surface friction using a Dynamic Friction Tester (DF Tester), and the
infiltration/waterproofing properties using a skid abrader outflow meter.
The chemical, structural, and functional performance of the test sections will be closely monitored in this
study so that their time trajectories can be determined (e.g., the process of initial loss and subsequent
recovery of surface friction).
2.3 Summary
The literature review reveals that fog seals may initially reduce pavement friction due to the presence of
binder coating the exposed aggregate surfaces, but that the seals have no long-term adverse effect as that
binder is removed by traffic over time. Generally, fog-sealed surfaces and untreated surfaces have similar
skid resistance for most of their service life. The in-progress FHWA/FPP fog seal study is expected to
significantly improve our knowledge of the effects of fog seals on pavement performance, and the best
design, construction, and evaluation practice.

Stage 4 Distribution, April 21, 2009
UCPRC-TM-2006-10 20
Stage 4 Distribution, April 21, 2009
UCPRC-TM-2006-10
REFERENCES 1. McDaniel, R. S., and Coree, B. J. Identification of Laboratory Techniques to Optimize Superpave
HMA Surface Friction Characteristics. North Central Superpave Center, Purdue University, West Lafayette, IN, Report No. SQDH 2003-6, June 2003.
2. Henry, J. J. Evaluation of Pavement Friction Characteristics, Synthesis of Highway Practice No. 291. Transportation Research Board, Washington D.C., 2000.
3. Lamm, R. Psarianos, B. & Mailaender, T. Highway Design and Traffic Safety Engineering Handbook. McGraw Hill, 1999
4. Woodside, A., and Woodward, D. "Chapter 18 - Wet Skid Resistance." Highways - The Location, Design, Construction and Maintenance of Pavements, C. A. O'Flaherty, ed., Butterworth Heinemann, Oxford, UK, 479-499, 2002.
5. Skid Resistance. NCHRP Synthesis of Highway Practice 14, National Research Council (U.S.). Highway Research Board, 1972.
6. Kandhal, P. S., Parker, F., and Mallick, R. B. Aggregate Tests for Hot Mix Asphalt: State of the Practice. NCAT Report 97-06. National Center for Asphalt Technology, Auburn University, Alabama. November 1997.
7. Jackson, N. M. Measuring Pavement Friction Characteristics at Variable Speeds for Added Safety. Report No. #DO-51684 (DO-2022), University of North Florida, Division of Engineering, South Jacksonville, FL, July 31, 2005.
8. Zube, E., Skog, J. B., and Kemp, G. R. Field and Laboratory Studies on Skid Resistance of Pavement Surfaces. State of California, Department of Public Works, Division of Highways, Materials and Research Department, Research Report 633126, February 1968.
9. Mahone, D. C. A Correlation of the British Portable Tester and the Virginia Skid Test Car. Virginia Council of Highway Investigation and Research, May 1961.
10. Skog, J. A. Final Report on a Study of the Pennsylvania State Drag Tester for Measuring the Skid Resistance of Pavement Surfaces. State of California, Department of Public Works, Division of Highways, Materials and Research Department, Research Report M&R 633251 B-3-2, May 1967.
11. Skog, J.B., and Johnson, M. H. Correlation Between California and BPR Skid Testers. State of California, Department of Public Works, Division of Highways, Materials and Research Department, Research Report 633126-5, July 1969.
12. Moyer, R. A. Effect of Pavement Type and Composition on Slipperiness-California Experience. Proceedings First International Skid Prevention Conference, Part II, 1959.
13. Mann, G. W., and Svetich, R. R. Skid Tester Correlation Study. State of California, Department of Public Works, Division of Highways, Materials and Research Department, Research Report 633126-7, October 1971.
14. Compare Test Results of the California Skid Tester with the Arizona Mu-Meter. Transportation Materials and Research Library. November 1972.

Stage 4 Distribution, April 21, 2009
UCPRC-TM-2006-10 22
15. Doty, R. N. A Study of the Sand Patch and Outflow Meter Methods of Pavement Surface Texture Measurement. State of California, Department of Transportation, Division of Highways, Highway Research Report CA-DOT-TL-3126-10-74-24, June 1974.
16. Mackey, G. Road Surface Friction: Measurement, Testing and Accuracy. International Surface Friction Conference: Roads and Runways. Christchurch, New Zealand, May 2005.
17. Kummer, H. W., and Meyer, W. E. Tentative Skid-Resistance Requirements for Main Rural Highways. NCHRP Report 37, 1967.
18. Dillard, J. H., and Mahone, D. C. Measuring Road Surface Slipperiness. ASTM Special Technical Publication 366, 1963.
19. Evaluation of Surface Skid Resistance on OGAC Mixes Used in District 1. California Department of Transportation, Materials Engineering and Testing Services, Office of Flexible Pavement Materials, Sacramento, California, December 3, 2002.
20. Gallaway, B. M., and Rose, J. G. Comparison of Highway Friction Measurements Taken in the Slip and Skid Modes. Highway Research Record No. 376, 1971.
21. Dynamic Friction Tester. Product Guide. Nippo Sangyo Co., Ltd. www.nippou.com/en/products/dft.html, accessed September 10, 2006.
22. Giles, C. G., Sabey, B. E., and Cardew, K. H. F. Development and Performance of the Portable Skid Resistance Tester. Road Research Technical Paper Number 66, London, 1964.
23. Bazlamit, S. M., and Reza, F. Changes in Asphalt Pavement Friction Components and Adjustment of Skid Number for Temperature. Journal of Transportation Engineering, Vol. 131, No. 6, June 2005.
24. Hill, B. J., and Henry, J. J. Surface Materials and Properties Related to Seasonal Variations in Skid Resistance. Pavement Surface Characteristics and Materials. ASTM Special Technical Publication 763. American Society of Testing and Materials, Philadelphia, 1982.
25. Kuttesch, J. S. Quantifying the Relationship between Skid Resistance and Wet Weather Accidents for Virginia Data. Thesis, Master of Science, Virginia Polytechnic Institute and State University, Blacksburg, Virginia, September 13, 2004.
26. Oliver, J. W. H. Seasonal Variation of Skid Resistance in Australia. Australia Road Research Board, Special Report No. 37, 1989.
27. A Guide to the Pavement Evaluation and maintenance of Bitumen-Surfaced Roads in Tropical and Sub-tropical Countries. Overseas Road Note 18. Transport Research Laboratory, CCrowthorne, Berkshire, United kingdom, 1999.
28. Reithmaier, D. W., and Salzinger, D. T. Motor Vehicle Tyres and Related Aspects. Final Report. TÜV Automotive GmbH, Commissioned by The European Commission, Enterprise Directorate General, Unit ENTR/F/5. 2003.
29. Kissoff, N. V. Investigation of Regional Differences in Ohio Pavement Skid Resistance Through Simulation Modeling. PhD Dissertation, University of Toledo, Toledo, Ohio, 1988.

Stage 4 Distribution, April 21, 2009
UCPRC-TM-2006-10 23
30. Luo, Y.. Effect of Pavement Temperature on Frictional Properties of Hot-Mix-Asphalt Pavment Surfaces at the Virginia Smart Road. Thesis, Master of Science, Virginia Polytechnic Institute and State University, Blacksburg, Virginia, January 8, 2003.
31. Asphalt Seal Coats. Technology Transfer (T2). Washington State Department of Transportation. March 2003.
32. Fog Seal Guidelines. State of California, Department of Transportation, Office of Pavement Preservation, Sacramento, California, October 2003.
33. Prapaitrakul, N., Freeman, T., and Glover, C. J. Analyze Existing Fog Seal Asphalts and Additives: Literature Review. Texas Transportation Institute, Research and Technology Implementation Office, Report No. FHWA/TX-06/0-5091-1. December 2005.
34. Estakhri, C. K., and Agarwal, H. Effectiveness of Fog Seals and Rejuvenators for Bituminous Pavement Surfaces. Research Report 1156-1F, Project No. 1156, Texas Transportation Institute, College Station, 1991.
35. Outcalt, W. SHRP Chip Seal. Report No. CDOT-DTD-R-2001-20, Colorado Department of Transportation Research Branch, December 2001.
36. Asphalt Systems, Inc. The True Story of Rejuvenation. The Solution, www.asiroads.com/theSolution/theSolution.asp, Salt Lake City, Utah, accessed September 12, 2006.

Stage 4 Distribution, April 21, 2009
UCPRC-TM-2006-10 24
Figure 1. The Friction Curve. (3)
0.0
0.2
0.4
0.6
0.8
1.0
0 20 40 60 80 100 120 140Speed
Fric
tion
Figure 2. The relationship between speed and friction for a given macrotexture.

Stage 4 Distribution, April 21, 2009
UCPRC-TM-2006-10 25
Figure 3. A California portable skid tester. (5)
Figure 4. A typical British Pendulum Tester.

Stage 4 Distribution, April 21, 2009
UCPRC-TM-2006-10 26
Figure 5. A Penn State DragTester. (5)
Figure 6. A typical ASTM standard skid trailer. (19)

Stage 4 Distribution, April 21, 2009
UCPRC-TM-2006-10 27
Figure 7. A Mu-Meter. (5)

Stage 4 Distribution, April 21, 2009
UCPRC-TM-2006-10 28
Figure 8. Grip Tester.
Figure 9. A Dynamic Friction Tester. (21)

Stage 4 Distribution, April 21, 2009
UCPRC-TM-2006-10 29
Figure 10. Measurement of macrotexture using a volumetric method (4).

Stage 4 Distribution, April 21, 2009
UCPRC-TM-2006-10 30
Figure 11. Correlation of California Skid Tester and British Portable Tester. (8)
Stage 4 Distribution, April 21, 2009
UCPRC-TM-2006-10 31
Figure 12. Correlation of California Skid Tester and Pennsylvania State Drag Skid Tester.(10)

Stage 4 Distribution, April 21, 2009
UCPRC-TM-2006-10 32
Figure 13. Correlation of California Skid Tester and U.S. Bureau of Public Roads Skid Trailer (BPR Skid Trailer with rib tire at 64 km/h). (11)
Stage 4 Distribution, April 21, 2009
UCPRC-TM-2006-10 33
Figure 14. Correlation of California Skid Tester and U.S. Bureau of Public Roads Skid Trailer (BPR Skid Trailer with rib tire at 80 km/h). (11)
Stage 4 Distribution, April 21, 2009
UCPRC-TM-2006-10 34
Figure 15. Correlation of California Skid Tester and U.S. Bureau of Public Roads Skid Trailer (BPR Skid Trailer with smooth tire at 80 km/h). (11)

Stage 4 Distribution, April 21, 2009
UCPRC-TM-2006-10 35
Figure 16. Correlation of California Skid Tester and ASTM E 274 Skid Trailer (ASTM Skid Trailer with rib tire at 64 km/h). (13)

Stage 4 Distribution, April 21, 2009
UCPRC-TM-2006-10 36
Figure 17. Correlation of California Skid Tester and ASTM E 274 Skid Trailer (ASTM Skid Trailer with rib tire at 80 km/h). (13)

Stage 4 Distribution, April 21, 2009
UCPRC-TM-2006-10 37
Figure 18. Correlation of California Skid Tester and ASTM E 274 Skid Trailer (ASTM Skid Trailer with smooth tire at 64 km/h). (13)

Stage 4 Distribution, April 21, 2009
UCPRC-TM-2006-10 38
Figure 19. Correlation of California Skid Tester and ASTM E 274 Skid Trailer (ASTM Skid Trailer with smooth tire at 80 km/h). (13)
Stage 4 Distribution, April 21, 2009
UCPRC-TM-2006-10 39
ACy = 0.6319x + 1.7419
R2 = 0.736
PCCy = 0.4911x + 1.4152
R2 = 0.8061
Grooved PCCy = 0.5269x + 6.9045
R2 = 0.5896
10
20
30
40
50
60
70
10 20 30 40 50 60 70 80 90 100 110Mu-Meter, SN40
Tow
ered
Tra
iler,
Sm
ooth
Tire
, SN
40
ACPCCGrooved PCC
Figure 20. Correlation of California Skid Tester (smooth tire) and Arizona Mu-Meter (re-plot from data in Reference 14).
ACy = 0.4908x + 8.5131
R2 = 0.8456
PCCy = 0.4055x + 10.577
R2 = 0.7923
Grooved PCCy = 0.4472x + 7.594
R2 = 0.5692
10
20
30
40
50
60
70
10 20 30 40 50 60 70 80 90 100 110Mu-Meter, SN40
Tow
ered
Tra
iler,
Rib
Tire
, SN
40
ACPCCGrooved PCC
Figure 21. Correlation of California Skid Tester (rib tire) and Arizona Mu-Meter (re-plot from data in Reference 14).

Stage 4 Distribution, April 21, 2009
UCPRC-TM-2006-10 40
Figure 22. Correlation of coefficient of friction by California
Skid Tester and Sand Patch texture depth. (15)
Figure 23. Correlation of British Pendulum Number to dynamic
friction tester for sites at the NASA Wallops Flight Facility. (2)

Stage 4 Distribution, April 21, 2009
UCPRC-TM-2006-10 41
(a)
(b)
Figure 24. Correlation of British Pendulum Number to GripTester (a – towed, b – pushed). (16)

Stage 4 Distribution, April 21, 2009
UCPRC-TM-2006-10 42
Figure 25. Correlation between stopping distance friction factor and skid number. (5)
Figure 26. Relationship between SN40 and BPN measured on open-graded asphalt concrete pavements. (19)

Stage 4 Distribution, April 21, 2009
UCPRC-TM-2006-10 43
Figure 27. Correlation between Mu-Meter and trailer conforming to ASTM E 274. (5)
Figure 28. Linear regression fit to BPN versus temperature for ten study sites when specimens were intermediately polished. (23)

Stage 4 Distribution, April 21, 2009
UCPRC-TM-2006-10 44
-10
-8
-6
-4
-2
0
2
4
6
8
10
0 10 20 30 40 50 60Temperature (C)
Cor
rect
ion
Fact
orBS7976BazlamitEU CommissionOliver (BPN=40)Oliver (BPN=60)Oliver (BPN=80)
Figure 29. Temperature correction factors for British Pendulum Numbers suggested by different researchers.