Embed Size (px)
Citation preview

Freshman Admissions and General Admissions Office/Campus Tours
Transfer Center
Admissions Processing
Calling Center
Barsema Alumni and Visitor Center Office
Office of Admissions UnitsOffice of Admissions Units
NIU

PRIORITY STUDENT PRIORITY STUDENT SEGMENTSSEGMENTS
Primary-Pool Students – new freshmen (ACT 21, top 33%High School Rank / 3.25 GPA).
High-Achieving Students – new freshmen who have ACT composite scores of 25-27 and rank in the top 25%-top 10% of the
high school class (3.50 -3.75 GPA) and new transfers who have grade point averages of 3.25 or above.
Multi-Cultural Students – new freshmen and new transfers (African American, Asian, Latino, Native American) who meet NIU’s
published admission requirements.
Transfer students who satisfy NIU transfer admissions requirements.
NIU
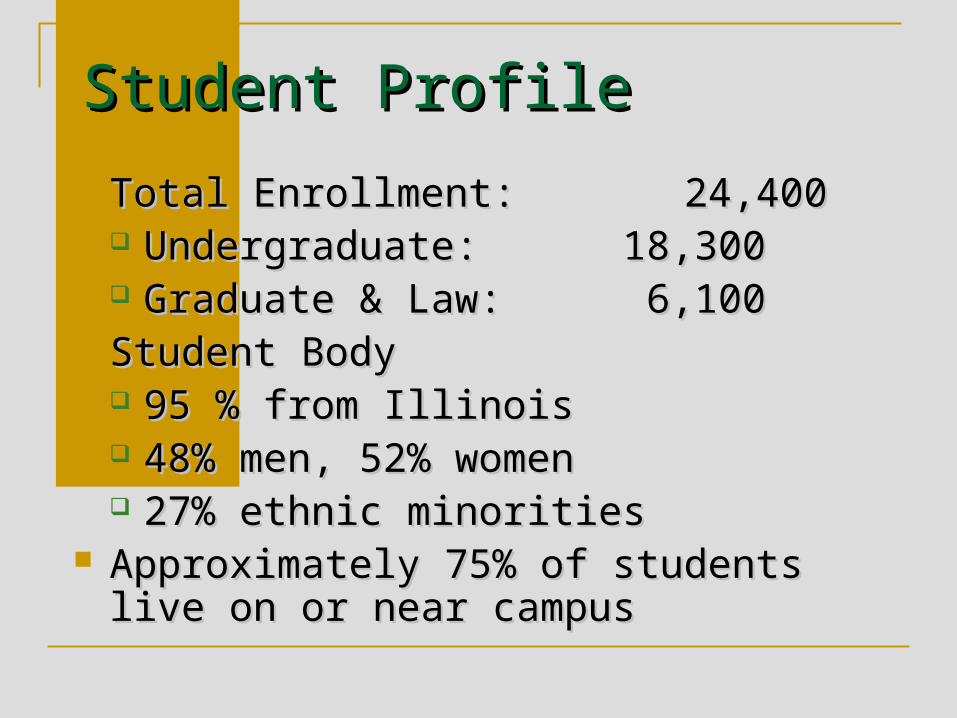
Student ProfileStudent Profile
Total Enrollment:Total Enrollment: 24,40024,400 Undergraduate:Undergraduate: 18,30018,300 Graduate & Law:Graduate & Law: 6,100 6,100
Student BodyStudent Body 95 % from Illinois95 % from Illinois 48% men, 52% women48% men, 52% women 27% ethnic minorities27% ethnic minorities
Approximately 75% of students live on or Approximately 75% of students live on or near campusnear campus

Freshman ApplicationsFreshman ApplicationsOver 17,700 For FallOver 17,700 For Fall
APPLIED
YEAR 2005 2006 2007 2008 2009 2009 v 2008
TOTAL Freshmen TOTAL Transfers
15,0035,576
16,0145,712
16,7465,799
17,2105,535
17,7124,947
2.9%-10.6%
NIU
Each application requires the processing of an ACT score, transcripts, letters of recommendation.
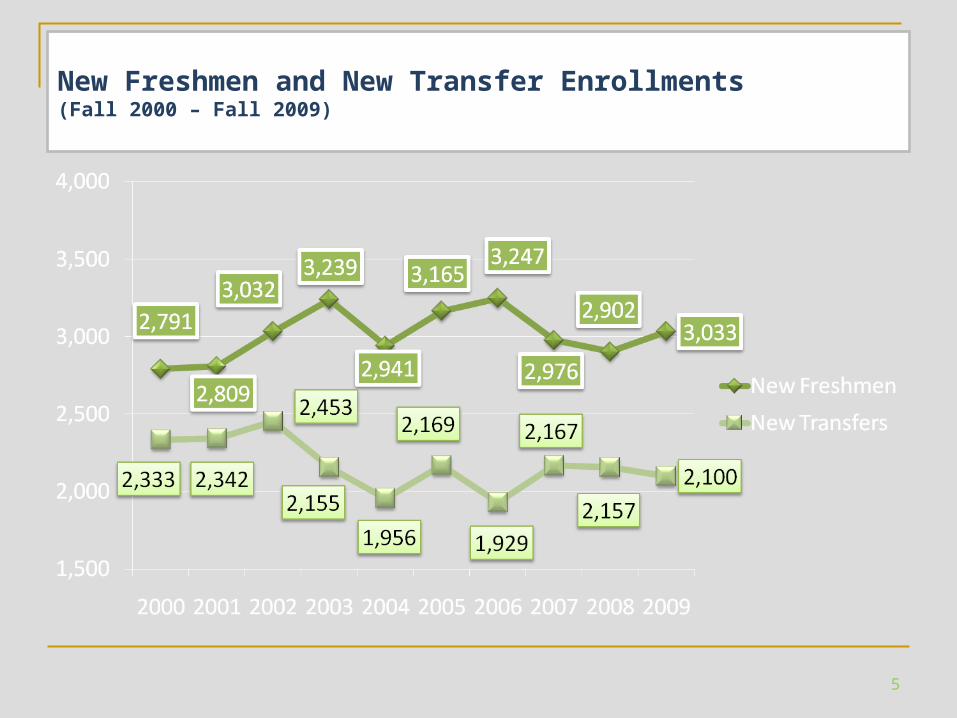
New Freshmen and New Transfer Enrollments(Fall 2000 – Fall 2009)
5

Geographic SegmentsFreshman Class
85-91% Major Market SegmentsAPPLIED ENROLLED
SEGMENT 2005 2006 2007 2008 2009 2005 2006 2007 2008 2009 2009 v 2008
Cook County 6,790 7,281 7,546 8,494 8927 1,284 1,296 1,199 980 1323 35.0%
Du Page County 1,829 1,951 1,827 1,852 1895 434 422 309 294 336 14.3%
Kane County 936 1,007 1,026 1,164 891 255 259 259 238 207 -13.0%
Lake County 1,102 1,210 1,152 1,150 1176 220 272 198 141 202 43.3%
McHenry County 578 636 699 664 574 141 157 162 138 120 -13.0%
Rockford Area 433 489 519 479 505 106 133 134 96 143 49.0%
Northwest Area 630 680 632 628 704 207 195 213 166 210 26.5%
Will County 695 812 889 920 1168 147 165 176 123 212 72.4%

New Transfers by Major Feeder Community Colleges
Over 70% of all Transfers from CC’s and 77% of all CC Transfers From 9 CC’s
APPLIED ENROLLED
LAST COLLEGE 2005 2006 2007 2008 2009 2005 2006 2007 2008 2009 2009 v 2008
College of Du Page 773 708 674 574 431 280 223 239 234 182 -22.2%
William Rainey Harper College 386 423 405 379 387 148 149 143 156 173 10.9%
Rock Valley College 355 384 349 348 293 164 180 170 207 155 -25.1%
Waubonsee Community College 281 304 321 249 297 122 109 143 118 147 24.6%
Elgin Community College 324 340 322 259 221 142 152 125 117 111 -5.1%
McHenry County College 245 250 258 215 203 119 96 131 100 111 11.0%
Kishwaukee College 186 205 238 138 168 114 103 126 84 108 28.6%
Joliet Junior College 182 163 207 165 163 80 49 90 65 65 0.0%
College of Lake County 204 211 205 161 148 82 77 71 66 53 -19.7%

Challenges
Beginning downward trends in college-bound students
Changing demographic in Illinois
Competition from in-state, private, out-of-state, on-line proprietary colleges and universities, certification programs, work.

© Copyright 2007, The Chronicle of Higher Education Reprinted with permission. This material may not be posted,
published, or distributed without permission from The Chronicle.Source: Western Interstate Commission for Higher Education
Projected change in the number of high school graduates, 2007-08 to 2017-18

High School Seniors – Public & Private
115000
120000
125000
130000
135000
140000
145000
Enrollments
2000-20012001-20022002-20032004-20052005-20062006-20072007-20082008-20092009-20102010-2011

NIU
High School Seniors Public and Private HS's
Illinois AF/AM Latino Asian Non Minority
Year Total % Change Total % Change Total % Change Total % Change Total % Change
1993-1994 116,365 15,598 7,983 3,929 74,473
1994-1995 119,988 3.1% 15,411 -1.2% 8,263 3.5% 4,089 4.1% 77,181 3.6%
1995-1996 119,146 -0.7% 15,597 1.2% 8,459 2.4% 4,063 -0.6% 76,349 -1.1%
1996-1997 125,206 5.1% 16,472 5.6% 9,377 10.9% 4,380 7.8% 79,672 4.4%
1997-1998 130,092 3.9% 17,390 5.6% 10,302 9.9% 4,816 10.0% 81,878 2.8%
1998-1999 127,726 -1.8% 16,964 -2.4% 10,468 1.6% 4,731 -1.8% 80,229 -2.0%
1999-2000 126,949 -0.6% 16,416 -3.2% 10,873 3.9% 4,750 0.4% 79,590 -0.8%
2000-2001 125,519 -1.1% 15,498 -5.6% 10,855 -0.2% 4,889 2.9% 79,210 -0.5%
2001-2002 131,816 5.0% 16,242 4.8% 12,240 12.8% 5,233 7.0% 82,452 4.1%
2002-2003 134,862 2.3% 16,619 2.3% 13,375 9.3% 5,373 2.7% 84,266 2.2%
2003-2004 133,548 -1.0% 16,584 -0.2% 13,599 1.7% 5,538 3.1% 82,853 -1.7%
2004-2005 132,917 -0.5% 16,979 2.4% 13,948 2.6% 5,643 1.9% 81,314 -1.9%
2005-2006 135,510 2.0% 16,478 -3.0% 14,868 6.6% 5,931 5.1% 82,838 1.9%
2006-2007 140,747 3.9% 18,646 13.2% 16,224 9.1% 6,227 5.0% 83,486 0.8%
2007-2008 142,247 1.1% 18,302 -1.8% 17,147 5.7% 6,257 0.5% 84,275 0.9%
2008-2009 144,244 1.4% 19,485 6.5% 19,200 12.0% 6,466 3.3% 82,351 -2.3%
2009-2010 143,439 -0.6% 19,375 -0.6% 20,216 5.3% 6,760 4.5% 80,757 -1.9%
2010-2011 143,124 -0.2% 19,749 1.9% 21,121 4.5% 6,894 2.0% 78,577 -2.7%
2011-2012 142,791 -0.2% 19,453 -1.5% 22,562 6.8% 7,337 6.4% 77,228 -1.7%
2012-2013 140,683 -1.5% 18,036 -7.3% 23,739 5.2% 7,754 5.7% 75,990 -1.6%
2013-2014 137,823 -2.0% 16,973 -5.9% 24,344 2.5% 8,164 5.3% 74,344 -2.2%
2014-2015 136,082 -1.3% 16,582 -2.3% 24,600 1.1% 8,532 4.5% 72,886 -2.0%
2015-2016 137,524 1.1% 16,761 1.1% 25,812 4.9% 8,616 1.0% 72,726 -0.2%
2016-2017 137,239 -0.2% 16,137 -3.7% 27,402 6.2% 9,574 11.1% 71,385 -1.8%
2017-2018 139,483 1.6% 16,165 0.2% 29,131 6.3% 10,473 9.4% 71,278 -0.1%
Record High
Record Low

College Enrollment Rate for College Enrollment Rate for HighHigh School GraduatesSchool Graduates
Non Minority 45.90%African-American 40.60%Latino 37.70%Asia-Pl 65.20%
All Races 46.00%(Approx 55% attend 4-year Schools and
45% attend 2-year Schools)
NIU

ACT BenchmarksACT BenchmarksReadiness for College Sub Readiness for College Sub
ScoresScores
English 18
Math 22
Reading 21
Science 24
50% Chance of B
75% Chance of C
NIU

Percentages of Act-Tested IL Percentages of Act-Tested IL HS Grads Meeting HS Grads Meeting
BenchmarksBenchmarksAll None English Math
2002 2006 2004 2006 2002 2006 2002 2006
All Students 19 20 34 32 60 65 36 38
Low Income 7 7 53 52 41 44 18 18
NIU

Parental Income(Fall 2008 New Freshmen)
Median $87,752 $63,81615

NIU

Top Competitors
University of Illinois – Urbana/Champaign University of Illinois – Chicago Illinois State University Illinois Community Colleges/Other IL 4-year Many Colleges and Universities from Around
the Country Recruit Chicago Area Illinois is one of the largest exporters of
students in US

Recruitment Basics 101Recruitment Basics 101
Put NIU information in the hands of qualified students in our market region
Encourage campus visit and application Provide the best campus visit and tour possible
Showcase the advantages of NIU to students and family members
Engage the entire campus community to create a high quality on-campus experience
Follow up with great customer service resulting in enrollment
NIU

PrestigeFactors
Quality of Faculty Quality of Students Athletics

Importance of College-Choice Characteristics
• NIU’s prospects are evaluating their college options on many different levels, as more than half of the attributes tested received a mean rating of 4.0 or above
• However, these top attributes are focused around the following themes:
– Overall academic quality—programs, teachers, facilities, and reputation
– Success—grad placement and internships
– Cost—value, financial aid, and tuition
– Atmosphere—safe, fun, friendly, and personal
• Note: Cost and financial aid are less important to those in NIU’s low-yield markets. However, they are more concerned with the quality of students and a friendly atmosphere
© 2009 Stamats Inc. – 20
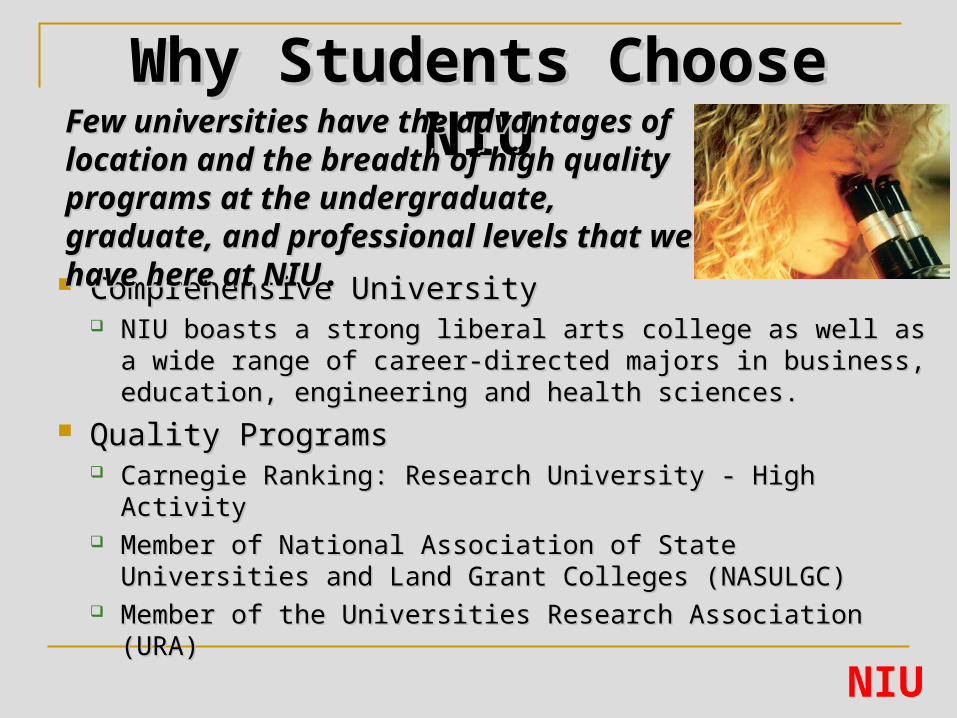
Why Students Choose Why Students Choose NIUNIU
Comprehensive UniversityComprehensive University NIU boasts a strong liberal arts college as well as a wide NIU boasts a strong liberal arts college as well as a wide
range of career-directed majors in business, education, range of career-directed majors in business, education, engineering and health sciences. engineering and health sciences.
Quality ProgramsQuality Programs Carnegie Ranking: Research University - High ActivityCarnegie Ranking: Research University - High Activity Member of National Association of State Universities and Member of National Association of State Universities and
Land Grant Colleges (NASULGC)Land Grant Colleges (NASULGC) Member of the Universities Research Association (URA)Member of the Universities Research Association (URA)
Few universities have the advantages of Few universities have the advantages of location and the breadth of high quality location and the breadth of high quality programs at the undergraduate, graduate, and programs at the undergraduate, graduate, and professional levels that we have here at NIUprofessional levels that we have here at NIU..
NIU

Why Students Choose Why Students Choose NIUNIU
LocationLocation Friendly, small city atmosphere with Friendly, small city atmosphere with
convenient big city accessconvenient big city access Residential AtmosphereResidential Atmosphere Affordable Costs Affordable Costs
$9,390 Instate Tuition & Fees (per $9,390 Instate Tuition & Fees (per academic year)academic year)
NIU Students Get Good JobsNIU Students Get Good Jobs
NIU

Funnel StagesFunnel Stages
NIU

Sources of ContactSources of Contact
High Achieving Students PSAT Search 10,000 – 11,000 Names
Primary Pool and Multi Cultural Students ACT EOS Search 20,000 -21,000 names
General Prospects Open House and Office Visitors Prospects Met at HS and CC Visits/Fairs ACT Score Senders HS Grad Class 2010
17,488 Received by Sept 1, 2009 5,500 ACT 19/Rank Top 50%/GPA 3.0
The application is the initial source of contact for many.
NIU

Recruitment Strategies for Recruitment Strategies for Each Priority GroupEach Priority Group
Publication and Communication Sequence Letters, Email, Postcards, Telephone, Publications
On Campus Visit Opportunities Office Visits M-F and Saturdays Open House
Next Step Sessions FAFSA Completion Options
Targeted Receptions HS and CC Counselor Receptions NIView Honors Minority Reception Pulaski Day College Receptions Chicago City College Reception
NIU

Recruitment Strategies for Recruitment Strategies for Each Priority GroupEach Priority Group
Off Campus Out Reach—Territory Mgmt Traditional Student Recruitment
HS Visits (400 high schools) CC Visits (Top 3 major feeders six visits per
term/top 4-8 feeders four visits per term. 29 CC’s Visited)
College Day and Night Fairs (226 Programs) Targeted Receptions
Down State Receptions Alumni Receptions
NIU
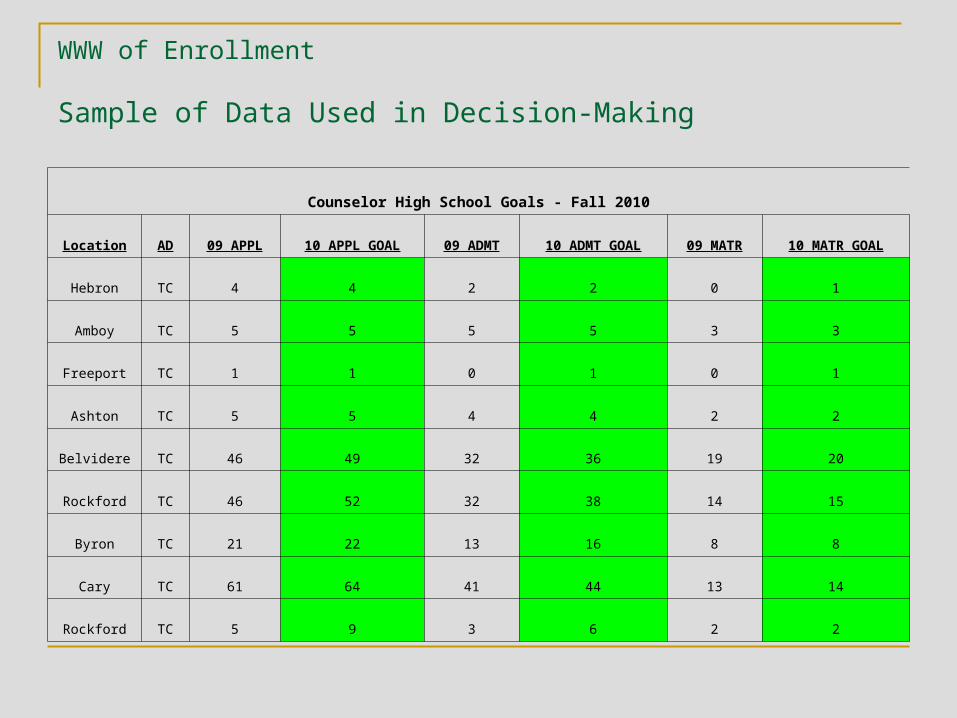
WWW of Enrollment
Sample of Data Used in Decision-Making
Counselor High School Goals - Fall 2010
Location AD 09 APPL 10 APPL GOAL 09 ADMT 10 ADMT GOAL 09 MATR 10 MATR GOAL
Hebron TC 4 4 2 2 0 1
Amboy TC 5 5 5 5 3 3
Freeport TC 1 1 0 1 0 1
Ashton TC 5 5 4 4 2 2
Belvidere TC 46 49 32 36 19 20
Rockford TC 46 52 32 38 14 15
Byron TC 21 22 13 16 8 8
Cary TC 61 64 41 44 13 14
Rockford TC 5 9 3 6 2 2

Customer Relationship Management
Software (CRM) VIP Page Students Parents
Internet Answer Email connections to admissions counselors
High school visits Personal follow up
Lists to colleges/departments for follow up Telephone lists for outbound calling center

NIU

Sample Communication SequenceMonth Inquiry Type Communication Description
Continuous All Inquiries VIP Kickoff
Continuous All Inquiries Birthday Wishes
Continuous All NIU Visitors You're An NIU VIP Email
(The admissions office creates VIP pages for all visitors)
March All 2010 prospects Good Friday Open House
April/May-continuous ACT Score Senders Thank You For Interest
June-July All Inquiries Visit the Campus This Summer
August All Inquiries Apply to NIU this Fall
August-continuous All Inquiries Northern Brochure Mailing
August High Achieving Honors Receptions Invitation
August/Sept Minority Students Early Application Letter
August/Sept Parents of Minority Students Early Application Letter
Sept/Dec HS Students High School Visit Announcement
October Priority Pool Academic Department/College
October All Inquiries November Open House Invitation
December Priority Pool Follow Application Letter not applied

Sample Communications LogSample Communications Log First Contact: Student made contact through Zoom
ACT/EOSName: Rebecca K
Admit Term: Fall 2010
High School: Taft High School
Academic Plan: Nursing
Program Action: Admit
Name Log Comm Plan
AD Admissions Decision Email - Tim - visited schools
E-mail Sent/Not Viewed
Freshman
VIP VIP Logout -
VIP VIP Login -
VIP VIP Login -
AD App email - Tim - visited schools
E-mail Viewed Freshman
NIU: Awesome Academics - FR E-mail Viewed Freshman
VIP VIP Logout -
VIP VIP Login -
Responders to Colleges 10-5-09 Export File Prospective Students
HHS overview E-mail Viewed College of HHS
Open House Invitation E-mail Viewed Default Plan
EOS Response Letter Doc Merged Prospective Students
NIU

NIU

Major WebsiteMajor Website
NIU

WWW of Enrollment
Sample of the Volumes:
Purchased 14,000 ACT names
Processed 23,000 Fall applications – about 100,000 documents
Inbound Calls Answered Sept 2580
Outbound Calls Initiated - Sept 4432
Admissions Office Visits – Sept 558
NIU State Articulation Program – 426 HS counselors on campus
Sept to Oct 8 -- 80 college fairs147 high school visits
Open House Attendance - Oct 2500+

Primary Enrollment Indicators
Campus Visits Admissions and Confirmations Housing Applications/Deposits Orientation Reservations

Campus VisitsCampus VisitsThe Most Important The Most Important
Recruitment StrategyRecruitment Strategy75% - 90% Who Visit Apply Tour the Campus Meet Students Speak with Admissions Counselor Attend a Class Meet Professor
NIU

Campus VisitsCampus VisitsSept 2008 – Aug 2009Sept 2008 – Aug 2009
Student Visitors Met with Counselor 4,592 Attended Open House 3,879
Total Students 8,471 Student/Family Tours
Daily Office Tours 7,094 Open House Tours 8,813
Total Campus Tours 15,907 Additional Group Visits
Special Groups 176 Students Served 4,461
NIU

Columbus Day Open House
COLUMBUS DAY
STUDENTS PARENTS TOTAL
1994-95 281 438 719
1995-96 387 503 890
1996-97 593 961 1554
1997-98 692 1066 1758
1998-99 848 972 1820
1999-00 678 828 1506
2000-01 721 876 1597
2001-2002 791 1015 1806
2002-2003 887 1017 1904
2003-2004 1184 1344 2528
2004-2005 1116 1150 2266
2005-2006 994 1296 2290
2006-2007 975 1182 2157
2007-2008 898 1006 1904
2008-2009 986 1193 2179
2009-10 1148 1424 2572

Total Student Visits Office Interviews and
Open House 2006-2007 2007-2008 2008-2009Fall 3328 3413 3134Spring 3976 2752 3924Summer 1532 1216 1413Total 8836 7381 8471 Campus ToursTotal 13789 11907 15907 In addition 3,000- 5,000 students visit NIU
through special group programs


Orientation Reservations
New Student Orientation Reservation Number - August 10 2009
FRESHMEN RESERVATIONS
COLLEGE 2009 2008 2007 2006 2009-08 2009-08
AAC 341 363 357 447 -22 -6.06%
BUSE 534 603 647 718 -69 -11.44%
E&ET 163 123 138 172 40 32.52%
EDUC 268 234 229 241 34 14.53%
H&HS 356 342 360 346 14 4.09%
LA&S 764 579 659 683 185 31.95%
VP&A 152 152 132 196 0 0.00%
TOTAL 2578 2396 2522 2803 182 7.60%

SummarySummary
Enrollment Success is a University-Wide Effort. Quality Academic Programs Connection with Faculty
Opportunities for Research/Internships Nurturing Campus Atmosphere
Commitment to Customer Service Student Involvement Connections to Students and Family
Student Expectations Must be Met and Exceeded.
NIU

Challenges to Maintain Enrollments
More competition for fewer students is a reality. Enrollment rates for underrepresented student
populations must improve. CC transfers will be essential. Non-Traditional markets should be developed
Evening and Weekend Programs On-Campus

On-Campus Challenges and Opportunities
Undergraduate enrollment will be more diverse and require review of student services.
More economic/academic/social disparity on-campus between have’s and have not’s is a reality and a challenge.
Retention is a campus-wide responsibility. Enhance faculty and staff training to promote
student success and customer service.

Questions and Comments