Embed Size (px)
Citation preview
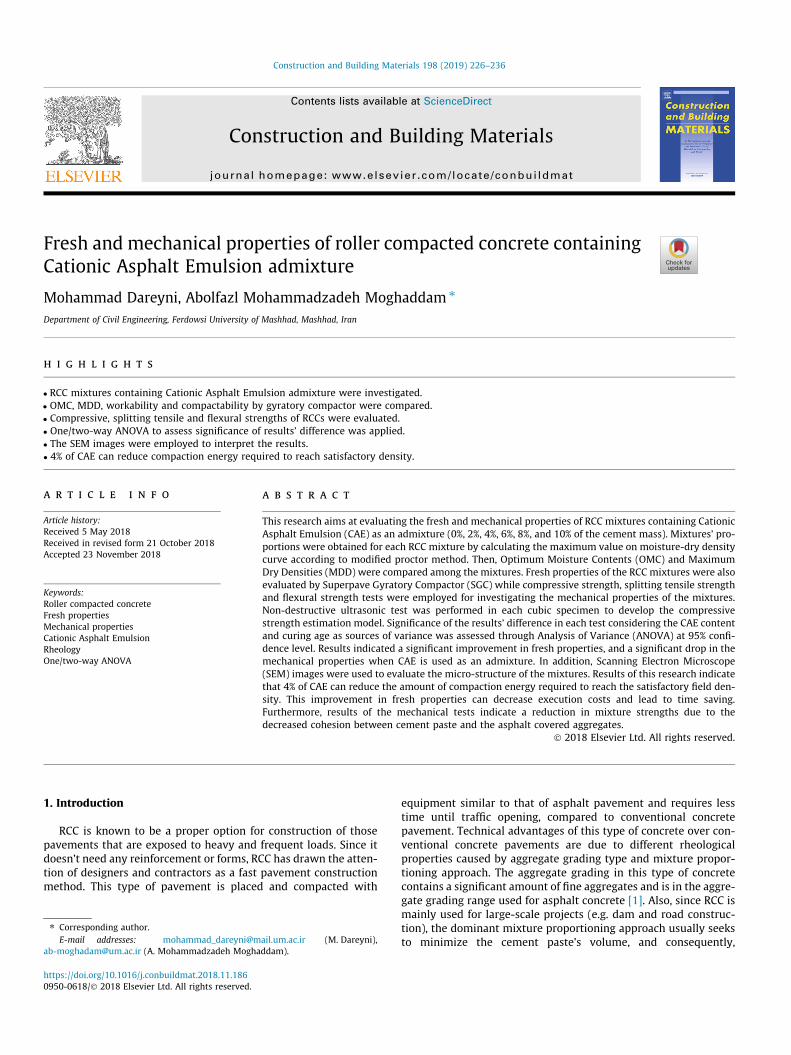
Construction and Building Materials 198 (2019) 226–236
Contents lists available at ScienceDirect
Construction and Building Materials
journal homepage: www.elsevier .com/locate /conbui ldmat
Fresh and mechanical properties of roller compacted concrete containingCationic Asphalt Emulsion admixture
https://doi.org/10.1016/j.conbuildmat.2018.11.1860950-0618/� 2018 Elsevier Ltd. All rights reserved.
⇑ Corresponding author.E-mail addresses: [email protected] (M. Dareyni),
[email protected] (A. Mohammadzadeh Moghaddam).
Mohammad Dareyni, Abolfazl Mohammadzadeh Moghaddam ⇑Department of Civil Engineering, Ferdowsi University of Mashhad, Mashhad, Iran
h i g h l i g h t s
� RCC mixtures containing Cationic Asphalt Emulsion admixture were investigated.� OMC, MDD, workability and compactability by gyratory compactor were compared.� Compressive, splitting tensile and flexural strengths of RCCs were evaluated.� One/two-way ANOVA to assess significance of results’ difference was applied.� The SEM images were employed to interpret the results.� 4% of CAE can reduce compaction energy required to reach satisfactory density.
a r t i c l e i n f o
Article history:Received 5 May 2018Received in revised form 21 October 2018Accepted 23 November 2018
Keywords:Roller compacted concreteFresh propertiesMechanical propertiesCationic Asphalt EmulsionRheologyOne/two-way ANOVA
a b s t r a c t
This research aims at evaluating the fresh and mechanical properties of RCC mixtures containing CationicAsphalt Emulsion (CAE) as an admixture (0%, 2%, 4%, 6%, 8%, and 10% of the cement mass). Mixtures’ pro-portions were obtained for each RCC mixture by calculating the maximum value on moisture-dry densitycurve according to modified proctor method. Then, Optimum Moisture Contents (OMC) and MaximumDry Densities (MDD) were compared among the mixtures. Fresh properties of the RCC mixtures were alsoevaluated by Superpave Gyratory Compactor (SGC) while compressive strength, splitting tensile strengthand flexural strength tests were employed for investigating the mechanical properties of the mixtures.Non-destructive ultrasonic test was performed in each cubic specimen to develop the compressivestrength estimation model. Significance of the results’ difference in each test considering the CAE contentand curing age as sources of variance was assessed through Analysis of Variance (ANOVA) at 95% confi-dence level. Results indicated a significant improvement in fresh properties, and a significant drop in themechanical properties when CAE is used as an admixture. In addition, Scanning Electron Microscope(SEM) images were used to evaluate the micro-structure of the mixtures. Results of this research indicatethat 4% of CAE can reduce the amount of compaction energy required to reach the satisfactory field den-sity. This improvement in fresh properties can decrease execution costs and lead to time saving.Furthermore, results of the mechanical tests indicate a reduction in mixture strengths due to thedecreased cohesion between cement paste and the asphalt covered aggregates.
� 2018 Elsevier Ltd. All rights reserved.
1. Introduction
RCC is known to be a proper option for construction of thosepavements that are exposed to heavy and frequent loads. Since itdoesn’t need any reinforcement or forms, RCC has drawn the atten-tion of designers and contractors as a fast pavement constructionmethod. This type of pavement is placed and compacted with
equipment similar to that of asphalt pavement and requires lesstime until traffic opening, compared to conventional concretepavement. Technical advantages of this type of concrete over con-ventional concrete pavements are due to different rheologicalproperties caused by aggregate grading type and mixture propor-tioning approach. The aggregate grading in this type of concretecontains a significant amount of fine aggregates and is in the aggre-gate grading range used for asphalt concrete [1]. Also, since RCC ismainly used for large-scale projects (e.g. dam and road construc-tion), the dominant mixture proportioning approach usually seeksto minimize the cement paste’s volume, and consequently,
M. Dareyni, A. Mohammadzadeh Moghaddam / Construction and Building Materials 198 (2019) 226–236 227
minimize the mixture manufacturing costs significantly. This typeof aggregate grading and mixture proportioning will lead to mix-tures totally different from conventional concrete mixtures, there-fore, performing slump test to evaluate their workability is notpossible (their slump is equal to zero). Thus, workability of RCCis measured utilizing the Vebe table and according to ASTMC1170 standard. In this method, the required time for a ring ofmortar to be visible between the wall of the container and the sur-charge on the vibrating mixture is used as the workability mea-surement criterion. RCC mixture proportions in the USACE mixdesign is also obtained according to the results of this test [2].The main disadvantage of this method is the high dependency ofthe test results on the vibration parameters, due to the dependencyof Bingham parameters of the concrete on the vibration parame-ters, in a way that the vibration velocity has the highest effect onthe test results [3,4].
Considering this limitation, Paakkinen introduced a method forevaluating the fresh properties of stiff concrete mixtures by devel-oping the Intensive Compaction Tester (ICT) device. Compaction ofthe specimens is performed without imposing any vibration orimpact on this device, and an inclined piston compacts the mixtureby applying pressure [5]. In recent decades, the ICT has been usedfor stiff concrete mixtures evaluation to a limited extent, and thedevice’s output curves have been directly used as the comparisoncriteria for their fresh properties [6–8]. Moreover, the SuperpaveGyratory Compactor (SGC) device, which was first developed tomanufacture asphalt concrete specimens according to Superpavemix design methods, is used for dry manufacturing and evaluationof stiff concrete mixtures with a function similar to ICT. NaderAmer investigated the effects of the number of SGC gyrations onthe density and mechanical properties of RCC mixtures andshowed that increasing the number of gyrations leads to higherdensity and strength in specimens. They have also developed thelinear model that relates the density and the tensile strength ofmixtures in different water to cement ratios and suggestedemploying this model for mixture designs [9,10]. In addition, J. T.Kevern et al. defined the workability energy index (an index ofmixture’s density under the initial compaction energy) and com-paction densification index (an index of the extra compactionenergy required for the mixture to reach desired density) of thepervious concrete mixture as the area below the SGC output curve[11].
There are numerous studies in the literature evaluating the RCC,many of which aim at studying the feasibility of using supplemen-tary cementitious materials and recycled aggregates in the mix-tures [12–19]. Nonetheless, despite its significance, few studieshave been devoted to optimizing the rheological properties ofRCC. Conventionally, chemical admixtures are employed to manu-facture RCCs with favorable rheological properties, the quantity ofwhich is much greater than the quantity advised for conventional
Stre
ss
Shear rate
Plas�c viscosity
Yield stress
Fig. 1. Bingham model for describing t
Concrete (PCC) due to low volume of cement paste in RCC mixtures[20]. Emulsion asphalt has also been used as an admixture for PCCand RCC in a few cases, which resulted in improvements in manyproperties, especially the durability properties of concrete [21–23].
The primary purpose of this research is to improve the freshproperties of concrete by utilizing Cationic Asphalt Emulsion(CAE). Therefore, the CAE was added to the mixture in 2%, 4%, 6%,8% and 10% of the cement’s mass, and Optimum Moisture Content(OMC) and Maximum Dry Density (MDD) of the mixtures wereobtained utilizing proctor mold and rammer. Workability andcompactability of the mixtures were also investigated throughSGC and were compared with the control mixture.
Compressive, flexural, and tensile strength tests were per-formed to evaluate the mechanical properties of the mixtures.Due to the importance of non-destructive tests, cubic specimenswere subject to the ultrasonic test, in order to develop the com-pressive strength estimation model of the RCC containing CAE.Finally, ANOVA tests were conducted on the tests results at 5% sig-nificance level to investigate the effects of the variables on them.
2. Rheology of stiff concrete
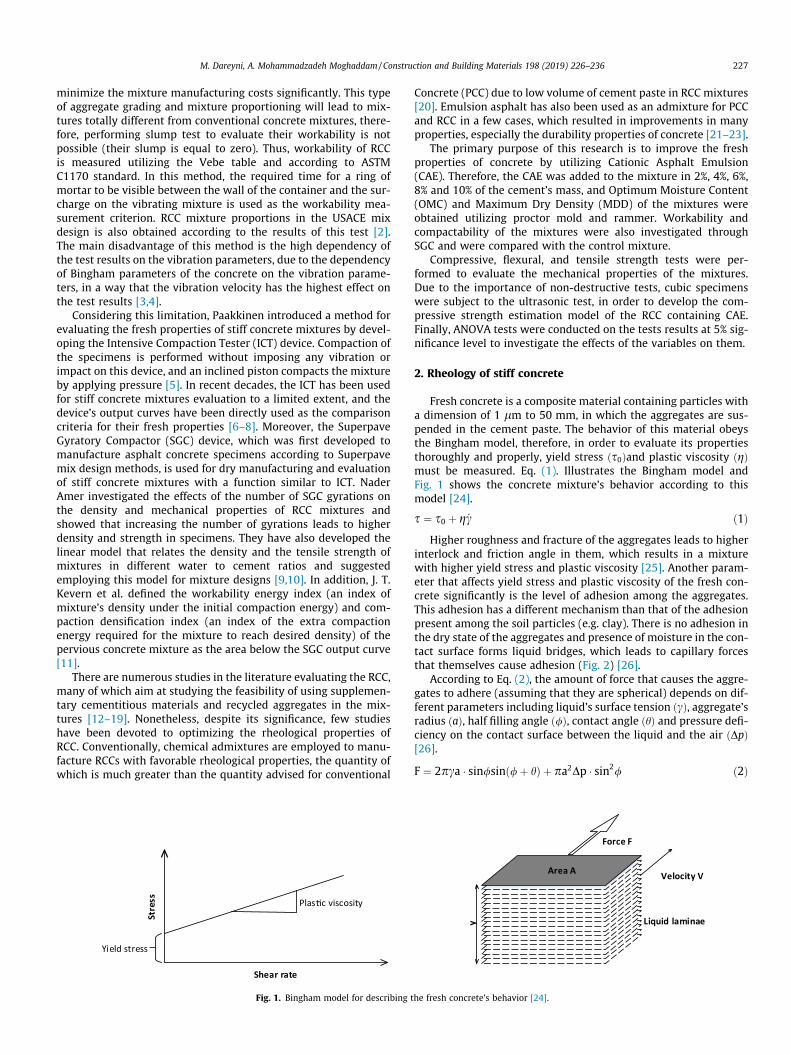
Fresh concrete is a composite material containing particles witha dimension of 1 lm to 50 mm, in which the aggregates are sus-pended in the cement paste. The behavior of this material obeysthe Bingham model, therefore, in order to evaluate its propertiesthoroughly and properly, yield stress ðs0Þand plastic viscosity ðgÞmust be measured. Eq. (1). Illustrates the Bingham model andFig. 1 shows the concrete mixture’s behavior according to thismodel [24].
s ¼ s0 þ g _c ð1ÞHigher roughness and fracture of the aggregates leads to higher
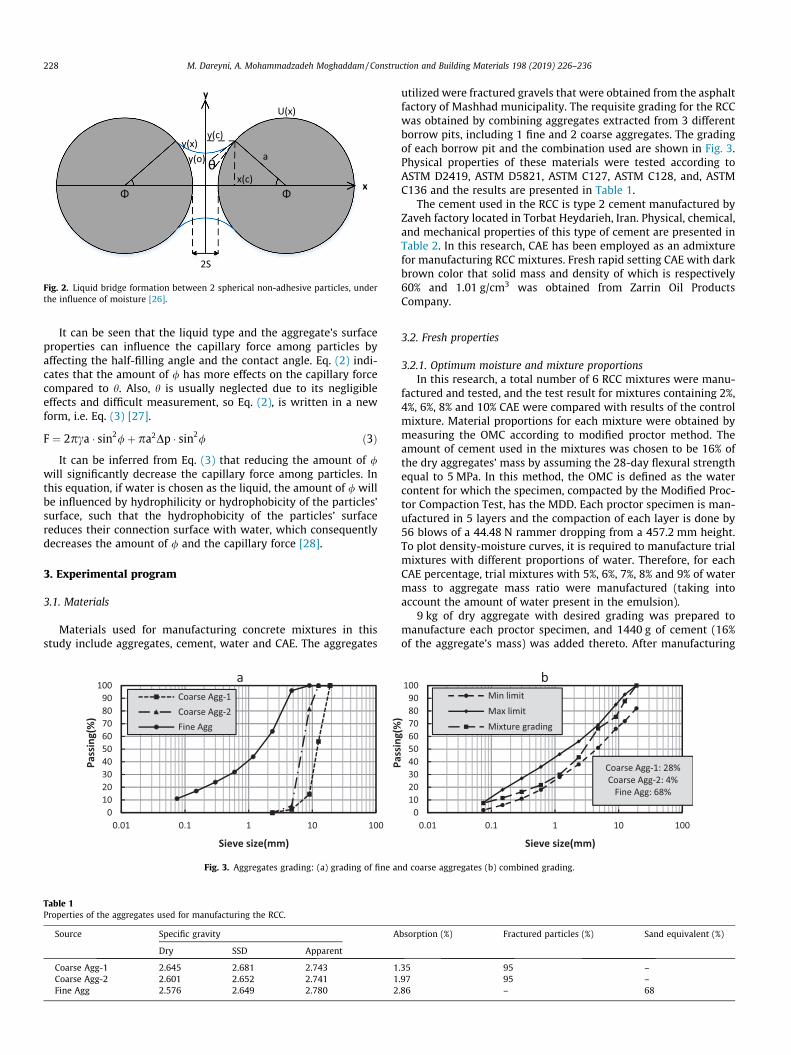
interlock and friction angle in them, which results in a mixturewith higher yield stress and plastic viscosity [25]. Another param-eter that affects yield stress and plastic viscosity of the fresh con-crete significantly is the level of adhesion among the aggregates.This adhesion has a different mechanism than that of the adhesionpresent among the soil particles (e.g. clay). There is no adhesion inthe dry state of the aggregates and presence of moisture in the con-tact surface forms liquid bridges, which leads to capillary forcesthat themselves cause adhesion (Fig. 2) [26].
According to Eq. (2), the amount of force that causes the aggre-gates to adhere (assuming that they are spherical) depends on dif-ferent parameters including liquid’s surface tension ðcÞ, aggregate’sradius ðaÞ, half filling angle ð/Þ, contact angle ðhÞ and pressure defi-ciency on the contact surface between the liquid and the air ðDpÞ[26].
F ¼ 2pca � sin/sin /þ hð Þ þ pa2Dp � sin2/ ð2Þ
Force F
Area A
y
Velocity V
Liquid laminae
he fresh concrete’s behavior [24].
ΦΦx
y
a
U(x)
y(c)
x(c)
y(o)y(x)
2S
θ
Fig. 2. Liquid bridge formation between 2 spherical non-adhesive particles, underthe influence of moisture [26].
228 M. Dareyni, A. Mohammadzadeh Moghaddam / Construction and Building Materials 198 (2019) 226–236
It can be seen that the liquid type and the aggregate’s surfaceproperties can influence the capillary force among particles byaffecting the half-filling angle and the contact angle. Eq. (2) indi-cates that the amount of / has more effects on the capillary forcecompared to h. Also, h is usually neglected due to its negligibleeffects and difficult measurement, so Eq. (2), is written in a newform, i.e. Eq. (3) [27].
F ¼ 2pca � sin2/þ pa2Dp � sin2/ ð3ÞIt can be inferred from Eq. (3) that reducing the amount of /
will significantly decrease the capillary force among particles. Inthis equation, if water is chosen as the liquid, the amount of / willbe influenced by hydrophilicity or hydrophobicity of the particles’surface, such that the hydrophobicity of the particles’ surfacereduces their connection surface with water, which consequentlydecreases the amount of / and the capillary force [28].
3. Experimental program
3.1. Materials
Materials used for manufacturing concrete mixtures in thisstudy include aggregates, cement, water and CAE. The aggregates
0102030405060708090
100
0.01 0.1 1 10 100
aCoarse Agg-1Coarse Agg-2Fine Agg
Pass
ing(
%)
Sieve size(mm)
Fig. 3. Aggregates grading: (a) grading of fine an
Table 1Properties of the aggregates used for manufacturing the RCC.
Source Specific gravity A
Dry SSD Apparent
Coarse Agg-1 2.645 2.681 2.743 1Coarse Agg-2 2.601 2.652 2.741 1Fine Agg 2.576 2.649 2.780 2
utilized were fractured gravels that were obtained from the asphaltfactory of Mashhad municipality. The requisite grading for the RCCwas obtained by combining aggregates extracted from 3 differentborrow pits, including 1 fine and 2 coarse aggregates. The gradingof each borrow pit and the combination used are shown in Fig. 3.Physical properties of these materials were tested according toASTM D2419, ASTM D5821, ASTM C127, ASTM C128, and, ASTMC136 and the results are presented in Table 1.
The cement used in the RCC is type 2 cement manufactured byZaveh factory located in Torbat Heydarieh, Iran. Physical, chemical,and mechanical properties of this type of cement are presented inTable 2. In this research, CAE has been employed as an admixturefor manufacturing RCC mixtures. Fresh rapid setting CAE with darkbrown color that solid mass and density of which is respectively60% and 1.01 g/cm3 was obtained from Zarrin Oil ProductsCompany.
3.2. Fresh properties
3.2.1. Optimum moisture and mixture proportionsIn this research, a total number of 6 RCC mixtures were manu-
factured and tested, and the test result for mixtures containing 2%,4%, 6%, 8% and 10% CAE were compared with results of the controlmixture. Material proportions for each mixture were obtained bymeasuring the OMC according to modified proctor method. Theamount of cement used in the mixtures was chosen to be 16% ofthe dry aggregates’ mass by assuming the 28-day flexural strengthequal to 5 MPa. In this method, the OMC is defined as the watercontent for which the specimen, compacted by the Modified Proc-tor Compaction Test, has the MDD. Each proctor specimen is man-ufactured in 5 layers and the compaction of each layer is done by56 blows of a 44.48 N rammer dropping from a 457.2 mm height.To plot density-moisture curves, it is required to manufacture trialmixtures with different proportions of water. Therefore, for eachCAE percentage, trial mixtures with 5%, 6%, 7%, 8% and 9% of watermass to aggregate mass ratio were manufactured (taking intoaccount the amount of water present in the emulsion).
9 kg of dry aggregate with desired grading was prepared tomanufacture each proctor specimen, and 1440 g of cement (16%of the aggregate’s mass) was added thereto. After manufacturing
0102030405060708090
100
0.01 0.1 1 10 100
bMin limitMax limitMixture grading
Pass
ing(
%)
Sieve size(mm)
Coarse Agg-1: 28%Coarse Agg-2: 4%
Fine Agg: 68%
d coarse aggregates (b) combined grading.
bsorption (%) Fractured particles (%) Sand equivalent (%)
.35 95 –
.97 95 –
.86 – 68
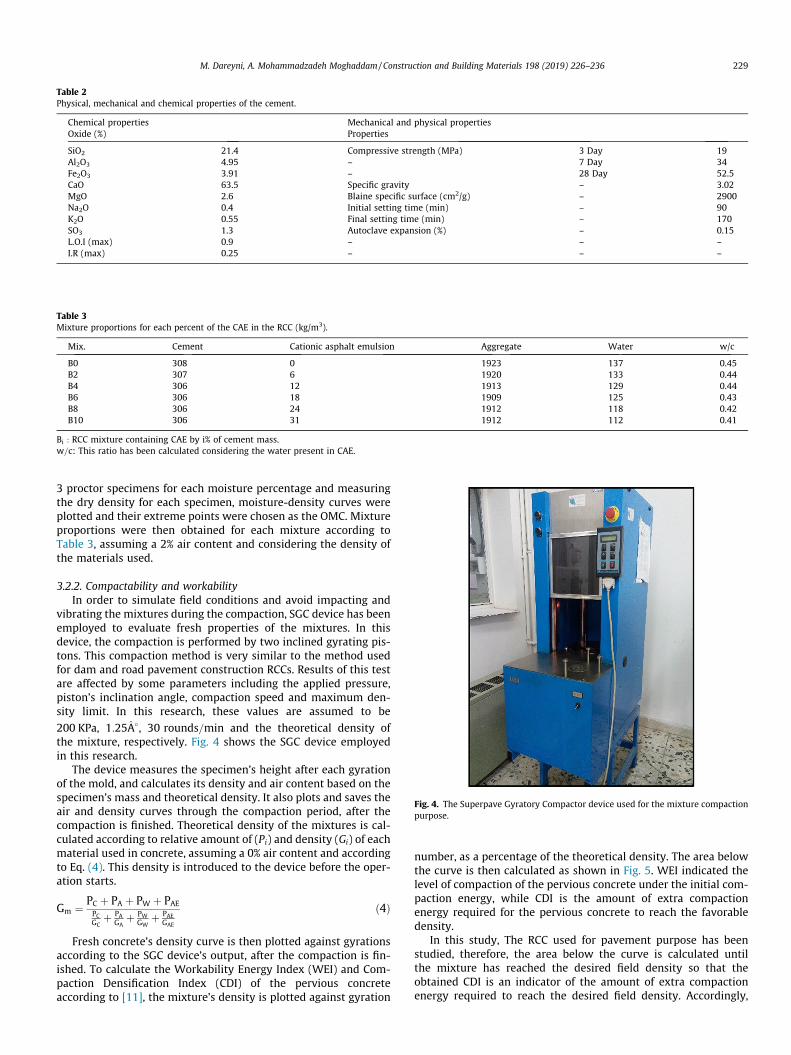
Table 2Physical, mechanical and chemical properties of the cement.
Chemical properties Mechanical and physical propertiesOxide (%) Properties
SiO2 21.4 Compressive strength (MPa) 3 Day 19Al2O3 4.95 – 7 Day 34Fe2O3 3.91 – 28 Day 52.5CaO 63.5 Specific gravity – 3.02MgO 2.6 Blaine specific surface (cm2/g) – 2900Na2O 0.4 Initial setting time (min) – 90K2O 0.55 Final setting time (min) – 170SO3 1.3 Autoclave expansion (%) – 0.15L.O.I (max) 0.9 – – –I.R (max) 0.25 – – –
Table 3Mixture proportions for each percent of the CAE in the RCC (kg/m3).
Mix. Cement Cationic asphalt emulsion Aggregate Water w/c
B0 308 0 1923 137 0.45B2 307 6 1920 133 0.44B4 306 12 1913 129 0.44B6 306 18 1909 125 0.43B8 306 24 1912 118 0.42B10 306 31 1912 112 0.41
Bi : RCC mixture containing CAE by i% of cement mass.w=c: This ratio has been calculated considering the water present in CAE.
Fig. 4. The Superpave Gyratory Compactor device used for the mixture compactionpurpose.
M. Dareyni, A. Mohammadzadeh Moghaddam / Construction and Building Materials 198 (2019) 226–236 229
3 proctor specimens for each moisture percentage and measuringthe dry density for each specimen, moisture-density curves wereplotted and their extreme points were chosen as the OMC. Mixtureproportions were then obtained for each mixture according toTable 3, assuming a 2% air content and considering the density ofthe materials used.
3.2.2. Compactability and workabilityIn order to simulate field conditions and avoid impacting and
vibrating the mixtures during the compaction, SGC device has beenemployed to evaluate fresh properties of the mixtures. In thisdevice, the compaction is performed by two inclined gyrating pis-tons. This compaction method is very similar to the method usedfor dam and road pavement construction RCCs. Results of this testare affected by some parameters including the applied pressure,piston’s inclination angle, compaction speed and maximum den-sity limit. In this research, these values are assumed to be
200 KPa, 1:25A�, 30 rounds=min and the theoretical density ofthe mixture, respectively. Fig. 4 shows the SGC device employedin this research.
The device measures the specimen’s height after each gyrationof the mold, and calculates its density and air content based on thespecimen’s mass and theoretical density. It also plots and saves theair and density curves through the compaction period, after thecompaction is finished. Theoretical density of the mixtures is cal-culated according to relative amount of (Pi) and density (Gi) of eachmaterial used in concrete, assuming a 0% air content and accordingto Eq. (4). This density is introduced to the device before the oper-ation starts.
Gm ¼ PC þ PA þ PW þ PAEPCGC
þ PAGA
þ PWGW
þ PAEGAE
ð4Þ
Fresh concrete’s density curve is then plotted against gyrationsaccording to the SGC device’s output, after the compaction is fin-ished. To calculate the Workability Energy Index (WEI) and Com-paction Densification Index (CDI) of the pervious concreteaccording to [11], the mixture’s density is plotted against gyration
number, as a percentage of the theoretical density. The area belowthe curve is then calculated as shown in Fig. 5. WEI indicated thelevel of compaction of the pervious concrete under the initial com-paction energy, while CDI is the amount of extra compactionenergy required for the pervious concrete to reach the favorabledensity.
In this study, The RCC used for pavement purpose has beenstudied, therefore, the area below the curve is calculated untilthe mixture has reached the desired field density so that theobtained CDI is an indicator of the amount of extra compactionenergy required to reach the desired field density. Accordingly,

0
20
40
60
80
100
0 5 10 15 20 25
Dens
ity p
erce
nt(%
)
Number of Gyra�on
Compac�on Densifica�onIndex(CDI)
Wor
kabi
lity
Ener
gy In
dex
(WEI
)
N1= N2=
Fig. 5. WEI and CDI calculation method for the pervious concrete based on J.T.Kevern et al. [11].
0
20
40
60
80
100
0 5 10 15 20 25 30 35 40
Dens
ity p
erce
nt(%
)
Number of Gyra�on
RCC Compac�on Densifica�onIndex(RCDI)
RCC
Wor
kabi
lity
Ener
gy In
dex
(RW
EI)
98%.Gm
Fig. 6. RWEI and RCDI calculation method regarding the area below the densitypercentage curve.
230 M. Dareyni, A. Mohammadzadeh Moghaddam / Construction and Building Materials 198 (2019) 226–236
N2 was considered to be the number of gyrations required for themixture to reach 98% of its theoretical density, thus, RCCWorkabil-ity Energy Index (RWEI) and RCC Compaction Densification Index(RCDI) were calculated according to Fig. 6. Each mixture requiresa specific amount of energy to reach the favorable density basedon its fresh properties; thus, improving the fresh properties leadsto a decrease in the N2. This is why the method adopted to calcu-late RCDI in this research aims at normalizing the mixtures accord-ing to the number of gyrations against the earlier method.
3.3. Mechanical properties
3.3.1. Casting and curing methodA challenge that the research on RCC usually face is the molding
of test specimens with different shapes, due to high stiffness of RCCmixtures. Current standards in this area suggest employing thevibrating table (ASTM C1176) and the vibrating hammer (ASTMC1435). Unfortunately, the standard methods mentioned abovecan only be used to mold cylindrical specimens. It should be men-tioned that a standard for molding the RCC mixtures in rectangularmolds using the vibrating hammer is currently being developed(ASTM WK41101).
In this research, a vibrating hammer equipped with specialreplaceable plates was used for molding the mixtures. Cylindricalspecimens were molded in 4 lifts and according to the standardwhile cubic and beam specimens were molded in 3 lifts due totheir lower heights. These specimens were demolded after a dayand were cured by immersing until the test date.
3.3.2. Test methodMechanical properties are cited as the most common concrete
quality evaluation criteria in many manuals, and dimensions of dif-ferent concrete structures are designed according to these proper-ties. Therefore, there’s a special emphasis on mechanical propertiesof the mixtures in this research, and compressive, tensile and flex-ural strength tests were performed on the mixtures. To evaluateeach of these properties, 4 specimens were tested in 7, 28 and90 days of age. According to BS EN 12390-3:2002 standard, 4 cubicspecimens with 100� 100� 100 mm dimensions were tested in 7,28 and 90 days of age, to measure the compressive strength.According to the standard’s recommendation, the loading ratewas chosen to be 3 kN=s (or 0:3 MPa=s). Available standards onflexural strength measurement suggest 2 different methodsincluding center-point loading (ASTM C293) and the third-pointloading (ASTM C78), of which this research has adopted the ASTMC78 method and performed the test accordingly. A100� 100� 400 mm dimension was selected for beam specimensand the load was applied with a 0:055 kN=srate (equal to a1 MPa=min increase in the maximum stress of the tension face)in a 150 mm distance from both ends of the beams. Similar tothe compressive strength test, 4 specimens were tested in 7, 28and 90 days of age. To measure the tensile strength of the mixturesin 7, 28 and 90 days of age, 4 cylindrical specimens each having astandard 100� 200 mm dimension were tested for each mixtureaccording to ASTM C496. In this test, the loading rate was also cho-sen to be 0:052 kN=s (equal to a 1 MPa=min increase in the stressof the loaded plane).
3.4. Ultrasonic pulse velocity (UPV) test
One of the non-destructive tests performed on the concrete isthe UPV test, which is frequently used for evaluating the concrete’squality, especially the mechanical properties of the concrete, dueto its high speed and repeatable results. Therefore, this test wasperformed on cubic specimens before fracturing them in the com-pressive strength test, and the results were presented in the formof strength estimation models. The test was performed accordingto ASTM C597 standard, using the Portable Ultrasonic Non-destructive Digital Indicating Tester (PUNDIT) device. The utilizeddevice is equipped with two transducers with 50 mm diameters,which create pulses with 54 kHz frequency in the specimen. Thepassing time of these pulses through the specimen is measuredwith a 0.1 ls precision by the device.
4. Results and discussion
4.1. Fresh properties of concrete
4.1.1. Optimum moisture and maximum densityDry mass of the proctor specimens was measured after com-
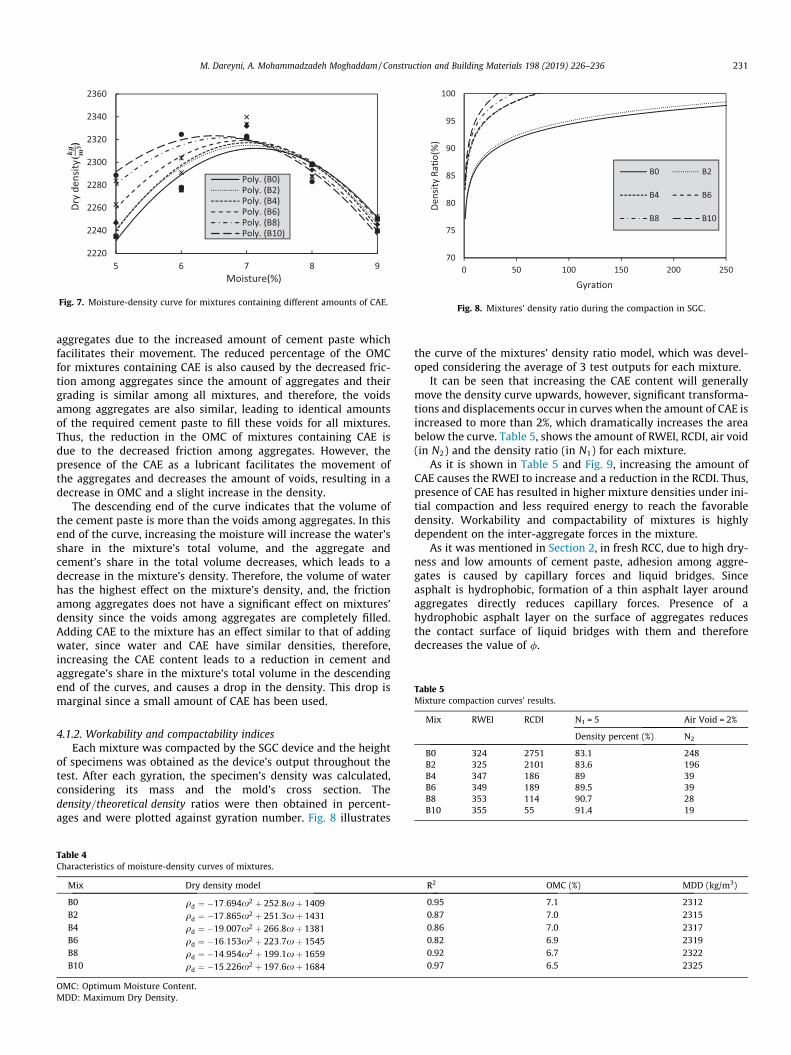
pacting and drying them in the 110 �C oven for 24 h, and themoisture-density curves were plotted for each mixture (Fig. 7).As it can be seen, there were two major changes in the moisture-density curves, i.e. a reduction in the OMC and an increase in theMDD. Quantities of the OMC and the MDD are presented in Table 4,for each mixture.
The moisture-density curve for the RCC follows a quadraticequation and comprises of an ascending and a descending end.The ascending end of the curves indicates mixtures which containcement paste in a lower volume than the voids among compactedaggregates. Filling these voids with the cement paste will lead toan increase in the mixture’s density in this end of the curve.Besides this reason, the other factor that increases the density ofthe mixture in this end of the curve is the decreased friction among
2220
2240
2260
2280
2300
2320
2340
2360
5 6 7 8 9
Dry
dens
ity
Moisture(%)
Poly. (B0)Poly. (B2)Poly. (B4)Poly. (B6)Poly. (B8)Poly. (B10)
()
Fig. 7. Moisture-density curve for mixtures containing different amounts of CAE.
70
75
80
85
90
95
100
0 50 100 150 200 250
Dens
ity R
a�o(
%)
Gyra�on
B0 B2
B4 B6
B8 B10
Fig. 8. Mixtures’ density ratio during the compaction in SGC.
Table 5Mixture compaction curves’ results.
M. Dareyni, A. Mohammadzadeh Moghaddam / Construction and Building Materials 198 (2019) 226–236 231
aggregates due to the increased amount of cement paste whichfacilitates their movement. The reduced percentage of the OMCfor mixtures containing CAE is also caused by the decreased fric-tion among aggregates since the amount of aggregates and theirgrading is similar among all mixtures, and therefore, the voidsamong aggregates are also similar, leading to identical amountsof the required cement paste to fill these voids for all mixtures.Thus, the reduction in the OMC of mixtures containing CAE isdue to the decreased friction among aggregates. However, thepresence of the CAE as a lubricant facilitates the movement ofthe aggregates and decreases the amount of voids, resulting in adecrease in OMC and a slight increase in the density.
The descending end of the curve indicates that the volume ofthe cement paste is more than the voids among aggregates. In thisend of the curve, increasing the moisture will increase the water’sshare in the mixture’s total volume, and the aggregate andcement’s share in the total volume decreases, which leads to adecrease in the mixture’s density. Therefore, the volume of waterhas the highest effect on the mixture’s density, and, the frictionamong aggregates does not have a significant effect on mixtures’density since the voids among aggregates are completely filled.Adding CAE to the mixture has an effect similar to that of addingwater, since water and CAE have similar densities, therefore,increasing the CAE content leads to a reduction in cement andaggregate’s share in the mixture’s total volume in the descendingend of the curves, and causes a drop in the density. This drop ismarginal since a small amount of CAE has been used.
Mix RWEI RCDI N1 = 5 Air Void = 2%
Density percent (%) N2
B0 324 2751 83.1 248B2 325 2101 83.6 196B4 347 186 89 39B6 349 189 89.5 39B8 353 114 90.7 28B10 355 55 91.4 19
4.1.2. Workability and compactability indicesEach mixture was compacted by the SGC device and the height
of specimens was obtained as the device’s output throughout thetest. After each gyration, the specimen’s density was calculated,considering its mass and the mold’s cross section. Thedensity=theoretical density ratios were then obtained in percent-ages and were plotted against gyration number. Fig. 8 illustrates
Table 4Characteristics of moisture-density curves of mixtures.
Mix Dry density model
B0 qd ¼ �17:694x2 þ 252:8xþ 1409B2 qd ¼ �17:865x2 þ 251:3xþ 1431B4 qd ¼ �19:007x2 þ 266:8xþ 1381B6 qd ¼ �16:153x2 þ 223:7xþ 1545B8 qd ¼ �14:954x2 þ 199:1xþ 1659B10 qd ¼ �15:226x2 þ 197:6xþ 1684
OMC: Optimum Moisture Content.MDD: Maximum Dry Density.
the curve of the mixtures’ density ratio model, which was devel-oped considering the average of 3 test outputs for each mixture.
It can be seen that increasing the CAE content will generallymove the density curve upwards, however, significant transforma-tions and displacements occur in curves when the amount of CAE isincreased to more than 2%, which dramatically increases the areabelow the curve. Table 5, shows the amount of RWEI, RCDI, air void(in N2) and the density ratio (in N1) for each mixture.
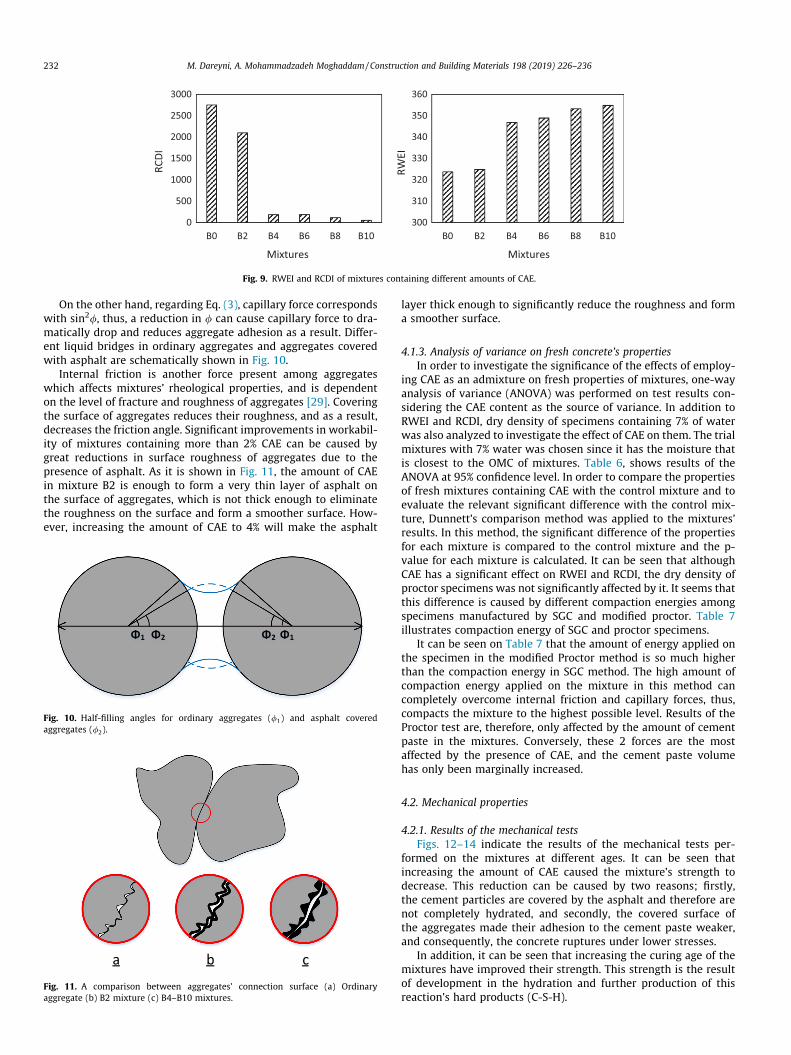
As it is shown in Table 5 and Fig. 9, increasing the amount ofCAE causes the RWEI to increase and a reduction in the RCDI. Thus,presence of CAE has resulted in higher mixture densities under ini-tial compaction and less required energy to reach the favorabledensity. Workability and compactability of mixtures is highlydependent on the inter-aggregate forces in the mixture.
As it was mentioned in Section 2, in fresh RCC, due to high dry-ness and low amounts of cement paste, adhesion among aggre-gates is caused by capillary forces and liquid bridges. Sinceasphalt is hydrophobic, formation of a thin asphalt layer aroundaggregates directly reduces capillary forces. Presence of ahydrophobic asphalt layer on the surface of aggregates reducesthe contact surface of liquid bridges with them and thereforedecreases the value of /.
R2 OMC (%) MDD (kg/m3)
0.95 7.1 23120.87 7.0 23150.86 7.0 23170.82 6.9 23190.92 6.7 23220.97 6.5 2325
0
500
1000
1500
2000
2500
3000
B0 B2 B4 B6 B8 B10
RCDI
Mixtures
300
310
320
330
340
350
360
B0 B2 B4 B6 B8 B10
RWEI
Mixtures
Fig. 9. RWEI and RCDI of mixtures containing different amounts of CAE.
232 M. Dareyni, A. Mohammadzadeh Moghaddam / Construction and Building Materials 198 (2019) 226–236
On the other hand, regarding Eq. (3), capillary force correspondswith sin2/, thus, a reduction in / can cause capillary force to dra-matically drop and reduces aggregate adhesion as a result. Differ-ent liquid bridges in ordinary aggregates and aggregates coveredwith asphalt are schematically shown in Fig. 10.
Internal friction is another force present among aggregateswhich affects mixtures’ rheological properties, and is dependenton the level of fracture and roughness of aggregates [29]. Coveringthe surface of aggregates reduces their roughness, and as a result,decreases the friction angle. Significant improvements in workabil-ity of mixtures containing more than 2% CAE can be caused bygreat reductions in surface roughness of aggregates due to thepresence of asphalt. As it is shown in Fig. 11, the amount of CAEin mixture B2 is enough to form a very thin layer of asphalt onthe surface of aggregates, which is not thick enough to eliminatethe roughness on the surface and form a smoother surface. How-ever, increasing the amount of CAE to 4% will make the asphalt
Φ1Φ2Φ1 Φ2
Fig. 10. Half-filling angles for ordinary aggregates (/1) and asphalt coveredaggregates (/2).
a b cFig. 11. A comparison between aggregates’ connection surface (a) Ordinaryaggregate (b) B2 mixture (c) B4–B10 mixtures.
layer thick enough to significantly reduce the roughness and forma smoother surface.
4.1.3. Analysis of variance on fresh concrete’s propertiesIn order to investigate the significance of the effects of employ-
ing CAE as an admixture on fresh properties of mixtures, one-wayanalysis of variance (ANOVA) was performed on test results con-sidering the CAE content as the source of variance. In addition toRWEI and RCDI, dry density of specimens containing 7% of waterwas also analyzed to investigate the effect of CAE on them. The trialmixtures with 7% water was chosen since it has the moisture thatis closest to the OMC of mixtures. Table 6, shows results of theANOVA at 95% confidence level. In order to compare the propertiesof fresh mixtures containing CAE with the control mixture and toevaluate the relevant significant difference with the control mix-ture, Dunnett’s comparison method was applied to the mixtures’results. In this method, the significant difference of the propertiesfor each mixture is compared to the control mixture and the p-value for each mixture is calculated. It can be seen that althoughCAE has a significant effect on RWEI and RCDI, the dry density ofproctor specimens was not significantly affected by it. It seems thatthis difference is caused by different compaction energies amongspecimens manufactured by SGC and modified proctor. Table 7illustrates compaction energy of SGC and proctor specimens.
It can be seen on Table 7 that the amount of energy applied onthe specimen in the modified Proctor method is so much higherthan the compaction energy in SGC method. The high amount ofcompaction energy applied on the mixture in this method cancompletely overcome internal friction and capillary forces, thus,compacts the mixture to the highest possible level. Results of theProctor test are, therefore, only affected by the amount of cementpaste in the mixtures. Conversely, these 2 forces are the mostaffected by the presence of CAE, and the cement paste volumehas only been marginally increased.
4.2. Mechanical properties
4.2.1. Results of the mechanical testsFigs. 12–14 indicate the results of the mechanical tests per-
formed on the mixtures at different ages. It can be seen thatincreasing the amount of CAE caused the mixture’s strength todecrease. This reduction can be caused by two reasons; firstly,the cement particles are covered by the asphalt and therefore arenot completely hydrated, and secondly, the covered surface ofthe aggregates made their adhesion to the cement paste weaker,and consequently, the concrete ruptures under lower stresses.
In addition, it can be seen that increasing the curing age of themixtures have improved their strength. This strength is the resultof development in the hydration and further production of thisreaction’s hard products (C-S-H).
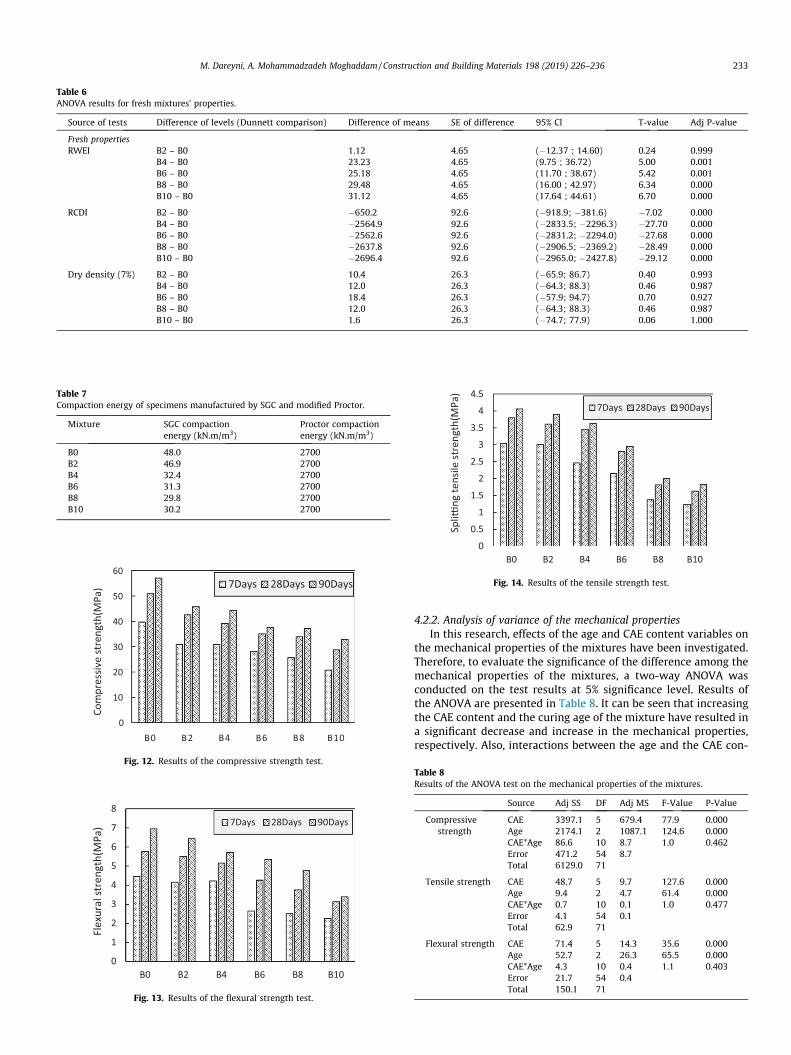
Table 6ANOVA results for fresh mixtures’ properties.
Source of tests Difference of levels (Dunnett comparison) Difference of means SE of difference 95% Cl T-value Adj P-value
Fresh propertiesRWEI B2 – B0 1.12 4.65 (�12.37 ; 14.60) 0.24 0.999
B4 – B0 23.23 4.65 (9.75 ; 36.72) 5.00 0.001B6 – B0 25.18 4.65 (11.70 ; 38.67) 5.42 0.001B8 – B0 29.48 4.65 (16.00 ; 42.97) 6.34 0.000B10 – B0 31.12 4.65 (17.64 ; 44.61) 6.70 0.000
RCDI B2 – B0 �650.2 92.6 (�918.9; �381.6) �7.02 0.000B4 – B0 �2564.9 92.6 (�2833.5; �2296.3) �27.70 0.000B6 – B0 �2562.6 92.6 (�2831.2; �2294.0) �27.68 0.000B8 – B0 �2637.8 92.6 (�2906.5; �2369.2) �28.49 0.000B10 – B0 �2696.4 92.6 (�2965.0; �2427.8) �29.12 0.000
Dry density (7%) B2 – B0 10.4 26.3 (�65.9; 86.7) 0.40 0.993B4 – B0 12.0 26.3 (�64.3; 88.3) 0.46 0.987B6 – B0 18.4 26.3 (�57.9; 94.7) 0.70 0.927B8 – B0 12.0 26.3 (�64.3; 88.3) 0.46 0.987B10 – B0 1.6 26.3 (�74.7; 77.9) 0.06 1.000
Table 7Compaction energy of specimens manufactured by SGC and modified Proctor.
Mixture SGC compactionenergy (kN.m/m3)
Proctor compactionenergy (kN.m/m3)
B0 48.0 2700B2 46.9 2700B4 32.4 2700B6 31.3 2700B8 29.8 2700B10 30.2 2700
0
10
20
30
40
50
60
B0 B2 B4 B6 B8 B10
Com
pres
sive
stre
ngth
(MPa
) 7Days 28Days 90Days
Fig. 12. Results of the compressive strength test.
0
1
2
3
4
5
6
7
8
B0 B2 B4 B6 B8 B10
Flex
ural
stre
ngth
(MPa
) 7Days 28Days 90Days
Fig. 13. Results of the flexural strength test.
0
0.5
1
1.5
2
2.5
3
3.5
4
4.5
B0 B2 B4 B6 B8 B10
Spli�
ng te
nsile
stre
ngth
(MPa
)
7Days 28Days 90Days
Fig. 14. Results of the tensile strength test.
M. Dareyni, A. Mohammadzadeh Moghaddam / Construction and Building Materials 198 (2019) 226–236 233
4.2.2. Analysis of variance of the mechanical propertiesIn this research, effects of the age and CAE content variables on
the mechanical properties of the mixtures have been investigated.Therefore, to evaluate the significance of the difference among themechanical properties of the mixtures, a two-way ANOVA wasconducted on the test results at 5% significance level. Results ofthe ANOVA are presented in Table 8. It can be seen that increasingthe CAE content and the curing age of the mixture have resulted ina significant decrease and increase in the mechanical properties,respectively. Also, interactions between the age and the CAE con-
Table 8Results of the ANOVA test on the mechanical properties of the mixtures.
Source Adj SS DF Adj MS F-Value P-Value
Compressivestrength
CAE 3397.1 5 679.4 77.9 0.000Age 2174.1 2 1087.1 124.6 0.000CAE*Age 86.6 10 8.7 1.0 0.462Error 471.2 54 8.7Total 6129.0 71
Tensile strength CAE 48.7 5 9.7 127.6 0.000Age 9.4 2 4.7 61.4 0.000CAE*Age 0.7 10 0.1 1.0 0.477Error 4.1 54 0.1Total 62.9 71
Flexural strength CAE 71.4 5 14.3 35.6 0.000Age 52.7 2 26.3 65.5 0.000CAE*Age 4.3 10 0.4 1.1 0.403Error 21.7 54 0.4Total 150.1 71
234 M. Dareyni, A. Mohammadzadeh Moghaddam / Construction and Building Materials 198 (2019) 226–236
tent did not have a significant effect on the mechanical properties.In other words, the effect of the CAE content on the mechanicalproperties of concrete does not depend on the mixture’s age.
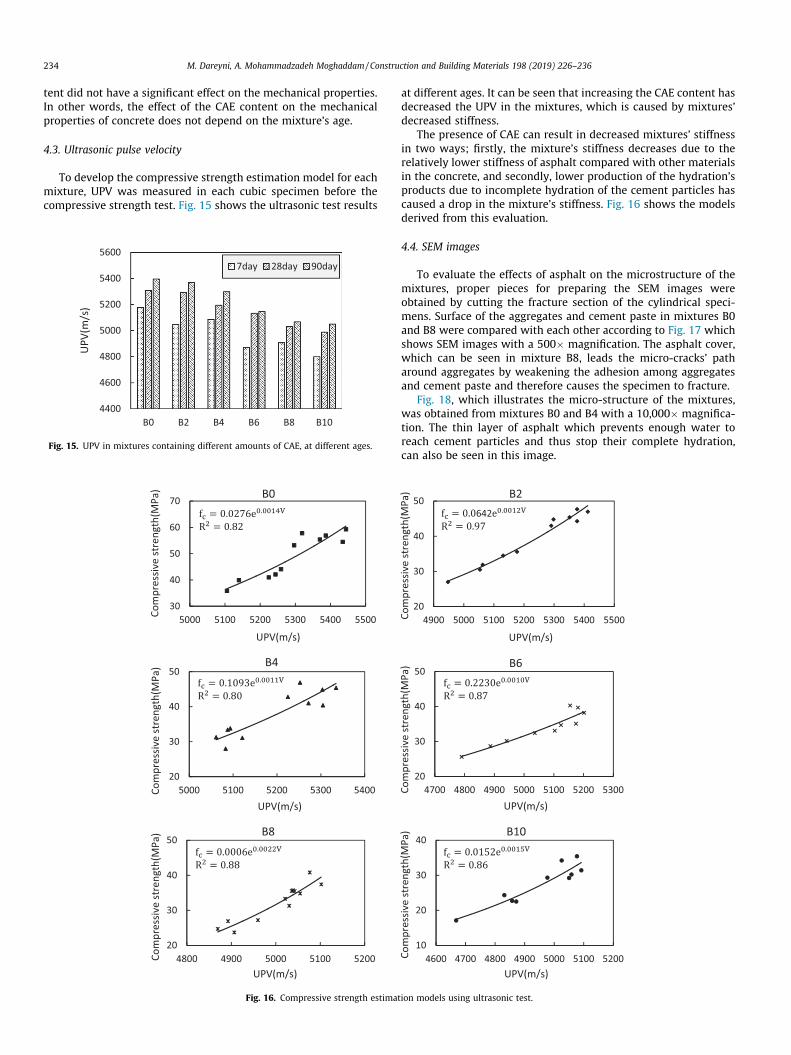
4.3. Ultrasonic pulse velocity
To develop the compressive strength estimation model for eachmixture, UPV was measured in each cubic specimen before thecompressive strength test. Fig. 15 shows the ultrasonic test results
4400
4600
4800
5000
5200
5400
5600
B0 B2 B4 B6 B8 B10
UPV
(m/s
)
7day 28day 90day
Fig. 15. UPV in mixtures containing different amounts of CAE, at different ages.
30
40
50
60
70
5000 5100 5200 5300 5400 5500Com
pres
sive
stre
ngth
(MPa
)
UPV(m/s)
B0
20
30
40
50
5000 5100 5200 5300 5400Com
pres
sive
stre
ngth
(MPa
)
UPV(m/s)
B4
20
30
40
50
4800 4900 5000 5100 5200Com
pres
sive
stre
ngth
(MPa
)
UPV(m/s)
B8
Fig. 16. Compressive strength estimat
at different ages. It can be seen that increasing the CAE content hasdecreased the UPV in the mixtures, which is caused by mixtures’decreased stiffness.
The presence of CAE can result in decreased mixtures’ stiffnessin two ways; firstly, the mixture’s stiffness decreases due to therelatively lower stiffness of asphalt compared with other materialsin the concrete, and secondly, lower production of the hydration’sproducts due to incomplete hydration of the cement particles hascaused a drop in the mixture’s stiffness. Fig. 16 shows the modelsderived from this evaluation.
4.4. SEM images
To evaluate the effects of asphalt on the microstructure of themixtures, proper pieces for preparing the SEM images wereobtained by cutting the fracture section of the cylindrical speci-mens. Surface of the aggregates and cement paste in mixtures B0and B8 were compared with each other according to Fig. 17 whichshows SEM images with a 500� magnification. The asphalt cover,which can be seen in mixture B8, leads the micro-cracks’ patharound aggregates by weakening the adhesion among aggregatesand cement paste and therefore causes the specimen to fracture.
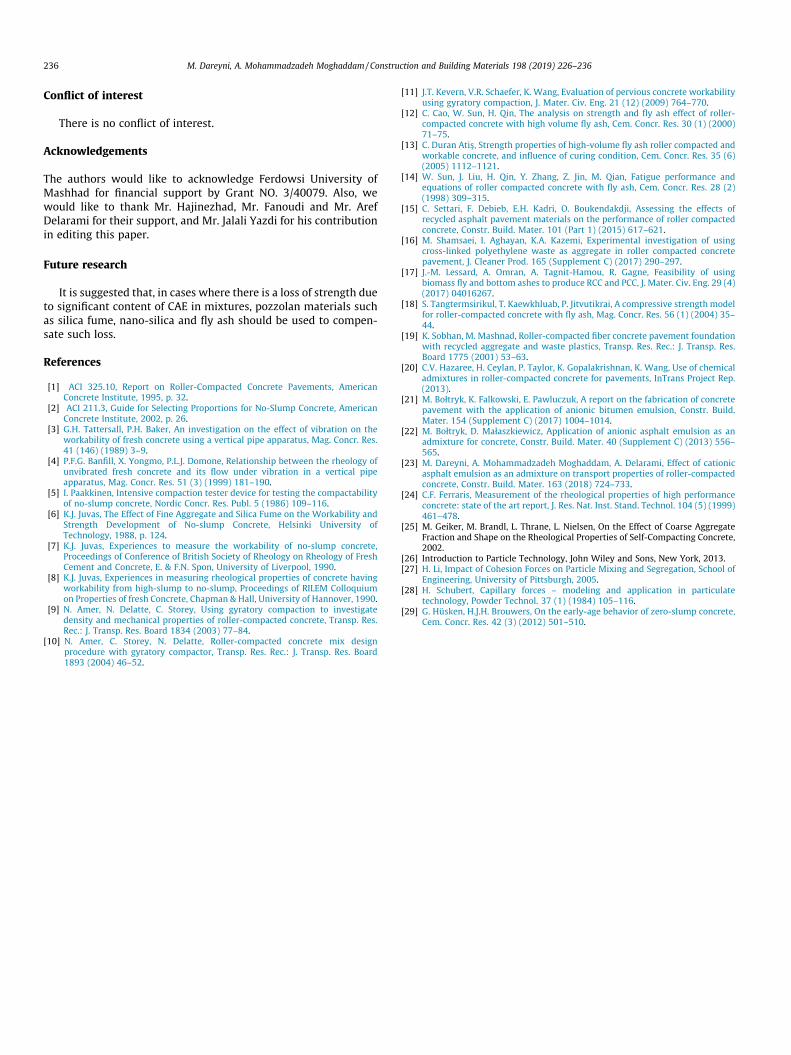
Fig. 18, which illustrates the micro-structure of the mixtures,was obtained from mixtures B0 and B4 with a 10,000� magnifica-tion. The thin layer of asphalt which prevents enough water toreach cement particles and thus stop their complete hydration,can also be seen in this image.
20
30
40
50
4900 5000 5100 5200 5300 5400 5500Com
pres
sive
stre
ngth
(MPa
)
UPV(m/s)
B2642
20
30
40
50
4700 4800 4900 5000 5100 5200 5300Com
pres
sive
stre
ngth
(MPa
)
UPV(m/s)
B6
10
20
30
40
4600 4700 4800 4900 5000 5100 5200Com
pres
sive
stre
ngth
(MPa
)
UPV(m/s)
B10
ion models using ultrasonic test.
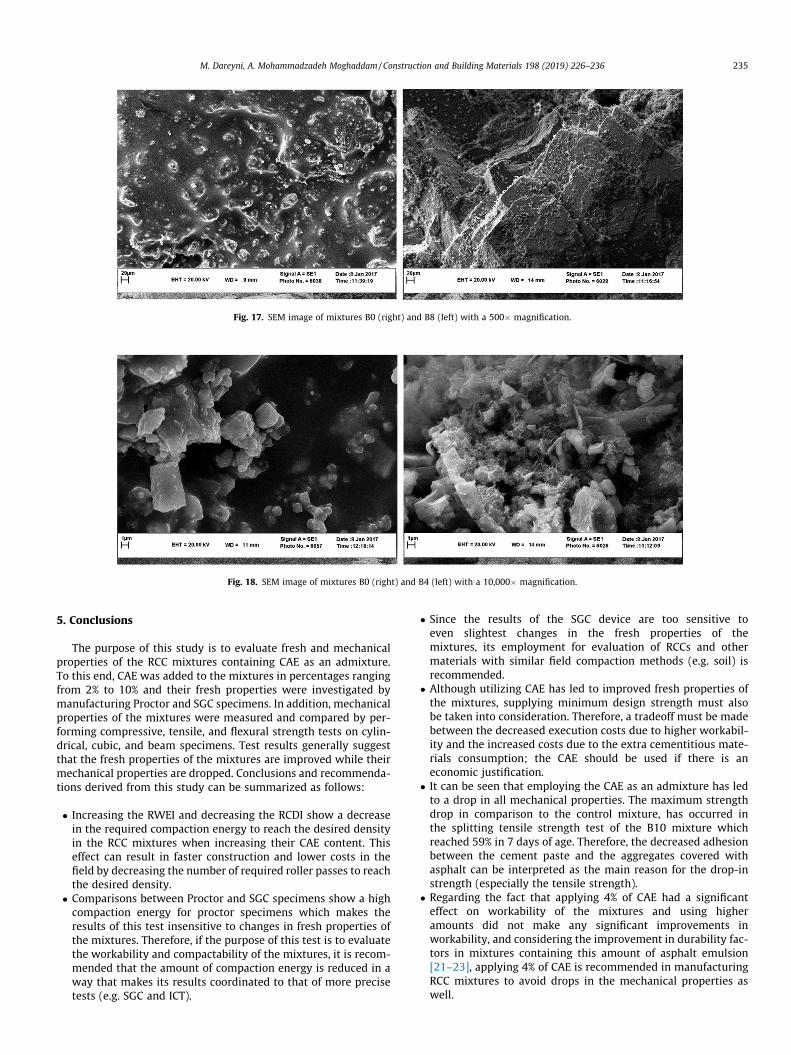
Fig. 17. SEM image of mixtures B0 (right) and B8 (left) with a 500� magnification.
Fig. 18. SEM image of mixtures B0 (right) and B4 (left) with a 10,000� magnification.
M. Dareyni, A. Mohammadzadeh Moghaddam / Construction and Building Materials 198 (2019) 226–236 235
5. Conclusions
The purpose of this study is to evaluate fresh and mechanicalproperties of the RCC mixtures containing CAE as an admixture.To this end, CAE was added to the mixtures in percentages rangingfrom 2% to 10% and their fresh properties were investigated bymanufacturing Proctor and SGC specimens. In addition, mechanicalproperties of the mixtures were measured and compared by per-forming compressive, tensile, and flexural strength tests on cylin-drical, cubic, and beam specimens. Test results generally suggestthat the fresh properties of the mixtures are improved while theirmechanical properties are dropped. Conclusions and recommenda-tions derived from this study can be summarized as follows:
� Increasing the RWEI and decreasing the RCDI show a decreasein the required compaction energy to reach the desired densityin the RCC mixtures when increasing their CAE content. Thiseffect can result in faster construction and lower costs in thefield by decreasing the number of required roller passes to reachthe desired density.
� Comparisons between Proctor and SGC specimens show a highcompaction energy for proctor specimens which makes theresults of this test insensitive to changes in fresh properties ofthe mixtures. Therefore, if the purpose of this test is to evaluatethe workability and compactability of the mixtures, it is recom-mended that the amount of compaction energy is reduced in away that makes its results coordinated to that of more precisetests (e.g. SGC and ICT).
� Since the results of the SGC device are too sensitive toeven slightest changes in the fresh properties of themixtures, its employment for evaluation of RCCs and othermaterials with similar field compaction methods (e.g. soil) isrecommended.
� Although utilizing CAE has led to improved fresh properties ofthe mixtures, supplying minimum design strength must alsobe taken into consideration. Therefore, a tradeoff must be madebetween the decreased execution costs due to higher workabil-ity and the increased costs due to the extra cementitious mate-rials consumption; the CAE should be used if there is aneconomic justification.
� It can be seen that employing the CAE as an admixture has ledto a drop in all mechanical properties. The maximum strengthdrop in comparison to the control mixture, has occurred inthe splitting tensile strength test of the B10 mixture whichreached 59% in 7 days of age. Therefore, the decreased adhesionbetween the cement paste and the aggregates covered withasphalt can be interpreted as the main reason for the drop-instrength (especially the tensile strength).
� Regarding the fact that applying 4% of CAE had a significanteffect on workability of the mixtures and using higheramounts did not make any significant improvements inworkability, and considering the improvement in durability fac-tors in mixtures containing this amount of asphalt emulsion[21–23], applying 4% of CAE is recommended in manufacturingRCC mixtures to avoid drops in the mechanical properties aswell.
236 M. Dareyni, A. Mohammadzadeh Moghaddam / Construction and Building Materials 198 (2019) 226–236
Conflict of interest
There is no conflict of interest.
Acknowledgements
The authors would like to acknowledge Ferdowsi University ofMashhad for financial support by Grant NO. 3/40079. Also, wewould like to thank Mr. Hajinezhad, Mr. Fanoudi and Mr. ArefDelarami for their support, and Mr. Jalali Yazdi for his contributionin editing this paper.
Future research
It is suggested that, in cases where there is a loss of strength dueto significant content of CAE in mixtures, pozzolan materials suchas silica fume, nano-silica and fly ash should be used to compen-sate such loss.
References
[1] ACI 325.10, Report on Roller-Compacted Concrete Pavements, AmericanConcrete Institute, 1995, p. 32.
[2] ACI 211.3, Guide for Selecting Proportions for No-Slump Concrete, AmericanConcrete Institute, 2002, p. 26.
[3] G.H. Tattersall, P.H. Baker, An investigation on the effect of vibration on theworkability of fresh concrete using a vertical pipe apparatus, Mag. Concr. Res.41 (146) (1989) 3–9.
[4] P.F.G. Banfill, X. Yongmo, P.L.J. Domone, Relationship between the rheology ofunvibrated fresh concrete and its flow under vibration in a vertical pipeapparatus, Mag. Concr. Res. 51 (3) (1999) 181–190.
[5] I. Paakkinen, Intensive compaction tester device for testing the compactabilityof no-slump concrete, Nordic Concr. Res. Publ. 5 (1986) 109–116.
[6] K.J. Juvas, The Effect of Fine Aggregate and Silica Fume on the Workability andStrength Development of No-slump Concrete, Helsinki University ofTechnology, 1988, p. 124.
[7] K.J. Juvas, Experiences to measure the workability of no-slump concrete,Proceedings of Conference of British Society of Rheology on Rheology of FreshCement and Concrete, E. & F.N. Spon, University of Liverpool, 1990.
[8] K.J. Juvas, Experiences in measuring rheological properties of concrete havingworkability from high-slump to no-slump, Proceedings of RILEM Colloquiumon Properties of fresh Concrete, Chapman & Hall, University of Hannover, 1990.
[9] N. Amer, N. Delatte, C. Storey, Using gyratory compaction to investigatedensity and mechanical properties of roller-compacted concrete, Transp. Res.Rec.: J. Transp. Res. Board 1834 (2003) 77–84.
[10] N. Amer, C. Storey, N. Delatte, Roller-compacted concrete mix designprocedure with gyratory compactor, Transp. Res. Rec.: J. Transp. Res. Board1893 (2004) 46–52.
[11] J.T. Kevern, V.R. Schaefer, K. Wang, Evaluation of pervious concrete workabilityusing gyratory compaction, J. Mater. Civ. Eng. 21 (12) (2009) 764–770.
[12] C. Cao, W. Sun, H. Qin, The analysis on strength and fly ash effect of roller-compacted concrete with high volume fly ash, Cem. Concr. Res. 30 (1) (2000)71–75.
[13] C. Duran Atis�, Strength properties of high-volume fly ash roller compacted andworkable concrete, and influence of curing condition, Cem. Concr. Res. 35 (6)(2005) 1112–1121.
[14] W. Sun, J. Liu, H. Qin, Y. Zhang, Z. Jin, M. Qian, Fatigue performance andequations of roller compacted concrete with fly ash, Cem. Concr. Res. 28 (2)(1998) 309–315.
[15] C. Settari, F. Debieb, E.H. Kadri, O. Boukendakdji, Assessing the effects ofrecycled asphalt pavement materials on the performance of roller compactedconcrete, Constr. Build. Mater. 101 (Part 1) (2015) 617–621.
[16] M. Shamsaei, I. Aghayan, K.A. Kazemi, Experimental investigation of usingcross-linked polyethylene waste as aggregate in roller compacted concretepavement, J. Cleaner Prod. 165 (Supplement C) (2017) 290–297.
[17] J.-M. Lessard, A. Omran, A. Tagnit-Hamou, R. Gagne, Feasibility of usingbiomass fly and bottom ashes to produce RCC and PCC, J. Mater. Civ. Eng. 29 (4)(2017) 04016267.
[18] S. Tangtermsirikul, T. Kaewkhluab, P. Jitvutikrai, A compressive strength modelfor roller-compacted concrete with fly ash, Mag. Concr. Res. 56 (1) (2004) 35–44.
[19] K. Sobhan, M. Mashnad, Roller-compacted fiber concrete pavement foundationwith recycled aggregate and waste plastics, Transp. Res. Rec.: J. Transp. Res.Board 1775 (2001) 53–63.
[20] C.V. Hazaree, H. Ceylan, P. Taylor, K. Gopalakrishnan, K. Wang, Use of chemicaladmixtures in roller-compacted concrete for pavements, InTrans Project Rep.(2013).
[21] M. Bołtryk, K. Falkowski, E. Pawluczuk, A report on the fabrication of concretepavement with the application of anionic bitumen emulsion, Constr. Build.Mater. 154 (Supplement C) (2017) 1004–1014.
[22] M. Bołtryk, D. Małaszkiewicz, Application of anionic asphalt emulsion as anadmixture for concrete, Constr. Build. Mater. 40 (Supplement C) (2013) 556–565.
[23] M. Dareyni, A. Mohammadzadeh Moghaddam, A. Delarami, Effect of cationicasphalt emulsion as an admixture on transport properties of roller-compactedconcrete, Constr. Build. Mater. 163 (2018) 724–733.
[24] C.F. Ferraris, Measurement of the rheological properties of high performanceconcrete: state of the art report, J. Res. Nat. Inst. Stand. Technol. 104 (5) (1999)461–478.
[25] M. Geiker, M. Brandl, L. Thrane, L. Nielsen, On the Effect of Coarse AggregateFraction and Shape on the Rheological Properties of Self-Compacting Concrete,2002.
[26] Introduction to Particle Technology, John Wiley and Sons, New York, 2013.[27] H. Li, Impact of Cohesion Forces on Particle Mixing and Segregation, School of
Engineering, University of Pittsburgh, 2005.[28] H. Schubert, Capillary forces – modeling and application in particulate
technology, Powder Technol. 37 (1) (1984) 105–116.[29] G. Hüsken, H.J.H. Brouwers, On the early-age behavior of zero-slump concrete,
Cem. Concr. Res. 42 (3) (2012) 501–510.