Embed Size (px)
Citation preview

1567
INTRODUCTIONThe decomposition of sound into its frequency components throughspectral analysis is common in all vertebrate auditory systems (Lewisand Fay, 2004). Spectral analysis of a sound signal reveals whichfrequencies are contained within a signal and the relative proportions(amplitudes) of the frequencies to one another. Spectral analysis isused for sound source segregation and the identification of soundsources, which are important for auditory scene analysis andcommunication (Bregman, 1990; Fay and Popper, 2000; Lewis andFay, 2004). Detection of a signal of a particular frequency (or setof frequencies) that is embedded in broadband noise can beimproved by passing it through a set of auditory filters which reducesthe noise power while leaving the signal power largely unaltered(Popper et al., 2003).
Most studies on spectral analysis and the underlying peripheralcoding mechanisms for frequency analysis in fish have beenconducted in teleosts (derived bony fishes) (Furukawa et al., 1967;Fay, 1978a; Moeng and Popper, 1984; Fay and Ream, 1986; Fay,1997; Fay and Edds-Walton, 1997a; Fay, 1998; Lu et al., 1998;Edds-Walton et al., 1999; McKibben and Bass, 1999; Fay, 2000;Weeg et al., 2002; Lu et al., 2003; Lu et al., 2004). Two studieswere conducted in a cartilaginous fish species, Negaprionbrevirostris (lemon shark) (Corwin, 1981a; Corwin, 1989) mainlymeasuring compound action potentials in the eighth nerve. However,there are no studies on the response properties of eighth nerveafferents (or any behavioral study) in a non-teleost bony fish. Suchdata would provide important insights into the evolutionary originof coding mechanisms for sound in fishes or in tetrapods. One suchspecies is Acipenser fulvescens (Rafinesque, 1817), the lakesturgeon, an ancestral member of the ray-finned fishes (oractinopterygians). Although the majority of actinopterygians areteleosts (more than 26,000 species) (Nelson, 2006) there are only48 extant non-teleost actinopterygian species (Liem et al., 2001).Of these, 25 species are sturgeons (family: Acipenseridae) and two
species belong to a sister group, the paddlefishes (family:Polyodontidae). Both Acipenseridae and Polyodontidae belong tothe order Acipenseriformes, a group which has a phylogenetichistory dating back about 250 million years (Grande and Bemis,1996).
From an evolutionary perspective, studies on non-teleostactinopterygian groups are important as they provide insight intopotential mechanisms of signal processing in an ancestral group.Moreover, such studies are critical for comparison with teleoststudies since they help to distinguish which character traits areancestral and which are derived (Wiley, 1981; Northcutt, 1985;Northcutt, 1986; Bolker, 2004) within the actinopterygians.
Acipenser fulvescens occur in the freshwaters of North Americaand Canada and usually lives on the bottom of the riverbed or lake.The fish migrate up rivers to spawn (Herald, 1961) and prefer certainspawning sites, which may be indicative of homing capabilities(Bemis and Kynard, 1997). Hearing may generally be useful inproviding cues about the auditory scene (Fay and Popper, 2000),which then provides information that assist sturgeon in theirmigration between rivers and lakes either for spawning or feeding.Vocalizations by male A. fulvescens have been described duringspawning season in the wild (Bruch and Binkowski, 2002). Thesesounds, however, have not been recorded and analyzed in terms oftheir frequency spectrum.
There have been a few physiological studies investigating hearingin ancestral groups of bony and cartilaginous fish (sharks and rays).These include one study on A. fulvescens and Polyodon spatula(Paddlefish) (Lovell et al., 2005) and several studies on sharks (e.g.Corwin et al., 1981b; Kenyon et al., 1998; Casper et al., 2003; Casperand Mann, 2007). All findings in these studies were based onauditory brainstem recordings (evoked potentials, AEPs). Otherstudies in sharks describe behavioral aspects of hearing (e.g. Banner,1967; Kelly and Nelson, 1967; Myrberg et al., 1972; Nelson andJohnson, 1976). We decided to choose an ancestral bony fish instead
The Journal of Experimental Biology 213, 1567-1578© 2010. Published by The Company of Biologists Ltddoi:10.1242/jeb.031757
Frequency tuning and intensity coding of sound in the auditory periphery of the lakesturgeon, Acipenser fulvescens
Michaela Meyer1,*, Richard R. Fay2 and Arthur N. Popper1
1Department of Biology, University of Maryland, College Park, MD 20742, USA and 2Parmly Hearing Institute, Loyola University ofChicago, Chicago, IL 60626, USA
*Author for correspondence ([email protected])
SUMMARYAcipenser fulvescens, the lake sturgeon, belongs to one of the few extant non-teleost ray-finned (bony) fishes. The sturgeons(family Acipenseridae) have a phylogenetic history that dates back about 250 million years. The study reported here is the firstinvestigation of peripheral coding strategies for spectral analysis in the auditory system in a non-teleost bony fish. We used ashaker system to simulate the particle motion component of sound during electrophysiological recordings of isolated single unitsfrom the eighth nerve innervating the saccule and lagena. Background activity and response characteristics of saccular andlagenar afferents (such as thresholds, response–level functions and temporal firing) resembled the ones found in teleosts. Thedistribution of best frequencies also resembled data in teleosts (except for Carassius auratus, goldfish) tested with the samestimulation method. The saccule and lagena in A. fulvescens contain otoconia, in contrast to the solid otoliths found in teleosts,however, this difference in otolith structure did not appear to affect threshold, frequency tuning, intensity- or temporal responsesof auditory afferents. In general, the physiological characteristics common to A. fulvescens, teleosts and land vertebrates reflectimportant functions of the auditory system that may have been conserved throughout the evolution of vertebrates.
Key words: auditory code, sturgeon, auditory, ancestral, particle motion, single unit.
THE JOURNAL OF EXPERIMENTAL BIOLOGY

1568
of a cartilaginous fish since it makes a comparison with data obtainedin teleosts (which we know most about) easier.
Most investigations on fish used loudspeakers which generatedboth pressure and particle motion. Although the inner ear of somefish species detect sound pressure indirectly, fish share a commonmechanism for ear stimulation that involves one or more otolithorgans (saccule, lagena, utricle) that respond directly, as inertialaccelerometers, to acoustic particle motion accelerating the fish’sbody in a sound field (de Vries, 1950; Fay, 1984; Hawkins, 1993).
Particle motion can vary in unpredictable ways with respect tothe sound pressure field generated by a loudspeaker immersed in asmall tank. To avoid this problem, we used a shaker table to simulatethe effect of particle motion by linearly accelerating the animal atdifferent frequencies and intensities (Fay, 1984). This method hasbeen previously used in only a few frequency studies in teleosts(e.g. Fay and Edds-Walton, 1997a; Weeg et al., 2002; Buchser etal., 2003; Lu et al., 2003; Lu et al., 2004).
In the current study we investigated the response of primary eighthnerve afferents innervating the saccule and lagena in A. fulvescensin terms of frequency selectivity, intensity dependence and temporalpattern. The data presented here represent the first detailedelectrophysiological investigation of auditory coding strategies ina non-teleost bony fish.
MATERIALS AND METHODSExperimental animals
Acipenser fulvescens, 25–37cm in total length (21–28cm in standardlength) were obtained from the Wild Rose fish hatchery of theWisconsin Department of Natural Resources. The fish were between1 and 2years old with body masses ranging between 45 and 115g.They were housed in 45-gallon (~200liter) tanks containing aeratedwater maintained by external filters and kept at a temperature of 17to 18°C on a 12h:12h light:dark cycle. Recordings from 21 fishwere used. We used the convention aa, bb, cc, etc. to identify specificanimals, and numbers to identify units (e.g. ‘pp9’ stands for unitnumber 9, recorded from animal ‘pp’). The care and experimentaluse of A. fulvescens were carried out using protocols approved bythe University of Maryland Institutional Animal Care and UseCommittee.
Surgery and anesthesiaFish were lightly anesthetized in a bath containing 0.05% buffered3-aminobenzoic acid methane-sulfonate salt (Sigma, St Louis, MO,USA) dissolved in tank water, immobilized with an intramuscularinjection of gallamine triethiodide in goldfish Ringer’s solution(43gg–1bodymass), and then transferred to a surgical dish. Forartificial respiration, aerated water was continuously pumpedthrough the fish’s mouth at a flow rate of 100–200mlmin–1. Tolocally anesthetize the surgical area, the skin at the dorsal surfaceof the head was dabbed with 2.5% Lidocaine (Astra ChemicalsGmbH, Wedel, Germany). An opening into the cranium was madeat the level of the entrance of the eighth nerve into the brain andfrom this moment the exposed brain was kept constantly moist withan inert fluorocarbon liquid (FC-77, 3M Corp, Sigma, St Louis,MO, USA) during the experiment. After completion of the surgery,fish were placed into an aluminum dish (diameter, 23cm; height,6cm) which was mounted on a three-dimensional shaker table(described below). A rigid holder with a respirator tube especiallydesigned for A. fulvescens was used to secure the head of the fishto the dish. Aerated tank water (temperature: 17–18°C) was pumpedthrough the respirator into the fish’s mouth via a Neslab RTE-111chiller pump (Cole-Parmer, Vernon Hills, Il, USA).
In preparation for electrophysiological recordings from theposterior ramus of the eighth nerve (Fig.1), the brain was slowlyretracted to the left side with a custom-made plastic retractor. Specialcare was taken that semicircular canals and all otolith organs of theear were not damaged during this procedure.
Stimulation systemThe shaker table developed by Fay (Fay, 1984) was used to testfrequency and intensity responses to sound in primary afferents ofA. fulvescens simulating the effects of particle motion of underwatersound in a natural environment (for details, see Fay and Edds-Walton, 1997b; Lu et al., 2003; Lu et al., 2004). The table consistedof a circular dish driven by five shakers. Four shakers (Bruel andKjaer no. 4810, Naerum, Denmark) generated motion in thehorizontal plane, while the fifth (Bruel and Kjaer no. 4809, Naerum,Denmark) generated vertical motion. The horizontal shakers werearranged in two orthogonal pairs, each in a push–pull arrangement.The vertical shaker was attached via a rod to the center of the bottom
M. Meyer, R. R. Fay and A. N. Popper
A
Posteriorramus
B
Anteriorramus
500 µm
Saccule Lagena
C
200 µm
Macula neglecta
D
A EA
S
U
LSM
LM
CC P
Fig. 1. (A)Diagram of a medial view of the right ear showing the spatialorientation of the saccule and lagena (located vertically in one pouch) inAcipenser sturio (Baltic sturgeon) (Retzius, 1881). A, anterior semicircularcanal; CC, crus commune; E, endolymphatic duct; L, lagena; LM, lagenarmacula (epithelium); P, posterior semicircular canal; S, saccule; SM,saccular macula; U, utricle. (B)Innervation of the right saccule and lagenain Acipenser fulvescens (medial view; photograph by M. Meyer). Thebracket indicates the recording site on the posterior ramus carrying fibersfrom the saccule and lagena. The more posterior portion of the nerve (justinnervating the lagena) is tightly attached to the pouch making recordingsdifficult without damaging the pouch. (C)Outline of the saccule and lagenain A. fulvescens showing the orientation of the hair cells. Arrows arepointing in the direction of the kinocilium [adapted from Lovell et al. (Lovellet al., 2005)].
THE JOURNAL OF EXPERIMENTAL BIOLOGY

1569Auditory coding in sturgeon
of the dish. As a result of the shaker positions, the stimulus consistedof linear oscillatory motions of the circular dish, thereby movingthe fish along distinct axes in the horizontal and midsagittal planes.Before measuring frequency responses, we determined the mostcommon best direction of afferents.
The entire shaker system was positioned on a Micro-Gpneumatic vibration isolation table (K&Us Equipment Inc,Boulder Creek, CA, USA). Signals to the front-to-back shakerpair, side-to-side shaker pair and the vertical shaker were digitallysynthesized sinusoids (500mslong) with 20ms rise and fall timesrepeated eight times. Sinusoids were independently read out ofthe three channels of a 16bit digital-to-analog converter (DA,Tucker Davis Technologies, Alachua, FL, USA) at a 10kHzsampling rate. Each signal was low-pass filtered at 2kHz,controlled in amplitude by a TDT PA4 programmable attenuatorand amplified by a Techron power amplifier (Model 5507, AETechron Inc., Elkhart, IN, USA). The amplified signals werefurther attenuated by 32dB using a resistor network to improvesignal-to-noise ratio at the shaker inputs.
Three accelerometers (PCB model 002A10, Flexcel, Piezotronics,Depew, NY, USA; sensitivity: 1Vg–1 of acceleration) positionedon the vertical, side-to-side and front-to-back axes were used tocalibrate dish movement before and after the fish was positionedin the stimulus dish. The accelerometer output was monitored andused to make adjustments to the phases and amplitudes of the signalsto create sinusoidal, linear movements along defined axes in thehorizontal and vertical planes, at defined frequencies and intensitiesby use of a calibration program (Fay, 1984). Directional stimuliwere presented at 100Hz in six axes in the horizontal plane (90deg.,60deg., 30deg., 0deg., –30deg. and –60deg.) and six axes in themidsagittal plane (0deg., 30deg., 60deg., 90deg., 120deg. and150deg.). Once it was determined that most afferents innervatingthe saccule or lagena in A. fulvescens responded best to verticalstimulation at or near 90deg. elevation (M.M., unpublished data),all stimuli testing the frequency response were set at 90deg.vertical.
Test frequencies ranged between 50 and 1000Hz for the firststimulus protocol. Once it was determined that the upper frequencylimit of afferents did not exceed 700Hz, the frequency range wasreduced to 50–700Hz (50, 100, 141, 185, 244, 303, 409, 714). Thesefrequencies were chosen so that there was an integer number ofbins in the period histogram at each frequency, making vectorstrength calculations possible, and to capture a wide range offrequencies. For isolevel frequency response functions, thisfrequency–stimulus protocol was repeated for several stimulus levelswithin the unit’s dynamic range.
Recording and data acquisitionExtracellular recordings were made using 2moll–1 NaCl-filled glasspipettes with resistances between 20 and 50M. Tip resistanceswere achieved using a micropipette puller (P97, Sutter InstrumentCo., Novato, CA, USA). The micropipette was positioned on thenerve under visual control and then advanced through with a remotehydraulic micro-drive. The tip of the reference electrode (asilver–silver-chloride wire of 1mm diameter) was placed in the fluidof the brain cavity. Neural signals were amplified using a DAM 80amplifier (World Precision Instruments, Sarasota, FL, USA) andband pass filtered between 300 and 3000Hz. Spikes werediscriminated using a single voltage criterion which means that onethreshold criterion well above noise levels was used to create a TTLpulse for each action potential. Spike times were recorded with a0.1ms sampling period.
Data analysisData from frequency–responsive units were analyzed with respectto some or all of the following parameters: background rate,threshold, degree of phase locking, best frequency (BF, determinedfrom isolevel frequency response functions), characteristic frequency(CF, determined from tuning curves), bandwidth (Q10dB), response-level functions and temporal response pattern.
From the spike times recorded during stimulation, periodhistograms (PHs), peristimulus time histograms (PSTHs), and interspike interval histograms (ISIHs) were formed and the coefficientof synchronization (R) was calculated to measure the degreeof phase locking (Goldberg and Brown, 1969). To minimizemisinterpretations of R when having a smaller number of spikes(Ns), the Rayleigh statistic ZR2Ns was applied to quantify phaselocked responses (Batschelet, 1981; Fay, 1984).
Background activity was defined as spontaneous firing of spikesby units in the absence of an intentional stimulus and was measuredover eight repetitions of the stimulus interval with no stimuluspresent. Threshold was determined at 90° vertical (best directionfor most units) and at 100Hz (BF for most units) and defined asthe stimulus displacement level (dBre.1nm) which corresponds toZ20 (the probability of obtaining a Z-value of 20 or more by chanceis less than 0.001).
To quantify response strength, both spike rate and the computedZ-value were plotted initially. However, it was decided to focus onthe Z-value as a measure of response strength for the data presentedin this paper since most units showed background activity and 99%of the units were strongly phase locked (with R-values >0.5 at10–15dB above threshold).
To investigate coding strategies to sound intensity, response(Z)–intensity functions for which stimulus intensity was expressedas dBre.1nm displacement r.m.s. (root mean square) were plotted.Response–intensity functions were fitted with a sigmoidal curveand the maximum slope (which occurs at the midpoint of thefunction) was chosen for quantification. Tuning curves andcontour plots were created from isolevel frequency responsefunctions by linear interpolation between levels. To assess thesharpness of a frequency response, Q10dB (dividing the CF by thebandwidth at 10dB above threshold) was determined for V-shapedtuning curves (N36). We chose Q10dB since this measure ofbandwidth is widely used in the vertebrate literature (e.g. Kianget al., 1965).
To compare BF distributions of A. fulvescens with data obtainedin teleost species, afferents with certain BFs were added for eachspecies and expressed as a percentage of the total number of afferentstested. This cumulative percentage would then be plotted as afunction of BF resulting in one graph for each species (data pointswere connected for the purpose of clarity). Frequencies at whichmost afferents had their BF would show the steepest part of thefunction.
RESULTSSpatial orientation of otolith organs and innervation in
A. fulvescensWe present a description of the innervation and spatial orientationof otolith organs (Fig.1) to illustrate certain differences fromteleost species used for single unit studies from the eighth nervein previous studies. The saccule and lagena in A. fulvescens arelocated in one vertically oriented pouch whereas the utricle isoriented horizontally (Fig.1A). The eighth nerve exits the brainand branches off into two major rami. The anterior ramusinnervates the utricle and the anterior and horizontal cristae,
THE JOURNAL OF EXPERIMENTAL BIOLOGY

1570
whereas the posterior ramus innervates the saccule, lagena, maculaneglecta and the posterior crista (Fig.1B). The posterior ramusruns parallel to the saccule and lagena. At the level of the saccule,the ramus sends off many short branches, which innervate haircells of the saccule (Fig.1B). More posteriorly the ramus dividesinto two major branches closely attached to the pouch, one of theminnervating the posterior crista, the other innervating the lagenaand macula neglecta. Recordings were made from the part of theposterior ramus of the right ear located most proximal to the brain(Fig.1B). It was impossible to access any distal portions of thisramus for recordings without severely damaging the saccule andlagena because of its tight connection with the pouch containingthose epithelia.
A differentiation between afferents innervating either the sacculeor the lagena based on hair cell orientation and/or spatial locationof these epithelia was not possible since the hair cells on the sacculeand the lagena are oriented in various directions on each epithelium(Lovell et al., 2005) (Fig.1C) and both epithelia are oriented in themidsaggital plane of the fish. Thus, to estimate the proportion ofdata from afferents projecting to one or the other of these organsrequires verification through labeling studies. We attemptedextracellular injections with neurobiotin into the recording site inseveral animals but did not obtain enough data to make a statisticalcomparison. However, the injections showed at least one afferentinnervating the saccule and one innervating the lagena in twodifferent animals.
PhysiologyWe recorded and analyzed 170 sound-responsive single units from21 animals. All of these units responded to sound with an increasedspike rate and by phase-locking to the stimulus. About 90 additionalunits encountered did not respond to the stimulus (‘non-responding’units).
During recordings, the electrode was always positioned over thedorsal surface of the right posterior ramus. While advancing theelectrode from dorsal to ventral through the nerve branch, non-responding units were found more dorsally, whereas respondingunits were found more ventrally.
Background activity and thresholdsBackground rates of 159 responding units ranged from 0 to142spikess–1 with a mean of 23spikess–1. Most of these afferents(91%, 145/159) showed background activity. Three general patternsof background firing occurred: units with irregular intervals betweenspikes (44%), units that had regular spike trains with intervalsdistributed around a maximum peak (32%) and units showing abursting pattern of background activity with ISIHs having multiplepeaks (21%). Background rates available for 23 non-responding unitsranged between 9 and 44spikess–1 with a mean of 20spikess–1. Thefiring rate of most of those units did not exceed 22spikess–1 (82%,18/23).
Thresholds (determined for 65 units at their BF, which was100Hz) ranged from –23dB to 34dB (re.1nm) with a mean of9dB, corresponding to displacement values of 0.07nm(minimum), 2.8nm (mean) and 50nm (maximum). A correlationbetween threshold and spontaneous rate was significant whenconsidering the entire population of afferents shown (includingthe afferents firing at rates higher than 100spikess–1; r–0.25,N65, P0.05, two-tailed test). However, there was no correlationwhen the two afferents with high background rates wereexcluded from the data set (r–0.17, N63, P0.05, two-tailedtest; Fig.2).
Frequency characteristics: isolevel frequency responsefunctions and tuning curves
Units differed in their BF (or CF), in the sharpness of tuning andin the shape of the frequency function (Fig.3). For example, sometuning curves either had a symmetric V shape (e.g. ff11 and qq5,Fig.3) or had a slightly sharper cutoff towards lower frequenciesthan toward higher frequencies (unit ss11, Fig.3) or vice versa. Inmost units, BF or CF as well as the shape of the frequency functionstayed consistent across levels.
Some units (19%; 33/170 units) had a second or third peak intheir isolevel frequency response function (called a ‘multi-peakfunction’; unit tt7, Fig.3) in contrast to 81% (137/170) with onlyone peak (a ‘mono-peak function’; units ff11, qq5, ss11, Fig.3).These multi-peak units obtained from 12 different animals werealways found mixed together with the majority of afferents havingmono-peak response profiles. The response versus level functionfor unit tt7 (Fig.4A), as well as the PSTH (Fig.4B), ISIH (Fig.4C)and PH (Fig.4D) obtained at 100Hz resembled those of single unitrecordings from afferents with mono-peak functions. Thus, unit tt7was most probably a single-unit recording and the multiple peakswere not caused by a second afferent from a multi-unit recording.Plotting the isolevel frequency function of unit tt7 as spike rateversus frequency instead of Z-value versus frequency resulted insimilar multi-peaked profiles (not shown). Q10dB values computedfor 36 tuning curves from mono-peak units ranged between 0.6 and1.8 (1.06±0.42; mean ± s.d.; Fig.5).
Distribution of best frequencies and comparison withteleost species
The majority of afferents in A. fulvescens (59%; 81 out of 137afferents) had BFs at 100Hz, whereas 31% (43/137) had their BFat 141Hz (Fig.6). Best frequencies of only 10% (13/137) of theafferents exceeded 141Hz with one afferent having a BF at 303Hz(the maximum BF found). The BF distribution for saccular andlagenar afferents of A. fulvescens appears to be similar to the BFdistribution for the saccular afferents in Porichthys notatus [plainfinmidshipman, green line, Fig.7; modified from Weeg et al. (Weeg
M. Meyer, R. R. Fay and A. N. Popper
0 20 40 60 80 100 120–30
–20
–10
0
10
20
30
40
Background rate (spikes s–1)
Thr
esho
ld (
dB r
e. 1
nm
)
Fig. 2. Background rate versus threshold for 65 afferents evaluated. Therewas no correlation (r–0.17, N63, P0.05) between these two variableswhen the two afferents with spike rates higher than 100spikess–1 wereexcluded from the statistical evaluation. With the two units included, thecorrelation was significant (r–0.25, N65, P0.05).
THE JOURNAL OF EXPERIMENTAL BIOLOGY

1571Auditory coding in sturgeon
et al., 2002)] and utricular afferents in Dormitator latifrons [sleepergoby, blue line, Fig.7; modified from Lu et al. (Lu et al., 2004)]and less similar to lagenar afferents in Carassius auratus [goldfish,black line, Fig.7 (Meyer et al., 2004)] since most afferents had theirBF near 200Hz in the lagena of C. auratus. The BF distribution forutricular afferents is similar to data obtained for saccular and lagenarafferents in D. latifrons according to Lu et al. (Lu et al., 2004),however, the actual distribution values were only published forutricular afferents (Lu et al., 2004). In A. fulvescens no afferentswere found that showed a stronger response at 50Hz than atfrequencies between 100 and 150Hz.
Displacement, velocity and acceleration tuning curvesThe tuning curves (obtained at the stimulus level in dBre.1nmdisplacement) of several units with different shapes and CFs wereconverted into dBre.1nms–1 velocity and dBre.1nms–2
acceleration as shown in Fig.8. The outcome of this conversionwas that no matter which shape the tuning curve had whenconverted to acceleration, all units essentially became low-passfilters with corner frequencies that corresponded to the BF. The
sensitivity to frequencies higher than the corner frequencydecreased very rapidly. This is the expected result if the sacculeand/or lagena were acceleration-sensitive end organs because anacceleration-sensitive transducer generally has a constant responseto accelerations at frequencies below a critical frequency. The unitshown in Fig.8A (ss5) had its BF around 150Hz and shows asubstantially flat response towards frequencies smaller than 150Hzand steeply decreased at frequencies higher than BF when plottedas dBre1nms–2 acceleration. A similar change in shape wasobserved for unit tt3 (Fig.8B) which had its BF at 100Hz. Unitpp9 (Fig.8C) had a W-shaped tuning curve and the tuning curveprofile became less prominent when plotted as dBre.1nms–2
acceleration but did not disappear completely. For this unit therewas a slight increase in threshold seen at 50Hz compared to100Hz.
Level encodingResponse (Z) versus intensity functions obtained at 100Hz weresigmoid shaped with dynamic ranges extending from 9 to 24dB(re.1nm displacement) and slopes varying between 14 and 28 Z/dB.
0
100
200
300
400
500
600 10 dB15 dB20 dB25 dB30 dB
ff11
0
50
100
150
200
250
300 –5 dB0 dB5 dB10 dB
qq5
0
50
100
150
200
250
300 15 dB20 dB25 dB30 dB
ss11
Frequency (Hz)
Z-v
alue
Stim
ulus
leve
l (dB
re.
1 n
m r.
m.s
.)
Frequency (Hz)
100
200
300
400
10
15
20
25
30
50
100
150
200
–5
0
5
10
50
100
150
200
15
20
25
30
50
100
150
200
250
300
50 100 200 300 400 700–5
0
5
10
15
20
25
50 100 200 300 5007000
100
200
300
400 –5 dB0 dB5 dB10 dB15 dB25 dB30 dB
tt7
Z-value
Fig. 3. Frequency responses of four units. Theleft column represents isolevel frequencyresponses: Z-value is plotted as a function offrequency for different levels (see inset; x-axis:logarithmic scale; data points connected bystraight lines for clarity). The right column showscontour plots: stimulus level is plotted as afunction of frequency (x-axis: logarithmic scale).The black line in each contour plot outlines thetuning curve (criterion: Z20). The color code tothe right of each contour plot indicates Z-values.Frequency responses of afferents differed interms of BF (or CF), in the sharpness of tuningand the shape of the function. ff11:BF/CF141Hz, Q10dB0.57, backgroundrate15spikess–1. qq5: BF/CF100Hz,Q10dB1.3, background rate20spikess–1. ss1:BF/CF100Hz, Q10dB0.83, backgroundrate43spikess–1. tt7 had three peaks at 100,185 and 303Hz, Q10dB was not defined,background rate54 spikes s–1. Nineteen percentof units had a more complex response profilewith two or three peaks (e.g. unit tt7).
THE JOURNAL OF EXPERIMENTAL BIOLOGY

1572
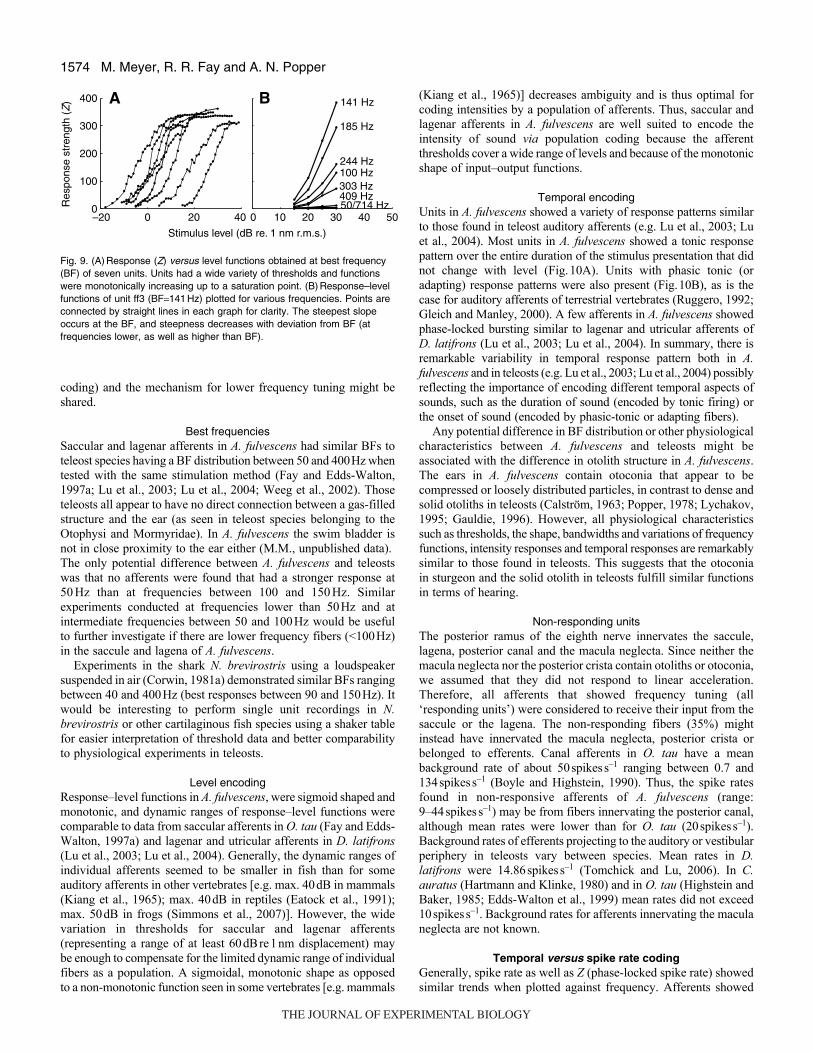
Functions differed widely in threshold (Fig.9A). When consideringthe variations of response–level functions of one unit with frequencyas shown in Fig.9B, it becomes apparent that the slope is steepestat BF and becomes flatter with increasing or decreasing frequenciesrelative to BF.
Temporal encoding and effect of level on firing patternHow units respond to stimulus duration is revealed by PSThistograms (PSTHs) and raster plots. We have plotted the rasterplot, inter spike interval distribution (ISIH) and the period histogram(PH) to 100Hz stimulation for 53 units (from 17 animals) toinvestigate the firing pattern over the course of stimulus presentationand to reveal the effect of stimulus level on the pattern and phaselocking. Three different response patterns were found (Fig.10). Mostunits (85%, 45/53) fired continuously and in a highly phase-locked
manner throughout the stimulus (‘tonic firing pattern’, Fig.10A, unituu8). Uu8 showed strong phase locking that increased at higherlevels and the phase angle decreased slightly with level.
Fifteen percent of the afferents (8/53) fired more spikes during theonset of the stimulus (‘phasic tonic response pattern’). This responsepattern remained consistent across levels (example shown in Fig.10B,unit pp7). The phasic component becomes proportionally strongerwith increasing stimulus intensity and this unit also showed strongphase-locking (see distinct peaks in its ISIH related to the period ofthe stimulus waveform and single peak in its PH).
Some units firing in a tonic or phasic manner showed bursting(15%, 8/53) that increased with level. These bursts were usuallydouble spikes occurring at a very short interval even at low levels(Fig.10C, unit ss10) near threshold. The PHs show two peaks athigher levels that become more and more distinct with increasing
M. Meyer, R. R. Fay and A. N. Popper
–20 –10 0 10 20 30 400
50
100
150
200
250
300
350
Stimulus level(dB re. 1 nm displacement, r.m.s.)
Res
pons
e st
reng
th (
Z-v
alue
)
0 90 180 270 360
0 20 40 60 80 100
Time (ms)
Time (ms)
Phase angle (deg.)
0 50 100 150 200 250 300 350 400 450 500A
D
B
C
Fig. 4. Response characteristics for unittt7. (A)Response versus level functionof unit tt7 obtained at 100Hz (datapoints connected by straight lines). Thefunction for this unit was similar toresponse–level curves obtained formono-peak functions. (B)Responsepattern shown in raster plot (top) andperi stimulus time histogram (middle; binsize: 1ms). The unit fired bursts in acontinuous fashion throughout stimuluspresentation (100Hz-stimulus shown inbottom trace). (C)Inter spike intervalhistogram (bin size: 1ms). (D)Periodhistogram (bin size: 5deg.). Allhistograms have been obtained at10dBre.1nm displacement and at100Hz.
0.4 0.6 0.8 1.0 1.2 1.4 1.6 1.8 2.00
2
4
6
8
10
12
Q10 dB
Num
ber
of a
ffere
nts
Fig. 5. Sharpness of frequency tuning for 36 afferents as determined fromtheir Q10dB values. Q10dB values were similar to those found for afferentswith low CFs (<400Hz) in other vertebrates.
100 150 200 250 3000
10
20
30
40
50
60
70
80
90
Best frequency (Hz)
Num
ber
of a
ffere
nts
Fig. 6. Distributions of best frequencies (BFs) of 137 mono-peak functionsin A. fulvescens. Test frequencies were 50, 100, 141, 185, 244, 303, 409and 714Hz. Best frequency was defined as the frequency that elicited thegreatest response at the lowest stimulus level presented. Most afferentsresponded best at 100Hz.
THE JOURNAL OF EXPERIMENTAL BIOLOGY

1573Auditory coding in sturgeon
level. Thus, both spikes were phase-locked and occurred at differentphase angles but they were not separated by 180deg.
DISCUSSIONThe unique aspect about A. fulvescens for studies of sensory codingis its cladistic position within the vertebrates and its early occurrencein the evolutionary history of vertebrates. In this study, wecharacterized basic auditory afferent response properties in a mannerdirectly comparable with previous studies in teleosts and othervertebrates.
Comparison to teleosts and other vertebratesBackground rates as well as physiological response characteristicssuch as threshold, frequency response, bandwidth, response tostimulus intensity and temporal response showed many similaritieswith data from teleosts and other vertebrates as discussed in thefollowing section.
Background rates and thresholdsSaccular and lagenar afferents in A. fulvescens showed highvariability in background firing (ranging from 0 to 150spikess–1)and in firing pattern, being either regular, irregular (most fibers) orbursting [as also seen in Gadus morhua, Atlantic cod (Horner etal., 1981); Ictalurus punctatus, channel catfish (Moeng and Popper,1984); C. auratus (Fay and Ream, 1986); O. tau (Fay and Edds-Walton, 1997a); P. notatus (McKibben and Bass, 1999); D. latifrons(Lu et al., 1998)]. Thresholds also varied widely with displacements,ranging between 0.07nm and 50nm, r.m.s., which is equivalent toresults found for saccular or lagenar afferents in C. auratus (Fay,1984; Fay and Ream, 1986; Meyer et al., 2004), O. tau (Fay andEdds-Walton, 1997a) and D. latifrons (Lu et al., 1998). Such a largerange of thresholds means that that sounds of widely different levelscan be encoded by the auditory periphery. The correlation betweenthreshold and spontaneous rate remains ambiguous, however. Unitswith very high background rates (larger than 100spikess–1) are rarerand were not recorded from damaged fibers, therefore they wereincluded in the dataset and not treated as outliers. However, moreafferents of this category are needed to determine if there is indeeda correlation between background rate and threshold.
Tuning and sharpnessShape and sharpness of tuning curves or isolevel frequency functionsamong afferents varied and were similar to those seen in teleoststhat resemble band pass filters. Although the tuning curves of mostunits were V-shaped (as is typical for auditory systems invertebrates), some units (19%) showed W-shaped tuning curves andisolevel frequency functions with more than one peak (max. threepeaks). Those complex profiles were also found in teleosts [e.g.saccular afferents of P. notatus (Weeg et al., 2002); medullar neuronsof O. tau (Edds-Walton and Fay, 2003); utricular afferents of D.latifrons (Lu et al., 2004)] stimulated with the shaker system andfor saccular afferents in P. notatus stimulated by a loud speaker(McKibben and Bass, 1999). Such complexity might arise fromcomplex interactions of peripheral tuning mechanisms such as ion-channel properties, hair cell resonances or micromechanics.
Q10dB values determined for 36 units (with V-shaped tuningcurves) in A. fulvescens resembled those values of afferents withlow CFs (<400Hz) of mammals, reptiles and birds and of afferentsinnervating the caudal auditory papillar regions or the basilar papillain frogs. This could mean that the existence of lower frequencytuning curves might have been conserved throughout the evolutionof vertebrates (possibly a more ancestral characteristic of auditory
0 50 100 150 200 250 300 350 400
0
10
20
30
40
50
60
70
80
90
100
A. fulvescens: saccule/lagenaC. auratus: lagena
P. notatus: saccule
D. latifrons: utricle
Best frequency (Hz)
Cum
ulat
ive
perc
enta
ge o
f affe
rent
s (%
)
Fig. 7. Comparison of best frequency (BF) distributions determined foreighth nerve afferents between A. fulvescens and teleost speciesstimulated using the shaker table. For each species, the cumulativepercentage of afferents was computed and plotted as a function of BF (y-axis shows the percentage of afferents having their BF up to and includingthe value shown on the x-axis). Red: saccular and lagenar afferents(combined) in A. fulvescens (N137); black: lagenar afferents in C. auratus(N67) (Meyer et al., 2004); green: saccular afferents in P. notatus (N64)(Weeg et al., 2002); blue: utricular afferents in D. latifrons (N70) (Lu et al.,2004). Data points are joined through straight lines for clarity.
0.4�10–8
0.8�10–8
0
0.5�10–5
1.0�10–5
50 100 200 4000
0.1
0.2
Dis
plac
emen
t(m
)V
eloc
ity(m
s–1
)A
ccel
erat
ion
(m s
–2)
A ss5
50 100 200 4000
0.05
0.1
0
1.0�10–8
0.5�10–8
0
4.0�10–5
2.0�10–5
C pp9
Frequency (Hz)
1.04
1.02
4.0�10–5
2.0�10–5
4.0�10–8
2.0�10–8
B tt3
00
0
50 100 200 4000
Fig. 8. Tuning curves of units ss5 (A), tt3 (B)and pp9 (C) plotted as dBre.1nmdisplacement (top), dBre.1nms–1 velocity(middle) and as dBre.1nms–2 acceleration(bottom) versus frequency (x-axis:logarithmic scale). Data points are connectedby straight lines in each graph. All unitsessentially became low-pass filters whenexpressed in terms of acceleration. This isthe expected result if the saccule and/orlagena were acceleration-sensitive endorgans. Unit pp9 differed slightly from theexpected pattern, showing a slight increasein threshold at 50Hz compared with 100Hz.
THE JOURNAL OF EXPERIMENTAL BIOLOGY
1574
coding) and the mechanism for lower frequency tuning might beshared.
Best frequenciesSaccular and lagenar afferents in A. fulvescens had similar BFs toteleost species having a BF distribution between 50 and 400Hz whentested with the same stimulation method (Fay and Edds-Walton,1997a; Lu et al., 2003; Lu et al., 2004; Weeg et al., 2002). Thoseteleosts all appear to have no direct connection between a gas-filledstructure and the ear (as seen in teleost species belonging to theOtophysi and Mormyridae). In A. fulvescens the swim bladder isnot in close proximity to the ear either (M.M., unpublished data).The only potential difference between A. fulvescens and teleostswas that no afferents were found that had a stronger response at50Hz than at frequencies between 100 and 150Hz. Similarexperiments conducted at frequencies lower than 50Hz and atintermediate frequencies between 50 and 100Hz would be usefulto further investigate if there are lower frequency fibers (<100Hz)in the saccule and lagena of A. fulvescens.
Experiments in the shark N. brevirostris using a loudspeakersuspended in air (Corwin, 1981a) demonstrated similar BFs rangingbetween 40 and 400Hz (best responses between 90 and 150Hz). Itwould be interesting to perform single unit recordings in N.brevirostris or other cartilaginous fish species using a shaker tablefor easier interpretation of threshold data and better comparabilityto physiological experiments in teleosts.
Level encodingResponse–level functions in A. fulvescens, were sigmoid shaped andmonotonic, and dynamic ranges of response–level functions werecomparable to data from saccular afferents in O. tau (Fay and Edds-Walton, 1997a) and lagenar and utricular afferents in D. latifrons(Lu et al., 2003; Lu et al., 2004). Generally, the dynamic ranges ofindividual afferents seemed to be smaller in fish than for someauditory afferents in other vertebrates [e.g. max. 40dB in mammals(Kiang et al., 1965); max. 40dB in reptiles (Eatock et al., 1991);max. 50dB in frogs (Simmons et al., 2007)]. However, the widevariation in thresholds for saccular and lagenar afferents(representing a range of at least 60dBre1nm displacement) maybe enough to compensate for the limited dynamic range of individualfibers as a population. A sigmoidal, monotonic shape as opposedto a non-monotonic function seen in some vertebrates [e.g. mammals
(Kiang et al., 1965)] decreases ambiguity and is thus optimal forcoding intensities by a population of afferents. Thus, saccular andlagenar afferents in A. fulvescens are well suited to encode theintensity of sound via population coding because the afferentthresholds cover a wide range of levels and because of the monotonicshape of input–output functions.
Temporal encodingUnits in A. fulvescens showed a variety of response patterns similarto those found in teleost auditory afferents (e.g. Lu et al., 2003; Luet al., 2004). Most units in A. fulvescens showed a tonic responsepattern over the entire duration of the stimulus presentation that didnot change with level (Fig.10A). Units with phasic tonic (oradapting) response patterns were also present (Fig.10B), as is thecase for auditory afferents of terrestrial vertebrates (Ruggero, 1992;Gleich and Manley, 2000). A few afferents in A. fulvescens showedphase-locked bursting similar to lagenar and utricular afferents ofD. latifrons (Lu et al., 2003; Lu et al., 2004). In summary, there isremarkable variability in temporal response pattern both in A.fulvescens and in teleosts (e.g. Lu et al., 2003; Lu et al., 2004) possiblyreflecting the importance of encoding different temporal aspects ofsounds, such as the duration of sound (encoded by tonic firing) orthe onset of sound (encoded by phasic-tonic or adapting fibers).
Any potential difference in BF distribution or other physiologicalcharacteristics between A. fulvescens and teleosts might beassociated with the difference in otolith structure in A. fulvescens.The ears in A. fulvescens contain otoconia that appear to becompressed or loosely distributed particles, in contrast to dense andsolid otoliths in teleosts (Calström, 1963; Popper, 1978; Lychakov,1995; Gauldie, 1996). However, all physiological characteristicssuch as thresholds, the shape, bandwidths and variations of frequencyfunctions, intensity responses and temporal responses are remarkablysimilar to those found in teleosts. This suggests that the otoconiain sturgeon and the solid otolith in teleosts fulfill similar functionsin terms of hearing.
Non-responding unitsThe posterior ramus of the eighth nerve innervates the saccule,lagena, posterior canal and the macula neglecta. Since neither themacula neglecta nor the posterior crista contain otoliths or otoconia,we assumed that they did not respond to linear acceleration.Therefore, all afferents that showed frequency tuning (all‘responding units’) were considered to receive their input from thesaccule or the lagena. The non-responding fibers (35%) mightinstead have innervated the macula neglecta, posterior crista orbelonged to efferents. Canal afferents in O. tau have a meanbackground rate of about 50spikess–1 ranging between 0.7 and134spikess–1 (Boyle and Highstein, 1990). Thus, the spike ratesfound in non-responsive afferents of A. fulvescens (range:9–44spikess–1) may be from fibers innervating the posterior canal,although mean rates were lower than for O. tau (20spikess–1).Background rates of efferents projecting to the auditory or vestibularperiphery in teleosts vary between species. Mean rates in D.latifrons were 14.86spikess–1 (Tomchick and Lu, 2006). In C.auratus (Hartmann and Klinke, 1980) and in O. tau (Highstein andBaker, 1985; Edds-Walton et al., 1999) mean rates did not exceed10spikess–1. Background rates for afferents innervating the maculaneglecta are not known.
Temporal versus spike rate codingGenerally, spike rate as well as Z (phase-locked spike rate) showedsimilar trends when plotted against frequency. Afferents showed
M. Meyer, R. R. Fay and A. N. Popper
–20 0 20 400
100
200
300
400
0 10 20 30 40 5050/714 Hz
100 Hz
141 Hz
185 Hz
244 Hz
303 Hz409 Hz
Stimulus level (dB re. 1 nm r.m.s.)
Res
pons
e st
reng
th (
Z) A B
Fig. 9. (A)Response (Z) versus level functions obtained at best frequency(BF) of seven units. Units had a wide variety of thresholds and functionswere monotonically increasing up to a saturation point. (B)Response–levelfunctions of unit ff3 (BF141Hz) plotted for various frequencies. Points areconnected by straight lines in each graph for clarity. The steepest slopeoccurs at the BF, and steepness decreases with deviation from BF (atfrequencies lower, as well as higher than BF).
THE JOURNAL OF EXPERIMENTAL BIOLOGY

1575Auditory coding in sturgeon
robust phase-locking within the physiological frequency detectionrange in A. fulvescens. Such a code based on timing between spikes(temporal code) has been found to be sufficient to encode forbehaviorally relevant frequencies as well as the temporal finestructure of sound stimuli in modern teleost fish (Fay and Coombs,1983; Fay, 1978b). Moreover, a temporal code has been found inall vertebrates for acoustic waveforms and can now be confirmedfor the most ancestral bony fish species studied so far. Thus, temporalencoding may represent the most ancestral neural code for hearing,although experiments in other ancestral bony fish as well ascartilaginous fish species are needed to confirm this hypothesis.
In addition to a temporal code there may also be a rate code sinceprimary auditory afferents in A. fulvescens and teleosts are frequencytuned, based on spike rate. The mechanisms underlying suchfrequency tuning as well as the differences in filter-shape andbandwidth seen in primary otolithic afferents in fish are not wellunderstood. However, they may arise from hair cell resonance
(Sugihara and Furukawa, 1989; Steinacker and Romero, 1992) andmicromechanical mechanisms between hair cells and theirattachment to the otolithic membrane (Fay, 1997). Evidence for aplace-frequency code in fish is unclear since only very few studieshave suggested that response characteristics of different saccular orlagenar regions might vary (Furukawa and Ishii, 1967; Sand andMichelsen, 1978; Enger, 1981; Fay, 1997). Yet, even without a placecode, the diversity in shape, bandwidth and sensitivity of filters inA. fulvescens and teleosts may be sufficient to encode intensity andfrequency information. A given sound would create a specificsignature or pattern across a population of afferents (populationcode) which could then be decoded centrally. The activation of onlya few afferents differing in CF and bandwidth may be enough toencode a particular frequency by central neurons, for example thedominant frequency of vocalizations. In summary, both a temporalcode as well as a spike rate code may be relevant for A. fulvescensand teleost species.
48
48
48
48
A 5
15
50
120
100
350
10
B 10 10
48
30 20
48
48
48
25 25
60 25
C48
48
48
48
15 10
120 20
250 50
400 120
0 90 180 270 360Phase angle (deg.)100 200 300 400 5000
Time (ms)
Stim
ulus
tria
ls
Spi
kes
per
bin
19 dB
24 dB
29 dB
39 dB
14 dB
24 dB
28 dB
31 dB
7 dB
16 dB
26 dB
35 dB
Time (ms)
5 Fig. 10. Response patterns of saccularand lagenar afferents in A. fulvescens tosinusoidal stimulation [obtained at bestfrequency (BF)100Hz]. Left to right:raster plots, inter spike intervalhistograms (bin size: 1ms) and periodhistograms (bin size: 5deg.). Each graphis presented at four different stimuluslevels to illustrate the effect of level onthe response pattern for each unit.(A)Tonic response pattern (backgroundrate: 0spikess–1; threshold:18dBre.1nm). (B)Phasic tonic responsepattern (background rate: 23spikess–1;threshold: 13dBre.1nm). (C)Phaselocked bursting (background rate:43spikess–1; threshold: 6dBre.1nm).
THE JOURNAL OF EXPERIMENTAL BIOLOGY
1576
Displacement, velocity and acceleration tuning curvesWhen the tuning curves were plotted using acceleration rather thandisplacement as the stimulus parameter they appeared nearly flatat the lower frequencies. The corner frequency (corresponding toBF or CF) marks the frequency range up to which the fiber is mostsensitive to stimulus acceleration. This tuning curve shape isconsistent with the idea that the otolith organ is a damped simpleharmonic oscillator driven by an external input, and the output ofthe organ is proportional to the acceleration of the otolith. At lowfrequencies, the output displacement depends only on themagnitude (A) of acceleration, thus the system acts like a pureaccelerometer (stiffness controlled). At intermediate frequencies,the output displacement is proportional to A/ (where is theinput frequency), thus the system acts like a velocity detector (sincethis corresponds to the process of integration going fromacceleration to velocity). The system at this point is predominantlycontrolled by viscous drag (acting against the moving mass). Athigher frequencies the output displacement instead is proportionalto A/2 (corresponding to the process of integration going fromacceleration to displacement), thus the system becomes adisplacement detector (mainly controlled by the inertia of theoverlying mass).
The examples shown for A. fulvescens (Fig.8) wererepresentative of all tuning curves obtained from afferentresponses. From these observations one may conclude that otolithorgans in fish, including those carrying otoconia instead of otoliths(such as the saccule and lagena in A. fulvescens), principally actas accelerometers. The conversion to velocity or displacementtuning curves results in a V-shaped function with a ‘best’ frequencyequal to the corner frequency (frequency at which the thresholdbegins to rise) of the acceleration tuning curves. Given velocityor displacement tuning curves, one is faced with the task ofexplaining the ‘best’ frequency and ‘frequency tuning’, whereaswith acceleration tuning curves, the critical feature is only thecorner frequency (bandwidth), or the frequency above whichsensitivity begins to decline. Thus, units of acceleration seem toresult in a simpler description of transducer behavior than eithervelocity or displacement. In this study, displacement manipulationwas chosen simply because displacement units are more intuitiveand understandable than either velocity or acceleration.
The conversion to acceleration tuning curves can reveal inaddition, whether there may be mechanisms differing fromaccelerometers (such as velocity or displacement detectionmechanisms). If such differences (e.g. pp9, Fig.8C) occurred, onecould then sample at finer frequencies and combine physiologicalstudies with single unit labeling studies to correlate shape andcorner frequency of acceleration tuning curves with different areason the epithelium (e.g. areas having varying densities of otoconia)to reveal differences in micromechanics. In any case, a similarinvestigation at a finer frequency resolution and including lowerfrequencies (down to infrasound) might be useful for furtherinvestigations.
The role of the saccule and the lagena in hearingThe saccule and lagena in A. fulvescens are likely to be involvedin hearing since tuning curves appeared more like band pass filters(when plotted with respect to displacement) and all physiologicalcharacteristics showed strong resemblance to data on the saccule inteleost fishes (Fay, 1984; Fay and Edds-Walton, 1997a; Fay andEdds-Walton, 1997b; Weeg et al., 2002; Buchser et al., 2003), whichis considered to be involved in hearing. Possibly, otolith organs infishes have a dual function, both vestibular (responding to
gravitational stimuli and linear acceleration caused by self-inducedmotion) and auditory [linear acceleration caused by movement ofthe fish in the sound field (Platt, 1989) (reviewed by Popper et al.,2003)]. Generally, there was no dichotomy in the data for A.fulvescens that would suggest a functional separation between thesaccule and lagena. Although the best frequencies did not vary muchbetween otolith organs in D. latifrons (the only species for whichfrequency data of all three otolith organs are known), it may stillbe useful to measure the response properties of utricular afferentsin A. fulvescens to investigate the potential role of the utricle forauditory (and vestibular) function.
Evolutionary considerationsThis is the first study of the response properties of primary auditoryafferents in a non-teleost bony fish that focuses on a detailedphysiological analysis of frequency and intensity coding. Recordingsfrom primary afferents innervating the saccule and lagena in A.fulvescens showed many similarities to the findings described for theauditory (or vestibular) periphery in teleost fishes and to auditorysystems in other vertebrates as discussed above. The similarities toteleosts are interesting considering that A. fulvescens belongs to agroup of fishes that had their major radiation approximately 250million years ago. The similarities to other vertebrates (and teleosts)is also interesting when assuming, as a first approximation, that thecoding strategies found in A. fulvescens may represent the ancestralcondition for all vertebrates, at least as far back as the origin of thebony fishes. However, more species of the group of non-teleost bonyfish are necessary to make a full assessment of ancestral versus moremodern coding strategies (within the group of bony fishes), since A.fulvescens may have developed modern characteristics during its ownevolutionary history.
Ultimately it is necessary to compare results from ancestral bonyfish with those of members of the outgroup of bony fish, thecartilaginous fishes. There are similarities in terms of BF distributionbetween sharks (based on one single unit study by Corwin, 1981a)and A. fulvescens supporting that the data in sturgeon may reflectthe ancestral condition in vertebrates (not just of bony fish), yetmore detailed studies in cartilaginous fishes using the samestimulation method would be helpful to further evaluate thishypothesis.
In general, it seems likely that similarities between vertebratesoccurred because the auditory system in vertebrates derived from acommon ancestor. The assumption is based on the notion that certainauditory and vestibular structures are considered homologous, suchas the vertebrate hair cell (Coffin et al., 2004) and that the grossmorphology of the inner ears is very similar among vertebrates. Theearliest vertebrates for which a sensitivity to sound of the inner earwas found were elasmobranches (Löwenstein and Roberts, 1950;Myrberg et al., 1972; Nelson and Johnson, 1976; Corwin, 1981a;Corwin, 1981b), thus it seems plausible that elasmobranches havesimilar coding strategies to ancestral bony fish and teleosts. Asensitivity to sound in Agnatha still remains to be investigated.
LIST OF ABBREVIATIONSBF best frequencyCF characteristic frequencyISIH interspike interval histogramPH period histogramPSTH peristimulus time histogram
ACKNOWLEDGEMENTSThis research was supported in part by the NIH (NIDCD) R01 research grant R01DC006215 to R. R. Fay and the Parmly Hearing Institute of Loyola University
M. Meyer, R. R. Fay and A. N. Popper
THE JOURNAL OF EXPERIMENTAL BIOLOGY

1577Auditory coding in sturgeon
Chicago and by a P30 grant (P30 DC004664) to the Center of Comparative andEvolutionary Biology of Hearing of the University of Maryland. We thank theParmly Hearing Institute for providing a Parmly Hearing Scholar fellowship to M.M. during a three months stay in Chicago. Lake sturgeons were kindly supplied bythe Wisconsin Department of Natural Resources. Many thanks to Kaushik Ghosefor help with Matlab and to Ruth Anne Eatock for comments on the manuscript.Finally we would like to thank the two anonymous reviewers for their suggestions.Deposited in PMC for release after 12 months.
REFERENCESBanner, A. (1967). Evidence of sensitivity to acoustic displacements in the lemon
shark, Negaprion brevirostris (Poey). In Lateral Line Detectors (ed. P. H. Cahn), pp.265-273. Bloomington: Indiana University Press.
Batschelet, E. (1981). Circular Statistics in Biology. New York: Academic Press.Bemis, W. E. and Kynard, B. (1997). Sturgeon rivers: an introduction to
acipenseriform biogeography and life history. Environ. Biol. of Fishes 48, 167-183.Bolker, J. (2004). Embryology. In Sturgeon and Paddlefish of North America (ed. G. T.
O. Le Breton, F. W. H. Beamish and R. S. McKinley), pp. 134-144. New York:Springer-Verlag.
Boyle, R. and Highstein, S. M. (1990). Efferent vestibular system in the toadfish:action upon horizontal semicircular canal afferents. J. Neurosci 10, 1570-1582.
Bregman, A. (1990). Auditory Scene Analysis: The Perceptual Organization of Sound.Cambridge, MA: MIT Press.
Bruch, R. and Binkowski, F. P. (2002). Spawning behavior of lake sturgeon(Acipenser fulvescens). J. Appl. Ichthyol. 18. 570-579.
Buchser, W. J., Lu, Z., Xu, Z. and Evoy, W. H. (2003). Frequency response ofsaccular afferents in a teleost fish. Soc. Neurosci. Abstr. 93, 7.
Carlström, D. (1963). A crystallographic study of vertebrate otoliths. Biol. Bull. 125,441-463.
Casper, B. M. and Mann, D. A. (2007). Dipole hearing measurements inelasmobranch fishes. J. Exp. Biol. 210, 75-81.
Casper, B. M., Lobel, P. S. and Yan, H. Y. (2003). The hearing sensitivity of the littleskate, Raja erinacea: comparison of two methods. Environ. Biol. Fishes 68, 371-379.
Coffin, A. B., Kelley, M., Manley, G. and Popper, A. N. (2004). Evolution of sensoryhair cells. In Evolution of the Vertebrate Auditory System (ed. R. A. Eatock, A. N.Popper and R. R. Fay), pp. 27-54. New York: Springer-Verlag.
Corwin, J. T. (1981a). Peripheral auditory physiology in the lemon shark: evidenceof parallel otolithic and non-otolithic sound detection. J. Comp. Physiol. 142, 379-390.
Corwin, J. T. (1981b). Audition in elasmobranchs. In Hearing and SoundCommunication in Fishes (ed. W. N. Tavolga, A. N. Popper and R. R. Fay), pp. 81-102. New York: Springer Verlag.
Corwin, J. T. (1989). Functional anatomy of the auditory system in sharks and rays. J.Exp. Zool. 2, 62-74.
de Vries, H. L. (1950). The mechanics of the labyrinth otoliths. Acta Oto-Laryngol. 38,262-273.
Eatock, R. A., Weiss, T. F. and Otto, K. L. (1991). Dependence of discharge rates onsound pressure level in cochlear nerve fibers of the alligator lizard: implications forcochlear mechanisms. J. Neurophys. 65, 1580-1597.
Edds-Walton, P. L. and Fay, R. R. (2003). Directional selectivity and frequency tuningof midbrain cells in the oyster toadfish (Opsanus tau). J. Comp. Physiol. 189, 527-543.
Edds-Walton, P. L., Fay, R. R. and Highstein, S. M. (1999). Dendritic arbors andcentral projections of physiologically characterized auditory fibers from the saccule ofthe toadfish (Opsanus tau). J. Comp. Neurol. 411, 212-238.
Enger, P. S. (1981). Frequency discrimination in teleosts – central or peripheral? InHearing and Sound Communication in Fishes (ed. W. N. Tavolga, A. N. Popper andR. R. Fay), pp. 243-255. New York: Springer Verlag.
Fay, R. R. (1978a). Coding of information in single auditory nerve fibers of the goldfish.J. Acoust. Soc. Am. 63, 136-146.
Fay, R. R. (1978b). Phase-locking in goldfish saccular nerve fibers accounts forfrequency discrimination capacities. Nature 275, 320-322.
Fay, R. R. (1984). The goldfish ear codes the axis of particle motion in threedimensions. Science 225, 951-953.
Fay, R. R. (1997). Frequency selectivity of saccular afferents of the goldfish revealedby revcor analysis. In Diversity in Auditory Mechanics (ed. E. R. Lewis, G. R. R.Long, R. F. Lyon, P. M Narins, C. R. Steele and E. Hecht-Poinar), pp. 69-75.Singapore: World Scientific Publishers.
Fay, R. R. (1998). Auditory stream segregation in goldfish (Carassius auratus). Hear.Res. 120, 69-76.
Fay, R. R. (2000). Spectral contrasts underlying auditory stream segregation ingoldfish (Carassius auratus). J. Assn. Res. Otolaryngol. 1, 120-128.
Fay, R. R. and Coombs, S. (1983). Neural mechanisms in sound detection andtemporal summation. Hear. Res. 10, 69-92.
Fay, R. R. and Edds-Walton, P. L. (1997a). Directional response properties ofsaccular afferents of the toadfish (Opsanus tau). Hear. Res. 111, 1-21.
Fay, R. R. and Edds-Walton, P. L. (1997b). Diversity in frequency responseproperties of saccular afferents of the toadfish (Opsanus tau). Hear. Res. 113, 235-246.
Fay, R. R. and Popper, A. N. (2000). Evolution of hearing in vertebrates: the innerears and processing. Hear. Res. 149, 1-10.
Fay, R. R. and Ream, T. J. (1986). Acoustic response and tuning in saccularnerve fibers of the goldfish (Carassius auratus). J. Acoust. Soc. Am. 79, 1883-1895.
Furukawa, T. and Ishii, Y. (1967). Neurophysiological studies on hearing in goldfish.J. Neurophysiol. 30, 1377-1403.
Gauldie, R. W. (1996). Fusion of otoconia: a stage in the development of the otolith inthe evolution of fishes. Acta. Zool. 77, 1-23.
Gleich, O. and Manley, G. (2000). The hearing organ of birds and Crocodilia. InComparative Hearing: Birds and Reptiles (ed. R. J. Dooling, A. N. Popper and R. R.Fay), pp. 70-138. New York: Springer Verlag.
Goldberg, J. M. and Brown, P. B. (1969). Response of binaural neurons of dogsuperior olivary complex to dichotic tonal stimuli: some physiological mechanisms ofsound localization. J. Neurophysiol. 32, 613-636.
Grande, L. and Bemis, W. E. (1996). Interrelationships of Acipenseriformes, withcomments on Chondrostei. In Interrelationships of Fishes (ed. M. L. J. Stianssny, L.R. Parenti and G. D. Johnson), pp. 85-115. San Diego: Academic Press.
Hartmann, R. and Klinke, R. (1980). Efferent activity in the goldfish vestibular nerveand its influence on afferent activity. Pflueger’s Arch. 38, 123-128.
Hawkins, A. D. (1993). Underwater sound and fish behavior. In Behavior of TeleostFishes (ed. T. J. Pitcher), pp. 129-169. New York: Chapmann and Hall.
Herald, E. S. (1961). Living Fishes of the World. Garden City, New York: Doubledayand Company Inc.
Highstein, S. M. and Baker, R. (1985). Action of the efferent vestibular system onprimary afferents in the toadfish, Opsanus tau. J. Neurophys. 54, 370-384.
Horner, K., Hawkins, A. D. and Fraser, P. J. (1981). Frequency characteristics ofprimary auditory neurons from the ear of the cod (Gadus morhua). In Hearing andSound Communication in Fishes (ed. W. N. Tavolga, A. N. Popper and R. R. Fay),pp. 223-241. New York: Springer-Verlag.
Kelly, J. C. and Nelson, D. R. (1967). Hearing thresholds in the horn shark,Heterodontus francisci. J. Acoust. Soc. Amer. 58, 905-909.
Kenyon, T. N., Ladich, F. and Yan, H. Y. (1998). A comparative study of hearingability in fishes: the auditory brainstem response approach. J. Comp. Physiol. A 182,307-318.
Kiang, N. Y. S., Watanabe, T., Thomas, C. and Clark, L. F. (1965). DischargePatterns of Single Fibers in the Cat’s Auditory Nerve. Cambridge, MA: MIT Press.
Lewis, E. R. and Fay, R. R. (2004). Environmental variables and the fundamentalnature of hearing. In Evolution of the Vertebrate Auditory System (ed. G. A. Manley,A. N. Popper and R. R. Fay), pp. 27-54. New York: Springer-Verlag.
Liem, K. F., Bemis, W. E., Walker, W. F., Jr, and Grande, L. (2001). FunctionalAnatomy of the Vertebrates. An Evolutionary Perspective, 3rd edn. Orlando:Harcourt College Publishers.
Lovell, J. M., Findlay, M. M., Moate, R. M., Nedwell, J. R. and Pegg, M. A. (2005).The inner ear morphology and hearing abilities of the paddlefish (Polyodon spathula)and the lake sturgeon (Acipenser fulvescens). Comp. Biochem. Physiol. A 142, 286-296.
Löwenstein, O. and Roberts, T. D. M. (1950). The equilibrium function of the otolithorgans of the thornback ray (Raja clavatra). J. Physiol. 110, 392-415.
Lu, Z. and Popper, A. N. (1998). Morphological polarizations of sensory hair cells inthe three otolith organs of a teleost fish: fluorescent labeling of ciliary bundles. Hear.Res. 12, 47-57.
Lu, Z., Xu, Z. and Buchser, W. J. (2003). Acoustic response properties of lagenarnerve fibers in the sleeper goby (Dormitator latifrons). J. Comp. Physiol. A 189, 889-905.
Lu, Z., Xu, Z. and Buchser, W. J. (2004). Coding of acoustic particle motion byutricular fibers in the sleeper goby (Dormitator latifrons). J. Comp. Physiol. A 190,923-938.
Lychakov, D. V. (1995). Investigation of the otolithic apparatus in the Acipenser fry. J.Evol. Biochem. Phys. 31, 333-341.
McKibben, J. R. and Bass, A. H. (1999). Peripheral encoding of behaviorallyrelevant acoustic signals in a vocal fish: single tones. J. Comp. Physiol. 184, 563-576.
Meyer, M., Popper, A. N. and Fay, R. R. (2004). Frequency tuning and directionalpreferences in lagenar nerve fibers of the goldfish (Carassius auratus). Abst. Assn.Res. Otolaryngol. 27, 325.
Moeng, R. and Popper, A. N. (1984). Auditory responses of saccular neurons of thecatfish (Ictalurus punctatus). J. Comp. Physiol. 155, 615-624.
Myrberg, A. A., Jr, Ha, S. J., Walewski, S. and Banbury, J. C. (1972). Effectivenessof acoustic signals in attracting epipelagic sharks to an underwater sound source.Bull. Mar. Sci. 22, 926-949.
Nelson, J. S. (2006). Fishes of the World. New York: John Wiley.Nelson, J. S. and Johnson, R. H. (1976). Some recent observations on acoustic
attraction of Pacific reef sharks. In Sound Reception in Fishes (ed. A. Schuijf and A.D. Hawkins), pp. 229-239. Amsterdam: Elsevier.
Northcutt, R. G. (1985). The brain and sense organs of the earliest vertebrates:reconstruction of a morphotype. In Evolutionary Biology of Primitive Fishes (ed. E. R.Foreman, A. Gorbman, J. M. Dodd and R. Olsson), pp. 81-112. New York: PlenumPress.
Northcutt, R. G. (1986). Strategies of comparison: how do we study brain evolution?Verh. dt. zool. Ges. 79, 91-103.
Platt, C., Popper, A. N. and Fay, R. R. (1989). The ear as part of the octavolateralissystem. In The Mechanosensory Lateral Line: Neurobiology and Evolution (ed. S.Coombs, P. Görner and M. Münz), pp. 633-651. Berlin: Springer-Verlag.
Popper, A. N. (1978). Scanning electron microscopic study of the otolithic organs inthe bichir (Polypterus bichir) and shovel-nose sturgeon (Scaphirhynchusplatorynchus). J. Comp. Neurol. 18, 117-128.
Popper, A. N., Fay, R. R., Platt, C. and Sand, O. (2003). Sound detectionmechanisms and capabilities of teleost fishes. In Sensory Processing of the AquaticEnvironment (ed. S. P. Collin and J. P. Marshall), pp. 3-23, New York: SpringerVerlag.
Rafinesque, C. S. (1817). Addition to the observations on the sturgeons of NorthAmerica. Amer. Mo. Mag. 1, 288.
Retzius, G. (1881). Das Gehörorgan der Wirbeltiere, Vol. 1. Stockholm: Samson andWallin.
THE JOURNAL OF EXPERIMENTAL BIOLOGY

1578
Ruggero, M. (1992). Physiology and coding of sound in the auditory nerve. In TheMammalian Auditory Pathway: Neurophysiology (ed. A. N. Popper and R. R. Fay),pp. 34-93. New York: Springer-Verlag.
Sand, O. and Michelsen, A. (1978). Vibration measurements of the perch saccularotolith. J. Comp. Physiol. A 123, 85-89.
Simmons, D. D., Meenderink, W. F. and Vassilakis, P. N. (2007). Anatomy,physiology and function of auditory end organs in the frog inner ear. In Hearing andSound Communication in Amphibians (ed. P. M. Narins, A. S. Feng, A. N. Popperand R. R. Fay), pp. 184-220. New York: Springer-Verlag.
Steinacker, A. and Romero, A. (1992). Voltage-gated potassium current resonance inthe toadfish saccular hair cell. Brain Res. 574, 229-236.
Sugihara, I. and Furukawa, T. (1989). Morphological and functional aspects of twodifferent types of hair cells in the goldfish sacculus. J. Neurophysiol. 62, 1330-1343.
Tomchick, S. and Lu, Z. (2006). Auditory physiology and anatomyof octavolateral efferent neurons in a teleost fish. J. Comp. Physiol. 192, 51-67.
Weeg, M. S., Fay, R. R. and Bass, A. H. (2002). Directional response and frequencytuning in saccular nerve fibers of a vocal fish, Porychthus notatus. J. Comp. Physiol.A 188, 631-641.
Wiley, E. O. (1981). Phyologenetics – The Theory and Practice of PhylogeneticSystematics. New York: John Wiley and Sons.
M. Meyer, R. R. Fay and A. N. Popper
THE JOURNAL OF EXPERIMENTAL BIOLOGY