Embed Size (px)
Citation preview

Nilanjana Bhadra
St. Lawrence High School
A JESUIT CHRISTIAN MINORITY INSTITUTION
Sub: Arithmetic Class: 7 Date: 08.05.20
STUDY MATERIAL: FREQUENCY DISTRIBUTION AND MEAN
Important Formulae and Concepts
Frequency Distribution: Introduction
To understand frequency distribution, let us first start with a simple example. We consider the marks obtained by ten students from a class in a test to be given as follows:
23, 26, 11, 18, 09, 21, 23, 30, 22, 11
This form of data is known as raw data. A statistical measure called range can be defined. It is the
difference between the largest and smallest values of a data set. Here, range = 30 – 09 = 21.
Frequency Distribution Table
Now, imagine how difficult and cumbersome this process would get if there were a larger number of
observations. If we were to include the test scores of all 20 students in this class, it would be very difficult to understand and interpret such data unless it is ‘organized’.
The objective of statistical interpretation is to organize data into a concise form so that interpretation and
analysis become easy. It is for this reason that we organize larger data into a table called the frequency
distribution table.
Tally Marks and Frequency Distribution
As the name suggests tally marks shows the number of times an object or data is repeating. The
organisation of this data in a tabular form is the frequency distribution table. We have used the term ‘data’. What is data? Let us know some of the commonly used terms.
Terminologies
Data: Data is a collection of numbers. They are gathered and organised to give some information.
Data put in their original form as they are collected are raw data.
Observation: Each of the value in the raw data is an observation.
Types of Data

Nilanjana Bhadra
Data are collected on the basis of requirement or the needed information. Data are mainly of two types – primary and secondary data.
Primary Data: The data collected directly from the source is primary data. Suppose when you
need to collect data for the favourite game of your classmates. You ask them directly. This is the primary data.
Secondary Data: The collection of data indirectly or from some external source is the secondary
data. These sources can be newspapers, magazines, television, internet etc. Suppose if you have to
collect the data on the number of branches of your favourite restaurant in different cities. You
may collect the data from newspapers or the internet. Such data is the secondary data.
Organization of the Data
Now that you have your data, what can be done with them? These data are raw data. We have to organise
it in some meaningful way to take out the information. Consider the example of a collection of data of
your favourite sport. From this raw data, you can count the number of the people who like a particular sport.
Tally Marks
Tally marks are the representation of the data in the form of vertical lines. We put one vertical line (|) for
each of the four counts. A diagonal line (\) is put for the fifth count. These marks are tally marks.
Tally marks for Number 4 is ||||
Number 5 is represented as
The representation of 6 as and so on.
Frequency Distribution
The representation of the various observations and tally marks in a form of table is the frequency
distribution. The frequency is the number of the times an observation occurs. It is the number of
repetitions. Consider in a class of 30 students, 5 like badminton. 10 students like cricket, 3 like tennis, 4 like football, 7 like volleyball and 1 likes hockey.
Representation of this data:

Nilanjana Bhadra
This table is the frequency distribution table or the frequency table. Each item of this table, badminton, cricket etc. is an observation. The number of the students is the frequency.
Ungrouped Data
Let the test scores of all 20 students be as follows:
23, 26, 11, 18, 09, 21, 23, 30, 22, 11, 21, 20, 11, 13, 23, 11, 29, 25, 26, 26
Note that the term frequency refers to the number of times an observation occurs or appears in a data set.
Hence, in case of repetitions, the frequency increases. The table below will help you understand this
better:
Marks obtained in the test No. of students (Frequency)
09 1
11 4
13 1
18 1
20 1
21 2
22 1
23 3
25 1
26 3
29 1
30 1
Total 20

Nilanjana Bhadra
In the example above, the frequency refers to the number of students getting a particular mark in the test.
Also, note that your frequency must always total the number of observations after tallying. Here, the total
we have obtained after tallying the test scores of the students is 20 which is also the number of observations given.
A frequency distribution such as the one above is called an ungrouped frequency distribution table. It
takes into account ungrouped data and calculates the frequency for each observation singularly.
Grouped Data
Now consider the situation where we want to collect data on the test scores of five such classes i.e. of 100
students. It becomes difficult to tally for each and every score of all 100 students. Besides, the table we
will obtain will be very large in length and not understandable at once. In this case, we use what is called
a grouped frequency distribution table.
Such tables take into consideration groups of data in the form of class intervals to tally the frequency for the data that belongs to that particular class interval.
Take a look at the table below to understand the concept better:
Marks obtained in the test (Class Interval) No. of students (Frequency)
0-5 3
5-10 11
10-15 38
15-20 34
20-25 9
25-30 5
Total 100
The first column here represents the marks obtained in class interval form. The lowest number in a class
interval is called the lower limit and the highest number is called the upper limit. This example is a case of continuous class intervals as the upper limit of one class is the lower limit of the following class.
Note that in continuous cases, any observation corresponding to the extreme values of a class is always
included in that class where it is the lower limit. For example, if we had a student who has scored 5 marks
in the test, his marks would be included in the class interval 5-10 and not 0-5.
Nilanjana Bhadra
Analogous to continuous class intervals are disjoint class intervals. An example of such as case would
be 0-4, 5-9, 10-14, and so on. The frequency distribution can be done for disjoint data as well, similar to
how it is done above.
Range and Mean Deviation for Grouped Data
Most of the data we deal with in real life is in a grouped form. The amount of data is generally large and
is associated with corresponding frequencies (sometimes we divide data items into class intervals). For
example- we are given data about people of varying age groups in a library. The data will be displayed as
classified into intervals associated with their frequencies depending on the number of people belonging to each interval. Here, we will be studying methods to calculate range and mean deviation for grouped data.
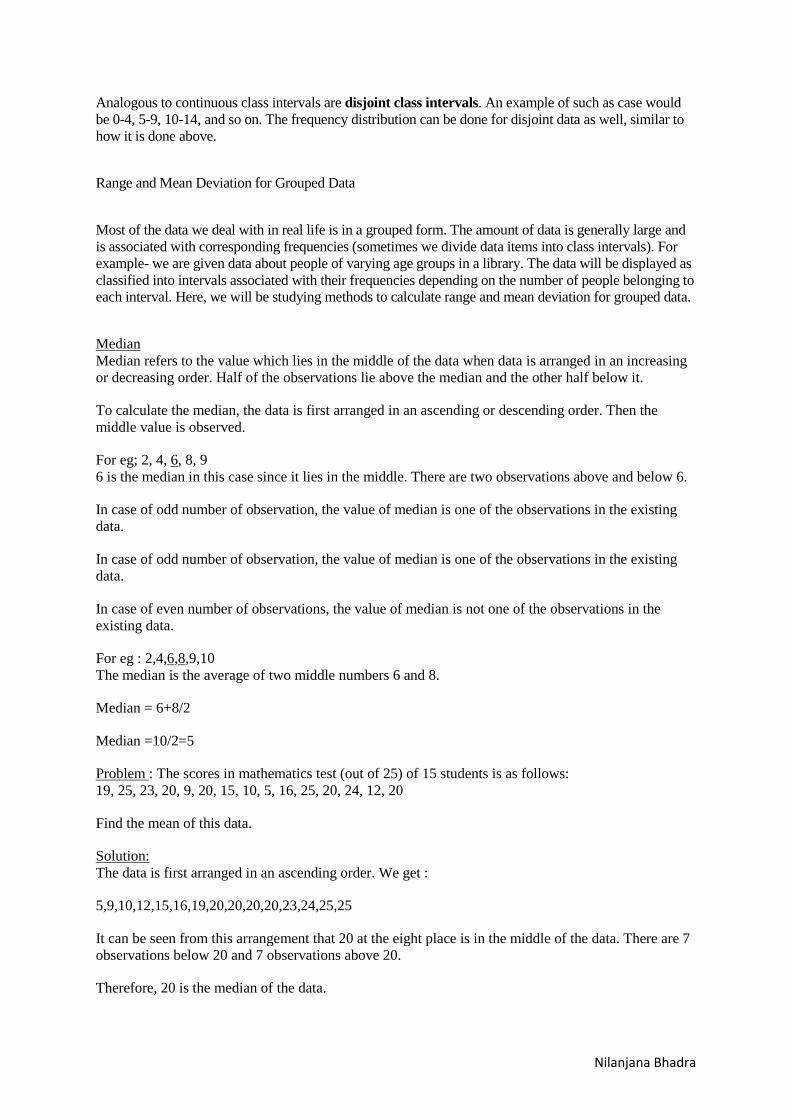
Median
Median refers to the value which lies in the middle of the data when data is arranged in an increasing
or decreasing order. Half of the observations lie above the median and the other half below it.
To calculate the median, the data is first arranged in an ascending or descending order. Then the
middle value is observed.
For eg; 2, 4, 6, 8, 9
6 is the median in this case since it lies in the middle. There are two observations above and below 6.
In case of odd number of observation, the value of median is one of the observations in the existing
data.
In case of odd number of observation, the value of median is one of the observations in the existing
data.
In case of even number of observations, the value of median is not one of the observations in the
existing data.
For eg : 2,4,6,8,9,10
The median is the average of two middle numbers 6 and 8.
Median = 6+8/2
Median =10/2=5
Problem : The scores in mathematics test (out of 25) of 15 students is as follows:
19, 25, 23, 20, 9, 20, 15, 10, 5, 16, 25, 20, 24, 12, 20
Find the mean of this data.
Solution:
The data is first arranged in an ascending order. We get :
5,9,10,12,15,16,19,20,20,20,20,23,24,25,25
It can be seen from this arrangement that 20 at the eight place is in the middle of the data. There are 7
observations below 20 and 7 observations above 20.
Therefore, 20 is the median of the data.

Nilanjana Bhadra
Problem: The weights (in kg.) of 15 students of a class are:
38, 42, 35, 37, 45, 50, 32, 43, 43, 40, 36, 38, 43, 38, 47
Find the mode and median of this data.
Solution:
Firstly, data will be arranged in an ascending order in a tabular format.
The observation with the highest frequency is the mode. 38kgs and 43kgs are the mode since the
maximum numbers of students have these two weights. The frequency is maximum at these two
observations, which is 3.
To find out the median, the data is first arranged in ascending order. Hence, the table has weights in
ascending order.
(ii) Is there more than one mode?
There are two modes because two observations have highest and equal frequency. The two
observations are 38 and 43.
Mean Median Mode Formula
The Mean, Median and Mode are the arithmetic average of a data set. This is found by adding the
numbers in a data set and dividing by how many numbers there are. The median is the middle number
in a data set when the numbers are listed in either ascending or descending order. The mode is the
value that occurs the most often in a data set, and the range is the difference between the highest and lowest values in a data set.
The Mean
Avg(x)=∑x/N
Here,
∑ represents the summation
X represents scores
N represents number of scores.
The Median
If the total number of numbers(n) is an odd number, then the formula is given below:
Median=((n+1)/2)thterm
If the total number of the numbers(n) is an even number, then the formula is given below:
Median=((n/2)thterm+(n/2+1)thterm)/2

Nilanjana Bhadra
The Mode
The mode is the most frequently occurring score or value.
SOLVED NUMERICALS
Question 1: The following is the distribution for the age of the students in a school:
Age 0-5 5-10 10-15 15-20
No. of Students 35 45 50 30
Calculate:
The lower limit of the first class interval.
The class limits of the third class.
The class mark for the interval 5-10.
The class size.
Answer:
The lower limit of the first class interval i.e. 0-5 is ‘0’.
The class limits of the third class, i.e. 10-15 are 10 (lower limit) and 15 (upper limit).
The classmark is defined as the average of the upper and lower limits of a class. For 5-10, the classmark is (5+10)/2 = 7.5
The class size is the difference between the lower and upper class-limits. Here, we have a uniform
class size, which is equal to 5 (5 – 0, 10 – 5, 15 – 10, 20 – 15 are all equal to 5).
Question 2: Discuss the differences between the frequency table and the frequency distribution
table?
Answer: The frequency table is said to be a tabular method where each part of the data is assigned to its
corresponding frequency. Whereas, a frequency distribution is generally the graphical representation of the frequency table.
Question 3: What are the numerous types of frequency distributions?
Answer: Different types of frequency distributions are as follows:

Nilanjana Bhadra
1. Grouped frequency distribution.
2. Ungrouped frequency distribution.
3. Cumulative frequency distribution.
4. Relative frequency distribution.
5. Relative cumulative frequency distribution, etc.
Question 4: What are some characteristics of the frequency distribution?
Answer: Some major characteristics of the frequency distribution are given as follows:
1. Measures of central tendency and location i.e. mean, median, and mode.
2. Measures of dispersion i.e. range, variance, and the standard deviation.
3. The extent of the symmetry or asymmetry i.e. skewness.
4. The flatness or the peakedness i.e. kurtosis.
Question 5: What is the importance of frequency distribution?
Answer: The value of the frequency distributions in statistics is excessive. A well-formed frequency
distribution creates the possibility of a detailed analysis of the structure of the population. So, the groups
where the population breaks down are determinable.
Question 6: Find the mean, median, mode, and range for the following list of values: 13, 18, 13, 14, 13, 16, 14, 21, 13
Solution:
Given sequence: 13, 18, 13, 14, 13, 16, 14, 21, 13
The mean is the usual average, so:
13+18+13+14+13+16+14+21+139=15
Note that the mean isn’t a value from the original list. This is a common result. You should not assume that your mean will be one of your original numbers.
The median is the middle value, so to rewrite the list in order:
13, 13, 13, 13, 14, 14, 16, 18, 21
There are nine numbers in the list, so the middle one will be
9+12=102=5
= 5th number, so, the median is 14.
The mode is the number that is repeated more often than any other, so 13 is the mode.
The largest value in the list is 21, and the smallest is 13, so the range is 21 – 13 = 8.
mean: 15
median: 14
mode: 13 range: 8

Nilanjana Bhadra
Question 7: For the given table, fill the blanks.
Frequency Tally Marks
9 __
__ |||
7 __
__ ||||
16 __
__ |
__ |||
5 __
__ ||
11 __
Answer : The complete table is

Nilanjana Bhadra
Question 8: Below is the marks of 35 students in English test (out of 10). Arrange these marks in
tabular form using tally marks. 5, 8, 7, 6, 10, 8, 2, 4, 6, 3, 7, 5, 8, 5, 1, 7, 4, 6, 3, 5, 2, 8, 4, 2, 6, 4, 2, 8,
9, 5, 4, 7, 5, 5, 8.
a. How many students scored more than 7 marks?
b. What is the mark scored by the maximum students? What is the number of the students?
c. How many students scored less than and equal to 5?
Answer : The frequency table is
a. The number of students with more than 7 marks = 6 + 1 + 1 = 8.
b. The maximum students scored 5 marks. The number of students is 7.
c. The number of students with less than and equal to 5 marks = 19.
Question 9: How do tally marks look like?
Answer: The tally marks are simple straight lines. These are useful for keeping track of something. Just
like the scores of different players in a sport or results from some survey or research. The use of the tally marks is an easy and great way to present the information.
Question 10: What is the tally chart and tally marks when it comes to statistics?
Answer: A tally chart is said to be a simple method used for the collection of data with the tally marks.
The tally marks are basically the frequencies, occurrences, or the sum numbers we measure for a
particular category in a set of data.
Question 11: Why are the tally marks essential?

Nilanjana Bhadra
Answer: The tally marks are important as we mainly use them to keep the record of a running or
continuous count. These marks are so useful for recording and maintaining the scores in a game or a
sport.
Question 12: What is the tally frequency table?
Answer: A tally frequency table is generally known as a tally chart. It is a method of collecting the data with the tally marks.
Solution of Previous Years’ Question Papers
2019
1st term
3rd Term
2018
1st Term

Nilanjana Bhadra
2nd Term
3rd Term
Exercise Problems
1. Are the mean, median and mode of the following data the same? If not
which item among this may be deleted so as to make the mean, median and mode the same? 47 40 36 40 42 45 40 32
2. Find median and mode of the following information: 2, 2, 3, 5, 5, 7, 8
Nilanjana Bhadra
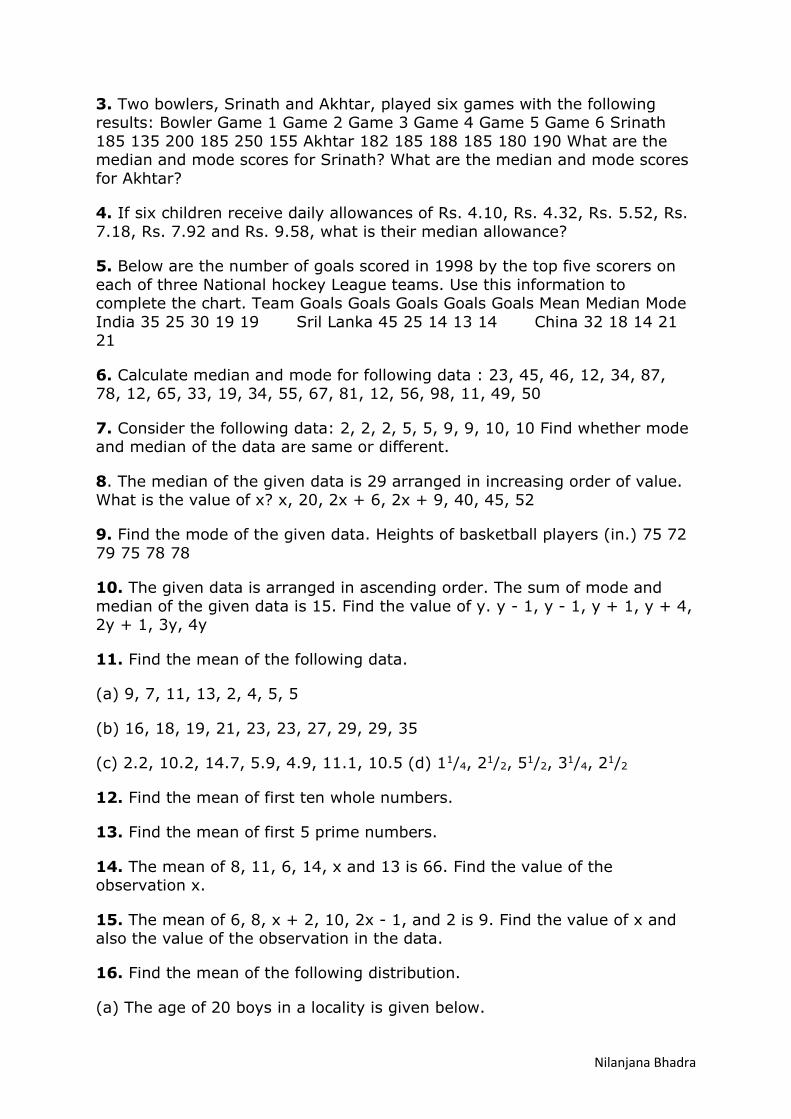
3. Two bowlers, Srinath and Akhtar, played six games with the following results: Bowler Game 1 Game 2 Game 3 Game 4 Game 5 Game 6 Srinath
185 135 200 185 250 155 Akhtar 182 185 188 185 180 190 What are the median and mode scores for Srinath? What are the median and mode scores
for Akhtar?
4. If six children receive daily allowances of Rs. 4.10, Rs. 4.32, Rs. 5.52, Rs.
7.18, Rs. 7.92 and Rs. 9.58, what is their median allowance?
5. Below are the number of goals scored in 1998 by the top five scorers on
each of three National hockey League teams. Use this information to complete the chart. Team Goals Goals Goals Goals Goals Mean Median Mode
India 35 25 30 19 19 Sril Lanka 45 25 14 13 14 China 32 18 14 21 21
6. Calculate median and mode for following data : 23, 45, 46, 12, 34, 87, 78, 12, 65, 33, 19, 34, 55, 67, 81, 12, 56, 98, 11, 49, 50
7. Consider the following data: 2, 2, 2, 5, 5, 9, 9, 10, 10 Find whether mode and median of the data are same or different.
8. The median of the given data is 29 arranged in increasing order of value. What is the value of x? x, 20, 2x + 6, 2x + 9, 40, 45, 52
9. Find the mode of the given data. Heights of basketball players (in.) 75 72
79 75 78 78
10. The given data is arranged in ascending order. The sum of mode and
median of the given data is 15. Find the value of y. y - 1, y - 1, y + 1, y + 4, 2y + 1, 3y, 4y
11. Find the mean of the following data.
(a) 9, 7, 11, 13, 2, 4, 5, 5
(b) 16, 18, 19, 21, 23, 23, 27, 29, 29, 35
(c) 2.2, 10.2, 14.7, 5.9, 4.9, 11.1, 10.5 (d) 11/4, 21/2, 51/2, 31/4, 21/2
12. Find the mean of first ten whole numbers.
13. Find the mean of first 5 prime numbers.
14. The mean of 8, 11, 6, 14, x and 13 is 66. Find the value of the observation x.
15. The mean of 6, 8, x + 2, 10, 2x - 1, and 2 is 9. Find the value of x and also the value of the observation in the data.
16. Find the mean of the following distribution.
(a) The age of 20 boys in a locality is given below.

Nilanjana Bhadra
Age in Years 12 10 15 14 8
Number of Boys 5 3 2 6 4
(b) Marks obtained by 40 students in an exam are given below.
Marks 25 30 15 20 24
Number of Students 8 12 10 6 4
(c)
xi 1 2 3 4 5
fi 4 5 8 10 3
(d) The daily wages of 50 employees in an organization are given below:
Daily wages (in $) 100 - 150 150 - 200 200 - 250 250 - 300
Number of Workers 12 13 17 8
Find the mean daily wages.
17. Find the mode of the following data.
(a) 12, 8, 4, 8, 1, 8, 9, 11, 9, 10, 12, 8
(b) 15, 22, 17, 19, 22, 17, 29, 24, 17, 15
(c) 0, 3, 2, 1, 3, 5, 4, 3, 42, 1, 2, 0
(d) 1, 7, 2, 4, 5, 9, 8, 3
18. The runs scored in a cricket match by 11 players is as follows:
7, 16, 121, 51, 101, 81, 1, 16, 9, 11, 16
Find the mean, mode, median of this data.
19. The weights in kg of 10 students are given below:
39, 43, 36, 38, 46, 51, 33, 44, 44, 43
Find the mode of this data. Is there more than 1 mode? If yes, why?
20. The marks obtained by 40 students out of 50 in a class are given below in the table.
Marks (in $) 42 36 30 45 50
Number of Students 7 10 13 8 2

Nilanjana Bhadra
Find the mode of the above data.
21. The number of rupee notes of different denominations are given below in the table.
Denominations (Rs) 10 20 5 50 100
Number of Notes 40 30 10 25 20
Find the mode of the above data.
22. Find the median of the following data.
(a) 27, 39, 49, 20, 21, 28, 38
(b) 10, 19, 54, 80, 15, 16
(c) 47, 41, 52, 43, 56, 35, 49, 55, 42
(d) 12, 17, 3, 14, 5, 8, 7, 15
23. The following observations are arranged in ascending order. The median of the data is 25 find the value of x.
17, x, 24, x + 7, 35, 36, 46
24. The mean of the following distribution is 26. Find the value of p and also
the value of the observation.
xi 0 1 2 3 4 5
fi 3 3 p 7 p - 1 4
Also, find the mode and the given data.