Embed Size (px)
Citation preview

Overview of French Guiana’s Economy
October 3 2014October 3, 2014
French Guiana Agency

Central Bank of French overseas departments
Central Bank missions acting on behalf of the central Bank of France
P t b k t d i i t i l ti d i th i i t Put euro banknotes and coins into circulation and ensuring their maintenance Relay of national and European banking Authorities
Fulfill Public service missions on behalf of the French State
Making and uttering money in the economy g g y y List and manage households’ debt Burden issues and inform the public
General interest servicesGeneral interest services
Economic, financial observatories of companies and over-indebtednessB ki f b t Banking fees observatory
Web site of IEDOM : www.iedom.fr
Guyexpo 2014French Guiana Agency p- 2

Geographical framework
Area of 83 846 km²Area of 83 846 km²
0,5 % of the continent’s area but 16 % of FFrance area
Surrounded by y-Atlantic ocean (320 km),-Surinam (520 km) -Brazil on the south and east boarder ( 580Brazil on the south and east boarder ( 580 km)
94 % covered by Amazon Forest94 % covered by Amazon Forest
Guyexpo 2014French Guiana Agency p- 3

A regional environment with strong economic growth
10%
GDP growth rate at constant prices
8%
10%
4%
6%
0%
2%
-2%
0%
2002 2003 2004 2005 2006 2007 2008 2009 2010 2011 2012 2013
-4%French Guiana Guyana
Source: World Economic Outlouk, April 2014, final accounts and Cerom estimates
Guyexpo 2014French Guiana Agency p- 4

A moderate inflation
15%
Annual variation of the consumer prices index
10%11%12%13%14%
6%7%8%9%
10%
1%2%3%4%5%
-1%0%1%
1995 1996 1997 1998 1999 2000 2001 2002 2003 2004 2005 2006 2007 2008 2009 2010 2011 2012 2013
Guyana GuyaneGuyana GuyaneSource : Bureau of statistics of Guyana, Insee
Guyexpo 2014French Guiana Agency p- 5

A rich region within its regional environment
GDP per capita - area of South America - Caribbean in 2012
20 087Trinidad & Tobago
(based on purchasing-power-parity, $)
13 615
15 153
Venezuela
French Guiana (estimations)
12 398
11 875
Surinam
Brazil
1 242
7 939
Haïti
Guyana
0 2 000 4 000 6 000 8 000 10 000 12 000 14 000 16 000 18 000 20 000$
Source : IMF (World Economic Outlook Database, Octobre 2013 PPA), IEDOM estimates with the exchange rate of IMF euros dollars PPA (0,902)
Guyexpo 2014French Guiana Agency p- 6

A rich region within its regional environment
Human developpement index 2012
0,819
0,822
0,893
Chili
Guadeloupe (2010)
France
0,76
0,814
Trinidad & Tobago
Martinique (2010)
0,73
0,74
0,74
Brazil
Latin America and Caribbean average
French Guiana (2010)
0,636
0,684
Guyana
Surinam
0,456
0,4 0,6 0,8
Haiti
Source : AFD, CEROM estimates, INSEE, PNUD
Guyexpo 2014French Guiana Agency p- 7

A population characterized by its youthful
Demographic indicators
French Guiana GuyanaFrench Guiana Guyana Population 2013 250 109 746 880 Share of those below 20 years olds 45% n.dProjections 2030 424 000 910 000 Birth rate 28,2‰ 21‰Mortality rate 3,2‰ 7‰y ,Average annual growth of the population 3,1% ‐2,7%Source : World Bank (Guyana), United Nations (Guyana), Insee
Guyexpo 2014French Guiana Agency p- 8

An economy with a lack of jobs and skilled labourforce
Compared unemployment rate (according to the ILO definition)
21 5%
22,0%
21,0%
21,5%
21,3%
21,7%
20,5%
,
20,0%
FrenchGuiana (2013) Guyana (2013)French Guiana (2013) Guyana (2013)Source : Insee, World Bank
Guyexpo 2014 p- 9French Guiana Agency p- 9

An economy focused on services
60%
70%
80%
30%
40%
50%
%
French Guiana
Guyana
0%
10%
20%
A i lt I d t S i
Allocation/division of added value by sectorsAgriculture Industry Services
Guyana (2013) French Guiana (2007)y ( ) ( )Agriculture 21% 4%Industry 39% 20%including : construction n.d. 9%including : construction n.d. 9%Services 41% 76%including : retail n.d. 9%
Guyexpo 2014French Guiana Agency p- 10

An industry supported by the space sector
70%
80%
90%
30%
40%
50%
60%
Guyana (2002)
French Guiana
0%
10%
20%
Agriculture Industry Services
Allocation of employment by sector
Agriculture Industry Services
Guyana (2002) French Guiana (2013)Agriculture 21% 1%Industry 25% 15%including : construction 7% 8%Services 51% 84%including : retail 30% 8%nd 3%Sources : International Labor Organization (Guyana), Insee
Guyexpo 2014French Guiana Agency p- 11

A strong growing domestic market
Population, number of firms and sector divisionTransports, services divers Commerce Adm pub, enseig, santé, action soc
38,1% 24,9% 7,1%41,5% 24,8% 8,6%44 6% 23 0% 9 9%
Public administration,
d i44,6% 23,0% 9,9%
424 000 hab en 2030Industry 11,2%
education, healthcare,
social activities 7,1%
239 000 hab
Construction 18,8%
Retail 24,9%
239 450
10 372 firms
Transportation, other services
38,1%
Number of firms in 2011
P l ti i 2012
IndustryConstructionTransportation, other services
Population in 2012
Population in 2030Source : Insee, buisiness register, pop. Census, population projections (median scenario, 2007)
*All market activities excluding agriculture
RetailPublic administration, education, healthcare, social activities
Guyexpo 2014 12French Guiana Agency
Dynamic sectors
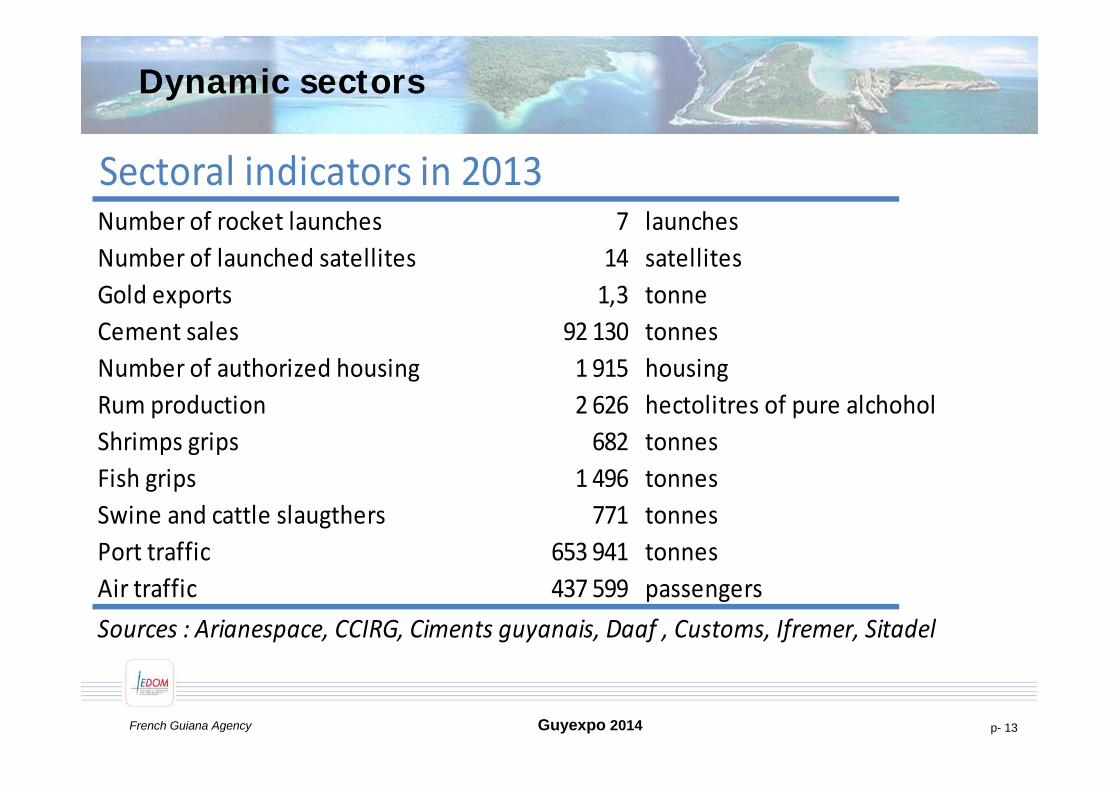
Sectoral indicators in 2013N b f k t l h 7 l hNumber of rocket launches 7 launchesNumber of launched satellites 14 satellitesGold exports 1,3 tonnep ,Cement sales 92 130 tonnesNumber of authorized housing 1 915 housing
d i h li f l h h lRum production 2 626 hectolitres of pure alchoholShrimps grips 682 tonnesFish grips 1 496 tonnesFish grips 1 496 tonnesSwine and cattle slaugthers 771 tonnesPort traffic 653 941 tonnesAir traffic 437 599 passengersSources : Arianespace, CCIRG, Ciments guyanais, Daaf , Customs, Ifremer, Sitadel
Guyexpo 2014French Guiana Agency p- 13

Main indicators
Economic and financial indicators in 2013I f d 1 589 illiImports of goods 1 589 million euros Exports of goods 292 million euros Trade balance ‐1 296 million eurosTrade balance 1 296 million euros GDP in current euros 3,9 billion euros
3 499 kW/capita/yearElectricity consumptionTotal appropriations 2 634 million euros
1,4 bank account per capitaNumber of bank accounts per capitaSources : Customs, EDF, IEDOM, Insee
Guyexpo 2014French Guiana Agency p- 14

Metropolitan France: First trading partner
500Main suppliers of French Guiana M€
350
400
450
200
250
300
50
100
150
0France* French West Indies European union Other European
countriesTrinidad Latin
America/Caribbean**Asia Rest of the World
1993 2003 2009 2010 2011 2012 2013Source : Customs
Imports : 1 589 M€
Source : Customs* whole France except french overseas departements in America ** except french overseas departements in America and Trinidad
Guyexpo 2014French Guiana Agency p- 15

Metropolitan France: Second trading partner
140
Main customers of French GuianaM€
100
120
60
80
20
40
0France* French West Indies European Union Other European
countries Latin America/Caribbean
**Rest of the world
1993 2003 2009 2010 2011 2012 2013
Exports : 292 M€
Source : Customs * whole France except french overseas departments in America ** except french overseas departments in America and Trinidad
Guyexpo 2014French Guiana Agency p- 16

Subdued trade with the neighboring countries
€€Imports Exports
292 M
€
1589
M€
18%Imports Exports
French Guyana0,0 M€
GuianaGuyana
0,1 M€‐Foodstuffs‐Fishings boats ‐Machine
Trade coverage rate(Exports/Imports)18%
1389
M€
035M
€
75%Imports
Exports
Source : Customs
1 10
Guyexpo 2014French Guiana Agency p- 17
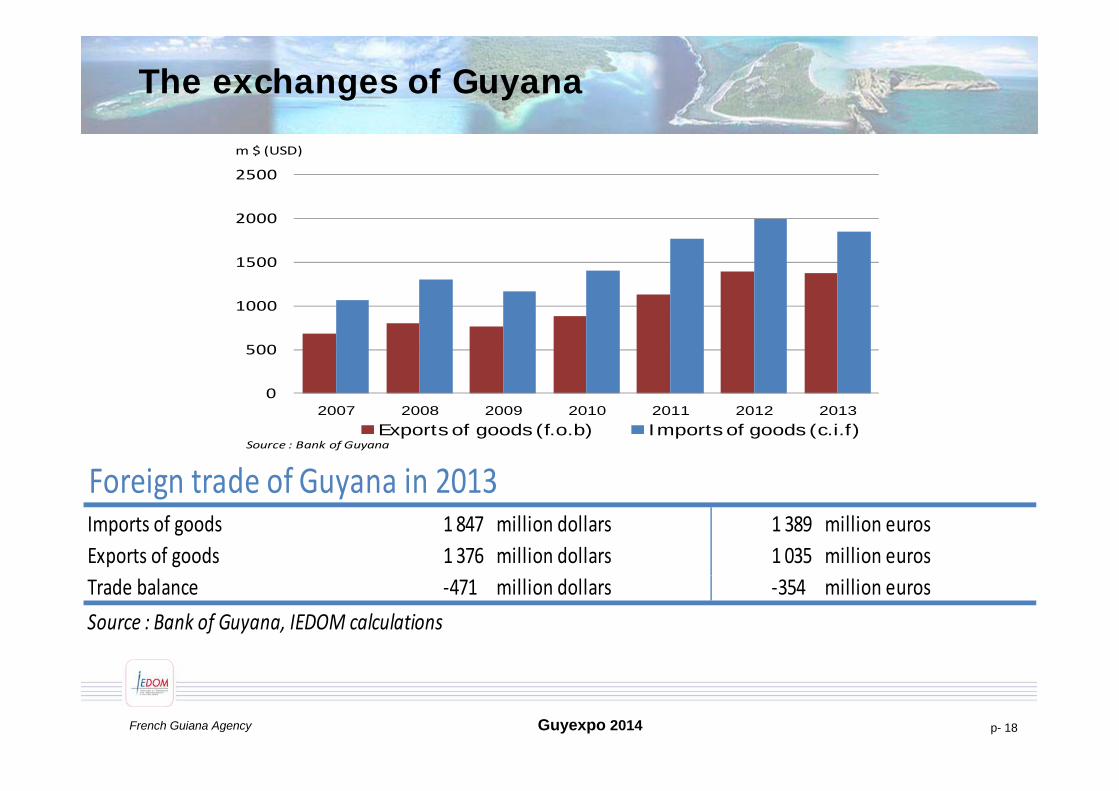
The exchanges of Guyana
2000
2500
m $ (USD)
1000
1500
2000
0
500
1000
02007 2008 2009 2010 2011 2012 2013
Exports of goods (f.o.b) Imports of goods (c.i.f)Source : Bank of Guyana
Foreign trade of Guyana in 2013Foreign trade of Guyana in 2013Imports of goods 1 847 million dollars 1 389 million eurosExports of goods 1 376 million dollars 1 035 million eurosTrade balance ‐471 million dollars ‐354 million eurosSource : Bank of Guyana, IEDOM calculations
Guyexpo 2014French Guiana Agency p- 18

Banking system organization in French Guiana
• 15 credit institutions locally based• 15 credit institutions locally based
• 45 permanent Bank branches• 45 permanent Bank branches• 128 ATMs
• 2 466 electronic payment terminals in stores and shops
• 1,4 Bank account per inhabitant1 09 payment cards per inhabitant• 1,09 payment cards per inhabitant
Guyexpo 2014French Guiana Agency p- 19

Evolution of economic actors’ financial investments
In millions €uros
Evolution of Financial Assets
10%
15%
20%
1 500
1 600
1 700
0%
5%
0%
1 200
1 300
1 400
-10%
-5%
1 000
1 100
juin-10 déc.-10 juin-11 déc.-11 juin-12 déc.-12 juin-13 déc.-13 juin-14
Source : Iedom
Quarter to Quarter Amount
Guyexpo 2014
Source : Iedom
French Guiana Agency p- 20

Evolution of economic funding
Evolution of outstanding Bank credit
6%2 900
In millions €uros
Evolution of outstanding Bank credit
3%
4%
5%
2 300
2 500
2 700
2 900
0%
1%
2%
1 700
1 900
2 100
2 300
-1%
0%
1 500
1 700
juin-10 déc.-10 juin-11 déc.-11 juin-12 déc.-12 juin-13 déc.-13 juin-14
Source : IedomHealthy credit lending (excluding non performing loans ) ECIL + ECNILECIL (ECNIL) : Credit institution (not) based locally
Quarter to Quarter Amount
Guyexpo 2014French Guiana Agency p- 21
Source : IedomECIL (ECNIL) : Credit institution (not) based locally

Evolution of economic funding
Outstanding loans of the private sector (in M€)
2 500 M€
1 750 M€
2 000 M€
2 250 M€
1 000 M€
1 250 M€
1 500 M€
250M€
500 M€
750 M€
0 M€
250 M€
2004 2005 2006 2007 2008 2009 2010 2011 2012 2013
F hG i G
Source: IEDOM, Bank of GuyanaExchange rate EUR/GYD and EUR/USD at 31/12/200N
French Guiana Guyana
Guyexpo 2014French Guiana Agency p- 22
g / / / /

Evolution of economic funding
Total outstanding loans in the Economy (in M€)
3 000 M€
2 500 M€
1 500 M€
2 000 M€
500M€
1 000 M€
0 M€
500 M€
2006 2007 2008 2009 2010 2011 2012 2013
Source: IEDOM, Bank of GuyanaExchange rate EUR/GYD and EUR/USD at 31/12/200N
French Guiana Guyana
Guyexpo 2014French Guiana Agency p- 23
g / / / /

Evolution of Saving
Global deposit amount (in Millions €uros)
1 800M€
1 400 M€
1 600 M€
1 800 M€
800 M€
1 000 M€
1 200 M€
200M€
400 M€
600 M€
0 M€
200 M€
2004 2005 2006 2007 2008 2009 2010 2011 2012 2013
Source: IEDOM
French Guiana Guyana
Guyexpo 2014French Guiana Agency p- 24
Source: IEDOM

Evolution counterparty risks
Global doubtful loans and provisioning rate
80%14%
60%
70%
80%
10%
12%
14%
40%
50%
6%
8%
10%
10%
20%
30%
2%
4%
6%
0%
10%
0%
2%
Source: IEDOM
Doubtful loans rate Provisioning rate (right scale)
Guyexpo 2014French Guiana Agency p- 25
Source: IEDOM

More informations about French Guiana ‘s economy
http://www.cerom-outremer.fr/guyane/http://www.iedom.fr/guyane/
Guyexpo 2014French Guiana Agency p- 26

A synthetic overview of French Guiana in several languages g g
htt // i d f / /http://www.iedom.fr/guyane/
Guyexpo 2014French Guiana Agency p- 27

Economic dashbord of French Guiana in severallanguages
http://www.cerom-outremer.fr/guyane/
Guyexpo 2014Agence de Guyane p- 28

Thank you for your attention
i d fwww.iedom.fr
www.cerom-outremer.frwww.cerom outremer.fr
Guyexpo 2014French Guiana Agency p- 29


![The Guiana Shield is the largest island in South America (?) [French]](https://img.dokumen.tips/doc/110x75/58a75cea1a28ab217e8b52bf/the-guiana-shield-is-the-largest-island-in-south-america-french.jpg)


