Embed Size (px)
Citation preview
Final Draft as Approved by Technical Subcommittee
SEWRPC Planning Report No. 47
A REGIONAL FREEWAY RECONSTRUCTION SYSTEM PLANFOR SOUTHEASTERN WISCONSIN
Chapter V
FREEWAY SYSTEM PROBLEMS AND DEFICIENCIES:PHYSICAL DESIGN, TRAFFIC SAFETY,
AND TRAFFIC CONGESTION
INTRODUCTION
This chapter will describe for each freeway segment and for the freeway system as a whole, its existing and
potential future traffic problems and deficiencies. The physical design deficiencies of each segment of the freeway
system will be determined by identifying those elements of the freeway system which do not currently meet
accepted modern freeway design standards. Also, traffic safety problems on each segment of the freeway system
will be identified by reviewing the number and rate of traffic accidents over the past three years. The existing and
potential future traffic congestion problems on the freeway system will be identified, including that traffic
congestion which may be expected to remain even upon implementation of other transportation system
improvement and expansion as called for in the adopted regional transportation plan.
Some of the deficiencies of the current freeway system which will be identified in this chapter exist due to the
advancement in knowledge about freeway operations and design which has been achieved since the time of
original freeway construction, and the evolution of modern freeway design criteria. Others may exist because the
original planned freeway system, as shown on Map 5-1, was never completed.
FREEWAY SYSTEM PHYSICAL DESIGN DEFICIENCIES
Freeway Design Standards
The extent to which the physical characteristics of each segment of the freeway system meets modern freeway
design standards was determined by comparing the physical design characteristics of each freeway segment to

FREE
WAY
ROCK
FRE
EW
AY
6
6 6
6
6
66
6
6
6
6
6
6
6
66
6
6
6
6
4
6
4
4
44
4
4
4
4
4
4
44
8
4
6
6
8
8
8
8
6
6
PARK FREEWAY
U S
H4
5
U S
H 41
FOND DU LAC
STA
DIU
M
FRE
EW
AY
FR
FR
E
E
WAY
WA
Y
E
E
BAY
U S H16
WEST BENDFREEWAY
Map 5-1
ORIGINAL PLANNEDREGIONAL FREEWAY SYSTEM
AND EXISTING FREEWAY SYSTEM
The original planned freeway system is the recommended freeway system in the Southeastern Wisconsin RegionalPlanning Commission’s design year 1990 land use and transportation plans which were completed in 1966.
Source: SEWRPC.
a
a
GRAPHIC SCALE
0 2 4 8 MILES
8
PLANNED FREEWAYDESIGNYEAR 1990
EXISTING FREEWAYSYEAR 2001
NUMBER OF LANES
4
4
4
6
6
6
6
44
6
6
6
4
4
4
4
U S H 12
U S H 12
I H
9
4N
OR
TH -
SO
UT
HBELT
STA
DIU
M
FREEWAY
EAST- WESTFREEWAY
ZO
OFR
EEW
AY
1a
BAYEEFR WAY
AIRPORT SPURFREEWAY
LAK
E
WA
YFR
EE
RACINE LOOPFREEWAY
BELT
FREEWAY
FRE
EW
AY
U S H45
IH 94
AIRPORT FREEWAY
NO
RT
H-
SO
UT
HFR
EE
WA
Y

2
modern freeway design standards. The primary sources for these design standards were the American
Association of State Highway and Transportation Official’s (AASHTO) report entitled “A Policy on Geometric
Design Standards of Highways and Streets” and the Wisconsin Department of Transportation’s (WisDOT)
“Facilities Development Manual.” The design standards are defined in Table 5-1 and include:
• Vertical Curvature Stopping Sight Distance
• Horizontal Curvature
• Vertical Alignment
• Lane Width
• Shoulder Width
• Lane Balance and Route Continuity
• Entrance/Exit Ramp Spacing
• Vertical Clearance, and
• Weaving
The design standards of vertical curvature stopping sight distance, horizontal curvature, shoulder width, lane
balance and route continuity, and weaving include both desirable standards and minimum standards. The design
standards of vertical alignment, lane width, entrance/exit ramp spacing, and vertical clearance include only one
standard which is both the desirable and minimum standard. Design standards are provided for both 70 miles per
hour freeway design speed and 60 miles per hour freeway design speed. The existing freeway system in
Milwaukee County was principally designed and constructed with a 60 miles per hour design speed; therefore, the
design standards for a 60 miles per hour design speed were applied in Milwaukee County for the identification of
freeway design deficiencies. The existing freeway system in the other six counties of the southeastern Wisconsin
Region was principally designed and constructed with a 70 miles per hour design speed; therefore, the design
standards for a 70 miles per hour design speed were applied in these six counties. However, design standards
related to lane width, shoulder width, lane balance and route continuity, vertical clearance, entrance/exit ramp
spacing and weaving do not vary with design speed. Only the design standards of vertical curvature stopping
sight distance, horizontal curvature, and vertical alignment vary with design speed.
In addition to these physical design standards, a design guideline for interchange spacing was defined. The design
standards were applied to each freeway segment to determine design deficiencies. The interchange spacing
design guideline was applied to each freeway segment to identify those segments of freeway with less than
desirable or minimum interchange spacing which may be expected to affect freeway operations.
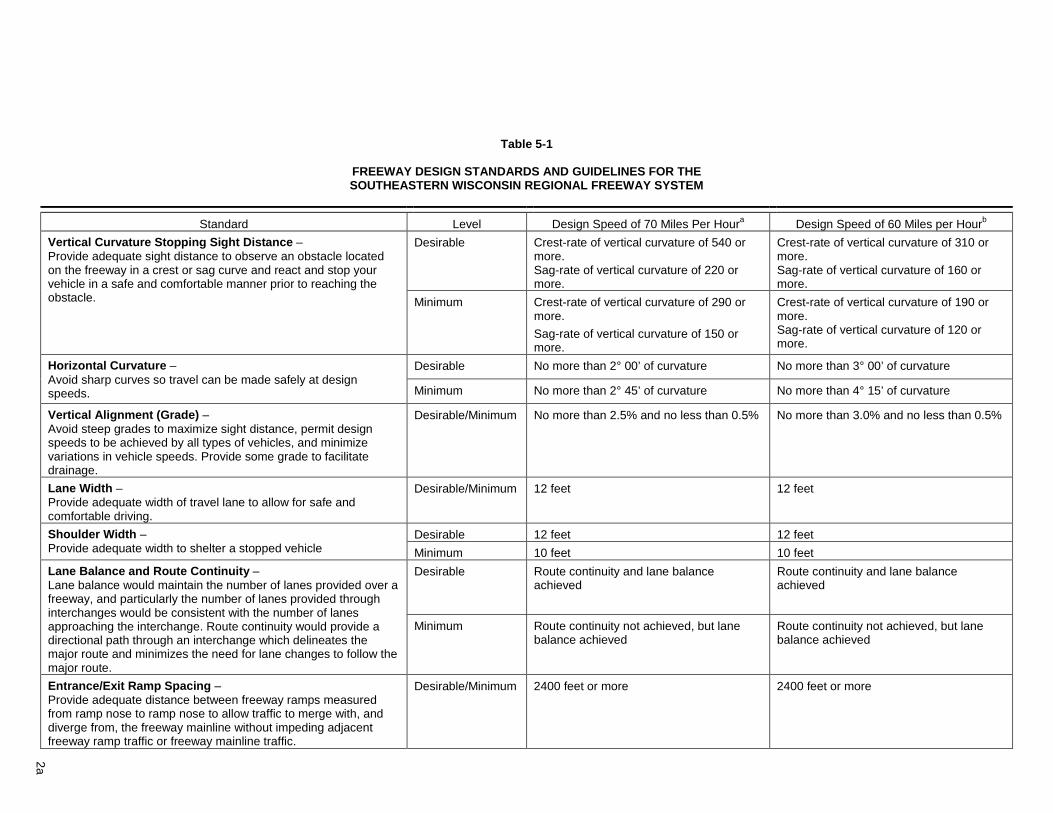
Table 5-1
FREEWAY DESIGN STANDARDS AND GUIDELINES FOR THESOUTHEASTERN WISCONSIN REGIONAL FREEWAY SYSTEM
Standard Level Design Speed of 70 Miles Per Houra Design Speed of 60 Miles per Hourb
Desirable Crest-rate of vertical curvature of 540 ormore.Sag-rate of vertical curvature of 220 ormore.
Crest-rate of vertical curvature of 310 ormore.Sag-rate of vertical curvature of 160 ormore.
Vertical Curvature Stopping Sight Distance –Provide adequate sight distance to observe an obstacle locatedon the freeway in a crest or sag curve and react and stop yourvehicle in a safe and comfortable manner prior to reaching theobstacle. Minimum Crest-rate of vertical curvature of 290 or
more.Sag-rate of vertical curvature of 150 ormore.
Crest-rate of vertical curvature of 190 ormore.Sag-rate of vertical curvature of 120 ormore.
Desirable No more than 2° 00’ of curvature No more than 3° 00’ of curvatureHorizontal Curvature –Avoid sharp curves so travel can be made safely at designspeeds. Minimum No more than 2° 45’ of curvature No more than 4° 15’ of curvature
Vertical Alignment (Grade) –Avoid steep grades to maximize sight distance, permit designspeeds to be achieved by all types of vehicles, and minimizevariations in vehicle speeds. Provide some grade to facilitatedrainage.
Desirable/Minimum No more than 2.5% and no less than 0.5% No more than 3.0% and no less than 0.5%
Lane Width –Provide adequate width of travel lane to allow for safe andcomfortable driving.
Desirable/Minimum 12 feet 12 feet
Desirable 12 feet 12 feetShoulder Width –Provide adequate width to shelter a stopped vehicle Minimum 10 feet 10 feet
Desirable Route continuity and lane balanceachieved
Route continuity and lane balanceachieved
Lane Balance and Route Continuity –Lane balance would maintain the number of lanes provided over afreeway, and particularly the number of lanes provided throughinterchanges would be consistent with the number of lanesapproaching the interchange. Route continuity would provide adirectional path through an interchange which delineates themajor route and minimizes the need for lane changes to follow themajor route.
Minimum Route continuity not achieved, but lanebalance achieved
Route continuity not achieved, but lanebalance achieved
Entrance/Exit Ramp Spacing –Provide adequate distance between freeway ramps measuredfrom ramp nose to ramp nose to allow traffic to merge with, anddiverge from, the freeway mainline without impeding adjacentfreeway ramp traffic or freeway mainline traffic.
Desirable/Minimum 2400 feet or more 2400 feet or more
2a
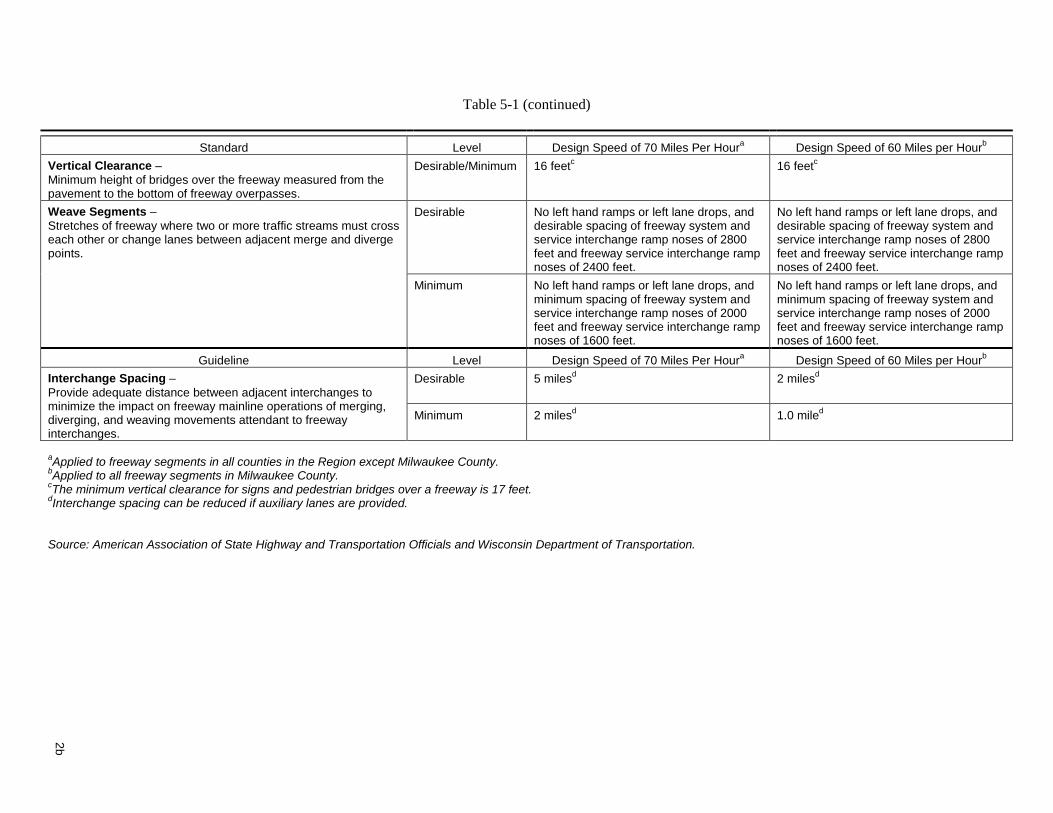
Table 5-1 (continued)
Standard Level Design Speed of 70 Miles Per Houra Design Speed of 60 Miles per Hourb
Vertical Clearance –Minimum height of bridges over the freeway measured from thepavement to the bottom of freeway overpasses.
Desirable/Minimum 16 feetc 16 feetc
Desirable No left hand ramps or left lane drops, anddesirable spacing of freeway system andservice interchange ramp noses of 2800feet and freeway service interchange rampnoses of 2400 feet.
No left hand ramps or left lane drops, anddesirable spacing of freeway system andservice interchange ramp noses of 2800feet and freeway service interchange rampnoses of 2400 feet.
Weave Segments –Stretches of freeway where two or more traffic streams must crosseach other or change lanes between adjacent merge and divergepoints.
Minimum No left hand ramps or left lane drops, andminimum spacing of freeway system andservice interchange ramp noses of 2000feet and freeway service interchange rampnoses of 1600 feet.
No left hand ramps or left lane drops, andminimum spacing of freeway system andservice interchange ramp noses of 2000feet and freeway service interchange rampnoses of 1600 feet.
Guideline Level Design Speed of 70 Miles Per Houra Design Speed of 60 Miles per Hourb
Desirable 5 milesd 2 milesdInterchange Spacing –Provide adequate distance between adjacent interchanges tominimize the impact on freeway mainline operations of merging,diverging, and weaving movements attendant to freewayinterchanges.
Minimum 2 milesd 1.0 miled
aApplied to freeway segments in all counties in the Region except Milwaukee County.bApplied to all freeway segments in Milwaukee County.cThe minimum vertical clearance for signs and pedestrian bridges over a freeway is 17 feet.dInterchange spacing can be reduced if auxiliary lanes are provided.
Source: American Association of State Highway and Transportation Officials and Wisconsin Department of Transportation.
2b
3
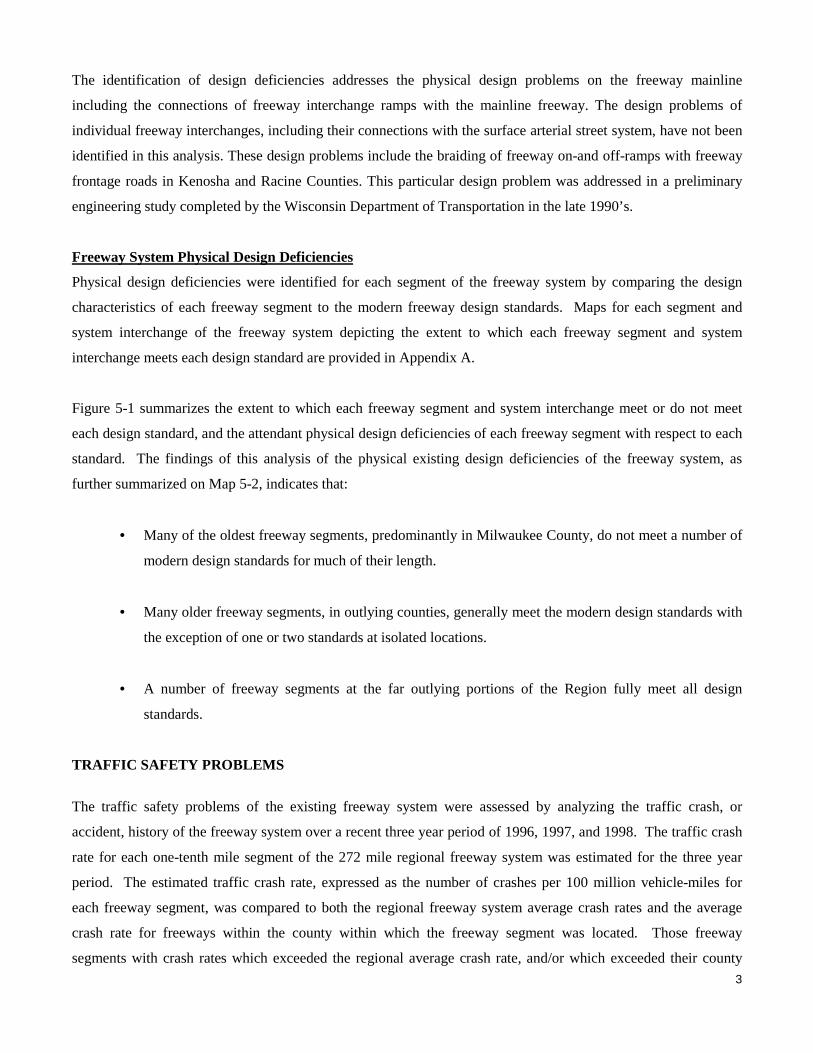
The identification of design deficiencies addresses the physical design problems on the freeway mainline
including the connections of freeway interchange ramps with the mainline freeway. The design problems of
individual freeway interchanges, including their connections with the surface arterial street system, have not been
identified in this analysis. These design problems include the braiding of freeway on-and off-ramps with freeway
frontage roads in Kenosha and Racine Counties. This particular design problem was addressed in a preliminary
engineering study completed by the Wisconsin Department of Transportation in the late 1990’s.
Freeway System Physical Design Deficiencies
Physical design deficiencies were identified for each segment of the freeway system by comparing the design
characteristics of each freeway segment to the modern freeway design standards. Maps for each segment and
system interchange of the freeway system depicting the extent to which each freeway segment and system
interchange meets each design standard are provided in Appendix A.
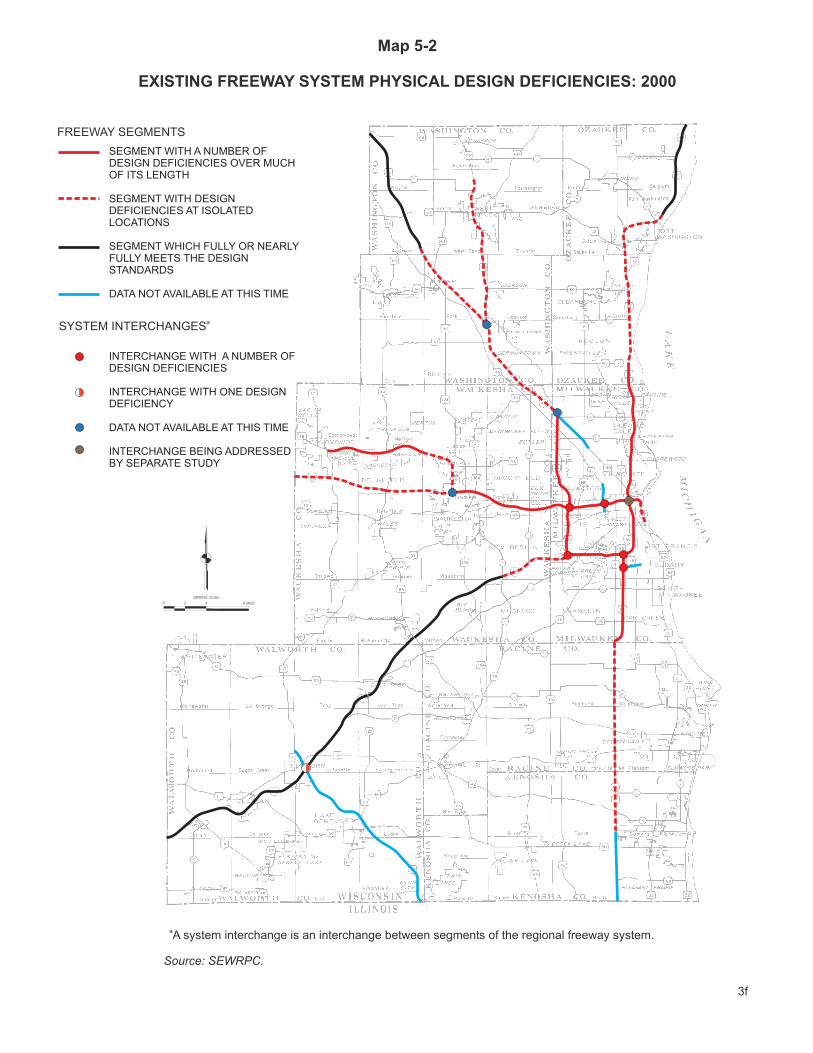
Figure 5-1 summarizes the extent to which each freeway segment and system interchange meet or do not meet
each design standard, and the attendant physical design deficiencies of each freeway segment with respect to each
standard. The findings of this analysis of the physical existing design deficiencies of the freeway system, as
further summarized on Map 5-2, indicates that:
• Many of the oldest freeway segments, predominantly in Milwaukee County, do not meet a number of
modern design standards for much of their length.
• Many older freeway segments, in outlying counties, generally meet the modern design standards with
the exception of one or two standards at isolated locations.
• A number of freeway segments at the far outlying portions of the Region fully meet all design
standards.
TRAFFIC SAFETY PROBLEMS
The traffic safety problems of the existing freeway system were assessed by analyzing the traffic crash, or
accident, history of the freeway system over a recent three year period of 1996, 1997, and 1998. The traffic crash
rate for each one-tenth mile segment of the 272 mile regional freeway system was estimated for the three year
period. The estimated traffic crash rate, expressed as the number of crashes per 100 million vehicle-miles for
each freeway segment, was compared to both the regional freeway system average crash rates and the average
crash rate for freeways within the county within which the freeway segment was located. Those freeway
segments with crash rates which exceeded the regional average crash rate, and/or which exceeded their county

Figure 5-1
SUMMARY OF PHYSICAL DESIGN DEFICIENCIES OF THE FREEWAY SYSTEM OF SOUTHEASTERN WISCONSINa
KEY: The portion of a cell colored a specific color represents the approximate proportion of the segment’slength classified as meeting or not meeting desirable and minimum standards.
MeetsDesirableStandard
MeetsMinimumStandard
Does NotMeet EitherStandard
Data Not Availableat this Time
Not Applicableto SystemInterchanges
Freeway Segment Approximate Extent of Freeway Segment Meeting or Not Meeting Desirable and Minimum StandardsReferenceNumber
(See MapA-1)
Facility/Facilities Description
VerticalCurvature
HorizontalCurvature
VerticalAlignment(Grade)
ShoulderWidth
LaneBalance
and RouteContinuity
VerticalClearanceb
Entrance/Exit RampSpacing Lane Width
WeaveSegments
1 IH 94 IllinoisState Line toSTH 158
2 IH 94 STH 20 toSTH 158
3 IH 94 Racine/MilwaukeeCo. Line toSTH 20
4 IH 94 MitchellInterchangeto RacineCo. Line
5 IH 43/94 MarquetteInterchangeto MitchellInterchange
6 IH 894 HaleInterchangeto MitchellInterchange
7 IH 894 ZooInterchangeto HaleInterchange
8 IH 94 ZooInterchangeto MarquetteInterchange
3a
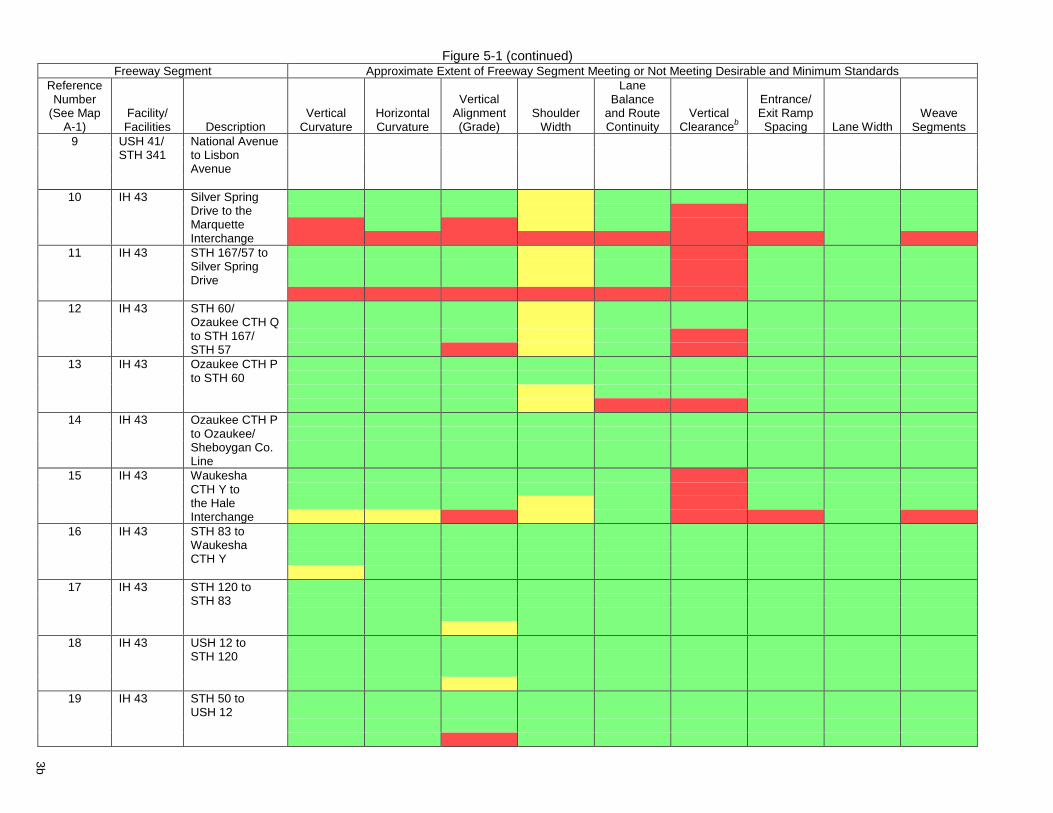
Figure 5-1 (continued)Freeway Segment Approximate Extent of Freeway Segment Meeting or Not Meeting Desirable and Minimum Standards
ReferenceNumber
(See MapA-1)
Facility/Facilities Description
VerticalCurvature
HorizontalCurvature
VerticalAlignment(Grade)
ShoulderWidth
LaneBalance
and RouteContinuity
VerticalClearanceb
Entrance/Exit RampSpacing Lane Width
WeaveSegments
9 USH 41/ National AvenueSTH 341 to Lisbon
Avenue
10 IH 43 Silver SpringDrive to theMarquetteInterchange
11 IH 43 STH 167/57 toSilver SpringDrive
12 IH 43 STH 60/Ozaukee CTH Qto STH 167/STH 57
13 IH 43 Ozaukee CTH Pto STH 60
14 IH 43 Ozaukee CTH Pto Ozaukee/Sheboygan Co.Line
15 IH 43 WaukeshaCTH Y tothe HaleInterchange
16 IH 43 STH 83 toWaukeshaCTH Y
17 IH 43 STH 120 toSTH 83
18 IH 43 USH 12 toSTH 120
19 IH 43 STH 50 toUSH 12
3b

Figure 5-1 (continued)Freeway Segment Approximate Extent of Freeway Segment Meeting or Not Meeting Desirable and Minimum Standards
ReferenceNumber
(See MapA-1)
Facility/Facilities Description
VerticalCurvature
HorizontalCurvature
VerticalAlignment(Grade)
ShoulderWidth
LaneBalance
and RouteContinuity
VerticalClearanceb
Entrance/Exit RampSpacing Lane Width
WeaveSegments
20 IH 43 Walworth/ RockCo. Line toSTH 50
21 USH 12 IH 43 toSTH 120
22 USH 12 STH 120 toIllinois StateLine
23 IH 94 WaukeshaCTH Y to theZooInterchange
24 IH 94 STH 16 toWaukeshaCTH Y
24a IH 94 STH 83 toWaukeshaSTH 16
25 IH 94 Jefferson/Waukesha Co.Line to STH 83
26 STH 16 WaukeshaCTH KE to IH 94
27 STH 16 WaukeshaCTH KE toWaukeshaCTH R
28 USH 45 Zoo Interchangeto STH 100
29 USH 45 STH 100 toNorthInterchange
3c
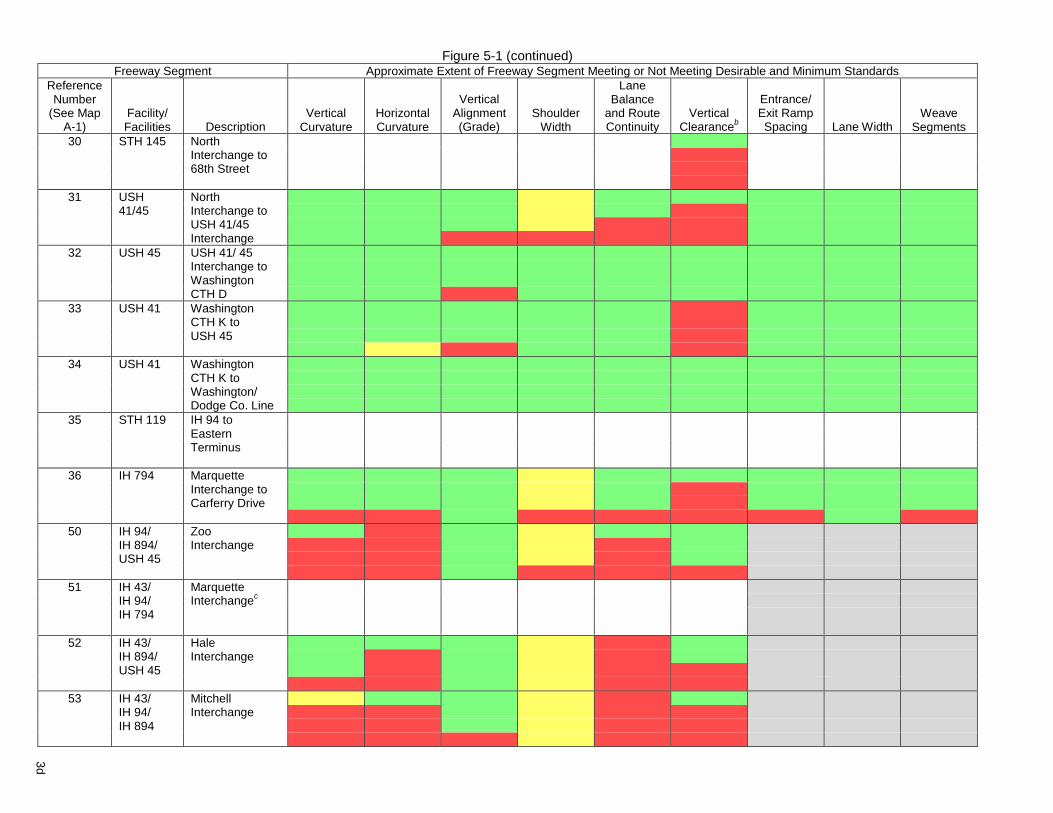
Figure 5-1 (continued)Freeway Segment Approximate Extent of Freeway Segment Meeting or Not Meeting Desirable and Minimum Standards
ReferenceNumber
(See MapA-1)
Facility/Facilities Description
VerticalCurvature
HorizontalCurvature
VerticalAlignment(Grade)
ShoulderWidth
LaneBalance
and RouteContinuity
VerticalClearanceb
Entrance/Exit RampSpacing Lane Width
WeaveSegments
30 STH 145 NorthInterchange to68th Street
31 USH North41/45 Interchange to
USH 41/45Interchange
32 USH 45 USH 41/ 45Interchange toWashingtonCTH D
33 USH 41 WashingtonCTH K toUSH 45
34 USH 41 WashingtonCTH K toWashington/Dodge Co. Line
35 STH 119 IH 94 toEasternTerminus
36 IH 794 MarquetteInterchange toCarferry Drive
50 IH 94/ ZooIH 894/ InterchangeUSH 45
51 IH 43/ MarquetteIH 94/ Interchangec
IH 794
52 IH 43/ HaleIH 894/ InterchangeUSH 45
53 IH 43/ MitchellIH 94/ InterchangeIH 894
3d

Figure 5-1 (continued)Freeway Segment Approximate Extent of Freeway Segment Meeting or Not Meeting Desirable and Minimum Standards
ReferenceNumber
(See MapA-1)
Facility/Facilities Description
VerticalCurvature
HorizontalCurvature
VerticalAlignment(Grade)
ShoulderWidth
LaneBalance
and RouteContinuity
VerticalClearanceb
Entrance/Exit RampSpacing Lane Width
WeaveSegments
54 USH 41/ NorthUSH 45/ InterchangeSTH 145
55 USH 41/ USH 41/USH 45 USH 45
Interchange
56 IH 94/ IH 94/STH 16 STH 16
Interchange
57 IH 43/ IH 43/ USH 12USH 12 Interchange
58 IH 94/ IH 84/ STH 119STH 119 Airport
Interchange
59 IH 94/ StadiumUSH 41/ InterchangeSTH 341
aIdentification of design deficiencies based on criteria included in Table 5-1. The extent of each of the freeway segment meeting or not meeting theminimum or desirable standards is displayed on the maps included in Appendix A.
bThe extent of each segment meeting or not meeting the minimum standard for vertical clearance applies only to the extent of structures present withineach segment.
cData for the Marquette Interchange is not presented here because that system interchange is being considered by a separate study.
Source: SEWRPC.
3e
Source: SEWRPC.
SEGMENT WITH A NUMBER OFDESIGN DEFICIENCIES OVER MUCHOF ITS LENGTH
SEGMENT WITH DESIGNDEFICIENCIES AT ISOLATEDLOCATIONS
SEGMENT WHICH FULLY OR NEARLYFULLY MEETS THE DESIGNSTANDARDS
DATA NOT AVAILABLE AT THIS TIME
INTERCHANGE WITH A NUMBER OFDESIGN DEFICIENCIES
INTERCHANGE WITH ONE DESIGNDEFICIENCY
INTERCHANGE BEING ADDRESSEDBY SEPARATE STUDY
DATA NOT AVAILABLE AT THIS TIME
FREEWAY SEGMENTS
SYSTEM INTERCHANGESa
Map 5-2
EXISTING FREEWAY SYSTEM PHYSICAL DESIGN DEFICIENCIES: 2000
3f
GRAPHIC SCALE
0 2 4 8 MILES
aA system interchange is an interchange between segments of the regional freeway system.
4
freeway average crash rate were considered to experience traffic safety problems which may warrant
consideration during the review of freeway redesign alternatives.
The average freeway crash rates within southeastern Wisconsin and within each of the seven counties of
southeastern Wisconsin are shown on Figure 5-2. Only the Milwaukee County freeway crash rate, 106 crashes
per 100 million vehicle-miles, is greater than the Region average freeway crash rate of 77 crashes per 100 million
vehicle-miles.
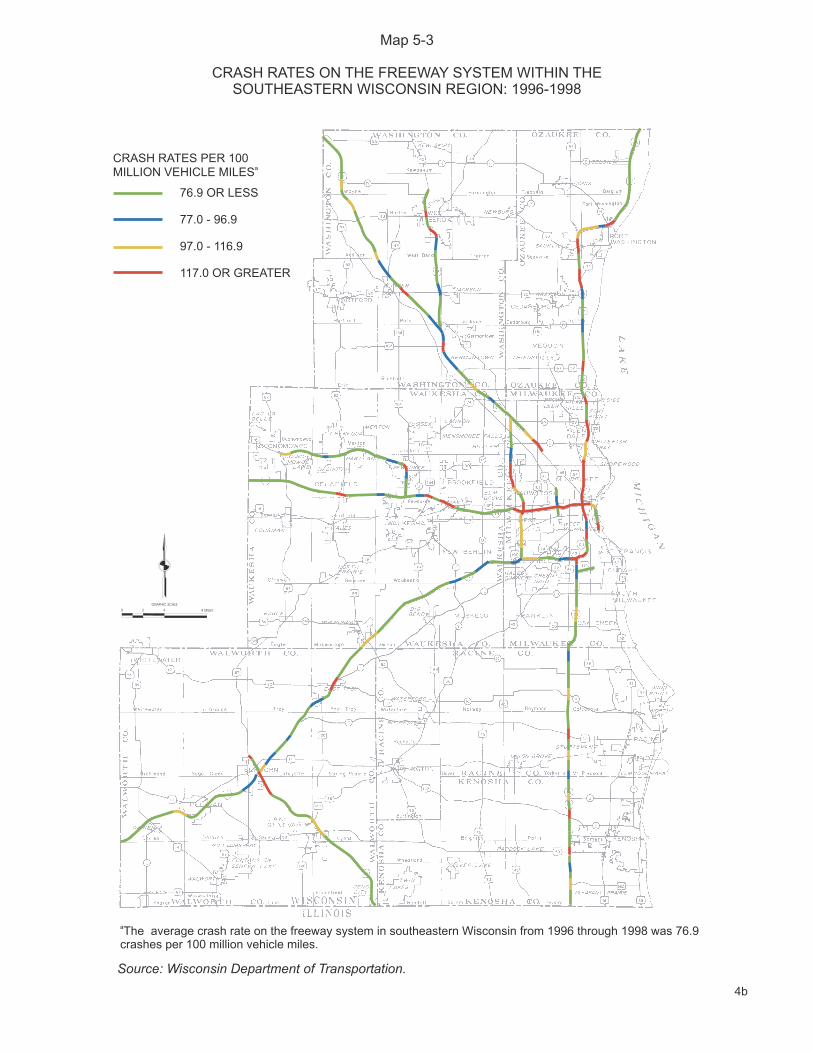
Map 5-3 displays those freeway segments within southeastern Wisconsin with average traffic crash rates which
exceed the regional average freeway crash rate. Within each county there are freeway segments which exceed the
regional average crash rate.
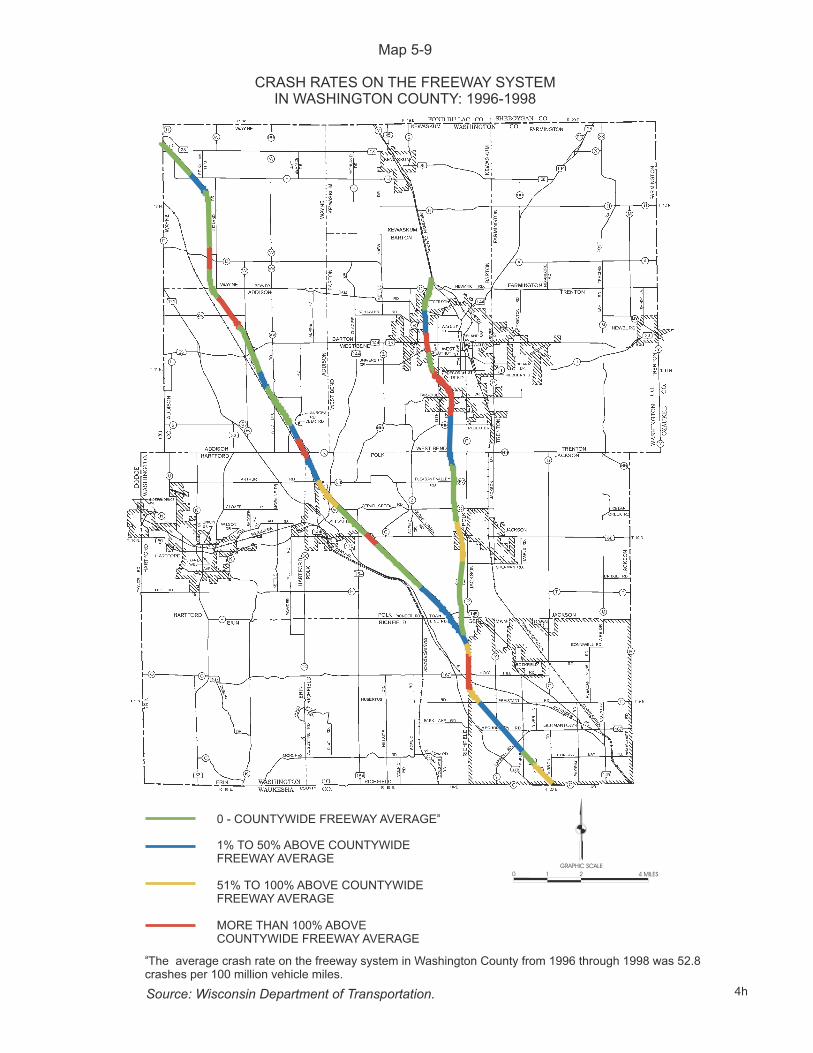
Maps 5-4 through 5-10 display for each of the seven counties those freeway segments which exceed the average
crash rate for freeways within each county.
Freeway segments with traffic crash problems may be considered to be those which exceed the regional freeway
system average crash rate and/or their county freeway system average crash rate.
The traffic crash rates for the southeastern Wisconsin freeway system may be compared to statewide highway
crash rates. The traffic crash rates for federal interstate freeways located in urban areas in Wisconsin is an
estimated 104 crashes per 100 million vehicle-miles, and for all other interstate freeways is 76 crashes per 100
million vehicle-miles.
TRAFFIC CONGESTION PROBLEMS
This section will document the existing traffic congestion on the freeway system of southeastern Wisconsin.
Historic levels of traffic congestion on the freeway system will also be presented for comparison to the existing
level and to document the historic trend in the growth of freeway traffic congestion in southeastern Wisconsin.
Also, the estimated current and historic levels of freeway system traffic congestion will be compared to forecast
future year 2020 levels of freeway traffic congestion.
Freeway traffic congestion can be classified into three levels as follows:
• Extreme Traffic Congestion—Freeway speeds of 20 to 30 miles per hour or less. Breakdown of freeway
traffic flow with stop-and-go, bumper-to-bumper traffic. No ability to maneuver or change lanes. Defined as
level of service “F”.
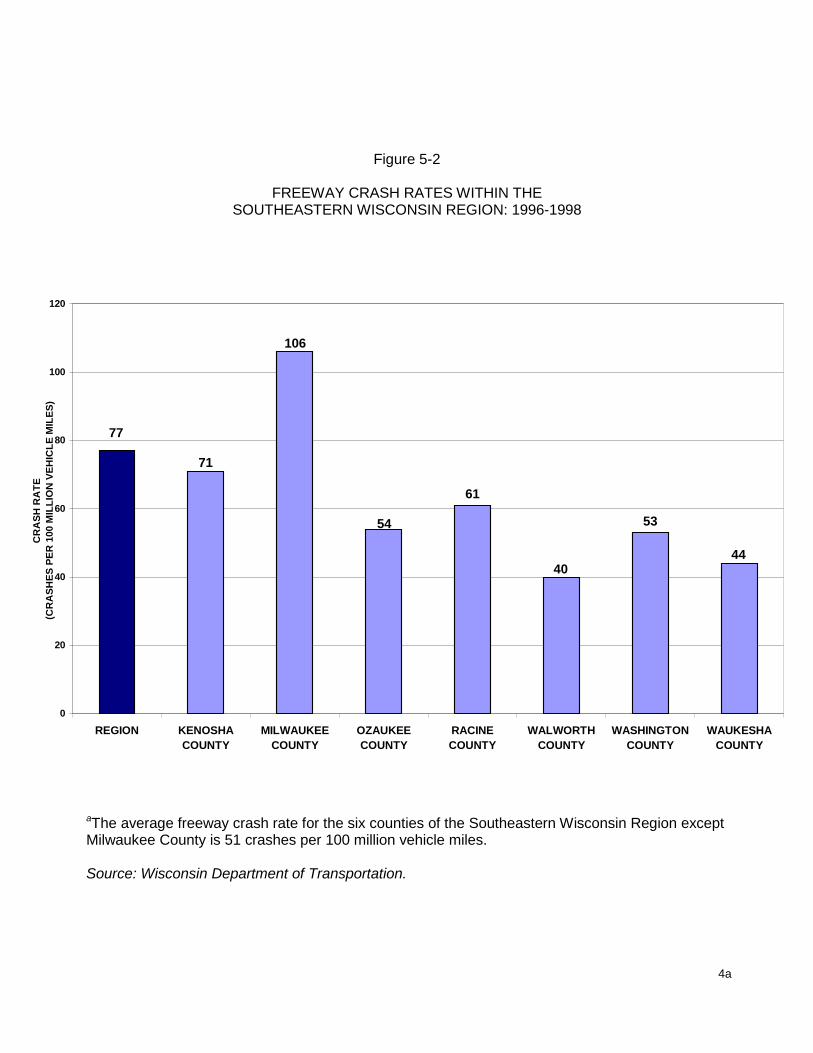
Figure 5-2
FREEWAY CRASH RATES WITHIN THESOUTHEASTERN WISCONSIN REGION: 1996-1998
aThe average freeway crash rate for the six counties of the Southeastern Wisconsin Region exceptMilwaukee County is 51 crashes per 100 million vehicle miles.
Source: Wisconsin Department of Transportation.
77
71
106
54
61
40
53
44
0
20
40
60
80
100
120
REGION KENOSHACOUNTY
MILWAUKEECOUNTY
OZAUKEECOUNTY
RACINECOUNTY
WALWORTHCOUNTY
WASHINGTONCOUNTY
WAUKESHACOUNTY
CR
ASH
RA
TE(C
RA
SHES
PER
100
MIL
LIO
N V
EHIC
LE M
ILES
)
4a
Source: Wisconsin Department of Transportation.
CRASH RATES PER 100MILLION VEHICLE MILES
a
76.9 OR LESS
77.0 - 96.9
97.0 - 116.9
117.0 OR GREATER
Map 5-3
CRASH RATES ON THE FREEWAY SYSTEM WITHIN THESOUTHEASTERN WISCONSIN REGION: 1996-1998
4b
GRAPHIC SCALE
0 2 4 8 MILES
aThe average crash rate on the freeway system in southeastern Wisconsin from 1996 through 1998 was 76.9crashes per 100 million vehicle miles.
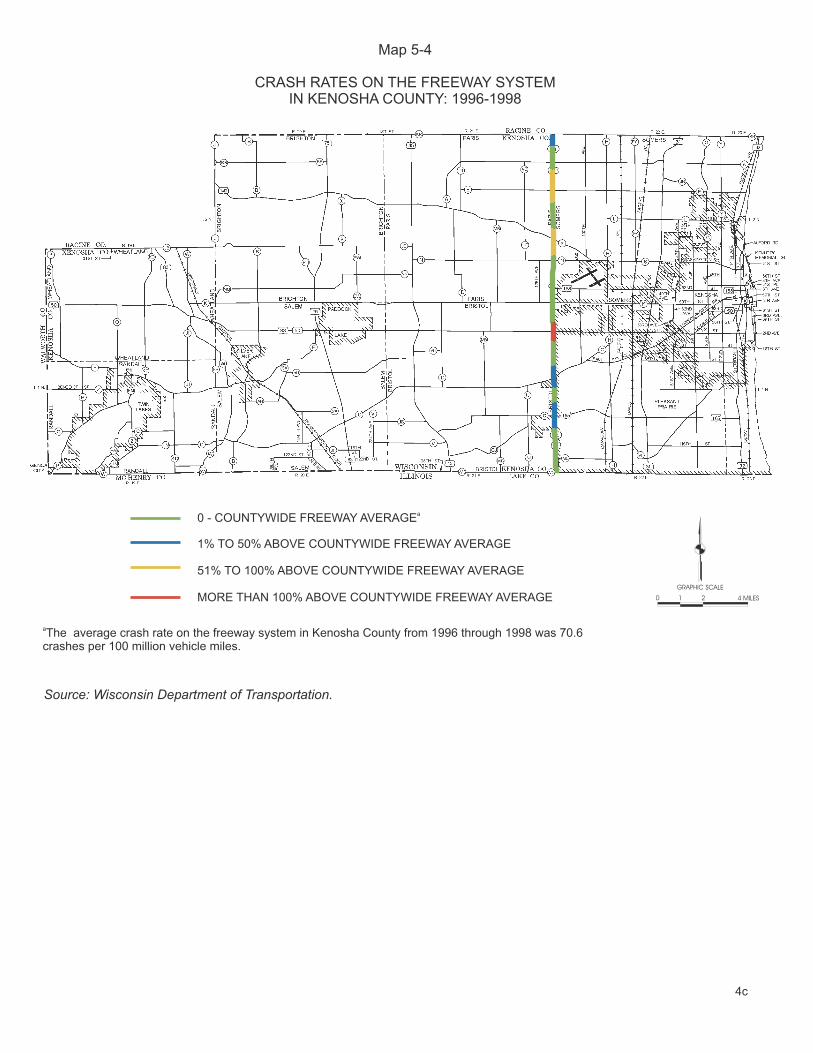
Map 5-4
CRASH RATES ON THE FREEWAY SYSTEMIN KENOSHA COUNTY: 1996-1998
0 - COUNTYWIDE FREEWAY AVERAGE
1% TO 50% ABOVE COUNTYWIDE FREEWAY AVERAGE
51% TO 100%
MORE THAN 100% ABOVE
a
ABOVE COUNTYWIDE FREEWAY AVERAGE
COUNTYWIDE FREEWAY AVERAGEGRAPHIC SCALE
0 21 4 MILES
Source: Wisconsin Department of Transportation.
aThe average crash rate on the freeway system in Kenosha County from 1996 through 1998 was 70.6crashes per 100 million vehicle miles.
4c
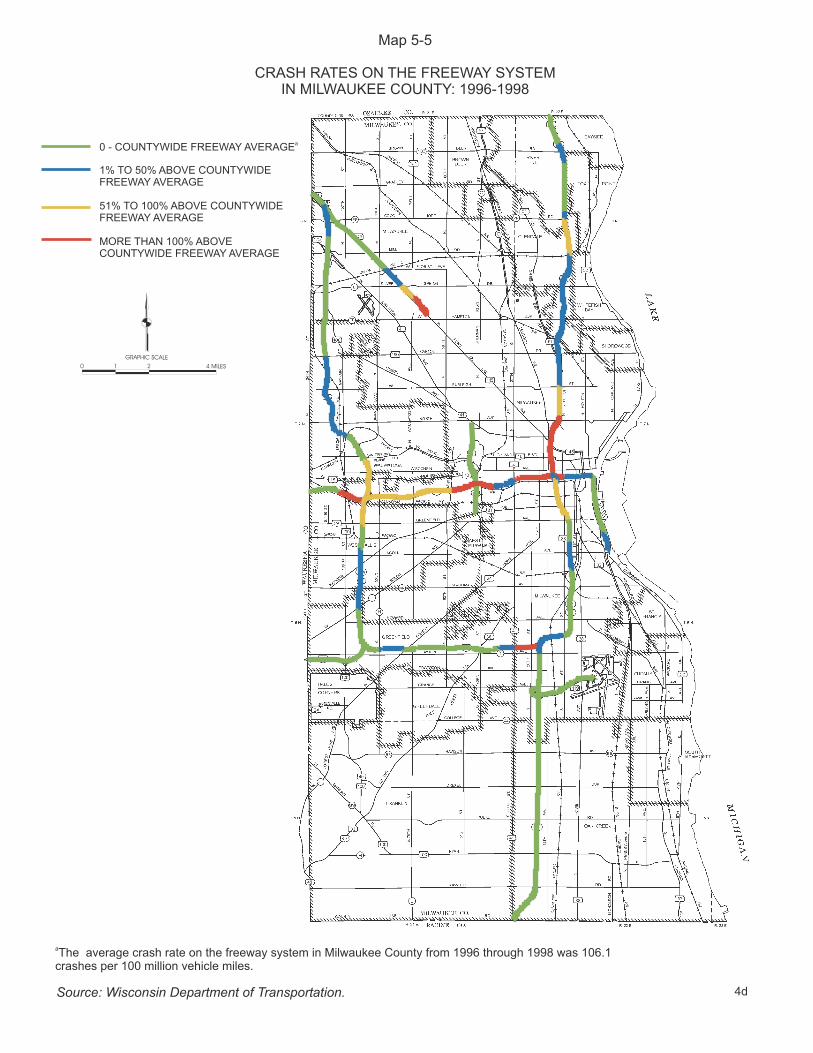
0 - COUNTYWIDE FREEWAY AVERAGE
1% TO 50% ABOVE COUNTYWIDEFREEWAY AVERAGE
51% TO 100%
MORE THAN 100% ABOVE
a
ABOVE COUNTYWIDEFREEWAY AVERAGE
COUNTYWIDE FREEWAY AVERAGE
GRAPHIC SCALE
0 21 4 MILES
Map 5-5
CRASH RATES ON THE FREEWAY SYSTEMIN MILWAUKEE COUNTY: 1996-1998
4dSource: Wisconsin Department of Transportation.
aThe average crash rate on the freeway system in Milwaukee County from 1996 through 1998 was 106.1crashes per 100 million vehicle miles.
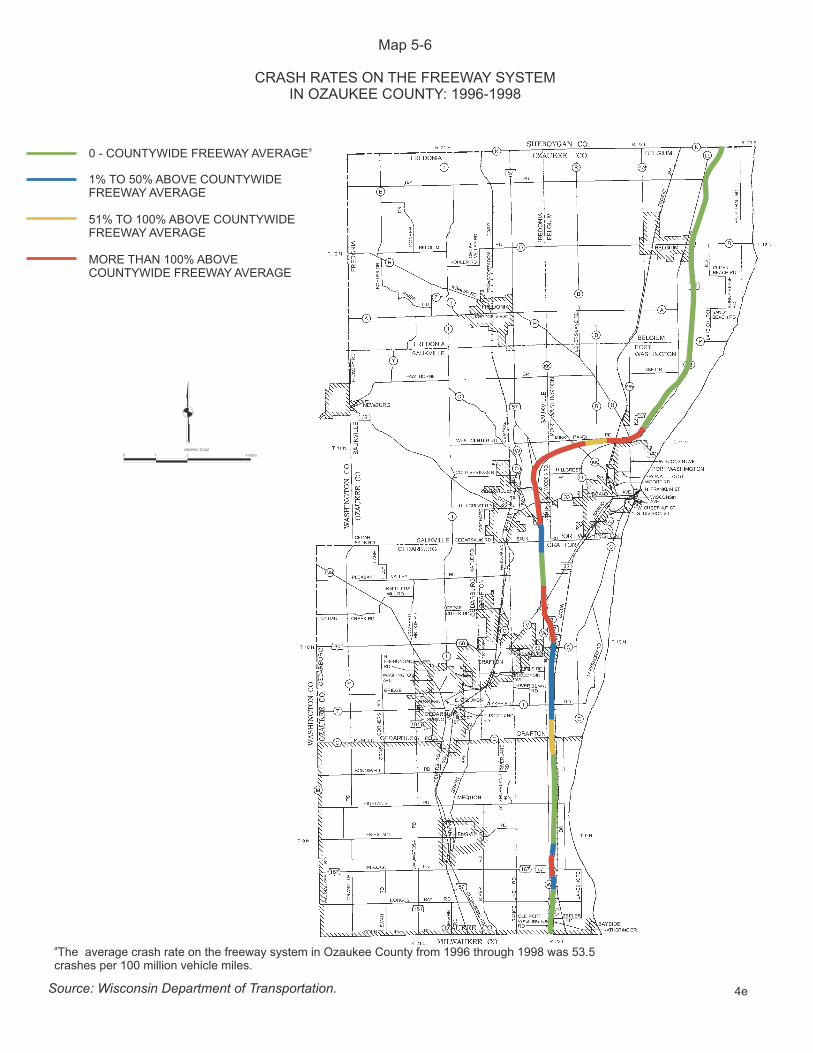
Map 5-6
CRASH RATES ON THE FREEWAY SYSTEMIN OZAUKEE COUNTY: 1996-1998
GRAPHIC SCALE
0 21 4 MILES
4e
0 - COUNTYWIDE FREEWAY AVERAGE
1% TO 50% ABOVE COUNTYWIDEFREEWAY AVERAGE
51% TO 100%
MORE THAN 100% ABOVE
a
ABOVE COUNTYWIDEFREEWAY AVERAGE
COUNTYWIDE FREEWAY AVERAGE
Source: Wisconsin Department of Transportation.
aThe average crash rate on the freeway system in Ozaukee County from 1996 through 1998 was 53.5crashes per 100 million vehicle miles.
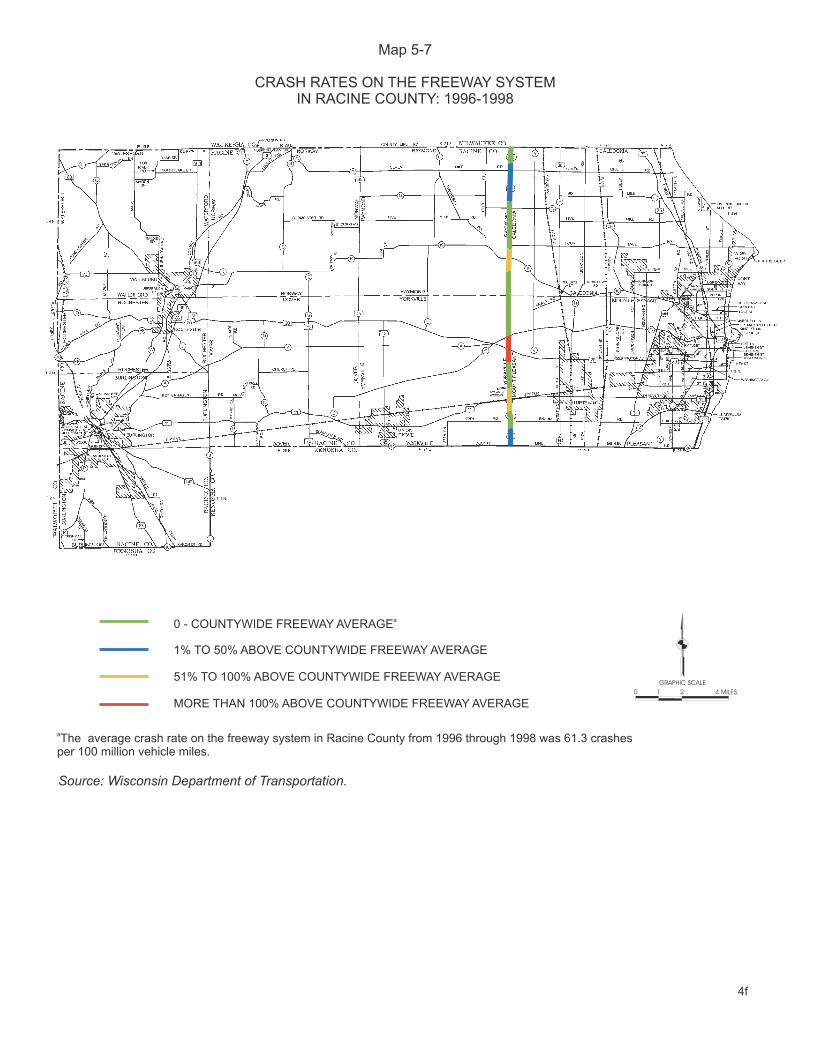
Map 5-7
CRASH RATES ON THE FREEWAY SYSTEMIN RACINE COUNTY: 1996-1998
GRAPHIC SCALE
0 21 4 MILES
0 - COUNTYWIDE FREEWAY AVERAGE
1% TO 50% ABOVE COUNTYWIDE FREEWAY AVERAGE
51% TO 100%
MORE THAN 100% ABOVE
a
ABOVE COUNTYWIDE FREEWAY AVERAGE
COUNTYWIDE FREEWAY AVERAGE
aThe average crash rate on the freeway system in Racine County from 1996 through 1998 was 61.3 crashesper 100 million vehicle miles.
Source: Wisconsin Department of Transportation.
4f
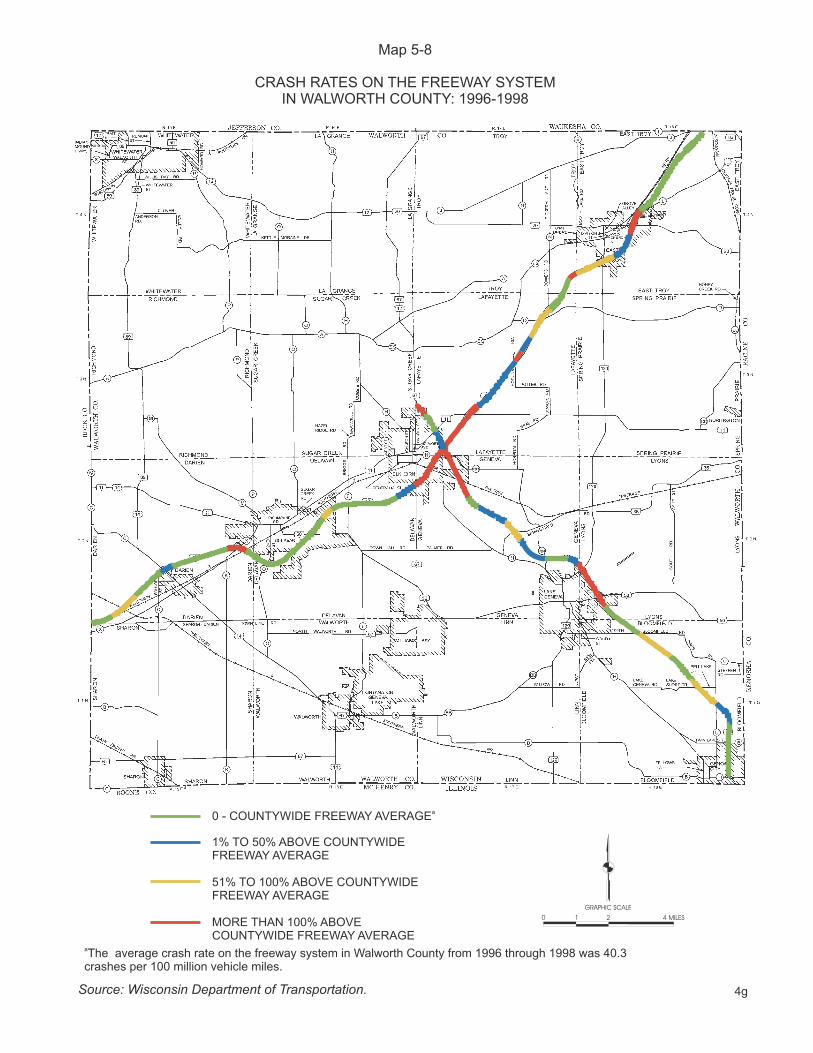
Map 5-8
CRASH RATES ON THE FREEWAY SYSTEMIN WALWORTH COUNTY: 1996-1998
0 - COUNTYWIDE FREEWAY AVERAGE
1% TO 50% ABOVE COUNTYWIDEFREEWAY AVERAGE
51% TO 100%
MORE THAN 100% ABOVE
a
ABOVE COUNTYWIDEFREEWAY AVERAGE
COUNTYWIDE FREEWAY AVERAGE
Source: Wisconsin Department of Transportation.
aThe average crash rate on the freeway system in Walworth County from 1996 through 1998 was 40.3crashes per 100 million vehicle miles.
GRAPHIC SCALE
0 1 2 4 MILES
4g
GRAPHIC SCALE
0 21 4 MILES
0 - COUNTYWIDE FREEWAY AVERAGE
1% TO 50% ABOVE COUNTYWIDEFREEWAY AVERAGE
51% TO 100%
MORE THAN 100% ABOVE
a
ABOVE COUNTYWIDEFREEWAY AVERAGE
COUNTYWIDE FREEWAY AVERAGE
Source: Wisconsin Department of Transportation.
aThe average crash rate on the freeway system in Washington County from 1996 through 1998 was 52.8crashes per 100 million vehicle miles.
Map 5-9
CRASH RATES ON THE FREEWAY SYSTEMIN WASHINGTON COUNTY: 1996-1998
4h

Map 5-10
CRASH RATES ON THE FREEWAY SYSTEMIN WAUKESHA COUNTY: 1996-1998
GRAPHIC SCALE
0 21 4 MILES
0 - COUNTYWIDE FREEWAY AVERAGE
1% TO 50% ABOVE COUNTYWIDEFREEWAY AVERAGE
51% TO 100%
MORE THAN 100% ABOVE
a
ABOVE COUNTYWIDEFREEWAY AVERAGE
COUNTYWIDE FREEWAY AVERAGE
Source: Wisconsin Department of Transportation.
aThe average crash rate on the freeway system in Waukesha County from 1996 through 1998 was 43.7crashes per 100 million vehicle miles.
4i
5
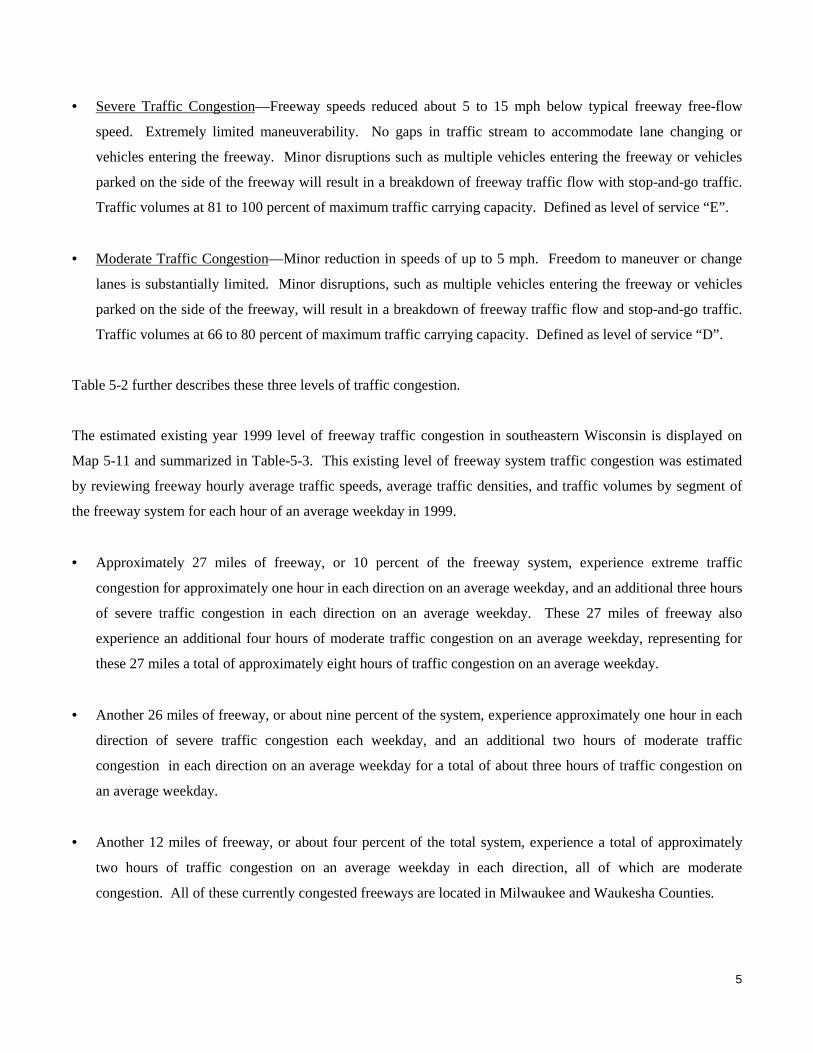
• Severe Traffic Congestion—Freeway speeds reduced about 5 to 15 mph below typical freeway free-flow
speed. Extremely limited maneuverability. No gaps in traffic stream to accommodate lane changing or
vehicles entering the freeway. Minor disruptions such as multiple vehicles entering the freeway or vehicles
parked on the side of the freeway will result in a breakdown of freeway traffic flow with stop-and-go traffic.
Traffic volumes at 81 to 100 percent of maximum traffic carrying capacity. Defined as level of service “E”.
• Moderate Traffic Congestion—Minor reduction in speeds of up to 5 mph. Freedom to maneuver or change
lanes is substantially limited. Minor disruptions, such as multiple vehicles entering the freeway or vehicles
parked on the side of the freeway, will result in a breakdown of freeway traffic flow and stop-and-go traffic.
Traffic volumes at 66 to 80 percent of maximum traffic carrying capacity. Defined as level of service “D”.
Table 5-2 further describes these three levels of traffic congestion.
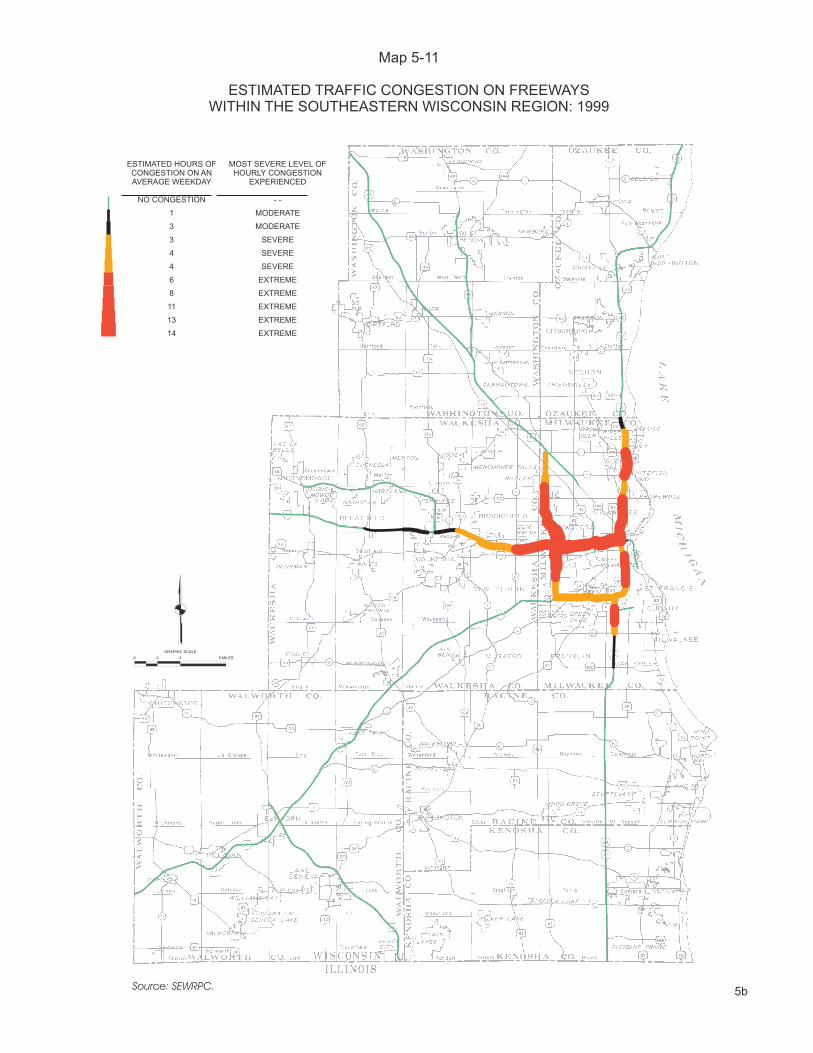
The estimated existing year 1999 level of freeway traffic congestion in southeastern Wisconsin is displayed on
Map 5-11 and summarized in Table-5-3. This existing level of freeway system traffic congestion was estimated
by reviewing freeway hourly average traffic speeds, average traffic densities, and traffic volumes by segment of
the freeway system for each hour of an average weekday in 1999.
• Approximately 27 miles of freeway, or 10 percent of the freeway system, experience extreme traffic
congestion for approximately one hour in each direction on an average weekday, and an additional three hours
of severe traffic congestion in each direction on an average weekday. These 27 miles of freeway also
experience an additional four hours of moderate traffic congestion on an average weekday, representing for
these 27 miles a total of approximately eight hours of traffic congestion on an average weekday.
• Another 26 miles of freeway, or about nine percent of the system, experience approximately one hour in each
direction of severe traffic congestion each weekday, and an additional two hours of moderate traffic
congestion in each direction on an average weekday for a total of about three hours of traffic congestion on
an average weekday.
• Another 12 miles of freeway, or about four percent of the total system, experience a total of approximately
two hours of traffic congestion on an average weekday in each direction, all of which are moderate
congestion. All of these currently congested freeways are located in Milwaukee and Waukesha Counties.
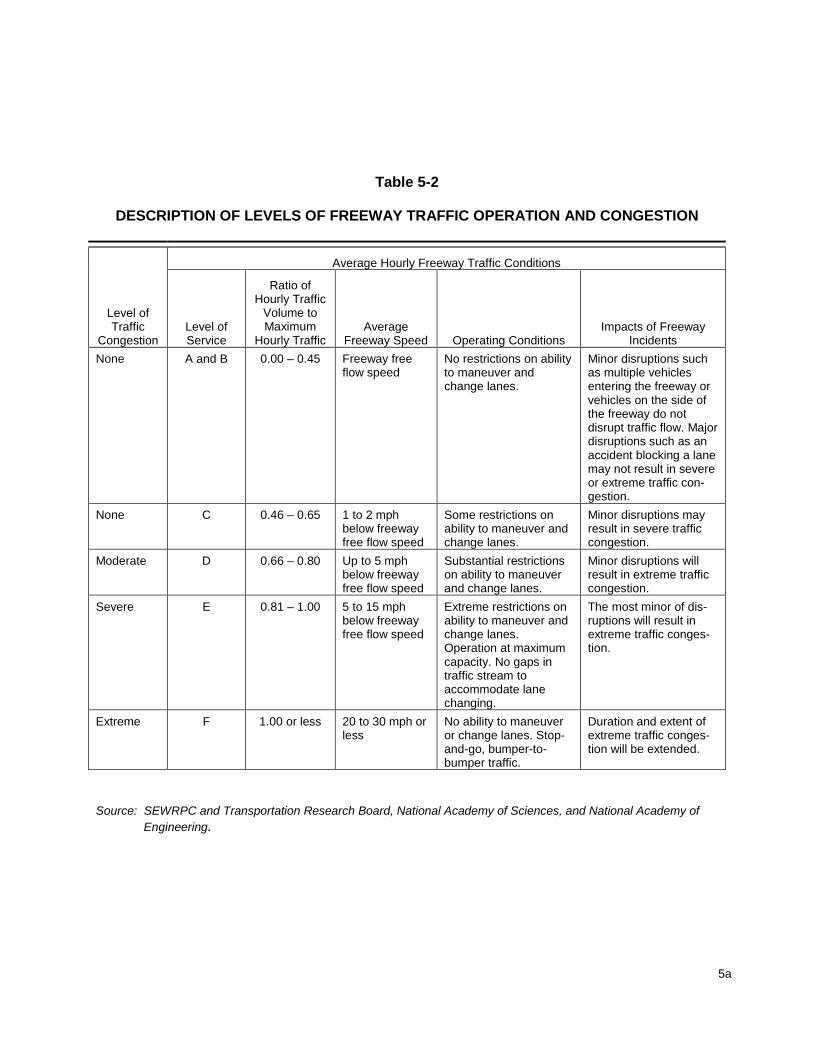
Table 5-2
DESCRIPTION OF LEVELS OF FREEWAY TRAFFIC OPERATION AND CONGESTION
Average Hourly Freeway Traffic Conditions
Level ofTraffic
CongestionLevel ofService
Ratio ofHourly Traffic
Volume toMaximum
Hourly TrafficAverage
Freeway Speed Operating ConditionsImpacts of Freeway
IncidentsNone A and B 0.00 – 0.45 Freeway free
flow speedNo restrictions on abilityto maneuver andchange lanes.
Minor disruptions suchas multiple vehiclesentering the freeway orvehicles on the side ofthe freeway do notdisrupt traffic flow. Majordisruptions such as anaccident blocking a lanemay not result in severeor extreme traffic con-gestion.
None C 0.46 – 0.65 1 to 2 mphbelow freewayfree flow speed
Some restrictions onability to maneuver andchange lanes.
Minor disruptions mayresult in severe trafficcongestion.
Moderate D 0.66 – 0.80 Up to 5 mphbelow freewayfree flow speed
Substantial restrictionson ability to maneuverand change lanes.
Minor disruptions willresult in extreme trafficcongestion.
Severe E 0.81 – 1.00 5 to 15 mphbelow freewayfree flow speed
Extreme restrictions onability to maneuver andchange lanes.Operation at maximumcapacity. No gaps intraffic stream toaccommodate lanechanging.
The most minor of dis-ruptions will result inextreme traffic conges-tion.
Extreme F 1.00 or less 20 to 30 mph orless
No ability to maneuveror change lanes. Stop-and-go, bumper-to-bumper traffic.
Duration and extent ofextreme traffic conges-tion will be extended.
Source: SEWRPC and Transportation Research Board, National Academy of Sciences, and National Academy ofEngineering.
5a
GRAPHIC SCALE
0 2 4 8 MILES
Source: SEWRPC.
ESTIMATED HOURS OFCONGESTION ON ANAVERAGE WEEKDAY
NO CONGESTION
1
3
3
4
4
6
8
11
13
14
MOST SEVERE LEVEL OFHOURLY CONGESTION
EXPERIENCED
- -
MODERATE
MODERATE
SEVERE
SEVERE
SEVERE
EXTREME
EXTREME
EXTREME
EXTREME
EXTREME
Map 5-11
ESTIMATED TRAFFIC CONGESTION ON FREEWAYSWITHIN THE SOUTHEASTERN WISCONSIN REGION: 1999
5b
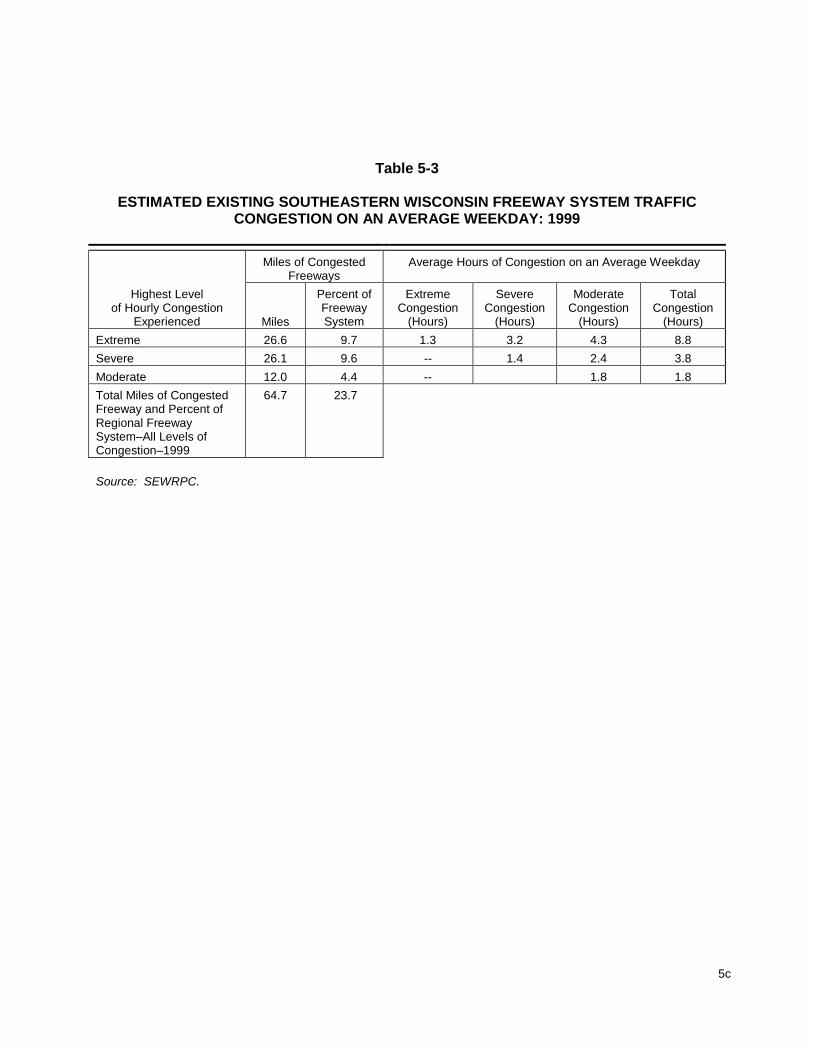
Table 5-3
ESTIMATED EXISTING SOUTHEASTERN WISCONSIN FREEWAY SYSTEM TRAFFICCONGESTION ON AN AVERAGE WEEKDAY: 1999
Miles of CongestedFreeways
Average Hours of Congestion on an Average Weekday
Highest Levelof Hourly Congestion
Experienced Miles
Percent ofFreewaySystem
ExtremeCongestion
(Hours)
SevereCongestion
(Hours)
ModerateCongestion
(Hours)
TotalCongestion
(Hours)Extreme 26.6 9.7 1.3 3.2 4.3 8.8Severe 26.1 9.6 -- 1.4 2.4 3.8Moderate 12.0 4.4 -- 1.8 1.8Total Miles of CongestedFreeway and Percent ofRegional FreewaySystem–All Levels ofCongestion–1999
64.7 23.7
Source: SEWRPC.
5c
6
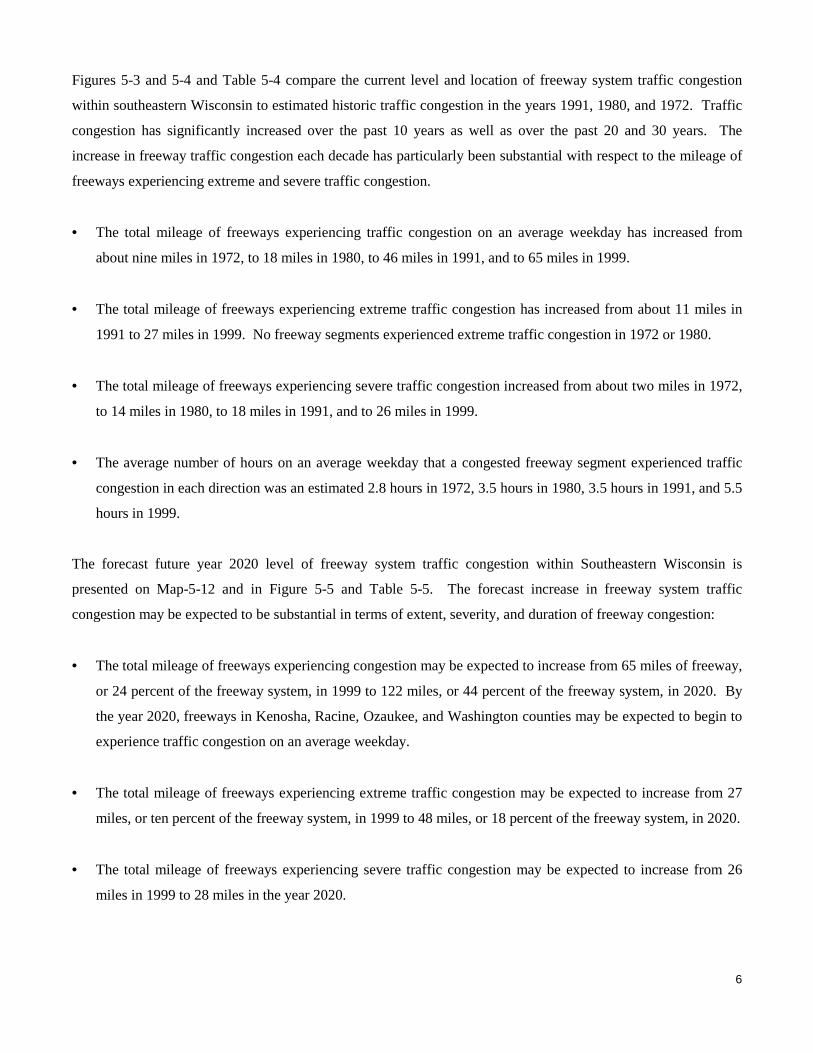
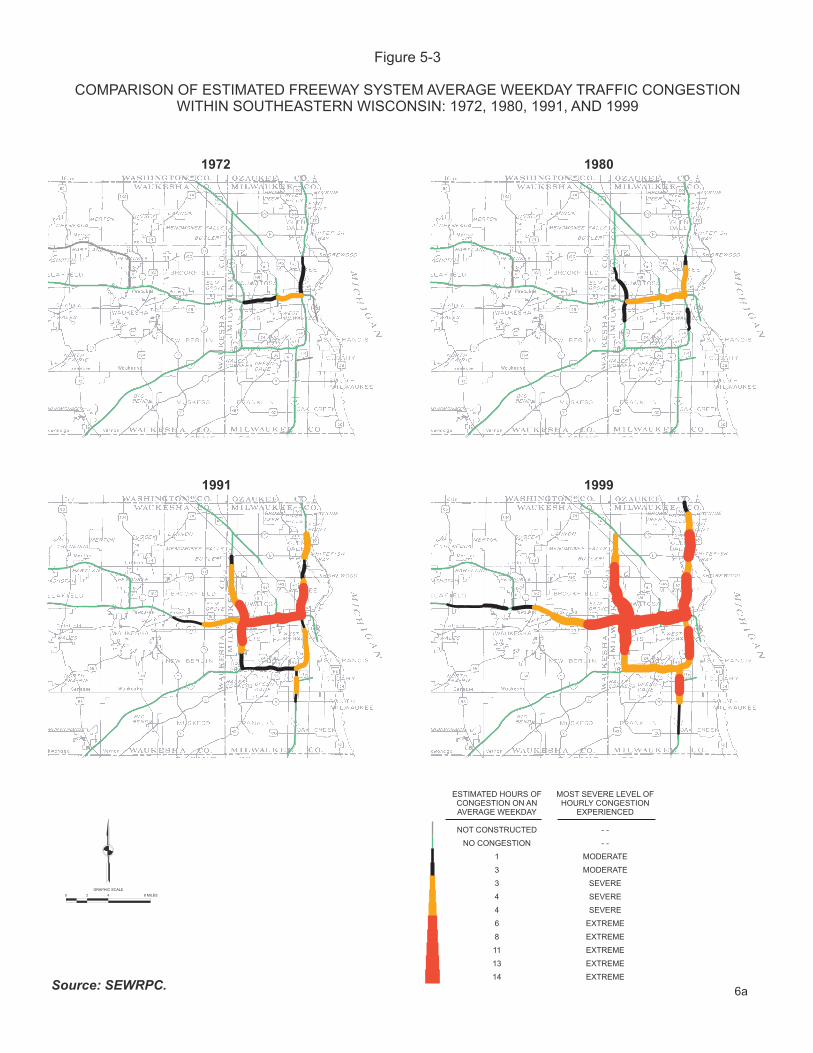
Figures 5-3 and 5-4 and Table 5-4 compare the current level and location of freeway system traffic congestion
within southeastern Wisconsin to estimated historic traffic congestion in the years 1991, 1980, and 1972. Traffic
congestion has significantly increased over the past 10 years as well as over the past 20 and 30 years. The
increase in freeway traffic congestion each decade has particularly been substantial with respect to the mileage of
freeways experiencing extreme and severe traffic congestion.
• The total mileage of freeways experiencing traffic congestion on an average weekday has increased from
about nine miles in 1972, to 18 miles in 1980, to 46 miles in 1991, and to 65 miles in 1999.
• The total mileage of freeways experiencing extreme traffic congestion has increased from about 11 miles in
1991 to 27 miles in 1999. No freeway segments experienced extreme traffic congestion in 1972 or 1980.
• The total mileage of freeways experiencing severe traffic congestion increased from about two miles in 1972,
to 14 miles in 1980, to 18 miles in 1991, and to 26 miles in 1999.
• The average number of hours on an average weekday that a congested freeway segment experienced traffic
congestion in each direction was an estimated 2.8 hours in 1972, 3.5 hours in 1980, 3.5 hours in 1991, and 5.5
hours in 1999.
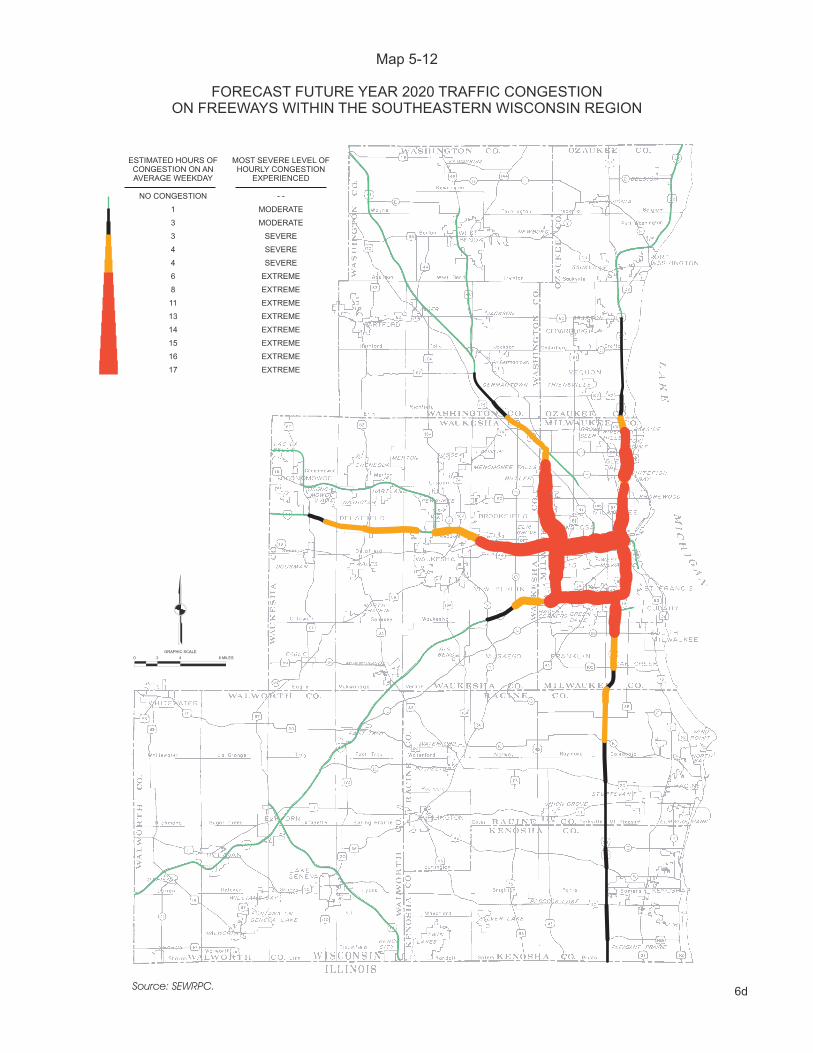
The forecast future year 2020 level of freeway system traffic congestion within Southeastern Wisconsin is
presented on Map-5-12 and in Figure 5-5 and Table 5-5. The forecast increase in freeway system traffic
congestion may be expected to be substantial in terms of extent, severity, and duration of freeway congestion:
• The total mileage of freeways experiencing congestion may be expected to increase from 65 miles of freeway,
or 24 percent of the freeway system, in 1999 to 122 miles, or 44 percent of the freeway system, in 2020. By
the year 2020, freeways in Kenosha, Racine, Ozaukee, and Washington counties may be expected to begin to
experience traffic congestion on an average weekday.
• The total mileage of freeways experiencing extreme traffic congestion may be expected to increase from 27
miles, or ten percent of the freeway system, in 1999 to 48 miles, or 18 percent of the freeway system, in 2020.
• The total mileage of freeways experiencing severe traffic congestion may be expected to increase from 26
miles in 1999 to 28 miles in the year 2020.
ESTIMATED HOURS OFCONGESTION ON ANAVERAGE WEEKDAY
NOT CONSTRUCTED
NO CONGESTION
1
3
3
4
4
6
8
11
13
14
MOST SEVERE LEVEL OFHOURLY CONGESTION
EXPERIENCED
- -
- -
MODERATE
MODERATE
SEVERE
SEVERE
SEVERE
EXTREME
EXTREME
EXTREME
EXTREME
EXTREME
Source: SEWRPC.
Figure 5-3
COMPARISON OF ESTIMATED FREEWAY SYSTEM AVERAGE WEEKDAY TRAFFIC CONGESTIONWITHIN SOUTHEASTERN WISCONSIN: 1972, 1980, 1991, AND 1999
1972 1980
1991 1999
6a
GRAPHIC SCALE
0 2 4 8 MILES

Figure 5-4
Source: SEWRPC.
0
10
20
30
40
50
60
70
1972 1980 1991 1999
YEAR
FREE
WA
Y M
ILES
MODERATE CONGESTION
SEVERE CONGESTION
EXTREME CONGESTION
COMPARISON OF ESTIMATED FREEWAY SYSTEM AVERAGE WEEKDAYTRAFFIC CONGESTION WITHIN SOUTHEASTERN WISCONSIN: 1972, 1980, 1991, AND 1999
6b
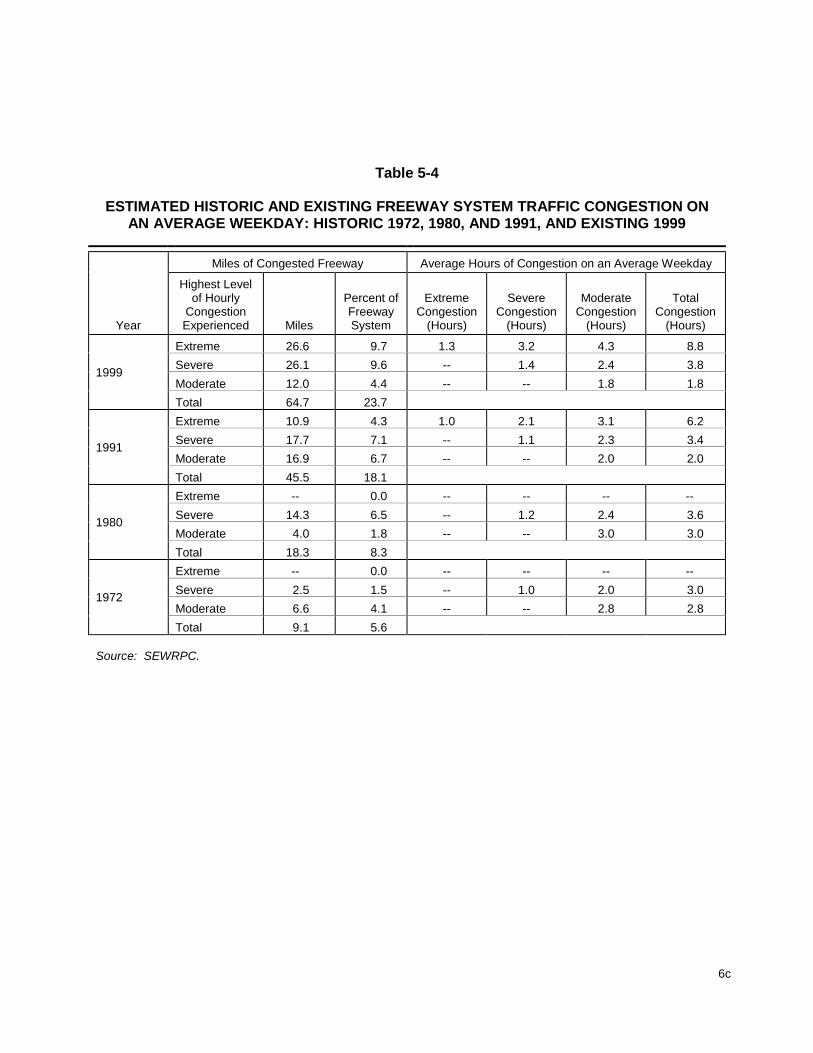
Table 5-4
ESTIMATED HISTORIC AND EXISTING FREEWAY SYSTEM TRAFFIC CONGESTION ONAN AVERAGE WEEKDAY: HISTORIC 1972, 1980, AND 1991, AND EXISTING 1999
Miles of Congested Freeway Average Hours of Congestion on an Average Weekday
Year
Highest Levelof Hourly
CongestionExperienced Miles
Percent ofFreewaySystem
ExtremeCongestion
(Hours)
SevereCongestion
(Hours)
ModerateCongestion
(Hours)
TotalCongestion
(Hours)
Extreme 26.6 9.7 1.3 3.2 4.3 8.8Severe 26.1 9.6 -- 1.4 2.4 3.8Moderate 12.0 4.4 -- -- 1.8 1.8
1999
Total 64.7 23.7Extreme 10.9 4.3 1.0 2.1 3.1 6.2Severe 17.7 7.1 -- 1.1 2.3 3.4Moderate 16.9 6.7 -- -- 2.0 2.0
1991
Total 45.5 18.1Extreme -- 0.0 -- -- -- --Severe 14.3 6.5 -- 1.2 2.4 3.6Moderate 4.0 1.8 -- -- 3.0 3.0
1980
Total 18.3 8.3Extreme -- 0.0 -- -- -- --Severe 2.5 1.5 -- 1.0 2.0 3.0Moderate 6.6 4.1 -- -- 2.8 2.8
1972
Total 9.1 5.6
Source: SEWRPC.
6c
GRAPHIC SCALE
0 2 4 8 MILES
Source: SEWRPC.
ESTIMATED HOURS OFCONGESTION ON ANAVERAGE WEEKDAY
NO CONGESTION
1
3
3
4
4
6
8
11
13
14
15
16
17
MOST SEVERE LEVEL OFHOURLY CONGESTION
EXPERIENCED
- -
MODERATE
MODERATE
SEVERE
SEVERE
SEVERE
EXTREME
EXTREME
EXTREME
EXTREME
EXTREME
EXTREME
EXTREME
EXTREME
Map 5-12
FORECAST FUTURE YEAR 2020 TRAFFIC CONGESTIONON FREEWAYS WITHIN THE SOUTHEASTERN WISCONSIN REGION
6d
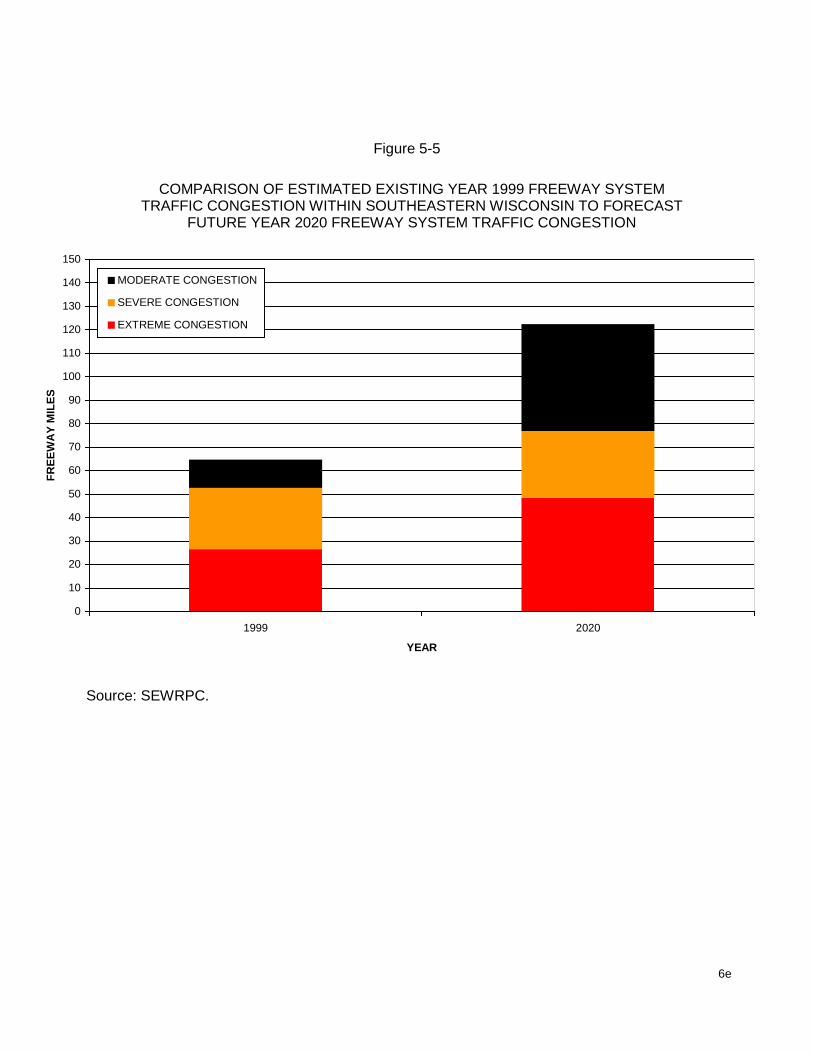
Figure 5-5
Source: SEWRPC.
COMPARISON OF ESTIMATED EXISTING YEAR 1999 FREEWAY SYSTEMTRAFFIC CONGESTION WITHIN SOUTHEASTERN WISCONSIN TO FORECAST
FUTURE YEAR 2020 FREEWAY SYSTEM TRAFFIC CONGESTION
0
10
20
30
40
50
60
70
80
90
100
110
120
130
140
150
1999 2020
YEAR
FREE
WA
Y M
ILES
MODERATE CONGESTION
SEVERE CONGESTION
EXTREME CONGESTION
6e

Table 5-5
COMPARISON OF ESTIMATED EXISTING YEAR 1999 FREEWAY SYSTEM TRAFFIC CONGESTIONWITHIN SOUTHEASTERN WISCONSIN TO FORECAST FUTURE YEAR 2020
FREEWAY SYSTEM TRAFFIC CONGESTION
Miles of Congested Freeway Average Hours of Congestion on an Average Weekday
Year
Highest Levelof Hourly
CongestionExperienced Miles
Percent ofFreewaySystem
ExtremeCongestion
(Hours)
SevereCongestion
(Hours)
ModerateCongestion
(Hours)
TotalCongestion
(Hours)
Extreme 48.4 17.4 2.0 4.1 5.4 11.5Severe 28.4 10.2 -- 1.3 2.2 3.5Moderate 45.6 16.4 -- -- 2.1 2.1
2020
Total 122.4 44.0Extreme 26.6 9.7 1.3 3.2 4.3 8.8Severe 26.1 9.6 -- 1.4 2.4 3.8Moderate 12.0 4.4 -- -- 1.8 1.8
1999
Total 64.7 23.7
Source: SEWRPC.
6f
7
• The total mileage of freeways experiencing moderate traffic congestion may be expected to increase from 12
miles, or four percent of the freeway system, in 1999 to 46 miles, or 16 percent of the system, in the year
2020.
• The average number of hours that a congested freeway segment may be expected to experience traffic
congestion may be expected to increase from 5.5 hours in 1999 to 6.1 hours in the year 2020.
The forecast year 2020 traffic congestion is based upon forecast year 2020 traffic volumes and transportation
facilities and services which assume implementation of the year 2020 regional land use plan and regional
transportation system plan, excepting only certain freeway widening improvements (the widening of IH 43 from
four to six lanes between Bender Road and Highland Road).
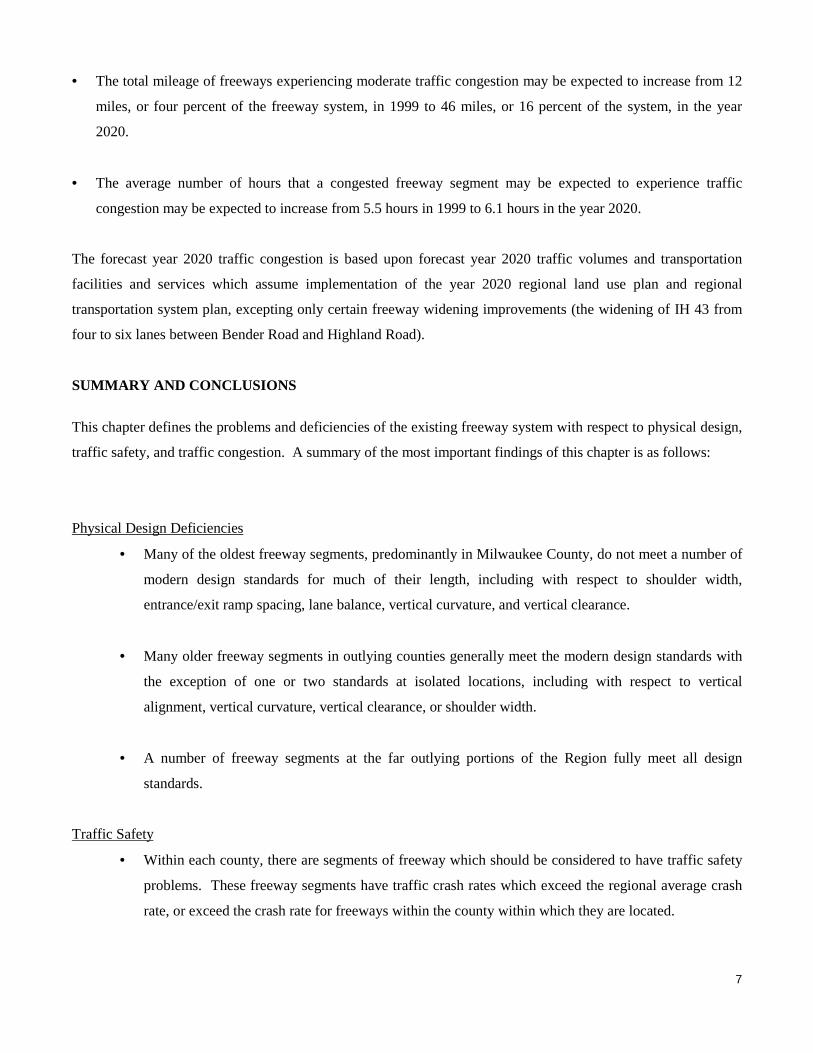
SUMMARY AND CONCLUSIONS
This chapter defines the problems and deficiencies of the existing freeway system with respect to physical design,
traffic safety, and traffic congestion. A summary of the most important findings of this chapter is as follows:
Physical Design Deficiencies
• Many of the oldest freeway segments, predominantly in Milwaukee County, do not meet a number of
modern design standards for much of their length, including with respect to shoulder width,
entrance/exit ramp spacing, lane balance, vertical curvature, and vertical clearance.
• Many older freeway segments in outlying counties generally meet the modern design standards with
the exception of one or two standards at isolated locations, including with respect to vertical
alignment, vertical curvature, vertical clearance, or shoulder width.
• A number of freeway segments at the far outlying portions of the Region fully meet all design
standards.
Traffic Safety
• Within each county, there are segments of freeway which should be considered to have traffic safety
problems. These freeway segments have traffic crash rates which exceed the regional average crash
rate, or exceed the crash rate for freeways within the county within which they are located.

8
Traffic Congestion
• Existing traffic congestion on the freeway system is substantial, with a total of 65 miles, or 24
percent, of the 272 mile freeway system experiencing congestion on an average weekday. An
estimated 53 miles, or 19 percent of the freeway system, experiences extreme or severe traffic
congestion for at least one hour each weekday.
• Freeway traffic congestion has increased particularly over the past 20 years, in extent, severity, and
duration of congestion. The extent of the freeway system experiencing congestion has increased from
18 miles, or eight percent of the total freeway system in 1980, to 45 miles and 18 percent in 1991, and
to 65 miles and 24 percent in 1999. The miles of freeway experiencing extreme or severe congestion
has increased from 14 miles and 7 percent of the freeway system in 1980, to 29 miles and 11 percent
in 1991, and to 53 miles and 19 percent in 1999. The average number of hours of congestion on an
average weekday occurring on a congested freeway segment has increased from 3.5 hours in 1980 to
5.5 hours in 1999.
• Freeway traffic congestion is forecast to increase substantially by the year 2020 even if regional land
use and transportation plans are implemented. The extent of the regional freeway system
experiencing congestion may be expected to increase from 65 miles and 24 percent of the freeway
system to 122 miles and 44 percent of the freeway system. The miles of freeway experiencing
extreme or severe congestion may be expected to increase from 53 miles and 19 percent of the
freeway system to 77 miles and 28 percent of the freeway system.
* * *