Embed Size (px)
Citation preview

189 © IWA Publishing 2014 Journal of Hydroinformatics | 16.1 | 2014
Free-surface flow simulations for discharge-based
operation of hydraulic structure gates
C. D. Erdbrink, V. V. Krzhizhanovskaya and P. M. A. Sloot
ABSTRACT
We combine non-hydrostatic flow simulations of the free surface with a discharge model based on
elementary gate flow equations for decision support in the operation of hydraulic structure gates. A
water level-based gate control used in most of today’s general practice does not take into account
the fact that gate operation scenarios producing similar total discharged volumes and similar water
levels may have different local flow characteristics. Accurate and timely prediction of local flow
conditions around hydraulic gates is important for several aspects of structure management:
ecology, scour, flow-induced gate vibrations and waterway navigation. The modelling approach is
described and tested for a multi-gate sluice structure regulating discharge from a river to the sea. The
number of opened gates is varied and the discharge is stabilized with automated control by varying
gate openings. The free-surface model was validated for discharge showing a correlation coefficient
of 0.994 compared to experimental data. Additionally, we show the analysis of computational fluid
dynamics (CFD) results for evaluating bed stability and gate vibrations.
doi: 10.2166/hydro.2013.215
C. D. Erdbrink (corresponding author)V. V. KrzhizhanovskayaP. M. A. SlootUniversity of Amsterdam,Amsterdam,The NetherlandsandNational Research University of Information
Technologies,Mechanics and Optics,Saint Petersburg,RussiaE-mail: [email protected];
C. D. ErdbrinkDeltares,Delft,The Netherlands
Key words | computational fluid dynamics, discharge sluice, free-surface flow, gate operation,
hydraulic gates, hydraulic structures
NOTATION
A
amplitude of gate vibration (m)Alake
surface area of lake (m2)a
gate opening (m)Cc
contraction coefficient for flow past sharp-edged underflow gate (�)
Cc,in
contraction coefficient for flow enteringupstream section between piers (�)
CD
discharge coefficient for submerged flow (–)CD*
average value of CD over one discharge event,computed by discharge model (�)
CE
discharge coefficient as used by Nago ()for experimental data
e
error value of PID discharge controller (m3/s)fgate
frequency of gate vibration (Hz)Fr
Froude number (�)g
gravitational constant (m/s2)h
water depth (m)h0
upstream water depth before reaching pier (m)h1
upstream water depth between piers, upstreamof gate (m)
h2
water depth in control section (m)h3
water depth downstream of gate, betweenpiers, behind recirculation zone (m)
h4
downstream water depth beyond pier (m)htarget
target lake level to be reached at the end of dis-charge period (m)
k
turbulent kinetic energy (m2/s2)KP, KI, KD
gain parameters of PID discharge controller(�)
m
number of gates opened fully or partially (�)n
total number of gates of the structure (�)~n
normal vector (�)p
pressure (Pa)Q
discharge (m3/s)
190 C. D. Erdbrink et al. | Free-surface flow simulations for discharge-based operation of hydraulic gates Journal of Hydroinformatics | 16.1 | 2014
QDM
discharge through one gate, calculated by dis-charge model (m3/s)
Qgate
discharge through one gate, calculated by thesystem model (m3/s)
QMF
modular flow discharge based on gate under-flow contraction criterion (m3/s)
q
discharge per unit width (m2/s)t
time variable (s)U
magnitude of flow velocity vector; in 2DVmodel defined as U ¼ffiffiffiffiffiffiffiffiffiffiffiffiffiffiffiffiffiu21 þ u2
3
q(m/s)
Uvc
magnitude of flow velocity vector in venacontracta (m/s)
~u ¼ (u1, u3)
flow velocity vector in 2DV model; u1 is hori-zontal velocity, u3 is vertical velocity (m/s)
Vr
reduced velocity parameter of flow-inducedvibrations (�)
Vtot
total volume passing the structure in a givenamount of time (m3)
Vtot,req
required total volume to pass the structure in agiven amount of time in order to reach htarget(m3)
w
width between piers (m)α
calibration parameter for turbulent flow in bedstability parameter (–)
β
relaxation factor in formula for CD in systemmodel (–)
ε
turbulent dissipation (m2/s3)ξin
entrance loss coefficient (–)ξout
exit loss coefficient (–)Ψ
stability parameter for beginning of motion ofgranular bed material (–) � �
∇ui gradient operator, defined as∇ui ¼ @ui=@x@ui=@z
∇ �~u divergence operator, defined as∇ �~u ¼ @u1=@xþ @u3=@z
qr� �
number of combinations of r objects out of qobjects (0� r� q), defined asq!
r! q� rð Þ!
⌊r⌋ floor function, defined as ∀r ∈ R, ⌊r⌋ ¼max(n ∈ Z:n � r)
⌈r⌉
ceiling function, defined as ∀r ∈ R,⌈r⌉ ¼ min(n ∈ Z:n � r)
�s time-average of quantity sINTRODUCTION
This paper gives an outline of how near-field free-surface
flow simulations can be used in the operation of gates of
large hydraulic structures.
Barrier operation is commonly based on water level pre-
dictions from system-scale far-field flow models. The
procedures are aimed at fulfilling the main function of
the structure: for a weir in a river this is to maintain the
upstream water level; for a discharge sluice this is to transfer
river water out to the sea while keeping a safe inland level.
Present-day hydraulic structures have various secondary
functions, such as providing favourable ecological con-
ditions, for which usually no numerical aids are available
in daily operation. A better prediction of the flow near struc-
tures would be beneficial to durable performance of all
barrier tasks.
Proper design studies pay attention to all functions of a
structure and assess the impact of all relevant flow features.
However, operational constraints change in time for natural
reasons (e.g. sea-level rise) or political reasons (e.g.
‘Kierbesluit Haringvlietsluizen’) (see Rijkswaterstaat ).
In addition, sometimes the design criteria that were orig-
inally applied cannot be retrieved, yielding uncertainty
about safety levels and allowable limits of gate settings in
the present.
There are several aspects in contemporary barrier man-
agement for which an informed view on discharge and flow
around gates is essential. First, the prediction of bed material
stability and scour, including local erosion (Hoffmans &
Pilarczyk ; Azamathulla ), as well as large-scale mor-
phological changes of surrounding bathymetry (Nam et al.
) greatly depend on the flow. Second, ecological issues
such as fish migration, salt water intrusion and mobile
fauna are also linked with local flow characteristics
(Martin et al. ). Third, other relevant aspects are the
dynamic forces associated with flow-induced gate vibrations
(Naudascher & Rockwell ) and the impact of flow
around structures on nearby shipping traffic. Fourth, for
the structure itself, local flow prediction is useful for dealing
with abnormal conditions: downtime of gates during sched-
uled maintenance or unexpected gate failure.
191 C. D. Erdbrink et al. | Free-surface flow simulations for discharge-based operation of hydraulic gates Journal of Hydroinformatics | 16.1 | 2014
The barriers and sluices built in the south-west of The
Netherlands in the period 1960–2000 are good examples of
structures where different functions are combined. Present
management of the barriers atHaringvliet andOosterschelde
calls for smart use to allow for regulation of fresh and salt
water flows and fish migration. At the same time, the aging
process of these structures demands an increasing awareness
of structural safety issues. The new storm-surge barrier of
Saint Petersburg, Russia, is another example. This large
dam houses two sector-gates and three sections of radial
gates that protect the low-lying city centre and regulate the
discharge from the river Neva. Operation of this complex
structure must rely on state-of-the-art flow models.
The above considerations motivate quantification of flow
around a hydraulic structure. The aim of this paper is to lay a
foundation for numerical models to estimate gate discharges
and to evaluate the impact of flow near hydraulic structures
in a way that is fit for operational applications. The influence
of waves is not investigated; the focus is on flow (current).
Traditionally, flow around hydraulic structures is
studied experimentally in the design stage or as a fundamen-
tal research topic (Kolkman ; Roth & Hager ).
Numerous numerical studies have looked into sluice gate
flow (Khan et al. ; Kim ; Akoz et al. ), but no
single accepted, validated modelling tool exists for assessing
turbulent gate flow with suitable practical value. Estimating
discharge over weirs or under gates is not trivial. New dis-
charge equations are still being introduced, both from
informatics viewpoints (Khorchani & Blanpain ) and
from the traditional viewpoint of measurements (Habibza-
deh et al. ).
System-scale models of inland water systems simulate the
flow in river branches by solving the one-dimensional or quasi-
two-dimensional ShallowWater equations (Deltares a, b).
The fact that these hydrostaticmodels do not simulate the flow
around hydraulic structures explicitly is not a severe limitation
formost applications. The systemeffect of the operation of var-
ious gates on the water levels in adjacent water bodies (river
branches) can thus be studied (for instance Becker & Schwa-
nenberg ). For stability of granular bed material and salt
water transport, however, the flow acceleration in the vertical
dimension needs to be simulated. Moreover, the downside of
primarily water level-centred validation and calibration in
combination with parameterized structure representations
(such as constant discharge coefficients) is that the prediction
quality of discharges in system-scale models is often unclear.
Warmink et al. (, ) investigated the uncertainty in cali-
bration of water levels in river models resulting from the
limited availability of discharge data. It was concluded that
the necessary extrapolation of the calibration parameter
(bed roughness of main channel) leads to significant uncer-
tainty in simulated design water levels. More intensive
measurement of discharges, for which most gated structures
are ideal, and a physically more realistic representation of
hydraulic structures in models are self-evident improvements
that nevertheless require a culture shift.
The application of computational fluid dynamics (CFD)
in the assessment of flow impact issues that arise long after
the start of operation of a structure is rare. Bollaert et al.
() employ numerical modelling to assess the influence
of gate usage on the formation of plunge pool scour of a
hydropower dam. For some issues, like salt water intrusion
and sediment transport past a discharge-regulating structure,
the solution cannot be found in a modelling tool at one
scale. The local flow simulation should in those cases be
coupled to a mid- or far-field model that covers a larger area.
A central role nowadays is played by the multi-
disciplinary field of hydroinformatics (Solomatine & Ostfeld
; Krzhizhanovskaya et al. ; Melnikova et al. ;
Pyayt et al. a; Pengel et al. ), in which different
forms of modelling (physics-based and data-driven) are con-
sidered and combined with contemporary computational
techniques like machine learning (Pyayt et al. b). In the
context of the present study, it is noted beforehand that for
a complex hydraulic structure, data-driven modelling alone
is not an apt option, because a single Q-H-relation does not
describe all states (Kolkman ), or is highly impractical
as it would require extensive permanent monitoring.
This study takes the underlying physics as a starting
point: elementary flow equations are combined with two-
dimensional model in the vertical (2DV) time-dependent
CFD simulations. The method bridges modelling scales
with a minimum of data coupling and at the same time intro-
duces the use of numerical aids into practical barrier
operation for issues that at present are decided upon by
expert judgement by the operator.
The remainder of this paper is organized as follows: first,
we describe the overall approach, then the method is

192 C. D. Erdbrink et al. | Free-surface flow simulations for discharge-based operation of hydraulic gates Journal of Hydroinformatics | 16.1 | 2014
described in three sections about discharge modelling, free-
surface flow simulation and analysis of the modelling
results. Next, the results of a series of validation runs for
the free-surface model are discussed, followed by the results
of a test case that gives numerical examples of all modelling
steps. We end the paper with recommendations, con-
clusions and an outlook on future work.
APPROACH
For obtaining a timely prediction of the flow around gates, we
propose a multi-step physics-based modelling strategy which
uses data input from a system-scale model. The work-flow of
the suggested gate operation system is shown in Figure 1.
The first step consists of the extraction of predicted
water levels on both sides of the structure from a far-field
(system-scale) model that contains the structure. Different
possible gate settings (when to open, how many gates to
use) are identified in the second step. All options need to
be assessed in terms of discharge capacity; this happens in
step 3. In the fourth step of Figure 1, for all gate configur-
ations capable of discharging the required volume, the
resulting flow is simulated using CFD. Subsequent analysis
of the simulation results determines the impact of the flow
for specific issues such as bed stability. The fifth and final
step comprises the actual decision of gate operation actions.
The conventional sequence of steps taken by most oper-
ational systems follows the dashed line in Figure 1,
skipping steps 3 and 4. The present study focuses on steps
2–4, which can be seen as an addition to computational
decision support systems (steps 1 and 5) by Boukhanovsky
& Ivanov () and Ivanov et al. ().
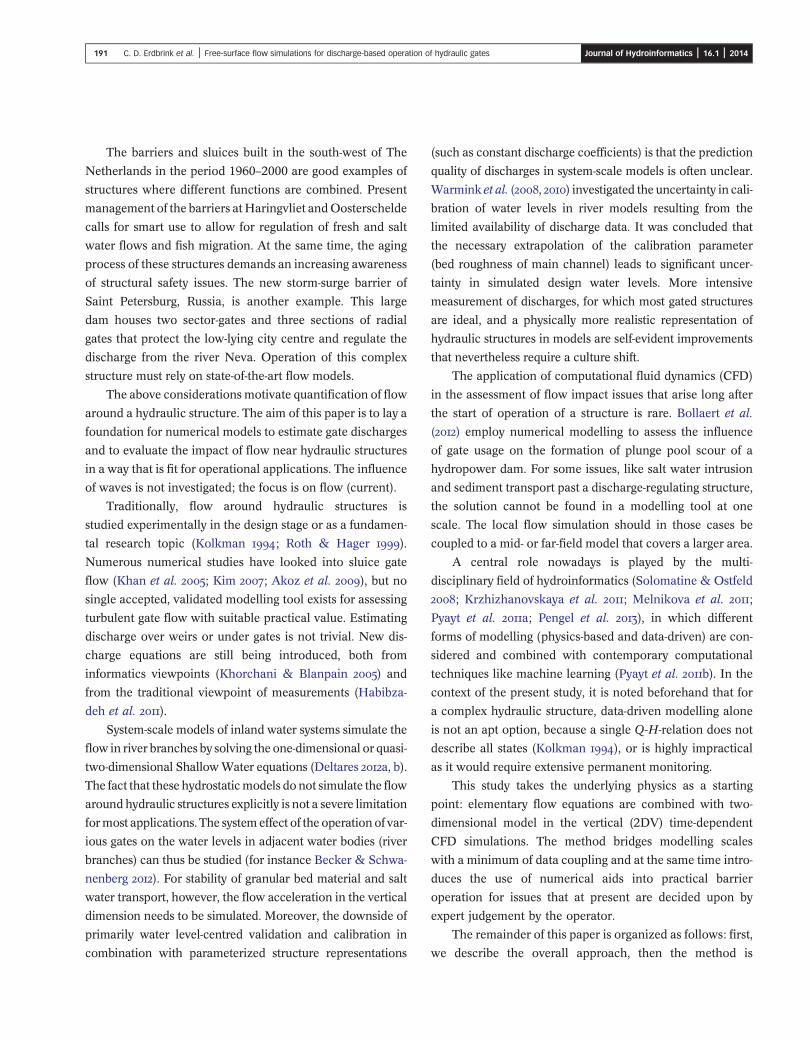
A multi-gated discharge sluice with underflow gates will
be used to describe the modelling method. The central
Figure 1 | Scheme of evaluation steps leading to a decision on optimal gate operation. Steps 1–
barrier systems that do not take into account flow effects.
question addressed is how to find the set of gate configur-
ations capable of delivering the required discharge that
also meet the relevant constraints on flow properties.
METHOD
Discharge computations
Configurations of multi-gated structure
Let us consider the gate configurations of a discharge struc-
ture consisting of n similar openings, each accommodating a
movable gate, see Figure 2. In its idle state, all n gates close
off the openings between the piers and the total discharge is
zero. During a discharge event, m gates will be opened par-
tially or completely, allowing a certain discharge through
the structure. A ‘gate configuration’ is defined as the allo-
cation of a number of gates (m� n) that are opened with a
gate opening a(t) while the other gates remain closed. All
gates selected for opening will be operated similarly, i.e.
with the same a(t).
Before deciding which gates to open, first the possible
combinations of opening gates are identified and counted.
In general, flow instabilities are not favourable for maintain-
ing an efficient and controllable discharge. As in other parts
of physics, symmetry is a global measure for stability of free-
surface flows. If asymmetry is allowed, m gates can be
chosen freely from the total of n available slots. Then the
number of possible combinations is obviouslynm
� �, using
the common notation for combinatorial choice of m objects
out of n. For the condition of symmetry to hold, gates may
only be opened in such a way that the pattern is symmetric
about the vertical plane of symmetry in flow direction (see
Figure 2). This implies that the number of options reduces
4 are treated in this paper. The dashed line shows the shorter decision sequence taken by
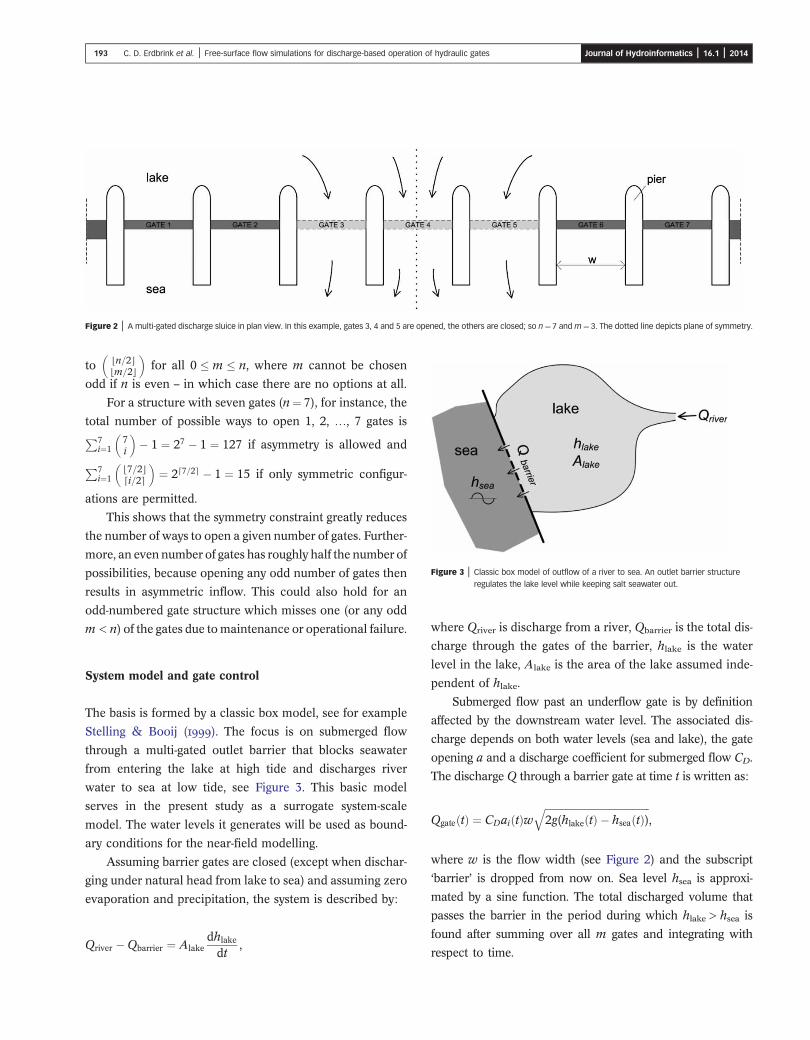
Figure 2 | A multi-gated discharge sluice in plan view. In this example, gates 3, 4 and 5 are opened, the others are closed; so n¼ 7 and m¼ 3. The dotted line depicts plane of symmetry.
Figure 3 | Classic box model of outflow of a river to sea. An outlet barrier structure
regulates the lake level while keeping salt seawater out.
193 C. D. Erdbrink et al. | Free-surface flow simulations for discharge-based operation of hydraulic gates Journal of Hydroinformatics | 16.1 | 2014
to ⌊n=2⌋⌊m=2⌋
� �for all 0 � m � n, where m cannot be chosen
odd if n is even – in which case there are no options at all.
For a structure with seven gates (n¼ 7), for instance, the
total number of possible ways to open 1, 2, …, 7 gates isP7
i¼17i
� �� 1 ¼ 27 � 1 ¼ 127 if asymmetry is allowed and
P7i¼1
⌊7=2⌋⌈i=2⌉
� �¼ 2⌈7=2⌉ � 1 ¼ 15 if only symmetric configur-
ations are permitted.
This shows that the symmetry constraint greatly reduces
the number of ways to open a given number of gates. Further-
more, an even number of gates has roughly half the number of
possibilities, because opening any odd number of gates then
results in asymmetric inflow. This could also hold for an
odd-numbered gate structure which misses one (or any odd
m< n) of the gates due tomaintenance or operational failure.
System model and gate control
The basis is formed by a classic box model, see for example
Stelling & Booij (). The focus is on submerged flow
through a multi-gated outlet barrier that blocks seawater
from entering the lake at high tide and discharges river
water to sea at low tide, see Figure 3. This basic model
serves in the present study as a surrogate system-scale
model. The water levels it generates will be used as bound-
ary conditions for the near-field modelling.
Assuming barrier gates are closed (except when dischar-
ging under natural head from lake to sea) and assuming zero
evaporation and precipitation, the system is described by:
Qriver �Qbarrier ¼ Alakedhlake
dt,
where Qriver is discharge from a river, Qbarrier is the total dis-
charge through the gates of the barrier, hlake is the water
level in the lake, Alake is the area of the lake assumed inde-
pendent of hlake.
Submerged flow past an underflow gate is by definition
affected by the downstream water level. The associated dis-
charge depends on both water levels (sea and lake), the gate
opening a and a discharge coefficient for submerged flow CD.
The discharge Q through a barrier gate at time t is written as:
Qgate tð Þ ¼ CDai tð Þwffiffiffiffiffiffiffiffiffiffiffiffiffiffiffiffiffiffiffiffiffiffiffiffiffiffiffiffiffiffiffiffiffiffiffiffiffiffiffiffiffiffi2g(hlake tð Þ � hsea tð Þ)
q,
where w is the flow width (see Figure 2) and the subscript
‘barrier’ is dropped from now on. Sea level hsea is approxi-
mated by a sine function. The total discharged volume that
passes the barrier in the period during which hlake> hsea is
found after summing over all m gates and integrating with
respect to time.

194 C. D. Erdbrink et al. | Free-surface flow simulations for discharge-based operation of hydraulic gates Journal of Hydroinformatics | 16.1 | 2014
Two gate opening scenarios will be considered. In both
scenarios equal gate openings a(t) are applied to all m gates
selected for opening. The first scenario uses a constant gate
opening aconst for the whole discharge period (from tstart to
tend). The opening required to lower the lake level to a
desired lake level htarget is found by estimating the average
required discharge Qtot,req to achieve this and by making
estimates of the average discharge coefficient and water
levels during the discharge period:
aconst ¼�Q0tot,req
m�C0Dw
ffiffiffiffiffiffiffiffiffiffiffiffiffiffiffiffiffiffiffiffiffiffiffiffiffiffiffiffiffiffiffiffi2g(�h
0lake � �h
0sea)
q with
�Q0
tot,req ¼ Alake(hlake(t(start))� htarget)t0end � tstart
where bars are time-averages and primes indicate predic-
tions of future values. In the second scenario, the
discharge is regulated by a proportional integral derivative
(PID) controller (Brown ). The goal of this scenario is
to have a more constant gate discharge by varying the gate
openings in time, whilst still achieving the same htarget as
in the first scenario. The discrete PID formula for discharge
at ti is:
Q tið Þ ¼ KPe tið Þ þ KI
Xi
j¼1
e(tj)þKDe tið Þ � e(ti�1)
Δt,
where Ki are the gain parameters and the error value is
defined as e(ti) ¼ Qset �Q(ti�1). In the simulations, KP¼
Figure 4 | System model: flow chart of gate control and water level computations.
0.10, KI¼ 0.45 and KD¼ 0.55 are used. The setpoint Qset is
constant and equal to Qtot,req, except for linear setpoint
ramping applied at the start of discharge to prevent undue
fluctuations of gate position. At each time step, the required
gate opening is derived from this discharge divided by
mC0Dw
ffiffiffiffiffiffiffiffiffiffiffiffiffiffiffiffiffiffiffiffiffiffiffiffiffiffiffiffiffiffiffiffiffiffiffiffiffiffiffiffiffiffi2g hlake tð Þ � hsea(t)ð Þp
. Figure 4 shows the flow chart
of the system model. It includes computations of the two
gate operation scenarios.
Figure 4 shows that the total discharge computed by
the system model Qtot is being used to calculate the new
lake level. Additionally, it shows that at the start of each
discharge event, i.e. when the gates are opened, the predic-
tion of the discharge coefficient CD0 is updated using data
from the discharge model. For both situations, with and
without PID control, this coefficient is found by a relax-
ation function with the mean discharge coefficient CD* of
the previous discharge event computed by the discharge
model. For the nth discharge event, the update formula
reads:
C0D nð Þ ¼ C0
D n� 1ð Þ þ β C�D n� 1ð Þ � C0
D n� 1ð Þ� �
In all computations, a relaxation factor β¼ 0.75 is
applied.
Discharge coefficients actually depend on numerous fac-
tors. Also, flows through neighbouring gates influence each
other. To distinguish between different gate configurations
with the same total flow-through area m �w � aconst, thesetwo things need to be taken into account. This is done in
the discharge model described in the next subsection, see
also the bold block in Figure 4.
195 C. D. Erdbrink et al. | Free-surface flow simulations for discharge-based operation of hydraulic gates Journal of Hydroinformatics | 16.1 | 2014
Discharge model
Vertical lift gates with underflow are raised vertically
between piers of a structure. The two main flow types that
occur are free flow and submerged flow. When the gates
are lifted higher than the water surface, there exists free or
submerged Venturi flow (Boiten ). All flow types have
different discharge characteristics and associated formulae.
For estimating the submerged flow discharge, the local
water depths are schematized according to Figure 5 (after
Kolkman ). Conservation of the energy head (Bernoulli
equation) is applied in the accelerating parts and the
momentum equations in the decelerating parts, yielding a
system of four equations (see Appendix, available online at
http://www.iwaponline.com/jh/016/215.pdf).
Transitions h0–h1 and h3–h4 with loss coefficients ξin
and ξout represent the effects of flow entering and leaving
the narrow area between two piers. Transitions h1–h2–h3
are the characteristic underflow gate zones, see Battjes
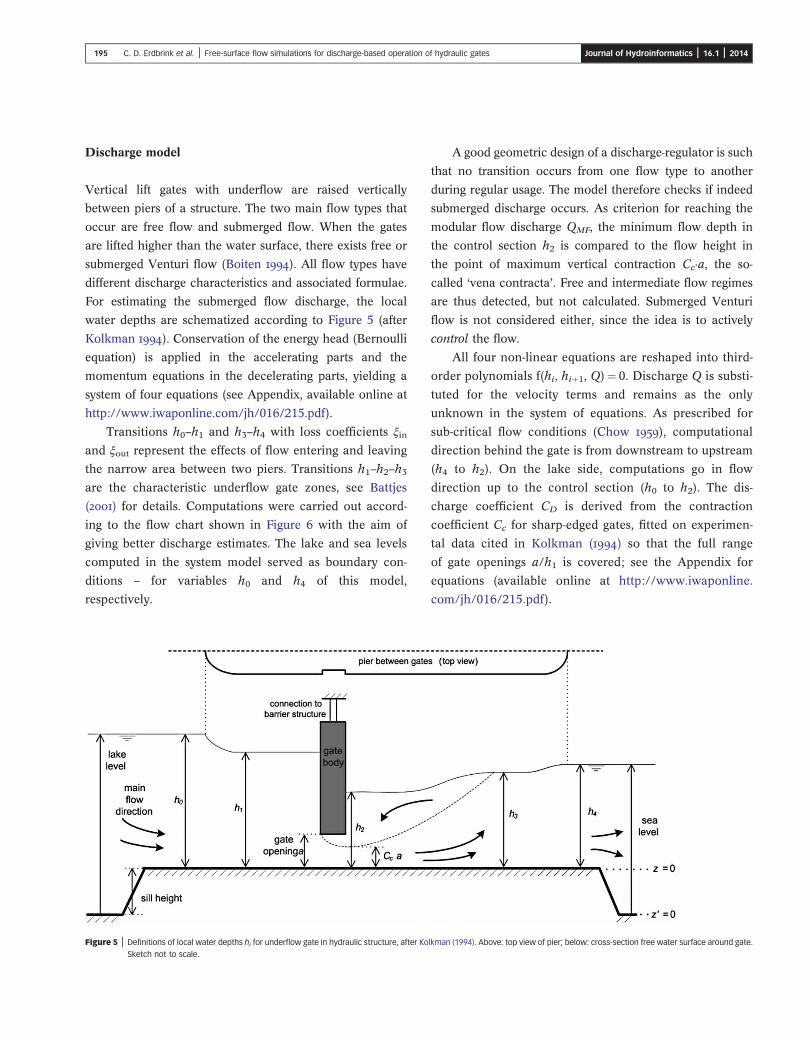
() for details. Computations were carried out accord-
ing to the flow chart shown in Figure 6 with the aim of
giving better discharge estimates. The lake and sea levels
computed in the system model served as boundary con-
ditions – for variables h0 and h4 of this model,
respectively.
Figure 5 | Definitions of local water depths hi for underflow gate in hydraulic structure, after Ko
Sketch not to scale.
A good geometric design of a discharge-regulator is such
that no transition occurs from one flow type to another
during regular usage. The model therefore checks if indeed
submerged discharge occurs. As criterion for reaching the
modular flow discharge QMF, the minimum flow depth in
the control section h2 is compared to the flow height in
the point of maximum vertical contraction Cc·a, the so-
called ‘vena contracta’. Free and intermediate flow regimes
are thus detected, but not calculated. Submerged Venturi
flow is not considered either, since the idea is to actively
control the flow.
All four non-linear equations are reshaped into third-
order polynomials f(hi, hiþ1, Q)¼ 0. Discharge Q is substi-
tuted for the velocity terms and remains as the only
unknown in the system of equations. As prescribed for
sub-critical flow conditions (Chow ), computational
direction behind the gate is from downstream to upstream
(h4 to h2). On the lake side, computations go in flow
direction up to the control section (h0 to h2). The dis-
charge coefficient CD is derived from the contraction
coefficient Cc for sharp-edged gates, fitted on experimen-
tal data cited in Kolkman () so that the full range
of gate openings a/h1 is covered; see the Appendix for
equations (available online at http://www.iwaponline.
com/jh/016/215.pdf).
lkman (1994). Above: top view of pier; below: cross-section free water surface around gate.
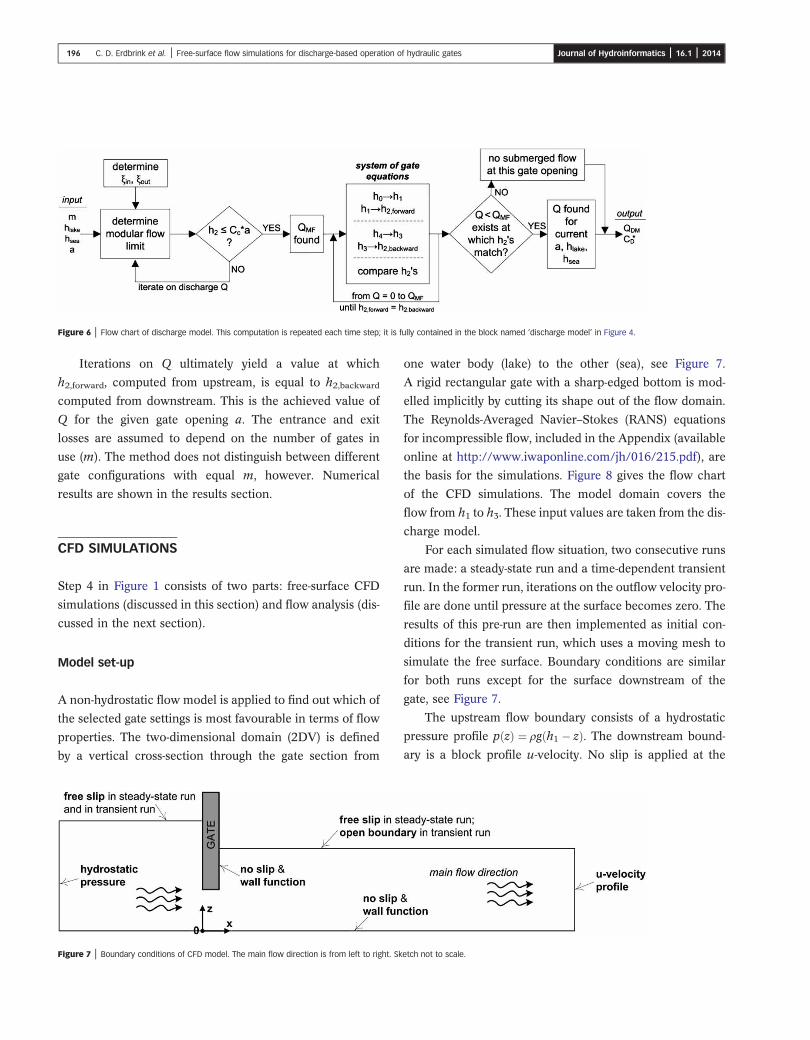
Figure 6 | Flow chart of discharge model. This computation is repeated each time step; it is fully contained in the block named ‘discharge model’ in Figure 4.
196 C. D. Erdbrink et al. | Free-surface flow simulations for discharge-based operation of hydraulic gates Journal of Hydroinformatics | 16.1 | 2014
Iterations on Q ultimately yield a value at which
h2,forward, computed from upstream, is equal to h2,backward
computed from downstream. This is the achieved value of
Q for the given gate opening a. The entrance and exit
losses are assumed to depend on the number of gates in
use (m). The method does not distinguish between different
gate configurations with equal m, however. Numerical
results are shown in the results section.
CFD SIMULATIONS
Step 4 in Figure 1 consists of two parts: free-surface CFD
simulations (discussed in this section) and flow analysis (dis-
cussed in the next section).
Model set-up
A non-hydrostatic flow model is applied to find out which of
the selected gate settings is most favourable in terms of flow
properties. The two-dimensional domain (2DV) is defined
by a vertical cross-section through the gate section from
Figure 7 | Boundary conditions of CFD model. The main flow direction is from left to right. Sk
one water body (lake) to the other (sea), see Figure 7.
A rigid rectangular gate with a sharp-edged bottom is mod-
elled implicitly by cutting its shape out of the flow domain.
The Reynolds-Averaged Navier–Stokes (RANS) equations
for incompressible flow, included in the Appendix (available
online at http://www.iwaponline.com/jh/016/215.pdf), are
the basis for the simulations. Figure 8 gives the flow chart
of the CFD simulations. The model domain covers the
flow from h1 to h3. These input values are taken from the dis-
charge model.
For each simulated flow situation, two consecutive runs
are made: a steady-state run and a time-dependent transient
run. In the former run, iterations on the outflow velocity pro-
file are done until pressure at the surface becomes zero. The
results of this pre-run are then implemented as initial con-
ditions for the transient run, which uses a moving mesh to
simulate the free surface. Boundary conditions are similar
for both runs except for the surface downstream of the
gate, see Figure 7.
The upstream flow boundary consists of a hydrostatic
pressure profile p zð Þ ¼ ρg h1 � zð Þ. The downstream bound-
ary is a block profile u-velocity. No slip is applied at the
etch not to scale.
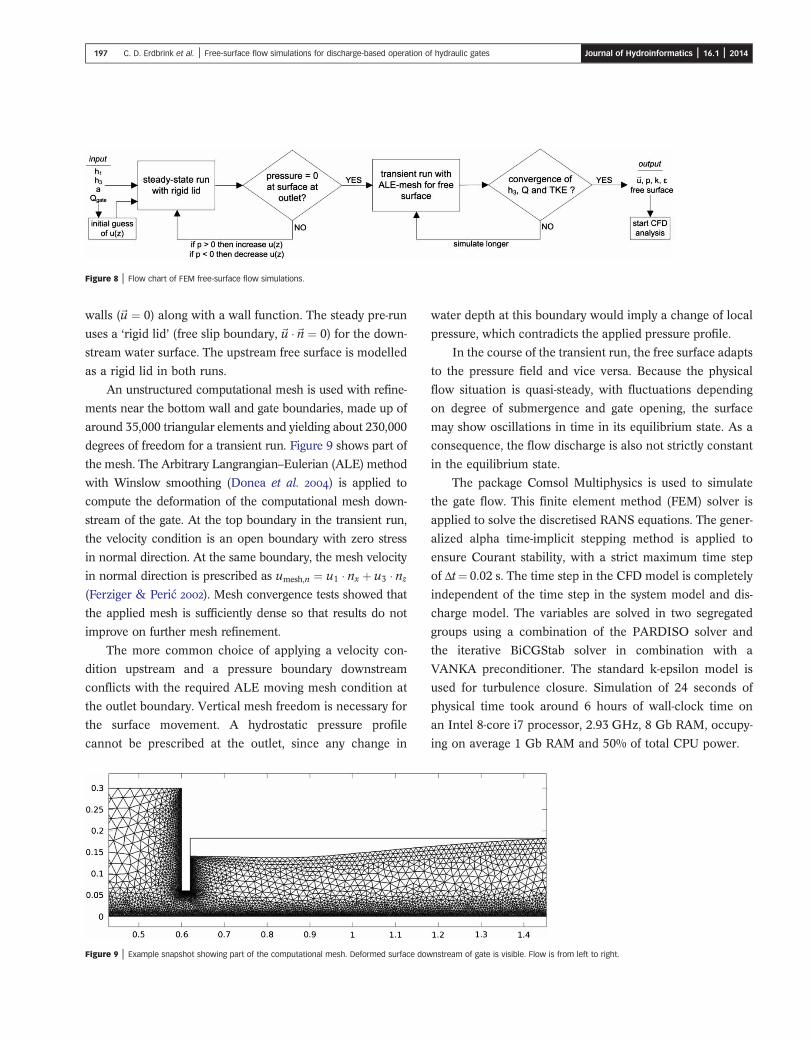
Figure 8 | Flow chart of FEM free-surface flow simulations.
197 C. D. Erdbrink et al. | Free-surface flow simulations for discharge-based operation of hydraulic gates Journal of Hydroinformatics | 16.1 | 2014
walls (~u ¼ 0) along with a wall function. The steady pre-run
uses a ‘rigid lid’ (free slip boundary, ~u �~n ¼ 0) for the down-
stream water surface. The upstream free surface is modelled
as a rigid lid in both runs.
An unstructured computational mesh is used with refine-
ments near the bottom wall and gate boundaries, made up of
around 35,000 triangular elements and yielding about 230,000
degrees of freedom for a transient run. Figure 9 shows part of
the mesh. The Arbitrary Langrangian–Eulerian (ALE) method
with Winslow smoothing (Donea et al. ) is applied to
compute the deformation of the computational mesh down-
stream of the gate. At the top boundary in the transient run,
the velocity condition is an open boundary with zero stress
in normal direction. At the same boundary, the mesh velocity
in normal direction is prescribed as umesh,n ¼ u1 � nx þ u3 � nz
(Ferziger & Peric ). Mesh convergence tests showed that
the applied mesh is sufficiently dense so that results do not
improve on further mesh refinement.
The more common choice of applying a velocity con-
dition upstream and a pressure boundary downstream
conflicts with the required ALE moving mesh condition at
the outlet boundary. Vertical mesh freedom is necessary for
the surface movement. A hydrostatic pressure profile
cannot be prescribed at the outlet, since any change in
Figure 9 | Example snapshot showing part of the computational mesh. Deformed surface dow
water depth at this boundary would imply a change of local
pressure, which contradicts the applied pressure profile.
In the course of the transient run, the free surface adapts
to the pressure field and vice versa. Because the physical
flow situation is quasi-steady, with fluctuations depending
on degree of submergence and gate opening, the surface
may show oscillations in time in its equilibrium state. As a
consequence, the flow discharge is also not strictly constant
in the equilibrium state.
The package Comsol Multiphysics is used to simulate
the gate flow. This finite element method (FEM) solver is
applied to solve the discretised RANS equations. The gener-
alized alpha time-implicit stepping method is applied to
ensure Courant stability, with a strict maximum time step
of Δt¼ 0.02 s. The time step in the CFD model is completely
independent of the time step in the system model and dis-
charge model. The variables are solved in two segregated
groups using a combination of the PARDISO solver and
the iterative BiCGStab solver in combination with a
VANKA preconditioner. The standard k-epsilon model is
used for turbulence closure. Simulation of 24 seconds of
physical time took around 6 hours of wall-clock time on
an Intel 8-core i7 processor, 2.93 GHz, 8 Gb RAM, occupy-
ing on average 1 Gb RAM and 50% of total CPU power.
nstream of gate is visible. Flow is from left to right.

198 C. D. Erdbrink et al. | Free-surface flow simulations for discharge-based operation of hydraulic gates Journal of Hydroinformatics | 16.1 | 2014
ANALYSIS
The second part of step 4 in Figure 1 is the analysis of the
modelling results obtained in previous steps. In this section,
three aspects of analysis are discussed: flow parameters,
vibrations and bed stability.
Flow parameters
Three parameters that are required for assessing various
types of flow impact are extracted from the CFD model:
the contraction coefficient Cc, the velocity in the vena con-
tracta Uvc and the Froude number (Fr). The flow field is
interpolated to a regular grid, so that the edge of the separ-
ated layer is found, see Figure 10. The contraction
coefficient is thus found directly.
The cross-sectional averaged velocity in the vena con-
tracta is defined by a spatial average in the separated shear
zone:
Uvc(t) ¼ 1Cc(t)a
ðCc(t)�a
z¼0
U(z, t)dz
where U is the velocity magnitude scalar at the point of
maximum flow contraction. For gate flow with significant
fluctuations, the temporal mean of this quantity, �Uvc, may
be used.
The Froude number is a widely used dimensionless
measure for flow-related surface curvatures. It is used for
describing the transition from intermediate to free flow
regimes and predicting modular flow discharge and associ-
ated gate openings. Here it is defined as:
Fr(t) ¼ Uvc(t)ffiffiffiffiffiffiffiffiffiffiffiffiffigh2 tð Þp
Figure 10 | Vector flow field of run II. Flow is from left to right. The computed free surface beh
negative u1-velocity. The figure shows only part of the actual computational doma
in which obviously h2 ¼ Cc � a in fully free flow. An overview
of critical flow theory from a historical perspective is given
by Castro-Orgaz & Hager () and from a more practical
viewpoint by Boiten (). In a more complete flow assess-
ment, not only the vertical contraction caused by the
underflow gate is used as a criterion for modular flow, as
is done here, but also contraction caused by horizontal
and possibly vertical flow domain transitions at the inlet of
the structure should be included.
Vibrations
The interaction of current with the movable hydraulic gate
is capable of causing significant flow-induced vibrations
(FIV). Although dedicated design tests greatly reduce sus-
ceptibility for dangerous dynamic forces (Jongeling &
Erdbrink ), active prediction and control will broaden
the windows of operation. The literature on dynamic gate
forces caused by this phenomenon uses a dimensionless
parameter of reduced velocity to signify occurring gate
vibrations (Hardwick ; Billeter & Staubli ; Erd-
brink ). In time-dependent form it is written as:
Vr(t) ¼ Uvc(t)fgate tð Þ � L
where fgate is the response frequency of the structure in Hz;
L is a characteristic length scale of the gate, usually the
thickness of the gate bottom, and Uvc as defined in the pre-
vious section. The response frequency is not easily
determined analytically (see general formula in Appendix,
available online at http://www.iwaponline.com/jh/016/
215.pdf); among other reasons because the ‘added’ water
mass mw that is caused by the inertia of water being
pushed away by the gate deviates from analytical values
ind the gate shows local lowering. Dashed line indicates separation between positive and
in. Total domain length is 3.6 m.

199 C. D. Erdbrink et al. | Free-surface flow simulations for discharge-based operation of hydraulic gates Journal of Hydroinformatics | 16.1 | 2014
at non-zero gate flow (Blevins ). The gate frequency
may best be monitored in situ by installing sensors –
which need to be sensitive to small amplitudes in order
to have predictive value. Erdbrink et al. () provide a
recipe for a data-driven gate control system for gate
vibrations. It is therein proposed to combine physics-
based modelling and sensor data with machine learning
computations to steer the gates clear of riskful situations.
From numerous experimental studies it is concluded
(Naudascher & Rockwell ) that for a specific gate, the
amplitude A due to FIV, in cross-flow or in-flow direction
or both, is a function of Vr, a and submergence:
A ¼ f(Vr, a, h3)
Details of the gate geometry are decisive for occurrence
or absence of vibrations. A database with response data
from past laboratory studies could be used to predict ampli-
tudes of future flow situations in an operational system.
Scour and bed protection
The classical prediction of local scour downstream of weirs
and sluice structures caused by outlet currents is described
by Breusers () and Hoffmans & Pilarczyk (). More
recently, contemporary computational techniques were
introduced for scour estimation, e.g. Azmathullah et al.
(). In the classical physics-based design formulae, turbu-
lence parameters are used to predict the depth of the scour
hole in unprotected beds. For beds protected with granular
material (loose rocks), the Shields parameter is a classic
non-dimensional measure applied as a first indicator for
instability (Shields ). An adapted version of this par-
ameter used by Jongeling et al. () and elaborated upon
by Hofland () and Hoan et al. () is defined as:
Ψ(x) ¼⟨ �U(x)þ α
ffiffiffiffiffiffiffiffiffik(x)
p� �2⟩Δgd(x)
withΔ ¼ ρs � ρwρw
,
where ⟨::⟩ denotes spatial averaging over the whole water
depth, k is the turbulent kinetic energy (TKE), d is the
local water depth, �U is the mean flow velocity magnitude
and α is an empirical parameter for bringing into account
the turbulence (that depends on flow type and local geome-
try, e.g. slopes in bottom profile).
MODEL VALIDATION RESULTS
A series of validation runs was performed for the free-sur-
face model. ‘Validation run’ is used here in the meaning
discussed by Stelling & Booij (): the uncalibrated
model is run without any tweaking of parameters to see
if it can reproduce the most important physical features.
Experimental laboratory data by Nago (, ) for a
vertical sharp-edged gate under submerged efflux
serve as comparison. Nago’s (, ) dimensions
were used without any scaling. His discharge formula
Q ¼ CEawffiffiffiffiffiffiffiffiffiffi2gh1
pdoes not contain the downstream level
h3 explicitly. Its influence is instead found in the discharge
coefficient CE. The simulated discharge is computed by
spatial integration of horizontal velocity at the outflow
boundary. In Figure 11, coefficient CE is plotted for differ-
ent series of dimensionless gate openings and for a range
of dimensionless downstream levels.
The results of the validation runs make clear that the
simulations capture the discharges of the experimental
data quite accurately: the correlation coefficient is 0.994
and the root mean square error is 1.14%. The fact that
the uncalibrated model shows good discharge estimates
gives confidence in the predictive power of this modelling
approach. Physical output not validated here (such as
TKE) may be calibrated in future studies by adjusting suit-
able model parameters. Convergence of various flow
variables occurs at different rates. First, the mean vel-
ocities stabilize, and then the forces on the gate
converge, then the discharge, and lastly the turbulent
energy.
The chosen boundary conditions proved to lead to
stable results for all submergence ratios of Nago’s (,
) data. It was found that the moving mesh is the critical
factor for numerical stability. ALE is a suitable method for
computing the free surface for quasi-steady gate flow as
long as the flow remains submerged. Steep surface gradients
associated with lowering h3 cause inverted mesh elements
and hence numerical instabilities.
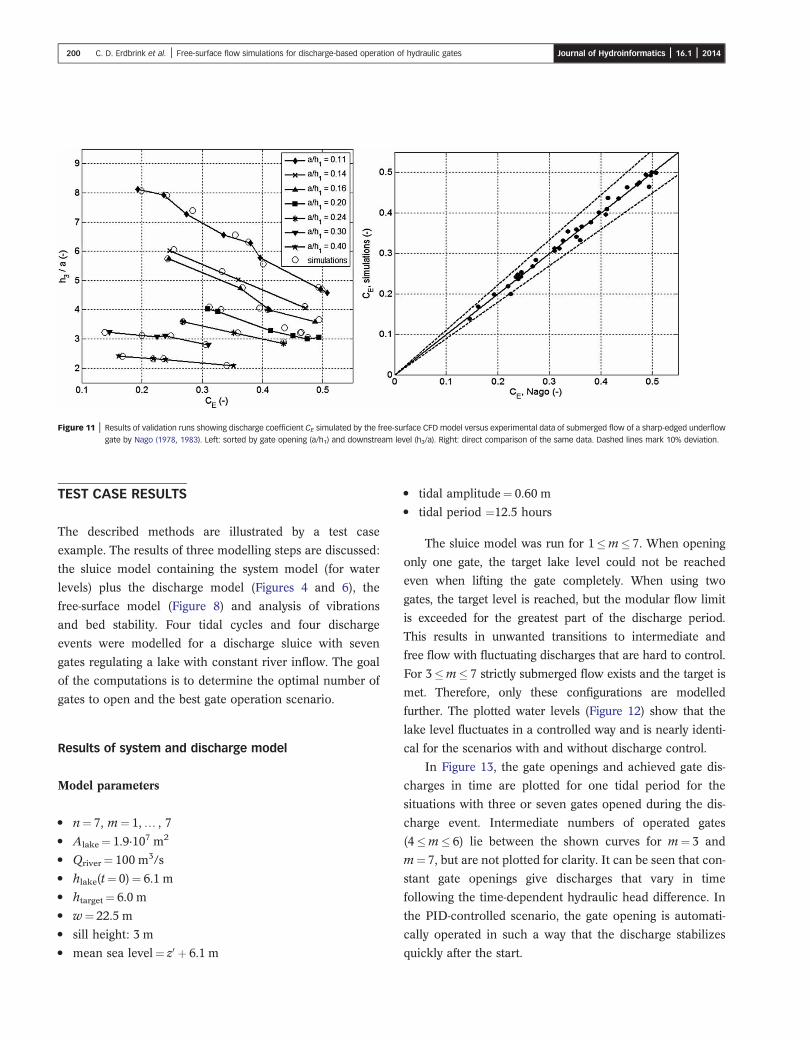
Figure 11 | Results of validation runs showing discharge coefficient CE simulated by the free-surface CFD model versus experimental data of submerged flow of a sharp-edged underflow
gate by Nago (1978, 1983). Left: sorted by gate opening (a/h1) and downstream level (h3/a). Right: direct comparison of the same data. Dashed lines mark 10% deviation.
200 C. D. Erdbrink et al. | Free-surface flow simulations for discharge-based operation of hydraulic gates Journal of Hydroinformatics | 16.1 | 2014
TEST CASE RESULTS
The described methods are illustrated by a test case
example. The results of three modelling steps are discussed:
the sluice model containing the system model (for water
levels) plus the discharge model (Figures 4 and 6), the
free-surface model (Figure 8) and analysis of vibrations
and bed stability. Four tidal cycles and four discharge
events were modelled for a discharge sluice with seven
gates regulating a lake with constant river inflow. The goal
of the computations is to determine the optimal number of
gates to open and the best gate operation scenario.
Results of system and discharge model
Model parameters
• n¼ 7, m¼ 1,… , 7
• Alake¼ 1.9·107 m2
• Qriver¼ 100 m3/s
• hlake(t¼ 0)¼ 6.1 m
• htarget¼ 6.0 m
• w¼ 22.5 m
• sill height: 3 m
• mean sea level¼ z0 þ 6.1 m
• tidal amplitude¼ 0.60 m
• tidal period ¼12.5 hours
The sluice model was run for 1�m� 7. When opening
only one gate, the target lake level could not be reached
even when lifting the gate completely. When using two
gates, the target level is reached, but the modular flow limit
is exceeded for the greatest part of the discharge period.
This results in unwanted transitions to intermediate and
free flow with fluctuating discharges that are hard to control.
For 3�m� 7 strictly submerged flow exists and the target is
met. Therefore, only these configurations are modelled
further. The plotted water levels (Figure 12) show that the
lake level fluctuates in a controlled way and is nearly identi-
cal for the scenarios with and without discharge control.
In Figure 13, the gate openings and achieved gate dis-
charges in time are plotted for one tidal period for the
situations with three or seven gates opened during the dis-
charge event. Intermediate numbers of operated gates
(4�m� 6) lie between the shown curves for m¼ 3 and
m¼ 7, but are not plotted for clarity. It can be seen that con-
stant gate openings give discharges that vary in time
following the time-dependent hydraulic head difference. In
the PID-controlled scenario, the gate opening is automati-
cally operated in such a way that the discharge stabilizes
quickly after the start.
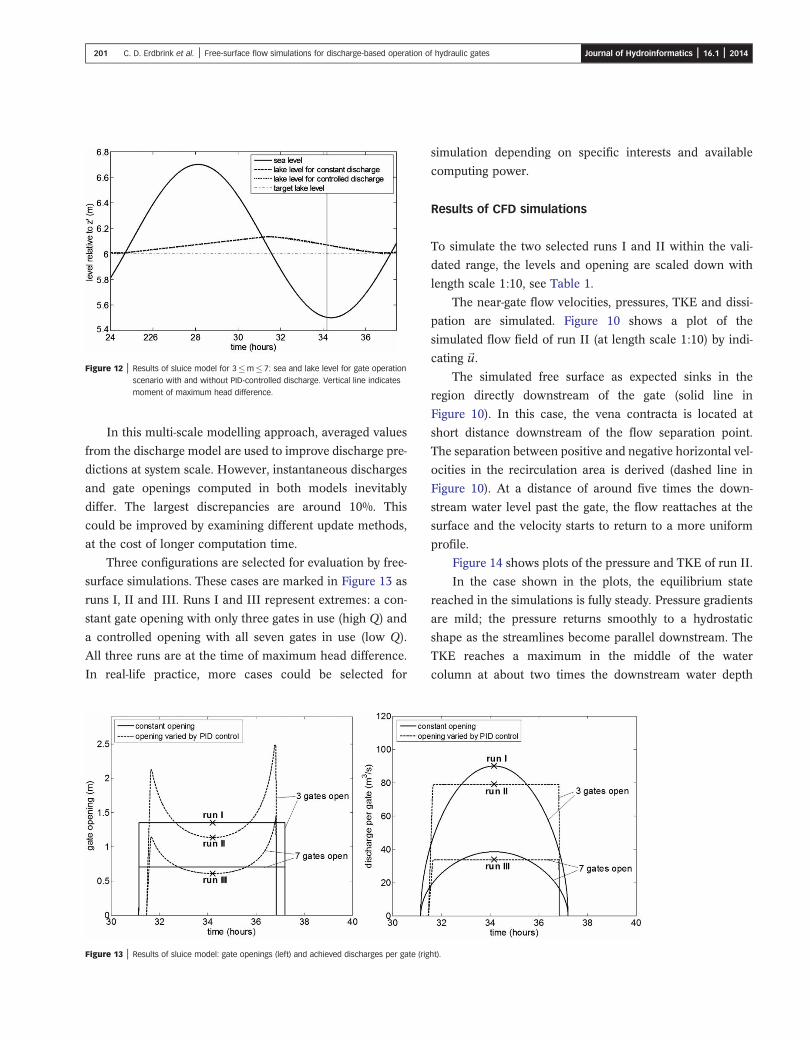
Figure 12 | Results of sluice model for 3�m� 7: sea and lake level for gate operation
scenario with and without PID-controlled discharge. Vertical line indicates
moment of maximum head difference.
201 C. D. Erdbrink et al. | Free-surface flow simulations for discharge-based operation of hydraulic gates Journal of Hydroinformatics | 16.1 | 2014
In this multi-scale modelling approach, averaged values
from the discharge model are used to improve discharge pre-
dictions at system scale. However, instantaneous discharges
and gate openings computed in both models inevitably
differ. The largest discrepancies are around 10%. This
could be improved by examining different update methods,
at the cost of longer computation time.
Three configurations are selected for evaluation by free-
surface simulations. These cases are marked in Figure 13 as
runs I, II and III. Runs I and III represent extremes: a con-
stant gate opening with only three gates in use (high Q) and
a controlled opening with all seven gates in use (low Q).
All three runs are at the time of maximum head difference.
In real-life practice, more cases could be selected for
Figure 13 | Results of sluice model: gate openings (left) and achieved discharges per gate (rig
simulation depending on specific interests and available
computing power.
Results of CFD simulations
To simulate the two selected runs I and II within the vali-
dated range, the levels and opening are scaled down with
length scale 1:10, see Table 1.
The near-gate flow velocities, pressures, TKE and dissi-
pation are simulated. Figure 10 shows a plot of the
simulated flow field of run II (at length scale 1:10) by indi-
cating ~u.
The simulated free surface as expected sinks in the
region directly downstream of the gate (solid line in
Figure 10). In this case, the vena contracta is located at
short distance downstream of the flow separation point.
The separation between positive and negative horizontal vel-
ocities in the recirculation area is derived (dashed line in
Figure 10). At a distance of around five times the down-
stream water level past the gate, the flow reattaches at the
surface and the velocity starts to return to a more uniform
profile.
Figure 14 shows plots of the pressure and TKE of run II.
In the case shown in the plots, the equilibrium state
reached in the simulations is fully steady. Pressure gradients
are mild; the pressure returns smoothly to a hydrostatic
shape as the streamlines become parallel downstream. The
TKE reaches a maximum in the middle of the water
column at about two times the downstream water depth
ht).
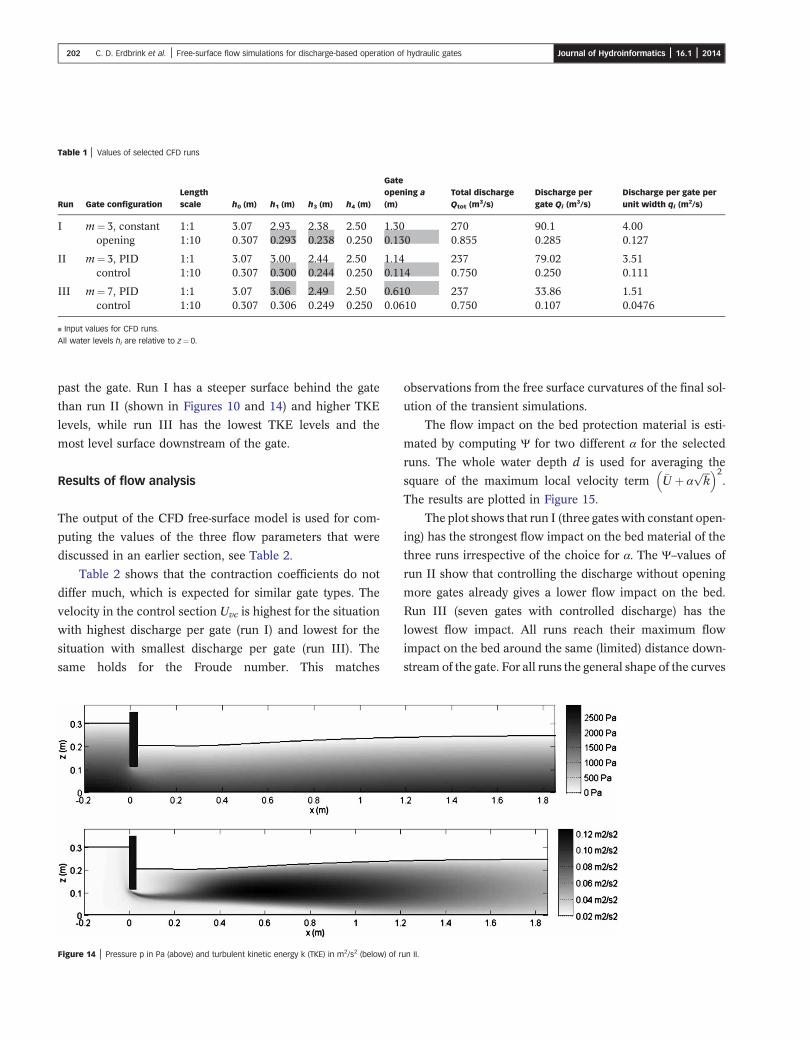
Table 1 | Values of selected CFD runs
Run Gate configurationLengthscale h0 (m) h1 (m) h3 (m) h4 (m)
Gateopening a
(m)Total dischargeQtot (m3/s)
Discharge pergate Qi (m3/s)
Discharge per gate perunit width qi (m2/s)
I m¼ 3, constantopening
1:1 3.07 2.93 2.38 2.50 1.30 270 90.1 4.001:10 0.307 0.293 0.238 0.250 0.130 0.855 0.285 0.127
II m¼ 3, PIDcontrol
1:1 3.07 3.00 2.44 2.50 1.14 237 79.02 3.511:10 0.307 0.300 0.244 0.250 0.114 0.750 0.250 0.111
III m¼ 7, PIDcontrol
1:1 3.07 3.06 2.49 2.50 0.610 237 33.86 1.511:10 0.307 0.306 0.249 0.250 0.0610 0.750 0.107 0.0476
▪ Input values for CFD runs.
All water levels hi are relative to z¼ 0.
202 C. D. Erdbrink et al. | Free-surface flow simulations for discharge-based operation of hydraulic gates Journal of Hydroinformatics | 16.1 | 2014
past the gate. Run I has a steeper surface behind the gate
than run II (shown in Figures 10 and 14) and higher TKE
levels, while run III has the lowest TKE levels and the
most level surface downstream of the gate.
Results of flow analysis
The output of the CFD free-surface model is used for com-
puting the values of the three flow parameters that were
discussed in an earlier section, see Table 2.
Table 2 shows that the contraction coefficients do not
differ much, which is expected for similar gate types. The
velocity in the control section Uvc is highest for the situation
with highest discharge per gate (run I) and lowest for the
situation with smallest discharge per gate (run III). The
same holds for the Froude number. This matches
Figure 14 | Pressure p in Pa (above) and turbulent kinetic energy k (TKE) in m2/s2 (below) of r
observations from the free surface curvatures of the final sol-
ution of the transient simulations.
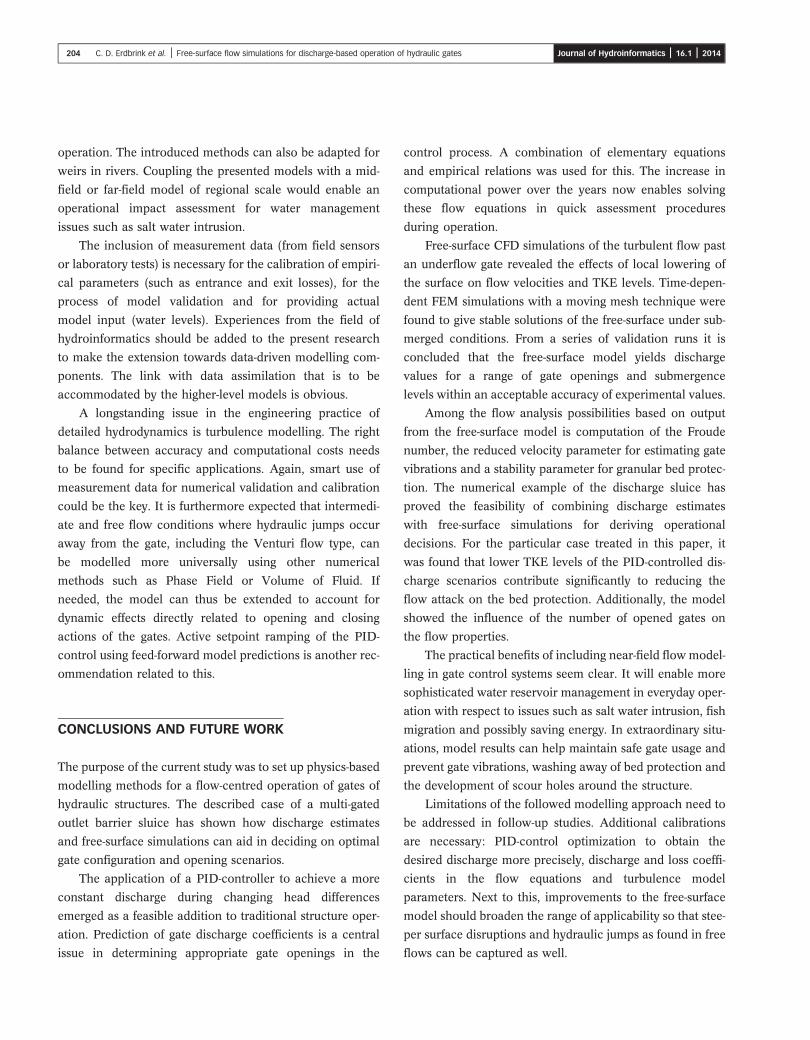
The flow impact on the bed protection material is esti-
mated by computing Ψ for two different α for the selected
runs. The whole water depth d is used for averaging the
square of the maximum local velocity term �U þ αffiffiffik
p� �2.
The results are plotted in Figure 15.
The plot shows that run I (three gates with constant open-
ing) has the strongest flow impact on the bed material of the
three runs irrespective of the choice for α. The Ψ–values of
run II show that controlling the discharge without opening
more gates already gives a lower flow impact on the bed.
Run III (seven gates with controlled discharge) has the
lowest flow impact. All runs reach their maximum flow
impact on the bed around the same (limited) distance down-
stream of the gate. For all runs the general shape of the curves
un II.
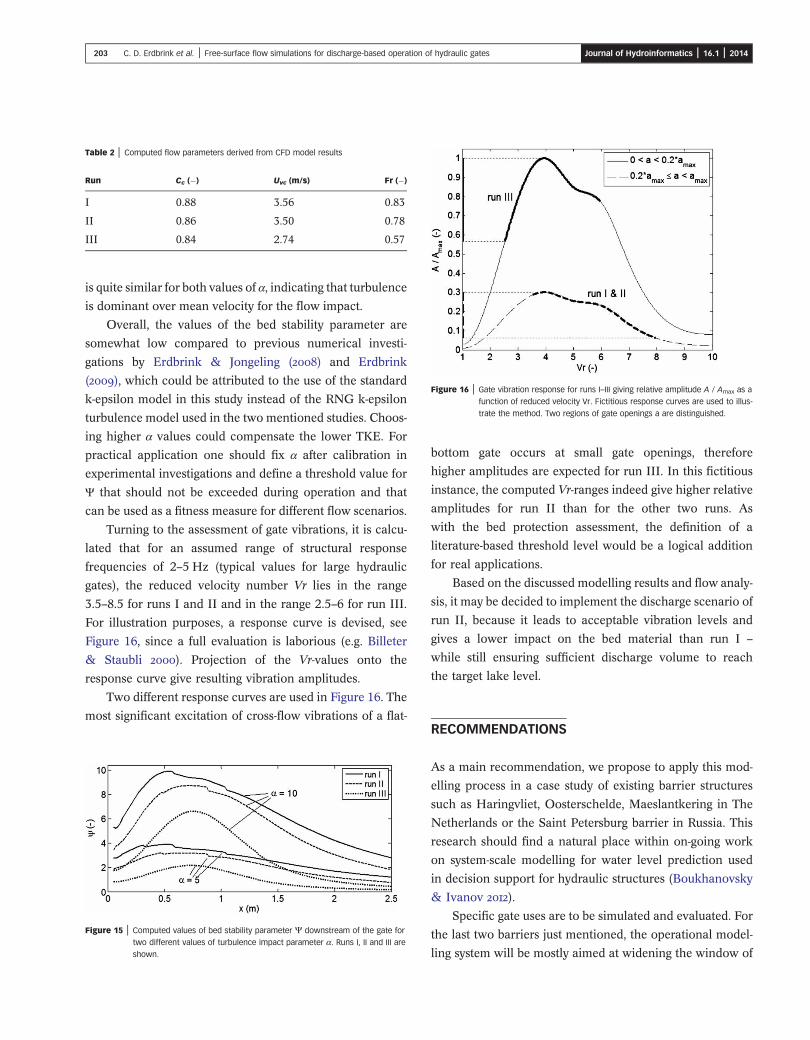
Table 2 | Computed flow parameters derived from CFD model results
Run Cc (�) Uvc (m/s) Fr (�)
I 0.88 3.56 0.83
II 0.86 3.50 0.78
III 0.84 2.74 0.57
Figure 16 | Gate vibration response for runs I–III giving relative amplitude A / Amax as a
function of reduced velocity Vr. Fictitious response curves are used to illus-
trate the method. Two regions of gate openings a are distinguished.
203 C. D. Erdbrink et al. | Free-surface flow simulations for discharge-based operation of hydraulic gates Journal of Hydroinformatics | 16.1 | 2014
is quite similar for both values of α, indicating that turbulence
is dominant over mean velocity for the flow impact.
Overall, the values of the bed stability parameter are
somewhat low compared to previous numerical investi-
gations by Erdbrink & Jongeling () and Erdbrink
(), which could be attributed to the use of the standard
k-epsilon model in this study instead of the RNG k-epsilon
turbulence model used in the two mentioned studies. Choos-
ing higher α values could compensate the lower TKE. For
practical application one should fix α after calibration in
experimental investigations and define a threshold value for
Ψ that should not be exceeded during operation and that
can be used as a fitness measure for different flow scenarios.
Turning to the assessment of gate vibrations, it is calcu-
lated that for an assumed range of structural response
frequencies of 2–5 Hz (typical values for large hydraulic
gates), the reduced velocity number Vr lies in the range
3.5–8.5 for runs I and II and in the range 2.5–6 for run III.
For illustration purposes, a response curve is devised, see
Figure 16, since a full evaluation is laborious (e.g. Billeter
& Staubli ). Projection of the Vr-values onto the
response curve give resulting vibration amplitudes.
Two different response curves are used in Figure 16. The
most significant excitation of cross-flow vibrations of a flat-
Figure 15 | Computed values of bed stability parameter Ψ downstream of the gate for
two different values of turbulence impact parameter α. Runs I, II and III are
shown.
bottom gate occurs at small gate openings, therefore
higher amplitudes are expected for run III. In this fictitious
instance, the computed Vr-ranges indeed give higher relative
amplitudes for run II than for the other two runs. As
with the bed protection assessment, the definition of a
literature-based threshold level would be a logical addition
for real applications.
Based on the discussed modelling results and flow analy-
sis, it may be decided to implement the discharge scenario of
run II, because it leads to acceptable vibration levels and
gives a lower impact on the bed material than run I –
while still ensuring sufficient discharge volume to reach
the target lake level.
RECOMMENDATIONS
As a main recommendation, we propose to apply this mod-
elling process in a case study of existing barrier structures
such as Haringvliet, Oosterschelde, Maeslantkering in The
Netherlands or the Saint Petersburg barrier in Russia. This
research should find a natural place within on-going work
on system-scale modelling for water level prediction used
in decision support for hydraulic structures (Boukhanovsky
& Ivanov ).
Specific gate uses are to be simulated and evaluated. For
the last two barriers just mentioned, the operational model-
ling system will be mostly aimed at widening the window of
204 C. D. Erdbrink et al. | Free-surface flow simulations for discharge-based operation of hydraulic gates Journal of Hydroinformatics | 16.1 | 2014
operation. The introduced methods can also be adapted for
weirs in rivers. Coupling the presented models with a mid-
field or far-field model of regional scale would enable an
operational impact assessment for water management
issues such as salt water intrusion.
The inclusion of measurement data (from field sensors
or laboratory tests) is necessary for the calibration of empiri-
cal parameters (such as entrance and exit losses), for the
process of model validation and for providing actual
model input (water levels). Experiences from the field of
hydroinformatics should be added to the present research
to make the extension towards data-driven modelling com-
ponents. The link with data assimilation that is to be
accommodated by the higher-level models is obvious.
A longstanding issue in the engineering practice of
detailed hydrodynamics is turbulence modelling. The right
balance between accuracy and computational costs needs
to be found for specific applications. Again, smart use of
measurement data for numerical validation and calibration
could be the key. It is furthermore expected that intermedi-
ate and free flow conditions where hydraulic jumps occur
away from the gate, including the Venturi flow type, can
be modelled more universally using other numerical
methods such as Phase Field or Volume of Fluid. If
needed, the model can thus be extended to account for
dynamic effects directly related to opening and closing
actions of the gates. Active setpoint ramping of the PID-
control using feed-forward model predictions is another rec-
ommendation related to this.
CONCLUSIONS AND FUTURE WORK
The purpose of the current study was to set up physics-based
modelling methods for a flow-centred operation of gates of
hydraulic structures. The described case of a multi-gated
outlet barrier sluice has shown how discharge estimates
and free-surface simulations can aid in deciding on optimal
gate configuration and opening scenarios.
The application of a PID-controller to achieve a more
constant discharge during changing head differences
emerged as a feasible addition to traditional structure oper-
ation. Prediction of gate discharge coefficients is a central
issue in determining appropriate gate openings in the
control process. A combination of elementary equations
and empirical relations was used for this. The increase in
computational power over the years now enables solving
these flow equations in quick assessment procedures
during operation.
Free-surface CFD simulations of the turbulent flow past
an underflow gate revealed the effects of local lowering of
the surface on flow velocities and TKE levels. Time-depen-
dent FEM simulations with a moving mesh technique were
found to give stable solutions of the free-surface under sub-
merged conditions. From a series of validation runs it is
concluded that the free-surface model yields discharge
values for a range of gate openings and submergence
levels within an acceptable accuracy of experimental values.
Among the flow analysis possibilities based on output
from the free-surface model is computation of the Froude
number, the reduced velocity parameter for estimating gate
vibrations and a stability parameter for granular bed protec-
tion. The numerical example of the discharge sluice has
proved the feasibility of combining discharge estimates
with free-surface simulations for deriving operational
decisions. For the particular case treated in this paper, it
was found that lower TKE levels of the PID-controlled dis-
charge scenarios contribute significantly to reducing the
flow attack on the bed protection. Additionally, the model
showed the influence of the number of opened gates on
the flow properties.
The practical benefits of including near-field flowmodel-
ling in gate control systems seem clear. It will enable more
sophisticated water reservoir management in everyday oper-
ation with respect to issues such as salt water intrusion, fish
migration and possibly saving energy. In extraordinary situ-
ations, model results can help maintain safe gate usage and
prevent gate vibrations, washing away of bed protection and
the development of scour holes around the structure.
Limitations of the followed modelling approach need to
be addressed in follow-up studies. Additional calibrations
are necessary: PID-control optimization to obtain the
desired discharge more precisely, discharge and loss coeffi-
cients in the flow equations and turbulence model
parameters. Next to this, improvements to the free-surface
model should broaden the range of applicability so that stee-
per surface disruptions and hydraulic jumps as found in free
flows can be captured as well.
205 C. D. Erdbrink et al. | Free-surface flow simulations for discharge-based operation of hydraulic gates Journal of Hydroinformatics | 16.1 | 2014
The physics-based model of this study is logically com-
plemented by data-driven techniques in future studies. It is
believed that hydroinformatics provides the required tools
for this. Use of sensor data from real-life structures and
coupling to system-scale water level prediction models are
seen as next steps. Moreover, it should be investigated
how operational decisions should be derived when taking
into account the various criteria and flow constraints.
ACKNOWLEDGEMENTS
This work was supported by the EU FP7 project
UrbanFlood, grant N 248767; by the Leading Scientist
Program of the Russian Federation, contract 11.
G34.31.0019 and by the BiG Grid project BG-020-10,
#2010/01550/NCF with financial support from The
Netherlands Organisation for Scientific Research NWO. It
is carried out in collaboration with Deltares.
REFERENCES
Akoz, M. S., Kirkgoz, M. S. & Oner, A. A. Experimental andnumerical modeling of a sluice gate flow. J. Hydraul. Res. 47(2), 167–176.
Azamathulla, H. Md. Gene expression programming forprediction of scour depth downstream of sills. J. Hydrol.460–461, 156–159.
Azmathullah, H. M. D., Deo, M. C. & Deolalikar, P. B. Estimation of scour below spillways using neural networks.J. Hydraul. Res. 44 (1), 61–69.
Battjes, J. A. Vloeistofmechanica. Lecture notes CT2100,Delft University of Technology, Fac. of Civil Eng. &Geosciences, Fluid Mechanics section.
Becker, B. P. J. & Schwanenberg, D. Conjunctive real timecontrol and hydrodynamic modelling in application to Rhineriver. In: HIC 2012: Proceedings of the 10th InternationalConference on Hydroinformatics. Hamburg, Germany, 14–18July, 2012. TuTech Verlag, Hamburg.
Billeter, P. & Staubli, T. Flow-induced multiple-modevibrations of gates with submerged discharge. J. Fluids Struct.14, 323–338.
Blevins, R. D. Flow-induced Vibration, 2nd edn.Van Nostrand Reinhold, New York.
Boiten, W. Vertical gates as flow measures structures. In:Proceedings of the 2nd International Conference onHydraulic Modelling. Stratford-upon-Avon, UK, 14–16June 1994, pp. 33–44. BHR Group, London.
Bollaert, E. F. R., Munodawafa, M. C. & Mazvidza, D. Z. Kariba dam plunge pool scour: quasi-3D numericalpredictions. In: Proceedings of the International Conferenceon Scour and Erosion ISCE6, Paris, August 27–31, 2012.
Boukhanovsky, A. V. & Ivanov, S. V. Urgent computing foroperational storm surge forecasting in Saint Petersburg. Proc.Comput. Sci. 9, 1704–1712.
Breusers, H. N. C. Conformity and time-scale in two-dimensional local scour. In: Proceedings of the Symposiumon Model and Prototype Conformity. Hydr. Res. Lab., Poona,India, pp. 1–8.
Brown, F. T. Engineering System Dynamics: A UnifiedGraph-centred Approach, 2nd edn. Taylor & Francis Group,Boca Raton, FL, USA.
Chow, V. T. Open-Channel Hydraulics. McGraw-Hill,New York.
Castro-Orgaz, O. & Hager, W. H. Critical flow:a historical perspective. J. Hydraul. Eng. 136, 3–11.
Deltares a Delft3D-Flow User Manual (Hydro-Morphodynamics) – version: 3.15.20508. Available from:http://oss.deltares.nl/web/opendelft3d.
Deltares b SOBEK-RE User Manual. Available from: http://sobek-re.deltares.nl and www.deltaressystems.com.
Donea, J., Huerta, A., Ponthot, J.-Ph. & Rodríguez-Ferran, A. Arbitrary Lagrangian–Eulerian methods. In: TheEncyclopedia of Computational Mechanics (E. Stein, R. DeBorst & T. J. R. Hughes, eds). Vol. 1. John Wiley & Sons,Bognor Regis, UK, pp. 413–437.
Erdbrink, C. D. Ontwerpmethodiek granulairebodemverdediging met CFX ongestructureerd. Deltaresresearch report 1200257-003, kennisonline.deltares.nl.
Erdbrink, C. D. Physical model tests on vertical flow-inducedvibrations of an underflow gate. Deltares research report1202229-004, kennisonline.deltares.nl.
Erdbrink, C. D. & Jongeling, T. H. G. Computations of theturbulent flow about square and round piers with agranular bed protection: 3D flow computations with CFX.Deltares research report Q4386/Q4593, kennisonline.deltares.nl.
Erdbrink, C. D., Krzhizhanovskaya, V. V. & Sloot, P. M. A. Controlling flow-induced vibrations of flood barrier gateswith data-driven and finite-element modelling. In:Comprehensive Flood Risk Management (F. Klijn & T.Schweckendiek, eds). CRC Press/Balkema (Taylor & FrancisGroup), Leiden, Proceedings of the 2nd EuropeanConference on Flood Risk Management FLOODrisk 2012.20–22 November 2012, Rotterdam, The Netherlands,pp. 425–434. Available from www.crcpress.com/product/isbn/9780415621441.
Ferziger, J. H. & Peric, M. Computational Methods for FluidDynamics, 3rd edn. Springer-Verlag, Berlin, Heidelberg,New York.
Habibzadeh, A., Vatankhah, A. R. & Rajaratnam, N. Role ofenergy loss on discharge characteristics of sluice gates. J.Hydraul. Eng. 137 (9), 1079–1084.
206 C. D. Erdbrink et al. | Free-surface flow simulations for discharge-based operation of hydraulic gates Journal of Hydroinformatics | 16.1 | 2014
Hardwick, J. D. Flow-induced vibration of vertical-lift gate.J. Hydraul. Div. Proc. ASCE 100 (5), 631–644.
Hoan, N. T., Stive, M., Booij, R., Hofland, B. & Verhagen, H. Stone stability in nonuniform flow. J. Hydraul. Eng. 137 (9),884–893.
Hoffmans, G. J. C. M. & Pilarczyk, K. W. Local scourdownstream of hydraulic structures. J. Hydraul. Eng. 121 (4),326–340.
Hofland, B. Rock & Roll – Turbulence-Induced Damage toGranular Bed Protections. PhD Thesis, Delft University ofTechnology, The Netherlands.
Ivanov, S. V., Kosukhin, S. S., Kaluzhnaya, A. V. &Boukhanovsky, A. V. Simulation-based collaborativedecision support for surge floods prevention in St.Petersburg. J. Comput. Sci. 3 (6), 450–455.
Jongeling, T.H.G.&Erdbrink,C.D. Dynamicavanbeweegbarewaterkeringen – Trillingen in onderstroomde schuiven enuitgangspunten voor een schaalmodelopstelling. Deltaresresearch report 1200216-000, kennisonline.deltares.nl.
Jongeling, T. H. G., Blom, A., Jagers, H. R. A., Stolker, C. &Verheij, H. J. Design method granular protections. WL|Delft Hydraulics, Technical report Q2933/Q3018.
Khan, L. A., Wicklein, E. A. & Rashid, M. A 3D CFD modelanalysis of the hydraulics of an outfall structure at a powerplant. J. Hydroinform. 7 (4), 283–290.
Khorchani, M. & Blanpain, O. Development of a dischargeequation for side weirs using artificial neural networks.J. Hydroinform. 7 (1), 31–39.
Kim, D.-G. Numerical analysis of free flow past a sluice gate.KSCE J. Civil Eng. (Water Eng.) 11 (2), 127–132.
Kolkman, P. A. Discharge relations and component headlosses for hydraulic structures. In:Hydraulic Structures DesignManual 8 (D. S. Miller, ed.). IAHR/AIRH, Balkema, pp. 55–151. Also published in 1989 as Delft Hydraulics report Q953.
Krzhizhanovskaya, V. V., Shirshov, G. S., Melnikova, N. B.,Belleman, R. G., Rusadi, F. I., Broekhuijsen, B. J., Gouldby,B. P., Lhomme, J., Balis, B., Bubak, M., Pyayt, A. L., Mokhov,I. I., Ozhigin, A. V., Lang, B. & Meijer, R. J. Flood earlywarning system: design, implementation and computationalmodules. Proc. Comput. Sci. 4, 106–115.
Martin, D., Bertasi, F., Colangelo, M. A., De Vries, M., Frost, M.,Hawkins, S. J., Macpherson, E., Moschella, P. S., Satta, M. P.,Thompson, R. C. & Ceccherelli, V. U. Ecological impactof coastal defence structures on sediment and mobile fauna:Evaluating and forecasting consequences of unavoidablemodifications of native habitats. Coast. Eng. 52, 1027–1051.
Melnikova, N. B., Shirshov, G. S. & Krzhizhanovskaya, V. V. Virtual dike: multiscale simulation of dike stability. Proc.Comput. Sci. 4, 791–800.
Nago, H. Influence of gate-shapes on discharge coefficients.Trans. JSCE 10, 116–119. Original in Japanese: Proc. of JSCE270, Feb. 1978, 59–71.
Nago, H. Discharge coefficient of underflow gate in openchannel. Research Report Department of Civil Engineering,Okayama University, Japan.
Nam, P. T., Larson, M., Hanson, H. & Xuan Hoan, L. A numerical model of beach morphological evolution due towaves and currents in the vicinity of coastal structures.Coast. Eng. 58, 863–876.
Naudascher, E. & Rockwell, D. Flow-induced Vibrations –
An Engineering Guide. Dover Publications, New York.Pengel, B., Krzhizhanovskaya, V. V., Melnikova, N. B., Shirshov,
G. S., Koelewijn, A. R., Pyayt, A. L. & Mokhov, I. I. Flood early warning system: sensors and internet. In: IAHSRed Book, N 357, Floods: From Risk to Opportunity(A. Chavoshian & K. Takeuchi, eds). IAHS Press,Wallingford, UK, pp. 445–453. Available from www.iahs.info/uploads/dms/15684.357%20445-453.pdf.
Pyayt, A. L., Mokhov, I. I., Kozionov, A., Kusherbaeva, V.,Melnikova, N. B., Krzhizhanovskaya, V. V. & Meijer, R. J.a Artificial intelligence and finite element modelling formonitoring flood defence structures. IEEE Workshop onEnvironmental, Energy, and Structural Monitoring Systems.September 2011. pp. 1–7. Available from http://dx.doi.org/10.1109/EESMS.2011.6067047.
Pyayt, A. L., Mokhov, I. I., Lang, B., Krzhizhanovskaya, V. V. &Meijer, R. J. b Machine learning methods forenvironmental monitoring and flood protection.World Acad.Sci. Eng. Technol. 54, 118–123. Available from http://waset.org/journals/waset/v54/v54-23.pdf.
Rijkswaterstaat Haringvlietsluizen op een kier – Effecten opnatuur en gebruiksfuncties. Stuurgroep Realisatie de Kier,report AP/2004.07, Dutch Ministry of Public Works.
Roth, A. & Hager, W. H. Underflow of standard sluice gate.Exp. Fluids 27 (4), 339–350.
Shields, A. Anwendung der Aehnlichkeitsmechanik und derTurbulenzforschung auf die Geschiebebetrieb. Mitteilungender Preussischen Versuchsanstalt fur Wasserbau undSchiffbau, Heft 26.
Solomatine, D. P. & Ostfeld, A. Data-driven modelling: somepast experiences and new approaches. J. Hydroinform. 10 (1),3–22.
Stelling, G. S. & Booij, N. Computational modelling of flowand transport. Lecture notes CTwa4340, Delft University ofTechnology, The Netherlands.
Warmink, J. J., Van der Klis, H., Booij, M. J. & Hulscher, S. J. M.H. Identification and quantification of uncertainties inriver models using expert elicitation. In: Proc. Conf.NCR-days 2008 (A. G. van Os & C. D. Erdbrink, eds).NCR-Publications, 33–2008, Delft, pp. 40–41.
Warmink, J. J., Janssen, J. A. E. B., Booij, M. J. & Krol, M. S. Identification and classification of uncertainties in theapplication of environmental models. Environ. Model.Software 25, 1518–1527.
First received 15 November 2012; accepted in revised form 28 June 2013. Available online 5 August 2013


![Trelles Electrode patterns in arc discharge simulations ...faculty.uml.edu/Juan...Electrode_patterns_in_arc_discharge_simulations-Effect_of_anode...phenomena [17]. Additionally, the](https://img.dokumen.tips/doc/110x75/5ec8ed319b8dea117c41a96a/trelles-electrode-patterns-in-arc-discharge-simulations-phenomena-17.jpg)


![Edinburgh Research Explorer · ESP Electrical Submersible Pump ... flow simulations carried out in PIPESIM [34] and empirical pressure and heat loss calculations integrated with](https://img.dokumen.tips/doc/110x75/5af6d2e77f8b9ae9488f4251/edinburgh-research-electrical-submersible-pump-ow-simulations-carried-out.jpg)