Embed Size (px)
Citation preview
IGG:TE ISM 17/3
INTERGOVERNMENTAL GROUP ON TEA
INTERSESSIONAL MEETING
Report of the Working Group on Global Tea Market
Analysis and Promotion1
1 Submitted by China.

IGG/Tea: ISM 17/3
Background
The Intergovernmental Group on Tea (IGG/Tea), at its Twenty-second session held in Naivasha, Kenya, in May 2016, constituted a Working Group (WG) on Global Tea Market Analysis and Promotion to encourage world tea consumption. China is the Chair of this WG, and member countries are Canada, India, Kenya, Sri Lanka, and United Kingdom.
The overall objectives of the WG are as follows:
1. To promote the sustainable development of tea industry in the world.
2. To promote international tea trade and investment.
3. To keep up with the international tea market situation and trends, identify new characteristics of tea consumption market.
4. To help tea producers, suppliers and distributors to understand the current and future trends in this market and formulate their business strategies accordingly.
Since this is the first year this WG is constituted, there are difficulties in market investigation globally and collection of market information from various countries, this report firstly analyzes the global tea market mainly by using macro data, and then provides the tea market information of several large tea consumption countries in the world.
Activities of the Working Group
1. Collection of information in international and domestic tea markets. Since preferences of tea and tea drinking habits vary among countries, it is difficult to obtain specific information and data on tea consumption in various countries. By far, information on tea consumption situation, structure change and future trends has been obtained from three of the largest tea consuming countries, namely, the USA, the United Kingdom and Canada. Member countries should cooperate and share information.
2. The First China International Tea Expo. In order to promote the development of the tea industry, enhance tea culture exchange and international tea trade, China held the First China International Tea Expo in Hangzhou, Zhejiang Province, on 18-21 May 18-21 2017. The event attracted participants from 47 tea and coffee producing countries, international organizations and large-scale international tea distribution enterprises, with more than 260 international exhibitors. The Expo will grow into an important platform for exchanges and cooperation between China and the rest of the world and should promote the development of the world's tea industry and start a new chapter for the tea industry and tea culture.
2

IGG/Tea: ISM 17/3
Action Plan1. Joint research and development and information-sharing among tea producing and consuming countries.
2. Undertake market studies, surveys, research projects, analyze the collected data and provide market report.
3. Member countries should provide their domestic tea consumption market dynamics and possible marketing strategies.
4. Market promotion activities and events at the international level.
Report of the Working Group on Global Tea Market Analysis and Promotion
1. World tea consumption marketTea currently represents the world’s second most popular beverage after water. It is prepared by pouring hot or boiling water over cured tea leaves. At present, there are about 50 countries and regions where tea is grown, and more than 160 countries and regions have tea drinking habits. Approximately 3 billion people around the world consume tea.
1.1 Quality preferences
Quality preferences by importing countries impacted on trade flows and prices. For instance, Ceylon Tea was preferred by Russia and the Commonwealth of Independent States (CIS) countries; cut-tear-curl (CTC) tea was favored largely by the UK, Pakistan and Egypt; and in North America, light-liquoring teas were in demand.
When it comes to flavors, tea consumption differs from one country to another. Overall, consumers in a country such as Korea, where green tea consumption has a long history, like teas with green vegetative characteristics the most. The consumers in countries such as Thailand or the USA, where green tea consumption is a more recent phenomenon, teas that are brown, fruity, honey-like and that do not have strong green flavors are preferred. Those less liked teas did appeal to smaller groups of consumers and, thus, can be launched to target specific consumer groups in the market (Lee, et al., 2010).
1.2 Product and process development of tea
Traditional loose tea has been largely replaced by bagged tea in many forms, due to convenience. There are a range of preferences for tea styles and drinking habits among different consumers in various countries. This product and process development has added-value to the tea products (see Table 1 for some examples).
3
IGG/Tea: ISM 17/3
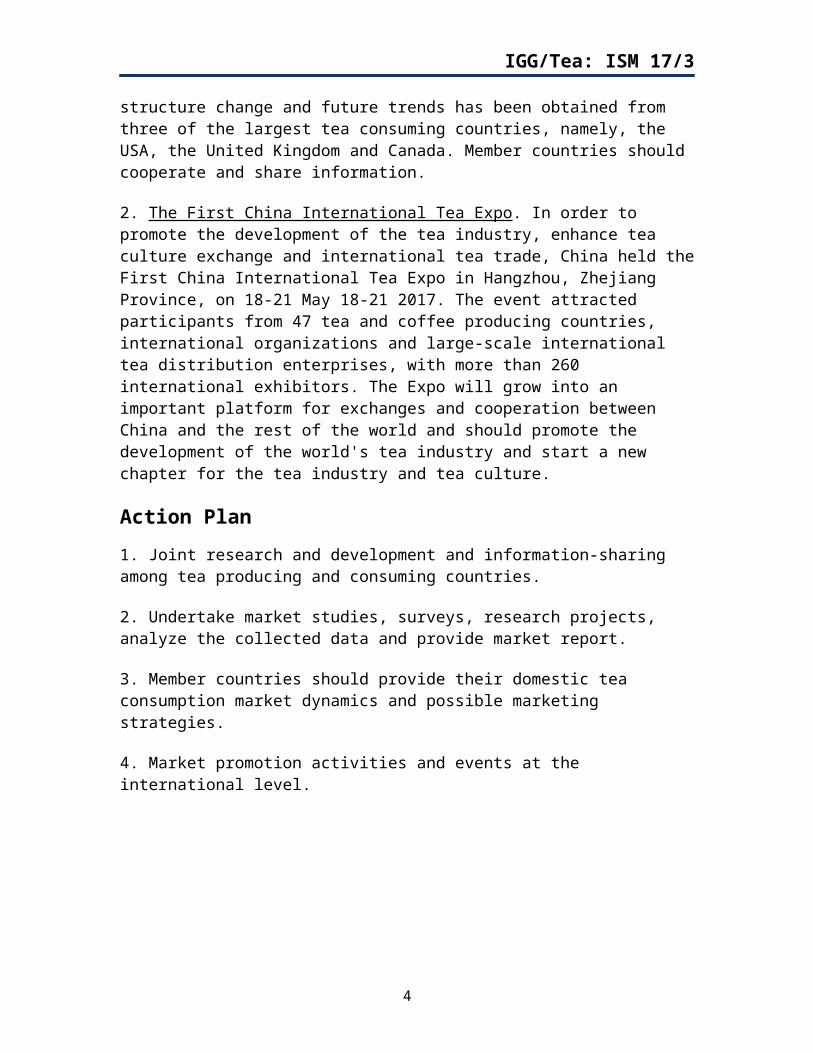
Table 1: Tea preferences in different countries
Types of tea CountriesIced-tea USA
Fruit flavored tea Europe“Foamy” tea TaiwanHerbal tea USA, China, Japan, Thailand
Ready to drink tea Japan, USA, Taiwan (in cans)
Green and black tea will still be major forms of tea. However, instant tea, flavored tea, decaffeinated tea, organically-grown tea, “foamy” tea, herbal tea, ready-to-drink tea (canned and bottled) will develop in-roads into the market. Food products which are being developed are tea-rice, tea-noodles, tea-cake, tea-biscuits, tea-wine, tea-candy and tea-ice cream.
2. The US tea marketTea can be found in almost 80 percent of US households, and it is the only beverage commonly served hot or iced, anytime, anywhere, for any occasion. According to the Tea Association of the USA, on any given day, over 158 million Americans are drinking tea.
For the US tea industry, 2016 continued to be a year of growth. In 2015, the US was the fourth largest importer of tea in the world, after Russia, Pakistan and United Kingdom, and the only western country to grow in tea imports and consumption. The total wholesale value of tea sold in the US grew from less than USD 2 billion in 1990 to over USD 10 billion in 2014. In 2016, total US black and green tea imports were approximately 130.64 thousand tons, with an estimated wholesale value of approximately USD 12 billion. The preference for healthier beverages is driving consumers away from soda and boosting the demand for tea and other categories like bottled water.
2.1 Annual consumption
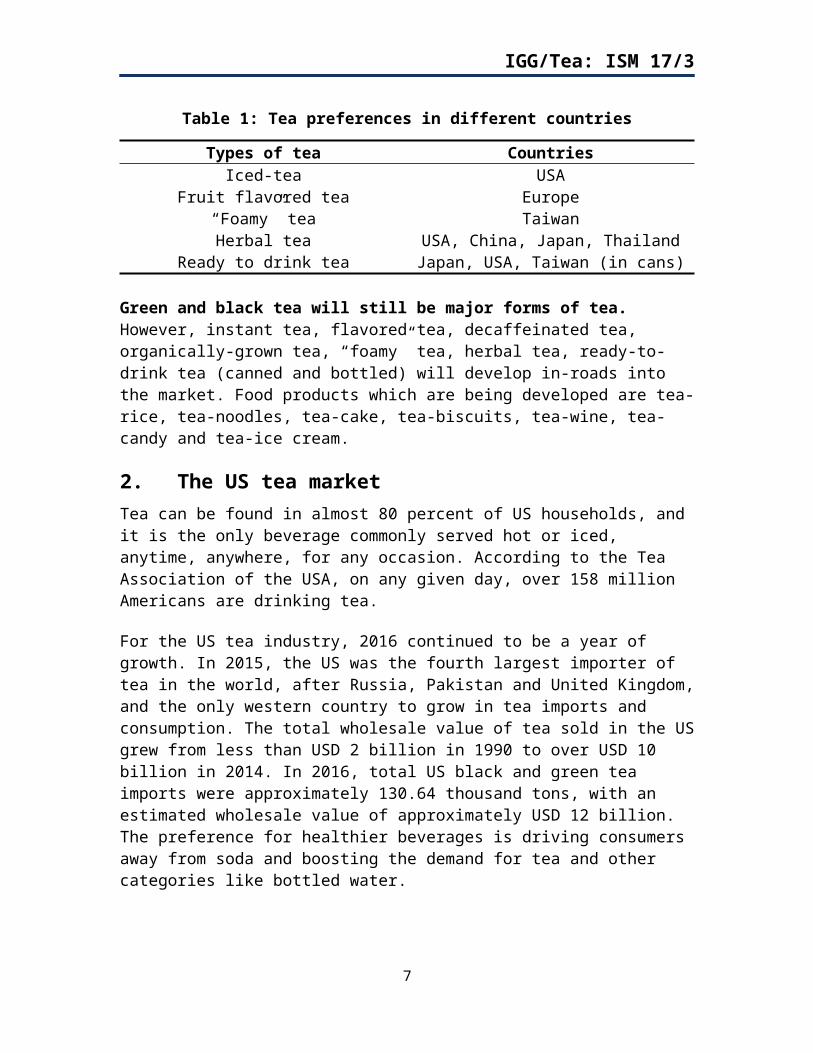
In 2016, almost 84 billion servings of tea, or more than 3.8 billion gallons, were consumed in the US. About 80 percent of all tea consumed was black tea, 16 percent was green tea, and the remaining 4 percent of tea consumption was oolong, white and dark tea (Table 2).
Table 2: Tea Consumption structure in US
Tea category 2014 2016
Black Tea 84% 80%Green Tea 15% 16%
Others (Oolong, White, and Dark Tea) 1% 4%
Source: Tea Association of the USA
4

IGG/Tea: ISM 17/3
2.2 Anticipated sales
The industry anticipates strong, continuous growth, with a CAGR (Compound Annual Growth Rate) of 4-6%. This growth will come from all segments driven by variety, convenience, health benefits, sustainability, availability, continued innovation and the discovery of unique, flavorful and high-end Specialty Tea. Future success also relies on the adoption of tea by new consumers who are looking for healthy beverage options.
Figure 1: US tea market: total wholesale value 1990-2015
1990 2012 2013 2014 2015*0.5
2.5
4.5
6.5
8.5
10.5
12.5
1.84
9.7910.41
10.8411.5
sale
s in
billi
on U
.S. d
olla
rs
Total wholesale tea sales in the United States from 1990 to 2015 (in billion U.S. dollars)Source: Tea Association of the USA; Statista 2017
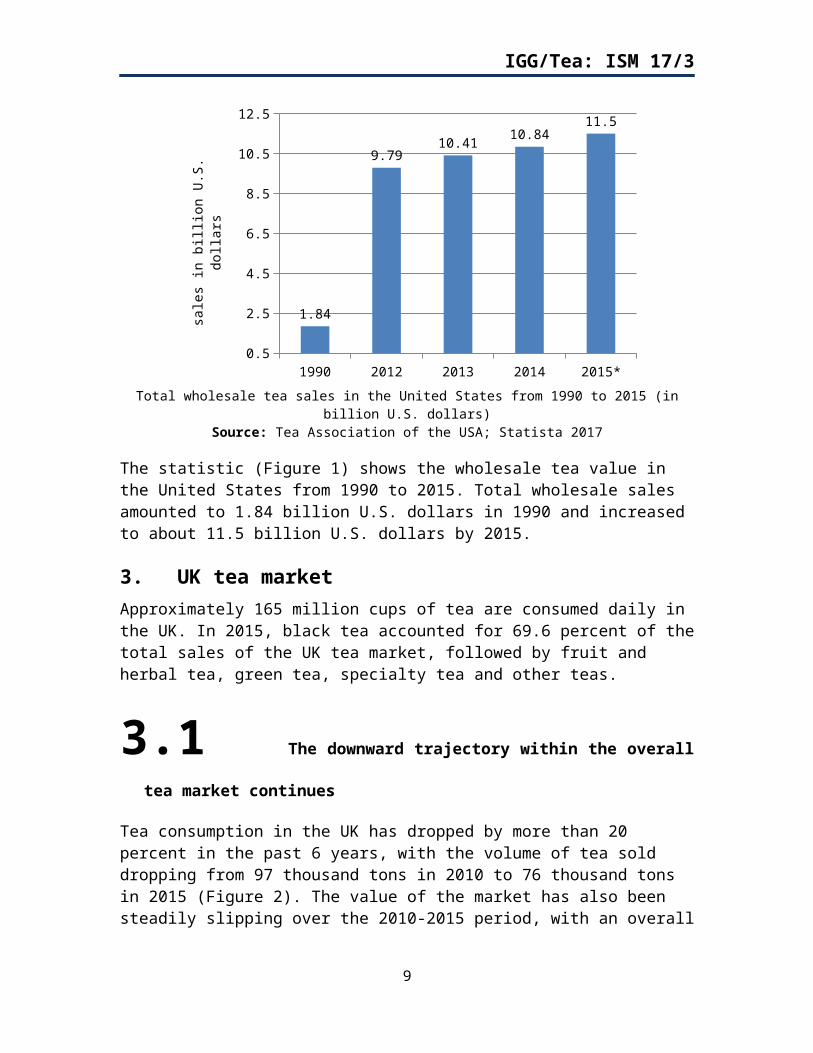
The statistic (Figure 1) shows the wholesale tea value in the United States from 1990 to 2015. Total wholesale sales amounted to 1.84 billion U.S. dollars in 1990 and increased to about 11.5 billion U.S. dollars by 2015.
3. UK tea marketApproximately 165 million cups of tea are consumed daily in the UK. In 2015, black tea accounted for 69.6 percent of the total sales of the UK tea market, followed by fruit and herbal tea, green tea, specialty tea and other teas.
3.1 The downward trajectory within the overall tea market continues
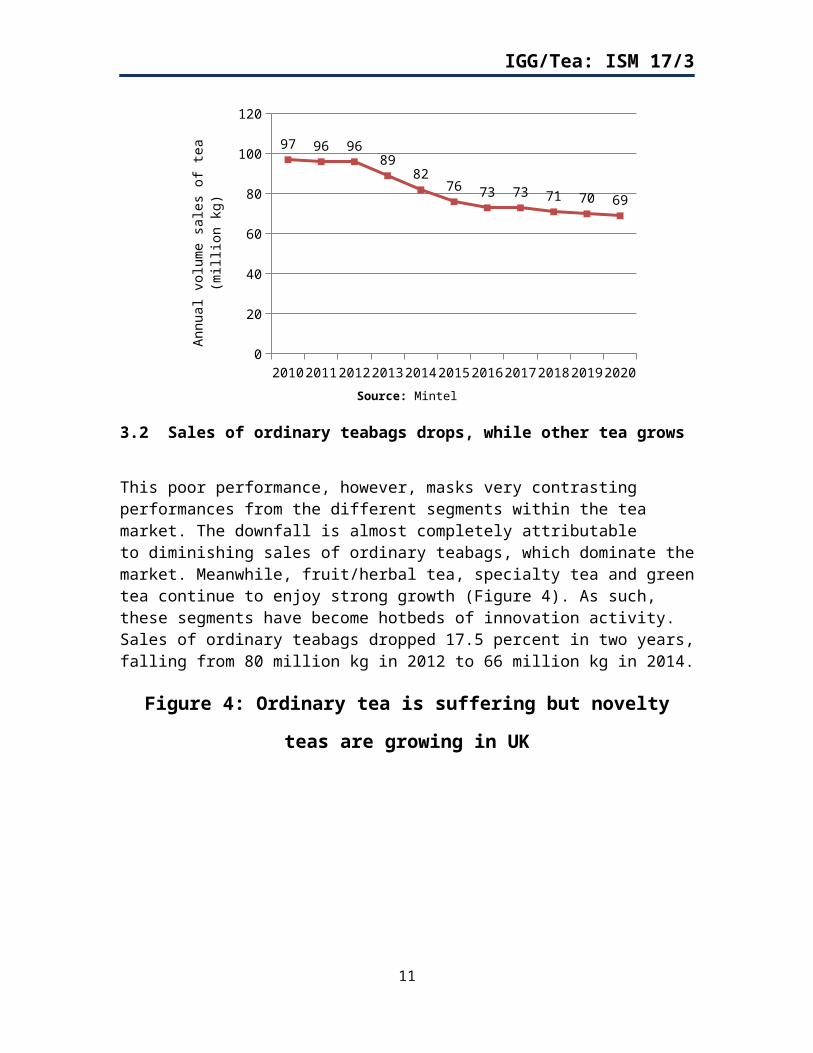
Tea consumption in the UK has dropped by more than 20 percent in the past 6 years, with the volume of tea sold dropping from 97 thousand tons in 2010 to 76 thousand tons in 2015 (Figure 2). The value of the market has also been steadily slipping over the 2010-2015 period, with an overall decline of 6 percent to GBP 654 million. Consumers are opting for more exciting hot beverages (Mintel).
5

IGG/Tea: ISM 17/3
Figure 2: Market share of tea in the United Kingdom (UK) in 2015, based on value
Black tea Fruit and
Herbal Green Specialty Tea other
0.0%
10.0%
20.0%
30.0%
40.0%
50.0%
60.0%
70.0%
80.0%
69.6%
12.2%7.1% 5.7% 5.4%
mar
ket s
hare
Source: Statista 2017
Figure 3: Tea consumption has dropped by 22% in six years in UK
2010 2011 2012 2013 2014 2015 2016 2017 2018 2019 20200
20
40
60
80
100
120
97 96 9689
8276 73 73 71 70 69
Ann
ual v
olum
e sa
les o
f tea
(mill
ion
kg)
Source: Mintel
6
IGG/Tea: ISM 17/3
3.2 Sales of ordinary teabags drops, while other tea grows
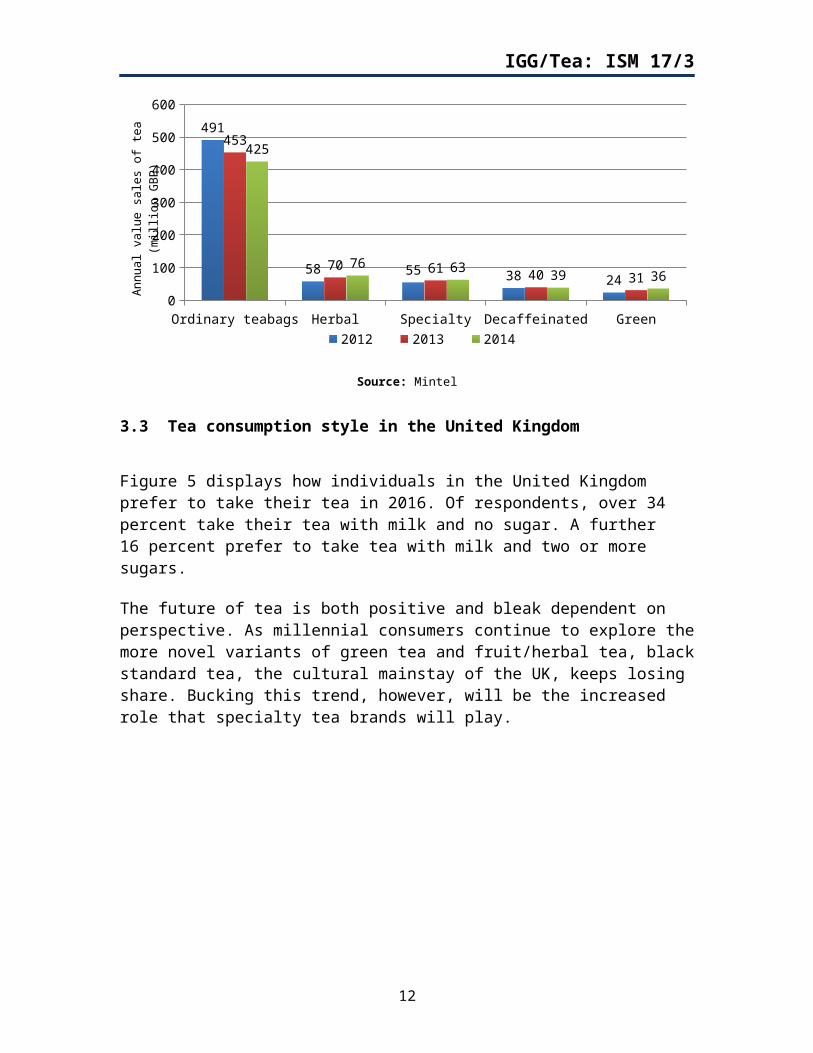
This poor performance, however, masks very contrasting performances from the different segments within the tea market. The downfall is almost completely attributable to diminishing sales of ordinary teabags, which dominate the market. Meanwhile, fruit/herbal tea, specialty tea and green tea continue to enjoy strong growth (Figure 4). As such, these segments have become hotbeds of innovation activity. Sales of ordinary teabags dropped 17.5 percent in two years, falling from 80 million kg in 2012 to 66 million kg in 2014.
Figure 4: Ordinary tea is suffering but novelty teas are growing in UK
Ordinary teabags Herbal Specialty Decaffeinated Green0
100
200
300
400
500
600
491
58 55 38 24
453
70 61 40 31
425
76 63 39 36
2012 2013 2014
Annu
al v
alue
sal
es o
f tea
(mill
ion
GBP
)
Source: Mintel
3.3 Tea consumption style in the United Kingdom
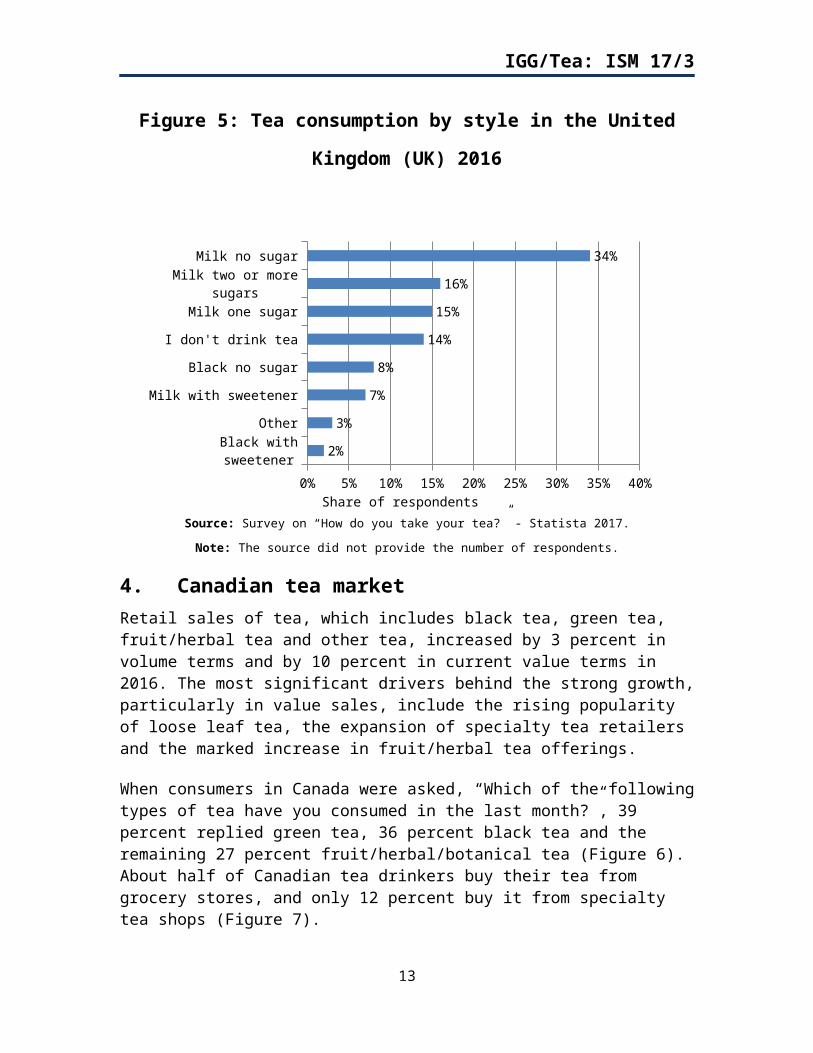
Figure 5 displays how individuals in the United Kingdom prefer to take their tea in 2016. Of respondents, over 34 percent take their tea with milk and no sugar. A further 16 percent prefer to take tea with milk and two or more sugars.
The future of tea is both positive and bleak dependent on perspective. As millennial consumers continue to explore the more novel variants of green tea and fruit/herbal tea, black standard tea, the cultural mainstay of the UK, keeps losing share. Bucking this trend, however, will be the increased role that specialty tea brands will play.
7
IGG/Tea: ISM 17/3
Figure 5: Tea consumption by style in the United Kingdom (UK) 2016
Milk no sugar
Milk two or more sugars
Milk one sugar
I don't drink tea
Black no sugar
Milk with sweetener
Other
Black with sweetener
0% 5% 10% 15% 20% 25% 30% 35% 40%
34%
16%
15%
14%
8%
7%
3%
2%
Share of respondentsSource: Survey on “How do you take your tea?” - Statista 2017.
Note: The source did not provide the number of respondents.
4. Canadian tea marketRetail sales of tea, which includes black tea, green tea, fruit/herbal tea and other tea, increased by 3 percent in volume terms and by 10 percent in current value terms in 2016. The most significant drivers behind the strong growth, particularly in value sales, include the rising popularity of loose leaf tea, the expansion of specialty tea retailers and the marked increase in fruit/herbal tea offerings.
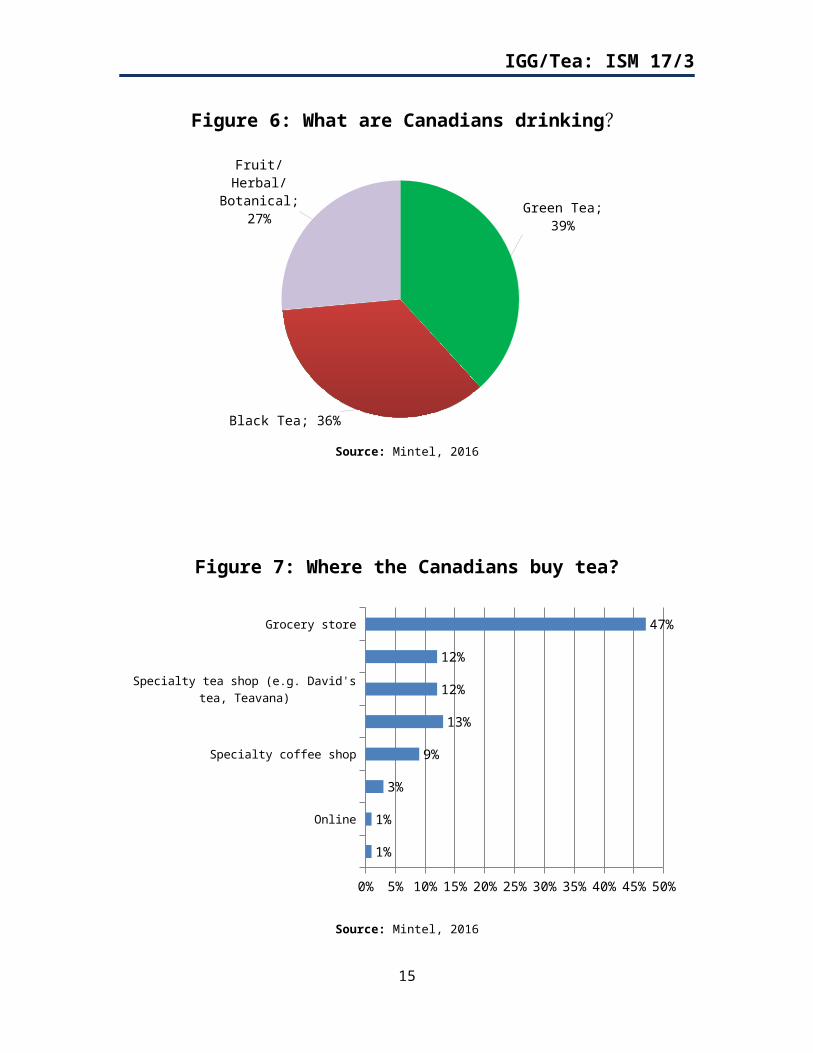
When consumers in Canada were asked, “Which of the following types of tea have you consumed in the last month?”, 39 percent replied green tea, 36 percent black tea and the remaining 27 percent fruit/herbal/botanical tea (Figure 6). About half of Canadian tea drinkers buy their tea from grocery stores, and only 12 percent buy it from specialty tea shops (Figure 7).
8
IGG/Tea: ISM 17/3
Figure 6: What are Canadians drinking?
Green Tea; 39%
Black Tea; 36%
Fruit/Herbal/Botanical; 27%
Source: Mintel, 2016
Figure 7: Where the Canadians buy tea?
Grocery store
Mass merchandise store (e.g. Walmart, Costco)
Specialty tea shop (e.g. David's tea, Teavana)
Coffee shop
Specialty coffee shop
Department store
Online
Tea room
0% 5% 10% 15% 20% 25% 30% 35% 40% 45% 50%
47%
12%
12%
13%
9%
3%
1%
1%
Source: Mintel, 2016
9

IGG/Tea: ISM 17/3
5. Chinese tea market5.1 Tea production
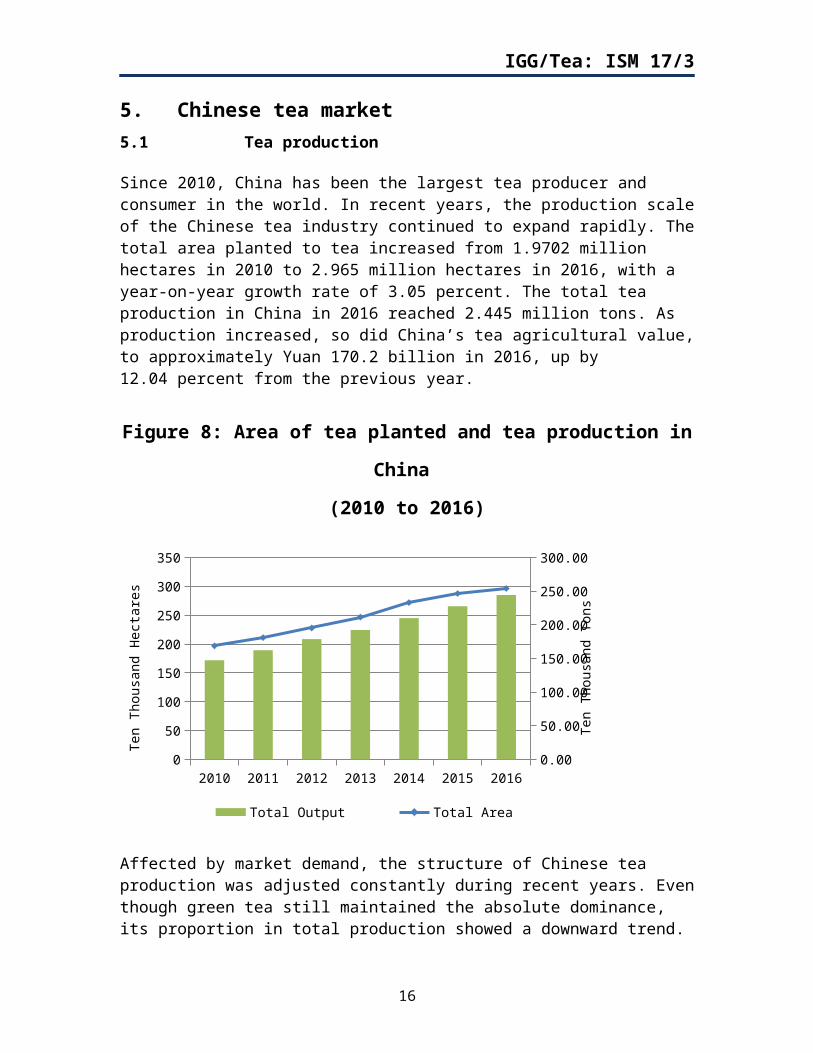
Since 2010, China has been the largest tea producer and consumer in the world. In recent years, the production scale of the Chinese tea industry continued to expand rapidly. The total area planted to tea increased from 1.9702 million hectares in 2010 to 2.965 million hectares in 2016, with a year-on-year growth rate of 3.05 percent. The total tea production in China in 2016 reached 2.445 million tons. As production increased, so did China’s tea agricultural value, to approximately Yuan 170.2 billion in 2016, up by 12.04 percent from the previous year.
Figure 8: Area of tea planted and tea production in China
(2010 to 2016)
2010 2011 2012 2013 2014 2015 20160
50
100
150
200
250
300
350
0.00
50.00
100.00
150.00
200.00
250.00
300.00
Total Output Total Area
Ten
Thou
sand
Hec
tare
s
Ten
Thou
sand
Ton
s
Affected by market demand, the structure of Chinese tea production was adjusted constantly during recent years. Even though green tea still maintained the absolute dominance, its proportion in total production showed a downward trend. Since 2010, green tea production increased annually, reaching 1.5091 million tons in 2016, but the proportion declined, just 61.71 percent in 2016, compared with 63.13 percent in 2015. Production of black tea, dark tea and white tea increased rapidly, as well as their status. The growth of black tea and dark tea (excluding puer) production was over 10 percent in 2015, reaching 297.9 thousand tons and 334.8 thousand tons, respectively. Oolong tea production was more than 271.2 thousand tons, increasing by 4.8 percent. Over 20 thousand tons of white tea was produced.
10
IGG/Tea: ISM 17/3
5.2 Tea consumption
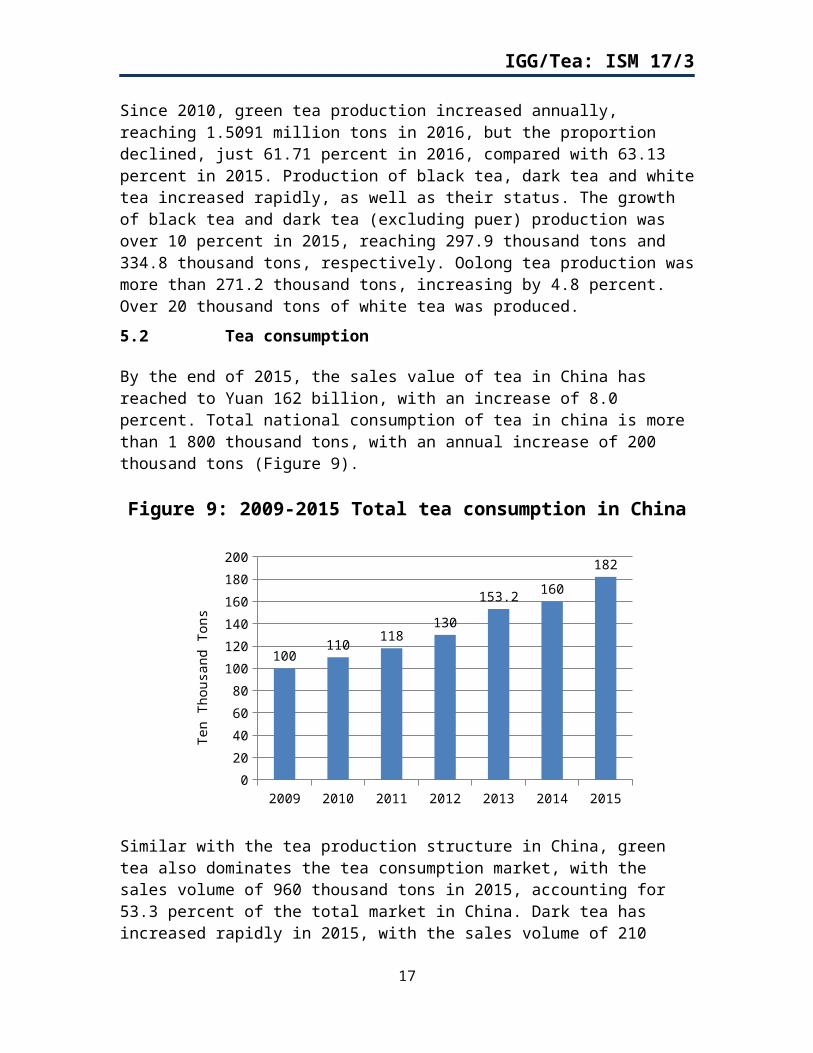
By the end of 2015, the sales value of tea in China has reached to Yuan 162 billion, with an increase of 8.0 percent. Total national consumption of tea in china is more than 1 800 thousand tons, with an annual increase of 200 thousand tons (Figure 9).
Figure 9: 2009-2015 Total tea consumption in China
2009 2010 2011 2012 2013 2014 20150
20
40
60
80
100
120
140
160
180
200
100110
118130
153.2 160
182
Ten
Thou
sand
Ton
s
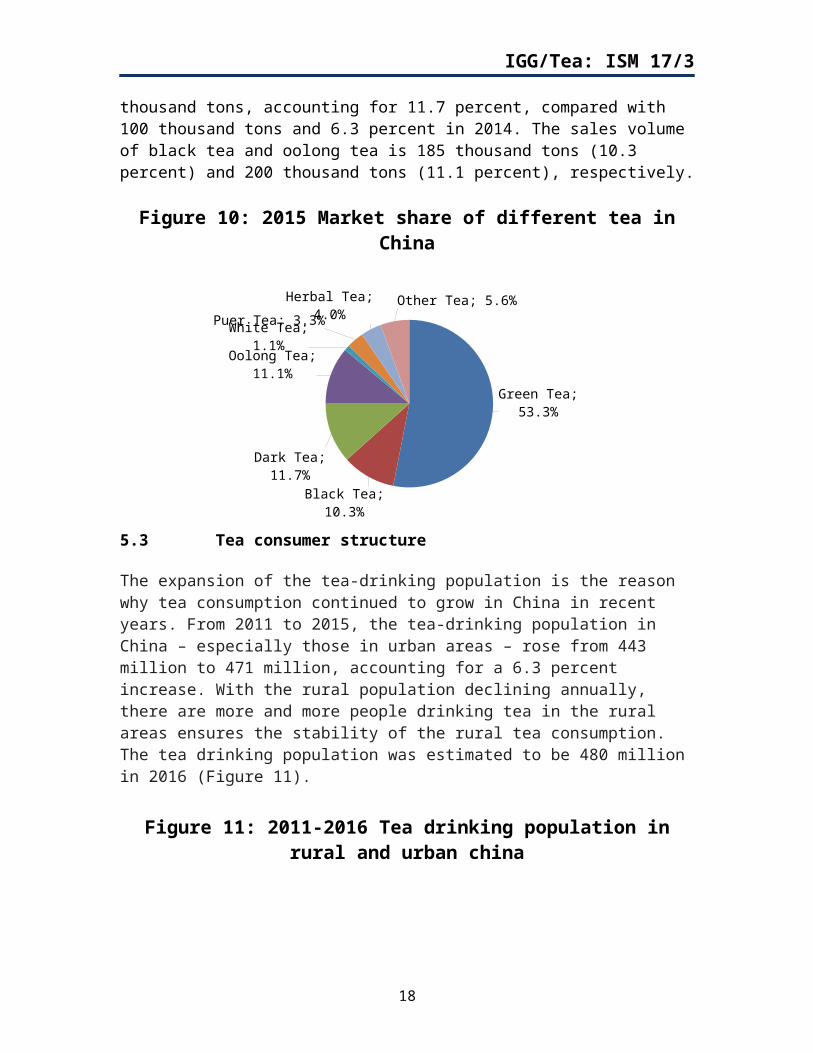
Similar with the tea production structure in China, green tea also dominates the tea consumption market, with the sales volume of 960 thousand tons in 2015, accounting for 53.3 percent of the total market in China. Dark tea has increased rapidly in 2015, with the sales volume of 210 thousand tons, accounting for 11.7 percent, compared with 100 thousand tons and 6.3 percent in 2014. The sales volume of black tea and oolong tea is 185 thousand tons (10.3 percent) and 200 thousand tons (11.1 percent), respectively.
Figure 10: 2015 Market share of different tea in China
Green Tea; 53.3%
Black Tea; 10.3%
Dark Tea; 11.7%
Oolong Tea; 11.1%
White Tea; 1.1%
Puer Tea; 3.3%Herbal Tea; 4.0%Other Tea; 5.6%
11
IGG/Tea: ISM 17/3
5.3 Tea consumer structure
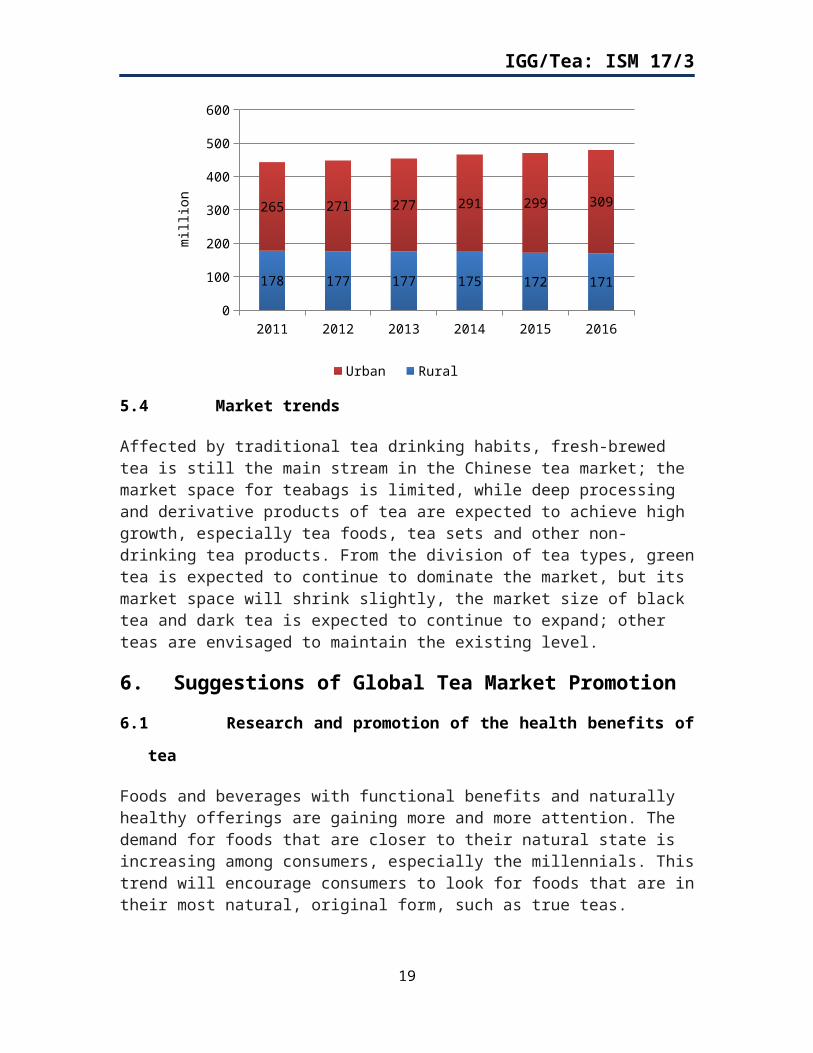
The expansion of the tea-drinking population is the reason why tea consumption continued to grow in China in recent years. From 2011 to 2015, the tea-drinking population in China – especially those in urban areas – rose from 443 million to 471 million, accounting for a 6.3 percent increase. With the rural population declining annually, there are more and more people drinking tea in the rural areas ensures the stability of the rural tea consumption. The tea drinking population was estimated to be 480 million in 2016 (Figure 11).
Figure 11: 2011-2016 Tea drinking population in rural and urban china
2011 2012 2013 2014 2015 20160
100
200
300
400
500
600
178 177 177 175 172 171
265 271 277 291 299 309
Urban Rural
mill
ion
5.4 Market trends
Affected by traditional tea drinking habits, fresh-brewed tea is still the main stream in the Chinese tea market; the market space for teabags is limited, while deep processing and derivative products of tea are expected to achieve high growth, especially tea foods, tea sets and other non-drinking tea products. From the division of tea types, green tea is expected to continue to dominate the market, but its market space will shrink slightly, the market size of black tea and dark tea is expected to continue to expand; other teas are envisaged to maintain the existing level.
6. Suggestions of Global Tea Market Promotion
6.1 Research and promotion of the health benefits of tea
Foods and beverages with functional benefits and naturally healthy offerings are gaining more and more attention. The demand for foods that are closer to their natural state is increasing among consumers, especially the millennials. This trend will encourage consumers to look for foods that are in their most natural, original form, such as true teas.
12
IGG/Tea: ISM 17/3
6.2 Develop new products to meet the diverse demand
Improve the usage efficiency of tea resources; enhance the research and development level of the tea, and develop new derivatives of tea, such as tea drinks, tea food, tea daily necessities, tea cosmetics, tea health products, tea crafts, etc., to meet the diverse demands of mass consumption.
6.3 Promote tea culture
The culture of tea could be promoted by using the upcoming “Global Tea Day” and by improving consumers’ recognition of tea around the world through hosting tea ceremonies that could expose various tea culture themes in producing and consuming countries. This would ensure that consumers know the story behind the products, such as the origins, histories and flavors of the tea they are drinking.
6.4 Pay more attention to the young consumer groups
In China, more and more young people are beginning to drink tea. Firstly, as China becomes an aging society, young people are becoming the main force of social consumption. Secondly, young people have become the main body of the internet economy that is playing an increasingly important role in tea sales channels. The intense life space has forced young people to pay more attention to their health, and they are more aware of the health benefit of drinking tea. Therefore, investigation and research should be taken to meet their demand.
7. Conclusions In the specific tea consumption market, the US and Canadian tea markets continued to grow, while the UK tea market, on the other hand, continued to decline, mainly due to diminishing sales of ordinary teabags. Meanwhile, green tea, fruit/herbal tea and specialty tea are expected to become a new growth point.
Tea is one of the few natural beverages in the world; it does not contain salt, fat or any other calorie substances. Tea contains more than 450 kinds of organic compounds, more than 15 kinds of inorganic minerals, and most of these ingredients have the effect of health and disease prevention. As early as 1989, an investigation by the United Nations’ World Health Organization has shown that one of the mysteries of human longevity is "more tea and less smoking". Today, people are pursuing better health and more natural foods, so there will be great space for the tea market. In order to promote developments in the tea industry, more investigation and research are required to be undertaken to identify consumer demands and to develop the right product.
13

IGG/Tea: ISM 17/3
Appendix
Overview of world tea market
China, India, Kenya and Sri Lanka are the world's major tea producing and exporting countries. In China and India, tea is mainly consumed domestically. In Kenya and Sri Lanka, however, tea is mainly exported, and their domestic consumption is limited.
1. World tea production
More than 5 280 million kg of tea was produced globally in 2015, of which more than 1 998 million kg or 38 percent of total production found a place in the international export market. Though tea is produced by a large number of countries, its production is dominated by four countries: China, India, Kenya and Sri Lanka. These four countries account for more than 75 percent of production and 60 percent of global export in recent years. In addition, countries like Vietnam and Indonesia have increased their shares substantially both in production and in export recently.
Figure 1: 2001-2015 World tea production
20012002
20032004
20052006
20072008
20092010
20112012
20132014
20150
1000
2000
3000
4000
5000
6000
thou
sand
tonn
es
Source: FAO, International Tea Committee
14
IGG/Tea: ISM 17/3
Figure 2: Production share of world’ top four tea producing countries
2006 2007 2008 2009 2010 2011 2012 2013 2014 20150.00%
5.00%
10.00%
15.00%
20.00%
25.00%
30.00%
35.00%
40.00%
45.00%
50.00%
China India Kenya Sri Lanka
Source: International Tea Committee
Figure 3: Production of the world’s top four tea producing countries
2006 2007 2008 2009 2010 2011 2012 2013 2014 20150.00
500.00
1000.00
1500.00
2000.00
2500.00
China India Kenya Sri Lanka
thou
sand
tonn
es
Source: International Tea Committee
15
IGG/Tea: ISM 17/3
Table 1: Top 10 producing countries of tea, 2011-2015
2011 2012 2013
Country Thousand Tons Percent Country Thousand
Tons Percent Country Thousand Tons Percent
China 1623 35.6% China 1789.753 38.1% China 1924.457 38.5%India 1095.46 24.0% India 1135.07 24.2% India 1208.78 24.2%
Kenya 377.912 8.3% Kenya 369.4 7.9% Kenya 432.4 8.7%Sri Lanka 327.5 7.2% Sri Lanka 330 7.0% Sri Lanka 340.23 6.8%
Turkey 221.6 4.9% Turkey 225 4.8% Viet Nam 217.7 4.4%Viet Nam 206.6 4.5% Viet Nam 211.5 4.5% Turkey 212.4 4.3%Indonesia 150.2 3.3% Indonesia 143.4 3.1% Indonesia 145.8 2.9%
Iran (Islamic Republic of) 103.89 2.3%
Iran (Islamic Republic
of)
95.272 2.0%
Iran (Islamic Republic
of)
116.818 2.3%
Argentina 92.892 2.0% Myanmar 94.6 2.0% Myanmar 96.3 1.9%Japan 82.1 1.8% Japan 85.9 1.8% Japan 84.8 1.7%World 4561 — World 4693 — World 4993 —Total — 93.86% Total — 95.46% Total — 95.73%
2014 2015Country Thousand Tons Percent Country Thousand Tons PercentChina 2095.57 40.3% China 2278 43.0%India 1207.31 23.2% India 1208.66 22.8%
Kenya 445.105 8.6% Kenya 399.211 7.5%Sri Lanka 338.032 6.5% Sri Lanka 328.964 6.2%Viet Nam 228.36 4.4% Turkey 258.541 4.9%
Turkey 226.8 4.4% Viet Nam 170 3.1%Indonesia 154.4 3.0% Indonesia 129.293 2.4%
Iran (Islamic Republic of) 119.388 2.3% Argentina 83 1.6%Myanmar 98.6 1.9% Japan 76.4 1.4%Argentina 85.401 1.6% Bangladesh 66.347 1.3%
World 5195 — World 5285 —Total — 96.23% Total — 94.2%
Source: FAO, International Tea Committee
16
IGG/Tea: ISM 17/3
Table 2: Top 10 Exporting Countries of Tea, 2011-2015
2011 2012 2013
Exporter Thousand Tons Percent Exporter Thousand
Tons Percent Exporter Thousand Tons Percent
Kenya 388.344 18.08% Kenya 380.357 18.65% Kenya 448.809 20.30%China 322.58 15.02% Sri Lanka 318.397 15.61% Sri Lanka 355.25 16.07%India 322.548 15.02% China 313.484 15.37% China 325.806 14.74%
Sri Lanka 321.074 14.95% India 225.082 11.04% India 254.841 11.53%Viet Nam 134.528 6.26% Viet Nam 146.899 7.20% Viet Nam 141.021 6.38%Argentina 86.65 4.03% Argentina 78.056 3.83% Argentina 77.335 3.50%
Indonesia 75.45 3.51% Indonesia 70.071 3.44% Indonesia 70.842 3.20%
United Kingdom 62.323 2.90% Uganda 55.21 2.71% Uganda 62.018 2.81%
Uganda 55.256 2.57%United Arab
Emirates48.551 2.38%
United Arab
Emirates61.788 2.79%
Malawi 46.007 2.14% Malawi 42.494 2.08% Malawi 43.245 1.96%World 2148.092 — World 2039.587 World 2210.972 —Total — 84.48% Total — 82.30% Total — 83.26%
2014 2015
Exporter Thousand Tons Percent Exporter Thousand
Tons Percent
Kenya 458.728 21.60% Kenya 410.039 20.52%Sri Lanka 325.141 15.31% China 324.949 16.26%
China 301.484 14.20% Sri Lanka 304.835 15.25%India 212.606 10.01% India 235.132 11.77%
Viet Nam 132.252 6.23% Viet Nam 125.186 6.26%Argentina 76.892 3.62% Argentina 76.029 3.80%
United Arab Emirates 71.342 3.36% Indonesia 61.915 3.10%
Indonesia 66.399 3.13% Uganda 53.319 2.67%Uganda 59.687 2.81% Free Zones 39.26 1.96%
Malawi 48.227 2.27% Malawi 38.785 1.94%
World 2123.831 — World 1998.377 —Total — 82.53% Total — 83.54%
Source: International trade committee
17
IGG/Tea: ISM 17/3
Table 3: Top 10 Importing Countries of Tea, 2011-2015
2011 2012 2013
Importers Thousand Tons Percent Importers Thousand
Tons Percent Importers Thousand Tons Percent
Russian Federation 187.77 10.06% Russian
Federation 180.49 9.05% Russian Federation 173.07 8.74%
UK 154.60 8.28% UK 144.11 7.23% UAE 147.88 7.47%
USA 127.54 6.83% Afghanistan 135.64 6.80% UK 137.62 6.95%
Pakistan 119.23 6.39% USA 125.59 6.30% USA 130.16 6.57%
Egypt 100.42 5.38% UAE 123.19 6.18% Iran 122.93 6.21%
Morocco 65.84 3.53% Pakistan 122.30 6.13% Pakistan 121.90 6.15%
Afghanistan 63.22 3.39% Egypt 109.38 5.49% Egypt 104.70 5.29%
Germany 57.64 3.09% Iran 77.88 3.91% Afghanistan 81.98 4.14%
Iran 56.27 3.01% Germany 58.86 2.95% Morocco 57.31 2.89%Poland 48.78 2.61% Morocco 53.08 2.66% Germany 55.23 2.79%World 1866.80 — World 1993.96 — World 1980.67 —Total — 52.57% Total — 56.70% Total — 57.19%
2014 2015
Importers ThousandTons Percent Importers Thousand
Tons Percent
Iraq 221.34 10.24% Russian Federation 173.07 8.76%
Russian Federation 172.61 7.99% Pakistan 164.64 8.34%
Pakistan 150.95 6.99% United Kingdom 135.23 6.85%
United Arab Emirates 149.15 6.90% United States of
America 129.71 6.57%
United States of America 129.25 5.98% United Arab
Emirates 104.21 5.28%
United Kingdom 128.12 5.93% Kenya 97.01 4.91%
Egypt 103.25 4.78% Egypt 87.95 4.45%
Afghanistan 85.08 3.94% Afghanistan 72.36 3.66%
Iran, Islamic Republic of 73.38 3.40% Iran, Islamic
Republic of 70.25 3.56%
Morocco 59.00 2.73% Morocco 64.44 3.26%World 2160.52 — World 1974.92 —Total — 58.88% Total — 55.64%
Source: International trade committee
18
IGG/Tea: ISM 17/3
2. World tea export market structure
2.1 Kenya tea export
Kenya mainly exports tea to Egypt, Pakistan, UK, Afghanistan and Sudan, the five countries accounted for about 70 percent of Kenya's total tea exports.
2010 2011 2012
Importer Thousand Tons Percent Importer Thousand
Tons Percent Importer Thousand Tons Percent
Egypt 77.00 18.44% United Kingdom 72.04 18.55% Pakistan 79.33 20.86%
Pakistan 73.96 17.71% Pakistan 69.75 17.96% Egypt 66.52 17.49%United
Kingdom 69.22 16.57% Egypt 67.51 17.39% United Kingdom 57.42 15.10%
Afghanistan 49.05 11.74% Afghanistan 46.07 11.86% Afghanistan 41.79 10.99%
Sudan (before 2012)
32.51 7.78%Sudan (before 2012)
24.75 6.37% Sudan 22.97 6.04%
United Arab
Emirates21.09 5.05%
United Arab
Emirates19.99 5.15% United Arab
Emirates 22.46 5.91%
Yemen 18.18 4.35% Russian Federation 15.80 4.07% Russian
Federation 17.04 4.48%
Russian Federation 15.33 3.67% Yemen 15.66 4.03% Yemen 14.63 3.85%
Kazakhstan 10.30 2.47% Kazakhstan 12.56 3.23% Kazakhstan 11.95 3.14%
India 5.08 1.22%Iran,
Islamic Republic of
5.57 1.43% India 4.78 1.26%
Total 388.34 89.00% Total 388.344 90.05% Total 380.36 89.10%
19
IGG/Tea: ISM 17/3
2.2 China tea export
Morocco is the largest importer of China's tea export, accounting for about 20 percent of China's total tea exports, followed by the United States and Uzbekistan.
2011 2012 2013
Importer Thousand Tons
Percent Importer Thousand
Tons Percent Importer Thousand Tons
Percent
Morocco 63.59 19.68% Morocco 55.76 17.79% Morocco 61.19 18.78
%United States of America 23.86 7.39% Uzbekistan 25.86 8.25% Uzbekistan 23.42 7.19%
Uzbekistan 18.55 5.74% United States of America 24.32 7.76% United States
of America 22.08 6.78%
Japan 18.10 5.60% Japan 17.32 5.53% Mauritania 18.19 5.58%Russian
Federation 17.87 5.53% Russian Federation 15.30 4.88% Japan 17.55 5.39%
Algeria 15.91 4.93% Algeria 14.39 4.59% Russian Federation 13.53 4.15%
Mauritania 12.33 3.81% Mauritania 12.51 3.99% Algeria 13.36 4.10%Hong Kong,
China 11.48 3.55% Togo 12.18 3.88% Togo 12.19 3.74%
Iran, Islamic Republic of 11.06 3.42% Hong Kong,
China 10.21 3.26% Senegal 10.22 3.14%
Togo 9.99 3.09% Germany 9.28 2.96% Germany 10.12 3.10%World 323.11 — World 313.48 — World 325.81 —
Total — 62.74% Total — 62.89% Total — 61.95
%
2014 2015Importer Thousand Tons Percent Importer Thousand Tons PercentMorocco 59.00 19.56% Morocco 64.44 19.81%
Togo 16.89 5.18% Uzbekistan 26.80 8.24%Uzbekistan 16.39 5.03% Senegal 17.22 5.29%
United States of America 15.30 4.70% United States of
America 16.36 5.03%
Algeria 15.01 4.61% Algeria 14.37 4.42%Japan 14.55 4.47% Togo 13.31 4.09%
Mauritania 14.10 4.33% Japan 13.07 4.02%Russian Federation 13.93 4.28% Mauritania 12.87 3.95%
Senegal 13.33 4.09% Russian Federation 12.77 3.93%Germany 12.54 3.85% Germany 12.48 3.84%
World 301.60 — World 325.34 —Total — 60.09% Total — 62.60%
20
IGG/Tea: ISM 17/3
2.3 India tea export
The top five importing countries of India tea exports are Russia, Iran, UK, Pakistan and the US. In 2015, the five countries accounted for India's tea exports were 20.21 percent, 10.81 percent, 8.64 percent, 8.35 percent and 6.51 percent.
2011 2012 2013
Importer Thousand Tons
Percent Importer Thousand
TonsPerce
nt Importer Thousand Tons
Percent
Russian Federation 46.44 17.95
%Russian
Federation 44.01 10.19%
Russian Federation 43.06 16.90
%United
Kingdom 31.40 12.13% Pakistan 22.93 9.27
%United Arab
Emirates 26.25 10.30%
Pakistan 24.87 9.61% United Kingdom 20.85 8.74
%Iran, Islamic Republic of 26.19 10.28
%United Arab
Emirates 22.29 8.61% United Arab Emirates 19.68 6.43
% Pakistan 22.12 8.68%
Kazakhstan 16.65 6.44% Kazakhstan 14.48 6.20%
United Kingdom 18.32 7.19
%United States of America 16.22 6.27% United States
of America 13.97 6.20%
United States of America 16.07 6.30
%Iran, Islamic Republic of 14.64 5.66% Iran, Islamic
Republic of 13.96 4.18% Bangladesh 13.32 5.23
%
Australia 9.09 3.51% Egypt 9.40 3.33% Kazakhstan 11.72 4.60
%
Saudi Arabia 7.99 3.09% Germany 7.50 3.18% Germany 9.06 3.56
%
Germany 7.69 2.97% Australia 7.16 3.18% Egypt 7.75 3.04
%Total Export 258.75 — Total Export 225.08 — Total Export 254.84 —
Total — 76.25% Total — 60.91
% Total — 76.07%
2014 2015Importer Thousand Tons Percent Importer Thousand Tons Percent
Russian Federation 39.53 18.59% Russian Federation 47.51 20.21%Iran, Islamic Republic of 19.52 9.18% Iran, Islamic Republic of 25.43 10.81%
United Kingdom 18.91 8.89% United Kingdom 20.32 8.64%United Arab Emirates 16.30 7.66% Pakistan 19.62 8.35%
Pakistan 15.70 7.38% United States of America 15.32 6.51%United States of
America 14.41 6.78% United Arab Emirates 14.50 6.17%
Kazakhstan 12.47 5.86% Kazakhstan 11.52 4.90%Egypt 8.17 3.84% Germany 10.61 4.51%
Germany 7.80 3.67% Bangladesh 8.93 3.80%Bangladesh 5.96 2.81% Poland 5.39 2.29%Total Export 212.61 — Total Export 235.13 —
Total — 74.67% Total — 76.19%
21
IGG/Tea: ISM 17/3
2.4 Sri Lanka tea export
Russia has been the main export market of Sri Lanka tea, followed by Turkey, Iraq and Iran, but in recent years due to the political situation, Sri Lanka tea exported to Russia and Iran has decreased.
2011 2012 2013
Importer Thousand Tons Percent Importer Thousand
Tons Percent Importer Thousand Tons Percent
Russian Federation 54.21 16.88% Russian
Federation 49.23 15.46% Iran 64.03 18.02%
Iran 32.10 10.00% Iran 41.04 12.89% Russian Federation 61.53 17.32%
Syria 28.87 8.99% Syria 24.74 7.77% Turkey 26.06 7.34%
Iraq 23.32 7.26% Iraq 23.49 7.38% Syria 22.65 6.37%
UAE 22.58 7.03% Turkey 23.16 7.27% UAE 20.25 5.70%
Turkey 19.28 6.00% Libya 16.51 5.19% Azerbaijan 16.51 4.65%
Ukraine 12.49 3.89% UAE 11.89 3.73% Kuwait 14.53 4.09%
Azerbaijan 12.19 3.80% Azerbaijan 10.69 3.36% Japan 13.94 3.92%
Japan 11.70 3.64% Ukraine 9.79 3.08% Iraq 12.20 3.43%Kuwait 9.27 2.89% Japan 9.73 3.05% Ukraine 12.02 3.38%World 321.07 — World 318.40 — World 355.25 —Total — 70.39% Total — 69.18% Total — 74.24%
2014 2015Importer Thousand Tons Percent Importer Thousand Tons Percent
Turkey 44.75 13.76% Russian Federation 36.74 12.05%
Russian Federation 44.10 13.56% Turkey 33.71 11.06%
Iran, Islamic Republic of 30.08 9.25% Iraq 31.37 10.29%
Iraq 24.75 7.61% Iran, Islamic Republic of 30.07 9.86%
United Arab Emirates 19.81 6.09% United Arab
Emirates 23.44 7.69%
Syrian Arab Republic 12.92 3.97% Azerbaijan 11.18 3.67%
Libya, State of 12.65 3.89% Syrian Arab
Republic 11.09 3.64%
Kuwait 12.22 3.76% Libya, State of 9.98 3.28%
Azerbaijan 11.16 3.43% Kuwait 8.73 2.86%Japan 9.11 2.80% Japan 8.46 2.78%World 325.14 — World 304.84 —
22

IGG/Tea: ISM 17/3
Total — 68.14% Total — 67.17%
3. World tea import market
In 2015, total volume of world tea imports is 1980.3 thousand tons, increased 38.8 percent of the import volume in 2001. Russian Federation, Pakistan, UK and the USA are the four largest tea importing countries in the world. Russian Federation imports more than 150 thousand tons of tea every year, accounting for about 10 percent of the total world’s tea imports. Tea imports in Pakistan decreased to 89.7 thousand tons in 2009 to 139.3 thousand tons in 2005, and increased to 164.6 thousand tons in 2015. Tea importing in UK falls in fluctuation during 2001 to 2015, and has dropped 32 percent in 10 ten years from 2002 to 2012. US tea imports have steadily increased, and surpassed the UK in 2014 (Figure4).
Figure 4: The world’s four largest tea importing countries
20012002
20032004
20052006
20072008
20092010
20112012
20132014
20150
20
40
60
80
100
120
140
160
180
200
Russian Federation Pakistan UK US
thou
sand
tonn
es
23


![Welcome [] Menus.pdf · 2016-09-27 · Coffee Service Brewed 100% Colombian Coffee, Decaffeinated Coffee, and Tea $3.95/person Brewed 100% Colombian Coffee and Decaffeinated Coffee](https://img.dokumen.tips/doc/110x75/5f43782735d53f25d2664119/welcome-menuspdf-2016-09-27-coffee-service-brewed-100-colombian-coffee.jpg)