Embed Size (px)
DESCRIPTION
free motion
Citation preview

ExcelMotionChart
Lloyd's Analysis Team© Lloyd's 2010

Disclaimer
Whilst all care has been taken to ensure the accuracy of this charting tool, Lloyd’s does not accept any responsibility for any errors or omissions. Lloyd’s does not accept any responsibility or liability for any loss to any person acting or refraining from action as the result of, but not limited to, any statement, fact, figure, expression of opinion or belief contained in this tool. Use of the tool is at your own risk

Introduction
This spreadsheet incorporates the Gapminder concept into a tool that you can use to visualise your own business data.
The chart can be quite memory/processor intensive so it is recommended that you close down programs you are not using.
Using The Motion Chart
1. Macros should be enabled (in Excel 2003 Tools > Macro > Security - set as medium and reopen)
3. Change the 'Y-Axis', 'X-Axis', 'Size' selections to change the chart data
4. Hit the 'Play' button to see the chart move through the whole time period
5. Use Esc to pause or stop the motion chart
Motion Chart Features
1. Move the 'Time' slider to navigate directly to a period of time for the chart
2. Click the 'Faster' control up or down between 1 (slow) and 20 (fast) to vary the speed of the motion
4. Click the 'Change Chart' buttons to change the chart to a Bubble Chart/Area Chart or Column Chart
5. Use the 'Show Data Labels' list box to show labels for your requirements
6. Use the 'Show Data Labels' toggle button to increase the size of the list box
How To Visualise Your Data
1. Paste your business data into the 'RAWDATA' sheet (maximum 10,000 records, 30 unique groups)
2. The 'RAWDATA' area is used to prepare your data before its structure is suitable for the chart
3. Arrange your data as below, with group data first, then time data followed by multiple series data
Group Data Time Data Series 1 Series 2 Series 3
Aviation 1993 0.5209224440252 83.345886310975 326.98732921112
Aviation 1994 0.36656395911 79.523257072489 18.973237913524 Example format required
Casualty 1993 0.6772932421024 1769.963417609 644.00244539327
Casualty 1994 0.6037442893346 2525.3317083525 303.12982753238
i. Examples of group data could be classes of business, brokers, service companies, employees
ii. Time data can be a year or date, but not a text date i.e. 1st January 2010
iii. Examples of series could be premium, claims, ULR's, commission, investment income, working hours
6. Ensure each group data/time combination is not repeated i.e. unique rows
7. Ensure column titles are not repeated
8. Any other data should be removed from the sheet
9. Sort the data by your group data in ascending order (ensure your column title is still there)
10. Click 'Update' button on 'Charts' sheet to update the data
Further information
The websites below served as inspiration for the charts
Feedback and suggestions
We welcome your feedback and any suggestions on improvements to the tool
Motion charts are a great way of visualising trends and patterns in data and showing several dimensions simultaneously. The concept was first developed several years ago by Hans Rosling with his Gapminder software.
The tool has been developed to be used with data provided in Statistics Relating To Lloyd's and next years edition will incorporate Excel motion charts in the supporting spreadsheet tools that accompany the guide.
Statistics Relating To Lloyds
This tool is provided for your use free of charge and you are free to copy and reuse the source code. However whilst we are happy to give you some guidance on using the tool, we do not provide ongoing support.
This version of the tool has been pre-loaded with randomly generated data by way of an example. We also set out instructions below that explain how you can use this tool to visualise your own business data.
It is not recommended that you manually change any of the charts or controls as this will limit the functionality of the charts and may cause errors.
2. Before using click the 'Update' button to update the source of the chart, and the controls on the form
3. Click the 'Smoother' control up or down between 1 (less smooth but faster) and 20 (very smooth but slower) to insert calculated sections between your data to smooth the motion of the chart
http://www.s-anand.net/blog/motion-charts-in-excel/http://www.gapminder.org/http://code.google.com/intl/en/apis/visualization/documentation/gallery/motionchart.html
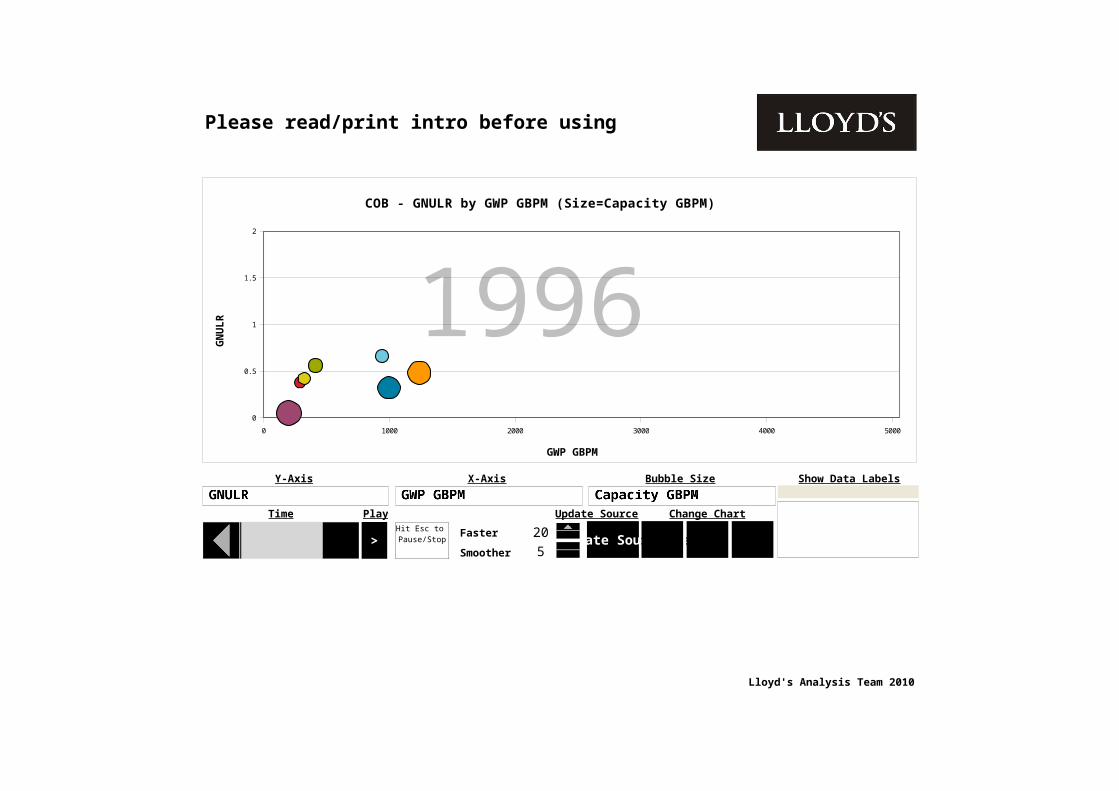
Please read/print intro before using
1996
Lloyd's Analysis Team 2010
Change ChartTime Play Update Source
FasterHit Esc to Pause/Stop
Smoother
0 1000 2000 3000 4000 5000
0
0.5
1
1.5
2
COB - GNULR by GWP GBPM (Size=Capacity GBPM)
GWP GBPM
GN
UL
R
> Update Source20
5Area ChartBubble Chart Bar Chart
Y-Axis X-Axis Bubble Size Show Data Labels

COB YOA GNULR
Aviation 1993 0.520922 83.34589 326.9873 0.002734Aviation 1994 0.366564 79.52326 18.97324 0.007183Aviation 1995 0.074832 313.4838 2.727781 0.028563Aviation 1996 0.003053 147.6932 303.3673 0.041648Aviation 1997 0.755455 433.5821 228.5317 0.019222Aviation 1998 0.723843 259.3742 224.4493 0.000565Aviation 1999 0.851792 512.9765 422.3556 0.007721Aviation 2000 1.187146 439.1768 322.7716 0.00059Aviation 2001 0.054346 290.0175 537.7269 0.034553Aviation 2002 0.315229 118.3728 549.7064 0.007102Aviation 2003 0.386877 394.3721 17.87648 0.010413Aviation 2004 0.442841 47.97033 282.1698 0.014896Aviation 2005 0.338425 163.0251 198.54 0.016764Aviation 2006 0.101773 211.2052 322.6728 0.011034Aviation 2007 0.750984 29.75228 290.0512 0.026863Aviation 2008 0.602487 121.6442 372.7732 0.000969Aviation 2009 0.328987 60.95144 430.2488 0.018856Casualty 1993 0.677293 1769.963 644.0024 0.086476Casualty 1994 0.603744 2525.332 303.1298 0.000246Casualty 1995 0.257602 219.2394 2670.784 0.123025Casualty 1996 0.754538 1933.432 1680.186 0.023844Casualty 1997 0.204669 543.3874 739.3481 0.038591Casualty 1998 0.024869 1668.427 233.8236 0.206545Casualty 1999 1.021849 2149.576 628.1804 0.155296Casualty 2000 0.953683 2128.748 1463.466 0.030304Casualty 2001 0.995898 3782.237 2057.462 0.270972Casualty 2002 0.801062 842.2041 1829.104 0.047915Casualty 2003 0.496316 2608.559 2896.875 0.205319Casualty 2004 0.35058 4290.406 3426.876 0.18353Casualty 2005 0.063129 4028.943 874.137 0.064094Casualty 2006 0.196411 1694.397 914.4754 0.134837Casualty 2007 0.755725 542.961 2389.878 0.131207Casualty 2008 0.5672 3669.602 2935.357 0.215973Casualty 2009 0.299276 827.9925 3544.399 0.218604Energy 1993 0.04967 23.92941 536.4532 0.063659Energy 1994 0.124561 292.7497 572.3809 0.063116Energy 1995 0.241826 13.37528 255.6758 0.007383Energy 1996 0.692761 481.3084 117.0811 0.043966Energy 1997 0.137757 165.324 567.7097 0.018809Energy 1998 0.921275 244.3962 142.1571 0.001696Energy 1999 1.149946 336.0096 367.1546 0.010195Energy 2000 0.825193 67.61482 72.52371 0.044181Energy 2001 0.386629 429.9444 91.80951 0.020143Energy 2002 0.112916 292.951 320.2551 0.005876Energy 2003 0.705784 539.3156 389.4557 0.01343Energy 2004 0.056811 606.9209 231.8618 0.015326Energy 2005 1.827556 1189.847 879.18 0.028288Energy 2006 0.303981 126.3718 1032.346 0.052061Energy 2007 0.248122 972.2088 931.0923 0.053337Energy 2008 0.106059 1237.955 505.8334 0.026516Energy 2009 0.449509 563.5024 1498.789 0.026565
GWP GBPM
Capacity GBPM
Capacity Perc of
Mkt
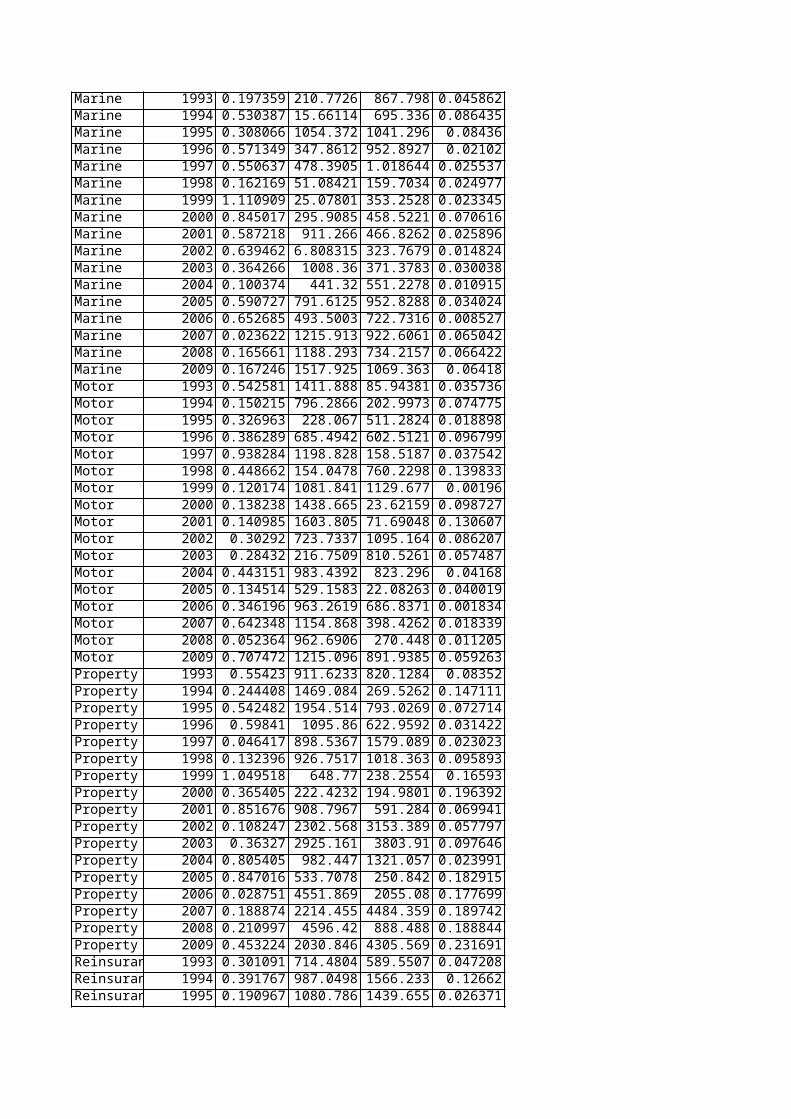
Marine 1993 0.197359 210.7726 867.798 0.045862Marine 1994 0.530387 15.66114 695.336 0.086435Marine 1995 0.308066 1054.372 1041.296 0.08436Marine 1996 0.571349 347.8612 952.8927 0.02102Marine 1997 0.550637 478.3905 1.018644 0.025537Marine 1998 0.162169 51.08421 159.7034 0.024977Marine 1999 1.110909 25.07801 353.2528 0.023345Marine 2000 0.845017 295.9085 458.5221 0.070616Marine 2001 0.587218 911.266 466.8262 0.025896Marine 2002 0.639462 6.808315 323.7679 0.014824Marine 2003 0.364266 1008.36 371.3783 0.030038Marine 2004 0.100374 441.32 551.2278 0.010915Marine 2005 0.590727 791.6125 952.8288 0.034024Marine 2006 0.652685 493.5003 722.7316 0.008527Marine 2007 0.023622 1215.913 922.6061 0.065042Marine 2008 0.165661 1188.293 734.2157 0.066422Marine 2009 0.167246 1517.925 1069.363 0.06418Motor 1993 0.542581 1411.888 85.94381 0.035736Motor 1994 0.150215 796.2866 202.9973 0.074775Motor 1995 0.326963 228.067 511.2824 0.018898Motor 1996 0.386289 685.4942 602.5121 0.096799Motor 1997 0.938284 1198.828 158.5187 0.037542Motor 1998 0.448662 154.0478 760.2298 0.139833Motor 1999 0.120174 1081.841 1129.677 0.00196Motor 2000 0.138238 1438.665 23.62159 0.098727Motor 2001 0.140985 1603.805 71.69048 0.130607Motor 2002 0.30292 723.7337 1095.164 0.086207Motor 2003 0.28432 216.7509 810.5261 0.057487Motor 2004 0.443151 983.4392 823.296 0.04168Motor 2005 0.134514 529.1583 22.08263 0.040019Motor 2006 0.346196 963.2619 686.8371 0.001834Motor 2007 0.642348 1154.868 398.4262 0.018339Motor 2008 0.052364 962.6906 270.448 0.011205Motor 2009 0.707472 1215.096 891.9385 0.059263Property 1993 0.55423 911.6233 820.1284 0.08352Property 1994 0.244408 1469.084 269.5262 0.147111Property 1995 0.542482 1954.514 793.0269 0.072714Property 1996 0.59841 1095.86 622.9592 0.031422Property 1997 0.046417 898.5367 1579.089 0.023023Property 1998 0.132396 926.7517 1018.363 0.095893Property 1999 1.049518 648.77 238.2554 0.16593Property 2000 0.365405 222.4232 194.9801 0.196392Property 2001 0.851676 908.7967 591.284 0.069941Property 2002 0.108247 2302.568 3153.389 0.057797Property 2003 0.36327 2925.161 3803.91 0.097646Property 2004 0.805405 982.447 1321.057 0.023991Property 2005 0.847016 533.7078 250.842 0.182915Property 2006 0.028751 4551.869 2055.08 0.177699Property 2007 0.188874 2214.455 4484.359 0.189742Property 2008 0.210997 4596.42 888.488 0.188844Property 2009 0.453224 2030.846 4305.569 0.231691Reinsuranc 1993 0.301091 714.4804 589.5507 0.047208Reinsuranc 1994 0.391767 987.0498 1566.233 0.12662Reinsuranc 1995 0.190967 1080.786 1439.655 0.026371
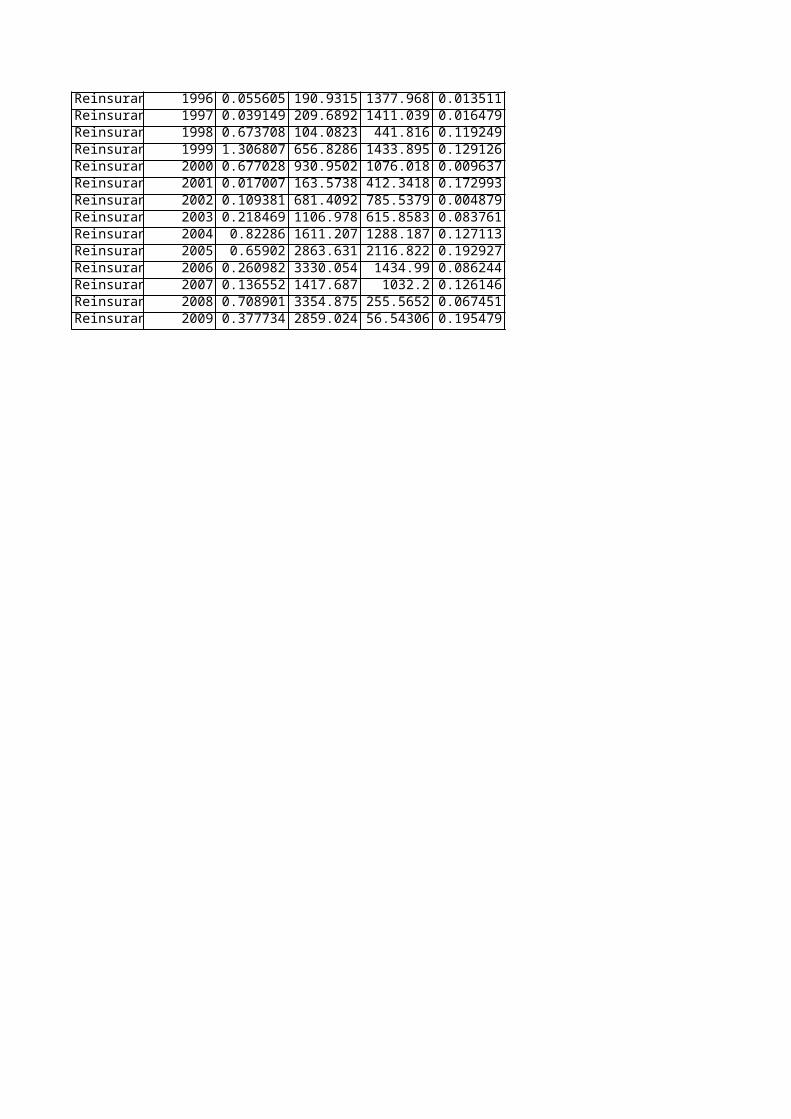
Reinsuranc 1996 0.055605 190.9315 1377.968 0.013511Reinsuranc 1997 0.039149 209.6892 1411.039 0.016479Reinsuranc 1998 0.673708 104.0823 441.816 0.119249Reinsuranc 1999 1.306807 656.8286 1433.895 0.129126Reinsuranc 2000 0.677028 930.9502 1076.018 0.009637Reinsuranc 2001 0.017007 163.5738 412.3418 0.172993Reinsuranc 2002 0.109381 681.4092 785.5379 0.004879Reinsuranc 2003 0.218469 1106.978 615.8583 0.083761Reinsuranc 2004 0.82286 1611.207 1288.187 0.127113Reinsuranc 2005 0.65902 2863.631 2116.822 0.192927Reinsuranc 2006 0.260982 3330.054 1434.99 0.086244Reinsuranc 2007 0.136552 1417.687 1032.2 0.126146Reinsuranc 2008 0.708901 3354.875 255.5652 0.067451Reinsuranc 2009 0.377734 2859.024 56.54306 0.195479