Embed Size (px)
Citation preview
Introduction
For the last few years, the pace of international migration has accelerated. Accord-ing to the United Nations (2002), the number of international migrants increasedfrom 154 million to 175 million between 1990 and 2000. The consequences forcountries of origin and destination have attracted the increased attention of policy-makers, scientists, and international agencies. The phenomenon is likely to furtherdevelop in the coming decades as a part of the world globalization process. Theinternational community must be prepared to address the challenges raised by theincreasing mobility of workers. In particular, the migration of skilled workers (theso-called brain drain) is a major piece of the migration debate. The transfer1 ofhuman resources has undergone extensive scrutiny in developing countries butalso in such industrial countries as Canada, the United Kingdom, and Germany,where an important fraction of talented natives is working abroad.
When considering the consequences for countries of origin, early literaturesupports the view that skilled migration is unambiguously detrimental for thoseleft behind (Grubel and Scott 1966; Johnson 1967; Bhagwati and Hamada 1974;Kwok and Leland 1982). This is the case if the migrants’ contribution to the econ-omy is greater than their marginal product or if the education of skilled emigrantswas partly funded by taxes on residents. The negative effects of the brain drain forsource countries have been reformulated in an endogenous growth framework(Miyagiwa 1991; Haque and Kim 1995; Wong and Yip 1999). More recently, theeffects of migration prospects on human capital formation have been the focus ofseveral studies, which suggest that such prospects may in fact foster human capital
151
5International
Migration byEducation
Attainment, 1990–2000
Frédéric Docquier and Abdeslam Marfouk
formation and growth in sending countries (Mountford 1997; Stark, Helmen-stein, and Prskawetz 1998; Vidal 1998; Beine, Docquier, and Rapoport 2001). Theauthors argue that if the return to education is higher abroad than at home, thepossibility of migration increases the expected return of human capital, therebyenhancing domestic enrollment in education.1 More people, therefore, invest inhuman capital as a result of increased migration opportunities. This acquisitioncan contribute positively to growth and economic performance. Along with theincentive to acquire education, other channels through which the brain drain maypositively affect the sending economy have also been proposed. These include arange of “feedback effects” such as remittances (Cinar and Docquier 2004), returnmigration after additional knowledge and skills have been acquired abroad (Stark,Helmenstein, and Prskawetz 1997; Domingues Dos Santos and Postel-Vinay2003), and the creation of business and trade networks (Dustmann andKirchkamp 2002; Mesnard and Ravallion 2001). A survey on the “new economicsof the brain drain” can be found in Commander, Kangasniemi, and Winters(2004) or Docquier and Rapoport (2004).
Understanding and measuring all the mechanisms at work require reliable dataand empirical analysis. Regarding the size and the education structure of interna-tional migration, there is a fair amount of evidence suggesting that the brain drainis now much more extensive than it was two or three decades ago. For example,Haque and Jahangir (1999) indicate that the number of highly skilled emigrantsfrom Africa increased from 1,800 a year on average during 1960–75 to 4,400 dur-ing 1975–84 and 23,000 during 1984–87. These trends were confirmed in the1990s in the face of the increasingly “quality-selective” immigration policies intro-duced in many Organisation for Economic Co-operation and Development(OECD) countries. Since 1984, Australia’s immigration policy has officially privi-leged skilled workers, with candidates being selected according to their prospec-tive “contribution to the Australian economy.” In November 1991, the NewZealand immigration policy shifted from a traditional “source-country prefer-ence” toward a “points-system” selection, similar to that in Australia (StatisticsNew Zealand 2004). The Canadian immigration policy follows similar lines,resulting in an increased share of highly educated people among the selectedimmigrants. For example, in 1997, 50,000 professional specialists and entrepre-neurs immigrated to Canada with 75,000 additional family members, represent-ing 58 percent of total immigration. In the United States, since the ImmigrationAct of 1990 (followed by the American Competitiveness and Work ForceImprovement Act of 1998), emphasis has been put on the selection of highlyskilled workers. This is accomplished through a system of quotas favoring candi-dates with academic degrees or specific professional skills. For the latter category,the annual number of visas issued for highly skilled professionals (H-1B visas)
152 Part II Brain Drain, Brain Gain, Brain Waste
increased from 110,200 in 1992 to 355,600 in 2000. The totality of this increase isthe result of immigration from developing countries, and about half of theseworkers now come from India.
In European Union (EU) countries, immigration policies are less clear and stilloriented toward traditional targets such as asylum seekers and applicants request-ing family reunion. However, there is some evidence suggesting that EU countriesare also leaning toward becoming quality selective. As reported in Lowell (2002a),“European Commission President Prodi has called for up to 1.7 million immi-grants to fill an EU-wide labor shortage through a system similar to the US greencards for qualified immigrants.” A growing number of EU countries (includingFrance, Ireland, and the United Kingdom) have recently introduced programsaiming at attracting a qualified labor force (especially in the field of information,communication, and technology, ICT) through the creation of labor-shortageoccupation lists (see Lowell 2002b). In February 2000, German ChancelorSchröder announced plans to recruit additional specialists in the field of informa-tion technology. Green cards came into force in August 2001, giving German ICTfirms the opportunity to hire up to 20,000 non-EU ICT specialists for a maximumof five years. More recently, the German Sübmuth Commission recommended theintroduction of a coherent flexible migration policy that allows for temporary andpermanent labor migrants (see Bauer and Kunze 2004). In 2002, the French Min-istry of Labor established a system to induce highly skilled workers from outsidethe EU to live and work in France. Given the apparent demographic problems andaging populations, the intensity of the brain drain could continue to increase dur-ing the next decades.2
Until recently, despite numerous case studies and anecdotal evidence, there hasbeen no systematic empirical assessment of the brain-drain magnitude. Manyinstitutions consider the lack of harmonized international data on migration bycountry of origin and education level as the major problem for monitoring thescope and impact of brain drain in developing areas.3 In the absence of suchempirical data, the debate has remained almost exclusively theoretical. In theirinfluential contribution, Carrington and Detragiache (1998, 1999) provided esti-mates of the emigration rates of tertiary educated workers for 61 developing coun-tries. These estimates are based on three main statistical sources: U.S. Census dataon the skill structure of immigration, OECD data on immigration per country oforigin, and Barro and Lee (2000) data describing the skill structure in sendingcountries. The estimates rely on a set of assumptions. First, for non-U.S. countries,they use OECD migration statistics, which report limited information on the ori-gin of immigrants.4 Second, they transpose the skill structure of U.S. immigrantson the OECD total immigration stock. For example, migrants from Morocco toFrance are assumed to be distributed across education categories in the same way
International Migration by Education Attainment, 1990–2000 153

as migrants from Morocco to the United States. This assumption is particularlytentative for countries that do not send many migrants to the United States. Rely-ing on OECD statistics produced an average underestimation of 8.9 percent inskilled-worker migration rates in 2000 (this is the major source of bias, especiallyfor small countries). Imposing the U.S. education structure on other OECD coun-tries produced an average overestimation of 6.3 percent in skilled-worker migra-tion rates in 2000 (the bias is obviously strong in countries sending a minor per-centage of their emigrants to the United States). On average, we demonstrate thatCarrington and Detragiache’s (1998, 1999) method underestimated the emigra-tion rates of skilled workers by 2.6 percent in 2000. While it seems rather small,the overall bias is heterogeneously distributed across countries. It ranges fromabout �51.5 percent for São Tomé and Principe to �51.2 percent for Mauritius.5
Adams (2003) used the same methodology to update the emigration rates of 24labor-exporting countries in 2000. Beine, Docquier, and Rapoport (2003) usedCarrington and Detragiache’s data to predict the growth impact of the braindrain. Yet, given the assumptions, the evidence concerning the consequences ofskilled migration for developing countries remains not only limited but alsolargely inconclusive.
The purpose of this chapter is to build an exhaustive international database oninternational migration by education attainment. This data set describes the lossof skilled workers (in absolute and relative terms) for all developing and devel-oped countries. The majority of highly skilled workers go to industrial countries.We focus on the south-north and north-north brain drain. We are aware that abrain drain is evident outside the OECD area—migration of skilled workers to thesix member states of the Gulf Cooperation Council (Bahrain, Kuwait, Oman,Qatar, Saudi Arabia, and the United Arab Emirates) and also to South Africa,Malaysia, Hong Kong (China), Singapore, and Taiwan (China). At this stage, how-ever, we do not take these flows into account. According to the United Nations(2002), migration to developed countries represented 53 percent of world migra-tion in 1990 and 60 percent in 2000. Highly skilled migration is even more con-centrated. Given census data collected from various non-OECD countries, weestimate that about 90 percent of these highly skilled migrants live in 1 of the 30member states of the OECD.
We use data on the immigration structure by education attainment and coun-try of birth from all OECD receiving countries. Census and register data are avail-able in nearly all OECD countries. This chapter clearly builds on Release 1.0 (Doc-quier and Marfouk 2004), which was the first attempt to evaluate migration stocksand rates by education attainment on an exhaustive scale.6 In comparison toRelease 1.0 (which built on survey data for 12 European countries), we significantlyextend the quality of the data. Special attention has been paid to the homogeneity
154 Part II Brain Drain, Brain Gain, Brain Waste

and the comparability of the data (definition of immigration, comparabilitybetween immigration and human capital indicators, treatment of the dependentterritories, homogeneity of the data sources). Consequently, we characterize (on avery homogeneous basis) the country of origin and education attainment of morethan 98 percent of the OECD stock of working-age adults in 2000. Focusing ontertiary educated migrants (defined as working-age migrants with more than asecondary school diploma), our calculations reveal that the stock of educatedimmigrants has increased by about 800,000 a year between 1990 and 2000 (thetotal stock of migrants has increased by about 1.7 million a year). Our countrymeasures can be used to examine the changes in the international distribution ofmigration rates, to test for the (push-and-pull) determinants per skill group, or toevaluate the macroeconomic consequences of migration on source and destina-tion countries.
The remainder of this chapter is organized as follows. The second sectiondescribes the methodology. Results for 1990 and 2000 are presented in the thirdsection. The fourth section focuses on OECD countries and provides the net gainsand losses of skilled workers (in percentage of the working-age population). Thefifth section concludes this chapter. Country classifications, and comparisons withprevious studies are given in annex 5.A.
Definition, Principles, and Data Sources
This section describes the methodology and data sources used to compute emigra-tion stocks and rates by education attainment and origin country in 1990 and2000. In what follows, the term “country” usually designates independent stateswhile “dependent territory” refers to other entities attached to a particular inde-pendent state. Our 2000 data set distinguishes 192 independent territories (VaticanCity and the 191 UN member states, including Timor-Leste, which became inde-pendent in 2002) and 39 dependent territories. Stocks are provided for both typesof territories while rates are only provided for independent countries as well asthree dependent territories, which are treated as economies—Hong Kong (China),Macao SAR, and Taiwan (China)—and one occupied territory (Palestine). Becausemost of the Korean migrants to the United States did not accurately report theirorigin, we cannot distinguish between the Republic of Korea and Democratic Peo-ple’s Republic of Korea (estimates are provided for Korea as a whole). We distin-guish 174 countries in 1990, before the secession of the Soviet bloc, the formerYugoslavia, the former Czechoslovakia, the independence of Eritrea and Timor-Leste, and the German and the Republic of Yemen reunifications.7
For economic and statistical reasons, working on stocks is more attractive thanworking on flows. Stock variables are more appropriate to analyze the endogeneity
International Migration by Education Attainment, 1990–2000 155
and the dynamics of migration movements (the equilibrium values are oftenexpressed in terms of stocks). Regarding statistics, it has long been recognized thatmigration flow data are less reliable than stock data, because of the impossibilityof evaluating emigration and return migration movements.
We count as migrants all working-age (25 and over) foreign-born individualsliving in an OECD country.8 Skilled migrants are those who have at least tertiaryeducation attainment wherever they completed their schooling. Our methodologyproceeds in two steps. We first compute emigration stocks by education attain-ment from all countries of the world. Then, we evaluate these numbers in percent-age of the total labor force born in the sending country (including the migrantsthemselves). This definition of skilled migrants deserves two main comments.
First, the set of receiving countries is restricted to OECD nations. Comparedwith existing works (such as Trends in International Migration, OECD 2002), ourdatabase reveals many insights about the structure of south-north and north-north migration. Generally speaking, the skill level of immigrants in non-OECDcountries is expected to be very low, except in a few countries such as SouthAfrica (1.3 million immigrants in 2000), the six member states of the Gulf Coop-eration Council (9.6 million immigrants in Saudi Arabia, the United Arab Emi-rates, Kuwait, Bahrain, Oman, and Qatar), and some Eastern Asian countries (4million immigrants in Hong Kong (China) and Singapore only). According totheir census and survey data, about 17.5 percent of adult immigrants have terti-ary education in these countries (17 percent in Bahrain, 17.2 percent in SaudiArabia, 14 percent in Kuwait, 18.7 percent in South Africa). Considering thatchildren constitute 25 percent of the immigration stock, we estimate the numberof educated workers at 1.9 million in these countries. The number of educatedimmigrants in the rest of the world lies between 1 and 4 million (if the averageproportion of educated immigrants among adults lies between 2.5 and 10 per-cent). This implies that, focusing on OECD countries, we should capture a largefraction of the worldwide educated migration (about 90 percent). Nevertheless,we are aware that by disregarding non-OECD immigration countries, we proba-bly underestimate the brain drain for a dozen developing countries (such as theArab Republic of Egypt, Sudan, Jordan, the Republic of Yemen, Pakistan, orBangladesh in the neighborhood of the Gulf states, and Swaziland, Namibia,Zimbabwe, and other countries that send emigrants to South Africa, and so on).Incorporating data collected from selected non-OECD countries could refine thedata set.
Second, we have no systematic information on the age of entry. It is thereforeimpossible to distinguish between immigrants who were educated at the time oftheir arrival and those who acquired education after they settled in the receivingcountry; for example, Mexican-born individuals who arrived in the United States
156 Part II Brain Drain, Brain Gain, Brain Waste
at age 5 or 10 and graduated from U.S. higher-education institutions are countedas highly skilled immigrants. Hence, our definition of the brain drain is partlydetermined by data availability. Existing data do not allow us to systematicallyeliminate foreign-born individuals who arrived with completed schooling or aftera given age threshold. In the United States, the proportion of foreign-born indi-viduals who arrived before age 10 represents 10 percent of the immigration stock(16 percent for those who arrived before age 16). This average proportionamounts to 13 percent among skilled immigrants (20.4 for age 16). Important dif-ferences are observed across countries. The share is important for high-incomeand Central American countries (about 20 percent). It is quite low for Asian andAfrican countries (about 9 percent). Having no systematic data for the otherreceiving countries, we cannot control for familial immigration. Our databaseincludes these individuals who arrived at young age. Our choice is also motivatedby several reasons: (a) our numbers are comparable to traditional statistics oninternational migration, which include all migrants whatever their age of entry;(b) it is impossible to quantify the share of these young immigrants who werepartly educated in their birth country and/or who arrived with foreign fellow-ships; and (c) young immigrants who spent part of their primary or secondaryschooling in the origin country or who got foreign schooling fellowships induceda fiscal loss for their origin country.
Emigration Stocks
It is well documented that statistics provided by origin countries do not provide arealistic picture of emigration. When available, they are incomplete and impre-cise.9 While detailed immigration data are not easy to collect on an homogeneousbasis, information on emigration can only be captured by aggregating consistentimmigration data collected in receiving countries. Information about the originand skill of natives and immigrants is available from national population censusesand registers. More specifically, country i’s census usually identifies individuals onthe basis of age, country of birth j, and skill level s. Our method consists of col-lecting census or register data from a large set of receiving countries, with thehighest level of detail on birth countries and (at least) three levels of educationattainment: s�h for high-skilled, s�m for medium-skilled, s�l for low-skilledand s�u for the unknowns. Let M i,j
t,s denote the stock of working-age individualsborn in j, of skill s, living in country i, at time t.
Low-skilled workers are those with primary education (or with 0 to 8 years ofschooling completed); medium-skilled workers are those with secondary educa-tion (9 to 12 years of schooling); high-skilled workers are those with tertiary edu-cation (13 years and above). The unknowns are either the result of the fact that
International Migration by Education Attainment, 1990–2000 157
some immigrants did not declare their education attainment or the result of theabsence of data on education in some receiving countries. Education categoriesare built on the basis of country-specific information and are compatible withhuman capital indicators available for all sending countries. A mapping betweenthe country education classification is sometimes required to harmonize thedata.10 Some statistics offices have difficulties determining the education level oftheir immigrants.11 By focusing on census and register data, our methodologydoes not capture illegal immigration for which systematic statistics by educationlevel and country of origin are not available.12 According to the U.S. Immigrationand Naturalization Services, the illegal population residing in the United Statesamounted to 3.5 million in January 1990 and 7.0 million in January 2000. It iseven possible to identify the main countries of origin (in 2000, 68.7 percent werefrom Mexico, 2.7 percent from El Salvador, 2.1 percent from Guatemala, 2.0 per-cent from Colombia and Honduras, and so on).13 However, there is no accuratedata about the education structure of these illegal migrants. For the other memberstates of the OECD, data on illegal immigration are less reliable or do not exist. Bydisregarding illegal migrants, we probably overestimate the average level of educa-tion of the immigrant population (it can be reasonably assumed that most illegalimmigrants are uneducated). Nevertheless, this limit should not significantly dis-tort our estimates of the migration rate of highly skilled workers.
As far as possible, we turn our attention to the homogeneity and the compara-bility of the data. This provides a few methodological choices:
• To allow comparisons between 1990 and 2000, we consider the same 30 receiv-ing countries in 1990 and 2000. Consequently, the former Czechoslovakia,Hungary, the Republic of Korea and Democratic People’s Republic of Korea,Poland, Mexico, and Turkey are considered as receiving countries in 1990despite the fact that they were not members of the OECD.
• Migration is defined on the basis of the country of birth rather than citizen-ship. While citizenship characterizes the foreign population, the concept of for-eign-born individuals better captures the decision to emigrate.14 Usually, thenumber of foreign-born individuals is much higher than the number of for-eign citizens (twice as large in countries such as Hungary, the Netherlands, andSweden).15 Furthermore, the concept of country of birth is time-invariant(contrary to citizenship, which changes with naturalization) and independentof the changes in policies regarding naturalization. The OECD statistics reportthat 14.4 million foreign-born individuals were naturalized between 1991 and2000. Countries with a particularly high number of acquisitions of citizenshipare the United States (5.6 million), Germany (2.2 million), Canada (1.6 mil-lion), and France (1.1 million). Despite the fact that they are partially reported
158 Part II Brain Drain, Brain Gain, Brain Waste

in traditional statistics (OECD 2002), the number of foreign-born individualscan be obtained for a majority of OECD countries. In a limited number ofcases, the national census only gives immigrants’ citizenship (Germany, Italy,Greece, Japan, and the Republic of Korea and the Democratic People’s Repub-lic of Korea). As indicated in table 5.2, 88.3 percent of working-age immigrantscan be characterized in terms of country of birth in 2000 (11.7 percent in termsof citizenship). Contrary to common belief, data availability is not significantlydifferent in 1990, even among European states. We obtain information aboutcountry of birth for 88 percent of working-age immigrants in 1990 (12 percentin terms of citizenship).
• It is worth noting that the concept of foreign born is not fully homogeneousacross OECD countries. As in many OECD countries, our main criterion relieson country of birth and citizenship at birth: we define foreign born as an indi-vidual born abroad with foreign citizenship at birth. For example, the U.S Cen-sus Bureau considers as natives children who are born in the United States (aswell as in Puerto Rico or U.S. dependent territories, such as the U.S. VirginIslands and Guam), or who are born abroad from a U.S. citizen.16 Other resi-dents are considered foreign born. France and Denmark use a similar concept.Statistics Netherlands defines first-generation immigrants as people who areborn abroad and have at least one parent who is also born abroad (Alders2001). However, in a few countries (for example, Australia, New Zealand, andBelgium), the foreign-born concept used by the Statistics Institute essentiallymeans “overseas born,” that is, an individual simply born abroad. While it isimpossible to use a fully comparable concept of immigration, we have tried tomaximize the homogeneity of our data sources. It is worth noting that our def-inition clearly excludes the second generation of immigrants. A couple ofcountries offer a more detailed picture of immigration, distinguishing the for-eign born from those with foreign backgrounds (basically immigrants’ descen-dants born locally from one of two foreign-born parents).17
• As discussed above, emigration rates are provided for 195 territories in 2000(191 UN member states, Vatican City, Palestine, Hong Kong (China), Taiwan(China), and Macao SAR minus the Democratic People’s Republic of Korea).The world configuration has changed between 1990 and 2000. The formerCzechoslovakia divided and became the Czech Republic and the Slovak Repub-lic; the former Soviet Union collapsed, leading to the formation of 15 countries(7 on the European continent and 8 on the Asian continent); the formerYugoslavia broke into 5 countries; Eritrea and Timor-Leste emerged as inde-pendent countries in 1993 and 2002. East and West Germany and the Democra-tic Republic and the Republic of Yemen were each unified. Consequently, forthis study, we distinguished 174 countries in 1990 (the former Soviet Union
International Migration by Education Attainment, 1990–2000 159

replaces 15 countries, the former Yugoslavia replaces 5 countries, and the for-mer Czechoslovakia replaces 2 countries). For homogeneity reasons, we aggre-gated East and West Germany as well as the Democratic Republic and theRepublic of Yemen in 1990. In 1990, the former Soviet Union totally belongedto the European area.18
• A related issue concerns the dependent territories. Each dependent territory islinked to a nation. Individuals born in these territories have the unrestrictedright to move to and to live in the nation. We naturally consider them as nativesof the sovereign nation. Once the category of foreign born is chosen, it meansthat these individuals should not be considered as immigrants if they move tothe sovereign state (internal migration). They should only be considered asimmigrants if they move to another independent state (external migration).This criterion is especially important for U.S. dependent territories (PuertoRico, Guam, and so on), U.K. overseas territories (Bermuda, Anguilla, and soon), French dependent territories (Guadalupe, Reunion, and so on), Denmark(Greenland and the Faroe Islands, and so on), or around Australia and NewZealand (Cook Islands, Niue, Tokelau, and so on). For example, in accordancewith the U.S. Census Bureau definition, we consider that the 1 million PuertoRicans living in the United States are U.S. natives but not immigrants. This con-siderably reduces the total stock of Puerto Rican emigrants. We have computedon the same basis the emigration stock for the other dependent territories—except for Taiwan (China), Hong Kong (China), and Macao SAR—which areassimilated to independent countries. Then, given the small numbers obtained,we have eliminated the Northern Mariana Islands and Western Sahara (a dis-puted rather than dependent territory) and have summed up Jersey andGuernsey (forming the Channel Islands).
• Because the second step of our analysis consists of comparing the numbers ofemigrants and residents by education attainment, we have to consider homo-geneous groups. Working with the working-age population (age 25 and over)maximizes the comparability of the immigration population with data on edu-cation attainment in source countries. It also excludes a large number of stu-dents who temporarily emigrate to complete their education. We cannot con-trol for graduate students age 25 and over completing their schooling.19 Asshown in table 5.1, this age group is slightly different in a limited number ofcountries.
Building an aggregate measure of emigration per education attainmentrequires a rule for sharing the unknown values. At the OECD level, the number ofmigrants whose education attainment is not described amounts to 1.287 million,that is, 2.2 percent of the total stock. Two reasonable rules could be considered:
160 Part II Brain Drain, Brain Gain, Brain Waste

International Migration by Education Attainment, 1990–2000 161
either unknown values can be distributed in the same way as the known values, orthey can be assimilated as unskilled. We combine both rules depending on theinformation available in the receiving country. For receiving countries whereinformation about immigrants’ education is available, we assimilate the unknownsto unskilled workers.20 For example, Australian immigrants who did not mentiontheir education attainment are considered unskilled. In receiving countries whereno information about skill is available, we transpose the skill distributionobserved in the rest of the OECD area or in the neighboring region. For example,if we have no information about the skill structure of immigrants to Iceland,Algerian emigrants to Iceland are assumed to be distributed the same way asAlgerian emigrants to all other Scandinavian countries. The assumptions will bediscussed below.
Formally, the stocks of emigrants of skill s from country j at time t (M jt,s) are
obtained as follows:
(5.1)
where �it is a (time- and country-dependent) binary variable equal to 1 if there is
no data on the immigrants’ skill in country i, and equal to 0 otherwise.Table 5.1 describes the data sources. In 2000, we use census, microcensus, and
register data for 29 countries. European Council data are used in the case ofGreece. Information on the country of birth is available for the majority of coun-tries, representing 88.3 percent of the OECD immigration stock. Information oncitizenship is used for the remaining countries (Germany, Italy, Greece, Japan, andthe Republic of Korea and the Democratic People’s Republic of Korea). The edu-cation structure can be obtained in 24 countries and can be estimated in 3 addi-tional countries (Belgium, Greece, and Portugal) on the basis of the European
M jt,h � a
i
Mi,jt,h � a
i
Mi,jt,u¿�i
t¿a
i
Mi,jt,l
ai
[Mi,jt,l � Mi,j
t,m � Mi,jt,h]
� ai
Mi,jt,u(1 � �i
t)
M jt,m � a
i
Mi,jt,h � a
i
Mi,jt,u¿�i
t¿a
i
Mi,jt,m
ai
[Mi,jt,l � Mi,j
t,m � Mi,jt,h]
M jt, h � a
i
Mi,jt,h � a
i
Mi,jt,u¿�i
t¿a
i
Mi,jt,h
ai
[Mi,jt,l � Mi,j
t,m � Mi,jt,h]

16
2Part II
Brain
Drain
, Brain
Gain
, Brain
Waste
TABLE 5.1 Data Sources
1990 (�) 2000 (�)
Country (age group) Origin Education Origin Education
Australia (25�) Census (#) Census (#) Census (#) Census (#)Austria (25�) Census Census Census CensusBelgium (25�) Census Census Improved EC (**) LFSCanada (25�) Census (#) Census (#) Census (#) Census (#)Czech Republic (25�) Census (#) — Census (#) Census (#)Denmark (25�) Register Register Register RegisterFinland (25�) Register Register Register RegisterFrance (25�) Census (#) Census (#) Census (#) Census (#)Germany (25–65) Microcensuz* (Cit) Microcensuz* (Cit) Microcensuz* (Cit) Microcensuz* (Cit)Greece (25�) EC (Cit) LFS (Cit.) EC (Cit) LFS (Cit.)Hungary (All;25�) EC (Cit) — Census CensusIceland (All) Register — Register —Ireland (25�) Census Census Census CensusItaly (25�) EC (Cit) — Census (Cit) Census (Cit)Japan (All/25�) Register (Cit) — Census (Cit) —Korea, Rep of (All) Register (Cit) — Register (Cit) —Luxembourg (25�) Census (#) Census (#) Census (#) Census (#)Mexico (25�) Ipums (�) 10% Ipums (�) 10% Ipums (�) 10.6% Ipums (�) 10.6%Netherlands (All) Census* Census* Census* Census*New Zealand (15�) Census Census Census CensusNorway (25�) Register Register Register Register

Intern
ation
al Mig
ration
by Ed
ucation
Attain
men
t, 1990–20001
63
Poland (13�) Census (#) — Census (#) Census (#)Portugal (25�) Census LFS Census LFSSlovak Republic (25�) See Czech Republic See Czech Republic Census (#) Census (#)Spain (25�) Census Census Census CensusSweden (25�) Census Census Census CensusSwitzerland (18�) Census (#) Census (#) Census (#) Census (#)Turkey (15�) Census (#) Census (#) Census (#) Census (#)United Kingdom (15�) Census* Census* Census* Census*United States (25�) Ipums (�) 5% Ipums(�) 5% Census 100%* Census 100%*
Source: Various statistical sources and agencies.
Notes: EC � European Council (register data); LFS � Labor Force Survey; (*) � limited level of detail. (**) European Council data corrected by the country-specific“foreign born/foreign citizen” ratio in Census 1991. (�) Year around 1990 and 2000 (for example, the Australian censuses refer to 1991 and 2001) (#) Data availablein Release 1.0. (�) See Ruggles et al. (2004) on the United States and Sobek et al. (2002) on the Mexican sample.

16
4Part II
Brain
Drain
, Brain
Gain
, Brain
Waste
1990 2000
Total stock of migrants in OECD countries 41.845 % of stock (*) 59.022 % of stock (*)Information about country of origin 41.845 100.0% 59.022 100.0%
including information about country of birth 36.812 88.0% 52.145 88.3%including information about citizenship 5.033 12.0% 6.878 11.7%
Information about educational attainment 38.169 91.2% 57.900 98.1%including “education not described” 1.576 3.8% 1.287 2.2%including Labor Force Survey data 0.283 0.7% 1.181 2.0%
Migrants with tertiary education 12.462 29.8% 20.403 34.6%including skilled migrants to the United States (*) 6.203 49.8% 10.354 50.7%including skilled migrants to Canada (*) 1.879 15.1% 2.742 13.4%including skilled migrants to Australia (*) 1.110 8.9% 1.540 7.5%including skilled migrants to the United Kingdom (*) 0.570 4.6% 1.257 6.2%including skilled migrants to Germany (*) 0.556 4.5% 0.996 4.9%including skilled migrants to France (*) 0.300 2.4% 0.615 3.0%
Migrants with secondary education 10.579 25.3% 17.107 29.0%Migrants with less than secondary education 18.804 44.9% 21.512 36.4%World total labor force (independent territories only) 2568.229 % of labor force 3187.233 % of labor forceWorld labor force with tertiary education 234.692 9.1% 360.614 11.3%World labor force with secondary education 755.104 29.4% 945.844 29.7%World labor force with less than secondary education 1578.433 61.5% 1880.775 59.0%World average emigration rate - tertiary education 5.0% — 5.4% —World average emigration rate - secondary education 1.4% — 1.8% —World average emigration rate - less than secondary education 1.2% — 1.1% —
TABLE 5.2 International Mobility by Education Attainment—An Overview
Intern
ation
al Mig
ration
by Ed
ucation
Attain
men
t, 1990–20001
65
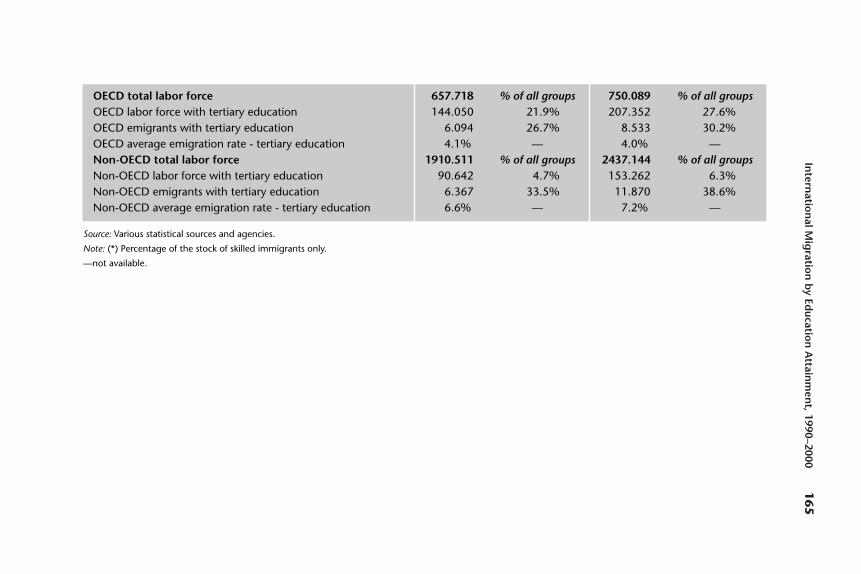
OECD total labor force 657.718 % of all groups 750.089 % of all groupsOECD labor force with tertiary education 144.050 21.9% 207.352 27.6%OECD emigrants with tertiary education 6.094 26.7% 8.533 30.2%OECD average emigration rate - tertiary education 4.1% — 4.0% —Non-OECD total labor force 1910.511 % of all groups 2437.144 % of all groupsNon-OECD labor force with tertiary education 90.642 4.7% 153.262 6.3%Non-OECD emigrants with tertiary education 6.367 33.5% 11.870 38.6%Non-OECD average emigration rate - tertiary education 6.6% — 7.2% —
Source: Various statistical sources and agencies.
Note: (*) Percentage of the stock of skilled immigrants only.
—not available.

Labor Force Survey. As shown in table 5.2, data built on the Labor Force Surveyrepresent only 2 percent of the OECD migration stock in 2000 (0.7 percent in1990). In the three remaining countries, the education structure is extrapolatedon the basis of the Scandinavian countries (for Iceland) or the rest of the OECD(for Japan and the Republic of Korea and the Democratic People’s Republic ofKorea). In 1990, European Council data were used for Hungary and Italy. Thesedata are based on the concept of citizenship. Compared with 2000, educationattainment was not available in Italy, the Czech Republic, and Hungary. The Ital-ian education structure is based on the rest of the EU-15. For the other two coun-tries, we use proportions computed from the rest of Europe. Information from theBelgian 1991 Census is available and provides complete data by country of birthand education attainment.
Emigration Rates
In the spirit of Carrington and Detragiache (1998) and Adams (2003), our secondstep consists of comparing the emigration stocks with the total number of peopleborn in the source country and belonging to the same education category. Calcu-lating the brain drain as a proportion of the total educated labor force is a betterstrategy to evaluate the pressure imposed on the local labor market. The pressureexerted by 1,037,000 Indian skilled emigrants (4.3 percent of the educated totallabor force) is less important than the pressure exerted by 16,000 skilled emigrantsfrom Grenada (85 percent of the educated labor force).
Denoting N jt,s as the stock of individuals age 25 or over, of skill s, living in coun-
try j, at time t, we define the emigration rates by the following.
(5.2)
In particular, mjt,s provides some information about the intensity of the brain
drain in the source country j. It measures the fraction of skilled agents born incountry j and living in other OECD countries.21
This step requires using data on the size and the skill structure of the working-age population in the countries of origin. Population data by age are provided bythe United Nations.22 We focus on the population age 25 and older. Data are miss-ing for a couple of countries but can be estimated using the Central IntelligenceAgency World Factbook Web site.23 Population data are split across educationgroups using international human capital indicators. Several sources based onattainment and/or enrollment variables can be found in the literature. These datasets suffer from two important limits. First, data sets published in the 1990s reveal
mjt,s �
M jt,s
Njt,s � M j
t,s
166 Part II Brain Drain, Brain Gain, Brain Waste
a number of suspicious features and inconsistencies.24 Second, given the variety ofeducation systems around the world, they are subject to serious comparabilityproblems. Three major competing data sets are available: Barro and Lee (2000),Cohen and Soto (2001), and De la Fuente and Domenech (2002). The first twosets depict the education structure in both developed and developing countries.The latter data set focuses only on 21 OECD countries (De la Fuente andDomenech 2002). Statistical comparisons between these sets reveal that the high-est signal/noise ratio is obtained in De la Fuente and Domenech. These tests areconducted in OECD countries. Regarding developing countries, Cohen and Soto’sset (2001) outperforms Barro and Lee’s set (2000) in growth regressions. However,Cohen and Soto’s data for Africa clearly underestimate official statistics. Accordingto the South African 1996 census, the share of educated individuals amounts to 7.2percent. Cohen and Soto report 3 percent (Barro and Lee report 6.9 percent). TheKenyan 1999 Census reports the share of educated individuals at 2 percent, whileCohen and Soto report 0.9 percent (1.2 percent for Barro and Lee).
Generally speaking, the Cohen and Soto data set predicts extremely low levelsof human capital for African countries25 (the share with tertiary education islower than 1 percent in a large number of African countries) and a few other non-OECD countries.26 The Barro and Lee estimates seem closer to the African officialstatistics. As the brain drain is particularly important in African countries, Barroand Lee’s indicators are preferable. Consequently, data for N j
t,s are taken from De laFuente and Domenech (2002) for OECD countries and from Barro and Lee(2000) for non-OECD countries. For countries where Barro and Lee measures aremissing (about 70 countries in 2000), we transpose the skill-sharing level of theneighboring country with the closest human development index regarding educa-tion. This method gives good approximations of the brain drain rate, which arebroadly consistent with anecdotal evidence.
The Database 1990–2000
World Migration—An Overview
Table 5.2 depicts the major trends regarding the international mobility of theworking-age population. The number of working-age individuals born in onecountry and living in another country increased from 42 million in 1990 to 59million in 2000, that is, by 1.7 million a year. Regarding the education structure ofmigrants, skilled workers are much more concerned with international migration.At the world level in 2000, highly skilled immigrants represented 34.6 percent ofthe OECD immigration stock, while only 11.3 percent of the world labor force
International Migration by Education Attainment, 1990–2000 167

had tertiary education. Between 1990 and 2000, the percentage of skilled workersamong immigrants increased by 4.8 percentage points (from 29.8 percent to 34.6percent). In 2000, the number of migrants with tertiary education living in theOECD countries amounted to about 20.4 million.
The share of migrants who completed their secondary school degree increasedfrom 25.3 to 29.0 percent. Consequently, low-skilled migration becomes increas-ingly less important in relative terms (44.9 percent in 1990 and 36.4 percent in2000). In absolute terms, the size of all groups has increased. More than 85 percentof OECD skilled immigrants live in one of the six largest immigration countries.About half of these immigrants are living in the United States; 13.4 percent live inCanada, 7.5 percent in Australia, 6.2 percent in the United Kingdom, 4.9 percentin Germany, and 3 percent in France. Contrary to other major receiving countries,the proportions of high-skilled migrants have decreased in Canada and Australiabetween 1990 and 2000.
Such a change in the education structure of migration can be related to theglobal change observed in the world labor force structure. The world potentiallabor force (defined as the population age 25 and more, including retirees) hasincreased from 2.6 billion to 3.2 billion between 1990 and 2000. Over this period,the share of workers with tertiary education increased by 1.8 percentage pointsand the share of low-skilled workers has decreased by 2.5 points. Comparingimmigrants with the rest of the population, the world average emigration rateincreased from 5.0 to 5.4 percent among the highly skilled and from 1.4 to 1.8 per-cent for the medium skilled. A slight decrease (from 1.2 to 1.1 percent) wasobserved for low-skilled workers.
These global trends hide important differences across countries and countrygroups. Table 5.2 distinguishes emigrants from OECD and non-OECD countries.Between 1990 and 2000, the number of highly skilled emigrants from OECDcountries increased less than the number of working-age highly skilled residents.The average emigration rate of OECD highly skilled workers decreased from 4.1to 4.0 percent. Regarding non-OECD countries, the number of highly skilled emi-grants increased more than the number of highly skilled residents. The skilledmigration rate increased from 6.6 to 7.2 percent in non-OECD countries.
Clearly, the international mobility of skilled workers is a crucial issue for mid-dle- and low-income countries, mainly because their share of tertiary educatedworkers remains low compared with high-income countries. Antecol, Cobb-Clark, and Trejo (2003) also confirm these results by comparing the stock ofimmigrants who arrived after 1985 in the United States, Canada, and Australia.They show that low-income countries have been strongly affected by the recentbrain drain. In all OECD areas, the percentage of skilled immigrants coming from
168 Part II Brain Drain, Brain Gain, Brain Waste
low-income countries (such as India, China, Vietnam, Pakistan, and Indonesia)increased between 1990 and 2000, especially in North America.
Stylized Facts by Country Group
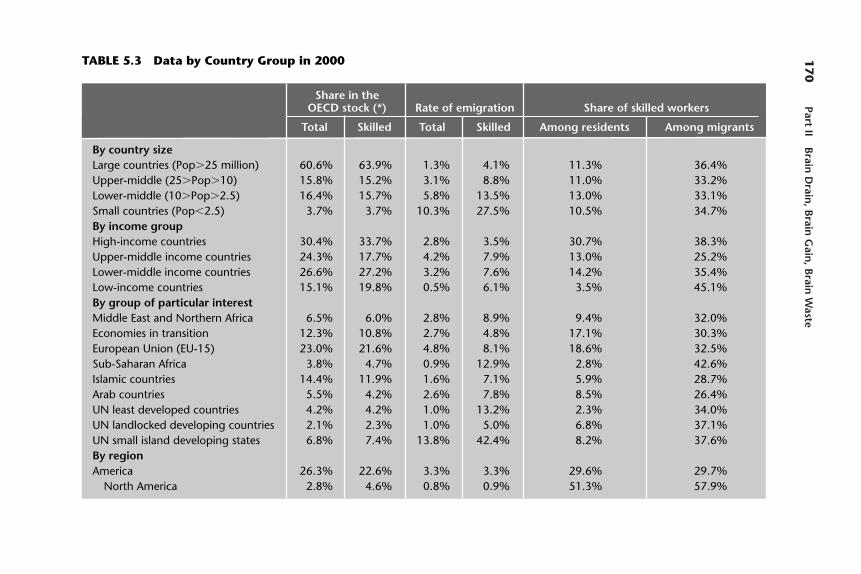
Let us now focus on more detailed figures by country group. Table 5.3 providesbasic indicators of migration and education attainment by country group in 2000(the definition of these groups is provided in annex 5.A):
• Countries are classified by country size on the basis of total population data(more than 25 million for large countries, between 10 and 25 million for upper-middle countries, between 2.5 and 10 million for lower-middle countries, andless than 2.5 million for small countries).
• They are classified by income group: we use World Bank classifications distin-guishing high-income, upper-middle income, lower-middle income, and low-income countries.
• They are classified by geographic area: we distinguish four American areas(North America, the Caribbean, Central America, and South America), fourEuropean areas (Northern Europe, Western Europe, Eastern Europe, andSouthern Europe), five African areas (Northern Africa, Central Africa, WesternAfrica, Eastern Africa, and Southern Africa), four Asian areas (Western Asia,South-Central Asia, South-Eastern Asia, and Eastern Asia) and four areas inOceania (Australia and New Zealand, Melanesia, Micronesia, and Polynesia).
• Some groups of political interest are also provided: Middle East and NorthAfrican countries (MENA), economies in transition, the EU-15 members, Sub-Saharan African countries, Islamic countries (members of the Organization ofIslamic Countries, OIC), Arab countries (members of the Arab League), theleast developed countries (UN definition), landlocked developing countries(UN definition), and small island developing countries (UN definition).
For these groups, we compute their share in the total OECD immigration stock(total and skilled migrants), their average emigration rate (total and skilledmigrants), and the share of skilled workers among emigrants (a measure of selec-tion) and residents.
Regarding size groups, the share in the OECD stock is obviously increasingwith the country size. It is noteworthy that the share of lower-middle-size coun-tries exceeds the share of upper-middle-size countries. In relative terms, we obtaina decreasing relationship between emigration rates and country population sizes.The average rate in small countries is seven times larger than the average rate in
International Migration by Education Attainment, 1990–2000 169
17
0Part II
Brain
Drain
, Brain
Gain
, Brain
Waste
Share in the OECD stock (*) Rate of emigration Share of skilled workers
Total Skilled Total Skilled Among residents Among migrants
By country sizeLarge countries (Pop�25 million) 60.6% 63.9% 1.3% 4.1% 11.3% 36.4%Upper-middle (25�Pop�10) 15.8% 15.2% 3.1% 8.8% 11.0% 33.2%Lower-middle (10�Pop�2.5) 16.4% 15.7% 5.8% 13.5% 13.0% 33.1%Small countries (Pop�2.5) 3.7% 3.7% 10.3% 27.5% 10.5% 34.7%By income groupHigh-income countries 30.4% 33.7% 2.8% 3.5% 30.7% 38.3%Upper-middle income countries 24.3% 17.7% 4.2% 7.9% 13.0% 25.2%Lower-middle income countries 26.6% 27.2% 3.2% 7.6% 14.2% 35.4%Low-income countries 15.1% 19.8% 0.5% 6.1% 3.5% 45.1%By group of particular interestMiddle East and Northern Africa 6.5% 6.0% 2.8% 8.9% 9.4% 32.0%Economies in transition 12.3% 10.8% 2.7% 4.8% 17.1% 30.3%European Union (EU-15) 23.0% 21.6% 4.8% 8.1% 18.6% 32.5%Sub-Saharan Africa 3.8% 4.7% 0.9% 12.9% 2.8% 42.6%Islamic countries 14.4% 11.9% 1.6% 7.1% 5.9% 28.7%Arab countries 5.5% 4.2% 2.6% 7.8% 8.5% 26.4%UN least developed countries 4.2% 4.2% 1.0% 13.2% 2.3% 34.0%UN landlocked developing countries 2.1% 2.3% 1.0% 5.0% 6.8% 37.1%UN small island developing states 6.8% 7.4% 13.8% 42.4% 8.2% 37.6%By regionAmerica 26.3% 22.6% 3.3% 3.3% 29.6% 29.7%
North America 2.8% 4.6% 0.8% 0.9% 51.3% 57.9%
TABLE 5.3 Data by Country Group in 2000
Intern
ation
al Mig
ration
by Ed
ucation
Attain
men
t, 1990–20001
71
Caribbean 5.1% 5.7% 15.3% 42.8% 9.3% 38.6%Central America 13.7% 6.6% 11.9% 16.9% 11.1% 16.6%South America 4.7% 5.6% 1.6% 5.1% 12.3% 41.2%
Europe 35.7% 32.8% 4.1% 7.0% 17.9% 31.7%Eastern Europe 7.9% 7.8% 2.2% 4.3% 17.4% 34.2%Northern Europe 7.9% 9.9% 6.8% 13.7% 19.9% 43.2%Southern Europe 12.4% 6.5% 6.6% 10.7% 10.8% 18.2%Western Europe 7.5% 8.6% 3.3% 5.4% 23.4% 39.3%
Africa 7.6% 6.8% 1.5% 10.4% 4.0% 30.9%Eastern Africa 1.4% 1.7% 1.0% 18.6% 1.8% 40.8%Central Africa 0.5% 0.5% 1.0% 16.1% 1.6% 30.9%Northern Africa 3.9% 2.2% 2.9% 7.3% 7.5% 19.6%Southern Africa 0.5% 0.8% 1.0% 6.8% 8.7% 62.1%Western Africa 1.3% 1.6% 1.0% 14.8% 2.4% 42.0%
Asia 25.5% 34.5% 0.8% 5.5% 6.3% 46.8%Eastern Asia 7.1% 11.3% 0.5% 3.9% 6.3% 55.5%South-Central Asia 6.0% 9.2% 0.5% 5.3% 5.0% 52.5%South-Eastern Asia 7.0% 10.5% 1.6% 9.8% 7.9% 51.4%Western Asia 5.3% 3.5% 3.5% 6.9% 11.4% 22.9%
Oceania 1.4% 1.8% 4.3% 6.8% 27.8% 45.0%Australia and New Zealand 1.0% 1.4% 3.7% 5.4% 32.7% 49.2%Melanesia 0.2% 0.3% 4.5% 44.0% 2.7% 45.0%Micronesia 0.0% 0.0% 7.2% 32.3% 7.1% 43.6%Polynesia 0.2% 0.1% 48.7% 75.2% 7.1% 22.7%
Source: Various statistical sources and agencies.
Note: (*) Contrary to country groups, the total OECD stock includes the unknowns and the dependent territories. The sum of regional shares is slightly lower than 100percent.

large countries. From the last two columns, these differences cannot be attributedto the education structure of residents or to a stronger selection in migrationflows. Smaller countries simply tend to be more open to migration. Hence, differ-ences in skilled migration are more or less proportional to differences in totalmigration rates. This explains why small island developing countries exhibit par-ticularly high migration rates while landlocked countries exhibit lower rates.
As for income groups, their share in the OECD stock is variable. Nevertheless,the highest average rates are clearly observed in middle-income countries. High-income countries (less incentives to emigrate) and low-income countries (whereliquidity constraints are likely to be more binding) exhibit the lowest rates. Asreported in Schiff (1996), liquidity constraints in poor and unequal societiesexplain the increasing relationship between income and migration at low-incomelevels. Papers by Freeman (1993), Faini and Venturini (1993), Funkhouser (1995),and World Bank (1994) have shown that emigrants essentially do not come fromthe low-income group. This inverted-U-shaped relationship between skilledmigration and income is rather stable even if, between 1990 and 2000, the situa-tion clearly improved in lower-middle-income countries and deteriorated in low-income countries. Nevertheless, the reality is more complex than this global pic-ture shows. Sub-Saharan African countries and the least developed countriesexhibit a high rate of skilled migration (13 percent). The latter groups excludelarge low-income countries (such as India, China, and Indonesia) with low emi-gration rates. While our indicators suggest that country size and gross domesticproduct (GDP) per capita are potential determinants of emigration, formal testsare required to assess their real contribution, as well as the relative effect of selec-tion policies; networks; and economic, cultural, historical, or political determi-nants of emigration. Whether these push-and-pull factors play differently acrossskill groups is a crucial issue.
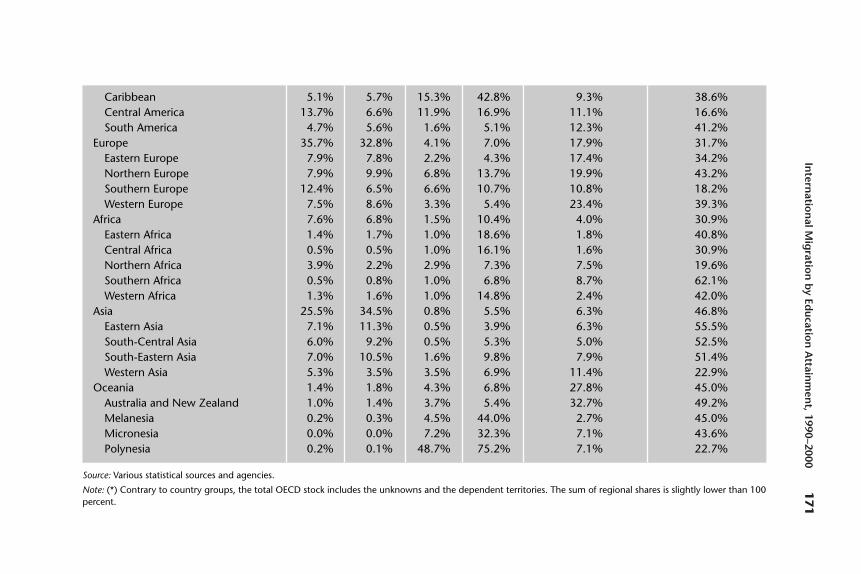
Regarding the regional distribution of skilled migration, the most affected con-tinent is Africa (10.4 percent on average). The lowest-skilled migration rates areobserved in America (3.3 percent) and Asia (5.5 percent). Oceania and Europeexhibit an intermediate rate of about 7 percent (note that European data includemigration between EU countries). Data by detailed area exhibit stronger dispari-ties. The most affected regions are the Caribbean and areas in the Pacific Oceania,which are groupings of small islands. Other remarkable areas are Eastern, Middle,and Western Africa and Central America. The difference between skilled and totalemigration rates is especially strong in Africa. This is essentially the result of thelow level of education in that part of the world.
Finally, data by area of particular interest shed light on the situation of partic-ular developing zones. Islamic and Arab countries are not strongly affected by thebrain drain. We note that Arab countries (a subset of Islamic countries) are more
172 Part II Brain Drain, Brain Gain, Brain Waste

affected by the brain drain than Islamic countries as a whole. On the contrary, Sub-Saharan African countries are strongly affected. The MENA zone exhibits an 8.9percent rate. On average, landlocked nations are less affected by the brain drain.
Remarkable Country Facts
The distribution of emigration rates is strongly heterogenous within groups. Forexample, the disparities between the Caribbean countries and the United Statesare tremendously high in America; large differences are observed between high-income countries such as Malta, Ireland, Hong Kong (China), Australia, or Japan.
Table 5.4 depicts the situation of the 30 most affected countries in 2000 regard-ing skilled migration. The brain-drain intensity differs if it is measured in absoluteor relative terms. In absolute terms (number of educated emigrants), the largestcountries are obviously strongly affected by the brain drain. The stock of skilledemigrants is high in the Philippines (1.136 million), India (1.037 million), Mexico(0.922 million), China (0.816 million), and Vietnam (0.506 million), as well as indeveloped countries, such as the United Kingdom and Germany, the Republic ofKorea and the Democratic People’s Republic of Korea (mainly the Republic ofKorea), Canada, and Italy.
In relative terms (in proportion of the educated labor force), small countriesare the most affected. The emigration rate exceeds 80 percent in nations such asGuyana, Jamaica, Haiti, Grenada, and St. Vincent and the Grenadines. One couldargue that the distance from the United States is a key element explaining the highemigration rates from these countries. Nevertheless, we believe that the reality ismuch more complex. Migration decisions of skilled workers are likely to be lessdependent on distances. It also appears that some African countries exhibit highrates of skilled migration. The rate of skilled migration exceeds 50 percent in fiveAfrican countries (67.5 percent in Cape Verde, 63.3 percent in The Gambia, 55.9percent in the Seychelles, 56.2 percent in Mauritius, and 52.5 percent in SierraLeone). Excluding small countries (population below 5 million), column 5 stressesthe importance of the brain drain in Africa and Central America. On the westernand eastern coasts of Africa, tremendous rates of emigration are found in nationssuch as Ghana, Mozambique, Sierra Leone, Kenya, Uganda, Angola, and Somalia.In Asia, the countries most affected by migration are the Lao People’s DemocraticRepublic, Sri Lanka, Hong Kong (China), Vietnam, Afghanistan, and Cambodia.Regarding Europe, emigration rates are particularly strong in Portugal, the SlovakRepublic, and the United Kingdom. The last column in table 5.3 reveals that coun-tries from the former Soviet Union and the Gulf States exhibit small rates of migra-tion. This is also the case of OECD countries, such as Japan, France, Sweden, Aus-tralia, and the United States. Finally, it is worth noting that developing countries
International Migration by Education Attainment, 1990–2000 173
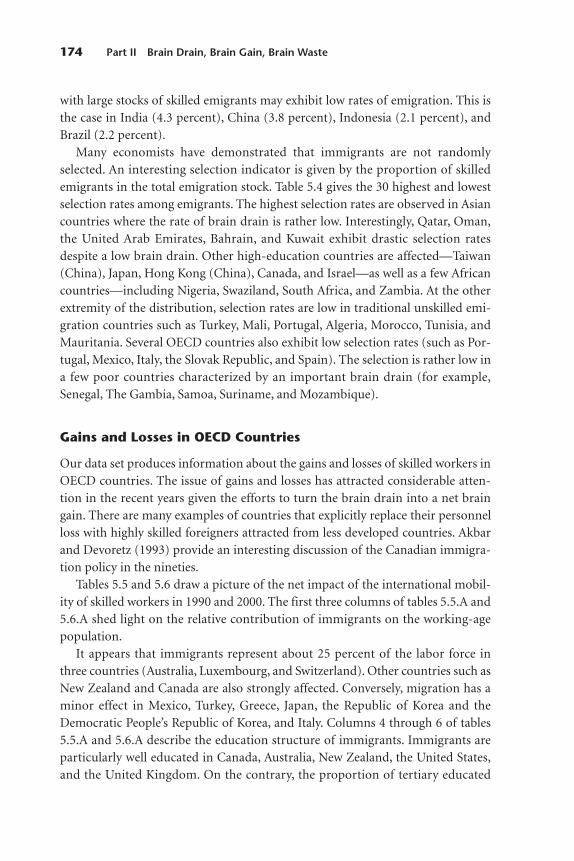
with large stocks of skilled emigrants may exhibit low rates of emigration. This isthe case in India (4.3 percent), China (3.8 percent), Indonesia (2.1 percent), andBrazil (2.2 percent).
Many economists have demonstrated that immigrants are not randomlyselected. An interesting selection indicator is given by the proportion of skilledemigrants in the total emigration stock. Table 5.4 gives the 30 highest and lowestselection rates among emigrants. The highest selection rates are observed in Asiancountries where the rate of brain drain is rather low. Interestingly, Qatar, Oman,the United Arab Emirates, Bahrain, and Kuwait exhibit drastic selection ratesdespite a low brain drain. Other high-education countries are affected—Taiwan(China), Japan, Hong Kong (China), Canada, and Israel—as well as a few Africancountries—including Nigeria, Swaziland, South Africa, and Zambia. At the otherextremity of the distribution, selection rates are low in traditional unskilled emi-gration countries such as Turkey, Mali, Portugal, Algeria, Morocco, Tunisia, andMauritania. Several OECD countries also exhibit low selection rates (such as Por-tugal, Mexico, Italy, the Slovak Republic, and Spain). The selection is rather low ina few poor countries characterized by an important brain drain (for example,Senegal, The Gambia, Samoa, Suriname, and Mozambique).
Gains and Losses in OECD Countries
Our data set produces information about the gains and losses of skilled workers inOECD countries. The issue of gains and losses has attracted considerable atten-tion in the recent years given the efforts to turn the brain drain into a net braingain. There are many examples of countries that explicitly replace their personnelloss with highly skilled foreigners attracted from less developed countries. Akbarand Devoretz (1993) provide an interesting discussion of the Canadian immigra-tion policy in the nineties.
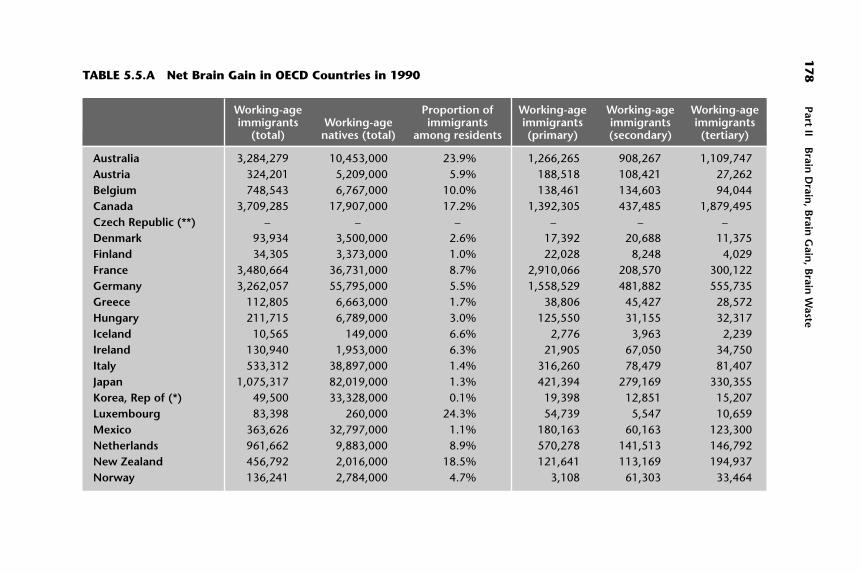
Tables 5.5 and 5.6 draw a picture of the net impact of the international mobil-ity of skilled workers in 1990 and 2000. The first three columns of tables 5.5.A and5.6.A shed light on the relative contribution of immigrants on the working-agepopulation.
It appears that immigrants represent about 25 percent of the labor force inthree countries (Australia, Luxembourg, and Switzerland). Other countries such asNew Zealand and Canada are also strongly affected. Conversely, migration has aminor effect in Mexico, Turkey, Greece, Japan, the Republic of Korea and theDemocratic People’s Republic of Korea, and Italy. Columns 4 through 6 of tables5.5.A and 5.6.A describe the education structure of immigrants. Immigrants areparticularly well educated in Canada, Australia, New Zealand, the United States,and the United Kingdom. On the contrary, the proportion of tertiary educated
174 Part II Brain Drain, Brain Gain, Brain Waste

Intern
ation
al Mig
ration
by Ed
ucation
Attain
men
t, 1990–20001
75
Highest Highest Highestemigration emigration selection
All countries stocks All countries rates, % All countries rates, %
United Kingdom 1 441 307 Guyana 89.0 Taiwan (China) 78.0Philippines 1 126 260 Grenada 85.1 Qatar 69.6India 1 037 626 Jamaica 85.1 Kuwait 67.8Mexico 922 964 St. Vincent and the Grenadines 84.5 United Arab Emirates 67.3Germany 848 414 Haiti 83.6 Philippines 67.1China 816 824 Trinidad and Tobago 79.3 Nigeria 65.0Rep. of Korea 652 894 St. Kitts and Nevis 78.5 Saudi Arabia 64.6Canada 516 471 Samoa 76.4 Japan 63.8Vietnam 506 449 Tonga 75.2 Oman 62.7Poland 449 059 St. Lucia 71.1 South Africa 62.6United States 431 330 Cape Verde 67.5 Hong Kong (China) 61.9Italy 408 287 Antigua and Barbuda 66.8 Mongolia 61.1Cuba 332 673 Belize 65.5 India 60.5France 312 494 Dominica 64.2 Canada 60.1Iran 308 754 Barbados 63.5 Venezuela, R. B. 60.1Jamaica 291 166 Gambia, The 63.3 Uzbekistan 59.5Hong Kong (China) 290 482 Fiji 62.2 Brunei 59.3Russia 289 090 Bahamas, The 61.3 Malaysia 59.2Taiwan (China) 275 251 Malta 57.6 Egypt, Arab Rep. of 58.9Japan 268 925 Mauritius 56.2 Iran, Islamic Rep. of 58.5Netherlands 256 762 Seychelles 55.9 Liberia 58.5
TABLE 5.4 Top-30 Skilled Emigration Countries, 2000

17
6Part II
Brain
Drain
, Brain
Gain
, Brain
Waste
Ukraine 246 218 Sierra Leone 52.5 Panama 57.7Colombia 233 536 Suriname 47.9 Israel 57.6Pakistan 222 372 Ghana 46.9 Singapore 57.1Ireland 209 156 Mozambique 45.1 Myanmar 56.1Romania 176 393 Liberia 45.0 Swaziland 56.1Turkey 174 043 Marshall Islands 39.4 Jordan 55.6Brazil 168 308 Lebanon 38.6 United States 55.4South Africa 168 083 Kenya 38.4 China, Macao SAR 55.2Peru 163 750 Micronesia, Federated States of 37.8 Palestine 55.0
Lowest Countries with Highest Countries with Lowestselection population above 5 emigration population above 5 emigration
All countries rates million rates, % million rates, %
Serbia and Montenegro 20.7% Haiti 83.6 Egypt, Arab Rep. of 4.6Liechtenstein 20.7% Ghana 46.9 Sweden 4.3Croatia 20.5% Mozambique 45.1 Bangladesh 4.3Gambia, The 20.4% Kenya 38.4 Spain 4.3Slovak Republic 20.0% Lao PDR 37.4 India 4.3FYR Macedonia 19.6% Uganda 35.6 Myanmar 4.0El Salvador 19.1% Angola 33.0 Paraguay 3.9Guatemala 19.0% Somalia 32.7 China 3.8Albania 18.4% El Salvador 31.0 Ukraine 3.5São Tomé and Principe 18.4% Sri Lanka 29.7 France 3.4
TABLE 5.4 Top-30 Skilled Emigration Countries, 2000 (continued)

Intern
ation
al Mig
ration
by Ed
ucation
Attain
men
t, 1990–20001
77
Suriname 18.4% Nicaragua 29.6 Venezuela, R. B. 3.4Mozambique 17.7% Hong Kong (China) 28.8 Belarus 3.2Italy 17.3% Cuba 28.7 Australia 2.7Bosnia and Herzegovina 17.0% Papua New Guinea 28.5 Burkina Faso 2.6Angola 16.9% Vietnam 27.1 Argentina 2.5Senegal 16.7% Rwanda 26.0 Chad 2.4Bulgaria 16.4% Honduras 24.4 Thailand 2.4San Marino 16.0% Guatemala 24.2 Libya 2.4Cape Verde 15.2% Afghanistan 23.3 Brazil 2.2Tunisia 14.9% Dominican Republic 21.6 Indonesia 2.1Mexico 14.4% Portugal 19.5 Azerbaijan 2.0Guinea-Bissau 14.2% Malawi 18.7 Georgia 1.6Algeria 14.1% Cambodia 18.3 Russian Federation 1.5Tuvalu 13.8% Senegal 17.7 Japan 1.2Comoros 13.4% Cameroon 17.2 Kazakhstan 1.2Morocco 12.9% Morocco 17.0 Saudi Arabia 0.9Equatorial Guinea 12.4% Zambia 16.8 Uzbekistan 0.7Portugal 12.0% Slovakia 16.7 Swaziland 0.5Mali 10.9% United Kingdom 16.7 United States 0.5Turkey 8.8% Mexico 15.3 Tajikistan 0.4
Source: Various statistical sources and agencies.
17
8Part II
Brain
Drain
, Brain
Gain
, Brain
Waste
Working-age Proportion of Working-age Working-age Working-ageimmigrants Working-age immigrants immigrants immigrants immigrants
(total) natives (total) among residents (primary) (secondary) (tertiary)
Australia 3,284,279 10,453,000 23.9% 1,266,265 908,267 1,109,747Austria 324,201 5,209,000 5.9% 188,518 108,421 27,262Belgium 748,543 6,767,000 10.0% 138,461 134,603 94,044Canada 3,709,285 17,907,000 17.2% 1,392,305 437,485 1,879,495Czech Republic (**) – – – – – –Denmark 93,934 3,500,000 2.6% 17,392 20,688 11,375Finland 34,305 3,373,000 1.0% 22,028 8,248 4,029France 3,480,664 36,731,000 8.7% 2,910,066 208,570 300,122Germany 3,262,057 55,795,000 5.5% 1,558,529 481,882 555,735Greece 112,805 6,663,000 1.7% 38,806 45,427 28,572Hungary 211,715 6,789,000 3.0% 125,550 31,155 32,317Iceland 10,565 149,000 6.6% 2,776 3,963 2,239Ireland 130,940 1,953,000 6.3% 21,905 67,050 34,750Italy 533,312 38,897,000 1.4% 316,260 78,479 81,407Japan 1,075,317 82,019,000 1.3% 421,394 279,169 330,355Korea, Rep of (*) 49,500 33,328,000 0.1% 19,398 12,851 15,207Luxembourg 83,398 260,000 24.3% 54,739 5,547 10,659Mexico 363,626 32,797,000 1.1% 180,163 60,163 123,300Netherlands 961,662 9,883,000 8.9% 570,278 141,513 146,792New Zealand 456,792 2,016,000 18.5% 121,641 113,169 194,937Norway 136,241 2,784,000 4.7% 3,108 61,303 33,464
TABLE 5.5.A Net Brain Gain in OECD Countries in 1990

Intern
ation
al Mig
ration
by Ed
ucation
Attain
men
t, 1990–20001
79
Poland 661,517 23,222,000 2.8% 392,288 97,345 100,977Portugal 170,390 6,304,000 2.6% 11,897 8,899 14,579Slovak Republic (**) 196,205 9,703,000 2.0% 116,352 28,872 29,949Spain 845,977 25,036,000 3.3% 477,484 220,448 148,044Sweden 617,449 5,852,000 9.5% 189,190 240,585 138,034Switzerland 1,463,670 4,724,000 23.7% 83,430 1,050,239 197,141Turkey 596,045 24,830,000 2.3% 429,419 100,100 48,972United Kingdom 2,778,527 37,978,000 6.8% 1,892,892 315,482 570,153United States 15,472,972 162,796,000 8.7% 3,957,187 5,312,740 6,203,045EU-15 14,178 244,201 5.5% 8,408 2,086 2,166Scandinavian countries 892 15,658 5.4% 234 335 189OECD (in millions) 41.866 657.718 6.0% 16.920 10.583 12.467
Source: Various statistical sources and agencies.
18
0Part II
Brain
Drain
, Brain
Gain
, Brain
Waste
RatioProportion of Proportion of immigrants / Working-age Net brain gain Net brain gain
tertiary among tertiary among residents expatriates (immigrants - in % of working-immigrants (PI) residents (PR) (PI/PR) (tertiary) expatriates) age residents
Australia 33.8% 31.1% 1.087 69,529 1,040,218 10.0%Austria 8.4% 11.2% 0.748 113,432 �86,170 �1.7%Belgium 12.6% 20.8% 0.605 67,627 26,417 0.4%Canada 50.7% 43.8% 1.156 396,162 1,483,333 8.3%Czech Republic (**) – – – – – –Denmark 12.1% 19.3% 0.627 51,906 �40,531 �1.2%Finland 11.7% 20.2% 0.581 53,939 �49,910 �1.5%France 8.6% 21.9% 0.393 225,415 74,707 0.2%Germany 17.0% 21.8% 0.781 735,191 �179,456 �0.3%Greece 25.3% 10.9% 2.330 119,572 �91,000 �1.4%Hungary 15.3% 10.1% 1.511 115,707 �83,390 �1.2%Iceland 21.2% 11.0% 1.927 5,435 �3,196 �2.1%Ireland 26.5% 13.9% 1.905 150,929 �116,179 �5.9%Italy 15.3% 6.3% 2.423 309,014 �227,607 �0.6%Japan 30.7% 21.2% 1.447 230,540 99,815 0.1%Korea, Rep of (*) 30.7% 13.4% 2.293 464,228 �449,020 �1.3%Luxembourg 12.8% 20.8% 0.616 5,303 5,356 2.1%Mexico 33.9% 9.2% 3.686 359,933 �236,633 �0.7%Netherlands 15.3% 15.7% 0.975 207,656 �60,864 �0.6%New Zealand 42.7% 23.3% 1.832 90,464 104,473 5.2%Norway 24.6% 15.7% 1.564 34,601 �1,137 0.0%
TABLE 5.5.B Net Brain Gain in OECD Countries in 1990

Intern
ation
al Mig
ration
by Ed
ucation
Attain
men
t, 1990–20001
81
Poland 15.3% 7.9% 1.932 308,051 �207,074 �0.9%Portugal 8.6% 6.5% 1.316 78,035 �63,456 �1.0%Slovak Republic (**) 15.3% 9.9% 1.541 95,253 �65,304 �0.7%Spain 17.5% 9.5% 1.846 94,122 53,923 0.2%Sweden 22.4% 20.5% 1.088 49,455 88,579 1.5%Switzerland 13.5% 17.2% 0.781 67,307 129,834 2.7%Turkey 8.2% 5.0% 1.643 112,739 �63,767 �0.3%United Kingdom 20.5% 13.9% 1.473 1,156,056 �585,903 �1.5%United States 40.1% 39.2% 1.023 326,472 5,876,573 3.6%EU-15 17.1% 15.5% 1.103 3,418 �1,252 �0.5%Scandinavian countries 24.9% 19.2% 1.296 195 �6 0.0%OECD (in millions) 31.2% 21.9% 1.424 6.094 6.373 1.0%
Source: Various statistical sources and agencies.
Note: (*) The number of expatriates includes Democratic People’s Republic of Korea; the number of immigrants includes Republic of Korea only.
(**) Results for Ex-Czechoslovakia are provided at the Slovak Republic line.
– not available

18
2Part II
Brain
Drain
, Brain
Gain
, Brain
Waste
Working-age Proportion of Working-age Working-age Working-ageimmigrants Working-age immigrants immigrants immigrants immigrants
(total) natives (total) among residents (primary) (secondary) (tertiary)
Australia 4,075,721 12,521,000 24.6% 1,293,435 1,242,616 1,539,670Austria 816,001 5,802,000 12.3% 387,425 325,337 103,239Belgium 867,620 7,233,000 10.7% 485,386 195,983 186,186Canada 4,661,330 20,805,000 18.3% 1,378,260 540,980 2,742,090Czech Republic 410,249 7,017,000 5.5% 155,660 191,239 59,631Denmark 169,664 3,748,000 4.3% 37,734 53,611 31,873Finland 90,511 3,580,000 2.5% 44,051 24,945 21,515France 3,755,514 40,418,000 8.5% 2,802,954 337,962 614,598Germany 4,746,000 60,269,000 7.3% 2,545,000 578,000 996,000Greece 106,041 7,750,000 1.3% 35,484 43,160 23,810Hungary 251,715 6,836,000 3.6% 109,307 87,908 54,502Iceland 16,927 174,000 8.9% 3,851 7,016 4,512Ireland 281,232 2,309,000 10.9% 23,495 127,146 115,721Italy 923,788 42,627,000 2.1% 488,538 292,781 142,469Japan 951,302 92,337,000 1.0% 325,594 275,692 328,870Korea, Rep of (*) 150,812 42,289,000 0.4% 51,617 43,706 52,137Luxembourg 114,625 303,000 27.4% 37,780 36,644 29,321Mexico 417,371 45,226,000 0.9% 139,186 119,414 141,912Netherlands 1,320,320 11,109,000 10.6% 715,337 351,331 253,651New Zealand 603,606 2,400,000 20.1% 93,909 182,109 232,296Norway 204,182 3,051,000 6.3% 5,693 112,202 64,239
TABLE 5.6.A Net Brain Gain in OECD Countries in 2000

Intern
ation
al Mig
ration
by Ed
ucation
Attain
men
t, 1990–20001
83
Poland 741,517 24,675,000 2.9% 441,529 187,418 103,496Portugal 207,476 6,889,000 2.9% 122,236 43,137 29,816Slovak Rep 426,072 3,416,000 11.1% 321,721 17,134 41,989Spain 1,370,657 28,839,000 4.5% 440,493 700,005 230,159Sweden 805,143 6,219,000 11.5% 201,319 335,463 220,731Switzerland 1,704,948 5,200,000 24.7% 119,714 970,084 286,682Turkey 826,110 33,130,000 2.4% 449,020 232,450 141,034United Kingdom 3,639,907 40,353,000 8.3% 1,334,821 1,048,194 1,256,892United States 24,366,085 183,564,000 11.7% 5,608,020 8,403,780 10,354,285EU-15 19,214 267,448 6.7% 9,702 4,494 4,256Scandinavian countries 1,286 16,772 7.1% 293 533 343OECD (in millions) 59.022 750.089 7.3% 20.199 17.107 20.403
Source: Various statistical sources and agencies.
18
4Part II
Brain
Drain
, Brain
Gain
, Brain
Waste
RatioProportion of Proportion of Immigrants / working-age Net brain gain Net brain gain
tertiary among tertiary among residents expatriates (immigrants - in % of working-immigrants (PI) residents (PR) (PI/PR) (tertiary) expatriates) age residents
Australia 37.8% 34.0% 1.112 116,723 1,422,947 11.4%Austria 12.7% 14.4% 0.878 130,487 �27,248 �0.5%Belgium 21.5% 27.5% 0.782 102,187 83,999 1.2%Canada 58.8% 51.5% 1.143 516,471 2,225,619 10.7%Czech Republic 14.5% 10.8% 1.346 88,112 �28,481 0.4%Denmark 18.8% 21.9% 0.858 68,643 �36,770 �1.0%Finland 23.8% 26.3% 0.905 76,132 �54,617 �1.5%France 16.4% 21.9% 0.747 312,494 302,104 0.7%Germany 21.0% 25.5% 0.823 848,414 147,586 0.2%Greece 22.5% 15.2% 1.481 159,895 �136,085 �1.8%Hungary 21.7% 12.0% 1.804 124,426 �69,923 �1.0%Iceland 26.7% 15.5% 1.720 6,598 �2,086 �1.2%Ireland 41.1% 21.7% 1.900 209,156 �93,435 �4.0%Italy 15.4% 8.7% 1.781 408,287 �265,818 �0.6%Japan 34.6% 24.6% 1.404 268,925 59,946 0.1%Korea, Rep of (*) 34.6% 25.8% 1.340 652,894 �600,757 �1.4%Luxembourg 25.6% 27.5% 0.932 7,281 22,040 7.3%Mexico 34.0% 11.3% 3.009 922,964 �781,052 �1.7%Netherlands 19.2% 21.9% 0.879 256,762 �3,111 0.0%New Zealand 38.5% 25.9% 1.489 161,740 70,556 2.9%Norway 31.5% 21.8% 1.447 46,286 17,953 0.6%
TABLE 5.6.B Net brain gain in OECD countries in 2000

Intern
ation
al Mig
ration
by Ed
ucation
Attain
men
t, 1990–20001
85
Poland 14.0% 11.1% 1.257 449,059 �345,563 �1.4%Portugal 14.4% 8.8% 1.630 147,438 �117,622 �1.7%Slovak Rep 9.9% 11.6% 0.850 79,451 �37,462 �1.1%Spain 16.8% 12.2% 1.372 159,889 70,271 0.2%Sweden 27.4% 27.5% 0.997 77,703 143,029 2.3%Switzerland 16.8% 17.2% 0.975 88,051 198,631 3.8%Turkey 17.1% 8.5% 2.008 174,043 �33,009 �0.1%United Kingdom 34.5% 17.8% 1.938 1,441,307 �184,415 �0.5%United States 42.5% 51.3% 0.828 431,330 9,922,955 5.4%EU-15 23.1% 18.6% 1.240 4,406 �150 �0.1%Scandinavian countries 29.3% 24.8% 1.182 275 68 0.4%OECD (in millions) 35.4% 27.6% 1.279 8.533 11.870 1.6%
Source: Various statistical sources and agencies.
Note: (*) The number of emigrants includes Democratic People’s Republic of Korea; the number of immigrants includes Republic of Korea only.
workers is rather low in the Slovak Republic, the Czech Republic, Austria, andSpain. The skill structure of immigrants can be compared with the structure of thenative population. On average, columns 2 and 3 of tables 5.5.B and 5.6.B show thatOECD immigrants are more skilled than individuals in the OECD who are nativeborn. This is especially true when the education of the native population is low(for example, in Mexico, the Republic of Korea and the Democratic People’sRepublic of Korea, Greece, Turkey, Italy, and Ireland). This is also true in countrieswhere the immigration policy relies on a “points system” (such as in Australia,Canada, and New Zealand) and in the United Kingdom. In highly educated coun-tries, such as the United States, France, Belgium, and Austria, immigrants are lesseducated than natives.
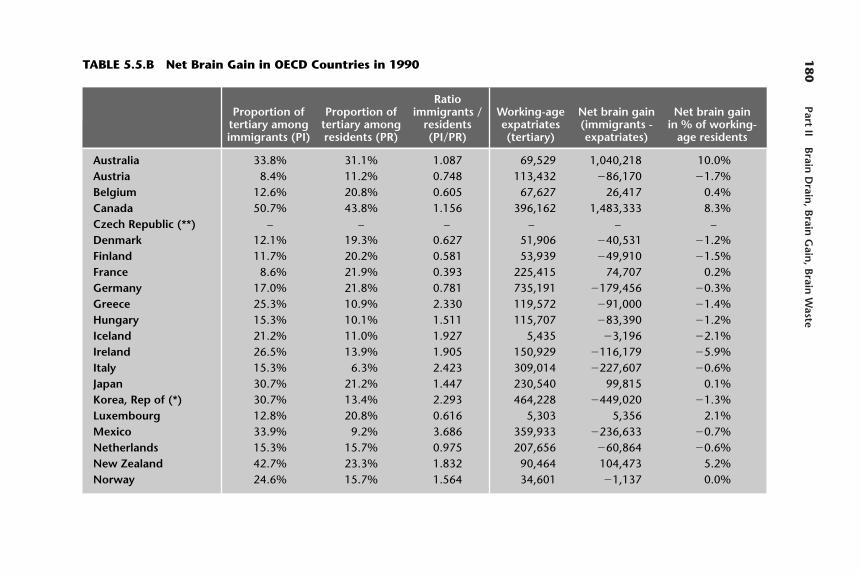
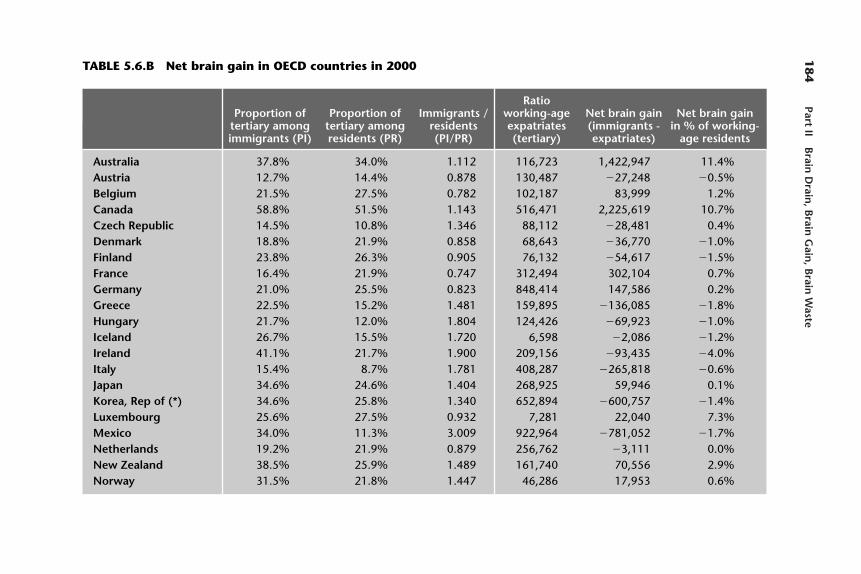
Finally, columns 4 through 6 of tables 5.5.B and 5.6.B offer a measure of thenet brain gain. The net brain gain is defined as the net immigration of skilledworkers, expressed in percentage of the working-age resident population. Ofcourse, such an indicator suffers from serious shortcomings: given the variety ofeducation systems, emigrants’ and immigrants’ education levels are subject toserious comparability problems. Additionally, immigrants take time to assimilateinto the labor market and suffer from discrimination. Nevertheless, our indicatorprovides new insights about who wins and who loses from skilled migration.Because M i,j
t,h denotes the stock of working-age skilled individuals born in countryj and living in country i at time t, the net brain gain in country i can be evaluatedas follows.
(5.3)
The first term in the numerator is the number of skilled emigrants from coun-try i (column 4 of tables 5.5.B and 5.6.B). The second term is the number ofskilled immigrants (column 6 of tables 5.5.A and 5.6.A). Expressing the differencebetween these two terms in proportion to the resident labor force (column 2 oftables 5.5.A and 5.6.A), we obtain the net brain gain (column 6 of tables 5.5.B and5.6.B). Countries exhibiting a positive (respectively, a negative) amount are netgainers (respectively, net losers). On the whole, OECD countries benefit from theinternational mobility of skilled workers. The net gain amounts to 1.6 percent in2000, compared with 1.0 percent in 1990. The net brain gain has globallyimproved in all OECD countries. Hence, the 1990 balanced situation in Scandina-vian countries turned into a net brain gain in 2000. The EU-15 deficit turned intoa quasi-balanced situation. The main winners of this brain gain are Australia,
NBGit �
aj
Mi,jt,h � a
k
Mk,it,h
as
Nit,s
186 Part II Brain Drain, Brain Gain, Brain Waste

Canada, and Luxembourg (the latter country experienced a strong improvementbetween 1990 and 2000), followed by the United States, Switzerland, and NewZealand. Conversely, Ireland, Greece, and Portugal experienced a brain loss of 2percent.
Conclusion
Because of the poor quality of international data, assessing the economic impactof international migration is a challenging issue. This chapter provides a new dataset for skilled emigration rates describing the loss of skilled workers in both devel-oping and developed countries.
In absolute terms, we show that the largest stocks of educated emigrants arefrom Europe (specifically the United Kingdom, Germany, and Italy); Southernand Eastern Asia (including the Philippines, India, China, the Republic of Koreaand the Democratic People’s Republic of Korea, and Vietnam); and, to a lesserextent, Central America and Mexico. These emigrants are concentrated in a fewdestination countries: about 50 percent of skilled migrants live in the UnitedStates; this percentage increases to 70 percent if two other immigration countries(Canada and Australia) are included and to 85 percent if the three largest EUcountries (the United Kingdom, Germany, and France) are included.
In proportion to the educated labor force in the origin countries, the highestrates are observed in Central America and Africa (in Middle, Western, and EasternAfrica), as well as in the Caribbean and the Pacific area. The emigration rateexceeds 80 percent in nations such as Guyana, Jamaica, Haiti, and Grenada. Highrates are observed in a few islands in Oceania. The emigration rate exceeds 50 per-cent in five African countries (Cape Verde, The Gambia, Mauritius, the Seychelles,and Sierra Leone). Conversely, the brain drain is rather low in the former SovietUnion; the Gulf States; and large countries such as India, China, Indonesia, Brazil,and most of the OECD countries. Calculations made by area of particular interestshed light on the situation in important developing zones. Islamic and Arab coun-tries are not strongly affected by the brain drain, in contrast with Sub-SaharanAfrican countries and, to a lesser extent, the MENA countries.
Regarding selection (that is, the proportion of skilled emigrants in the totalemigration stock), the highest selection rates are observed in the Gulf countrieswhere the rate of brain drain is rather low (such as in Qatar, Oman, the UnitedArab Emirates, Bahrain, and Kuwait), in some high-income countries (for exam-ple, Taiwan (China), Japan, Hong Kong (China), Canada, and Israel), and in a fewof African countries (including Nigeria, Swaziland, South Africa, and Zambia).Conversely, selection rates are low in traditional unskilled emigration countries(such as Turkey, Mali, Portugal, Algeria, Morocco, Tunisia, and Mauritania), in
International Migration by Education Attainment, 1990–2000 187
selected OECD countries (including Portugal, Mexico, Italy, the Slovak Republic,and Spain), and in a few countries that are characterized by high emigration rates(for example, Senegal, The Gambia, Samoa, Suriname, and Mozambique).
By increasing the number of observations and improving their degree of relia-bility, our method provides useful material for the empirical analysis of the causesand consequences of the brain drain. Our data set is obviously evolutionary andcould be refined in several ways. Nevertheless, we believe that the current versiondelivers new information that is rich enough to assess the changes in the interna-tional distribution of migration rates, to test for the (push-and-pull) determi-nants per skill group, and to evaluate the macroeconomic consequences of migra-tion on source and destination countries.
Annex 5.A
This annex provides definitions of the country sets distinguished in the tables, anda comparison with previous works.
Data
We distinguish America (including the United States, Canada, and Mexico),Europe (including the EU-15, Switzerland, the Czech and Slovak Republics, Hun-gary, Poland, Norway, and Iceland), and the rest of the Organisation for EconomicCo-operation and Development (OECD) countries (including Australia, NewZealand, Japan, the Republic of Korea and the Democratic People’s Republic ofKorea, and Turkey).
Country Groups
By region. AMERICA: North America (Canada, the United States), theCaribbean (Antigua and Barbuda, The Bahamas, Barbados, Cuba, Dominica, theDominican Republic, Grenada, Haiti, Jamaica, St. Kitts and Nevis, St. Lucia, St.Vincent and the Grenadines, Trinidad and Tobago), Central America (Belize,Costa Rica, El Salvador, Guatemala, Honduras, Mexico, Nicaragua, Panama),South America (Argentina, Bolivia, Brazil, Chile, Colombia, Ecuador, Guyana,Paraguay, Peru, Suriname, Uruguay, República Bolivariana de Venezuela).
EUROPE: Eastern Europe (Belarus, Bulgaria, the Czech Republic, Hungary,Moldova, Poland, Romania, the Russian Federation, the Slovak Republic,Ukraine), Northern Europe (Denmark, Estonia, Finland, Iceland, Ireland, Latvia,Lithuania, Norway, Sweden, the United Kingdom), Southern Europe (Albania,
188 Part II Brain Drain, Brain Gain, Brain Waste
Andorra, Bosnia and Herzegovina, Croatia, the former Yogoslav Republic of Mace-donia, Greece, Holy See (Vatican City), Italy, Malta, Portugal, San Marino, Serbiaand Montenegro, Slovenia, Spain), Western Europe (Austria, Belgium, France,Germany, Liechtenstein, Luxembourg, Monaco, the Netherlands, Switzerland).
AFRICA: Eastern Africa (Burundi, the Comoros, Djibouti, Eritrea, Ethiopia,Kenya, Madagascar, Malawi, Mauritius, Mozambique, Rwanda, the Seychelles,Somalia, Tanzania, Uganda, Zambia, Zimbabwe), Middle Africa (Angola,Cameroon, the Central African Republic, Chad, the Democratic Republic ofCongo, Equatorial Guinea, Gabon, the Republic of Congo, São Tomé andPrincipe), Northern Africa (Algeria, the Arab Republic of Egypt, Libya, Morocco,Sudan, Tunisia), Southern Africa (Botswana, Lesotho, Namibia, South Africa,Swaziland), Western Africa (Benin, Burkina Faso, Cape Verde, Côte d’Ivoire, TheGambia, Ghana, Guinea, Guinea-Bissau, Liberia, Mali, Mauritania, Niger, Nigeria,Senegal, Sierra Leone, Togo).
ASIA: Eastern Asia (China, Hong Kong (China), Macao SAR, Japan, Mongolia,the Republic of Korea and the Democratic People’s Republic of Korea, Taiwan(China)), South-Central Asia (Afghanistan, Bangladesh, Bhutan, India, IslamicRepublic of Iran, Kazakhstan, Kyrgyz Republic, Maldives, Nepal, Pakistan, SriLanka, Tajikistan, Turkmenistan, Uzbekistan), South-Eastern Asia (Brunei Darus-salam, Cambodia, Indonesia, the Lao People’s Democratic Republic, Malaysia,Myanmar, the Philippines, Singapore, Timor-Leste, Thailand, Vietnam), WesternAsia (Armenia, Azerbaijan, Bahrain, Cyprus, Georgia, Iraq, Israel, Jordan, Kuwait,Lebanon, Occupied Palestinian Territory, Oman, Qatar, Saudi Arabia, the Repub-lic of Yemen, the Syrian Arab Republic, Turkey, the United Arab Emirates).
OCEANIA: Australia and New Zealand (Australia, New Zealand), Melanesia(Fiji, Papua New Guinea, the Solomon Islands, Vanuatu), Micronesia (Kiribati,the Marshall Islands, the Federated States of Micronesia, Nauru, Palau), Polynesia(Samoa, Tonga, Tuvalu).
By income group. HIGH INCOME: Andorra, Australia, Austria, The Bahamas,Belgium, Brunei Darussalam, Canada, Cyprus, Denmark, Finland, France, Ger-many, Greece, Hong Kong (China), Iceland, Ireland, Israel, Italy, Japan, Kuwait,Liechtenstein, Luxembourg, Macao SAR, Malta, Monaco, the Netherlands, NewZealand, Norway, Portugal, Qatar, San Marino, Singapore, Slovenia, Spain, Swe-den, Switzerland, Taiwan (China), the United Arab Emirates, the United King-dom, the United States.
UPPER-MIDDLE INCOME: Antigua and Barbuda, Argentina, Bahrain, Barba-dos, Brazil, Botswana, Chile, Croatia, the Czech Republic, Estonia, Gabon,Grenada, Hungary, Lebanon, Libya, Malaysia, Mauritius, Mexico, Oman, Palau,Panama, Poland, República Bolivariana de Venezuela, the Republic of Korea and
International Migration by Education Attainment, 1990–2000 189

the Democratic People’s Republic of Korea, St. Kitts and Nevis, St. Lucia, SaudiArabia, the Seychelles, the Slovak Republic, Trinidad and Tobago, Turkey, Uruguay.
LOWER-MIDDLE INCOME: Albania, Algeria, Belarus, Belize, Bolivia, Bosniaand Herzegovina, Bulgaria, Cambodia, Cape Verde, Colombia, Costa Rica, Cuba,Djibouti, Dominica, the Dominican Republic, Ecuador, Egypt, El Salvador, Equa-torial Guinea, Fiji, FYR Macedonia, Georgia, Guatemala, Guyana, Iraq, IslamicRepublic of Iran, Jamaica, Jordan, Kazakhstan, Kiribati, Latvia, Lithuania, Mal-dives, the Marshall Islands, the Federated States of Micronesia, Morocco, Namibia,Papua New Guinea, Paraguay, Peru, the Philippines, Romania, Russia, St. Vincentand the Grenadines, Samoa, Serbia and Montenegro, South Africa, Sri Lanka,Suriname, Swaziland, the Syrian Arab Republic, Thailand, Tonga, Tunisia,Ukraine, Uzbekistan, Vanuatu.
LOW INCOME: Afghanistan, Angola, Armenia, Azerbaijan, Bangladesh,Benin, Bhutan, Burkina Faso, Myanmar, Burundi, Cameroon, the Central AfricanRepublic, Chad, China, the Comoros, the Democratic Republic of Congo, Côted’Ivoire, Eritrea, Ethiopia, The Gambia, Ghana, Guinea, Guinea-Bissau, Haiti,Honduras, India, Indonesia, Kenya, Kyrgyzstan, Lao PDR, Lesotho, Liberia, Mada-gascar, Malawi, Mali, Mauritania, Moldova, Mongolia, Mozambique, Nepal,Nicaragua, Niger, Nigeria, Pakistan, the Republic of Congo, the Republic ofYemen, Rwanda, São Tomé and Principe, Senegal, Sierra Leone, the SolomonIslands, Somalia, Sudan, Tajikistan, Tanzania, Togo, Turkmenistan, Uganda, Viet-nam, Zambia, Zimbabwe.
By size. LARGE (above 25 million): China, India, the United States, Indonesia,Brazil, Russia, Pakistan, Bangladesh, Japan, Nigeria, Mexico, Germany, Vietnam,the Philippines, the Republic of Korea and the Democratic People’s Republic ofKorea, Turkey, Egypt, Islamic Republic of Iran, Ethiopia, Thailand, France, theUnited Kingdom, Italy, Ukraine, the Democratic Republic of Congo, Myanmar,South Africa, Colombia, Spain, Poland, Argentina, Tanzania, Sudan, Canada,Kenya, Algeria, Morocco, Peru.
UPPER MIDDLE (from 10 to 25 million): Uzbekistan, República Bolivarianade Venezuela, Nepal, Uganda, Iraq, Malaysia, Taiwan (China), Romania, SaudiArabia, Afghanistan, Ghana, Australia, Sri Lanka, the Republic of Yemen, Mozam-bique, the Syrian Arab Republic, Madagascar, the Netherlands, Côte d’Ivoire,Kazakhstan, Chile, Cameroon, Cambodia, Zimbabwe, Ecuador, Angola, Mali,Burkina Faso, Guatemala, Malawi, Cuba, Greece, Niger, Serbia and Montenegro,Zambia, the Czech Republic, Belgium, Belarus, Portugal, Hungary.
LOWER MIDDLE (from 2.5 to 10 million): Tunisia, Senegal, Sweden, Somalia,the Dominican Republic, Bolivia, Azerbaijan, Guinea, Austria, Bulgaria, Haiti,Chad, Rwanda, Switzerland, Swaziland, Hong Kong (China), Honduras, Burundi,
190 Part II Brain Drain, Brain Gain, Brain Waste

Benin, El Salvador, Tajikistan, Israel, Paraguay, the Slovak Republic, Papua NewGuinea, Denmark, Lao PDR, Georgia, Libya, Finland, Nicaragua, Jordan, KyrgyzRepublic, Turkmenistan, Togo, Norway, Croatia, Sierra Leone, Moldova, Singa-pore, Bosnia and Herzegovina, Costa Rica, Ireland, New Zealand, the CentralAfrican Republic, Eritrea, Lithuania, Lebanon, the Republic of Congo, Uruguay,Palestine, Albania, Armenia, Panama, Liberia, the United Arab Emirates, Maurita-nia, Oman, Jamaica,
SMALL (lower than 2.5 million): Mongolia, Latvia, Kuwait, Bhutan, FYRMacedonia, Slovenia, Namibia, Lesotho, Botswana, Guinea-Bissau, Estonia, TheGambia, Trinidad and Tobago, Gabon, Mauritius, Fiji, Cyprus, Guyana, theComoros, Timor-Leste, Bahrain, Djibouti, Qatar, Equatorial Guinea, Macao SAR,Cape Verde, the Solomon Islands, Luxembourg, Suriname, Malta, Brunei Darus-salam, The Bahamas, Maldives, Iceland, Barbados, Belize, Vanuatu, Samoa, SãoTomé and Principe, St. Lucia, St. Vincent, the Federated States of Micronesia,Tonga, Kiribati, Grenada, the Seychelles, Andorra, Dominica, Antigua and Bar-buda, the Marshall Islands, St. Kitts and Nevis, Liechtenstein, Monaco, SanMarino, Palau, Nauru, Tuvalu, Holy See (Vatican City).
By group of particular interest. MIDDLE EAST AND NORTHERN AFRICA(MENA): Algeria, Bahrain, Cyprus, Djibouti, Egypt, Iraq, Islamic Republic ofIran, Israel, Jordan, Kuwait, Lebanon, Libya, Morocco, Palestine, Oman, Qatar, theRepublic of Yemen, Saudi Arabia, the Syrian Arab Republic, Tunisia, the UnitedArab Emirates.
ECONOMIES IN TRANSITION: Belarus, Bulgaria, the Czech Republic, FYRMacedonia, Hungary, Moldova, Poland, Romania, Russia, the Slovak Republic,Ukraine, Estonia, Latvia, Lithuania, Albania, Bosnia and Herzegovina, Croatia,Serbia and Montenegro, Slovenia, Kazakhstan, Kyrgyz Republic, Tajikistan, Turk-menistan, Uzbekistan, Armenia, Azerbaijan, Georgia.
EU-15: Denmark, Finland, Ireland, Sweden, the United Kingdom, Greece, Italy,Portugal, Spain, Austria, Belgium, France, Germany, Luxembourg, the Netherlands.
SUB-SAHARAN AFRICA: Burundi, the Comoros, Djibouti, Eritrea, Ethiopia,Kenya, Madagascar, Malawi, Mauritius, Mozambique, Rwanda, the Seychelles,Somalia, Tanzania, Uganda, Zambia, Zimbabwe, Angola, Cameroon, the CentralAfrican Republic, Chad, the Democratic Republic of Congo, Equatorial Guinea,Gabon, the Republic of Congo, São Tomé and Principe, Botswana, Lesotho,Namibia, South Africa, Swaziland, Benin, Burkina Faso, Cape Verde, Côte d’Ivoire,The Gambia, Ghana, Guinea, Guinea-Bissau, Liberia, Mali, Mauritania, Niger,Nigeria, Senegal, Sierra Leone, Togo.
ISLAMIC COUNTRIES: Afghanistan, Albania, Algeria, Azerbaijan, Bahrain,Bangladesh, Benin, Brunei Darussalam, Burkina Faso, Cameroon, Chad, the
International Migration by Education Attainment, 1990–2000 191

Comoros, Côte d’Ivoire, Djibouti, Egypt, Gabon, The Gambia, Guinea, Guinea-Bissau, Guyana, Indonesia, Iraq, Islamic Republic of Iran, Libya, Jordan, Kaza-khstan, Kuwait, Kyrgyzstan, Lebanon, Malaysia, Maldives, Mali, Mauritania,Morocco, Mozambique, Niger, Nigeria, Palestine, Oman, Pakistan, Qatar, theRepublic of Yemen, Saudi Arabia, Senegal, Sierra Leone, Somalia, Sudan, Suri-name, the Syrian Arab Republic, Tajikistan, Togo, Tunisia, Turkey, Turkmenistan,Uganda, the United Arab Emirates, Uzbekistan.
ARAB COUNTRIES: Algeria, Bahrain, the Comoros, Djibouti, Egypt, Iraq,Libya, Jordan, Kuwait, Lebanon, Mauritania, Morocco, Palestine, Oman, Qatar,the Republic of Yemen, Saudi Arabia, Somalia, Sudan, the Syrian Arab Republic,Tunisia, the United Arab Emirates.
UN LEAST DEVELOPED COUNTRIES: Afghanistan, Angola, Bangladesh,Benin, Bhutan, Burkina Faso, Burundi, Cambodia, Cape Verde, the CentralAfrican Republic, Chad, the Comoros, the Democratic Republic of Congo, Dji-bouti, Equatorial Guinea, Eritrea, Ethiopia, The Gambia, Guinea, Guinea-Bissau,Haiti, Kiribati, Lao PDR, Lesotho, Liberia, Madagascar, Malawi, Maldives, Mali,Mauritania, Mozambique, Myanmar, Nepal, Niger, the Republic of Yemen,Rwanda, Samoa, São Tomé and Principe, Senegal, Sierra Leone, the SolomonIslands, Somalia, Sudan, Tanzania, Timor-Leste, Togo, Tuvalu, Uganda, Vanuatu,Zambia.
UN LANDLOCKED DEVELOPING COUNTRIES: Afghanistan, Armenia,Azerbaijan, Bhutan, Bolivia, Botswana, Burkina Faso, Burundi, the Central AfricanRepublic, Chad, Ethiopia, FYR Macedonia, Kazakhstan, Kyrgyz Republic, LaoPDR, Lesotho, Malawi, Mali, Moldova, Mongolia, Nepal, Niger, Paraguay, Rwanda,Swaziland, Tajikistan, Turkmenistan, Uganda, Uzbekistan, Zambia, Zimbabwe.
UN SMALL ISLANDS DEVELOPING STATES: Antigua and Barbuda, TheBahamas, Barbados, Belize, Cape Verde, the Comoros, Cuba, Dominica, theDominican Republic, Fiji, Grenada, Guinea-Bissau, Guyana, Haiti, Jamaica, Kiri-bati, Maldives, the Marshall Islands, Mauritius, the Federated States of Microne-sia, Nauru, Palau, Papua New Guinea, St. Kitts and Nevis, St. Lucia, St Vincent,Samoa, São Tomé and Principe, the Seychelles, Singapore, the Solomon Islands,Suriname, Timor-Leste, Tonga, Trinidad and Tobago, Tuvalu, Vanuatu.
Comparison with Previous Studies
Comparison with Carrington and Detragiache (1998)
Carrington and Detragiache’s 1998 study clearly initiated new debates on themagnitude and distribution of the brain drain. Our data set refines their method
192 Part II Brain Drain, Brain Gain, Brain Waste
by incorporating additional statistical sources. By collecting census, register, andsurvey data from all OECD countries, we eliminate two sources of bias:
• Relying on OECD statistics on immigration brings up several problems. First,in 1990, these data only provided information on the country of origin for thetop-10 or top-5 sending countries. Hence, small sending countries are usuallynot identified, at least in the majority of receiving countries. Second, immigra-tion in EU countries is based on the concept of citizenship rather than oncountry of birth. Third, immigration data are missing for a few OECD coun-tries (Greece, Iceland, Mexico, Poland, the Slovak Republic, and Turkey).Finally, the OECD provides data on the total immigration stock rather than onthe adult immigration stock (which can be compared with the labor force insending countries). Compared with national censuses, we estimate that relyingon OECD statistics implies an average underestimation in skilled workersmigration rates by 8.9 percent in 2000. This is the major source of bias, espe-cially for small countries that usually are not identified as important sendingcountries.
• Imposing the U.S. education structure on other OECD countries induces anaverage overestimation in skilled workers migration rates by 6.3 percent in2000. The bias is obviously strong in countries sending a minor part of theiremigrants to the United States.
On average, Carrington and Detragiache’s method underestimates the emigra-tion rates of skilled workers by 2.6 percent in 2000. This average bias seems rathersmall but hides a strong heterogeneity. This appears on figure 5.A.1, which givesskilled migration rates evaluated under three measurement methods: (a) a methodfully based on census and administrative data (our method); (b) a method basedon OECD statistics and U.S. education attainment data (Carrington and Detra-giache 1998); and (c) an intermediate method based on census and administrativedata and U.S. education attainment data. The observations calculated with ourmethod are ranked in a decreasing order. In comparison with the census method,the second method clearly underestimates the brain drain for a majority of coun-tries. On the contrary, the third method overestimates the brain drain.
The two sources of bias cancel each other in a couple of cases. However, thebrain drain is particularly overestimated in countries such as São Tomé andPrincipe, Algeria, Tunisia, Morocco, Turkey, Suriname, and Algeria. By transposingthe education structure observed in the United States, Carrington and Detragiache(1998) and Adams (2003) obtain high emigration rates of tertiary educated work-ers for these countries (between 35 and 45 percent for North Africa and Turkey).Taking into account the low level of education observed among emigrants to
International Migration by Education Attainment, 1990–2000 193

Europe (where the majority of these migrants live), we obtain much lower-skilledemigration rates (between 5 and 20 percent). On the contrary, the brain drain islargely underestimated in Sub-Saharan Africa (Kenya, The Gambia, the Sey-chelles, Mauritius) and in small countries sending a small number of emigrants tothe OECD area (Malta, Cyprus, and so on).
Comparison with Release 1.0 (Docquier and Marfouk 2004)
Figure 5.A.2 compares the skilled migration rates evaluated in “Measuring theInternational Mobility of Skilled Workers—Release 1.0” with those evaluated inRelease 1.1. It appears that there were no systematic biases in the previous release:a simple regression gives Release 1.1 � 0.0081 � 0.9866�Release 1.0, R2 � 0.8701.Nevertheless, replacing survey data with census data obtained from Europeancountries strongly improves our measure for about 20 sending countries.
Acknowledgments
We are grateful to the statisticians from the Statistics Offices of OECD countriesthat sent us the data and helped us interpret them. We would particularly like to
194 Part II Brain Drain, Brain Gain, Brain Waste
Our methodCensus + U.S. sharing
OECD Statistics + U.S. Sharing
0
10
20
30
40
50
Per
cent
60
70
80
90
100
FIGURE 5.A.1 Emigration Rates under 3 MeasurementMethods, 2000
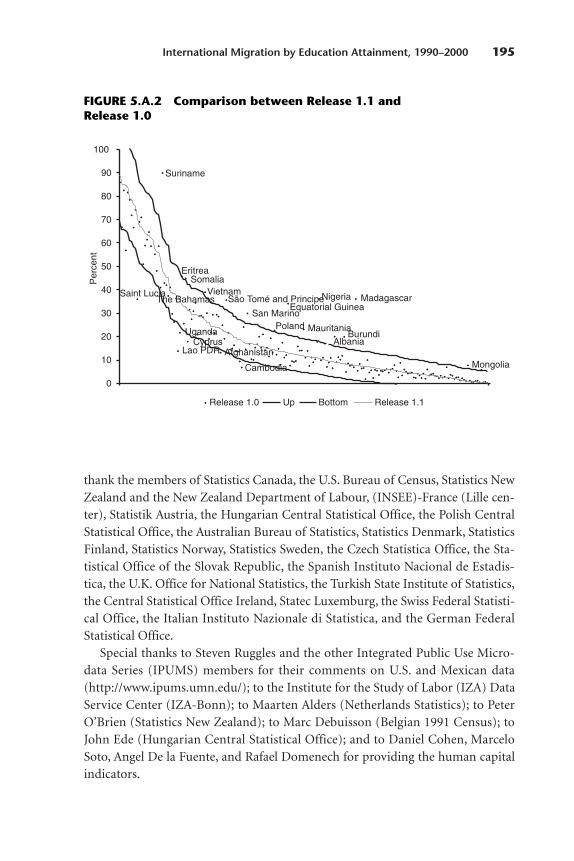
thank the members of Statistics Canada, the U.S. Bureau of Census, Statistics NewZealand and the New Zealand Department of Labour, (INSEE)-France (Lille cen-ter), Statistik Austria, the Hungarian Central Statistical Office, the Polish CentralStatistical Office, the Australian Bureau of Statistics, Statistics Denmark, StatisticsFinland, Statistics Norway, Statistics Sweden, the Czech Statistica Office, the Sta-tistical Office of the Slovak Republic, the Spanish Instituto Nacional de Estadis-tica, the U.K. Office for National Statistics, the Turkish State Institute of Statistics,the Central Statistical Office Ireland, Statec Luxemburg, the Swiss Federal Statisti-cal Office, the Italian Instituto Nazionale di Statistica, and the German FederalStatistical Office.
Special thanks to Steven Ruggles and the other Integrated Public Use Micro-data Series (IPUMS) members for their comments on U.S. and Mexican data(http://www.ipums.umn.edu/); to the Institute for the Study of Labor (IZA) DataService Center (IZA-Bonn); to Maarten Alders (Netherlands Statistics); to PeterO’Brien (Statistics New Zealand); to Marc Debuisson (Belgian 1991 Census); toJohn Ede (Hungarian Central Statistical Office); and to Daniel Cohen, MarceloSoto, Angel De la Fuente, and Rafael Domenech for providing the human capitalindicators.
International Migration by Education Attainment, 1990–2000 195
100
90
80
70
60
50
40
30
20
10
0
Release 1.0 Up Bottom
Per
cent
Release 1.1
The BahamasSaint Lucia
San Marino
UgandaCyprus
Lao PDR Afghanistan
Cambodia
Eritrea
Suriname
SomaliaVietnam
São Tomé and Principe
Poland Mauritania
Equatorial GuineaNigeria Madagascar
BurundiAlbania
Mongolia
FIGURE 5.A.2 Comparison between Release 1.1 and Release 1.0

Regarding non-OECD countries, we thank the Statistical Offices of SouthAfrica, Botswana, Macao SAR, Mauritius, Slovenia, and Armenia. All of their com-ments on data and assumptions were very helpful.
Endnotes
1. See the International Organization for Migration on Africa (IOM 2003). The United NationsDevelopment Programme (United Nations 2001) notes that, under the new U.S. legislation, about100,000 software professionals are expected to leave India each year, over the next three years. The emi-gration of those professionals costs $2 billion a year for India.
2. The IOM (2003) reports that “prospects of working abroad have increased the expected returnto additional years of education and led many people to invest in more schooling, especially in occu-pations in high demand overseas.”
3. See IOM (2003) and World Bank (2003) on the perspectives of brain drain in the twenty-firstcentury.
4. This was the position of the United Nations Economic Commission for Africa (UNECA), theIOM, and the International Development Research Centre at the regional conference on Africa, held inAddis Ababa in 2000.
5. OECD statistics suffer from various limitations (see OECD 2002). For example, they only pro-vide information on the country of origin for the main sending countries. Other sending countries areconsidered as residual in the entry “other countries.” African migration is particularly mismeasured. Inaddition, OECD data are not avalaible for Greece, Iceland, Mexico, Poland, the Slovak Republic, andTurkey in 2000.
6. A brief comparion is provided in appendix 6.3 of Docquier and Marfouk 2004.7. Since then, a similar study by Dumont and Lemaître (2004) came out in October 2004. The
main differences are as follows: (a) the data sources are somewhat different; (b) the definition of immi-grant differs for some countries (for example, French citizens born in Algeria are counted as immi-grants (the so-called “Pieds noirs”), while we use data on foreign born (people born abroad with for-eign citizenship at birth) published by the French Statistic Institute; (c) we consider the population age25 and over, while they consider the population age 15 and over; (d) we provide skilled emigrationrates for 195 countries in 2000 and 174 countries in 1990, while they provide rates for 102 observationsin 2000 (94 in a variant); (5) they aggregate dependent territories and their sovereign state, while wetreat dependent territories as separate areas.
8. Note that we report 1990 estimates for a few countries that became independent after January 1,1990 (for example, Namibia, the Marshall Islands, Micronesia, and Palau).
9. Our working-age concept includes retirees.10. Bhorat, Meyer, and Mlatsheni (2002) compare South African emigration data with immigra-
tion numbers collected in five important receiving countries (Australia, Canada, New Zealand, theUnited Kingdom, and the United States). They show that the emigration sum was approximately threetimes larger than South African official statistics.
11. For example, Australian data mix information about the highest degree and the number ofyears of schooling.
12. Using registration data from Finnish schools and universities, Statistics Finland has problemswith degrees obtained abroad. In New Zealand, there was a major change in the classification ofpostschool qualifications between 1991 and 1996.
13. Hatton and Williamson (2002) estimate that illegal immigrants residing in OECD countriesrepresent 10 to 15 percent of the total stock.
14. See http://uscis.gov/graphics/shared/aboutus/statistics/III Report 1211.pdf.15. In some receiving countries, such as Germany, immigrants’ children (that is, the second gener-
ation) usually keep their foreign citizenship.
196 Part II Brain Drain, Brain Gain, Brain Waste
16. Conversely, in other OECD countries with a restricted access to nationality (such as Japan,Korea, and Switzerland), the foreign population is important (about 20 percent in Switzerland).
17. See Malone and others (2003) for more details.18. Data by foreign background are provided in the Netherlands, France, and Scandinavian coun-
tries. See Alders (2001) for the Netherlands or Ostby (2002) for Norway.19. Note that aggregating appropriated stock data would allow computation of emigration rates
for the former Yugoslavia, the former Soviet Union, and the former Czechoslovakia in 2000.20. Carrington and Detragiache (1998) used data from the Institute of International Education to
estimate the number of graduate students completing their schooling in the United States. We considerthat some of these students age 25 and over receive grants and can be considered as workers(researchers).
21. Country-specific data by occupation reveal that the occupational structure of those withunknown education is similar to the structure of low-skilled workers (and strongly different from thatof high-skilled workers). See Debuisson and others (2004) on Belgium data.
22. For some countries, immigrants often travel back and forth between their new and old coun-tries (for example, Mexico). These immigrants are likely to be counted as still being residents in theirhome country. For that reason, Carrington and Detragiache (1998) provide an upper bound(m=M/N) and a lower bound (m=M/(N+M)). Because the upper bound is not interpretable for a largenumber of countries (higher than one), we only report the lower bound.
23. See http://esa.un.org/unpp.24. See http://www.cia.gov/cia/publications/factbook.25. This partly explains why human capital did not prove to be significant or distort the “good
sign” in growth regressions.26. For this reason, Cohen and Soto (2001) exclude African countries from their growth regressions.27. In Cyprus, the 2001 census gives share of population with tertiary education at 22 percent to
be compared with 4.6 percent in Cohen and Soto (and 17.1 percent in Barro and Lee).
References
Adams, R. 2003. “International Migration, Remittances and the Brain Drain: A Study of 24 Labor-Exporting Countries.” World Bank Policy Research Working Paper, no. 3069. World Bank, Washing-ton, DC.
Akbar, S., and D. J. Devoretz. 1993. “Canada’s Demand for the Third World Highly Trained Immi-grants.” World Development 21(1): 1976–86.
Alders, M. 2001. “Classification of the Population with Foreign Background in the Netherlands,Statistics Netherlands.” Paper for the conference The Measure and Mismeasure of Populations. Thestatistical use of ethnic and racial categories in multicultural societies. Centre for Educational Researchand Innovation-Institut national d’études démographiques (CERI-INED), Paris, December 17–18.
Antecol, H., D. Cobb-Clark, and S. Trejo. 2003. “Immigration Policy and the Skills of Immigrantsto Australia, Canada and the United States.” Journal of Human Resources 38(1): 198–218.
Barro, R.J., and J.W. Lee. 2000.“International Data on Educational Attainment: Updates and Impli-cations.” CID Working Papers, no. 42. Center for International Development, Harvard University.
Bauer, T.K., and A. Kunze. 2004. “The Demand for High-Skilled Workers and Immigration Policy.”Brussels Economic Review 47(1): 58–76, Special issue on skilled migration.
Bhagwati, J.N., and K. Hamada. 1974. “The Brain Drain, International Integration of Markets forProfessionals and Unemployment: A Theoretical Analysis.” Journal of Development Economics 1(1):19–42.
Beine, M., F. Docquier, and H. Rapoport. 2001. “Brain Drain and Economic Growth: Theory andEvidence.” Journal of Development Economics 64(1): 275–89.
———. 2003. “Brain Drain and Growth in LDCs: Winners and Losers.” IZA Discussion Paper.Institute for the Study of Labor, Bonn.
International Migration by Education Attainment, 1990–2000 197

Bhorat, H., J-B. Meyer, and C. Mlatsheni. 2002. “Skilled Labor Migration from Developing Coun-tries: Study on South and Southern Africa.” ILO International Migration Papers. International LaborOffice, Geneva.
Carrington, W.J., and E. Detragiache. 1998. “How Big is the Brain Drain?” IMF Working PaperWP/98/102. International Monetary Fund, Washington, DC.
———. 1999. “How Extensive is the Brain Drain?” Finance and Development 36(2): 46–49.Cinar, D., and F. Docquier. 2004. “Brain Drain and Remittances: Consequences for the Source
Countries.” Brussels Economic Review 47(1): 103–18, Special issue on skilled migration.Commander, S., M. Kangasniemi, and L.A. Winters. 2004. “The Brain Drain: A Review of Theory
and Facts.” Brussels Economic Review 47(1): 29–44, Special issue on skilled migration.Cohen, D., and M. Soto. 2001.“Growth and Human Capital: Good Data, Good Results.” CEPR Dis-
cussion Paper, no. 3025. Center for Economic Policy Research, London.Debuisson, M., F. Docquier, A. Noury, and M. Nantcho. 2004. “Immigration and Aging in the Bel-
gian Regions.” Brussels Economic Review 47(1): 138–58, Special issue on skilled migration.De la Fuente, A., and R. Domenech. 2002.“Human Capital in Growth Regressions: How Much Dif-
ference Does Data Quality Make? An Update and Further Results.” CEPR Discussion Paper, no. 3587.Center for Economic Policy Research, London.
Docquier, F., and A. Marfouk. 2004. “Measuring the International Mobility of Skilled Workers—Release 1.0.” Policy Research Working Paper, no. 3382. World Bank, Washington, DC.
Docquier, F., and H. Rapoport. 2004. “Skilled Migration—The Perspective of Sending Countries.”Policy Research Working Paper, no. 3381. World Bank, Washington, DC.
Domingues Dos Santos, M., and F. Postel-Vinay. 2003. “Migration as a Source of Growth: The Per-spective of a Developing Country.” Journal of Population Economics 16(1): 161–75.
Dumont, J.C., and Lemaître G. 2004. “Counting Immigrants and Expatriates in OECD Countries:A New Perspective.” Mimeo. Organisation for Economic Co-operation and Development.
Dustmann, C., and O. Kirchkamp. 2002. “The Optimal Migration Duration and Activity Choiceafter Remigration.” Journal of Development Economics 67(2): 351–72.
Faini, R., and A. Venturini. 1993. “Italian Migrations: The Pre-War Period.” In International Migra-tion and World Development, ed. Hatton and J. Williamson, 1850–939. London: Routledge.
Freeman, R.B. 1993. “Immigration from Poor to Wealthy Countries. Experience to the UnitedStates.” European Economic Review 37(2–3): 443–51.
Funkhouser, E. 1995. “Remittances from International Migration: A Comparison of El Salvadorand Nicaragua.” Review of Economics and Statistics 77(1): 137–46.
Grubel, H.G., and A. Scott. 1966. “The International Flow of Human Capital.” American EconomicReview 56(1/2): 268–74.
Haque, N.U., and A. Jahangir. 1999. “The Quality of Governance: Second-Generation Civil Reformin Africa.” Journal of African Economies 8: 65–106.
Haque, N.U., and S.-J. Kim. 1995. “‘Human Capital Flight’: Impact of Migration on Income andGrowth.” IMF Staff Papers 42(3): 577–607. International Monetary Fund, Washington, DC.
Hatton, T.J., and J.G. Williamson. 2002. “What Fundamentals Drive World Migration?” NBERWorking Paper, no. 9159. National Bureau of Economic Research, Washington, DC.
International Organization for Migration (IOM). 2003. World Migration 2003—Managing Migra-tion. Geneva: IOM.
Johnson, H. 1967. “Some Economic Aspects of the Brain Drain.” Pakistan Development Review7(3): 379–411.
Kwok, V., and H. Leland. 1982. “An Economic Model of the Brain Drain.” American EconomicReview 72(1): 91–100.
Lowell, L.B. 2002a. “Policy Responses to the International Mobility of Skilled Labour.” ILO Inter-national Migration Papers, no. 45. International Labour Office, Geneva.
———2002b. “Some Developmental Effects of the International Migration of Highly Skilled Per-sons.” ILO International Migration Papers, no. 46. International Labour Office, Geneva.
198 Part II Brain Drain, Brain Gain, Brain Waste

Malone, N., K. F. Baluja, J. M. Costanzo, and Davis, C. J. 2003. “The Foreign-Born Population:2000.” Census 2000 brief, C2KBR-34. U.S. Census Bureau, Washington, DC.
Mesnard, A., and M. Ravallion. 2001. “Wealth Distribution and Self-Employment in a DevelopingCountry.” CEPR Discussion Paper, DP3026. Center for Economic Policy Research, London.
Miyagiwa, K. 1991. “Scale Economies in Education and the Brain Drain Problem.” InternationalEconomic Review 32(3): 743–59.
Mountford, A. 1997. “Can a Brain Drain be Good for Growth in the Source Economy?” Journal ofDevelopment Economics 53(2): 287–303.
Organisation for Economic Co-operation and Development (OECD). 2002. Trends in Interna-tional Migration. Paris: OECD Editions.
Ostby, L. 2002. “The Demographic Characteristics of Immigrant Population in Norway.” 2002/22.Statistics Norway, Oslo.
Ruggles, S., M. Sobek, T. Alexander, C.A. Fitch, R. Goeken, P.K. Hall, M. King, and C. Ronnander.2004. Integrated Public Use Microdata Series: Version 3.0. Minneapolis, MN: Minnesota PopulationCenter.
Schiff, M. 1996. “South-North Migration and Trade—A Survey.” World Bank Research and PolicyReport, no. 1696. World Bank, Washington, DC.
Sobek, M., S. Ruggles, R. McCaa, M. King, and D. Levison. 2002. Integrated Public Use MicrodataSeries-International: Preliminary Version 1.0. Minneapolis: Minnesota Population Center, Universityof Minnesota.
Stark, O., C. Helmenstein, and A. Prskawetz. 1997. “A Brain Gain with a Brain Drain.” EconomicsLetters 55(2): 227–34.
———. 1998. “Human Capital Depletion, Human Capital Formation, and Migration: A Blessingor a ‘Curse’?” Economics Letters 60(3): 363–67.
Statistics New Zealand. 2004. “Degrees of Difference: The Employment of University-QualifiedImmigrants in New Zealand.” Statistics New Zealand, Wellington.
United Nations. 2001. “Human Development Report 2001.” New York, Oxford: Oxford UniversityPress.
———. 2002. “International Migration Report 2002.” New York: United Nations.Vidal, J.-P. 1998. “The Effect of Emigration on Human Capital Formation.” Journal of Population
Economics 11(4): 589–600.Wong, K.-Y., and C.K. Yip. 1999. “Education, Economic Growth, and Brain Drain.” Journal of Eco-
nomic Dynamics and Control 23(5–6): 699–726.World Bank. 1994. “Kingdom of Morocco—Poverty, Adjustment and Growth.” Report 11918-
MOR. World Bank, Washington, DC.———. 2003. World Development Indicators. Washington, DC: World Bank.
International Migration by Education Attainment, 1990–2000 199