Embed Size (px)
Citation preview

Volume 87 • Number 2 • February 2001
Federal Reserve
BULLETIN
Board of Governors of the Federal Reserve System, Washington, D.C.
Digitized for FRASER http://fraser.stlouisfed.org/ Federal Reserve Bank of St. Louis
Table of Contents
47 SUPERVISION OF LARGE COMPLEX BANKING ORGANIZATIONS
The long-term trends of consolidation and inno-vation in the U.S. banking system have intensified over the past decade. A small number of banking organizations now hold a larger portion of the banking system's assets, and, at the same time, their activities have become more complex. As a result, the Federal Reserve has altered its approach to the supervision of the largest, most complex banking organizations (LCBOs). This new approach focuses on the most important risks facing U.S. banking organizations and the ways in which these risks are managed. This article dis-cusses the Federal Reserve's risk-focused super-vision program as applied to LCBOs.
58 INDUSTRIAL PRODUCTION AND CAPACITY UTILIZATION FOR DECEMBER 2000
Industrial production fell 0.6 percent in Decem-ber, to 147.3 percent of its 1992 average, after two months of smaller losses. The rate of capac-ity utilization for total industry fell to 80.6 per-cent in December, a level IV2 percentage points below its 1967-99 average
61 ANNOUNCEMENTS
Federal Open Market Committee directive.
Statement on the nomination of Paul O'Neill as Secretary of the Treasury.
Statement on the resignation of Arthur Levitt as SEC chairman.
Appointment of new members, president, and vice president of the Thrift Institutions Advisory Council.
Adoption of an interagency rule on the disclosure and reporting of CRA-related agreements.
Ruling that the "finder role" is a permissible activity for financial holding companies.
Interim rule on the definition of financial activi-ties under the Bank Holding Company Act.
Final rule on procedures to qualify as a financial holding company and on permissible activities.
Increase in the exemption threshold for deposi-tory institutions reporting under HMDA.
Proposed revisions to Regulation C.
Proposed amendments to Regulation Z regarding the Home Ownership and Equity Protection Act of 1994.
Proposed amendment to Regulation Y.
Proposed revisions to calculation methods for priced services.
Proposal to allow financial holding companies to offer real estate services.
Publication of the December 2000 update to the Bank Holding Company Supervision Manual.
Enforcement actions and termination of previous actions.
Changes in Board staff.
68 MINUTES OF THE MEETING OF THE FEDERAL OPEN MARKET COMMITTEE HELD ON NOVEMBER 15, 2000
At this meeting, the Committee voted to maintain the existing stance of monetary policy, keeping its target for the federal funds rate at 6V2 per-cent. The Committee members also agreed that the risks continued to be weighted mainly toward conditions that might generate heightened infla-tion pressures in the foreseeable future.
75 LEGAL DEVELOPMENTS
Various bank holding company, bank service cor-poration, and bank merger orders; and pending cases.
Digitized for FRASER http://fraser.stlouisfed.org/ Federal Reserve Bank of St. Louis

A1 FINANCIAL AND BUSINESS STATISTICS
These tables reflect data available as of December 27, 2000.
A3 GUIDE TO TABULAR PRESENTATION
A4 Domestic Financial Statistics A42 Domestic Nonfinancial Statistics A50 International Statistics
A63 GUIDE TO STATISTICAL RELEASES AND SPECIAL TABLES
A78 INDEX TO STATISTICAL TABLES
A80 BOARD OF GOVERNORS AND STAFF
A82 FEDERAL OPEN MARKET COMMITTEE AND STAFF; ADVISORY COUNCILS
A84 FEDERAL RESERVE BOARD PUBLICATIONS
A86 MAPS OF THE FEDERAL RESERVE SYSTEM
A88 FEDERAL RESERVE BANKS, BRANCHES, AND OFFICES
Digitized for FRASER http://fraser.stlouisfed.org/ Federal Reserve Bank of St. Louis

PUBLICATIONS COMMITTEE Lynn S. Fox, Chair • Jennifer J. Johnson • Karen H. Johnson • Donald L. Kohn • Stephen R. Malphrus • J. Virgil Mattingly, Jr. • Dolores S. Smith • Richard Spillenkothen • Richard C. Stevens • David J. Stockton
The Federal Reserve Bulletin is issued monthly under the direction of the staff publications committee. This committee is responsible for opinions expressed except in official statements and signed articles. It is assisted by the Economic Editing Section headed by S. Ellen Dykes, the Graphics Center under the direction of Christine S. Griffith, and Publications Services supervised by Linda C. Kyles.
Digitized for FRASER http://fraser.stlouisfed.org/ Federal Reserve Bank of St. Louis

Supervision of Large Complex Banking Organizations
Lisa M. DeFerrari and David E. Palmer, of the Board's Division of Banking Supervision and Regu-lation, prepared this article.
Over the past decade, the long-term trends of consoli-dation and innovation in the U.S. banking system have intensified. Today a large proportion of assets held by U.S. banking organizations is concentrated in a small number of companies, and U.S. banking organizations have integrated into their product mix activities that extend well beyond traditional deposit-taking and lending. As a result of these develop-ments, there is a small number of banking organiza-tions that are larger and engage in a wider array of financial activities than at any time in recent history.
Banking supervisors have responded to these changes by adapting their approaches to supervision so that they continue to be aligned with the way finan-cial organizations structure and manage their business activities. These newer approaches—collectively referred to as risk-focused supervision—are designed to focus the greatest amount of supervisory attention on the business areas that represent the greatest risk to a banking organization's overall condition.
The Federal Reserve began to implement a struc-tured, more formal program of risk-focused super-vision in the early 1990s, and that program continues to evolve as the banking system itself continues to change. Since the mid-1990s, the Federal Reserve has devoted particular attention to developing and implementing a program for the supervision of the largest, most complex banking organizations, or LCBOs. Given the speed with which the risk profiles of these institutions can change, the LCBO super-vision program incorporates both a more continuous supervision process than in the past and a greater emphasis on the evaluation of banking organizations' internal systems and controls for managing risk.
DEVELOPMENT OF THE PROGRAM FOR LCBOS
Trends in the Banking Industry
Since 1989, the U.S. banking industry has undergone both consolidation in assets and expansion in the
range of financial activities conducted, an extension of long-term trends. From 1989 to 1999, the number of independent banking organizations in the United States fell from 9,500 to 6,800.! Over the same period, total assets held by these banking organiza-tions rose nearly 50 percent in real terms (chart 1). A related trend is that the banking system's assets have become even more concentrated than before in the largest banking organizations. Specifically, the share of total assets held by the fifty largest U.S. banking organizations rose from 55 percent in 1989 to 74 per-cent in 1999; the share held by the ten largest grew from 26 percent to 49 percent (chart 2).
Expansion in the range of financial activities of U.S. banking organizations is reflected in an increase both in the notional amount of derivatives contracts and in the size of nonbank subsidiaries. A small number of institutions are responsible for the largest portion of derivatives activity of U.S. banking organi-
1. Included are all bank holding companies and all independent banks (with no holding company). Notably, most of the consolidation in the banking system has occurred as the result of mergers and acquisitions, but bank failures at the beginning of the period also played a role. For more detail, see Stephen A. Rhoades, Bank Mergers and Banking Structure in the United States, 1980-98, Staff Studies 174 (Board of Governors of the Federal Reserve System, August 2000).
1. Number and total assets of U.S. banking organizations, 1989-99
Number Assets (billions of dollars)
8,000 — Number' — 8,000
6,000 — ^ — 6,000
4,000 — Tolalassets in real term^ « * »
2,000 —
I I 1 1
— 2,000
. i i i i i i l 1989 1991 1993 1995 1997 1999
1. Includes all bank holding companies and independent banks with no holding company.
2. Adjusted by the GDP deflator (base year = 1996).
Digitized for FRASER http://fraser.stlouisfed.org/ Federal Reserve Bank of St. Louis

48 Federal Reserve Bulletin • February 2001
2. Share of total banking assets held by the fifty largest U.S. banking organizations, selected years, 1989-99
zations, with the ten largest institutions accounting for nearly 95 percent of the total notional amount. Growth in the assets of nonbank subsidiaries of U.S. banking organizations over the past decade reflects in large part a significant expansion in the securities activities of the largest organizations. Total assets of nonbank subsidiaries held by the largest fifty banking organizations now represent nearly a quarter of their total consolidated assets, and the largest ten compa-nies account for the greatest proportion of these non-bank assets.2
Many factors account for the increase in asset concentration at the largest U.S. banking organiza-tions as well as the broadening of the range of their financial activities during the 1990s. These factors include increased competition in financial markets, improvements in information technology, the lifting of restrictions on interstate branching, some easing of regulatory restrictions on securities activities, the globalization of economic activity, and an effort by banking organizations to diversify revenue sources to mitigate cyclical effects on core banking activities, such as lending and deposit-taking.3
These trends are expected to continue, particularly given recent changes in U.S. banking law. During the six decades before 1999, U.S. banking organizations were subject to the provisions of the Banking Act of 1933, commonly referred to as the Glass-Steagall Act, which prohibited U.S. banks from being affili-
2. For a few of the fifty largest companies, data on total nonbank-ing assets were not available.
3. For a useful survey on this topic, see Allen N. Berger, Rebecca S. Demsetz, and Philip E. Strahan, "The Consolidation of the Financial Services Industry: Causes, Consequences, and Implications for the Future," Journal of Banking and Finance, vol. 23 (February 1999), pp. 135-94.
ated with firms engaged principally in corporate secu-rities underwriting and dealing. Thus, the banking business and the securities business were effectively separated. Starting in the mid-1980s, this separation began to diminish as some U.S. bank holding com-panies established securities subsidiaries, subject to revenue and other limits to prevent violation of the Glass-Steagall Act.4 U.S. banking organizations, however, were still generally prohibited from engag-ing in insurance underwriting activities. The Gramm-Leach-Bliley Act of 1999 eliminated the separation of financial activities, allowing U.S. banking organi-zations with well-capitalized and well-managed bank subsidiaries to engage in both securities and insur-ance underwriting activities through separate subsidi-aries. Banking organizations are now allowed to own securities and insurance companies and vice versa.
Supervisory Responses
Supervisory programs for state member banks and bank holding companies are implemented by indi-vidual Reserve Banks under policies and procedures issued by the Federal Reserve Board.5 Historically, the Reserve Banks generally used local supervisory staff for examinations and inspections, which, for the most part, were focused on legal entities, such as banks, Edge corporations, or bank holding compa-nies. The examinations and inspections were con-ducted once a year in most cases, and, subsequently, a rating was issued for the entity examined. There was usually little supervisory activity focused on the examined entity during the remainder of the year unless a crisis arose or the examination revealed material problems that required continued attention by supervisors. Ratings were arrived at using an approach that placed a great deal of emphasis on the valuation of assets, particularly the loan portfolio, while also taking into consideration assessments of other factors, including capital, earnings, liquidity, and management.
4. For example, these so-called section 20 securities subsidiaries (referring to section 20 of the Glass-Steagall Act) were allowed to have only a certain percentage of their revenue stem from securi-ties activities normally not allowed in a commercial bank—"bank-ineligible" activities—and were also limited outright from conducting other activities.
5. The type of charter that a U.S. bank holds determines its primary supervisor. For nationally chartered banks, the primary supervisor is the Office of the Comptroller of the Currency; for state-chartered banks that are members of the Federal Reserve System, it is the Federal Reserve and the respective state; and for state-chartered banks that are not members of the Federal Reserve, it is the Federal Deposit Insurance Corporation and the respective state. The Federal Reserve also supervises bank holding companies and Edge corporations.
Digitized for FRASER http://fraser.stlouisfed.org/ Federal Reserve Bank of St. Louis

Supervision of Large Complex Banking Organizations 49
Key Milestones in Risk-Focused Supervision
As with most large-scale supervisory efforts, the develop-ment of risk-focused supervision and of the LCBO program has progressed in stages. The formal elements of the pro-gram's policy development include a number of supervision and regulation (SR) letters, published by the Division of Banking Supervision and Regulation at the Federal Reserve Board. In general, these SR letters provide a way for the Board to communicate supervisory policies to its supervi-sory personnel, to the banking industry, to other market participants, and to the general public.1 The SR letters related to risk-focused supervision and the LCBO program include the following.
• SR 95-22: Enhanced Framework for Supervising the U.S. Operations of Foreign Banking Organizations. Details a risk-focused supervision program developed by the bank-ing supervisory authorities that have supervisory and exami-nation responsibilities for the U.S. operations of foreign banking organizations.
• SR 95-51: Rating the Adequacy of Risk Management Processes and Internal Controls at State Member Banks and Bank Holding Companies. Instructs examiners to shift more of their focus to risk-management processes and inter-nal controls in recognition that new technologies, product innovation, and the size and speed of financial transactions have changed the nature of financial markets.
• SR 96-14: Risk-Focused Safety and Soundness Exami-nations and Inspections. Outlines the elements of risk-focused examinations and inspections, which focus particu-lar attention on the most important risks facing an institution and evaluate lower-risk businesses less intensively.
• SR 97-24: Risk-Focused Framework for Supervision of Large Complex Institutions. Describes the framework of a risk-focused supervision program for institutions with more than $1 billion in assets. The details of the framework, including examination and inspection procedures, are con-tained in an attachment, "Framework for the Risk-Focused Supervision of Large Complex Organizations."
1. The SR letters are available at www.federalreserve.gov/boarddocs/ srletters. The first two digits of each letter indicate the year of issuance, the second, the sequence of its issuance that year.
• SR 98-13: Enhancements to the Interagency Program for Supervising the U.S. Operations of Foreign Banking Organizations. Describes improvements to the interagency risk-focused supervision program for the U.S. operations of foreign banking organizations.
• SR 98-25: Sound Credit Risk Management and the Use of Internal Credit Risk Ratings at Large Banking Organi-zations. Guides supervisors in their evaluation of credit-risk-management systems and offers examples of sound practices.
• SR 99-15: Risk-Focused Supervision of Large Complex Banking Organizations. Applies the risk-focused super-vision framework to LCBOs and emphasizes the challenges inherent in evaluating their internal control and risk-management systems.
• SR 99-18: Assessing Capital Adequacy in Relation to Risk at Large Complex Banking Organizations and Others with Complex Risk Profiles. Directs supervisors to evaluate banking organizations' internal capital management pro-cesses to determine whether they meaningfully tie the iden-tification, monitoring, and evaluation of risk to the determi-nation of the institutions' capital needs.2
• SR 00-13: Framework for Financial Holding Company Supervision. Provides guidance concerning the purpose and scope of the Federal Reserve's supervision of financial holding companies, with particular emphasis on working with other relevant supervisors and regulators.
• SR 00-14: Enhancements to the Interagency Program for Supervising the U.S. Operations of Foreign Banking Organizations. Discusses additional steps that are being taken to further refine the interagency risk-focused super-vision program for the U.S. operations of foreign banking organizations.
The LCBO program continues to develop and to be refined in response to changes in the industry. Senior man-agement within the Federal Reserve System meet regularly to review the LCBO program and to strengthen it, where possible.
2. For more detail, see text note 11.
Changes in the environment in which banking organizations operate have had a very substantial impact on the way they are managed and, in turn, have necessitated changes in the way they are super-vised. It became clear that the traditional process of examining banking organizations once a year— focusing mostly on their stock of assets at a fixed point—would no longer be an effective way to evaluate the condition of many banking organiza-tions. The Federal Reserve responded to this situation in the 1990s by developing a program of risk-focused
supervision. Various aspects of risk-focused super-vision have been communicated in a series of letters on policy guidance starting in 1995 (see box "Key Milestones in Risk-Focused Supervision"). The LCBO supervision program, which was formally established in 1999, is essentially an intensive appli-cation of risk-focused supervision to the largest, most complex banking organizations. These are the institu-tions in which change is most dramatic, with respect both to the impact of change and the speed with which changes in the organizations' risk profiles can
Digitized for FRASER http://fraser.stlouisfed.org/ Federal Reserve Bank of St. Louis

50 Federal Reserve Bulletin • February 2001
occur (see box "Criteria for Inclusion in the LCBO Program"). Generally, by paying special attention to LCBOs, supervisors aim to minimize significant adverse effects on the public, on financial markets and the financial system in the United States and abroad, and on taxpayers, who provide the ultimate resources behind the bank safety net.
Criteria for Inclusion in the LCBO Program
A number of measures are employed as guidelines for determining whether a particular banking organization should be included in the LCBO supervision program. These measures take into account the size of the organi-zation, the extent of international operations, participa-tion in large-value payment and settlement systems, and the extent of custody operations, fiduciary activities, and trading activities. For foreign organizations with a signifi-cant U.S. presence, these measures are assessed for U.S. operations as well as for the global organization. Mea-sures that are considered include the following:
• Total assets • Size of off-balance-sheet exposures • Activity in derivatives markets • Trading assets and trading revenue • Foreign assets and foreign deposits • Funding from market (non-deposit) sources • Securities borrowed and securities lent • Income from fiduciary activity • Mutual fund sales and mutual fund fee income • Revenue earned in mortgage markets • Assets under management • Activity in payment systems • Involvement in securities settlements • Geographic scope of operations • Merchant banking activities and proprietary
investments
No single factor qualifies or disqualifies an organiza-tion from being considered an LCBO. It is also important to note that the population of LCBOs is fluid and can change as a result of developments affecting a banking organization or changes in the industry as a whole. In particular, the number of LCBOs can change rather quickly as a result of mergers and acquisitions. Since the establishment of the LCBO program, the number of institutions that are considered LCBOs has been in the range of twenty-five to thirty companies. In addition, there are a number of banking organizations that do not meet enough of the criteria to be considered LCBOs but have sufficient size or complexity in some of their activi-ties to be covered by the program to a certain extent.
Overview of the LCBO Program
The fundamental goals of the Federal Reserve's supervisory process for LCBOs are to maintain an accurate and current assessment of each banking organization's financial and managerial strength and to respond in a timely fashion to any emerging prob-lem. There are a number of important elements that together define this program (see box "Comparison of Traditional Bank Examinations with Risk-Focused Supervision for LCBOs"):
• The program places strong emphasis on understanding and evaluating each institution's internal risk-management processes and control infrastructures.
• Each LCBO is assigned a team of Federal Reserve supervisors, who conduct an ongoing super-visory program based on the risks that have been identified in the organization's operations.
• Small teams with technical expertise on such issues as credit-risk modeling, payment systems, and information technology are available to supplement individual LCBO teams.
• The Federal Reserve's assessment of the banking organization's risk profile, as well as the correspond-ing plan for supervision of the institution, is updated quarterly, or more frequently as warranted, taking into account market developments
• The program stresses the development of rela-tionships with the management of the banking organi-zation at various levels through regular and frequent communications.
• The banking organizations that are covered by the LCBO program are viewed not just individually but also as a group to identify common or emerging weaknesses that have the potential to become more serious or to become systemic problems.
Regardless of how their business lines are man-aged, most LCBOs operate through a variety of legal entities that fall under the jurisdiction of different licensing and supervisory authorities, requiring a high level of information sharing and coordination among relevant supervisory agencies. For example, because a number of U.S.-headquartered LCBOs have lead banks with national bank charters, the Federal Reserve and the Office of the Comptroller of the Currency, the supervisor for national banks, cooper-ate closely in the supervision of these banking organizations. This collaboration among super-visory agencies both facilitates understanding the risk profile of a banking organization as a whole and
Digitized for FRASER http://fraser.stlouisfed.org/ Federal Reserve Bank of St. Louis

Supervision of Large Complex Banking Organizations 51
Comparison of Traditional Bank Examinations with Risk-Focused Supervision for LCBOs
Traditional Bank Examinations Risk-Focused Supervision for LCBOs
Supervisory process is focused on a single point in time Supervisory process is continuous and is more tuned and is rarely continuous unless there is a crisis. to market developments.
Examinations are generally staffed locally. Institutions are assigned designated supervisory teams. The teams are supplemented with specialists, who may be drawn from across the Federal Reserve System.
Significant emphasis is placed on valuation of assets. Focus is on risk-management processes and control systems.
Dialogue with management is mostly related to There is more frequent communication with senior examination findings unless there is a crisis. management.
Supervisory process includes more interaction with line management of business activities and risks.
Program includes business line and functional reviews that incorporate identification of best practices.
reduces the burden of the supervisory process on that organization.
BASIC FRAMEWORK FOR RISK-FOCUSED SUPERVISION
The basic framework for risk-focused supervision— the program that the Federal Reserve applies to all complex banking organizations with more than $1 billion in assets (discussed in SR 97-24)—consists of four principal activities that are carried out in a continuous cycle.6 These are (1) gaining an under-standing of the institution through a detailed risk assessment; (2) developing the supervisory plan; (3) executing the supervisory plan and reporting the results; and (4) determining and communicating the overall condition of the banking organization and addressing supervisory concerns.
Formulating the Risk Assessment
The process of understanding an institution and assessing its risks combines a "bottom-up" analy-sis of significant business lines—including reviews of sampled individual credits, exposures, and transactions—with a "top-down" look at the broad policies, procedures, and controls with which the banking organization identifies and manages risks
6. The Federal Reserve has also developed a program for risk-focused supervision of community banks. That program is discussed in SR 97-25.
company-wide. Using both approaches, examiners evaluate six major types of risk—credit, market, liquidity, operational, legal, and reputational (see box "Major Risk Categories"). For significant business lines, examiners prepare an activity risk matrix by evaluating the inherent risk undertaken by the busi-ness line with respect to the six major risk categories and then evaluating whether that risk is low, mod-erate, or high. They then assess the strength of the organization's systems for managing those risks, evaluating them as strong, acceptable, or weak. Risk-management systems include oversight by the board of directors and senior management; policies, pro-cedures, and limits; internal risk review and man-agement information systems; and internal control processes.
The institution-wide risk assessment is also pre-pared along the lines of the six major types of risk and includes a composite risk assessment. Examiners judge the level of each risk—high, moderate, or low—and the direction of risk—increasing, stable, or decreasing. In arriving at these assessments, examin-ers incorporate their evaluations of corporate-wide processes for identifying, measuring, monitoring, and controlling the six major types of risk, as well as their assessments of the risk profiles of significant business lines.
Developing the Supervisory Plan
The completion of the institution-wide risk assess-ment leads to the development of a comprehensive
Digitized for FRASER http://fraser.stlouisfed.org/ Federal Reserve Bank of St. Louis
52 Federal Reserve Bulletin • February 2001
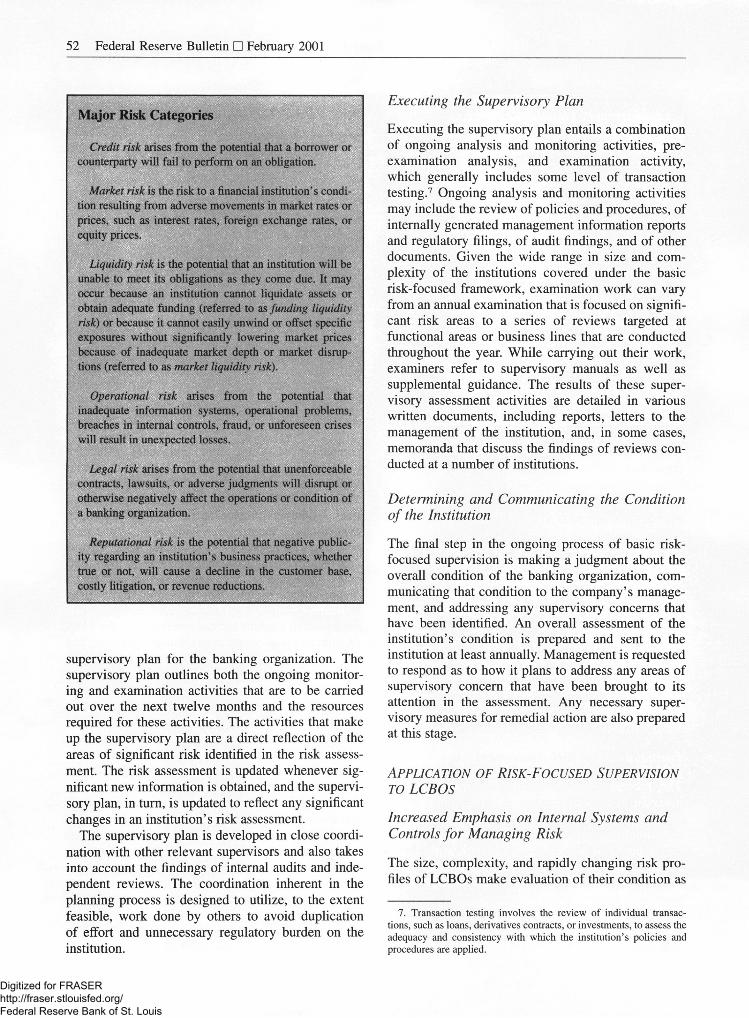
Major Risk Categories
Credit risk arises from the potential that a borrower or counterparty will fail to perform on an obligation.
Market risk is the risk to a financial institution's condi-tion resulting from adverse movements in market rates or prices, such as interest rates, foreign exchange rates, or equity prices.
Liquidity risk is the potential that an institution will be unable to meet its obligations as they come due. It may occur because an institution cannot liquidate assets or obtain adequate funding (referred to as funding liquidity risk) or because it cannot easily unwind or offset specific exposures without significantly lowering market prices because of inadequate market depth or market disrup-tions (referred to as market liquidity risk).
Operational risk arises from the potential that inadequate information systems, operational problems, breaches in internal controls, fraud, or unforeseen crises will result in unexpected losses.
Legal risk arises from the potential that unenforceable contracts, lawsuits, or adverse judgments will disrupt or otherwise negatively affect the operations or condition of a banking organization.
Reputational risk is the potential that negative public-ity regarding an institution's business practices, whether true or not, will cause a decline in the customer base, costly litigation, or revenue reductions.
supervisory plan for the banking organization. The supervisory plan outlines both the ongoing monitor-ing and examination activities that are to be carried out over the next twelve months and the resources required for these activities. The activities that make up the supervisory plan are a direct reflection of the areas of significant risk identified in the risk assess-ment. The risk assessment is updated whenever sig-nificant new information is obtained, and the supervi-sory plan, in turn, is updated to reflect any significant changes in an institution's risk assessment.
The supervisory plan is developed in close coordi-nation with other relevant supervisors and also takes into account the findings of internal audits and inde-pendent reviews. The coordination inherent in the planning process is designed to utilize, to the extent feasible, work done by others to avoid duplication of effort and unnecessary regulatory burden on the institution.
Executing the Supervisory Plan
Executing the supervisory plan entails a combination of ongoing analysis and monitoring activities, pre-examination analysis, and examination activity, which generally includes some level of transaction testing.7 Ongoing analysis and monitoring activities may include the review of policies and procedures, of internally generated management information reports and regulatory filings, of audit findings, and of other documents. Given the wide range in size and com-plexity of the institutions covered under the basic risk-focused framework, examination work can vary from an annual examination that is focused on signifi-cant risk areas to a series of reviews targeted at functional areas or business lines that are conducted throughout the year. While carrying out their work, examiners refer to supervisory manuals as well as supplemental guidance. The results of these super-visory assessment activities are detailed in various written documents, including reports, letters to the management of the institution, and, in some cases, memoranda that discuss the findings of reviews con-ducted at a number of institutions.
Determining and Communicating the Condition of the Institution
The final step in the ongoing process of basic risk-focused supervision is making a judgment about the overall condition of the banking organization, com-municating that condition to the company's manage-ment, and addressing any supervisory concerns that have been identified. An overall assessment of the institution's condition is prepared and sent to the institution at least annually. Management is requested to respond as to how it plans to address any areas of supervisory concern that have been brought to its attention in the assessment. Any necessary super-visory measures for remedial action are also prepared at this stage.
APPLICATION OF RISK-FOCUSED SUPERVISION TO LCBOS
Increased Emphasis on Internal Systems and Controls for Managing Risk
The size, complexity, and rapidly changing risk pro-files of LCBOs make evaluation of their condition as
7. Transaction testing involves the review of individual transac-tions, such as loans, derivatives contracts, or investments, to assess the adequacy and consistency with which the institution's policies and procedures are applied.
Digitized for FRASER http://fraser.stlouisfed.org/ Federal Reserve Bank of St. Louis

Supervision of Large Complex Banking Organizations 53
of a fixed point in time extremely difficult and, at the same time, less meaningful than for smaller, less complex institutions. Therefore, for LCBOs, the supervisory process places even greater emphasis on evaluating the organizations' own systems for managing risk as well as on evaluating their internal control processes.
Nevertheless, transaction testing remains an impor-tant element in the assessment of these banking orga-nizations' risk-management systems. Examiners also evaluate the sufficiency with which banking organi-zations stress test their portfolios in the process of managing risk.8 Over time, as supervisors become satisfied with individual banking organizations' sys-tems for classifying and measuring risk, they are expected to provide bank management with sugges-tions for further improvements in the systems based on industry-wide best practices, consistent with mini-mum standards for safety and soundness.
The Gramm-Leach-Bliley Act (GLBA) authorized qualifying bank holding companies to operate as financial holding companies (FHCs) and to engage in a diverse range of financial activities. The Federal Reserve now acts as "umbrella" supervisor for FHCs. The approach used by the Federal Reserve under the LCBO program is fully consistent with the process prescribed by GLBA for supervising FHCs.9
Umbrella supervision under GLBA reflects the reality that the risks associated with financial activities generally cut across legal entities and business lines and that, in fact, most large and sophisticated financial services companies take a consolidated, or organization-wide, approach to managing their risks. The umbrella role requires the Federal Reserve to understand F H C s corporate-wide systems and con-trols for managing risk and to keep primary bank supervisors and other relevant supervisors advised of any evolving problems in these areas that may affect the entities they supervise and regulate.
Assignment of a Designated Team
One of the essential elements of the supervisory program for LCBOs is the assignment of a full-time team of Federal Reserve supervisors to each banking organization. This designated team is responsible for developing and maintaining the Federal Reserve's supervisory plan for the banking organization and for
8. For example, the banking organization might conduct stress tests by revaluing portions of its portfolio based on a hypothetical increase in interest rates or a hypothetical change in exchange rates.
9. SR 00-13 Framework for Financial Holding Company Super-vision provides guidance concerning the purpose and scope of the Federal Reserve's supervision of FHCs.
coordinating all supervisory activity related to it. In its effort to accomplish this goal, the team must maintain a high level of knowledge about the banking organization and its strategies, organizational struc-ture, risk-management systems, and control policies.
Each designated team is headed by a very senior examiner or Reserve Bank official—the "central point of contact," or CPC, for the institution. The CPC serves as the Federal Reserve's primary day-to-day contact for a particular LCBO and coordinates the development and execution of the supervisory strategy for the institution.
The designated team generally comprises four to ten seasoned examiners and analysts. Team members typically have broad-based knowledge and experi-ence in banking and skill sets that are particularly relevant to the risk profile and major activities of the banking organization. The work of the designated team is supplemented as necessary with specialists in technical areas such as modeling credit risk and mar-ket risk, payment systems, and information technol-ogy. Staffing for the designated team is directed by the Reserve Bank that has responsibility for leading the Federal Reserve's supervisory program for the banking organization. A team may include members from more than one Reserve Bank, and specialists may also be drawn from across the System.
Maintaining Information Flows
Complex banking organizations typically measure and manage consolidated risk by individual cus-tomer; by major line of business; by category of risk, such as credit risk or market risk; by industry and geographic sector; and within distinct legal entities. The supervisory team for an LCBO looks at how the institution measures, monitors, and controls risk in each of these areas. The team is able to maintain its ongoing understanding of these risks in part through the establishment of regular information flows from a variety of sources. Included are internal management information reports from the banking organization as well as internal and external audit reports, regulatory filings, publicly available information, and informa-tion from other supervisors. Also included in the process are regular discussions with the management of the banking organization as well as discussions with other supervisory authorities responsible for that banking organization. With respect to internal management information reports, some of the largest banking organizations are increasingly providing direct on-line access to this information for the super-visory team.
Digitized for FRASER http://fraser.stlouisfed.org/ Federal Reserve Bank of St. Louis

54 Federal Reserve Bulletin • February 2001
The information-gathering portion of the ongoing supervision process is supported by an appropriate degree of verification through examinations or tar-geted reviews of specific business lines. Such activi-ties include testing of processes, procedures, and controls, as well as a degree of transaction testing and analysis that reflects the level of risk in the area being reviewed and whether concern exists about the insti-tution's ability to manage risk in that area. Targeted reviews of business lines are generally conducted in the following types of circumstances:
• When the supervisory team determines that a business line has high inherent risk that is not well controlled or when little information is available to the team on the operational controls
• When the business line is new, has undergone significant expansion, or is significant in terms of revenue and capital contribution but has not been reviewed for an extended period
• When the business line has experienced signifi-cant operational problems.
The objective of targeting business lines for review is to assess the adequacy of controls on activities undertaken in these business lines and to assess more fully their risk to the corporation.
Coordinating with Other Supervisors
Before the development of risk-focused supervision, the style of communication among supervisors on matters pertaining to an individual institution prima-rily involved ad hoc contact. Such contact included exchange of examination reports, sharing of informa-tion related to specific problem situations, and coordi-nation when special examination work was necessary to obtain additional information regarding a problem situation. The supervisors involved in this traditional pattern of communication included the Office of the Comptroller of the Currency (OCC), the Federal Deposit Insurance Corporation, the Office of Thrift Supervision, state banking agencies, and foreign bank supervisors.
Several authorities are usually involved in super-vising various parts of the operations of LCBOs, both within the United States and abroad. As these bank-ing organizations have evolved, ongoing contact among the supervisors of the principal affiliates within a banking organization has become particu-larly important. This contact is necessary not only to avoid duplicative work by supervisors and excessive burden on the institution but also to provide the
respective parties with the benefit of the perspective of their counterparts.
Coordinating with Other Primary Supervisors
This need for the exchange of information is particu-larly important when the lead bank of an LCBO has a primary supervisor other than the Federal Reserve. The lead bank typically plays an integral role within these dynamic banking organizations. In addition, systemic risk is associated with the potential dis-ruption of the operations of large banks. Thus, the Federal Reserve needs to know more about the activi-ties within large insured depository institutions than can be derived from public information or from the reports of the primary bank supervisor, and it also needs to have more than ad hoc contact with the primary bank supervisor. Similarly, the primary bank supervisor needs information about the activities of a bank's parent company and its nonbank affiliates to be aware of, and address as necessary, threats to the soundness of the bank that may arise from elsewhere in the consolidated organization.
As noted earlier, the Federal Reserve cooperates routinely with primary bank supervisors in preparing supervisory plans for LCBOs. The Federal Reserve takes into account work that has been done by the primary supervisor in identifying those areas that it wants to focus on at a banking organization. In addi-tion, there are times when examiners from both the Federal Reserve and the primary bank supervisor participate in an examination. For example, examin-ers from both the Federal Reserve and the OCC may participate in a review of an organization's internal audit process. Such an examination is normally under the lead of one of the agencies, and, ordinarily, only one report or memorandum is prepared.
Coordinating with Functional Regulators
Because many LCBOs have become financial hold-ing companies, they are in a position to expand further the range of activities they engage in through nonbank subsidiaries. Therefore, functional regula-tors have been added to the mix of regulatory coun-terparts with which effective communication and cooperation needs to take place. Functional regula-tors include the Securities and Exchange Commis-sion, the Commodities Futures Trading Commission, the National Association of Securities Dealers, and constituents from the National Association of Insur-ance Commissioners. In its role as the umbrella
Digitized for FRASER http://fraser.stlouisfed.org/ Federal Reserve Bank of St. Louis

Supervision of Large Complex Banking Organizations 55
supervisor of financial holding companies, the Fed-eral Reserve must coordinate its activities with these functional regulators and work with them to under-stand the risk profiles of the individual regulated entities and their relation and importance to an FHC's overall risk profile.
Coordinating with Foreign Supervisors
In the international sphere, the Federal Reserve has been working with its counterparts in various coun-tries around the world to strengthen communication and cooperation in the supervision of banking organi-zations that operate across borders. These efforts at collaboration have intensified in recent years and now take place in a variety of international settings, as well as on a bilateral basis between supervisors with respect to individual banking organizations (see box "Special Aspects of Supervising Large Foreign Banking Organizations"). One example of a multilat-eral effort is the Basel Committee on Banking Super-vision, in which supervisors from member countries
meet to discuss important issues and formulate guide-lines to improve and refine the process of banking supervision globally.
Portfolio Approach
Evaluating activities of banking organizations across institutions to identify trends and ensure consistency in supervisory treatment has long been a practice among supervisors.10 The LCBO program builds upon this practice by emphasizing comparative analysis of LCBOs with similar business lines, char-acteristics, and risk profiles. This portfolio approach to supervision serves to identify "outliers" among LCBOs with respect to risk profiles and risk-management techniques. By using this approach, supervisors are able not only to continue ensuring
10. An example is the Shared National Credit program, in which the bank supervisory agencies review large syndicated loans (more than $20 million) annually to provide an efficient and consistent review and classification of any loan or loan commitment shared by three or more supervised institutions.
Special Aspects of Supervising Large Foreign Banking Organizations
Foreign banking organizations (FBOs) have a sizable pres-ence in the United States, accounting for about 20 percent of the assets held by banking organizations located or operating in the United States.1 Some of the largest FBOs are also among the largest participants in US. financial markets. Because of their size and complexity both on a global level and in terms of their U.S. operations, large FBOs account for approximately one-third of the banking organizations in the LCBO program.
U.S. bank supervisory agencies operate as "host coun-try" supervisors for FBOs. As a result, although they have full access to information concerning the U.S. operations of FBOs, they do not have the same level of access to information on FBOs' consolidated operations and risk-management systems as the home country supervisors do. Therefore, US. supervisors focus particular attention on evaluating an FBO's consolidated financial condition, its capital adequacy, and its general ability to support its U.S. operations. In this regard, U.S. supervisors apply several specific criteria to assess an FBO's ability to support its U.S. operations, including measures related to financial and managerial soundness, to corporate governance, and to transparency.2
1. Total assets held by foreign banking organizations include total assets of U.S. bank holding companies or financial holding companies held by those foreign institutions, as well as total assets of branches, agencies, Edge corporations, direct nonbank subsidiaries, and commercial lending compa-nies held by them.
2. The Federal Reserve, along with other banking agencies, has in place a program for the coordinated supervision of FBOs, which outlines how
For FBOs that are part of the LCBO supervision pro-gram, the program's risk assessments are prepared speci-fically for the U.S. operations. However, U.S. supervisors need to have a sufficient understanding of an FBO's global risk-management and internal control systems in order to evaluate the manner in which those systems are applied with respect to oversight and control of its US. operations. U.S. supervisors are often able to obtain much of this information from FBO management based in the United States. However, in many cases the centralized nature of banking organizations' management of certain business lines or control functions may necessitate discussions with corporate management at the FBO's headquarters.
A core element of the LCBO program as applied to FBOs is communication with home country supervisors. In peri-odic meetings and discussions, U.S. supervisors seek the views of the home country supervisors on developments in the home country financial system generally and with respect to individual FBOs. U.S. and home country super-visors share information, as appropriate, contained in risk assessments and supervisory plans and obtained in examina-tions of U.S. operations of FBOs. When follow-up super-visory action is necessary, U.S. and home country super-visors work together closely in the development and implementation of the supervisory action.
these measures should be evaluated. See SR 00-14 Enhancements to the Interagency Program for Supervising the U.S. Operations of Foreign Bank-ing Organizations (available at www.federalreserve.gov/boarddocs/srletters).
Digitized for FRASER http://fraser.stlouisfed.org/ Federal Reserve Bank of St. Louis

56 Federal Reserve Bulletin • February 2001
consistency in the supervision of institutions with similar businesses and risk profiles but also to com-pare risk-management practices within the industry. In a broader sense, supervisors are given an improved framework for discerning industry trends, which can be particularly useful in informing policymakers.
In the development of the LCBO program, there have been a number of structured efforts to improve portfolio analysis of LCBOs. Two of the most impor-tant have been Coordinated Supervisory Exercises (CSEs) and the establishment of competency centers and knowledge centers. Through CSEs, supervisors develop comparative analyses of risk-management processes governing specific business activities or functional areas, deepen their understanding of inher-ent risk in specific business activities, develop exam-iner expertise, and identify gaps or weaknesses in existing Federal Reserve System policies and pro-cedures. For each CSE, a team is formed that typi-cally has members from several Reserve Banks as well as staff from the Federal Reserve Board. CSEs can take various forms but usually involve examina-tion work at a number of LCBOs, which are selected based on their involvement in the business activity or control function being reviewed. Once the project is completed, participants in a CSE prepare a report on the results and findings and distribute it within the community of relevant supervisors. In addition, the aggregate findings are discussed with the banking organizations that were included in the CSE.
The establishment of competency centers and knowledge centers, which are housed at designated Reserve Banks, arose out of a need to develop and maintain Federal Reserve System expertise in spe-cific technical areas in an efficient manner. At this time, competency centers have been established for two areas—venture capital activities and capital man-agement processes.11 One knowledge center has been established with respect to insurance activities. These centers assist examiners and other supervisory staff in keeping abreast of the most recent developments in their respective areas. In addition, competency cen-ters maintain teams of specialists in their respective areas that are available to participate in examinations in other Federal Reserve Districts.
Market Discipline
The idea that financial markets can provide useful discipline to U.S. banking organizations is not new.
11. These processes include sophisticated techniques used to model the specific amount of capital necessary to support certain activities— often referred to as "economic" capital.
However, as non-core funding—that is, funding based on uninsured deposits—now represents a higher percentage of total funding than in the past, particularly for LCBOs, it is important that market participants play a greater role in the supervision of these banking organizations. The need for market discipline—and its prerequisite, public disclosure—is heightened because the unusual size and complexity of LCBOs requires either more burdensome and detailed supervision and regulation or incentives from other sources to ensure safe and sound banking opera-tions. Discipline of LCBOs and other banking organi-zations by the market can complement supervision by reducing excessive risk-taking, by alleviating some of the moral hazard that exists with a federal safety net, and, it is hoped, by decreasing the level of supervision that would otherwise be necessary.12
Market discipline works through changes in access to funds and changes in risk premiums as banks take on or shed risk or engage in certain types of trans-actions. Market discipline can function directly, for example, if the cost of funding for a banking organi-zation rises as its risk-taking increases; or indirectly, as market participants and bank supervisors observe prices of the company's financial instruments (includ-ing equity shares and various types of debt) to assess whether the risk profile has increased and then take appropriate action. Two particular approaches to mar-ket discipline appear to be most promising, particu-larly for LCBOs: increased public disclosure and issuance of subordinated debt by the companies.13
More transparent balance sheets and the disclosure of additional information about a banking organiza-tion's risks are beneficial to shareholders, debt hold-ers, and the market in general. Expanding this type of disclosure is one strategy for improving market disci-pline. To be sure, most LCBOs already disclose a considerable volume of information to market partici-pants, and, indeed, there is ample evidence that mar-ket discipline now plays a role in affecting their behavior. Nonetheless, the scale and clarity of disclo-
12. The term "moral hazard" applies to instances in which an economic agent's risk-taking is affected by the fact that the agent faces zero or reduced costs from a negative outcome of a risky action but receives full gains from a positive one. For example, if creditors of a banking organization know that deposit insurance will protect them from losses if it fails, then they have few incentives to protect against a deterioration in its financial condition.
13. In 1999, a Federal Reserve task force sponsored the publication of staff studies on these two subjects: Federal Reserve System Study Group on Disclosure, Improving Public Disclosure in Banking, Staff Studies 173 (Board of Governors of the Federal Reserve System, March 2000); and Federal Reserve System Study Group on Subordi-nated Notes and Debentures, Using Subordinated Debt as an Instru-ment of Market Discipline, Staff Studies 172 (Board of Governors of the Federal Reserve System, December 1999).
Digitized for FRASER http://fraser.stlouisfed.org/ Federal Reserve Bank of St. Louis

Supervision of Large Complex Banking Organizations 57
sures is better at some institutions than at others and, on average, could be considerably improved.
One particularly useful element of increased public disclosure is the reduced tendency for market partici-pants to be surprised by sudden adverse news. If information is released on a more consistent basis, the reporting of unfavorable news is less likely to result in large market movements, which might have systemic implications. Supervisors are engaged in a dialogue with the banking industry to identify those areas in which expanded public disclosure would be most useful. In that regard, a private-sector working group recently issued recommendations for more fre-quent public disclosure of financial information by banking and securities organizations. Among its rec-ommendations, the group said that market risk infor-mation previously disclosed annually should be dis-closed quarterly; that the content of market risk disclosures should be improved; and, that additional credit risk information on wholesale credit exposures should be made available quarterly. The group also noted that public disclosures should vary among insti-tutions to reflect legitimate differences in internal management processes and that disclosure practices should change in step with innovations in firms' risk-management and measurement practices.14
The second strategy that may hold considerable promise for augmenting market discipline is to require banks to issue minimum amounts of subordi-nated debt to unrelated parties. Subordinated debt holders have an interest in discouraging excessive risk-taking because their claims are both long-term and junior to all depositors and to any senior debt holders. Subordinated debt holders share in very lim-ited ways in potential gains made by a company but are exposed to considerable risk if it encounters financial difficulty. In this respect, their risk prefer-ences can resemble those of banking supervisors. By raising a company's cost of funds, subordinated debt holders can send a direct signal that excessive risk-taking is not desired. However, as documented in a recent report to the Congress by the Treasury and
14. The Working Group on Public Disclosure, established in April 2000 by the Federal Reserve Board, was composed of representatives of eleven banking and securities firms. The working group's recom-mendations were announced in a joint press release by the Federal Reserve Board, the OCC, and the U.S. Securities and Exchange Commission, dated January 11, 2001, that is available on the Board's web site at www.federalreserve.gov/boarddocs/press/general/2001.
the Federal Reserve Board, a number of uncertainties need to be clarified before a mandatory subordinated debt policy would be judged desirable.15 These uncer-tainties include how best to interpret changes in debt spreads, whether changes in other regulatory policies, such as improvements in risk-based capital rules, will make mandatory subordinated debt unnecessary, and whether the bank or its holding company parent should issue the debt.
BENEFITS OF THE LCBO SUPERVISION PROGRAM
To date, there have been some recognizable benefits from the implementation of the LCBO program. First, supervisors are able to maintain on a more consistent basis a deeper understanding of the risk profiles, financial performance, and relative strength of the banking organizations in the program. Information exchanges—both with banking organizations and with other supervisors—are more frequent and open at all levels than in the past. As a result of ongoing monitoring and coordination efforts, the Federal Reserve becomes aware more quickly of emerging problems and is able to work with banking organiza-tions and other supervisors, as appropriate, to take whatever steps may be necessary to address these issues. Having a more complete and continuous flow of information also helps supervisors to gauge earlier the effect of potentially adverse events on banking organizations and on the financial system in general.
An additional benefit of the program is the perspec-tive that has been gained on risk-management prac-tices across the industry. This perspective enables supervisors to provide recommendations to banking organizations with respect to strengthening of risk-management processes. These recommendations are based on a greater understanding of industry-wide best practices, consistent with minimum standards for safety and soundness, than was generally available to supervisors in the past. •
15. Under GLBA, the U.S. Treasury and the Federal Reserve Board were required to prepare a report to the Congress on the feasibility and desirability of a mandatory subordinated debt policy for certain depository institutions and their holding companies. This report, The Feasibility and Desirability of Mandatory Subordinated Debt, was submitted to the Congress in December 2000 and is available on the Board's web site at www.federalreserve.gov/boarddocs/RptCongress/.
Digitized for FRASER http://fraser.stlouisfed.org/ Federal Reserve Bank of St. Louis

58
Industrial Production and Capacity Utilization for December 2000
Released for publication January 17
Industrial production fell 0.6 percent in December after two months of smaller losses. After having slowed in the third quarter, industrial output con-tracted at an annual rate of 1.1 percent in the fourth quarter, the first negative quarterly reading since 1991. Manufacturing output declined 1.1 percent in
December, with cutbacks in many industries. Output at utilities surged 6.5 percent in response to extremely cold weather, and production in mining edged up 0.3 percent. At 147.3 percent of its 1992 average, industrial production was 3.1 percent higher than in December 1999. The rate of capacity utilization for total industry fell to 80.6 percent in December, a level Wi percentage points below its 1967-99 average.
Industrial production and capacity utilization Ratio scale, 1992 = 100
1990 1992 1994 1996 1998 2000
Industrial production, market groups Ratio scale, 1992 = 100
Percent of capacity
150 Capacity utilization
140
130 CJ Y Total industry —
120
110 Manufacturing
100
1 1 1 1 1 1 1 1 1 1 1 1 1 1988 1990 1992 1994 1996 1998
Equipment
85
80
2000
Ratio scale, 1992 = 100
Consumer goods 165 Intermediate products - 165 Consumer goods 155
Intermediate products — 155
- j ^ r 145 145 — Durable 135 — - 135
y ^ A ( 125 ~ Construction supplies , , — / - 125
rJ 115 - 115
- 105 - 105
^ - n r ^ Y ^ J y ' Nondurable
1 V 1 1 1 1 1 I I I !
95 Business supplies
1 1 1 1 1
- 95
Ratio scale, 1992 = 100 Ratio scale, 1992 = 100
1990 1992 1994 1996 1998 2000 1990 1992 1994 1996 1998 2000
All series are seasonally adjusted. Latest series, December. Capacity is an index of potential industrial production.
Digitized for FRASER http://fraser.stlouisfed.org/ Federal Reserve Bank of St. Louis

59
Industrial production and capacity utilization, December 2000
Category
Industrial production, index, 1992= 100
2000
Sept.1 Oct.r Nov.r Dec.P
Percent change
20001
Sept.r Oct.r Nov.r Dec.P
Dec. 1999 to
Dec. 2000
Total
Previous estimate
Major market groups Products, total2
Consumer goods . . . Business equipment Construction supplies
Materials
Major industry groups Manufacturing
Durable Nondurable
Mining Utilities
149.0
149.1
Total
Previous estimate
Manufacturing Advanced processing Primary processing .
Mining Utilities
148.5
148.9
148.1
148.6
147.3 - .3
- . 1
- .3
- . 2
3.1
136.7 136.3 136.4 136.1 .0 - .3 .1 - .2 2.6 123.8 122.7 122.8 122.9 .0 - .8 .1 .0 .4 199.5 200.2 200.3 199.4 .9 .3 .1 - .4 10.5 143.1 142.2 140.7 137.7 .3 -.7 -1.1 -2.1 -3.1 171.3 170.8 169.3 167.6 .5 - .3 - .9 -1.0 4.1
155.1 154.8 153.9 152.2 .3 - .2 - .6 -1.1 2.6 198.4 197.2 196.0 193.5 .8 - .6 - .6 -1.2 6.0 116.0 116.4 115.8 114.7 -.3 .3 - .5 - .9 -1.6 100.4 100.4 100.3 100.6 - .6 .0 -.1 .3 1.9 121.7 119.4 123.9 132.0 -.3 -1.9 3.8 6.5 12.4
Capacity utilization, percent MEMO Capacity, percent change,
Dec. 1999 to
Dec. 2000
Average, 1967-99
Low, 1982
High, 1988-89
1999 2000
MEMO Capacity, percent change,
Dec. 1999 to
Dec. 2000
Average, 1967-99
Low, 1982
High, 1988-89
Dec. Sept.r Oct/ Nov/ Dec.P
MEMO Capacity, percent change,
Dec. 1999 to
Dec. 2000
82.1 71.1 85.4 81.7 82.4 81.9 81.4 80.6 4.6
82.5 82.1 81.6
81.1 69.0 85.7 81.0 81.7 81.2 80.4 79.1 5.0 80.5 70.4 84.2 79.8 81.6 81.0 80.4 79.6 6.7 82.5 66.2 88.9 85.0 83.0 82.6 81.5 79.2 1.6 87.4 80.3 88.0 84.5 86.4 86.5 86.5 86.9 - .9 87.5 75.9 92.6 90.0 91.0 89.0 92.1 97.9 3.3
NOTE. Data seasonally adjusted or calculated from seasonally adjusted monthly data.
1. Change from preceding month.
2. Contains components in addition to those shown, r Revised, p Preliminary.
MARKET GROUPS
The index for consumer goods was unchanged in December, with decreases in many categories offset by a surge in the output of consumer energy products. The production of durable consumer goods fell 1.5 percent and was pulled down for a third month by a drop in the production of automotive products. The output of other durable goods also fell for a third month and was down at an annual rate of 4.0 percent in the fourth quarter. The production of nondurable consumer goods other than energy products ticked down 0.1 percent in December.
The output of business equipment fell 0.4 percent in December but increased at an annual rate of 5.2 percent in the fourth quarter. The production of both industrial and transit equipment fell about 1V2 percent in December. The output of transit equip-ment, particularly motor vehicles, dropped again and posted a substantial loss for the quarter. The output of computer and office equipment grew 0.6 percent in
December, but growth during the quarter was notice-ably slower than earlier in the year. Production of other business equipment increased 1.4 percent in December, lifted by a rebound in farm machinery.
The production of construction supplies fell sharply in December and was down at an annual rate of 8.2 percent in the fourth quarter. The output of materials contracted 1.0 percent in December follow-ing a similar decline in November. The indexes for durable and nondurable materials were down sharply and were offset only partly by an increase in the output of energy materials. Among durable materials industries, the consumer parts group was hit by another decline in the production of original equip-ment parts for motor vehicles. The output of semicon-ductors, printed circuit boards, and other electronic components increased 2.5 percent in December. Nonetheless, the fourth-quarter increase in this cate-gory was at an annual rate of 24.0 percent, a pace significantly below the average over the past two years. The 1.6 percent drop in the index for nondura-
Digitized for FRASER http://fraser.stlouisfed.org/ Federal Reserve Bank of St. Louis

60 Federal Reserve Bulletin • February 2001
ble materials mainly reflected declines in the output of paper and chemicals.
INDUSTRY GROUPS
Manufacturing output dropped 1.1 percent in Decem-ber, with a 1.2 percent decrease in the production of durable goods and a 0.9 percent decrease in nondura-ble goods. Among durable goods, the losses were widespread, with the largest declines in primary met-als, fabricated metal products, and transportation equipment. The output of nondurables has declined, on balance, over the last six months, and losses in December were widespread. The petroleum products and paper and products industries suffered the largest drops.
The factory operating rate declined to 79.1 percent in December, 2lA percentage points below its Sep-tember level and the lowest level since 1993. In recent months, capacity utilization has fallen signifi-cantly in the transportation equipment and primary metals industries. The operating rate at electric utili-ties surged to 97.8 percent in December, a level 8.2 percentage points above its 1967-99 average. The operating rate for mining was 86.9 percent, a reading at the high end of its range for the year.
REVISION OF INDUSTRIAL PRODUCTION AND CAPACITY UTILIZATION
On December 5, the Federal Reserve Board pub-lished revisions to the index of industrial production (IP), to the related measures of capacity and capacity utilization, and to the index of industrial use of elec-tric power. The updated measures reflect both the incorporation of newly available, more comprehen-sive source data typical of annual revisions and, for some series, the introduction of improved com-pilation methods. The revision also included a refine-ment of the method used to aggregate the individual series in the production and capacity indexes. The new source data are for recent years, primarily 1997
through 1999, and the modified methods affect data from 1992 onward.
The updating of source data for IP included annual data from the following reports of the Bureau of the Census: the 1997 Census of Manufactures, the 1998 Annual Survey of Manufactures, and selected editions of its 1998 and 1999 Current Industrial Reports. Annual data from the U.S. Geological Sur-vey regarding metallic and nonmetallic minerals (except fuels) for 1998 and 1999 also were intro-duced. The updating included revisions to the monthly indicator for each industry (either physical product data, production-worker hours, or electric power usage) and revised seasonal factors.
The revision to capacity and capacity utilization incorporated preliminary data from the 1999 Survey of Plant Capacity of the Bureau of the Census, which covers manufacturing, along with other new data on capacity from the U.S. Geological Survey, the Depart-ment of Energy, and other organizations. The statis-tics on the industrial use of electric power incorpo-rated additional information received from utilities for the past few years as well as data from the 1997 Census of Manufactures and 1998 Annual Survey of Manufactures.
Aggregate IP indexes are built as annually weighted chain-type indexes, beginning with data for 1977. Previously, the weights changed at the middle of every year; with the revision, the weights change every month beginning with data for 1992.
The revision is available on the Board's web site (www.federalreserve.gov/releases/gl7). The revised data are also available through the web site of the Department of Commerce. Further information on these revisions is available from the Board's Indus-trial Output Section (telephone 202-452-3197).
The G.17 statistical release will be redesigned beginning with the issue covering data for January 2001. Special aggregates will be added; although some detailed industry data will no longer be listed in the regular release, these series will continue to be available on the Federal Reserve Board's public web site, along with a template of the redesigned tables. •
Digitized for FRASER http://fraser.stlouisfed.org/ Federal Reserve Bank of St. Louis

61
Announcements
FEDERAL OPEN MARKET COMMITTEE DIRECTIVE
The Federal Open Market Committee at its meeting on December 19, 2000, decided to maintain the exist-ing stance of monetary policy, keeping its target for the federal funds rate at 6V2 percent.
The drag on demand and profits from rising energy costs, as well as eroding consumer confidence, reports of substantial shortfalls in sales and earnings, and stress in some segments of the financial markets, suggest that economic growth may be slowing fur-ther. While some inflation risks persist, they are diminished by the more moderate pace of economic activity and by the absence of any indication that longer-term inflation expectations have increased. The Committee will continue to monitor closely the evolving economic situation.
Against the background of its long-run goals of price stability and sustainable economic growth and of the information currently available, the Committee consequently believes that the risks are weighted mainly toward conditions that may generate eco-nomic weakness in the foreseeable future.
STATEMENT ON THE NOMINATION OF PAUL O'NEILL AS SECRETARY OF THE TREASURY
Federal Reserve Board Chairman Alan Greenspan issued the following statement on December 20, 2000:
In Paul O'Neill, the President-elect has attracted an exceptional and talented person. I look forward to again working closely with an old friend and colleague.
STATEMENT ON THE RESIGNATION OF ARTHUR LEVITT AS SEC CHAIRMAN
Federal Reserve Board Chairman Alan Greenspan issued the following statement on December 20, 2000:
Arthur Levitt has much to be proud of in his lengthy and careful stewardship of the Securities and Exchange Com-
mission. Our nation has benefited from his service and he will be missed by all of us who had the pleasure of working with him on a daily basis. I am, of course, hopeful that he will continue to agree to the occasional round of golf, and I wish him all good things as he ponders his next tough assignment.
APPOINTMENT OF NEW MEMBERS, PRESIDENT, AND VICE PRESIDENT TO THE THRIFT INSTITUTIONS ADVISORY COUNCIL
The Federal Reserve Board on December 22, 2000, announced the names of seven new members of its Thrift Institutions Advisory Council (TIAC) and des-ignated a new president and vice president of the council for 2001.
The council is an advisory group made up of twelve representatives from thrift institutions. The panel was established by the Board in 1980 and includes savings and loan, savings bank, and credit union representatives. The council meets at least three times each year with the Board of Governors to discuss developments relating to thrift institutions, the housing industry, mortgage finance, and certain regulatory issues.
The new council president for 2001 is Thomas S. Johnson, Chairman and CEO, GreenPoint Bank, New York, New York. The new vice president is Mark H. Wright, President and CEO, USAA Federal Savings Bank, San Antonio, Texas.
The seven new members, named for two-year terms beginning January 1, are the following:
Ronald S. Eliason, President and CEO, Utah Community Federal Credit Union, Provo, Utah
D.R. Grimes, Vice President and CEO, NetBank, Alpharetta, Ga„ and Charlotte, N.C.
Karen L. McCormick, President and CEO, First Federal Savings and Loan Association, Port Angeles, Wash.
James F. McKenna, President and CEO, North Shore Bank, FSB, Brookfield, Wis.
Charles C. Pearson, Jr., Co-Chairman and CEO, Waypoint Bank, Harrisburg, Pa.
Herbert M. Sandler, Chairman and CEO, World Savings Bank, FSB, Oakland, Calif.
Everett Stiles, President and CEO, Macon Bank, Franklin, N.C.
Digitized for FRASER http://fraser.stlouisfed.org/ Federal Reserve Bank of St. Louis
62 Federal Reserve Bulletin • February 2001
Other TIAC members whose terms continue through 2001 are the following:
Tom R. Dorety, President and CEO, Suncoast Schools Federal Credit Union, Tampa, Fla.
Cornelius D. Mahoney, Chairman, President, and CEO, Woronoco Savings Bank, Westfield, Mass.
Clarence Zugelter, President, CEO, and Chairman of the Board, First Federal Bank, F.S.B., Kansas City, Mo.
ADOPTION OF AN INTERAGENCY RULE ON DISCLOSURE AND REPORTING OF CRA-RELATED AGREEMENTS
The federal bank regulatory agencies on Decem-ber 21, 2000, approved the issuance of final regula-tions implementing the CRA Sunshine Requirements of the Federal Deposit Insurance Act (FDIA), which were recently enacted by the Gramm-Leach-Bliley Act.
The FDIA establishes annual reporting and public disclosure requirements for certain written agree-ments that are entered into between insured deposi-tory institutions or their affiliates and nongovernmen-tal entities or persons (NGEPs) and that are made pursuant to, or in connection with, the fulfillment of the Community Reinvestment Act of 1977 (CRA). The final rule, to be published in the Federal Register by the Board of Governors of the Federal Reserve System, the Federal Deposit Insurance Corporation, the Office of the Comptroller of the Currency, and the Office of Thrift Supervision, identifies the types of agreements that are in fulfillment of the CRA and implements the requirements of the statute.
The FDIA exempts from coverage all agreements with NGEPs that have not had a communication concerning the CRA with the relevant banking orga-nization or a banking agency. The final rule clarifies when NGEPs have had these types of communica-tions and implements this exemption. The final rule also implements the exemptions included in the FDIA for certain types of loans and loan commitments.
Consistent with the statute, the agencies have implemented the disclosure and reporting require-ments of the act in a manner that limits potential burden. For example, the final rule establishes simple disclosure and reporting procedures and allows NGEPs to use reports that they have prepared for other purposes—such as tax returns and financial statements—if these reports provide the information required by the FDIA.
The regulations, which are identical in all substan-tive respects, are effective April 1, 2001.
"FINDER " ROLE PERMISSIBLE ACTIVITY FOR FINANCIAL HOLDING COMPANIES
The Federal Reserve Board on December 19, 2000, after consulting with the Secretary of the Treasury, has determined by rule that acting as a "finder" is an activity that is incidental to a financial activity and therefore a permissible activity for a financial holding company.
The Board's final rule provides that a finder may act through any means to bring together buyers and sellers of products and services for transactions that the parties themselves negotiate and consummate. Among other things, a finder may host an Internet marketplace consisting of links to the web sites of buyers and sellers. A finder also may operate a web site that allows buyers and sellers to post information concerning products and services and to enter into transactions among themselves.
The rule, approved by the Board on December 13, 2000, is effective thirty days after publication in the Federal Register.
INTERIM RULE ON DEFINITION OF FINANCIAL ACTIVITIES UNDER BANK HOLDING COMPANY ACT
The Federal Reserve Board on December 21, 2000, approved an interim rule defining three categories of activities listed in section 4(k)(5) of the Bank Hold-ing Company Act as financial in nature or incidental to a financial activity.
The interim rule also establishes a mechanism through which financial holding companies or other interested parties may request that the Board find, by order, that particular specific activities fall within one of the three categories.
The categories in section 4(k)(5), added to the Bank Holding Company Act by the Gramm-Leach-Bliley Act, are the following:
• Lending, exchanging, transferring, investing for others, or safeguarding financial assets other than money or securities
• Providing any device or other instrumentality for transferring money or other financial assets
• Arranging, effecting, or facilitating financial transactions for the account of third parties.
The Board is soliciting comment on the mecha-nism set out in the interim rule for requesting a Board finding and on what activities, if any, should be found by rule to fall within one of the three categories.
Digitized for FRASER http://fraser.stlouisfed.org/ Federal Reserve Bank of St. Louis

Announcements 63
The Board plans to issue a joint notice with the Secretary of the Treasury, who is promulgating a similar interim rule implementing section 5136A(b)(3) of the Revised Statutes, which parallels section 4(k)(5).
The interim rule will become effective on Janu-ary 2, 2001, and will be published in the Federal Register.
FINAL RULE ON PROCEDURES TO QUALIFY AS A FINANCIAL HOLDING COMPANY AND PERMISSIBLE ACTIVITIES
The Federal Reserve Board on December 21, 2000, approved a final rule setting forth procedures for domestic bank holding companies and foreign bank-ing organizations to qualify as financial holding companies.
The rule, effective thirty days after publication in the Federal Register, also lists financial activities permissible for financial holding companies under the Gramm-Leach-Bliley Act.
The final rule reflects public comment submitted on the interim rule in effect since March 11, 2000.
With respect to foreign banks, the final rule does the following:
• Removes the tier 1 leverage ratio from the numerical screening test in the definition of "well capitalized" and adds the leverage ratio to the list of factors the Board may take into account in determin-ing whether a foreign bank's capital is comparable to that required of a U.S. bank owned by a financial holding company
• Adopts specific standards with respect to consoli-dated home country supervision in order for a foreign bank to be treated as a financial holding company
• Clarifies the definition of "well managed" used in the assessment required of the overall operations of the foreign bank by its home country supervisor
• Revises the definition of "well managed" to require a foreign bank to have a satisfactory compos-ite rating for its U.S. branch and agency operations, rather than requiring each office individually to have a satisfactory rating.
The Board believes that the standards and proce-dures for foreign banks represent a flexible approach that takes into account the statutory requirement for comparability of capital and management standards while ensuring that foreign banks operating in the United States are offered national treatment and equality of competitive opportunity.
INCREASE IN EXEMPTION THRESHOLD FOR DEPOSITORY INSTITUTIONS UNDER HMDA REPORTING REQUIREMENT
The Federal Reserve Board on December 20, 2000, announced that the exemption threshold for deposi-tory institutions that are required to report data under the Home Mortgage Disclosure Act (HMDA) is increased to $31 million. Under the revision to the Board's staff commentary to Regulation C (HMDA), depository institutions with assets totaling $31 mil-lion or less as of December 31, 2000, are not required to collect HMDA data in 2001. An institution's exemption from collecting data in 2001 does not affect its responsibility to report data it was required to collect in 2000.
The Board is required to adjust annually the asset-size exemption threshold for depository institutions based on the annual percentage change in the Con-sumer Price Index for Urban Wage Earners and Cleri-cal Workers. The adjustment reflects changes for the twelve-month period ending in November 2000.
PROPOSED REVISIONS TO REGULATION C
The Federal Reserve Board on December 14, 2000, published proposed revisions to its Regulation C, which implements the Home Mortgage Disclosure Act (HMDA). The Board voted to request comments on the proposed revisions at its meeting on Novem-ber 29, 2000. Comment is requested by March 9, 2001.
PROPOSED AMENDMENTS TO REGULATION Z REGARDING HOEPA
The Federal Reserve Board on December 13, 2000, proposed amending the provisions of the Board's Regulation Z (Truth in Lending) that implement the Home Ownership and Equity Protection Act (HOEPA) of 1994.
The Board seeks public comment on the proposed rule, which will be published in the Federal Register.
The amendments would broaden the scope of loans subject to HOEPA's protections by adjusting the price triggers that determine coverage under the act. The rate-based trigger would be lowered by 2 percentage points, and the fee-based trigger would be revised to include optional insurance premiums and similar credit protection products paid at closing.
Certain acts and practices in connection with home-secured loans would be prohibited, including a
Digitized for FRASER http://fraser.stlouisfed.org/ Federal Reserve Bank of St. Louis

64 Federal Reserve Bulletin • February 2001
rule to restrict creditors from engaging in repeated refinancings of their own HOEPA loans over a short time period when the transactions are not in the borrower's interest. HOEPA's prohibition against extending credit without regard to a consumer's repayment ability would be strengthened by requiring creditors generally to document and verify income for HOEPA-covered loans. HOEPA disclosures would include the total amount of money borrowed.
HOEPA was enacted in response to anecdotal evi-dence of predatory lending practices in the home equity lending market. HOEPA imposes additional disclosure requirements by creditors at least three business days before the loan is closed. It also imposes substantive limitations, such as restrictions on short-term balloon notes, on certain home equity loans with rates and fees above a certain percentage or amount.
The term "predatory lending" encompasses a variety of practices. Often homeowners in cer-tain communities—particularly, the elderly and minorities—are targeted with offers of high-cost, home-secured credit. The loans carry high up-front fees and may be based on the homeowners' equity in their homes, not their ability to make the scheduled payments. When homeowners have problems repay-ing the debt, they are often encouraged to refinance the loan. Frequently this leads to another high-fee loan that provides little or no economic benefit to the borrower.
HOEPA authorizes the Board to expand HOEPA's coverage and prohibit certain acts and practices in connection with mortgage lending generally. The Board held hearings this summer in Charlotte, Bos-ton, Chicago, and San Francisco on possible ways to curb predatory lending using its regulatory authority.
PROPOSED AMENDMENT TO REGULATION Y
The Federal Reserve Board on December 13, 2000, requested public comment on a proposal that would amend Regulation Y (Bank Holding Companies and Change in Bank Control). The proposal would permit the following:
• All bank holding companies, as an activity that is closely related to banking, to conduct a greater amount of nonfinancial data processing in connection with processing financial data
• Financial holding companies, as an activity that is complementary to financial activity, to invest in companies engaged in certain types of data storage, web hosting, and data processing advisory activities,
so long as the investment was related to the provision of financial products and services.
The proposal also requests comment on whether the Board should permit financial holding companies to invest in companies that do the following:
• Develop new technologies that might support the sale and availability of financial products and services
• Provide communications links for the delivery of financial products and services
• And/or engage in the electronic sale and delivery of products and services that include, but are not limited to, financial products and services.
Comment is requested by February 16, 2001.
PROPOSED REVISIONS TO CALCULATION METHODS FOR PRICED SERVICES
The Federal Reserve Board on December 21, 2000, proposed revisions to the methods used for calculat-ing the private-sector adjustment factor (PSAF) and net income on clearing balances (NICB). The Board requested comment by April 6, 2001.
The PSAF imputes the costs that would have been incurred and profits that would have been earned had the Reserve Banks' priced services been provided by a private firm.
The NICB imputes income on the investment of depository institutions' clearing balances held with the Reserve Banks, less related costs.
The Monetary Control Act of 1980 requires that the Federal Reserve set fees for its services to recover, over the long term, its actual costs of provid-ing the services, as well as these imputed costs and profits. The Board reviews its method for calculating the PSAF periodically to assess whether it is still appropriate in light of the changing environment.
The Board's proposal would base the PSAF on a priced-services balance sheet that resembles that of a private business, using real assets and liabilities, im-puting liabilities and equity only to the extent neces-sary, and more appropriately reflecting the risk inher-ent in priced-service activity.
Separately, the Board made available a related research paper proposing a new approach for cal-culating the cost of equity capital used in the PSAF. The paper has been posted on the Internet at: www.federalreserve.gov/press/boardacts/2000/ 200012212/researchpaper.pdf.
Digitized for FRASER http://fraser.stlouisfed.org/ Federal Reserve Bank of St. Louis

Announcements 65
PROPOSAL TO ALLOW FINANCIAL HOLDING COMPANIES TO OFFER REAL ESTATE SERVICES
The Federal Reserve Board announced on Decem-ber 27, 2000, that it is seeking public comment on a proposal to permit financial holding companies to act as real estate brokers and managers. Comment is due by March 2, 2001.
The rule, proposed by the Board on December 13, 2000, would determine that real estate brokerage and management services are financial in nature or inci-dental to financial activity and are therefore permis-sible for financial holding companies.
Concurrently with the Board, the Secretary of the Treasury developed a proposal that would allow financial subsidiaries of national banks to act as real estate brokers and managers.
The Board and the Secretary will jointly publish their proposed rule in the Federal Register.
PUBLICATION OF THE DECEMBER 2000 UPDATE TO THE BANK HOLDING COMPANY SUPERVISION MANUAL
The December 2000 update to the Bank Holding Company Supervision Manual, Supplement No. 19, has been published and is now available. The Manual comprises the Federal Reserve System's bank hold-ing company (BHC) supervisory and inspection guid-ance. The supplement includes new or revised super-visory information and examiner guidance on the following topics:
1. The Statutory Authority, Focus, and Scope of BHC Inspections. The Gramm-Leach-Bliley (GLB Act), which amended section 5(c) of the BHC Act, sets forth the statutory authority, focus, and scope of BHC inspections. The GLB Act provides specific supervisory guidance per-taining to the breadth of BHC inspections, as well as inspections of their subsidiaries. The focus of inspections will be on preserving the safety and soundness of the holding company's affiliated depository institutions.
2. The GLB Act's revisions to Section 23A of the Fed-eral Reserve Act (transactions between affiliates). The GLB Act expanded the coverage of section 23A by includ-ing transactions between banks and their financial subsidi-aries and by providing a definition of financial subsidiary. With respect to transactions between a bank and an indi-vidual financial subsidiary of the bank, the GLB Act pro-vides that the 10 percent limit on covered transactions does not apply. The GLB Act also created a rebuttable presump-tion that a company or shareholder controls another com-pany if the company or shareholder directly or indirectly owns or controls 15 percent or more of the equity capital of the other company as a portfolio company.
3. The Revised June 2000 Uniform Retail-Credit Classi-fication and Account-Management Policy (revised policy).
The revised policy supersedes the February 1999 policy and provides for the following:
• Stressing the need for institutions to adopt and adhere to prudential internal standards on the number and fre-quency of extensions, deferrals, rewrites, and renewals of closed-end loans they grant
• Limiting re-aging of open-end accounts that partici-pate in a debt counseling or workout program, following receipt of at least three consecutive minimum monthly payments, or an equivalent cumulative amount
• A current assessment of value to be made no later than 180 days past the contractual due date for loans secured by real estate (any loan balance exceeding the property's value, less selling costs, is to be classified as a loss and charged off)
• A clarification that collateralized loans due to be charged off under the policy can be written down to the collateral's value, less cost to sell, instead of being entirely charged off
• A clarification that payments received after the appli-cable charge-off threshold, but before the end of the month in which the charge-off threshold is triggered, may be considered when determining if a charge-off remains appropriate.
While the terms of the revised policy apply only to federally insured depository institutions, they are broadly applicable to BHCs, particularly their consumer finance nonbank subsidiaries and other credit-extending financial affiliates. Examiners are advised to consider the methodol-ogy used for aging retail loans. The contractual method of loan aging is emphasized as the more accurate and pre-ferred methodology for aging retail loans. See Supervision and Regulation (SR) Letter 00-8. (SR Letters are the Fed-eral Reserve's primary means of communicating key pol-icy directives to its examiners, supervisory staff, and the banking industry. SR Letters can be viewed on the Board's Internet site: www.federalreserve.gov/boarddocs/srletters.)
4. Financial Holding Companies (FHCs). Information is provided on the focus and scope of the Federal Reserve System's supervisory framework for FHCs. Under the GLB Act, the Federal Reserve has supervisory oversight authority and responsibility for BHCs, including BHCs that operate as FHCs. The GLB Act streamlined the Fed-eral Reserve's supervision of BHCs and provided param-eters for working with primary depository institution regu-lators and other functional regulators (such as those responsible for supervising activities involving insurance, securities, and commodities).
The GLB Act designates the Federal Reserve as the umbrella supervisor of FHCs. In carrying out its super-visory oversight role, the Federal Reserve will maintain a supervisory focus that is concentrated on a consolidated or group-wide analysis of the organization. The Federal Reserve will thus identify and evaluate the significant risks in the diversified holding company, assessing how these risks could affect the safety and soundness and viability of its affiliated depository institutions. The Federal Reserve will also emphasize analysis of the consolidated financial condition of FHCs and the risks associated with engaging in a broad range of financial activities, since those risks can cut across the organization's legal entities and business lines. See SR Letter 00-13.
Digitized for FRASER http://fraser.stlouisfed.org/ Federal Reserve Bank of St. Louis

66 Federal Reserve Bulletin • February 2001
5. Risk Assessments for Small Shell Bank Holding Com-panies (SSBHCs). As announced in SR Letter 00-15, risk assessments for small SSBHCs are now due within sixty days of receipt of the lead bank's full-scope examination report, instead of forty-five days (as stated previously in SR Letter 97-27 and the Board's S-Letter 2587).
A more detailed summary of changes is included with the update package. The Manual and updates, including pricing information, are available from Publications Services, Mail Stop 127, Board of Gov-ernors of the Federal Reserve System, Washington, DC 20551 (or charge by facsimile: 202-728-5886). The Manual is also available on the Board's public web site: www.federalreserve.gov/boarddocs/ supmanual/.
ENFORCEMENT ACTIONS AND TERMINATION OF PREVIOUS ACTIONS
The Federal Reserve Board on December 12, 2000, announced the issuance of several enforcement actions related to foreign banking organizations that had been involved with Operation Casablanca.
Operation Casablanca was a law enforcement undercover operation that resulted in numerous crimi-nal money laundering convictions of drug traffickers, bankers, and two foreign banking organizations with operations in the United States—Bancomer, S.A., Mexico City, Mexico, and Banca Serfin, S.A., Lomas de Sante Fe, Mexico. The Federal Reserve provided substantial assistance to the U.S. Customs Service and the U.S. Department of Justice during the under-cover operation and subsequent prosecutions.
On May 18, 1998, in response to the alleged mis-conduct by employees of several foreign banking organizations whose activities were identified during Operation Casablanca, the Federal Reserve Board issued temporary orders to cease and desist. The temporary orders required the banks to enhance their anti-money-laundering policies and procedures in the United States.
The Federal Reserve Board's actions included the following:
• The issuance of an order with regard to Bancomer, S.A., determining that it is not necessary to terminate the U.S. operations of the bank as a result of the bank's conviction for a money launder-ing offense in the United States
• The issuance of a consent cease and desist order against Bancomer, S.A., requiring continued enhance-
ments of the bank's anti-money-laundering policies and procedures
• Because Banca Serfin, S.A. ceased all operations in the United States at the end of 1999, no further enforcement action against the bank was necessary
• The issuance of a written agreement between Banco Industrial de Venezuela and the Federal Reserve Bank of Atlanta, requiring continued enhancements of the bank's anti-money-laundering policies and procedures
• The termination of the temporary orders to cease and desist that had been issued against Bancomer, S.A., Banca Serfin, S.A., and Banco Industrial de Venezuela.
In March 2000, the Federal Reserve Board termi-nated temporary cease and desist orders that had been issued in 1998 against Banco Nacional de Mexico, Mexico City, Mexico; Banco Internacional, S.A., Mexico City, Mexico; and Banco Santander, Madrid, Spain.
The issuance of these enforcement actions con-cludes the Federal Reserve's enforcement efforts aris-ing out of Operation Casablanca.
The Federal Reserve Board on December 12, 2000, announced the issuance of an order of prohibition against Bruce Jeffrey Kingdon, a former partner, operating committee member, managing director, employee, and institution-affiliated party of the Bank-ers Trust Company, New York, New York.
Mr. Kingdon, without admitting to any allegations, consented to the issuance of the order as a result of his alleged violations of law, unsafe or unsound banking practices, and breaches of his fiduciary duties to Bankers Trust and its customers.
The Federal Reserve Board on December 12, 2000, announced the execution of a written agreement by and between People's Bancshares, Inc., New Bed-ford, Massachusetts, and the Federal Reserve Bank of Boston.
The Federal Reserve Board announced on Decem-ber 13, 2000, the issuance of a final decision and order of prohibition against Kaye G. Hill, former employee, Barnett Bank, N.A., Jacksonville, Florida. The order, the result of an action brought by the Office of the Comptroller of the Currency, pro-hibits Ms. Hill from participating in the conduct of the affairs of any financial institution or holding company.
Digitized for FRASER http://fraser.stlouisfed.org/ Federal Reserve Bank of St. Louis

Announcements 67
CHANGES IN BOARD STAFF
The Board of Governors approved on December 20, 2000, a restructuring of the Division of Banking Supervision and Regulation. The principal objectives of the reorganization are the following:
• Focus more effectively on major supervisory risks and to provide additional emphasis on enhanced accounting, public disclosure, and market discipline as important supplements to safety and soundness supervision
• Develop a more coordinated approach to System-wide supervisory activities, including large, com-plex banking organizations (LCBOs) and resource allocation
• Support implementation of financial holding company umbrella supervision and other aspects of the Gramm-Leach-Bliley Act
• Address strategic organizational considerations.
As part of the reorganization, the Board is pleased to announce the following official staff promotions and appointments:
• The promotion of Herbert A. Biern, Roger T. Cole, and William A. Ryback to Senior Associate Directors
• The promotion of Gerald A. Edwards to Associ-ate Director and Chief Supervisory Accountant
• The promotion of James V. Houpt, Stephen M. Hoffman, Jack R Jennings, Michael G. Martinson, and Molly S. Wassom to Associate Directors
• The promotion of Sidney M. Sussan to Adviser • The promotion of Howard A. Amer, Mary Cross
Jacowski, Norah M. Barger, and Richard A. Small to Deputy Associate Directors
• The appointment of Deborah R Bailey, Bar-bara J. Bouchard, Angela Desmond, James A. Ember-sit, Charles H. Holm, Heidi W. Richards, William G. Spaniel, and David M. Wright to the official staff as Assistant Directors.
Ms. Bailey was appointed Assistant Director responsible for LCBO supervision after having been the manager of the Global Organizations Section. She joined the Board's staff in 1997 after seventeen years with the Office of the Comptroller of the Cur-rency as a supervisory financial analyst. She was awarded a B.B.A. from the University of Georgia and has received her commission as a National Bank Examiner.
Ms. Bouchard was appointed Assistant Director of the Supervisory and Risk Policy Function after hav-ing been the manager of the Policy Development Section. She began her career at the Board in 1992 as a senior financial analyst. She received her law degree from George Washington University's National Law Center and her B.S. from the Univer-sity of Virginia.
Ms. Desmond was appointed Assistant Director for the LCBO Secretariat. She joined the Board's staff in 1993 and most recently performed the secretariat function for the LCBO Subcommittee of the Sys-tem's Strategic Plan Steering Committee. She earned her B.S. from Boston State College and her J.D. from The American University Law School.
Mr. Embersit was appointed Assistant Director of the Market and Liquidity Risks Function. He began his career at the Board in 1991 as a supervisory financial analyst and was promoted to manager of the Capital Markets Program. Mr. Embersit earned his B.A. from The American University and holds mas-ter's degrees from Boston College and George Wash-ington University.
Mr. Holm was appointed Assistant Director of the Accounting Function. He joined the Board's staff in 1988 as an accountant analyst in the Policy Devel-opment Section and became the manager of the Accounting Policy and Disclosure Section in 1998. He earned a B.S. from Villanova University, an M.B.A. from the University of Maryland, and is a certified public accountant.
Ms. Richards was appointed Assistant Director of the Operational Risk and Emerging Activities Func-tion after having been manager of Specialized Activ-ities. She joined the Board's staff in 1993 in the Division of Federal Reserve Bank Operations and Payment Systems as an assistant financial services analyst. She holds an A.B. from Radcliffe College and an M.P.A. from the John F. Kennedy School of Government at Harvard.
Mr. Spaniel was appointed Assistant Director of the System Planning Evaluation and Staff Develop-ment Function. He joined the Board's staff in 1990 as a senior financial analyst and in 1998 was promoted to manager, Supervisory Reviews and Evaluations. Mr. Spaniel holds a B.A. from The College of William and Mary.
Mr. Wright was appointed Assistant Director of the Credit Risk Function after having been manager of the Financial Analysis and Special Studies Function since 1998. He joined the division in 1991. He holds a B.A. from Wake Forest University and an M.B.A. from The College of William and Mary. •
Digitized for FRASER http://fraser.stlouisfed.org/ Federal Reserve Bank of St. Louis

68
Minutes of the Meeting of the Federal Open Market Committee Held on November 15, 2000
A meeting of the Federal Open Market Committee was held in the offices of the Board of Governors of the Federal Reserve System in Washington, D.C., on Wednesday, November 15, 2000, at 9:00 a.m.
Present: Mr. Greenspan, Chairman Mr. McDonough, Vice Chairman Mr. Broaddus Mr. Ferguson Mr. Gramlich Mr. Guynn Mr. Kelley Mr. Meyer Mr. Parry
Mr. Hoenig, Ms. Minehan, Messrs. Moskow and Poole, Alternate Members of the Federal Open Market Committee
Messrs. McTeer, Stern, and Santomero, Presidents of the Federal Reserve Banks of Dallas, Minneapolis, and Philadelphia respectively
Mr. Kohn, Secretary and Economist Mr. Bernard, Deputy Secretary Mr. Gillum, Assistant Secretary Ms. Fox, Assistant Secretary Mr. Mattingly, General Counsel Ms. Johnson, Economist Mr. Stockton, Economist
Ms. Cumming, Messrs. Eisenbeis, Goodfriend, Howard, Lindsey, Reinhart, Simpson, and Sniderman, Associate Economists
Mr. Fisher, Manager, System Open Market Account
Mr. Winn, Assistant to the Board, Office of Board Members, Board of Governors
Mr. Ettin, Deputy Director, Division of Research and Statistics, Board of Governors
Mr. Madigan, Associate Director, Division of Monetary Affairs, Board of Governors
Messrs. Oliner, Slifman, and Struckmeyer, Associate Directors, Division of Research and Statistics, Board of Governors
Mr. Whitesell, Assistant Director, Division of Monetary Affairs, Board of Governors
Ms. Low, Open Market Secretariat Assistant, Division of Monetary Affairs, Board of Governors
Mr. Barron and Ms. Pianalto, First Vice Presidents, Federal Reserve Banks of Atlanta and Cleveland respectively
Messrs. Hakkio, Hunter, Ms. Mester, Messrs. Rasche, Rolnick, and Rosenblum, Senior Vice Presidents, Federal Reserve Banks of Kansas City, Chicago, Philadelphia, St. Louis, Minneapolis, and Dallas respectively
Messrs. Fuhrer, Judd, and Ms. Perelmuter, Vice Presidents, Federal Reserve Banks of Boston, San Francisco, and New York respectively
By unanimous vote, the minutes of the meeting of the Federal Open Market Committee held on Octo-ber 3, 2000, were approved.
The Manager of the System Open Market Account reported on recent developments in foreign exchange markets. There were no open market operations in foreign currencies for the System's account in the period since the previous meeting.
The Manager also reported on developments in domestic financial markets and on System open mar-ket transactions in government securities and federal agency obligations during the period October 3, 2000, through November 14, 2000. By unanimous vote, the Committee ratified these transactions.
The Committee then turned to a discussion of the economic situation and outlook and the implementa-tion of monetary policy over the intermeeting period ahead.
The information reviewed at this meeting sug-gested that economic growth had slowed appreciably from the rapid pace in the first half of the year. The slowdown was most apparent in housing construc-tion and business investment in equipment and software, while consumer spending remained on a
Digitized for FRASER http://fraser.stlouisfed.org/ Federal Reserve Bank of St. Louis

69
relatively solid upward trend. With expansion of aggregate demand less robust, industrial production and employment were rising at appreciably slower rates, though unemployment remained very low. Core inflation appeared to be increasing, but very gradu-ally and in part reflecting the indirect effects of higher energy costs.
Growth in private nonfarm payroll employment slowed in October from the moderate September rate; since midyear, employment growth had been consid-erably lower than earlier in the year. The falloff in growth was concentrated in the manufacturing, retail trade, and temporary help services industries. By contrast, the pace of hiring was brisk in real estate and construction and slowed only slightly in services industries other than temporary help. The civilian unemployment rate held at its current cyclical low of 3.9 percent in October.
Industrial production edged down in October, after its growth had dropped abruptly in the third quarter to a pace well below that recorded during the first half of the year. Manufacturing output was unchanged in October; a further sharp decline in production of motor vehicles followed on the heels of a third-quarter slump, and the manufacture of other durables also fell. Expansion of output of high-tech equip-ment, which had been extraordinarily rapid earlier in the year, slowed somewhat in October. With produc-tion unchanged in October, the rate of capacity utili-zation in manufacturing fell to a level slightly below its long-term average.
Nominal retail sales edged up in October after rising substantially in the third quarter. Nondurable goods stores, notably apparel, registered a sizable increase in October sales, but that gain was more than offset by declines in outlays for durable goods, par-ticularly motor vehicles. Consumer spending for ser-vices continued to grow at a moderate rate through September (latest data). Recent consumer buying pat-terns seemed to reflect moderate growth of real dis-posable income in recent quarters and still generally buoyant consumer sentiment.
Single-family housing starts declined further in the third quarter as a whole. Nevertheless, the drop in interest rates on fixed-rate mortgages since mid-May might have sparked the slight increase, on balance, in single-family housing starts in August and September and the upturn in new home sales in the third quarter. After a strong first half, multifamily starts dropped in the third quarter despite low vacancy rates and rising apartment rents.
Business investment in durable equipment and software decelerated sharply in the third quarter. In the high-tech area, spending on computers and related
equipment as well as software recorded further robust gains. However, expenditures on communications equipment declined after a half-year of very strong increases, and outlays for other types of equipment also softened; investment in aircraft, autos, trucks, and construction and mining equipment fell, while growth of spending on agricultural and industrial equipment slowed. Despite the third-quarter weak-ness in expenditures, recent data on orders for non-defense capital goods suggested that spending for many types of equipment remained on an upward trend. Data on construction put in place indicated that nonresidential building activity picked up consider-ably in the third quarter, with the institutional, indus-trial, and office categories recording solid gains. Mar-ket fundamentals, including rising property values and low vacancy rates, suggested that further expan-sion of office building was likely. Other commercial construction, by contrast, remained weak, partly reflecting the already substantial stock of large retail stores and regional malls.
The pace of inventory investment slowed consid-erably in the third quarter. However, for a second consecutive quarter, the book value of inventories rose faster than sales, and inventory overhangs were evident in some industries. In manufacturing, stock accumulation edged up and the aggregate stock-shipments ratio in September, though still quite low by historic norms, was just above the middle of its range over the preceding twelve months. In the wholesale sector, inventory accumulation dropped in the third quarter; however, sales declined and the aggregate inventory-sales ratio for the sector was at the top of its narrow range over the past year. Retail stockbuilding also slowed in the third quarter, with much of the drop reflecting reductions in motor vehicle inventories at auto dealers. The aggregate inventory-sales ratio for this sector edged lower and was near the middle of its range over the past year.
The U.S. trade deficit in goods and services nar-rowed in August after having widened considerably in July; on balance, the trade deficit increased some-what from its second-quarter level. The value of exports grew in the July-August period at about the same strong pace as that recorded for the second quarter. The value of imports also rose briskly over the two months, but at a slightly lower rate than that of the second quarter. The available information indi-cated that, on average, economic expansion in the foreign industrial countries slowed appreciably in the third quarter from the elevated pace during the first half of the year and that the slowdown importantly reflected little or no growth in Japan. In addition, economic activity appeared to have decelerated in
Digitized for FRASER http://fraser.stlouisfed.org/ Federal Reserve Bank of St. Louis

70 Federal Reserve Bulletin • February 2001
many developing countries in the third quarter but remained solid in most of those nations.
Incoming data continued to indicate that price inflation had picked up somewhat. Consumer prices, as measured by the consumer price index (CPI), rose considerably in September (latest data) after having edged down in August; a sizable step-up in energy prices and a noticeable increase in core inflation contributed about equally to the accelera-tion. Although the core measure of CPI prices accel-erated noticeably in the twelve months ended in September compared with the previous twelve-month period, personal consumption expenditure (PCE) price inflation had been about steady. By contrast, core producer prices dropped a little in October and decelerated somewhat on a year-over-year basis, though the deceleration was more than accounted for by a surge in tobacco prices during the year ended in October 1999. With regard to labor costs, the third-quarter rise in the employment cost index (ECI) for hourly compensation of private industry workers was smaller than the elevated increase of the previous quarter. However, ECI compensation advanced con-siderably more during the year ended in September than in the previous year, with larger increases in benefits accounting for much of the rise. Average hourly earnings of production or nonsupervisory workers increased at a slightly higher rate in both October and the twelve months ended in October.
At its meeting on October 3, 2000, the Committee adopted a directive that called for maintaining condi-tions in reserve markets consistent with an unchanged federal funds rate of about 6V2 percent. In taking that action, the members noted that the growth of aggre-gate demand had moderated appreciably, the pros-pects for a significant rise in inflation seemed quite limited for the near term, and previous policy tighten-ing actions and the earlier rise in energy prices had not yet exerted their full restraining effects on demand. Nevertheless, in the context of continuing substantial pressures on labor resources and the potential effects of the previous rise in energy prices on inflation expectations, members believed it was necessary to remain on guard for signs of rising inflation over the intermediate term. As a result, they agreed that the statement accompanying the announcement of their decision should continue to indicate that the risks remained weighted mainly in the direction of rising inflation.
Open market operations were directed throughout the intermeeting period toward maintaining the fed-eral funds rate at the Committee's targeted level of 6V2 percent, and the average rate remained close to the intended level. Short- and intermediate-term mar-
ket interest rates registered small mixed changes over the intermeeting interval. At longer maturities, Trea-sury coupon yields drifted slightly lower, and rates on high-grade corporate securities changed little. How-ever, growing market concerns about the outlook for corporate earnings led to substantial increases in interest rates on lower-rated investment-grade and high-yield bonds, and the early November survey of senior loan officers indicated that banks had tightened further their standards and terms for business loans. The mixed reports on corporate earnings, incoming information indicating slower growth in economic activity in the United States, and wide swings in and uncertainty about the price of oil contributed to a sharp drop in broad indexes of stock market prices over the period in volatile trading.
In foreign exchange markets, the trade-weighted value of the dollar increased slightly further on bal-ance over the intermeeting interval in terms of the currencies of a broad group of U.S. trading partners. Among the major foreign currencies, the dollar moved up against the euro and the Canadian and Australian dollars but edged down a bit in terms of the yen. The dollar rose to a record level against the euro in the weeks following the FOMC meeting, but the release of weaker-than-expected U.S. economic growth data in late October was seen as possibly marking a shift in the relative growth rates, and the dollar subsequently gave up much of its intermeeting gains in terms of the euro. The dollar also posted gains against an index of the currencies of other important trading partners, largely reflecting condi-tions in some emerging economies. Concerns about Argentina's recent economic and fiscal performance and its external financing situation spilled over to other Latin American countries, notably Brazil and Mexico, and political developments in Indonesia and the Philippines depressed the currencies of those countries.
The broad monetary aggregates decelerated in October. The slower growth of M2 followed strong expansion in August and September, however, and growth since midyear was at about the same pace as in the first half of the year. M3 also increased at a slower rate in October, partly reflecting weakness in bank lending and declines in bank holdings of securi-ties. The growth of domestic nonfinancial debt picked up in September in association with an increase in the pace of private borrowing and a less rapid paydown of federal debt.
The staff forecast prepared for this meeting sug-gested that the economic expansion, having slowed considerably, would be sustained over the forecast horizon at a rate a little below the staff's current
Digitized for FRASER http://fraser.stlouisfed.org/ Federal Reserve Bank of St. Louis

Minutes of the Federal Open Market Committee 71
estimate of the economy's potential output. The fore-cast anticipated that the expansion of domestic final demand would be held back to some extent by the waning influence of the positive wealth effects associ-ated with past outsized gains in equity prices but also by some firming of conditions in credit markets. As a result, growth of spending on consumer durables was expected to be appreciably below that in recent quar-ters and housing demand to trend slightly downward. By contrast, business fixed investment—notably, out-lays for equipment and software—was projected to remain relatively robust, and brisk growth abroad would undergird the expansion of U.S. exports. Core price inflation was projected to rise a little over the forecast horizon, in part as a result of higher import prices but largely as a consequence of further increases in nominal labor compensation gains that would not be fully offset by growth in productivity.
In the Committee's discussion of current and pro-spective economic conditions, members commented that the information that had become available since the previous meeting had reinforced earlier indica-tions of appreciable slowing in the expansion of economic activity. The cumulating evidence of mod-erating expansion seemed especially clear in the in-formation on employment growth and manufacturing output. Aggregate demand currently appeared to be growing at a pace a little below the rate of increase in the economy's output potential, a configuration that could well persist in coming quarters. Actual and expected shortfalls in business profitability had led to tighter credit conditions for many borrowers and lower equity prices, which would continue to restrain spending; moreover, further pressure on profit mar-gins, with adverse effects on financial markets, busi-ness investment, and consumer spending, was a dis-tinct possibility. Members observed, however, that economic growth had rebounded sharply from tempo-rary slowdowns previously in the current expansion, and several noted the possibility that a less restrictive fiscal policy stance would be bolstering demand in the years ahead.
Although the softening in aggregate demand moved in the direction of containing potential infla-tion pressures, the members continued to be con-cerned about the possibility that inflation would edge higher. Even with demand growth slower, labor mar-kets were likely to remain unusually tight for some time, and in such circumstances labor costs could begin to rise increasingly in excess of even elevated gains in productivity. Some members also com-mented that energy prices might not trend lower as soon as, or to the extent, now expected by market analysts, and a few raised the prospect that the dollar
might depreciate from its currently elevated level and add to potential upward pressures on domestic prices over the forecast horizon.
A key factor underlying the economic outlook was the emergence in recent months of less accommoda-tive financial conditions for many businesses, includ-ing some further tightening since the meeting in early October, and decreases in the wealth of households. The slowdown in the pace of the expansion and disappointing business earnings had fostered more cautious attitudes on the part of lending institutions and investors. Anecdotal comments from around the country supported the indications from surveys of tightening terms and standards at banks for business borrowers. At the same time, spreads in securities markets had widened, most sharply on obligations of borrowers rated below investment grade, and as a result those borrowers faced higher credit costs. Lender caution and less receptive markets probably had contributed to considerable weakening recently in overall growth of credit to nonfinancial businesses. Rising interest and energy costs in conjunction with restraint on the prices of final output had depressed the earnings and stock market valuations of many firms, notably in the high-tech area, with adverse repercussions on their ability to borrow and willing-ness to invest and on the financial position of the households holding their equity shares.
Less hospitable conditions in financial markets for a number of borrowers and deteriorating profit mar-gins had contributed to a substantial moderation in the growth of business fixed investment in recent months, and anecdotal reports of reductions in capi-tal spending plans were consistent with continued more moderate expansion in such outlays. The recent deceleration was especially pronounced in expendi-tures for high-tech equipment and software, though such spending was still growing at a robust pace. It was suggested that the weakening expansion of expenditures in these capital goods might reflect a surfeit in capacity following a period of extraordinary growth in many industries—for example, those related to fiber optics. The available evidence did not indicate any material decrease in the optimism of equity market analysts as a group regarding the out-look for earnings over the long term. This suggested that their contacts among business executives remained fundamentally upbeat about the long-term prospects for productivity and earnings. In these circumstances, appreciable further growth in invest-ment spending seemed to be in prospect for com-ing quarters, though undoubtedly at a slower pace than had been experienced on average in recent quarters.
Digitized for FRASER http://fraser.stlouisfed.org/ Federal Reserve Bank of St. Louis

72 Federal Reserve Bulletin • February 2001
Even limited slowing in the expansion of invest-ment expenditures could be expected to have retard-ing effects on the growth of consumer income and spending. While such spending had held up well in the third quarter, the limited information available on more recent developments suggested some softening, though the data were not conclusive. Factors cited in support of a somewhat weaker trajectory in consumer spending included the impact of elevated energy costs, the high debt burdens of many households, and the ebbing of the wealth effects from strong earlier gains in stock market prices. Even so, anticipated increases in employment and income and still rela-tively high levels of consumer confidence were likely to support appreciable further growth in consumer spending, albeit probably at a rate somewhat below the brisk pace of the past few years.
Key indicators of housing activity had fluctuated considerably this year, but the evidence of recent months pointed on balance to a mild softening in such activity, a perception that was supported by anecdotal reports from several areas around the coun-try. In general, housing demand was expected to edge lower in response to the same income and wealth effects that were influencing consumer durables expenditures and to the increase in mortgage interest rates that had occurred on net over the past year.
Current forecasts of appreciable growth in foreign economic activity had favorable implications for U.S. exports and the nation's trade balance, but some members expressed concern about financial and eco-nomic weakness in a number of foreign economies. Failure to remedy structural and other problems in some countries incurred the risk of economic and financial distress, with possible spillover effects on other economies and financial markets. While those risks seemed small, they might be difficult to contain. The exchange value of the dollar was another source of uncertainty for the outlook. In the view of some members, the dollar could well come under down-ward pressure as the nation's current account deficits continued to cumulate. A lower dollar would tend to have a favorable effect on the trade deficit but also would add to inflationary pressures in the domestic economy.
Members continued to be concerned about the outlook for inflation. Measured increases in "head-line" consumer prices could be explained mostly as a result of sharp advances in energy prices, which many observers expected to be reversed at some point. However, core consumer price measures also displayed a gradual uptrend, perhaps only in part as a consequence of the pass-through effects of persis-tently high energy prices. Measures of labor compen-
sation appeared to be accelerating, partly as a result of sharply rising health benefit costs. To be sure, unit labor costs in the nonfinancial corporate sector had changed little over the past year, undoubtedly reflect-ing impressive further gains in productivity. Even so, higher interest rates and increased energy and other input costs were adding to overall production expenses. To date, competitive pressures were con-tinuing to inhibit the ability of many firms to pass on those costs, although a significant exception was a number of successful efforts to impose energy surcharges.
Looking to the future, however, the members gen-erally agreed that the risks were in the direction of a heightening in inflation pressures despite their belief that growth in overall demand now seemed to have declined to a more sustainable pace and probably would continue to expand for a time at a rate below that of the economy's output potential. The members believed that growth in labor compensation was likely to remain under upward pressure from the anticipated persistence of very tight conditions in labor markets that would enable wages to catch up to earlier gains in labor productivity. Whether offsetting increases in the growth of labor productivity would materialize was open to question, in part because productivity growth might tend to level out in the context of less ebullient expansion in business invest-ment. Another key factor in the outlook for inflation was the course of oil and other energy prices. Thus far, increases in energy costs had been reflected only marginally in core consumer prices, and while there were widespread market expectations of declining oil prices in coming quarters, a great deal of uncertainty, including the potential for more difficulties in the Middle East, surrounded the timing and extent of such an outcome. The longer relatively high energy prices persisted, of course, the greater might be their imprint on both inflation expectations and core prices. In sum, the moderation in economic expansion, the persistence of highly competitive conditions in most domestic markets, the outlook for continued robust gains in productivity, and relatively subdued inflation expectations were favorable factors in the inflation outlook, but the members continued to view the prospects as weighted on balance in the direction of a gradual uptrend in core inflation.
In the Committee's discussion of policy for the intermeeting period ahead, all the members supported a proposal to maintain an unchanged policy stance consistent with the federal funds rate continuing to average about 6V2 percent. Despite clear indications of a more moderate expansion in economic activity, persisting risks of heightened inflation pressures
Digitized for FRASER http://fraser.stlouisfed.org/ Federal Reserve Bank of St. Louis

Minutes of the Federal Open Market Committee 73
remained a policy concern, particularly in the context of an evident, if gradual, uptrend in key measures of core inflation. Indeed, a few members commented that measures of core inflation already were near or slightly above levels that they viewed as acceptable for the longer run. Although overall financial con-ditions had tightened during the course of recent months and currently appeared to be holding down the growth in spending, this added restraint was likely to be necessary to contain inflation pressures. In these circumstances, all the members saw the maintenance of a steady policy as the best course at this juncture to promote the Committee's longer-run objectives of price stability and sustainable economic expansion.
Still, growth had slowed more quickly than many members had anticipated, and financial market and other developments now seemed more likely to keep pressures on resources from mounting over coming quarters. Under the circumstances, the members focused at this meeting on the potential desirability of moving from a statement of risks weighted toward rising inflation to one that indicated a balanced view of the risks to the Committee's goals of price stability and sustainable economic growth. The members agreed that a stronger case could be made for a shift to a balanced risk statement than at the previous meeting. A few indicated that the decision was a close call for them, and several commented that developments might be moving in a direction that would make a shift advisable in the relatively near future. Even so, they were unanimous in concluding that such a change would be premature at this time. Concerns about the possibility of rising inflation per-sisted. And while the members could see an increased risk of a marked slowing of growth relative to the rapid rate of expansion of the economy's potential, the degree to which growth in demand might remain sufficiently damped to contain and offset those infla-tion pressures was quite uncertain. Moreover, a shift in the Committee's published views might induce an undesirable softening in overall financial market con-ditions, which in itself would tend to add to inflation
pressures. The members concluded that retaining a risk statement weighted toward more inflation pres-sures would best represent their current thinking, but they believed it was desirable to provide some recog-nition of the emergence of increased downside risks to the economic expansion in the statement to be released after this meeting.
At the conclusion of this discussion, the Commit-tee voted to authorize and direct the Federal Reserve Bank of New York, until it was instructed other-wise, to execute transactions in the System Account in accordance with the following domestic policy directive:
The Federal Open Market Committee seeks monetary and financial conditions that will foster price stability and promote sustainable growth in output. To further its long-run objectives, the Committee in the immediate future seeks conditions in reserve markets consistent with main-taining the federal funds rate at an average of around 61/2 percent.
The vote also encompassed approval of the sen-tence below for inclusion in the press statement to be released shortly after the meeting:
Against the background of its long-run goals of price stability and sustainable economic growth and of the infor-mation currently available, the Committee believes that the risks are weighted mainly toward conditions that may generate heightened inflation pressures in the foreseeable future.
Votes for this action: Messrs. Greenspan, McDonough, Broaddus, Ferguson, Gramlich, Guynn, Kelley, Meyer, Moskow, and Parry. Votes against this action: None. Mr. Moskow voted as alternate member for Mr. Jordan.
It was agreed that the next meeting of the Commit-tee would be held on Tuesday, December 19, 2000.
The meeting adjourned at 1:00 p.m.
Donald L. Kohn Secretary
Digitized for FRASER http://fraser.stlouisfed.org/ Federal Reserve Bank of St. Louis

74 Federal Reserve Bulletin • February 2001
Digitized for FRASER http://fraser.stlouisfed.org/ Federal Reserve Bank of St. Louis

75
Legal Developments
FINAL RULE—AMENDMENT TO REGULATION C
The Board of Governors is amending 12 C.F.R. Part 203, its Regulation C (Home Mortgage Disclosure). The Board is required to adjust annually the asset-size exemption threshold for depository institutions based on the annual percentage change in the Consumer Price Index for Urban Wage Earners and Clerical Workers. The present adjust-ment reflects changes for the 12-month period ending in November 2000. During this period, the index increased by 3.4 percent; as a result, the threshold is increased to $31 million. Thus, depository institutions with assets of $31 million or less as of December 31, 2000, are exempt from data collection in 2001.
Effective January 1, 2001, 12 C.F.R. Part 203 is amended as follows:
Part 203—Home Mortgage Disclosure (Regula-tion C)
1. The authority citation for Part 203 continues to read as follows:
Authority: 12 U.S.C. 2801-2810.
2. In Supplement I to Part 203, under Section 203.3— Exempt Institutions, under 3(a) Exemption based on location, asset size, or number of home-purchase loans, paragraph 2 is revised to read as follows:
Supplement I to Part 203—Staff Commentary sfc jfc 5j< ^
FINAL RULE—AMENDMENT TO REGULATION Y
The Board of Governors is amending 12 C.F.R. Part 225, its Regulation Y (Bank Holding Companies and Change in Bank Control), by adding acting as a finder to the list of activities that a financial holding company may conduct using the streamlined post-transaction notice procedure authorized by the Gramm-Leach-Bliley Act.
The final rule allows a financial holding company to bring together buyers and sellers of products and services for transactions that the buyers and sellers themselves negotiate and consummate. The rule provides examples of specific services that a financial holding company may and may not perform when acting as a finder under the rule. The rule also requires a financial holding company that acts as a finder to provide appropriate disclosures to distin-guish products and services that are offered by the financial holding company from those that are offered by a third party using the financial holding company's finder service.
Effective January 22, 2001, 12 C.F.R. Part 225 is amended as follows:
Part 225—Bank Holding Companies and Change in Bank Control (Regulation Y)
1. The authority citation for Part 225 continues to read as follows:
Authority: 12 U.S.C. 1817(j)(13), 1818, 1828(o), 1831i, 183 lp-1, 1843(c)(8), 1843(k), 1844(b), 1972(/), 3106, 3108, 3310, 3331-3351, 3907, and 3909.
2. Section 225.86 is amended by adding a new paragraph (d) to read as follows:
Section 203.3—Exempt Institutions
3(a) Exemption based on location, asset size, or number of home-purchase loans.
2. Adjustment of exemption threshold for depository insti-tutions. For data collection in 2001, the asset-size ex-emption threshold is $31 million. Depository institu-tions with assets at or below $31 million are exempt from collecting data for 2001.
Section 225.86—What activities are permissible for financial holding companies?
(d) Activities determined to be financial in nature or inci-dental to financial activities by the Board— (1) Acting as a finder—
Acting as a finder in bringing together one or more buyers and sellers of any product or service for transactions that the parties themselves negoti-ate and consummate. (i) What is the scope of finder activities ? Acting
as a finder includes providing any or all of the following services through any means—
Digitized for FRASER http://fraser.stlouisfed.org/ Federal Reserve Bank of St. Louis

76 Federal Reserve Bulletin • February 2001
(A) Identifying potential parties, making inquiries as to interest, introducing and referring potential parties to each other, and arranging contacts between and meetings of interested parties;
(B) Conveying between interested parties expres-sions of interest, bids, offers, orders and con-firmations relating to a transaction; and
(C) Transmitting information concerning prod-ucts and services to potential parties in con-nection with the activities described in para-graphs (d)(l)(i)(A) and (B) of this section.
(ii) What are some examples of finder services? The following are examples of the services that may be provided by a finder when done in accordance with paragraphs (d)(l)(iii) and (iv) of this section. These examples are not exclusive. (A) Hosting an electronic marketplace on the fi-
nancial holding company's Internet web site by providing hypertext or similar links to the web sites of third party buyers or sellers.
(B) Hosting on the financial holding company's servers the Internet web site of— (7) A buyer (or seller) that provides informa-
tion concerning the buyer (or seller) and the products or services it seeks to buy (or sell) and allows sellers (or buyers) to sub-mit expressions of interest, bids, offers, orders and confirmations relating to such products or services; or
(2) A government or government agency that provides information concerning the ser-vices or benefits made available by the government or government agency, as-sists persons in completing applications to receive such services or benefits from the government or agency, and allows per-sons to transmit their applications for ser-vices or benefits to the government or agency.
(C) Operating an Internet web site that allows multiple buyers and sellers to exchange infor-mation concerning the products and services that they are willing to purchase or sell, locate potential counterparties for transactions, ag-gregate orders for goods or services with those made by other parties, and enter into transactions between themselves.
(D) Operating a telephone call center that pro-vides permissible finder services.
(iii) What limitations are applicable to a financial holding company acting as a finder? (A) A finder may act only as an intermediary
between a buyer and a seller. (B) A finder may not bind any buyer or seller to
the terms of a specific transaction or negotiate the terms of a specific transaction on behalf of a buyer or seller, except that a finder may—
(1) Arrange for buyers to receive pre-ferred terms from sellers so long as
the terms are not negotiated as part of any individual transaction, are pro-vided generally to customers or broad categories of customers, and are made available by the seller (and not by the financial holding company); and
(2) Establish rules of general applicabil-ity governing the use and operation of the finder service, including rules that— (0 Govern the submission of bids
and offers by buyers and sellers that use the finder service and the circumstances under which the finder service will match bids and offers submitted by buyers and sellers; and
(ii) Govern the manner in which buyers and sellers may bind themselves to the terms of a spe-cific transaction.
(C) A finder may not— (1) Take title to or acquire or hold an owner-
ship interest in any product or service offered or sold through the finder service;
(2) Provide distribution services for physical products or services offered or sold through the finder service;
(3) Own or operate any real or personal prop-erty that is used for the purpose of manu-facturing, storing, transporting, or assem-bling physical products offered or sold by third parties; or
(4) Own or operate any real or personal prop-erty that serves as a physical location for the physical purchase, sale or distribution of products or services offered or sold by third parties.
(D) A finder may not engage in any activity that would require the company to register or ob-tain a license as a real estate agent or broker under applicable law.
(iv) What disclosures are required? A finder must distinguish the products and services offered by the financial holding company from those offered by a third party through the finder service.
(2) [Reserved]
ORDERS ISSUED UNDER BANK HOLDING COMPANY ACT
Orders Issued Under Sections 3 and 4 of the Bank Holding Company Act
The Chase Manhattan Corporation New York, New York
Digitized for FRASER http://fraser.stlouisfed.org/ Federal Reserve Bank of St. Louis
Legal Developments 77
J. P. Morgan & Co. Incorporated New York, New York
Order Approving the Merger of Bank Holding Companies, Merger of Banks, and Establishment of Branches
The Chase Manhattan Corporation ("Chase"), a bank hold-ing company within the meaning of the Bank Holding Company Act ("BHC Act"), has requested the Board's approval under section 3 of the BHC Act (12 U.S.C. § 1842) to merge with J.P. Morgan & Co. Incorporated ("Morgan") and thereby acquire Morgan's subsidiary bank, Morgan Guaranty Trust Company of New York ("Morgan Guaranty"), New York, New York.1 Chase's lead bank, The Chase Manhattan Bank, also in New York ("Chase Bank"), a state member bank, has applied under section 18(c) of the Federal Deposit Insurance Act (12 U.S.C. § 1828(c)) (the "Bank Merger Act") to merge with Morgan Guaranty, with Chase Bank as the surviving institution. Chase Bank also has applied under section 9 of the Federal Reserve Act (12 U.S.C. § 321) to establish branches at the locations of the main office and branches of Morgan Guaranty.2
In addition, Chase has requested the Board's approval under sections 4(c)(8) and 4(j) of the BHC Act (12 U.S.C. §§ 1843(c)(8) and 1843(j)) and section 225.24 of the Board's Regulation Y (12 C.F.R. 225.24) to acquire Mor-gan's subsidiary savings association, J.P. Morgan FSB, Palm Beach, Florida ("Morgan FSB").
Chase also has filed notices under section 4(c)(13) of the BHC Act (12 U.S.C. § 1843(c)(13)), sections 25 and 25A of the Federal Reserve Act (12 U.S.C. §§ 601 et seq. and 611 et seq.), and the Board's Regulation K (12 C.F.R. 211) to acquire the Edge Act subsidiary and foreign operations of Morgan Guaranty.
Notice of the proposal, affording interested persons an opportunity to submit comments, has been published (64 Federal Register 36,875 (2000)). As required by the Bank Merger Act, reports on the competitive effects of the merger were requested from the United States Attorney General, Federal Deposit Insurance Corporation, and the Office of the Comptroller of the Currency. The time for filing comments has expired, and the Board has considered the proposal and all comments received in light of the factors set forth in sections 3 and 4 of the BHC Act, the Bank Merger Act and the Federal Reserve Act.
Chase, with total consolidated assets of $396 billion, is the third largest commercial banking organization in the United States, controlling approximately 6 percent of the
1. On consummation of the proposal, Chase would change its name to J.R Morgan Chase & Co. Chase and Morgan also have each requested the Board's approval to hold and exercise an option to acquire up to 19.9 percent of the other's voting shares. These options would expire on consummation of the proposal.
2. The branches would be established at: 60 Wall Street, New York, New York; 522 Fifth Avenue, New York, New York; 500 Stanton Avenue, Newark, Delaware.
total assets of insured commercial banks in the United States ("total banking assets").3 Chase is the largest bank-ing organization in New York, controlling deposits of $98 billion, representing approximately 23.2 percent of total deposits in depository institutions in the state ("state deposits").4 Chase also operates banks in California, Con-necticut, Delaware, Florida, New Jersey, and Texas.
Morgan, with total consolidated assets of $266.3 billion, is the fifth largest commercial banking organization in the United States, controlling approximately 4 percent of total banking assets. It is the 15th largest banking organization in New York, controlling deposits of $7.9 billion, repre-senting approximately 1.9 percent of state deposits. Mor-gan also operates insured depository institutions in Dela-ware and Florida.
After consummation of the proposal, Chase would re-main the third largest commercial banking organization in the United States, with total consolidated assets of $662.3 billion, representing approximately 10 percent of total banking assets. Chase would continue to operate insured depository institutions in the states where it cur-rently operates.
Interstate Analysis
Section 3(d) of the BHC Act allows the Board to approve an application by a bank holding company to acquire control of a bank located in a state other than the home state of the bank holding company if certain conditions are met. For purposes of the BHC Act, the home state of Chase is New York.5 As part of the proposal, Chase proposes to acquire a bank in Delaware.6 All the conditions for an interstate acquisition enumerated in section 3(d) are met in this case.7 In light of all the facts of record, the Board is permitted to approve the proposal under section 3(d) of the BHC Act.
Competitive Factors
The Bank Merger Act and section 3 of the BHC Act prohibit the Board from approving a proposal that would
3. Asset data are as of June 30, 2000. All other banking data are as of June 30, 1999, unless otherwise noted, and have been adjusted to account for mergers consummated since that date.
4. Unless otherwise noted, depository institutions include commer-cial banks, savings banks, and savings associations.
5. A bank holding company's home state is the state in which the total deposits of all banking subsidiaries of the company were the largest on July 1, 1966, or the date on which the company became a bank holding company, whichever is later. 12 U.S.C. § 1841(o)(4)(C).
6. For purposes of section 3(d) of the BHC Act, the Board considers a bank to be located in the states in which the bank is chartered, headquartered, or operates a branch.
7. 12 U.S.C. §§ 1842(d)(1)(A) and (B) and 1842(d)(2)(A) and (B). Chase meets the capital and managerial requirements established under applicable law. On consummation, Chase would control less than 10 percent of the total amount of deposits of insured depository institutions in the United States and less than 30 percent of state deposits in Delaware. See 5 Del. Code Ann. tit. 5 § 795G (2000). All other requirements under section 3(d) of the BHC Act also would be met on consummation of the proposal.
Digitized for FRASER http://fraser.stlouisfed.org/ Federal Reserve Bank of St. Louis

78 Federal Reserve Bulletin • February 2001
result in a monopoly or be in furtherance of a monopoly. These acts also prohibit the Board from approving a pro-posal that would substantially lessen competition in any relevant banking market unless the anticompetitive effects of the proposal in that banking market are clearly out-weighed in the public interest by the probable effect of the proposal in meeting the convenience and needs of the community to be served.8
In reviewing the competitive effects of the proposal, the Board has reviewed carefully comments submitted by In-ner City Press/Community on the Move, Bronx, New York ("ICP"). ICP contends that the merger would reduce com-petition for banking services in several product markets and result in higher fees and reduced customer conve-nience. ICP also challenges the Board's use of the cluster of banking services to review the competitive effects of the proposal.
To review the effect of a particular transaction on compe-tition, it is necessary to designate the area of effective competition between the parties, which the courts have held is decided by reference to the relevant "line of com-merce" or a product market and a geographic market. The Board and the courts have recognized consistently that the appropriate product market for analyzing the competitive effects of bank mergers and acquisitions is the cluster of products (various kinds of credit) and services (such as checking accounts and trust administration) offered by banking institutions.9 According to the Supreme Court, the cluster of banking products and services facilitates conve-nient access to these products and services, and this conve-nience vests the cluster with economic significance beyond the individual products and services that constitute the cluster.10 Several studies support the conclusion that both businesses and households continue to seek this cluster of products and services.11 Consistent with these precedents and studies, and on the basis of all the facts of record in this case, the Board concludes that the cluster of banking products and services represents the appropriate product market for analyzing the competitive effects of the propos-al.12
8. See 12 U.S.C. §§ 1828(c)(5) and 1842(c). 9. See Chemical Banking Corporation 82 Federal Reserve Bulletin
239 (1996) and the cases and studies cited therein. The Supreme Court has emphasized that it is the cluster of products and services that, as a matter of trade reality, makes banking a distinct line of commerce. See United States v. Philadelphia National Bank, 374 U.S. 321, 357 (1963); accord, United States v. Connecticut National Bank, 418 U.S. 656 (1974); United States v. Phillipsburg National Bank, 399 U.S. 350 (1969) ("Phillipsburg National").
10. See Phillipsburg National 399 U.S. at 361. 11. Elliehausen and Wolken, Banking Markets and the Use of
Financial Services by Households, 78 Federal Reserve Bulletin 169 (1992); Elliehausen and Wolken, Banking Markets and the Use of Financial Services by Small- and Medium-Sized Businesses, 76 Fed-eral Reserve Bulletin 726 (1990).
12. ICP asserts that after the enactment of the Gramm-Leach-Bliley Act (Pub. L. No. 106-102, 113 Stat. 1338 (1999)), the cluster ap-proach no longer is appropriate, and that certain products and services provided by Morgan Guaranty, including syndicated lending, precious metal trading, debt underwriting, and foreign currency exchange, should be analyzed as separate product markets. Under the Gramm-
Chase and Morgan compete directly in the Metropolitan New York/New Jersey banking market ("New York bank-ing market"); the West Palm Beach, Florida, banking market ("West Palm Beach banking market"); and the Wilmington, Delaware, banking market ("Wilmington banking market").13 The Board has reviewed carefully the competitive effects of the proposal in each of the banking markets in light of all the facts of record, including the number of competitors that would remain in the markets, the relative shares of total deposits in depository institu-tions in the markets ("market deposits") controlled by Chase and Morgan,14 the concentration level of market deposits and the increase in this level as measured by the Herfindahl-Hirschman Index ("HHI") under the Depart-
Leach-Bliley Act, financial holding companies and financial subsidiar-ies of banks may, under certain circumstances, engage in a broader range of nonbanking activities than permitted previously. The passage of the act, however, does not suggest that the cluster of banking products and services no longer is the appropriate line of commerce for analyzing the competitive effect of bank affiliations. ICP also argues that the elimination of Morgan Guaranty as a counter-party or participant in the markets for specific products and services listed above would impair significantly the operations of these markets. Even if the approach advocated by ICP were adopted, the Board notes that these activities are conducted on a national or global scale, with numerous other large institutions and sophisticated participants.
13. In addition to considering the product markets affected by a banking merger, the Board also analyzes the effects in a geographic market. See e.g., Sunwest Financial Services, Inc., 73 Federal Reserve Bulletin 463 (1987); Pikeville National Corporation, 71 Federal Re-serve Bulletin 240 (1985); Wyoming Bancorporation, 68 Federal Reserve Bulletin 313 (1982), aff'd 729 F.2d 687 (10th Cir. 1984).
The New York banking market is defined as New York City; Nassau, Orange, Putnam, Rockland, Suffolk, Sullivan, and Westches-ter Counties in New York; Bergen, Essex, Hudson, Hunterdon, Mid-dlesex, Monmouth, Morris, Ocean, Passaic, Somerset, Sussex, Union, Warren, and a portion of Mercer Counties in New Jersey; Pike County in Pennsylvania; and portions of Fairfield and Litchfield Counties in Connecticut.
The West Palm Beach banking market is defined as all of Palm Beach County east of Loxahatchee and the towns of Indiantown and Hobe Sound in Martin County, all in Florida.
The Wilmington banking market is defined as New Castle County, Delaware, and Cecil County, Maryland.
14. Except as noted, market share data are as of June 30, 1999, and are based on calculations that include the deposits of thrift institutions, which include savings banks and savings associations, weighted at 50 percent. The Board has indicated previously that thrift institutions have become, or have the potential to become, significant competitors of commercial banks. See, e.g., Midwest Financial Group, 75 Federal Reserve Bulletin 386 (1989); National City Corporation, 70 Federal Reserve Bulletin 743 (1984). Thus, the Board regularly has included thrift deposits in the calculation of market share on a 50-percent weighted basis. See, e.g., First Hawaiian, Inc., 77 Federal Reserve Bulletin 52 (1991). Because the deposits of Morgan FSB are con-trolled by and would continue to be controlled by a bank holding company, these deposits are included at 100 percent in the calculation of Chase's market share in the West Palm Beach banking market. See Norwest Corporation, 78 Federal Reserve Bulletin 452 (1992); First Banks, Inc., 76 Federal Reserve Bulletin 669, 670 n.9 (1990).
Digitized for FRASER http://fraser.stlouisfed.org/ Federal Reserve Bank of St. Louis

Legal Developments 79
ment of Justice Merger Guidelines ("DOJ Guidelines"),15
and other characteristics and measures of the markets. Chase operates the largest depository institution in the
New York banking market, controlling deposits of $98 billion, representing approximately 22.7 percent of market deposits. Morgan controls the 12th largest deposi-tory institution in the market, with deposits of $8 billion, representing approximately 1.9 percent of market deposits. On consummation of the proposal, Chase would continue to operate the largest depository institution in the market, controlling deposits of $106 billion, representing approxi-mately 24.6 percent of market deposits. The New York banking market would remain unconcentrated as measured by the HHI, which would increase 84 points to 886, with numerous other competitors.
Chase operates the 40th largest depository institution in the West Palm Beach banking market, controlling deposits of $20.3 million, representing less than 1 percent of market deposits. Morgan controls the 29th largest depository insti-tution in the market, with deposits of $55.5 million, also representing less than 1 percent of market deposits. On consummation of the proposal, Chase would become the 25th largest depository institution in the West Palm Beach banking market, controlling deposits of $75.8 million, rep-resenting less than 1 percent of market deposits. The HHI would remain at 1137 points, and the market would con-tinue to be moderately concentrated, with numerous other competitors remaining.
Chase operates the second largest depository institution in the Wilmington banking market, controlling deposits of $6.1 billion, representing approximately 12.9 percent of market deposits.16 Morgan controls the sixth largest depos-itory institution in the market, with deposits of $1.9 billion, representing approximately 4 percent of market deposits. On consummation of the proposal, Chase would continue to operate the second largest depository institution in the Wilmington banking market, controlling deposits of
15. Under the DOJ Guidelines, 49 Federal Register 26,823 (June 29, 1984), a market is considered unconcentrated if the post-merger HHI is below 1000, moderately concentrated if the post-merger HHI is between 1000 and 1800, and highly concentrated if the post-merger HHI is above 1800. The Department of Justice has informed the Board that a bank merger or acquisition generally will not be challenged (in the absence of other factors indicating anticom-petitive effects) unless the post-merger HHI is at least 1800 and the merger increases the HHI by more than 200 points. The Department of Justice has stated that the higher than normal HHI thresholds for screening bank mergers for anticompetitive effects implicitly recog-nize the competitive effects of limited-purpose lenders and other nondepository financial institutions.
16. Deposit data for the Wilmington banking market are as of June 30, 2000, and include preliminary summary of deposit data. ICP has asserted that Chase and Morgan manipulated their deposit data for June 30, 2000, to conceal their competitive presence in the Wilming-ton banking market. In reviewing competitive effects and the changes in deposit data in this market over the past year, the Board has considered the structure of market operations, types of specific institu-tions, and the specific business practices of Chase and Morgan and changes in the market data for other competitors in the market. Based on these considerations, the Board has concluded that the 2000 data most accurately reflect the effects of the transaction on this market.
$8 billion, representing approximately 16.9 percent of market deposits. The HHI would increase 104 points to 2259, and numerous other competitors would remain in the market.
In addition, the Wilmington banking market is attractive for entry by out-of-market competitors. From 1997 to 2000, market deposits increased by 47.7 percent, compared with the national rate of increase of 34.1 percent. Per capita income in the market is $18,156, compared with the na-tional per capita income of $15,555. From June 1998 to June 2000, five banking organizations entered the market de novo and two banking organizations entered the market by acquisition.
The Department of Justice also has considered the com-petitive effects of the proposal and has determined that it would not have a significantly adverse effect on competi-tion in any relevant banking market. The Federal Deposit Insurance Corporation ("FDIC") and the Office of the Comptroller of the Currency ("OCC") have been afforded an opportunity to comment on the competitive aspects of the proposal and have not objected to consummation of the proposal.
Based on all the facts of record, and for the reasons discussed in the order, the Board concludes that consum-mation of the proposal would not be likely to result in a significantly adverse effect on competition or on the con-centration of banking resources in any of the banking markets in which Chase and Morgan compete directly or in any other relevant banking market. Accordingly, the Board has determined that the competitive effects in this case are consistent with approval of the proposal.
Financial, Managerial, and Other Supervisory Factors
The Bank Merger Act and section 3 of the BHC Act also require that the Board consider the financial and manage-rial resources and future prospects of the organizations involved in a proposal as well as certain other supervisory factors. The Board has carefully considered the financial and managerial resources and future prospects of Chase, Morgan, and their respective subsidiary banks and other supervisory factors in light of all the facts of record, including comments received on the proposal, reports of examination and other confidential supervisory informa-tion assessing the financial and managerial resources of the organizations, and financial information provided by Chase.
In evaluating financial factors in expansion proposals by banking organizations, the Board consistently has consid-ered capital adequacy to be especially important. The Board notes that Chase and Morgan and their subsidiary depository institutions are well capitalized, as defined in the relevant regulations of the federal banking agencies, and would remain well capitalized on consummation of the proposal.17 The proposal is structured as a stock-for-stock
17. ICP expresses concern about press reports of earnings volatility at a Chase subsidiary that makes venture capital investments, Chase
Digitized for FRASER http://fraser.stlouisfed.org/ Federal Reserve Bank of St. Louis

80 Federal Reserve Bulletin • February 2001
transaction and would not increase the debt service require-ments of the combined organization. The proposal also would result in a more diversified client base and more diversified revenue sources for the combined organization. In addition, Chase expects to increase net income as a result of significant cost reductions as well as projected increases in revenue.18
The Board also has taken account of the managerial resources of Chase and Morgan and the federal financial supervisory agencies' examination records in supervising these organizations. All the subsidiary depository institu-tions of Chase and Morgan are well managed. Chase previously has integrated acquired organizations in a satis-factory manner and has remained well managed. Although Chase and Morgan continue to assess the appropriate risk management systems and procedures that would support certain individual lines of business, Chase expects to have an integrated risk management function, including credit risk management, in place and operating at the time of consummation of the proposal.19
Capital Partners, New York, New York ("Chase Capital"). The Board has considered Chase Capital's activities and earnings record in evaluating Chase's financial resources.
18. ICP also contends that the combined organization would be able to exert an inappropriate level of influence on global financial markets and foreign nations thereby resulting in an institution too large for the Board and other government agencies to regulate. The Board and the other financial supervisory agencies have extensive experience super-vising Chase and Morgan and their subsidiary depository institutions as well as other large banking organizations. See, e.g., Travelers Group Inc., 84 Federal Reserve Bulletin 985 (1998); NationsBank Corporation, 84 Federal Reserve Bulletin 858 (1998). Building on this experience, the Board has developed a supervisory system that will permit the Board to monitor and supervise the organization effectively. As previously noted, section 3 of the BHC Act prohibits the Board from approving a transaction if the resulting organization would control more than 10 percent of the insured deposits in the country. After consummation, Chase would control approximately 3.7 percent of U.S. insured deposits.
19. ICP notes press reports stating that: (i) a certain individual with alleged connections to parties in-
volved in a suspected money laundering enterprise maintained an account at Chase Bank; and
(ii) certain Chase credit card holders were erroneously billed by a telemarketer not related to Chase. ICP has provided no facts that indicate any involvement by Chase or Chase Bank employ-ees or management in the alleged money laundering activities or erroneous billing.
ICP has expressed concern about Chase's management on the basis of press reports that Chase held less than 5 percent of the voting shares of Nichiei Co., Tokyo, Japan ("Nichiei"), a Japanese lending company at which an employee violated Japanese criminal law by engaging in certain collection practices. Chase has stated that it has never owned any interest in Nichiei. There is no evidence that Chase controls, exercises a controlling influence over, or participates in any manner in the management of Nichiei. See also 12 C.F.R. 225.31(e)(1) and 225.171.
ICP also has questioned the managerial resources of Chase and Morgan on the basis of press reports that Morgan paid no federal corporate income tax in 1998, that Chase received government assis-tance to retain jobs in New York City but subsequently moved those positions outside the city, and that Chase and Morgan helped to finance various activities and projects worldwide that might damage the environment particularly in predominantly minority areas. ICP's contentions are unsubstantiated and contain no allegations of illegality
ICP expresses concern about certain activities of Chase during World War II. ICP cites press reports contending that Chase allegedly collaborated with the German govern-ment to confiscate and liquidate Jewish assets and to funnel French assets to Germany. ICP has urged the Board to investigate these alleged activities and produce a full ac-counting of any assets Chase has retained wrongfully.20
Chase has provided information about its eiforts to ad-dress the alleged actions of its predecessors. Chase repre-sents that Chase Bank has conducted a three-year investiga-tion into the World War II activities of its predecessor bank. Through this investigation, Chase has determined that during World War II, the German government appro-priated certain accounts in the Paris branch of a Chase predecessor bank, and that the holders of some of those accounts have applied for restitution. Chase and the World Jewish Congress have retained jointly an independent counsel to review Chase's self-assessment.
The Board has carefully reviewed the issues presented by ICP in light of all the facts of record and taken into consideration the Board's authority under federal banking laws. The Board has taken into account, in particular, the eiforts of Chase to investigate and address these matters and the ongoing eiforts of current management to elfect a resolution. The Board also has taken into account that many of the matters raised by ICP involve subjects of public interest that are not within the Board's limited jurisdiction to adjudicate or do not relate to the factors that the Board is required to consider when reviewing an appli-cation or notice under the BHC Act or the Bank Merger Act.21
Based on all the facts of record the Board concludes that considerations relating to the financial and managerial re-sources and future prospects of the organizations involved are consistent with approval, as are the other supervisory
or other action that would affect the safety and soundness of the institutions. These matters also raise issues that are outside the limited statutory factors that the Board is authorized to consider when review-ing an application under the BHC Act. See Western Bancshares, Inc. v. Board of Governors, 480 F.2d 749 (10th Cir. 1973). The Board also notes that the Department of Justice and the Environmental Protection Agency have jurisdiction, to the extent that the actions occur in the United States, to determine whether companies are in compliance with federal environmental protection statutes and regulations.
20. ICP also has expressed concern about the activities of two predecessor banks of Chase that allegedly were involved in the mid-19th century in servicing life insurance policies sold on the lives of African-American slaves in the United States. In connection with these allegations, Chase states that it has investigated its activities and has no record indicating that it had any role in providing or servicing insurance on slaves. Chase represents that it will continue to investi-gate the matter by researching sources external to Chase.
21. The factors that the Board considers when reviewing an applica-tion or notice under the BHC Act and the Bank Merger Act are necessarily limited by the acts. Moreover, the Board has noted previ-ously that courts have held that the Board's limited jurisdiction to review applications and notices under the BHC Act does not authorize the Board to adjudicate disputes involving an applicant that do not arise under laws administered and enforced by the Board. See Deut-sche Bank AG, 85 Federal Reserve Bulletin 509 (1999); Union Bank of Switzerland, 84 Federal Reserve Bulletin 684 (1998).
Digitized for FRASER http://fraser.stlouisfed.org/ Federal Reserve Bank of St. Louis

Legal Developments 81
factors that the Board must consider under the Bank Merger Act and section 3 of the BHC Act.22
Convenience and Needs Factor
In acting on a proposal under section 3 of the BHC Act, the Board is required to consider the effect of the proposal on the convenience and needs of the communities to be served. The Board has long held that consideration of the convenience and needs factor includes a review of the records of the relevant depository institutions under the Community Reinvestment Act (12 U.S.C. § 2901 et seq.) ("CRA"). Accordingly, the Board has carefully considered the effect of the proposed merger on the convenience and needs of the communities to be served and the CRA records of performance of the institutions involved in light of all the facts of record, including comments received on the proposal.
Three parties submitted written comments on aspects of the proposal and, in particular, the effect of the proposal on the convenience and needs of the affected communities and the CRA performance records of the depository institutions involved. ICP has submitted comments opposing the pro-posal and generally contending that through a series of mergers over the past decade, Chase and its predecessor institutions have withdrawn from the business of retail banking and concentrated on expanding their wholesale banking services. ICP states that after consummating previ-ous mergers, Chase closed retail branches and abandoned communities, often in low- and moderate-income ("LMI") or predominantly minority areas. ICP further alleges that Chase underserves LMI and minority mortgage borrowers and other borrowers seeking loans on properties in LMI areas. ICP also contends, based in part on its analysis of data filed under the Home Mortgage Disclosure Act (12 U.S.C. § 2801 et seq.) ("HMDA"), that Chase and Morgan have violated the fair lending laws. The Greater Rochester Community Reinvestment Coalition, Rochester, New York ("GRCRC") has submitted comments that com-mend and criticize Chase's community reinvestment perfor-mance in Rochester. The Association for Neighborhood & Housing Development, Inc., New York, New York ("ANHD"), has provided favorable comments on the com-munity reinvestment activities of Chase and Morgan, and in particular, the institutions' community development lending, and their lending, investments, technical assis-tance, and other forms of support to community develop-ment and nonprofit organizations. ANHD also has ex-pressed concern that the community reinvestment products and programs of Chase and Morgan would cease to be
22. ICP notes that Chase and Morgan are defendants in several pending lawsuits. In one of these cases, which challenged the payment crediting practices of Chase USA, the parties recently reached a monetary settlement that also requires Chase to modify its practices. The other cases have been dismissed or are at preliminary pleading or discovery stages, and there has been no determination of liability or damages in these cases. In each of the cases, the courts appear to have adequate jurisdiction and authority to provide relief to plaintiffs, if warranted.
expanded or be reduced after consummation of the pro-posal.
A. CRA Performance Examinations
As provided in the CRA, the Board has evaluated the convenience and needs factor in light of examinations of the CRA performance records of the relevant depository institutions by the appropriate federal financial supervisory agency.23 Chase's lead bank, Chase Bank, which accounts for approximately 80 percent of the total consolidated assets of Chase, received an "outstanding" rating at its most recent CRA examination by the Federal Reserve Bank of New York ("FRBNY"), as of July 1999. All Chase's other subsidiary banks also received "outstand-ing" or "satisfactory" ratings at the most recent examina-tions of their CRA performance.24 Morgan's only subsid-iary bank, Morgan Guaranty, received an "outstanding" rating from the FRBNY at its most recent examination, as of January 1999. Morgan's subsidiary thrift, Morgan FSB, received a "satisfactory" rating for CRA performance from its primary federal financial supervisory agency, the Office of Thrift Supervision ("OTS"), as of November 1998. Examiners found no evidence of prohibited discrim-ination or other illegal credit practices at any of the insured depository institutions involved in this proposal and found no violations of substantive provisions of the fair lending laws.
Chase has indicated that it expects to continue to expand and improve the products and services of Morgan and that the CRA-related programs and activities of the combined organization would be based on the current programs of the two individual organizations. Accordingly, the Board has considered carefully the CRA performance records of Chase and Morgan in evaluating the proposal.
B. CRA Performance Record of Chase's Subsidiaries
1. Chase Bank Overview. Chase Bank received an examination rating of "outstanding" for its lending activities. Examiners com-mended the bank for its response to the credit needs of its
23. ICP has questioned the reliability of CRA examinations in measuring the performance of a depository institution in meeting the credit needs of its community. The federal financial supervisory agencies have stated that an institution's most recent CRA perfor-mance evaluation is an important and often controlling factor in the consideration of an institution's CRA record because it represents a detailed evaluation of the institution's overall record of performance under the CRA by its appropriate federal financial supervisory agency. 65 Federal Register 25,088 and 25,107 (2000).
24. The OCC has examined the CRA performance of the following Chase subsidiary banks: Chase Manhattan Bank and Trust Co., N.A., Los Angeles, California, rated "outstanding," as of October 1999; Chase-USA, rated "outstanding," as of May 1999; The Chase Man-hattan Private Bank, N.A., Tampa, Florida, rated "outstanding," as of October 1999; and The Chase Bank of Texas - San Angelo, National Association, Texas (then named Texas Commerce Bank - San An-gelo), rated "satisfactory," as of August 1996.
Digitized for FRASER http://fraser.stlouisfed.org/ Federal Reserve Bank of St. Louis
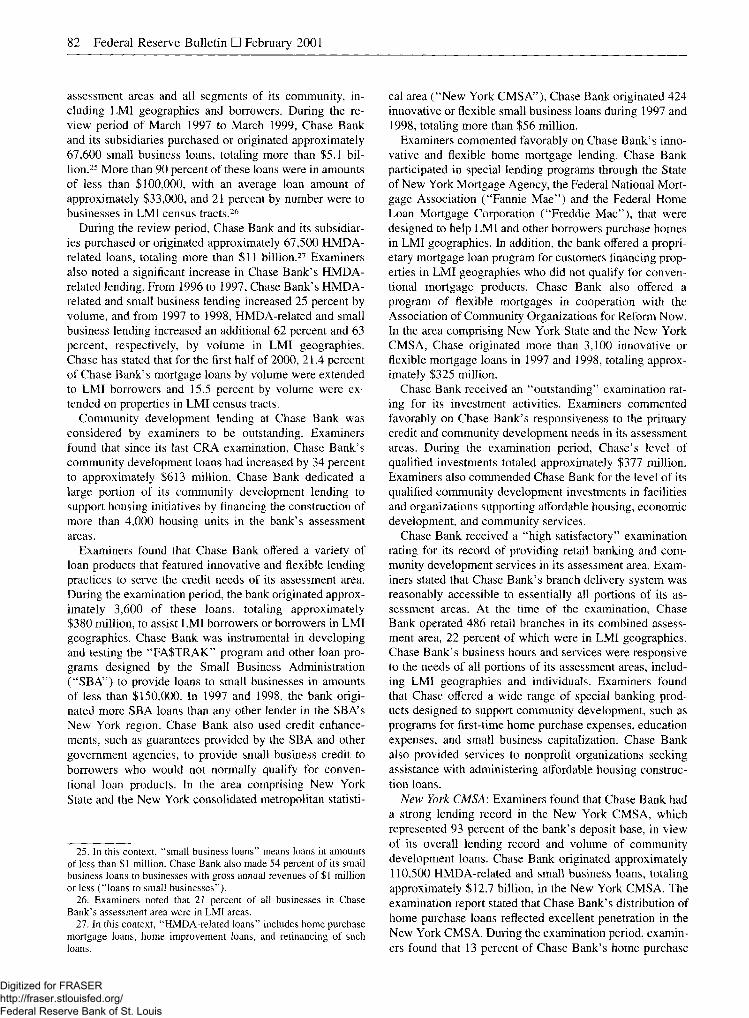
82 Federal Reserve Bulletin • February 2001
assessment areas and all segments of its community, in-cluding LMI geographies and borrowers. During the re-view period of March 1997 to March 1999, Chase Bank and its subsidiaries purchased or originated approximately 67,600 small business loans, totaling more than $5.1 bil-lion.25 More than 90 percent of these loans were in amounts of less than $100,000, with an average loan amount of approximately $33,000, and 21 percent by number were to businesses in LMI census tracts.26
During the review period, Chase Bank and its subsidiar-ies purchased or originated approximately 67,500 HMDA-related loans, totaling more than $11 billion.27 Examiners also noted a significant increase in Chase Bank's HMDA-related lending. From 1996 to 1997, Chase Bank's HMDA-related and small business lending increased 25 percent by volume, and from 1997 to 1998, HMDA-related and small business lending increased an additional 62 percent and 63 percent, respectively, by volume in LMI geographies. Chase has stated that for the first half of 2000, 21.4 percent of Chase Bank's mortgage loans by volume were extended to LMI borrowers and 15.5 percent by volume were ex-tended on properties in LMI census tracts.
Community development lending at Chase Bank was considered by examiners to be outstanding. Examiners found that since its last CRA examination, Chase Bank's community development loans had increased by 34 percent to approximately $613 million. Chase Bank dedicated a large portion of its community development lending to support housing initiatives by financing the construction of more than 4,000 housing units in the bank's assessment areas.
Examiners found that Chase Bank offered a variety of loan products that featured innovative and flexible lending practices to serve the credit needs of its assessment area. During the examination period, the bank originated approx-imately 3,600 of these loans, totaling approximately $380 million, to assist LMI borrowers or borrowers in LMI geographies. Chase Bank was instrumental in developing and testing the "FA$TRAK" program and other loan pro-grams designed by the Small Business Administration ("SBA") to provide loans to small businesses in amounts of less than $150,000. In 1997 and 1998, the bank origi-nated more SBA loans than any other lender in the SBA's New York region. Chase Bank also used credit enhance-ments, such as guarantees provided by the SBA and other government agencies, to provide small business credit to borrowers who would not normally qualify for conven-tional loan products. In the area comprising New York State and the New York consolidated metropolitan statisti-
25. In this context, "small business loans" means loans in amounts of less than $1 million. Chase Bank also made 54 percent of its small business loans to businesses with gross annual revenues of $ 1 million or less ("loans to small businesses").
26. Examiners noted that 21 percent of all businesses in Chase Bank's assessment area were in LMI areas.
27. In this context, "HMDA-related loans" includes home purchase mortgage loans, home improvement loans, and refinancing of such loans.
cal area ("New York CMS A"), Chase Bank originated 424 innovative or flexible small business loans during 1997 and 1998, totaling more than $56 million.
Examiners commented favorably on Chase Bank's inno-vative and flexible home mortgage lending. Chase Bank participated in special lending programs through the State of New York Mortgage Agency, the Federal National Mort-gage Association ("Fannie Mae") and the Federal Home Loan Mortgage Corporation ("Freddie Mac"), that were designed to help LMI and other borrowers purchase homes in LMI geographies. In addition, the bank offered a propri-etary mortgage loan program for customers financing prop-erties in LMI geographies who did not qualify for conven-tional mortgage products. Chase Bank also offered a program of flexible mortgages in cooperation with the Association of Community Organizations for Reform Now. In the area comprising New York State and the New York CMS A, Chase originated more than 3,100 innovative or flexible mortgage loans in 1997 and 1998, totaling approx-imately $325 million.
Chase Bank received an "outstanding" examination rat-ing for its investment activities. Examiners commented favorably on Chase Bank's responsiveness to the primary credit and community development needs in its assessment areas. During the examination period, Chase's level of qualified investments totaled approximately $377 million. Examiners also commended Chase Bank for the level of its qualified community development investments in facilities and organizations supporting affordable housing, economic development, and community services.
Chase Bank received a "high satisfactory" examination rating for its record of providing retail banking and com-munity development services in its assessment area. Exam-iners stated that Chase Bank's branch delivery system was reasonably accessible to essentially all portions of its as-sessment areas. At the time of the examination, Chase Bank operated 486 retail branches in its combined assess-ment area, 22 percent of which were in LMI geographies. Chase Bank's business hours and services were responsive to the needs of all portions of its assessment areas, includ-ing LMI geographies and individuals. Examiners found that Chase offered a wide range of special banking prod-ucts designed to support community development, such as programs for first-time home purchase expenses, education expenses, and small business capitalization. Chase Bank also provided services to nonprofit organizations seeking assistance with administering affordable housing construc-tion loans.
New York CMS A: Examiners found that Chase Bank had a strong lending record in the New York CMSA, which represented 93 percent of the bank's deposit base, in view of its overall lending record and volume of community development loans. Chase Bank originated approximately 110,500 HMDA-related and small business loans, totaling approximately $12.7 billion, in the New York CMSA. The examination report stated that Chase Bank's distribution of home purchase loans reflected excellent penetration in the New York CMSA. During the examination period, examin-ers found that 13 percent of Chase Bank's home purchase
Digitized for FRASER http://fraser.stlouisfed.org/ Federal Reserve Bank of St. Louis

Legal Developments 83
and refinance loans were in LMI geographies, where 12 percent of the housing units were owner occupied. Furthermore, the examination report observed that 21 per-cent of Chase Bank's small business loans were in LMI geographies, which coincided with the percentage of busi-nesses in LMI geographies. Examiners noted a significant increase in Chase Bank's small business and HMDA-related lending. From 1996 to 1997, the number of small business loans increased 345 percent, with a 275-percent increase in small business loans in LMI geographies. Ex-aminers also specifically noted the bank's excellent perfor-mance in LMI geographies. From 1997 to 1998, HMDA-related lending increased 63 percent overall and 68 percent in LMI geographies.
Examiners noted that Chase Bank participated in com-plex and innovative community development lending pro-grams, including a loan pool established by wholesale and foreign banks in New York City. ICP contends, however, that Chase Bank's community reinvestment efforts primar-ily support the construction of housing that LMI persons cannot afford. In the New York CMS A, Chase Bank had approximately $520 million in outstanding community de-velopment loans during the examination period, which provided financing for more than 2,700 new housing units. Chase Bank also states that it has continued to engage in community development lending. According to Chase Bank, it closed a loan for approximately $6.9 million loan in 2000 to help finance the rehabilitation of 200 apartment units in the Bronx, the majority of whose residents re-ceived public housing assistance. Furthermore, Chase has stated that in August 1999, it provided a $1.75 million loan to rehabilitate apartment units for LMI veterans in Queens.
The examination report characterized Chase Bank's level of qualified investments in the New York CMSA as strong. Chase Bank's qualified investments totaled approximately $365 million at the time of the examination. Ninety-one percent, or $344 million, of Chase Bank's investments were directed to agencies engaged in affordable housing. Chase Bank also participated in innovative qualified invest-ments such as Low Income Housing Tax Credits ("LIHTC"), which accounted for approximately 77 per-cent of total qualified investments.
Examiners determined that Chase Bank's delivery sys-tem was reasonably accessible to essentially all portions of the New York CMSA assessment area. Chase Bank oper-ated 406 branches in the New York CMSA, including 87 branches in LMI geographies. The examination report also stated that Chase Bank employed multiple alternative de-livery systems that were generally effective in its enhanc-ing the distribution of banking services throughout the New York CMSA, including a network of 127 stand-alone ATM locations, 33 percent of which were in LMI geogra-phies. In certain branches, Chase Bank offered payroll check cashing for non-customer employees of Chase's corporate clients. Examiners found that Chase Bank also provided community development services that included seminars designed to help build the credit skills of commu-nity development organizations. In addition, Chase Bank also operated three Business Resource Centers that pro-
vided business development, financing, and planning assis-tance for small business owners.
New York State'. In Chase Bank's assessment areas in New York State, which excluded the New York CMSA, examiners found that Chase exhibited good responsiveness to the credit needs of its assessment area. During the examination period, Chase Bank reported 9,849 loans total-ing approximately $798 million, of which 64 percent were small business loans. Furthermore, the examination report noted that small business lending significantly increased, especially in LMI geographies. From 1996 to 1997, small business lending increased 397 percent. Overall, HMDA-related lending increased 18 percent from 1996 to 1997 and 45 percent from 1997 to 1998. Examiners also charac-terized Chase Bank's loan activity in all portions of its assessment area, including LMI geographies, as excellent. During the examination period, Chase Bank reported 362 home purchase or refinance loans in LMI geographies. Moreover, 25 percent of Chase Bank's small business loans were in LMI geographies. Examiners also found that the distribution of loans among borrowers of different income levels was excellent. More than 23 percent of Chase Bank's home purchase and finance loans were to LMI borrowers. Chase Bank also had an excellent record of lending to businesses of different sizes. Eighty-five percent of Chase Bank's small business loans were in amounts of $100,000 or less. Furthermore, approximately 52 percent of Chase Bank's small business loans were to small businesses.
A large portion of Chase Bank's HMDA-reportable lend-ing and small business lending in upstate New York was in the Rochester metropolitan statistical area ("Rochester MSA"). During the examination period, Chase Bank re-ported 1,400 home purchase and refinancing loans and 2,212 small business loans in the portion of the Rochester MSA in its assessment area. Examiners noted that Chase exhibited excellent geographic distribution of small busi-ness loans. Approximately 23 percent of Chase Bank's small business loans were in LMI geographies. This level of lending exceeded the percentage of loans in LMI geog-raphies by small business loan reporters in the aggregate. Examiners also noted as excellent Chase Bank's perfor-mance in its distribution of small business loans by bor-rower income. Eighty-four percent of all Chase Bank's small business loans were in amounts of $100,000 or less, with an average total amount of approximately $33,000. Moreover, 53 percent of total small business loans were to small businesses.
GRCRC expresses concern about Chase Bank's home lending record among minority and LMI individuals and in predominantly minority and LMI census tracts in Roches-ter and about Chase Bank's record of attracting, counsel-ing, and retaining potential minority and LMI applicants for home mortgages. The examination report, however, characterized Chase Bank's distribution of home purchase and refinance loans by borrower income as good. During the examination period, 29 percent of Chase Bank's home purchase and refinance loans were to LMI borrowers. Furthermore, Chase Bank also demonstrated a strong per-
Digitized for FRASER http://fraser.stlouisfed.org/ Federal Reserve Bank of St. Louis
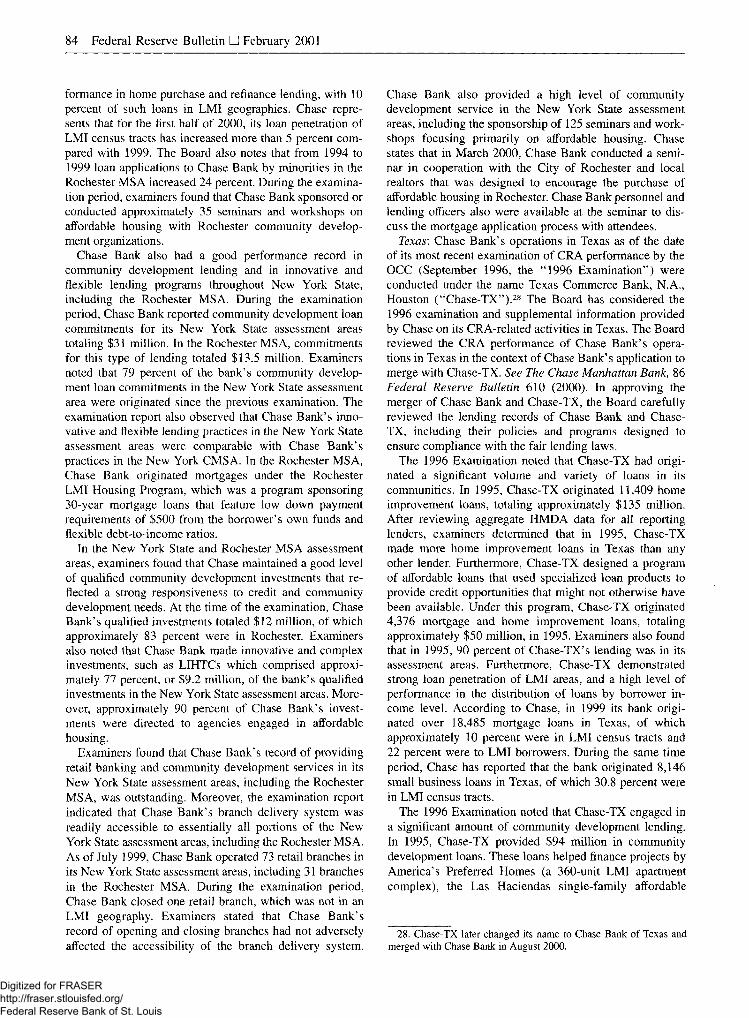
84 Federal Reserve Bulletin • February 2001
formance in home purchase and refinance lending, with 10 percent of such loans in LMI geographies. Chase repre-sents that for the first half of 2000, its loan penetration of LMI census tracts has increased more than 5 percent com-pared with 1999. The Board also notes that from 1994 to 1999 loan applications to Chase Bank by minorities in the Rochester MSA increased 24 percent. During the examina-tion period, examiners found that Chase Bank sponsored or conducted approximately 35 seminars and workshops on affordable housing with Rochester community develop-ment organizations.
Chase Bank also had a good performance record in community development lending and in innovative and flexible lending programs throughout New York State, including the Rochester MSA. During the examination period, Chase Bank reported community development loan commitments for its New York State assessment areas totaling $31 million. In the Rochester MSA, commitments for this type of lending totaled $13.5 million. Examiners noted that 79 percent of the bank's community develop-ment loan commitments in the New York State assessment area were originated since the previous examination. The examination report also observed that Chase Bank's inno-vative and flexible lending practices in the New York State assessment areas were comparable with Chase Bank's practices in the New York CMSA. In the Rochester MSA, Chase Bank originated mortgages under the Rochester LMI Housing Program, which was a program sponsoring 30-year mortgage loans that feature low down payment requirements of $500 from the borrower's own funds and flexible debt-to-income ratios.
In the New York State and Rochester MSA assessment areas, examiners found that Chase maintained a good level of qualified community development investments that re-flected a strong responsiveness to credit and community development needs. At the time of the examination, Chase Bank's qualified investments totaled $12 million, of which approximately 83 percent were in Rochester. Examiners also noted that Chase Bank made innovative and complex investments, such as LIHTCs which comprised approxi-mately 77 percent, or $9.2 million, of the bank's qualified investments in the New York State assessment areas. More-over, approximately 90 percent of Chase Bank's invest-ments were directed to agencies engaged in affordable housing.
Examiners found that Chase Bank's record of providing retail banking and community development services in its New York State assessment areas, including the Rochester MSA, was outstanding. Moreover, the examination report indicated that Chase Bank's branch delivery system was readily accessible to essentially all portions of the New York State assessment areas, including the Rochester MSA. As of July 1999, Chase Bank operated 73 retail branches in its New York State assessment areas, including 31 branches in the Rochester MSA. During the examination period, Chase Bank closed one retail branch, which was not in an LMI geography. Examiners stated that Chase Bank's record of opening and closing branches had not adversely affected the accessibility of the branch delivery system.
Chase Bank also provided a high level of community development service in the New York State assessment areas, including the sponsorship of 125 seminars and work-shops focusing primarily on affordable housing. Chase states that in March 2000, Chase Bank conducted a semi-nar in cooperation with the City of Rochester and local realtors that was designed to encourage the purchase of affordable housing in Rochester. Chase Bank personnel and lending officers also were available at the seminar to dis-cuss the mortgage application process with attendees.
Texas: Chase Bank's operations in Texas as of the date of its most recent examination of CRA performance by the OCC (September 1996, the "1996 Examination") were conducted under the name Texas Commerce Bank, N.A., Houston ("Chase-TX").28 The Board has considered the 1996 examination and supplemental information provided by Chase on its CRA-related activities in Texas. The Board reviewed the CRA performance of Chase Bank's opera-tions in Texas in the context of Chase Bank's application to merge with Chase-TX. See The Chase Manhattan Bank, 86 Federal Reserve Bulletin 610 (2000). In approving the merger of Chase Bank and Chase-TX, the Board carefully reviewed the lending records of Chase Bank and Chase-TX, including their policies and programs designed to ensure compliance with the fair lending laws.
The 1996 Examination noted that Chase-TX had origi-nated a significant volume and variety of loans in its communities. In 1995, Chase-TX originated 11,409 home improvement loans, totaling approximately $135 million. After reviewing aggregate HMDA data for all reporting lenders, examiners determined that in 1995, Chase-TX made more home improvement loans in Texas than any other lender. Furthermore, Chase-TX designed a program of affordable loans that used specialized loan products to provide credit opportunities that might not otherwise have been available. Under this program, Chase-TX originated 4,376 mortgage and home improvement loans, totaling approximately $50 million, in 1995. Examiners also found that in 1995, 90 percent of Chase-TX's lending was in its assessment areas. Furthermore, Chase-TX demonstrated strong loan penetration of LMI areas, and a high level of performance in the distribution of loans by borrower in-come level. According to Chase, in 1999 its bank origi-nated over 18,485 mortgage loans in Texas, of which approximately 10 percent were in LMI census tracts and 22 percent were to LMI borrowers. During the same time period, Chase has reported that the bank originated 8,146 small business loans in Texas, of which 30.8 percent were in LMI census tracts.
The 1996 Examination noted that Chase-TX engaged in a significant amount of community development lending. In 1995, Chase-TX provided $94 million in community development loans. These loans helped finance projects by America's Preferred Homes (a 360-unit LMI apartment complex), the Las Haciendas single-family affordable
28. Chase-TX later changed its name to Chase Bank of Texas and merged with Chase Bank in August 2000.
Digitized for FRASER http://fraser.stlouisfed.org/ Federal Reserve Bank of St. Louis
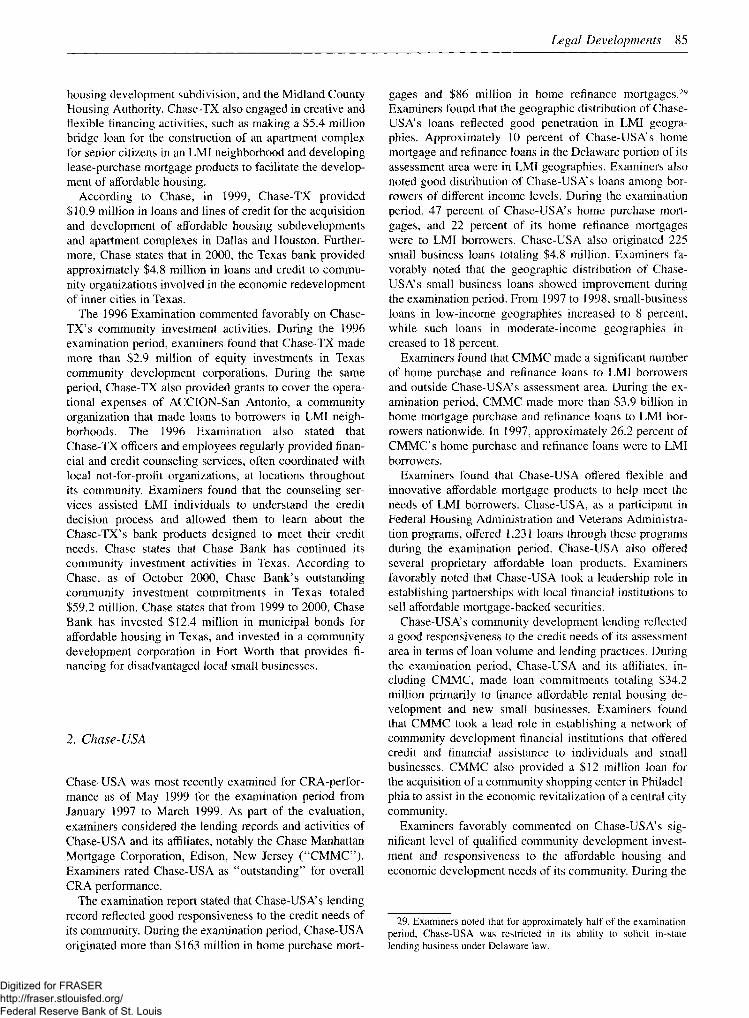
Legal Developments 85
housing development subdivision, and the Midland County Housing Authority. Chase-TX also engaged in creative and flexible financing activities, such as making a $5.4 million bridge loan for the construction of an apartment complex for senior citizens in an LMI neighborhood and developing lease-purchase mortgage products to facilitate the develop-ment of affordable housing.
According to Chase, in 1999, Chase-TX provided $10.9 million in loans and lines of credit for the acquisition and development of affordable housing subdevelopments and apartment complexes in Dallas and Houston. Further-more, Chase states that in 2000, the Texas bank provided approximately $4.8 million in loans and credit to commu-nity organizations involved in the economic redevelopment of inner cities in Texas.
The 1996 Examination commented favorably on Chase-TX's community investment activities. During the 1996 examination period, examiners found that Chase-TX made more than $2.9 million of equity investments in Texas community development corporations. During the same period, Chase-TX also provided grants to cover the opera-tional expenses of ACCION-San Antonio, a community organization that made loans to borrowers in LMI neigh-borhoods. The 1996 Examination also stated that Chase-TX officers and employees regularly provided finan-cial and credit counseling services, often coordinated with local not-for-profit organizations, at locations throughout its community. Examiners found that the counseling ser-vices assisted LMI individuals to understand the credit decision process and allowed them to learn about the Chase-TX's bank products designed to meet their credit needs. Chase states that Chase Bank has continued its community investment activities in Texas. According to Chase, as of October 2000, Chase Bank's outstanding community investment commitments in Texas totaled $59.2 million. Chase states that from 1999 to 2000, Chase Bank has invested $12.4 million in municipal bonds for affordable housing in Texas, and invested in a community development corporation in Fort Worth that provides fi-nancing for disadvantaged local small businesses.
2. Chase-USA
Chase-USA was most recently examined for CRA-perfor-mance as of May 1999 for the examination period from January 1997 to March 1999. As part of the evaluation, examiners considered the lending records and activities of Chase-USA and its affiliates, notably the Chase Manhattan Mortgage Corporation, Edison, New Jersey ("CMMC"). Examiners rated Chase-USA as "outstanding" for overall CRA performance.
The examination report stated that Chase-USA's lending record reflected good responsiveness to the credit needs of its community. During the examination period, Chase-USA originated more than $163 million in home purchase mort-
gages and $86 million in home refinance mortgages.29
Examiners found that the geographic distribution of Chase-USA's loans reflected good penetration in LMI geogra-phies. Approximately 10 percent of Chase-USA's home mortgage and refinance loans in the Delaware portion of its assessment area were in LMI geographies. Examiners also noted good distribution of Chase-USA's loans among bor-rowers of different income levels. During the examination period, 47 percent of Chase-USA's home purchase mort-gages, and 22 percent of its home refinance mortgages were to LMI borrowers. Chase-USA also originated 225 small business loans totaling $4.8 million. Examiners fa-vorably noted that the geographic distribution of Chase-USA's small business loans showed improvement during the examination period. From 1997 to 1998, small-business loans in low-income geographies increased to 8 percent, while such loans in moderate-income geographies in-creased to 18 percent.
Examiners found that CMMC made a significant number of home purchase and refinance loans to LMI borrowers and outside Chase-USA's assessment area. During the ex-amination period, CMMC made more than $3.9 billion in home mortgage purchase and refinance loans to LMI bor-rowers nationwide. In 1997, approximately 26.2 percent of CMMC's home purchase and refinance loans were to LMI borrowers.
Examiners found that Chase-USA offered flexible and innovative affordable mortgage products to help meet the needs of LMI borrowers. Chase-USA, as a participant in Federal Housing Administration and Veterans Administra-tion programs, offered 1,231 loans through these programs during the examination period. Chase-USA also offered several proprietary affordable loan products. Examiners favorably noted that Chase-USA took a leadership role in establishing partnerships with local financial institutions to sell affordable mortgage-backed securities.
Chase-USA's community development lending reflected a good responsiveness to the credit needs of its assessment area in terms of loan volume and lending practices. During the examination period, Chase-USA and its affiliates, in-cluding CMMC, made loan commitments totaling $34.2 million primarily to finance affordable rental housing de-velopment and new small businesses. Examiners found that CMMC took a lead role in establishing a network of community development financial institutions that offered credit and financial assistance to individuals and small businesses. CMMC also provided a $12 million loan for the acquisition of a community shopping center in Philadel-phia to assist in the economic revitalization of a central city community.
Examiners favorably commented on Chase-USA's sig-nificant level of qualified community development invest-ment and responsiveness to the affordable housing and economic development needs of its community. During the
29. Examiners noted that for approximately half of the examination period, Chase-USA was restricted in its ability to solicit in-state lending business under Delaware law.
Digitized for FRASER http://fraser.stlouisfed.org/ Federal Reserve Bank of St. Louis

86 Federal Reserve Bulletin • February 2001
examination period, the investment commitments of Chase-USA and its affiliates in its assessment area totaled $31.6 million. Examiners noted that Chase-USA took a leadership role in working with the Delaware State Hous-ing Authority ("DSHA") bond underwriter to restructure its bond program and thereby significantly reduced costs to the agency and home buyers. Chase-USA and CMMC purchased a total of $21.4 million in DSHA bonds. CMMC also purchased $1.5 million in LIHTC partnerships. Exam-iners noted that Chase-USA provided $1.83 million in qualified grants to community organizations to develop affordable housing programs, shelter and outreach services for the homeless, and a small business resource center. Chase-USA also provided more than 400 computers and printers and similar donations to community-based organi-zations.
C. CRA Performance Record of Morgan
Morgan Guaranty is a wholesale banking institution that provides investment management, corporate trust, financial and estate planning, fiduciary, and private banking services for institutions and high net worth individuals. Morgan Guaranty is a "wholesale bank" for CRA purposes30 and its performance is evaluated under the "community devel-opment test."31 Community development activities as a general matter must benefit areas in an institution's assess-ment area(s) or a broader statewide or regional area that includes the institution's assessment area(s).32
Morgan Guaranty's most recent CRA performance eval-uation reviewed the institution's record of assisting to meet the credit needs of its community in 1997 and 1998. Examiners rated Morgan Guaranty's performance under the community development test "outstanding." The exam-ination report noted that Morgan had conducted the major-ity of its community development lending and qualified investment activities through its affiliate, Morgan Commu-nity Development Corporation.
30. A "wholesale bank" is a bank that: (i) Is not in the business of extending home mortgage, small
business, small farm or consumer loans to retail consumers; and
(ii) Has been designated as a wholesale bank by its appropriate federal banking agency. 12 C.F.R. 228.12(w).
ICP alleges that Morgan engages in the business of multifamily mortgage lending. Morgan engages in the securitization of multifam-ily mortgage loans, an activity that is consistent with its wholesale bank designation.
31 .See 12 C.F.R. 228.25(a). The test evaluates a wholesale bank on its record of community development services, community develop-ment investments, and community development lending. 12 C.F.R. 228.25(c). The primary purpose of any service, investment, or loan considered under the test must be "community development," which is defined in terms of specific categories of activities that benefit LMI individuals, LMI areas, or small businesses or small farms. See 12 C.F.R. 228.12(h); see, e.g., The Charles Schwab Corporation, 86 Federal Reserve Bulletin 494, 496 (2000).
32. Community development activities outside an institution's as-sessment area(s) may also be considered if the institution has ade-quately addressed the needs of its assessment area(s). See 12 C.F.R. 228.25(e).
During the examination period, Morgan provided a sig-nificant level of community development loans, qualified investments, and community development services to help meet the credit and community development needs of its assessment areas. Examiners stated that Morgan Guaran-ty's community development lending totaled approxi-mately $268.2 million, representing an increase of 112 percent since the previous examination. Consistent with Morgan Guaranty's wholesale bank operations, most lending activity was indirect, primarily financing housing and community service intermediaries that supported com-munity development in the bank's assessment area.
Morgan Guaranty also had a significant level of qualified investments, totaling approximately $196.9 million at the time of the examination and representing an increase of 106 percent since the previous examination. Indirect in-vestments in affordable housing initiatives totaled more than $168 million or 86 percent of Morgan Guaranty's qualified investments. Other investments included $11.6 million of grants and contributions to more than 200 nonprofit community development organizations. Projects in the bank's assessment area totaled $149.4 million or 76 percent of total investments.
Examiners noted that Morgan Guaranty provided a sub-stantial level of community development services, includ-ing advisory services, technical assistance, and in-kind donations. Approximately 47 percent of Morgan Guaran-ty's community development services were for affordable housing programs for LMI individuals. Morgan Guaranty and its affiliates also donated office furniture, used comput-ers, and other items to 87 nonprofit and public institutions.
Examiners indicated that Morgan Guaranty extensively used innovative and complex qualified investments, com-munity development loans, and community development services. Through a partnership with a Primary Care Devel-opment Corporation ("PCDC"), Morgan Guaranty en-gaged in the financing of ten primary care facilities that served more than 73,000 low-income individuals in New York City. Examiners stated that Morgan Guaranty's long-term efforts with the PCDC had improved access to pri-mary health care for LMI neighborhoods. Morgan Guar-anty also structured a revolving line of credit to the New York Community Investment Company and syndicated bridge loans for several housing fund initiatives. Of Mor-gan Guaranty's total qualified investments, examiners found that approximately 81 percent or $158.5 million were LIHTCS and, therefore, qualified as complex invest-ments.
The examination report indicated that Morgan Guaranty had exhibited excellent responsiveness to credit and com-munity development needs in its assessment areas through community development lending and investments and ade-quate responsiveness through its community development service and practices. Affordable housing activity totaled $180.6 million or 67 percent of Morgan Guaranty's total community development lending. Morgan's lending to or-ganizations that provide community services for LMI indi-viduals totaled $62.1 million. Examiners also found that Morgan Guaranty provided financing to organizations such
Digitized for FRASER http://fraser.stlouisfed.org/ Federal Reserve Bank of St. Louis

Legal Developments 87
as the National Community Development Initiative that provided financial and technical support to nonprofit com-munity development corporations. Qualified investments in affordable housing initiatives totaled $178.5 million or 91 percent of Morgan Guaranty's qualified investments. In Morgan Guaranty's New York assessment area, examiners found that the institution's LIHTCs supported housing initiatives that resulted in the creation or rehabilitation of approximately 5,000 units of affordable housing for LMI individuals.
D. HMDA Data
The Board also has considered the lending record of Chase and Morgan in light of comments about the HMDA data reported by the organizations' subsidiaries.33 HMDA data from 1997 to 1999 indicate that in New York and Texas,34
Chase was generally comparable with lenders in the aggre-gate in its assessment areas in terms of the percentage of housing-related loans to African Americans and Hispanics. During the same time period, Chase's rate of denying applications from African-American and Hispanic borrow-ers for home mortgage loans in the New York and Texas assessment areas was also comparable with lenders in the aggregate. The data further indicate that Chase's lending in minority census tracts in the New York and Texas assess-ment areas was comparable with, and at times, exceeded, such loans by lenders in the aggregate.35
The Board is concerned when an institution's record indicates disparities in lending, and believes that all banks are obligated to ensure that their lending practices are based on criteria that ensure not only safe and sound banking, but also equal access to credit by creditworthy applicants regardless of their race or income level.36
33. Some commenters have criticized Chase's record of home mortgage lending in numerous markets, including Chase's assessment areas in New York and Texas. GRCRC and ICP note that in certain markets, minority applications for conventional home purchase and refinance loans were denied by Chase more frequently than by lenders in the aggregate. ICP also presents data purportedly demonstrating that Chase denies applications from minorities more frequently than it denied applications from nonminorities.
ICP contests the inclusion in Chase's HMDA data for subprime loans originated by Chase affiliates. The Board notes that Regula-tion C (12 C.F.R. 203 et seq.) requires all mortgage lending institu-tions and subsidiaries of financial institutions supervised by the Board, OCC, FDIC, and OTS to submit HMDA data to the appropriate federal financial supervisory agency. See 12 C.F.R. 203, App. A, Part I (C) & (E).
34. Mortgage loans extended by Chase and its subsidiaries in New York and Texas comprise 85 percent of Chase's total HMDA-reportable loans in states where it has been evaluated for performance under the CRA.
35. ICP has expressed concern that the HMDA data reported by Chase do not separately report subprime loans to borrowers. HMDA and Regulation C do not require separate reporting for subprime loans to borrowers.
36. ICP also generally alleges that Chase and Morgan have indi-rectly supported predatory and discriminatory lending through their business relationships that include warehouse finance and securitiza-tion services for several nonaffiliated nonbanking companies ("con-sumer lending companies").
The Board recognizes, however, that HMDA data alone provide an incomplete measure of an institution's lending in its community because the data cover only a few catego-ries of housing-related lending. HMDA data, moreover, provide only limited information about the covered loans.37
HMDA data, therefore, have limitations that make the data an inadequate basis, absent other information, for conclud-ing that an institution has not adequately assisted in meet-ing its community's credit needs or has engaged in illegal lending discrimination.38
Because of the limitations of HMDA data, the Board has carefully considered the data and comments in light of other information, including information provided by Chase and Morgan, examination reports, and confidential
The Board has considered the due diligence and other actions taken by Chase in connection with its relationships with consumer lending companies. For example, before obtaining Chase's warehouse financ-ing services, consumer-lending companies must make certain written representations and warranties stating that they are in compliance with all applicable laws, including consumer protection laws. Chase also has retained an outside firm to investigate and monitor the loan production activities of its warehouse finance customers.
In addition, Chase states that in the securitization of subprime loans, it has no role in the initial funding of, and does not control the loan selection criteria for, the loans it securitizes. Chase states, however, that it conducts due diligence reviews for compliance with consumer and fair lending laws, including on-site reviews, of every subprime pool it securitizes as lead manager. Furthermore, when securitizing subprime mortgage loans, Chase reviews every loan purchased to help ensure adherence to fair lending laws.
Morgan states that it does not engage in subprime warehouse financing. Morgan also states that it does not control the origination of subprime loans from consumer lending companies that it securitizes, but that it hires third parties to conduct due diligence reviews of all consumer lending companies before it serves as lead manager. Fur-thermore, when securitizing mortgage-backed loans, Morgan, as lead manager, conducts on-site reviews of the consumer lending company and hires a third party to review a sample of the loan pool to be securitized.
The Board has considered all these facts of record in evaluating the managerial and convenience and needs factors in this case. Moreover, the Board notes that the Department of Housing and Urban Develop-ment, the Department of Justice, and the Federal Trade Commission have responsibility for reviewing the compliance with fair lending laws of nondepository institutions.
37. The data, for example, do not account for the possibility that an .institution's outreach efforts may attract a larger proportion of margin-ally qualified applicants than other institutions attract and do not provide a basis for an independent assessment of whether an applicant who was denied credit was, in fact, creditworthy. Credit history problems and excessive debt levels relative to income (reasons most frequently cited for a credit denial) are not available from HMDA data.
38. ICP contends that Chase Bank, Chase-USA through its subsid-iary CMMC, and certain other subsidiaries engage directly and indi-rectly in disproportionate amounts subprime lending to LMI and minority individuals in certain metropolitan areas. ICP further con-tends that Chase has increased its involvement in subprime lending. Subprime lending is a permissible activity when conducted in compli-ance with fair lending laws. ICP has provided no information that indicates that Chase's subprime lending is illegal. Moreover, examin-ers found no evidence of illegal discrimination or credit practices at Chase Bank. Examiners considered CMMC's practices and record of lending when evaluating Chase-USA for CRA performance and found no evidence of illegal discrimination or credit practices. The Board notes that Chase reviews subprime mortgage applications to inform applicants if they may qualify for a prime loan.
Digitized for FRASER http://fraser.stlouisfed.org/ Federal Reserve Bank of St. Louis

88 Federal Reserve Bulletin • February 2001
supervisory material. As noted above, examiners found no evidence of prohibited discrimination or other illegal credit practices at the subsidiary banks of Chase and Morgan at their most recent examinations. Examiners reviewed fair lending policies and procedures of the banks and found the policies and procedures to be comprehensive and appropri-ate for monitoring compliance with fair lending laws. The Board has also considered the HMDA data in light of the lending records of Chase and Morgan which show that the organizations' subsidiary banks significantly help to meet the credit needs of their communities, including LMI areas.
E. Branch Closings
Commenters expressed concern that consummation of the proposal would result in branch closings and that these closings would have adverse effects on the local communi-ties in which the branches are located.39
The Board has carefully considered the comments con-cerning branch closings in light of all the facts of record, the branch closing policies of Chase and Morgan, and the record of the two organizations in opening and closing branches. Examiners at the most recent CRA examination of Chase and Morgan reviewed the banks' records of opening and closing branches and found that the banks' branch closings had not adversely affected the accessibility of banking services in their communities.
The Board also has considered that federal banking law provides a specific mechanism for addressing branch clos-ings. Federal law requires an insured depository institution to provide notice to the public and to the appropriate federal supervisory agency before closing a branch.40 The law does not authorize federal regulators to prevent the closing of any branch. Branch closings resulting from the proposal also would be considered by the appropriate fed-
39. ICP expresses concern about potential branch closures by citing two lawsuits that Chase aggressively opposed involving alleged ille-gal discrimination in layoffs after previous Chase consolidations. The composition of an applicant's workforce by race or age is not within the statutory factors that the Board is permitted to consider under the BHC Act. The Board also notes that the Equal Employment Opportu-nity Commission has jurisdiction to determine whether a banking organization such as Chase is in compliance with federal equal em-ployment opportunity statutes under the regulations of the Department of Labor. See 41 C.F.R. 60-1.7(a), 60-1.40.
40. Section 42 of the Federal Deposit Insurance Act (12 U.S.C. § 1831r-l), as implemented by the Joint Policy Statement Regarding Branch Closings (64 Federal Register 34,844 (1999)), requires that a bank provide the public with at least 30 days' notice and the appropri-ate federal supervisory agency with at least 90 days' notice before the date of the proposed branch closing. The bank also is required to provide reasons and other supporting data for the closure, consistent with the institution's written policy for branch closings.
ICP also expresses concern over the sale of Chase Bank's Virgin Island branches to an acquirer that might also be engaged in nonbank-ing and nonfinancial activities. The Board notes that any sale of branches must be in accordance with the law including any relevant application and review of CRA performance as required in accordance with those applications.
eral supervisor at the next CRA examination of the rele-vant subsidiary depository institution.41
F. Conclusion on the Convenience and Needs Factor
In its review of the convenience and needs factor, the Board has carefully considered the entire record, including the CRA performance examinations of each of the insured depository institutions involved in the proposal, all the information provided by the commenters,42 Chase and Morgan, the opinion of federal and state agencies, and confidential supervisory information43 Based on all the facts of record, and for the reasons discussed above, the Board concludes that considerations relating to the conve-nience and needs factor, including the CRA performance records of the relevant insured depository institutions, are consistent with approval of the proposal.
Nonbanking Activities
Chase also has filed notice under section 4(j)(2) of the BHC Act to acquire Morgan FSB and thereby engage in operating a savings association. The Board has determined by regulation that the operation of a savings association is, within certain limits, closely related to banking for pur-poses of the BHC Act.44 Chase has committed to conduct these nonbanking activities in accordance with the limita-tions set forth in Regulation Y and the Board's orders and interpretations governing the activity.
To approve a notice under section 4(c)(8) of the BHC Act, the Board also must determine that the proposed activities "can reasonably be expected to produce benefits
41. ICP asserts that Chase should be held accountable for the closure of branches originally sold by Chase to another banking institution. The Board notes that these closings are subject to separate review by the primary federal supervisor of the purchaser under the same policy guidelines applicable to Chase.
42. ANHD requests that Chase and Morgan answer certain ques-tions and provide certain commitments. The Board notes that the CRA requires only that, in considering an acquisition proposal, the Board carefully review the actual performance records of the relevant depos-itory institutions in helping to meet the credit needs of their communi-ties. The CRA does not require depository institutions to make pledges concerning future performance under the CRA. The Board also notes that future activities of Chase's subsidiary banks will be reviewed by the appropriate federal supervisors in future performance examina-tions, and such CRA performance records will be considered by the Board in subsequent applications by Chase to acquire a depository institution.
43. ICP has alleged that the merger of Chase and Morgan might result in the loss of jobs. As previously noted, the factors that the Board may consider when reviewing an application or notice are limited by the applicable law. The effect of a proposed transaction on employment in a community is not among the factors included in the acts administered by the Board. Moreover, the convenience and needs factor has been consistently interpreted by the federal banking agen-cies, the courts, and Congress to relate to the effect of a proposal on the availability and quality of banking services in the community. See Wells Fargo & Company, 82 Federal Reserve Bulletin, 455, 457 (1996).
44. See 12 C.F.R. 225.28(b)(4)(ii).
Digitized for FRASER http://fraser.stlouisfed.org/ Federal Reserve Bank of St. Louis

Legal Developments 89
to the public . . . that outweigh possible adverse effects, such as undue concentration of resources, decreased or unfair competition, conflicts of interests, or unsound bank-ing practices."45 As noted above, Morgan received a "sat-isfactory" rating from the OTS at its most recent CRA performance examination, as of November 1998.
As part of its evaluation of the public interest factors, the Board considers the financial condition and managerial resources of the notificant and its subsidiaries, including the companies to be acquired, and the effect of the pro-posed transaction on those resources. For the reasons noted above, and based on all the facts of record, the Board has concluded that financial and managerial considerations are consistent with approval of the proposal.
The Board also has considered the competitive effects of the proposed acquisition by Chase of Morgan FSB. Mor-gan FSB has two branches in California and Florida and competes directly with Chase in the West Palm Beach banking market. For the reasons discussed above, the Board has concluded that the acquisition of Morgan's subsidiary depository institutions, including Morgan FSB, is not likely to have any significantly adverse effects in the West Palm Beach banking market or any other relevant banking market. Based on all the facts of record, the Board concludes that it is unlikely that significantly adverse com-petitive effects would result from the nonbanking acquisi-tion proposed in the transaction.
Chase has indicated that consummation of the proposal would provide current and future customers of the two organizations greater convenience. Chase also has stated that the proposal would permit the combined organization to achieve greater operational efficiencies and economies of scale, and that these improvements would strengthen Chase's ability to compete in the markets in which it operates. Morgan also would provide the combined organi-zation with an enhanced capacity to offer wholesale bank-ing products and services. Chase, in turn, would provide former Morgan customers with access to certain commer-cial and retail banking products not offered by Morgan's depository institutions, such as home mortgage loans. Fur-thermore, former Morgan customers would gain access to Chase's expansive branch delivery network 46
The Board also concludes that conducting the proposed nonbanking activity within the framework of Regulation Y and Board precedent is not likely to result in adverse effects, such as undue concentration of resources, conflicts of interests, or unsound banking practices, that would outweigh the public benefits of the proposal, such as in-creased customer convenience and gains in efficiency. Ac-cordingly, based on all the facts of record, the Board has determined that the balance of public interest factors that the Board must consider under the standard in section 4(j) of the BHC Act is consistent with approval of Chase's notice.
45. 12 U.S.C. § 1843(j)(2)(A). 46. See, e.g., Banc One Corporation, 84 Federal Reserve Bulletin
553 (1998); First Union Corporation, 84 Federal Reserve Bulletin 489 (1998).
Chase also has requested the Board's consent under section 4(c)(13) of the BHC Act and section 211.5(c) of the Board's Regulation K (12 C.F.R. 211.5(c)) to acquire cer-tain foreign investments of Morgan 47 In addition, Chase has provided notice under sections 25 and 25A of the Federal Reserve Act and sections 211.3, 211.4, and 211.5 of Regulation K (12 C.F.R. 211.3, 211.4, and 211.5) to acquire some of Morgan's foreign branches and Morgan Guaranty International Finance Corporation, Newark, Del-aware, a company organized under section 25A of the Federal Reserve Act. The Board concludes that all the factors required to be considered under the Federal Re-serve Act, the BHC Act, and the Board's Regulation K are consistent with approval of these proposals.
Chase Bank has also applied under section 9 of the Federal Reserve Act (12 U.S.C. § 322 et seq.) to establish branch at the offices of Morgan Guaranty. The Board has considered the factors it is required to consider when reviewing application for establishing branches pursuant to section 9 of the Federal Reserve Act (12 U.S.C. § 322) and, for the reasons discussed in this order, finds those factors to be consistent with approval.
Conclusion
Based on the foregoing, and in light of all the facts of record, the Board has determined that the applications and notices should be, and hereby are, approved.48 The Board's
47. ICP contends that some activities by ICTSI International Hold-ings Corp., Manila, Philippines ("ICTSI"), and Massera S.A., Buenos Aires, Argentina ("Massera"), are impermissible under section 4 of the BHC Act. Under section 4(c)(13) of the BHC Act, a bank holding company may acquire shares of a foreign organization that does no business in the United States except as incident to its international or foreign business, if the Board determines that the exemption would not be substantially at variance with the purposes of the BHC Act and would be in the public interest. See 12 U.S.C. § 1843(c)(13). Sec-tion 211.5(b)(l)(iii) of Regulation K generally permits investments of less than 20 percent of the voting shares (and less than 40 percent of the total equity) of foreign companies without regard to the activities of such companies. 12 C.F.R. 211.5(b)(l)(iii). Chase's investments in ICTSI and Massera would comply with these provisions.
48. Commenters have requested a public meeting or hearing on the proposal. Section 3 of the BHC Act does not require the Board to hold a public hearing on an application unless the appropriate supervisory authority for the bank to be acquired makes a timely written recom-mendation of denial. The Board has not received such a recommenda-tion from the appropriate supervisory authorities. The Board's regula-tions provide for a hearing under section 4 of the BHC Act if there are disputed issues of material fact that cannot be resolved in some other manner. See 12 C.F.R. 225.25(a)(2). Under its rules, the Board also may, in its discretion, hold a public meeting or hearing on an applica-tion to acquire a bank if a meeting or hearing is necessary or appropriate to clarify factual issues related to the application and to provide an opportunity for testimony. 12 C.F.R. 225.16(e).
The Board has carefully considered the requests for a public meet-ing or hearing in light of all the facts of record. In the Board's view, commenters have had ample opportunity to submit their views and, in fact, have submitted written comments that have been carefully con-sidered by the Board in acting on the proposal. The requests fail to identify disputed issues of fact that are material to the Board's decision and that may be clarified by a public meeting or hearing. Commenters have provided substantial written comments that have
Digitized for FRASER http://fraser.stlouisfed.org/ Federal Reserve Bank of St. Louis

90 Federal Reserve Bulletin • February 2001
approval is specifically conditioned on compliance by Chase with all the commitments made in connection with these applications and with the conditions stated or re-ferred to in this order. The Board's determination on the nonbanking activities also is subject to all the terms and conditions set forth in Regulation Y, including those in sections 225.7 and 225.25(c) (12 C.F.R. 225.7 and 225.25(c)), and to the Board's authority to require such modification or termination of the activities of a bank holding company or any of its subsidiaries as the Board finds necessary to ensure compliance with, and to prevent evasion of, the provisions of the BHC Act and the Board's regulations and orders thereunder. For purposes of this action, the commitments and conditions relied on by the Board in reaching its decision are deemed to be conditions imposed in writing by the Board in connection with its findings and decision and, as such, may be enforced in proceedings under applicable law.
The acquisition of the subsidiary bank of Morgan shall not be consummated before the fifteenth calendar day following the effective date of this order, and the proposal shall not be consummated later than three months after the effective date of this order, unless such period is extended for good cause by the Board or by the Federal Reserve Bank of New York, acting pursuant to delegated authority.
By order of the Board of Governors, effective Decem-ber 11,2000.
Voting for this action: Chairman Greenspan and Governors Kelley, Meyer, and Gramlich. Absent and not voting: Vice Chairman Fergu-son.
ROBERT DEV. FRIERSON Associate Secretary of the Board
ORDERS ISSUED UNDER INTERNATIONAL BANKING ACT
Euroclear Bank Brussels, Belgium
Order Approving Establishment of a Representative Office
Euroclear Bank ("Bank"), Brussels, Belgium, a foreign bank within the meaning of the International Banking Act ("IBA"), has applied under section 10(a) of the IBA (12 U.S.C. § 3107(a)) to establish a representative office in New York, New York. The Foreign Bank Supervision Enhancement Act of 1991 ("FBSEA"), which amended the IBA, provides that a foreign bank must obtain the
been carefully considered by the Board, and the requests fail to show why a public meeting or hearing is necessary for the proper presenta-tion or consideration of commenters' views. For these reasons, and based on all the facts of record, the Board has determined that a public meeting or hearing and further delay in considering the application is not required or warranted in this case. Accordingly, the requests are hereby denied.
approval of the Board to establish a representative office in the United States.
Notice of the application, affording interested persons an opportunity to submit comments, has been published in a newspaper of general circulation in New York (The New York Post, August 31, 2000). The time for filing comments has expired, and all comments have been considered.
Bank is a newly formed Belgian bank that was created to operate the Euroclear System (the "System"), a clearance and settlement system for international securities. The Sys-tem is currently operated by the Brussels office of the Morgan Guaranty Trust Company of New York ("MGT") on behalf of Euroclear Clearance System pic ("ECS pic"), a United Kingdom company owned by a consortium of 119 financial institutions. ECS pic owns, directly or indirectly, 95 percent of the shares of Bank, and more than 1200 other participants in the System own the balance. The parent of MGT, J.R Morgan & Co. Incorporated, entered into an agreement with ECS pic whereby MGT's role as operator of the System will cease on or about December 31, 2000. At that time, the assets and liabilities of MGT's Brussels office related to the operation of the System will be trans-ferred to Bank, and Bank will become the System's opera-tor. Most MGT employees who currently have duties re-lated to the operations of the System will become employees of Bank. Bank will not engage in the full range of international banking activities, but only in the clearance and settlement of international securities transactions. Bank also intends to establish representative offices in Tokyo, Sao Paolo, Singapore, Hong Kong, and London.
The proposed representative office will engage in liaison, marketing and support activities, including the solicitation of new clients and the promotion of Bank products and services. These are the same functions currently performed by certain employees of MGT's New York office.
In acting on an application to establish a representative office, the IBA and Regulation K provide that the Board shall take into account whether the foreign bank engages directly in the business of banking outside the United States and has furnished to the Board the information it needs to assess the application adequately. The Board also shall take into account whether the foreign bank and any foreign bank parent is subject to comprehensive supervi-sion or regulation on a consolidated basis by its home country supervisor.1 The Board may take into account
1. See 12 U.S.C. § 3107(a)(2); 12 C.F.R. 211.24(d)(2). In assessing this standard, the Board considers, among other factors, the extent to which the home country supervisors:
(i) Ensure that the bank has adequate procedures for monitoring and controlling its activities worldwide;
(ii) Obtain information on the condition of the bank and its subsid-iaries and offices through regular examination reports, audit reports, or otherwise;
(iii) Obtain information on the dealings with and relationship be-tween the bank and its affiliates, both foreign and domestic;
(iv) Receive from the bank financial reports that are consolidated on a worldwide basis, or comparable information that permits analysis of the bank's financial condition on a worldwide consolidated basis;
Digitized for FRASER http://fraser.stlouisfed.org/ Federal Reserve Bank of St. Louis

Legal Developments 91
additional standards set forth in the IBA and Regula-tion K.2 The Board previously has stated that the standards that apply to the establishment of a branch or agency need not in every case apply to the establishment of a represen-tative office, because representative offices do not engage in a banking business and cannot take deposits or make loans.3
As noted above, Bank will engage directly in the busi-ness of banking outside the United States through its banking operations in Belgium. Bank also has provided the Board with the information necessary to assess the applica-tion through submissions that address the relevant issues.
With respect to home country supervision of Bank, the Board has considered the following information. The Bel-gian Banking and Finance Commission ("BBFC") and the National Bank of Belgium ("NBB") are the primary super-visors of Bank.4 The Board previously has determined, in connection with applications involving other Belgian banks, that those banks were subject to comprehensive consolidated supervision by the BBFC.5 Although Bank is a de novo institution, and the BBFC has not previously had primary supervisory authority over the operations of the System, the BBFC intends to supervise Bank in substan-tially the same manner as the banks previously reviewed in the orders cited above. Based on all the facts of record, the Board has determined that factors relating to the supervi-sion of Bank by its home country supervisor are consistent with approval of the proposed representative office.
The Board has taken into account the additional stan-dards set forth in the IBA and in Regulation K.6 The BBFC has granted Bank approval to establish the proposed office. With respect to the financial and managerial resources of Bank, taking into consideration the record of operations by Bank's predecessor in its home country, Bank's overall financial resources, and its standing with its home country supervisor, the Board has determined that financial and managerial considerations are consistent with approval. In addition, Bank appears to have the experience and capacity to support the proposed office and has established controls and procedures in the representative office to ensure com-
(v) Evaluate prudential standards, such as capital adequacy and risk asset exposure, on a worldwide basis.
These are indicia of comprehensive consolidated supervision; no single factor is essential and other elements may inform the Board's determination.
2. See 12 U.S.C. § 3105(d)(3) and (4); 12 C.F.R. 211.24(c)(2). 3. See 58 Federal Register 6348, 6351 (1993). See also Banco de la
Ciudad de Buenos Aires, 85 Federal Reserve Bulletin 647 (1999); Agricultural Bank of China, 83 Federal Reserve Bulletin 617 (1997); Citizens National Bank, 79 Federal Reserve Bulletin 805 (1993).
4. The National Bank of Belgium has primary responsibility for oversight of payment and clearing systems in Belgium. The BBFC is the primary banking regulator in Belgium, however, and would have full supervisory authority over the activities of Bank. The BBFC has indicated that it works closely with the NBB and that both entities share information with respect to supervisory matters.
5. See Antwerpse Diamantbank, N.V., 85 Federal Reserve Bulletin 830 (1999); KBC Bank, N.V., 85 Federal Reserve Bulletin 832 (1999).
6. See 12 U.S.C. § 3105(d)(3) and (4); 12 C.F.R. 211.24(c)(2).
pliance with applicable U.S. law, as well as controls and procedures for its worldwide operations generally.
With respect to access to information, the Board has reviewed the restrictions on disclosure in relevant jurisdic-tions in which Bank operates and has communicated with relevant government authorities about access to informa-tion. Bank and ECS pic have committed to make available to the Board such information on the operations of Bank and any affiliate of Bank that the Board deems necessary to determine and enforce compliance with the IBA, the Bank Holding Company Act, and other applicable federal law. To the extent that the provision of such information may be prohibited or impeded by law or otherwise, Bank and ECS pic have committed to cooperate with the Board to obtain any necessary consents or waivers that might be required from third parties in connection with disclosure of certain information. In addition, subject to certain conditions, the BBFC may share information on Bank's operations with other supervisors, including the Board. In light of these commitments and other facts of record, and subject to the condition described below, the Board has concluded that Bank has provided adequate assurances of access to any necessary information the Board may request.
On the basis of all the facts of record, and subject to the commitments made by Bank, as well as the terms and conditions set forth in this order, the Board has determined that Bank's application to establish a representative office in New York should be, and hereby is, approved. Should any restrictions on access to information on the operations or activities of Bank or any of its affiliates subsequently interfere with the Board's ability to determine and enforce compliance by Bank or its affiliates with applicable federal statutes, the Board may require or recommend termination of any of Bank's direct or indirect activities in the United States. Approval of this application also is specifically conditioned on Bank's compliance with the commitments made in connection with this application and with the conditions in this order.7 The commitments and conditions referred to above are conditions imposed in writing by the Board in connection with its decision and may be enforced in proceedings against Bank and its affiliates under applica-ble law.
By order of the Board of Governors, effective Decem-ber 21, 2000.
Voting for this action: Chairman Greenspan, Vice Chairman Fergu-son, and Governors Meyer and Gramlich. Absent and not voting: Governor Kelley.
ROBERT DEV. FRIERSON Associate Secretary of the Board
7. The Board's authority to approve the establishment of the pro-posed office parallels the continuing authority of the State of New York to license offices of a foreign bank. The Board's approval of this application does not supplant the authority of the State of New York or its agent, the New York State Banking Department, to license the proposed office of Bank in accordance with any terms or conditions that the New York State Banking Department may impose.
Digitized for FRASER http://fraser.stlouisfed.org/ Federal Reserve Bank of St. Louis

92 Federal Reserve Bulletin • February 2001
APPLICATIONS APPROVED UNDER BANK HOLDING COMPANY ACT By the Secretary of the Board
Recent applications have approved by the Secretary of the Board as listed below. Copies are available upon request to the Freedom of Information Office, Office of the Secretary, Board of Governors of the Federal Reserve System, Washington, D.C. 20551.
Section 3
Applicant(s) Bank(s) Effective Date
The Chase Manhattan Corporation, New York, New York
Compass Bancshares, Inc., Birmingham, Alabama
J.P. Morgan & Co. Incorporated, New York, New York
Morgan Guaranty Trust Company of New York, New York, New York
J.P. Morgan FSB, West Palm Beach, Florida
FirsTier Corporation, Northglenn, Colorado
FirsTier Bank, Northglenn, Colorado
Firstate Bank, Kimball, Nebraska
December 11, 2000
December 13, 2000
Section 4
Applicant(s) Bank(s) Effective Date
City National Corporation, Beverly Hills, California
Wells Fargo & Company, San Francisco, California
Wells Fargo Financial Services, Inc. Des Moines, Iowa
Wells Fargo Financial, Inc., Des Moines, Iowa
Wells Fargo & Company, San Francisco, California
Wells Fargo Financial Services, Inc. Des Moines, Iowa
Wells Fargo Financial, Inc., Des Moines, Iowa
Reed, Conner & Birdwell, Inc., Los Angeles, California
Conseco Finance Vendor Services Corporation, Paramus, New Jersey
Flagship Credit Corporation, Philadelphia, Pennsylvania
December 27, 2000
December 28, 2000
December 6, 2000
Digitized for FRASER http://fraser.stlouisfed.org/ Federal Reserve Bank of St. Louis

Legal Developments 93
By Federal Reserve Banks
Recent applications have been approved by the Federal Reserve Banks as listed below. Copies are available upon request to the Reserve Banks.
Section 3
Applicant(s) Bank(s) Reserve Bank Effective Date
1st Financial Bancshares, Inc. Shawnee Mission, Kansas
Amana Bancshares, Inc., Southfield, Michigan
Bank of America Corporation, Charlotte, North Carolina
N B Holdings Corporation, Charlotte, North Carolina
Capitol Bancorp Ltd., Lansing, Michigan
Sun Community Bancorp Limited, Phoenix, Arizona
Sunrise Capital Corporation, Albuquerque, New Mexico
Capital City Bank Group, Inc., Tallahassee, Florida
Central Financial Corporation, Hutchinson, Kansas
Chemical Financial Corporation, Midland, Michigan
Citizens Bancorp of Oviedo, Oviedo, Florida
CNB Holdings, Inc., McConnelsville, Ohio
Cooper Lake Financial Corporation, Cooper, Texas
Sylvan Agency, Inc., Sylvan Grove, Kansas
Centerville State Bank, Centerville, Kansas
Amana Bank, Dearborn, Michigan
Bank of America Georgia, National Association, Atlanta, Georgia
Sunrise Bank of San Diego, San Diego, California
First National Bankshares of West Point, Inc., West Point, Georgia
First National Bank of West Point, West Point, Georgia
First Peoples Bankshares, Inc., Pine Mountain, Georgia
First Mortgage Company, Pine Mountain, Georgia
TTAC Corp., Manhattan, Kansas
Community First National Bank, Manhattan, Kansas
Shoreline Financial Corporation, Benton Harbor, Michigan
Shoreline Bank, Benton Harbor, Michigan
Citizens Bank of Oviedo, Oviedo, Florida
The Citizens National Bank of McConnelsville, McConnelsville, Ohio
The Delta Bank, Cooper, Texas
Kansas City December 11, 2000
Chicago December 22, 2000
Richmond December 20, 2000
Chicago November 30, 2000
Atlanta December 11, 2000
Kansas City December 22, 2000
Chicago
Atlanta
Cleveland
Dallas
December 11, 2000
December 11, 2000
November 24, 2000
December 11, 2000
Digitized for FRASER http://fraser.stlouisfed.org/ Federal Reserve Bank of St. Louis

94 Federal Reserve Bulletin • February 2001
Section 3—Continued
Applicant(s) Bank(s) Reserve Bank Effective Date
Eggemeyer Advisory Corp., Rancho Santa Fe, California
WJR Corp., Rancho Santa Fe, California
Castle Creek Capital, LLC, Rancho Santa Fe, California
Castle Creek Capital Partners Fund I, LP, Rancho Santa Fe, California
Castle Creek Capital Partners Fund Ha, Rancho Santa Fe, California
Castle Creek Capital Partners Fund lib, Rancho Santa Fe, California
F&M National Corporation, Winchester, Virginia
First Bancorp of Taylorville, Inc., Taylorville, Illinois
First Banks, Inc., St. Louis, Missouri
First Banks America, Inc., St. Louis, Missouri
First Banks, Inc., St. Louis, Missouri
First Banks America, Inc., St. Louis, Missouri
First Community Bancorp, Rancho Santa Fe, California
First National Bankers Bankshares, Inc., Baton Rouge, Louisiana
First National Johnson Bancshares, Inc., Johnson, Nebraska
F.N.B. Corporation, Hermitage, Pennsylvania
Goering Financial Holding Company Partnership, L.P., Moundridge, Kansas
Goering Management Company, LLC, Moundridge, Kansas
Heritage Group, Inc., Aurora, Nebraska
Innes Street Financial Corporation, Salisbury, North Carolina
Lake Bank Shares, Inc., Employee Stock Ownership Plan, Emmons, Minnesota
First Professional Bank, S.A., Santa Monica, California
San Francisco December 21, 2000
Community Bankshares of Maryland, Bowie, Maryland
The First National Bank of Mt. Auburn, Mt. Auburn, Illinois
Millennium Bank, San Francisco, California
The San Francisco Company, San Francisco, California
Bank of San Francisco, San Francisco, California
Profesional Bancorp, Inc., Santa Monica, California
Mississippi National Bankers Bank, Ridgeland, Mississippi
Wilber Company, Wilber, Nebraska
Sun Bancorp, Inc., Selinsgrove, Pennsylvania
BON, Inc., Moundridge, Kansas
Goering Financial Holding Company Partnership, L.P., Moundridge, Kansas
Heritage Bank, N.A., Doniphan, Nebraska
Citizens Bank, Inc., Salisbury, North Carolina
Citizens Bank, FSB, Salisbury, North Carolina
Lake Bank Shares, Inc., Emmons, Minnesota
The First State Bank of Emmons, Emmons, Minnesota
Richmond December 20, 2000
Chicago December 1, 2000
St. Louis December 12, 2000
St. Louis November 29, 2000
San Francisco December 21, 2000
Atlanta December 4, 2000
Kansas City November 27, 2000
Cleveland November 27, 2000
Kansas City December 20, 2000
Kansas City December 20, 2000
Kansas City December 14, 2000
Richmond December 7, 2000
Minneapolis December 27, 2000
Digitized for FRASER http://fraser.stlouisfed.org/ Federal Reserve Bank of St. Louis

Legal Developments 95
Section 3—Continued
Applicant(s) Bank(s) Reserve Bank Effective Date
Lenawee Bancorp, Inc., Adrian, Michigan
Marquette Bancshares, Inc., Minneapolis, Minnesota
Mason National Bancshares, Inc., Mason, Texas
Mason National Bancshares of Nevada, Inc., Carson City, Nevada
Meader Insurance Agency, Inc., Waverly, Kansas
Merchants and Manufacturers Bancorporation, Inc., New Berlin, Wisconsin
Merchants Merger Corp., New Berlin, Wisconsin
Mid-Iowa Bancshares Co., Algona, Iowa
Mississippi Valley Bancshares, Inc. St. Louis, Missouri
Mountain West Financial Corp., Helena, Montana
Nara Bancorp, Inc., Los Angeles, California
North Texas Bancshares, Inc., Dallas, Texas
North Texas Bancshares of Delaware, Inc., Wilmington, Delaware
Northwest Mutual Holding Company, Winsted, Connecticut
Litchfield Mutual Holding Company, Litchfield, Connecticut
Northwest Suburban Bancorp, Inc., Mount Prospect, Illinois
OSB Financial Services, Inc., Orange, Texas
OSB Delaware Financial Services, Inc., Dover, Delaware
PAB Bankshares, Inc., Valdosta, Georgia
Pacifica Bancorp, Inc., Bellevue, Washington
Seacoast Financial Services Corporation, New Bedford, Massachusetts
Bank of Washtenaw, Saline, Michigan
Commerce Bank of Santa Barbara, N.A., Santa Barbara, California
Mason National Bank, Mason, Texas
1st Financial Bancshares, Inc., Shawnee Mission, Kansas
CBOC, Inc., Oconto Falls, Wisconsin
Community Bank of Oconto County, Oconto Falls, Wisconsin
Ruthven Investment, Ltd., Ruthven, Iowa
Southwest Bank of Phoenix, Phoenix, Arizona
Bankwest Financial, Inc., Kalispell, Montana
Nara Bank, Los Angeles, California
Park Cities Bank, Dallas, Texas
Northwest Community Bank, Winsted, Connecticut
Litchfield Bancorp, Litchfield, Connecticut
Village Bank and Trust, North Barrington, Illinois
Orange Savings Bank, SSB, Orange, Texas
FCB Interim Bank, Ocala, Florida
Friendship Community Bank, Ocala, Florida
Pacifica Bank, Bellevue, Washington
Home Port Bancorp, Inc., Nantucket, Massachusetts
Nantucket Bank, Nantucket, Massachusetts
Chicago December 11, 2000
Minneapolis December 14, 2000
Dallas
Chicago
St. Louis
Minneapolis
San Francisco
Dallas
Boston
Chicago
Dallas
Atlanta
December 14, 2000
Kansas City December 11, 2000
Chicago November 17, 2000
November 30, 2000
December 12, 2000
December 21, 2000
December 15, 2000
November 28, 2000
December 15, 2000
December 14, 2000
November 24, 2000
December 8, 2000
San Francisco November 21, 2000
Boston December 11, 2000
Digitized for FRASER http://fraser.stlouisfed.org/ Federal Reserve Bank of St. Louis
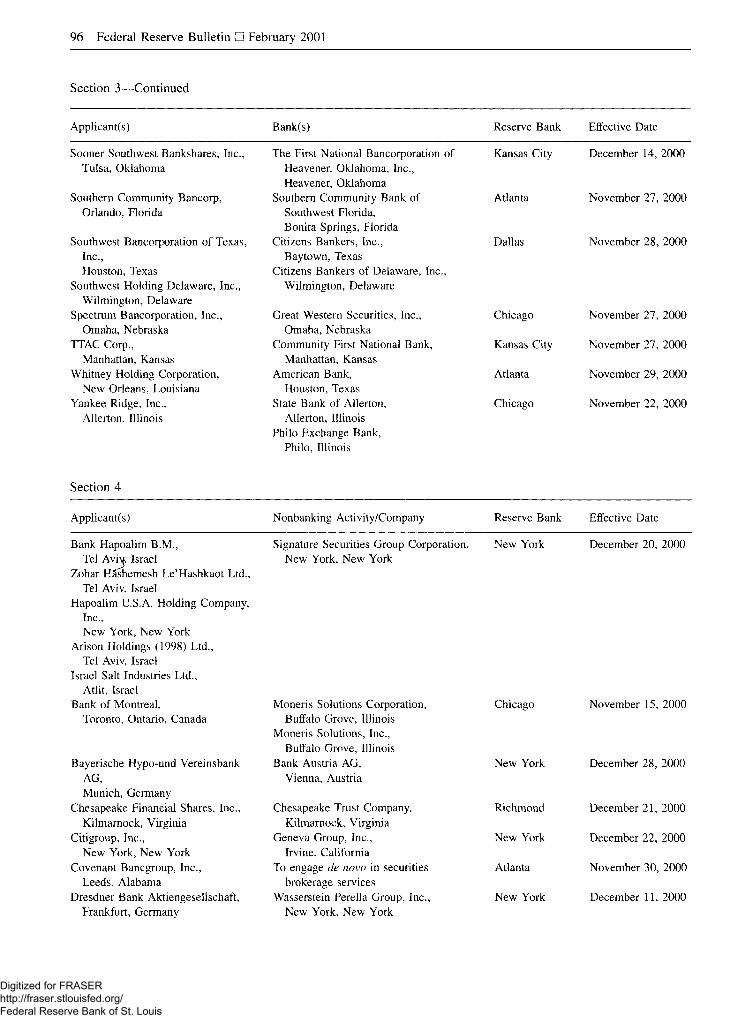
96 Federal Reserve Bulletin • February 2001
Section 3—Continued
Applicant(s) Bank(s) Reserve Bank Effective Date
Sooner Southwest Bankshares, Inc., Tulsa, Oklahoma
Southern Community Bancorp, Orlando, Florida
Southwest Bancorporation of Texas, Inc., Houston, Texas
Southwest Holding Delaware, Inc., Wilmington, Delaware
Spectrum Bancorporation, Inc., Omaha, Nebraska
TTAC Corp., Manhattan, Kansas
Whitney Holding Corporation, New Orleans, Louisiana
Yankee Ridge, Inc., Allerton, Illinois
The First National Bancorporation of Heavener, Oklahoma, Inc., Heavener, Oklahoma
Southern Community Bank of Southwest Florida, Bonita Springs, Florida
Citizens Bankers, Inc., Bay town, Texas
Citizens Bankers of Delaware, Inc., Wilmington, Delaware
Great Western Securities, Inc., Omaha, Nebraska
Community First National Bank, Manhattan, Kansas
American Bank, Houston, Texas
State Bank of Allerton, Allerton, Illinois
Philo Exchange Bank, Philo, Illinois
Kansas City December 14, 2000
Atlanta
Dallas
Chicago
Kansas City
Atlanta
Chicago
November 27, 2000
November 28, 2000
November 27, 2000
November 27, 2000
November 29, 2000
November 22, 2000
Section 4
Applicant(s) Nonbanking Activity/Company Reserve Bank Effective Date
Bank Hapoalim B.M., Tel Aviv, Israel
Zohar KSshemesh Le'Hashkaot Ltd., Tel Aviv, Israel
Hapoalim U.S.A. Holding Company, Inc., New York, New York
Arison Holdings (1998) Ltd., Tel Aviv, Israel
Israel Salt Industries Ltd., Atlit, Israel
Bank of Montreal, Toronto, Ontario, Canada
Bayerische Hypo-und Vereinsbank AG, Munich, Germany
Chesapeake Financial Shares, Inc., Kilmarnock, Virginia
Citigroup, Inc., New York, New York
Covenant Bancgroup, Inc., Leeds, Alabama
Dresdner Bank Aktiengesellschaft, Frankfurt, Germany
Signature Securities Group Corporation, New York, New York
New York
Moneris Solutions Corporation, Buffalo Grove, Illinois
Moneris Solutions, Inc., Buffalo Grove, Illinois
Bank Austria AG, Vienna, Austria
Chesapeake Trust Company, Kilmarnock, Virginia
Geneva Group, Inc., Irvine, California
To engage de novo in securities brokerage services
Wasserstein Perella Group, Inc., New York, New York
Chicago
New York
Richmond
New York
Atlanta
New York
December 20, 2000
November 15, 2000
December 28, 2000
December 21, 2000
December 22, 2000
November 30, 2000
December 11, 2000
Digitized for FRASER http://fraser.stlouisfed.org/ Federal Reserve Bank of St. Louis

Legal Developments 97
Section 4—Continued
Applicant(s) Nonbanking Activity/Company Reserve Bank Effective Date
Fifth Third Bancorp, Cincinnati, Ohio
Irwin Financial Corporation, Columbus, Indiana
Manning Financial Services, Inc., Manning, Iowa
Mizuho Holdings, Inc., Tokyo, Japan
The Dai-Ichi Kangyo Bank, Limited, Tokyo, Japan
National Australia Bank Limited, Melbourne, Australia
HomeSide Lending, Inc., Jacksonville, Florida
SSB Management L.L.C., Wilber, Nebraska
Sturm Financial Group, Inc., Denver, Colorado
Westdeutsche Landesbank Girozentrale, Dusseldolf, Germany
Wilber Company, Wilber, Nebraska
Resource Management Inc., Cleveland, Ohio
Irwin Union Bank, F.S.B., Louisville, Kentucky
To engage de novo in extending credit and servicing loans
Dealerconx, Inc., Livingston, New Jersey
The CIT Group, Inc., New York, New York
Charles F. Curry Company, Kansas City, Missouri
Wilber Company, Wilber, Nebraska
Saline State Insurance Agency, L.L.C. Wilber, Nebraska
Community Financial Services, Inc., Denver, Colorado
Gulfstream Global Investors, Ltd., Addison, Texas
Saline State Insurance Agency, L.L.C. Wilber, Nebraska
Cleveland
Chicago
Chicago
New York
Chicago
December 8, 2000
December 1, 2000
December 20, 2000
December 8, 2000
December 27, 2000
Kansas City November 27, 2000
Kansas City December 18, 2000
New York December 8, 2000
Kansas City November 27, 2000
APPLICATIONS APPROVED UNDER BANK MERGER ACT By the Secretary of the Board
Recent applications have approved by the Secretary of the Board as listed below. Copies are available upon request to the Freedom of Information Office, Office of the Secretary, Board of Governors of the Federal Reserve System, Washington, D.C. 20551.
Applicant(s) Bank(s) Effective Date
The Chase Manhattan Bank, Morgan Guaranty Trust Company of December 11, 2000 New York, New York New York,
New York, New York Compass Bank, FirsTier Bank, December 13, 2000
Birmingham, Alabama Northglenn, Colorado Firstate Bank,
Kimball, Nebraska
Digitized for FRASER http://fraser.stlouisfed.org/ Federal Reserve Bank of St. Louis

98 Federal Reserve Bulletin • February 2001
By Federal Reserve Banks
Recent applications have been approved by the Federal Reserve Banks as listed below. Copies are available upon request to the Reserve Banks.
Applicant s) Bank(s) Reserve Bank Effective Date
Adams Bank & Trust, Bank of Colorado-Western Slope, Kansas City November 29, 2000 Ogallala, Nebraska Grand Junction, Colorado
Bank of Colorado, Bank of Colorado-Western Slope, Kansas City November 28, 2000 Fort Lupton, Colorado Grand Junction, Colorado
Bank of Pontiac, Odell State Bank, Chicago December 27, 2000 Pontiac, Illinois Odell, Illinois
Bank of Tazewell County, First Union National Bank, Richmond December 21, 2000 Tazewell, Virginia Charlotte, North Carolina
Bank of Washtenaw, Bank of Lenawee, Chicago December 11, 2000 Saline, Wisconsin Adrian, Michigan
Capital City Bank, First National Bank of West Point, Atlanta December 11, 2000 Tallahassee, Florida West Point, Georgia
Capital City Bank, First Union National Bank, Atlanta December 1, 2000 Tallahassee, Florida Charlotte, North Carolina
Centennial Bank of the West, Farmers Bank, Kansas City December 5, 2000 Eaton, Colorado Ault, Colorado
F&M Bank-Maryland, Inc., Community Bank of Maryland, Richmond December 20, 2000 Bethesda, Maryland Bowie, Maryland
Friendship Community Bank, FCB Interim Bank, Atlanta December 8, 2000 Ocala, Florida Ocala, Florida
Harris Trust Bank of Arizona, Century Bank, Chicago November 27, 2000 Scottsdale, Arizona Scottsdale, Arizona
PNB Financial Bank, City National Bank, Dallas December 11, 2000 Lubbock, Texas Austin, Texas
Sylvan State Bank, Centerville State Bank, Kansas City December 11, 2000 Sylvan Grove, Kansas Centerville, Kansas
Kendall State Bank, Valley Falls, Kansas
PENDING CASES INVOLVING THE BOARD OF GOVERNORS
This list of pending cases does not include suits against the Federal Reserve Banks in which the Board of Governors is not named a party.
Dime Bancorp, Inc. v. Board of Governors, No. 00-4249 (2d Cir., filed December 11, 2000). Petition for review of a Board order dated September 27, 2000, approving the appli-cations of North Fork Corporation, Inc., Melville, New York, to acquire control of Dime Bancorp, Inc. and to thereby acquire its wholly owned subsidiary, The Dime Savings Bank of New York, FSB, both of New York, New York.
Nelson v. Greenspan, No. 99-215(EGS) (D.D.C., amended complaint filed December 8, 2000). Employment discrimi-nation action.
Howe v. Bank for International Settlements, No. 00CV12485 RCL (D. Mass., filed December 7, 2000). Action seeking damages in connection with gold market activities and the
repurchase of privately-owned shares of the Bank for Inter-national Settlements.
Barnes v. Reno, No. 1:00CV02900 (D.D.C., filed December 4, 2000). Civil rights action.
El Bey v. United States, No. 00-5293 (D.C. Cir., filed August 31, 2000). Appeal from district court order dismiss-ing pro se action as lacking arguable basis in law. The government filed a motion for summary affirmance on Octo-ber 26, 2000.
Trans Union LLC v. Board of Governors, et al„ No. 00-CV-2087(ESH) (D.D.C., filed August 30, 2000). Action under Administrative Procedure Act challenging a portion of inter-agency rule regarding Privacy of Consumer Financial Infor-mation.
Sedgwick v. Board of Governors, No. 00-16525 (9th Cir., filed August 7, 2000). Appeal of district court dismissal of action under Federal Tort Claims Act alleging violation of bank supervision requirements.
Digitized for FRASER http://fraser.stlouisfed.org/ Federal Reserve Bank of St. Louis

Legal Developments 99
Individual Reference Services Group, Inc., v. Board of Gover-nors, et al, No. 00-CV-1828 (ESH) (D.D.C., filed July 28, 2000). Action under Administrative Procedure Act chal-lenging a portion of interagency rule regarding Privacy of Consumer Finance Information.
Reed Elsevier Inc. v. Board of Governors, No. 00-1289 (D.C. Cir., filed June 30, 2000). Petition for review of interagency rule regarding Privacy of Consumer Financial Information.
Board of Governors v. Interfinancial Services, Ltd., No. 00-5233 (D.C. Cir., filed June 27, 2000). Appeal of district court order enforcing administrative subpoena issued by the Board. On June 30, 2000, the court of appeals denied the appellant's motion for a stay of the district court order. On December 1, 2000, the court dismissed the case on appel-lant's motion.
Bettersworth v. Board of Governors, No. 00-50262 (5th Cir., filed April 14, 2000). Appeal of district court's dismissal of Privacy Act claims.
Hunter v. Board of Governors, No. OO-CV-735 (ESH) (D.D.C., filed April 5, 2000). Action claiming retaliation for whistle-blowing activity. The case was dismissed by stipulation on December 15, 2000.
Bennett v. Federal Bureau of Investigation, et al., No. H-00-0707 (S.D. Texas, filed March 1, 2000). Action alleging Board interference with a private investment. On October 20, 2000, the court dismissed the action.
Albrecht v. Board of Governors, No. 00-CV-317 (CKK) (D.D.C., filed February 18, 2000). Action challenging the funding of the retirement plan for certain Board employees.
Folstad v. Board of Governors, No. 00-1056 (6th Cir., filed January 14, 2000). Appeal of district court order granting summary judgment to the Board in a Freedom of Informa-tion Act case. On October 26, 2000, the court of appeals affirmed the district court's order.
Toland v. Internal Revenue Service, Federal Reserve System, et al., No. CV-S-99-1769-JBR-RJJ (D. Nevada, filed December 29, 1999). Challenge to income taxation and Federal Reserve notes. On May 1, 2000, the court granted the government's motion to dismiss the action.
Guerrero v. United States, No. CV-F-99-6771 (OWW) (E.D. Cal., filed November 29, 1999). Prisoner suit.
Artis v. Greenspan, No. 1:99CV02073 (EGS) (D.D.C., filed August 3, 1999). Employment discrimination action.
Sheriff Gerry Ali v. U.S. State Department, No. 99-7438 (C.D. Cal., filed July 21, 1999). Action relating to impounded bank drafts. On December 3, 1999, the court stayed the action indefinitely.
Kerr v. Department of the Treasury, No. 99-16263 (9th Cir., filed April 28, 1999). Appeal of dismissal of action chal-lenging income taxation and Federal Reserve notes. On July 13, 2000, the court of appeals affirmed the dismissal.
Fraternal Order of Police v. Board of Governors, No. 1:98CV03116 (WBB)(D.D.C., filed December 22, 1998). Declaratory judgment action challenging Board labor prac-tices. On February 26, 1999, the Board filed a motion to dismiss the action.
Board of Governors v. Carrasco, No. 98 Civ. 3474 (LAK) (S.D.N.Y., filed May 15, 1998). Action to freeze assets of individual pending administrative adjudication of civil
money penalty assessment by the Board. On May 26, 1998, the court issued a preliminary injunction restraining the transfer or disposition of the individual's assets and appoint-ing the Federal Reserve Bank of New York as receiver for those assets. Following entry of the Board's order requiring restitution, 85 Federal Reserve Bulletin 142 (1998), the court granted the Board's motion for judgment in the asset freeze action and authorized a judicial sale of the seized property.
Board of Governors v. Pharaon, No. 98-6101 (2d Cir., filed May 4, 1998). Appeal and cross-appeal of district court order granting in part and denying in part the Board's motion for summary judgment seeking prejudgment interest and a statutory surcharge in connection with a civil money penalty assessed by the Board. On February 24, 1999, the court granted the Board's appeal and denied the cross-appeal, and remanded the matter to the district court for determination of prejudgment interest due to the Board.
FINAL ENFORCEMENT DECISION ISSUED BY THE BOARD OF GOVERNORS
In the Matter of a Notice to Prohibit Further Participation Against Kaye G. Hill, Former Employee,
Barnett Bank, N.A. Jacksonville, Florida
Docket No. 0CC-AA-EC-00-24
Final Decision
This is an administrative proceeding pursuant to the Fed-eral Deposit Insurance Act ("FDI Act") in which the Office of the Comptroller of the Currency of the United States of America ("OCC") seeks to prohibit the Respon-dent, Kaye G. Hill ("Respondent"), from further participa-tion in the affairs of any financial institution because of her conduct as an employee of Barnett Bank, N.A., Jackson-ville, Florida (the "Bank"). Under the FDI Act, the OCC may initiate a prohibition proceeding against a former employee of a national bank, but the Board must make the final determination whether to issue an order of prohibi-tion.
Upon review of the administrative record, the Board issues this Final Decision adopting the Recommended De-cision ("RD") of Administrative Law Judge Ann Z. Cook (the "ALJ"), and orders the issuance of the attached Order of Prohibition.
/. Statement of the Case
A. Statutory and Regulatory Framework
Under the FDI Act and the Board's regulations, the ALJ is responsible for conducting proceedings on a notice of
Digitized for FRASER http://fraser.stlouisfed.org/ Federal Reserve Bank of St. Louis

100 Federal Reserve Bulletin • February 2001
charges. 12 U.S.C. § 1818(e)(4). The ALJ issues a recom-mended decision that is referred to the deciding agency together with any exceptions to those recommendations filed by the parties. The Board makes the final findings of fact, conclusions of law, and determination whether to issue an order of prohibition in the case of prohibition orders sought by the OCC. Id.; 12 C.F.R. 263.40.
The FDI Act sets forth the substantive basis upon which a federal banking agency may issue against a bank official or employee an order of prohibition from further participa-tion in banking. To issue such an order, the Board must make each of three findings: (1) That the respondent engaged in identified misconduct,
including a violation of law or regulation, an unsafe or unsound practice or a breach of fiduciary duty;
(2) That the conduct had a specified effect, including financial loss to the institution or gain to the respon-dent; and
(3) That the respondent's conduct involved either personal dishonesty or a willful or continuing disregard for the safety or soundness of the institution. 12 U.S.C. § 1818(e)(l)(A)-(C).
An enforcement proceeding is initiated by the filing of a notice of charges which is served on the respondent. Under the OCC's and the Board's regulations, the respondent must file an answer within 20 days of service of the notice. 12 C.F.R. 19.19(a) and 263.19(a). Failure to file an answer constitutes a waiver of the respondent's right to contest the allegations in the notice, and a final order may be entered unless good cause is shown for failure to file a timely answer. 12 C.F.R. 19.19(c)(1) and 263.19(c)(1).
B. Procedural History
On April 6, 2000, the OCC issued a Notice initiating an enforcement action that sought an order of prohibition due to Respondent's actions in taking $5000 from two cus-tomer accounts at the Bank. The Notice directed Respon-dent to file an answer within 20 days, and warned that failure to do so would constitute a waiver of her right to appear and contest the allegations. The record shows that the Respondent received a copy of the Notice by certified mail. Nonetheless, Respondent filed to file an answer within the 20-day period. Consequently, on May 22, 2000, the ALJ issued an Order directing Respondent to show cause for her failure to file an answer. Respondent did not respond to the Order.
On November 30, 2000, the ALJ issued a Recommended Decision finding Respondent in default and adopting as her factual findings the allegations in the Notice. On the basis of those findings, the ALJ recommended that an order of prohibition be entered against the Respondent.
II. Discussion
The OCC's Rules of Practice and Procedure set forth the requirements of an answer and the consequences of a failure to file an answer to a Notice. Under the Rules,
failure to file a timely answer "constitutes a waiver of [a respondent's] right to appear and contest the allegations in the Notice." 12 C.F.R. 19.19(c). If the ALJ finds that no good cause has been shown for the failure to file, the judge "shall file . . . a recommended decision containing the findings and the relief sought in the notice." Id. An order based on a failure to file a timely answer is deemed to be issued by consent. Id.
In this case, Respondent failed to file an answer despite notice to her of the consequences of such failure, and also failed to respond to the ALJ's Order to show cause. Re-spondent's failure to file an answer constitutes a default.
Respondent's default requires the Board to consider the allegations in the Notice as uncontested. The Notice al-leges, and the Board finds, that Respondent made an unau-thorized withdrawal of $3000 from one customer account, and closed another, reopening it the same day with $2000 less in the reopened account. This conduct meets all the criteria for entry of an order of prohibition under 12 U.S.C. § 1818(e). It is a violation of law and an unsafe or unsound practice for a bank employee to embezzle customer funds. Respondent's actions caused gain to herself as well as loss to the Bank. Finally, Respondent's actions involved per-sonal dishonesty in taking property not her own. The requirements for an order of prohibition having been met, the Board has determined that such an order will issue.
Conclusion
For these reasons, the Board orders the issuance of the attached Order of Prohibition.
By Order of the Board of Governors, this 13th day of December, 2000.
Board of Governors of the Federal Reserve System
JENNIFER J. JOHNSON Secretary of the Board
Order of Prohibition
WHEREAS, pursuant to section 8(e) of the Federal De-posit Insurance Act, as amended, (the "Act") (12 U.S.C. § 1818(e)), the Board of Governors of the Federal Reserve System ("the Board") is of the opinion, for the reasons set forth in the accompanying Final Decision, that a final Order of Prohibition should issue against KAYE G. HILL ("HILL"),
NOW, THEREFORE, IT IS HEREBY ORDERED, pur-suant to section 8(e) of the Federal Deposit Insurance Act, as amended, (12 U.S.C. § 1818(e)), that:
1. In the absence of prior written approval by the Board, and by any other Federal financial institution regula-tory agency where necessary pursuant to section 8(e)(7)(B) of the Act (12 U.S.C. § 1818(e)(7)(B)), Hill is hereby prohibited: (a) From participating in the conduct of the affairs of
any bank holding company, any insured depository
Digitized for FRASER http://fraser.stlouisfed.org/ Federal Reserve Bank of St. Louis

Legal Developments 101
institution or any other institution specified in sub-section 8(e)(7)(A) of the Act (12 U.S.C. § 1818(e)(7)(A));
(b) From soliciting, procuring, transferring, attempting to transfer, voting or attempting to vote any proxy, consent, or authorization with respect to any voting rights in any institution described in subsection 8(e)(7)(A) of the Act (12 U.S.C. § 1818(e)(7)(A));
(c) From violating any voting agreement previously approved by the appropriate Federal banking agency; or
(d) From voting for a director, or from serving or acting as an institution-affiliated party as defined in section 3(u) of the Act, (12 U.S.C. § 1813(u)), such as an officer, director, or employee.
2. This Order, and each provision hereof, is and shall remain fully effective and enforceable until expressly stayed, modified, terminated or suspended in writing by the Board.
This Order shall become effective at the expiration of thirty days after service is made.
By Order of the Board of Governors, this 13th day of December, 2000.
Board of Governors of the Federal Reserve System
JENNIFER J. JOHNSON Secretary of the Board
FINAL ENFORCEMENT ORDERS ISSUED BY THE BOARD OF GOVERNORS
Bruce Jeffrey Kingdon New York, New York
The Federal Reserve Board announced on December 12, 2000, the issuance of an Order of Prohibition against Bruce Jeffrey Kingdon, a former partner, operating committee member, managing director, employee, and institution-
affiliated party of the Bankers Trust Company, New York, New York.
DETERMINATION NOT TO CONDUCT A TERMINATION PROCEEDING
Bancomer, S.A. Mexico City, Mexico
The Federal Reserve Board announced on December 12, 2000, pursuant to section 7(i) of the International Banking Act ("IBA"), the Board of Governors has determined that it is not necessary to conduct a proceeding to determine if the United States operations of Bancomer, S.A., Mexico City, Mexico ("Bancomer"), and Banca Serfin, S.A., Lo-mas de Santa Fe, Mexico ("Serfin"), foreign banks within the meaning of the IBA, should be terminated as a result of Bancomer and Serfin each having been found guilty of a money laundering offense in the United States.
WRITTEN AGREEMENTS APPROVED BY FEDERAL RESERVE BANKS
People's Bancshares, Inc. New Bedford, Massachusetts
The Federal Reserve Board announced on December 12, 2000, the execution of a Written Agreement by and be-tween People's Bancshares, Inc., New Bedford, Massachu-setts, and the Federal Reserve Bank of Boston.
Caisse Nationale de Credit Agricole Paris, France
The Federal Reserve Board announced on December 1, 2000, the execution of a Written Agreement by and among Caisse Nationale de Credit Agricole, Paris, France; Credit Agricole Indosuez, Paris, France; Credit Agricole In-dosuez, New York Branch, New York, New York; the Federal Reserve Bank of New York; and the New York State Banking Department.
Digitized for FRASER http://fraser.stlouisfed.org/ Federal Reserve Bank of St. Louis

60
Financial and Business Statistics
A3 GUIDE TO TABULAR PRESENTATION
DOMESTIC FINANCIAL STATISTICS
Money Stock and Bank Credit
A4 Reserves, money stock, and debt measures A5 Reserves of depository institutions and Reserve Bank
credit A6 Reserves and borrowings—Depository
institutions
Policy Instruments
A7 Federal Reserve Bank interest rates A8 Reserve requirements of depository institutions A9 Federal Reserve open market transactions
Federal Reserve Banks
A10 Condition and Federal Reserve note statements A l l Maturity distribution of loan and security
holding
Monetary and Credit Aggregates
A12 Aggregate reserves of depository institutions and monetary base
A13 Money stock and debt measures
Commercial Banking Institutions— Assets and Liabilities
A15 All commercial banks in the United States A16 Domestically chartered commercial banks A17 Large domestically chartered commercial banks A19 Small domestically chartered commercial banks A20 Foreign-related institutions
Financial Markets
A22 Commercial paper and bankers dollar acceptances outstanding
A22 Prime rate charged by banks on short-term business loans
A23 Interest rates—Money and capital markets A24 Stock market—Selected statistics
Federal Finance
A25 Federal fiscal and financing operations A26 US. budget receipts and outlays A27 Federal debt subject to statutory limitation
Federal Finance—Continued
All Gross public debt of U.S. Treasury— Types and ownership
A28 U.S. government securities dealers—Transactions
A29 U.S. government securities dealers— Positions and financing
A30 Federal and federally sponsored credit agencies—Debt outstanding
Securities Markets and Corporate Finance
A31 New security issues—Tax-exempt state and local governments and corporations
A32 Open-end investment companies—Net sales and assets
A32 Corporate profits and their distribution A3 2 Domestic finance companies—Assets and liabilities A3 3 Domestic finance companies—Owned and managed
receivables
Real Estate
A34 Mortgage markets—New homes A3 5 Mortgage debt outstanding
Consumer Credit
A3 6 Total outstanding A3 6 Terms
Flow of Funds
A37 Funds raised in U.S. credit markets A39 Summary of financial transactions A40 Summary of credit market debt outstanding A41 Summary of financial assets and liabilities
DOMESTIC NONFINANCIAL STATISTICS
Selected Measures
A42 Nonfinancial business activity A42 Labor force, employment, and unemployment A43 Output, capacity, and capacity utilization A44 Industrial production—Indexes and gross value A46 Housing and construction A47 Consumer and producer prices A48 Gross domestic product and income A49 Personal income and saving
Digitized for FRASER http://fraser.stlouisfed.org/ Federal Reserve Bank of St. Louis

61 Federal Reserve Bulletin • February 2001
INTERNATIONAL STATISTICS
Summary Statistics
A50 U.S. international transactions A51 U.S. foreign trade A51 U.S. reserve assets A51 Foreign official assets held at Federal Reserve
Banks A52 Selected U.S. liabilities to foreign official
institutions
Reported by Banks in the United States
A52 Liabilities to, and claims on, foreigners A53 Liabilities to foreigners A55 Banks' own claims on foreigners A56 Banks' own and domestic customers' claims on
foreigners A56 Banks' own claims on unaffiliated foreigners A57 Claims on foreign countries—Combined
domestic offices and foreign branches
Reported by Nonbanking Business Enterprises in the United States
A58 Liabilities to unaffiliated foreigners A59 Claims on unaffiliated foreigners
Securities Holdings and Transactions
A60 Foreign transactions in securities A61 Marketable U.S. Treasury bonds and
notes—Foreign transactions
Interest and Exchange Rates
A62 Foreign exchange rates
A63 GUIDE TO STATISTICAL RELEASES AND SPECIAL TABLES
SPECIAL TABLES
A64 Assets and liabilities of commercial banks, September 30, 2000
A66 Terms of lending at commercial banks, November 2000
A72 Assets and liabilities of U.S. branches and agencies of foreign banks, September 30, 2000
A76 Pro forma balance sheet and income statements for priced service operations, September 30, 2000
A78 INDEX TO STATISTICAL TABLES
Digitized for FRASER http://fraser.stlouisfed.org/ Federal Reserve Bank of St. Louis

A3
Guide to Tabular Presentation
SYMBOLS AND ABBREVIATIONS
c Corrected G-7 Group of Seven e Estimated G-10 Group of Ten n.a. Not available GDP Gross domestic product n.e.c. Not elsewhere classified GNMA Government National Mortgage Association P Preliminary HUD Department of Housing and Urban r Revised (Notation appears on column heading Development
when about half of the figures in that column IMF International Monetary Fund are changed.) IOs Interest only, stripped, mortgage-back securities
Amounts insignificant in terms of the last decimal IPCs Individuals, partnerships, and corporations place shown in the table (for example, less than IRA Individual retirement account 500,000 when the smallest unit given is millions) MMDA Money market deposit account
0 Calculated to be zero MSA Metropolitan statistical area Cell not applicable NOW Negotiable order of withdrawal
ABS Asset-backed security OCDs Other checkable deposits ATS Automatic transfer service OPEC Organization of Petroleum Exporting Countries BIF Bank insurance fund OTS Office of Thrift Supervision CD Certificate of deposit PMI Private mortgage insurance CMO Collateralized mortgage obligation POs Principal only, stripped, mortgage-back securities CRA Community Reinvestment Act of 1977 REIT Real estate investment trust FAMC Federal Agricultural Mortgage Corporation REMICs Real estate mortgage investment conduits FFB Federal Financing Bank RHS Rural Housing Service FHA Federal Housing Administration RP Repurchase agreement FHLBB Federal Home Loan Bank Board RTC Resolution Trust Corporation FHLMC Federal Home Loan Mortgage Corporation SCO Securitized credit obligation FmHA Farmers Home Administration SDR Special drawing right FNMA Federal National Mortgage Association SIC Standard Industrial Classification FSA Farm Service Agency VA Department of Veterans Affairs FSLIC Federal Savings and Loan Insurance Corporation
GENERAL INFORMATION
In many of the tables, components do not sum to totals because of rounding.
Minus signs are used to indicate (1) a decrease, (2) a negative figure, or (3) an outflow.
"U.S. government securities" may include guaranteed issues of U.S. government agencies (the flow of funds figures also
include not fully guaranteed issues) as well as direct obliga-tions of the Treasury.
"State and local government" also includes municipalities, special districts, and other political subdivisions.
Digitized for FRASER http://fraser.stlouisfed.org/ Federal Reserve Bank of St. Louis

A4 Domestic Nonfinancial Statistics • February 2001
1 . 1 0 R E S E R V E S , M O N E Y S T O C K , A N D D E B T M E A S U R E S
Percent annual rate of change, seasonally adjusted1
Monetary or credit aggregate 1999 2000 2000
Monetary or credit aggregate Q4 Q1 Q2 Q3r Julyr Aug.1" Sept.1" Oct.r Nov.
Reserves of depository institutions2
1 Total - 3 . 4 1.8 - 9 . 5 - 7 . 1 9.0 - 9 . 4 - 2 . 5 - 9 . 7 - 2 . 9 2 Required - 4 . 5 .1 - 5 . 9 - 7 . 4 9.1 - 8 . 0 - 5 . 3 - 1 0 . 8 - 5 . 2 3 Nonborrowed - 3 . 0 2.4 -11 .1 - 8 . 8 6.4 - 9 . 8 .6 - 8 . 0 1.2 4 Monetary base3 20.4 4.3 - 3 . 2 2.6 3.7 .6 3.2 3.5 - 1 . 9
Concepts of money and debt4
5 Ml 4.8 .0 - 1 . 0 r - 2 . 7 .2 - 3 . 7 - 5 . 2 4.6 - 1 0 . 7 6 M2 5.2r 6.3 6.5r 4.8 3.6 7.6 9.0 4.6 2.7 7 M3 10.6r 11.3 8.6 8.3 8.8 9.9 8.8 4.0 3.2 8 Debt 6.3 5.6 6.2 4.7 4.3 4.0 5.0 2.7 n.a.
Nontransaction components y In M25 5.4r 8.3 8.8 7.0 4.6 11.0 13.2 4.6 6.6
10 In M3 only6 25.0r 24.3 13.8r 17.1 21.4 15.3 8.2 2.6 4.4
Time and savings deposits Commercial banks
n Savings, including MMDAs 4.2 3.1' 8.1 10.7 10.4 14.8 22.3 1.5 10.5 12 Small time7 6.9r 9.3 13.7 10.9 9.1 9.9 4.2 1.4 5.9 13 Large time8'9 38.6r 22.0r 17.31 9.9 11.2 17.6 -18 .1 - 9 . 3 13.9
Thrift institutions 14 Savings, including MMDAs - 3 . 3 - 1 . 7 2.0r 2.0 - 1 . 3 5.8 2.6 .5 - 2 . 1 15 Small time7 5.1 7.2 3.8r 11.6 12.4 15.8 8.9 8.5 8.8 16 Large time8 6.0 18.5r — .& 16.7 22.6 20.9 6.1 21.7 20.1
Money market mutual funds 17 Retail 11.0r 20.8r 11.7 - . 6 - 7 . 3 6.8 13.5 12.4 5.1 18 Institution-only 22.4r 23.7r 13.9r 32.9 51.3 27.2 32.3 6.6 U . l
Repurchase agreements and eurodollars 19 Repurchase agreements10 19.5 22.5 10.8 7.3 5.2 - 1 7 . 9 - 3 . 6 .0 - 2 5 . 2 20 Eurodollars'0 10.0 41.1 15.4 4.8 - 1 9 . 8 24.7 33.1 22.3 - 6 . 7
Debt components4
21 Federal - 4 . 4 - 4 . 8 - 7 . 5 - 7 . 2 - 3 . 7 - 7 . 3 - 4 . 8 - 1 0 . 0 n.a. 22 Nonfederal 9.2r 8.4 9.7 7.6 6.3 6.7 7.4 5.7 n.a.
1. Unless otherwise noted, rates of change are calculated from average amounts outstand-ing during preceding month or quarter.
2. Figures incorporate adjustments for discontinuities, or "breaks," associated with regulatory changes in reserve requirements. (See also table 1.20.)
3. The seasonally adjusted, break-adjusted monetary base consists of (1) seasonally adjusted, break-adjusted total reserves (line 1), plus (2) the seasonally adjusted currency component of the money stock, plus (3) (for all quarterly reporters on the "Report of Transaction Accounts, Other Deposits and Vault Cash" and for all weekly reporters whose vault cash exceeds their required reserves) the seasonally adjusted, break-adjusted difference between current vault cash and the amount applied to satisfy current reserve requirements.
4. Composition of the money stock measures and debt is as follows: Ml: (1) currency outside the U.S. Treasury, Federal Reserve Banks, and the vaults of
depository institutions, (2) travelers checks of nonbank issuers, (3) demand deposits at all commercial banks other than those owed to depository institutions, the U.S. government, and foreign banks and official institutions, less cash items in the process of collection and Federal Reserve float, and (4) other checkable deposits (OCDs), consisting of negotiable order of withdrawal (NOW) and automatic transfer service (ATS) accounts at depository institutions, credit union share draft accounts, and demand deposits at thrift institutions. Seasonally adjusted Ml is computed by summing currency, travelers checks, demand deposits, and OCDs, each seasonally adjusted separately.
M2: Ml plus (1) savings (including MMDAs), (2) small-denomination time deposits (time deposits—including retail RPs—in amounts of less than $100,000), and (3) balances in retail money market mutual funds. Excludes individual retirement accounts (IRAs) and Keogh balances at depository institutions and money market funds. Seasonally adjusted M2 is calculated by summing savings deposits, small-denomination time deposits, and retail money fund balances, each seasonally adjusted separately, and adding this result to seasonally adjusted Ml .
M3: M2 plus (1) large-denomination time deposits (in amounts of $100,000 or more), (2) balances in institutional money funds, (3) RP liabilities (overnight and term) issued by all
depository institutions, and (4) eurodollars (overnight and term) held by U.S. residents at foreign branches of U.S. banks worldwide and at all banking offices in the United Kingdom and Canada. Excludes amounts held by depository institutions, the U.S. government, money market funds, and foreign banks and official institutions. Seasonally adjusted M3 is calculated by summing large time deposits, institutional money fund balances, RP liabilities, and eurodollars, each seasonally adjusted separately, and adding this result to seasonally adjusted M2.
Debt: The debt aggregate is the outstanding credit market debt of the domestic nonfinancial sectors—the federal sector (U.S. government, not including government-sponsored enter-prises or federally related mortgage pools) and the nonfederal sectors (state and local governments, households and nonprofit organizations, nonfinancial corporate and nonfarm noncorporate businesses, and farms). Nonfederal debt consists of mortgages, tax-exempt and corporate bonds, consumer credit, bank loans, commercial paper, and other loans. The data, which are derived from the Federal Reserve Board's flow of funds accounts, are break-adjusted (that is, discontinuities in the data have been smoothed into the series) and month-averaged (that is, the data have been derived by averaging adjacent month-end levels).
5. Sum of (1) savings deposits (including MMDAs), (2) small time deposits, and (3) retail money fund balances, each seasonally adjusted separately.
6. Sum of (1) large time deposits, (2) institutional money fund balances, (3) RP liabilities (overnight and term) issued by depository institutions, and (4) eurodollars (overnight and term) of U.S. addressees, each seasonally adjusted separately.
7. Small time deposits—including retail RPs—are those issued in amounts of less than $100,000. All IRA and Keogh account balances at commercial banks and thrift institutions are subtracted from small time deposits.
8. Large time deposits are those issued in amounts of $100,000 or more, excluding those booked at international banking facilities.
9. Large time deposits at commercial banks less those held by money market funds, depository institutions, the U.S. government, and foreign banks and official institutions.
10. Includes both overnight and term.
Digitized for FRASER http://fraser.stlouisfed.org/ Federal Reserve Bank of St. Louis
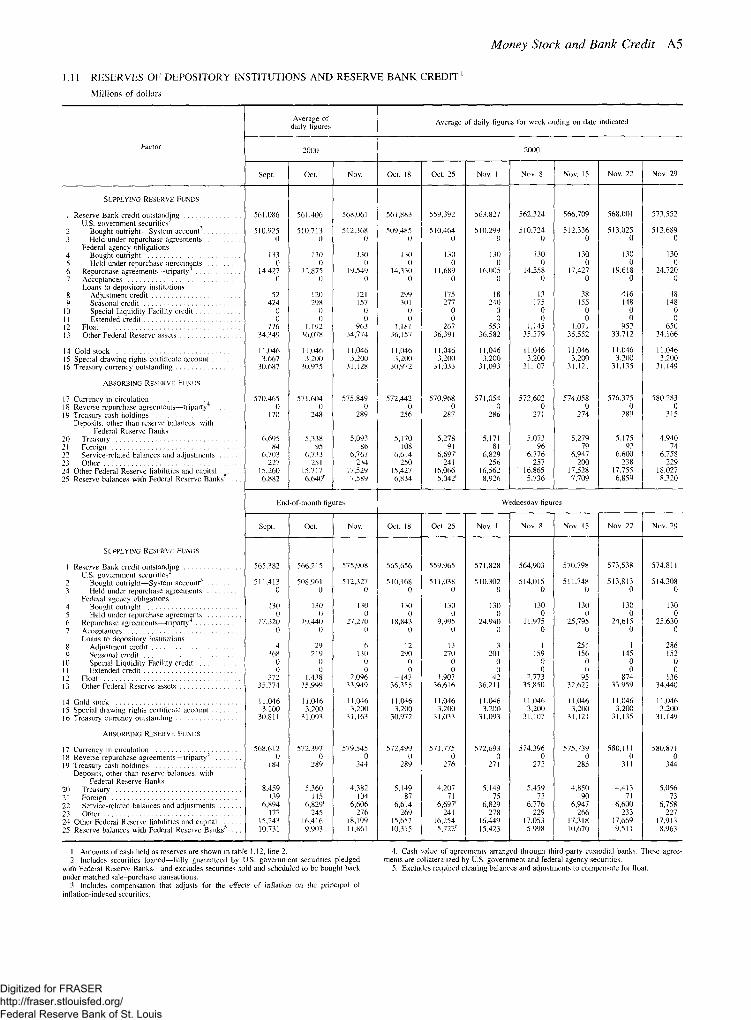
Money Stock and Bank Credit A5
. 11 RESERVES OF DEPOSITORY INSTITUTIONS AND RESERVE BANK CREDIT1
Millions of dollars
Average of daily figures Average of daily figures for week ending on date indicated
2000 2000
Sept. Oct. Nov. Oct. 18 Oct. 25 Nov. 1 Nov. 8 Nov. 15 Nov. 22 Nov. 29
561,086 561,406 568,061 561,883 559,392 563,827 562,324 566,709 568,001 573,552
510,925 0
510,713 0
512,368 0
509,485 0
510,464 0
510,299 0
510,724 0
512,336 0
513,025 0
513,689 0
133 0
14,427 0
130 0
12,875 0
130 0
19,549 0
130 0
14,330 0
130 0
11,689 0
130 0
16,005 0
130 0
14,558 0
130 0
17,427 0
130 0
19,618 0
130 0
24,720 0
52 424
0 0
776 34,349
120 298
0 0
1,192 36,078
121 157
0 0
963 34,774
299 301
0 0
1,181 36,157
175 277
0 0
267 36,391
18 240
0 0
553 36,582
13 175
0 0
1,145 35,579
38 155
0 0
1,071 35,552
416 148
0 0
952 33,712
48 148
0 0
650 34,166
11,046 3,667
30,687
11,046 3,200
30,975
11,046 3,200
31,128
11,046 3,200
30,972
11,046 3,200
31,033
11,046 3,200
31,093
11,046 3,200
31,107
11,046 3,200
31,121
11,046 3,200
31,135
11,046 3,200
31,149
570,465 0
170
571,604 0
248
575,849 0
289
572,442 0
256
570,968 0
287
571,054 0
286
572,602 0
271
574,058 0
274
576,375 0
289
580,283 0
315
6,695 84
6,703 227
15,260 6,882
5,338 95
6,733 251
15,717 6,640r
5,093 86
6,767 234
17,529 7,589
5,170 108
6,614 250
15,427 6,834
5,278 91
6,697r
241 16,066 5,042r
5,171 81
6,829 256
16,562 8,926
5,073 96
6,776 257
16,865 5,736
5,279 79
6,947 200
17,528 7,709
5,175 92
6,600 238
17,755 6,859
4,940 74
6,758 229
18,027 8,320
End-of-month figures Wednesday figures
Sept. Oct. Nov. Oct. 18 Oct. 25 Nov. 1 Nov. 8 Nov. 15 Nov. 22 Nov. 29
565,382 566,215 575,908 565,656 559,965 571,828 564,903 570,798 573,538 574,811
511,413 0
508,961 0
512,327 0
510,168 0
511,038 0
510,302 0
514,015 0
511,748 0
513,813 0
514,308 0
130 0
17,320 0
130 0
19,440 0
130 0
27,270 0
130 0
18,843 0
130 0
9,995 0
130 0
24,940 0
130 0
11,975 0
130 0
25,795 0
130 0
24,615 0
130 0
25,630 0
4 368
0 0
372 35,774
29 219
0 0
1,438 35,999
6 130
0 0
2,096 33,949
12 290
0 0
- 1 4 3 36,355
13 270
0 0
1,903 36,616
3 201
0 0
42 36,211
1 159
0 0
2,773 35,850
251 156
0 0
95 32,622
1 145
0 0
874 33,959
286 152
0 0
- 1 3 6 34,440
11,046 3,200
30,811
11,046 3,200
31,093
11,046 3.200
31,163
11,046 3,200
30,972
11,046 3,200
31,033
11,046 3,200
31,093
11,046 3,200
31,107
11,046 3,200
31,121
11,046 3,200
31,135
11,046 3,200
31,149
568,612 0
184
572,397 0
289
579,545 0
344
572,499 0
289
571,775 0
276
572,693 0
271
574,396 0
272
575,739 0
285
580,111 0
311
580,871 0
344
8,459 139
6,894 177
15,243 10,731
5,360 115
6,829r
245 16,416 9,903
4,382 104
6,606 276
18,199 11,861
5,149 87
6,614 269
15,652 10,315
4,207 71
6,697r
241 16,254 5,722r
5,149 75
6,829 278
16,449 15,423
5,459 72
6,776 229
17,053 5,998
4,850 90
6,947 266
17,318 10,670
4,413 71
6,600 233
17,669 9,511
5,056 73
6,758 227
17,913 8,963
SUPPLYING RESERVE FUNDS
1 Reserve Bank credit outstanding U.S. government securities"
2 Bought outright—System account' 3 Held under repurchase agreements
Federal agency obligations 4 Bought outright 5 Held under repurchase agreements 6 Repurchase agreements—triparty4
7 Acceptances Loans to depository institutions
8 Adjustment credit 9 Seasonal credit
10 Special Liquidity Facility credit 11 Extended credit 12 Float 13 Other Federal Reserve assets
14 Gold stock 15 Special drawing rights certificate account 16 Treasury currency outstanding
ABSORBING RESERVE FUNDS
17 Currency in circulation . . . . 18 Reverse repurchase agreements—triparty . . . 19 Treasury cash holdings
Deposits, other than reserve balances, with Federal Reserve Banks
20 Treasury 21 Foreign 22 Service-related balances and adjustments . 23 Other 24 Other Federal Reserve liabilities and capital 25 Reserve balances with Federal Reserve Banks
SUPPLYING RESERVE FUNDS
1 Reserve Bank credit outstanding U.S. government securities"
2 Bought outright—System account' 3 Held under repurchase agreements
Federal agency obligations 4 Bought outright 5 Held under repurchase agreements 6 Repurchase agreements—triparty 7 Acceptances
Loans to depository institutions 8 Adjustment credit 9 Seasonal credit
10 Special Liquidity Facility credit 11 Extended credit 12 Float 13 Other Federal Reserve assets
14 Gold stock 15 Special drawing rights certificate account 16 Treasury currency outstanding
ABSORBING RESERVE FUNDS
17 Currency in circulation • . . . 18 Reverse repurchase agreements—triparty . . . 19 Treasury cash holdings
Deposits, other than reserve balances, with Federal Reserve Banks
20 Treasury 21 Foreign 22 Service-related balances and adjustments . 23 Other 24 Other Federal Reserve liabilities and capital 25 Reserve balances with Federal Reserve Banks
1. Amounts of cash held as reserves are shown in table 1.12, line 2. 2. Includes securities loaned—fully guaranteed by U.S. government securities pledged
with Federal Reserve Banks—and excludes securities sold and scheduled to be bought back under matched sale-purchase transactions.
3. Includes compensation that adjusts for the effects of inflation on the principal of inflation-indexed securities.
4. Cash value of agreements arranged through third-party custodial banks. These agree-ments are collateralized by U.S. government and federal agency securities.
5. Excludes required clearing balances and adjustments to compensate for float.
Digitized for FRASER http://fraser.stlouisfed.org/ Federal Reserve Bank of St. Louis

A6 Domestic Nonfinancial Statistics • February 2001
1.12 R E S E R V E S A N D B O R R O W I N G S Deposi tory Institutions1
Millions of dollars
Prorated monthly averages of biweekly averages
Reserve classification 1997 1998 1999 2000 Reserve classification
Dec. Dec. Dec. May June July Aug. Sept. Oct/ Nov.
1 Reserve balances with Reserve Banks2 10,664 9,026 5,263 7,661 6,460 6,582 6,875 6,829 6,782 7,157 2 Total vault cash3 44,742 44,294 60,619r 44,643 44,560 45,473r 45,319r 44,807r 45,178 44,544 3 Applied vault cash4 37,255 36,183 36,392 33,898 32,757 33,086 32,611 32,429 32,072 31,635 4 Surplus vault cash5 7,486 8,111 24,227r 10,745 11,802 12,387r 12,708r 12,378r 13,105 12,909 5 Total reserves6 47,919 45,209 41,655 41,558 39,217 39,668 39,486 39,257 38,854 38,792 6 Required reserves 46,235 43,695 40,348 40,616 38,153 38,600 38,471 38,155 37,725 37,590 7 Excess reserve balances at Reserve Banks7 1,685 1,514 1,307 943 1,064 1,068 1,014 1,102 1,129 1,202 8 Total borrowing at Reserve Banks 324 117 320 362 479 570 579 477 418 283 9 Adjustment 245 101 179 86 90 60 25 50 119 124
10 Seasonal 79 15 67 276 389 510 554 427 299 159 11 Special Liquidity Facility8 0 0 74 0 0 0 0 0 0 0 12 Extended credit9 0 0 0 0 0 0 0 0 0 0
Biweekly averages of daily figures for two-week periods ending on dates indicated
2000
Aug. 9 Aug. 23 Sept. 6 Sept. 20 Oct. 4 Oct. 18 Nov. 1' Nov. 15 Nov. 29 Dec. 13
1 Reserve balances with Reserve Banks2 7,267 6,603 6,911 6,578 7,131 6,502 6,976 6,709 7,621 7,142 2 Total vault cash3 46,287r 45,395' 44,097r 44,823r 45,210' 45,778' 44,521 44,631 44,537 43,450 3 Applied vault cash4 33,638 32,195 32,184 32,077 33,068 31,601 32,274 31,056 32,262 30,319 4 Surplus vault cash5 12,649r 13,201r 11,913r 12,746' 12,142' 14,177' 12,247 13,575 12,275 13,131 5 Total reserves6 40,904 38,797 39,095 38,655 40,198 38,103 39,250 37,765 39,883 37,461 6 Required reserves 39,802 37,818 38,118 37,612 38,938 37,073 38,056 36,762 38,477 36,317 7 Excess reserve balances at Reserve Banks7 1,102 979 977 1,043 1,260 1,030 1,194 1,003 1,406 1,144 8 Total borrowing at Reserve Banks 581 564 604 473 409 480 355 190 380 159 9 Adjustment 27 12 45 70 26 167 97 25 232 37
10 Seasonal 555 552 559 403 383 313 259 165 148 123 11 Special Liquidity Facility8
12 Extended credit9 0 0 0 0 0 0 0 0 0 0
1. Data in this table also appear in the Board's H.3 (502) weekly statistical release. For ordering address, see inside front cover. Data are not break-adjusted or seasonally adjusted.
2. Excludes required clearing balances and adjustments to compensate for float and includes other off-balance-sheet "as-of ' adjustments.
3. Vault cash eligible to satisfy reserve requirements. It includes only vault cash held by those banks and thrift institutions that are not exempt from reserve requirements. Dates refer to the maintenance periods in which the vault cash can be used to satisfy reserve require-ments.
4. All vault cash held during the lagged computation period by "bound" institutions (that is, those whose required reserves exceed their vault cash) plus the amount of vault cash applied during the maintenance period by "nonbound" institutions (that is, those whose vault cash exceeds their required reserves) to satisfy current reserve requirements.
5. Total vault cash (line 2) less applied vault cash (line 3). 6. Reserve balances with Federal Reserve Banks (line 1) plus applied vault cash
(line 3). 7. Total reserves (line 5) less required reserves (line 6). 8. Borrowing at the discount window under the terms and conditions established for the
Century Date Change Special Liquidity Facility in effect from October 1, 1999, through April 7, 2000.
9. Consists of borrowing at the discount window under the terms and conditions estab-lished for the extended credit program to help depository institutions deal with sustained liquidity pressures. Because there is not the same need to repay such borrowing promptly as with traditional short-term adjustment credit, the money market effect of extended credit is similar to that of nonborrowed reserves.
Digitized for FRASER http://fraser.stlouisfed.org/ Federal Reserve Bank of St. Louis

Policy Instruments A 7
1.14 FEDERAL RESERVE BANK INTEREST RATES
P e r c e n t p e r y e a r
Current and previous levels
Adjustment credit1 Seasonal credit ' Extended credit3
Federal Reserve Federal Reserve Bank On
1/5/01 Effective date Previous rate On 1/5/01 Effective date Previous rate On
1/5/01 Effective date Previous rate
Boston 5.50 1/4/01 6.00 6.45 12/28/00 6.55 6.95 12/28/00 7.05 New York 1/4/01 5.75 Philadelphia Cleveland
1/4/01 1/4/01
6.00 5.75
Richmond 1/4/01 6.00 Atlanta 1/4/01 5.75
Chicago St. Louis
1/4/01 1/5/01
6.00 5.75
Minneapolis Kansas City
1/4/01 1/4/01
6.00 5.75
Dallas 1/4/01 5.75 San Francisco . . . . 5.50 1/4/01 5.75 6.45 12/28/00 6.55 6.95 12/28/00 7.05
Range of rates for adjustment credit in recent years4
Range (or level)—All F.R. Banks
F.R. Bank of
N.Y.
Range (or F.R. Bank Range (or F.R. Bank level)—All of Effective date level)—All of F.R. Banks N.Y. F.R. Banks N.Y.
9.5-10 9.5 1994—May 17 3-3.5 3.5 9.5 9.5 18 3.5 3.5
9-9.5 9 Aug. 16 3.5-4 4 9 9 18 4 4
8.5-9 9 Nov. 15 4-4.75 4.75 8.5-9 8.5 17 4.75 4.75
8.5 8.5 1995—Feb. 1 4.75-5.25 5.25
8.5-9 9 9 5.25 5.25 9 9
8.5-9 8.5 1996—Jan. 31 5.00-5.25 5.00 8.5 8.5 Feb. 5 5.00 5.00
8 1998—Oct. 15 4.75-5.00 4.75
7.5-8 7.5 16 4.75 4.75 7.5 7.5 Nov. 17 4 . 5 0 ^ . 7 5 4.50
19 4.50 4.50 7-7.5 7
7 7 1999—Aua. 24 4.50-4.75 4.75 6.5-7 6.5 26 4.75 4.75
6.5 6.5 Nov. 16 4.75-5.00 4.75 6 6 18 5.00 5.00
5.5-6 5.5 5.5 5.5 2000—Feb. 2 5.00-5.25 5.25
4 5.25 5.25 5.5-6 6 Mar. 21 5.25-5.50 5.50
6 6 23 5.50 5.50 May 16 5.50-6.00 5.50
6-6 .5 6.5 19 6.00 6.00 6.5 6.5
2001—Jan. 3 5.75-6.00 5.75 6.5-7 7 4 5.50-5.75 5.50
7 7 5 5.50 5.50
6.5 6.5 In effect Jan. 5, 2001 5.50 5.50
6-6.5 6 6 6
5.5-6 5.5 5.5 5.5
5-5.5 5 5 5
4.5-5 4.5 4.5 4.5
3.5^1.5 3.5 3.5 3.5
3-3.5 3 3 3
In effect Dec. 31, 1977
1978—Jan. 9 20 May 11
12 July 3
10 Aug. 21 Sept. 22 Oct. 16
20 Nov. 1
3
1979—July 20 Aug. 17
20 Sept. 19
21 Oct. 8
10
1980—Feb. 15 19
May 29 30
June 13 16
July 28 2 9
Sept. 26 Nov. 17 Dec. 5
8
1981—May 5 8
Nov. 2 6
Dec. 4
1982—July 20 23
Aug. 2 3
16 27 3 0
6-6.5 6.5
6.5-7 7
7-7.25 7.25 7.75
8 8-8.5
8.5 8.5-9.5
9.5
10 10-10.5
10.5 10.5-11
11 11-12 12 12-13
13 12-13
12 11-12
11 10-11
10 11 12
12-13 13
13-14 14
13-14 13 12
11.5-12 11.5
11-11.5 II 10.5
10-10.5 10
6.5 6.5 7 7 7.25 7.25 7.75 8 8.5 8.5 9.5 9.5
10 10.5 10.5 11 11 12 12 13 13 13 12 11 11 10 10 11 12 13 13 14 14 13 13 12
11.5 11.5 11 II 10.5 10 10
1982—Oct. 12 13 Nov. 22
26 Dec. 14
15 17
1984—Apr. 9 13
Nov. 21 26
Dec. 24
1985—May 20 24
1986—Mar. 7 10
Apr. 21 23.
July 11 Aug. 21
22
1987—Sept. 4 11
1988—Aug. 9 11
1989—Feb. 24 27
1990—Dec. 19
1991—Feb. 1 4
Apr. 30 May 2 Sept. 13
17 Nov. 6
7 Dec. 20
24
1992—July 2 7
1. Available on a short-term basis to help depository institutions meet temporary needs for funds that cannot be met through reasonable alternative sources. The highest rate established for loans to depository institutions may be charged on adjustment credit loans of unusual size that result from a major operating problem at the borrower's facility.
2. Available to help relatively small depository institutions meet regular seasonal needs for funds that arise from a clear pattern of intrayearly movements in their deposits and loans and that cannot be met through special industry lenders. The discount rate on seasonal credit takes into account rates charged by market sources of funds and ordinarily is reestablished on the first business day of each two-week reserve maintenance period; however, it is never less than the discount rate applicable to adjustment credit.
3. May be made available to depository institutions when similar assistance is not reasonably available from other sources, including special industry lenders. Such credit may be provided when exceptional circumstances (including sustained deposit drains, impaired access to money market funds, or sudden deterioration in loan repayment performance) or practices involve only a particular institution, or to meet the needs of institutions experiencing difficulties adjusting to changing market conditions over a longer period (particularly at times of deposit disintermediation). The discount rate applicable to adjustment credit ordinarily is charged on extended-credit loans outstanding less than thirty days; however, at the discretion
of the Federal Reserve Bank, this time period may be shortened. Beyond this initial period, a flexible rate somewhat above rates charged on market sources of funds is charged. The rate ordinarily is reestablished on the first business day of each two-week reserve maintenance period, but it is never less than the discount rate applicable to adjustment credit plus 50 basis points.
4. For earlier data, see the following publications of the Board of Governors; Banking and Monetary Statistics, 1914-1941, and 1941-I970-, and the Annual Statistical Digest, 1970-1979.
In 1980 and 1981, the Federal Reserve applied a surcharge to short-term adjustment-credit borrowings by institutions with deposits of $500 million or more that had borrowed in successive weeks or in more than four weeks in a calendar quarter. A 3 percent surcharge was in effect from Mar. 17, 1980, through May 7, 1980. A surcharge of 2 percent was reimposed on Nov. 17, 1980; the surcharge was subsequently raised to 3 percent on Dec. 5, 1980, and to 4 percent on May 5, 1981. The surcharge was reduced to 3 percent effective Sept. 22, 1981, and to 2 percent effective Oct. 12, 1981. As of Oct. 1, 1981, the formula for applying the surcharge was changed from a calendar quarter to a moving thirteen-week period. The surcharge was eliminated on Nov. 17, 1981.
Digitized for FRASER http://fraser.stlouisfed.org/ Federal Reserve Bank of St. Louis

A8 Domestic Nonfinancial Statistics • February 2001
1.15 R E S E R V E R E Q U I R E M E N T S O F D E P O S I T O R Y I N S T I T U T I O N S '
Type of deposit
Net transaction accounts' 1 $0 million-$42.8 million3. . 2 More than $42.8 million4 . .
3 Nonpersonal time deposits5.
4 Eurocurrency liabilities6. . ..
12/28/00 12/28/00
12/27/90
12/27/90
1. Required reserves must be held in the form of deposits with Federal Reserve Banks or vault cash. Nonmember institutions may maintain reserve balances with a Federal Reserve Bank indirectly, on a pass-through basis, with certain approved institutions. For previous reserve requirements, see earlier editions of the Annual Report or the Federal Reserve Bulletin. Under the Monetary Control Act of 1980, depository institutions include commercial banks, savings banks, savings and loan associations, credit unions, agencies and branches of foreign banks, and Edge Act corporations.
2. Transaction accounts include all deposits against which the account holder is permitted to make withdrawals by negotiable or transferable instruments, payment orders of with-drawal, or telephone or preauthorized transfers for the purpose of making payments to third persons or others. However, accounts subject to the rules that permit no more than six preauthorized, automatic, or other transfers per month (of which no more than three may be by check, draft, debit card, or similar order payable directly to third parties) are savings deposits, not transaction accounts.
3. The Monetary Control Act of 1980 requires that the amount of transaction accounts against which the 3 percent reserve requirement applies be modified annually by 80 percent of the percentage change in transaction accounts held by all depository institutions, determined as of June 30 of each year. Effective with the reserve maintenance period beginning December 28. 2000, for depository institutions that report weekly, and with the period beginning January 18, 2001, for institutions that report quarterly, the amount was decreased from $44.3 million to $42.8 million.
Under the Garn-St Germain Depository Institutions Act of 1982, the Board adjusts the amount of reservable liabilities subject to a zero percent reserve requirement each year for the
succeeding calendar year by 80 percent of the percentage increase in the total reservable liabilities of all depository institutions, measured on an annual basis as of June 30. No corresponding adjustment is made in the event of a decrease. The exemption applies only to accounts that would be subject to a 3 percent reserve requirement. Effective with the reserve maintenance period beginning December 28, 2000, for depository institutions that report weekly, and with the period beginning January 18, 2001, for institutions that report quarterly, the exemption was raised from $5.0 million to $5.5 million.
4. The reserve requirement was reduced from 12 percent to 10 percent on Apr. 2, 1992, for institutions that report weekly, and on Apr. 16, 1992, for institutions that report quarterly.
5. For institutions that report weekly, the reserve requirement on nonpersonal time deposits with an original maturity of less than 1 Vi years was reduced from 3 percent to 1 'A percent for the maintenance period that began Dec. 13, 1990, and to zero for the maintenance period that began Dec. 27, 1990. For institutions that report quarterly, the reserve requirement on nonpersonal time deposits with an original maturity of less than 1VS years was reduced from 3 percent to zero on Jan. 17, 1991.
The reserve requirement on nonpersonal time deposits with an original maturity of 1 l/l years or more has been zero since Oct. 6, 1983.
6. The reserve requirement on Eurocurrency liabilities was reduced from 3 percent to zero in the same manner and on the same dates as the reserve requirement on nonpersonal time deposits with an original maturity of less than 1 Vl years (see note 5).
Digitized for FRASER http://fraser.stlouisfed.org/ Federal Reserve Bank of St. Louis

Policy Instruments A9
1.17 FEDERAL RESERVE OPEN MARKET TRANSACTIONS1
Millions of dollars
Type of transaction and maturity 1997 1998 1999
2 0 0 0 Type of transaction
and maturity 1997 1998 1999
Apr. May June July Aug. Sept. Oct.
U.S. Treasury Securities2
Outright transactions (excluding matched transactions)
Treasury bills I Gross purchases 9 , 1 4 7 3 , 5 5 0 0 2 , 2 9 4 0 0 1 ,825 5 3 1 2 3 1 7 7 9 ? Gross sales 0 0 0 0 0 0 0 0 0 0
Exchanges 4 3 5 , 9 0 7 4 5 0 , 8 3 5 4 6 4 , 2 1 8 3 7 , 1 4 1 3 6 , 3 8 6 4 4 , 0 0 8 3 3 , 7 1 8 4 2 , 7 9 7 3 7 , 0 0 6 3 8 , 1 4 2 4 For new bills 4 3 5 , 9 0 7 4 5 0 , 8 3 5 4 6 4 , 2 1 8 3 7 , 1 4 1 3 6 , 3 8 6 4 4 , 0 0 8 3 3 , 7 1 8 4 2 , 7 9 7 3 7 , 0 0 6 3 8 , 1 4 2 5 Redemptions 0 2 , 0 0 0 0 7 7 9 2 , 2 9 7 4 , 1 8 8 4 , 9 0 2 3 , 4 3 8 3 , 8 9 8 2 , 6 5 6
Others within one year 6 Gross purchases 5 , 5 4 9 6 , 2 9 7 1 1 , 8 9 5 0 164 1 ,875 1 ,284 2 , 7 7 0 7 1 6 0 7 Gross sales 0 0 0 0 0 0 0 0 0 0 8 Maturity shifts 4 1 , 7 1 6 4 6 , 0 6 2 5 0 , 5 9 0 0 1 3 , 0 6 3 4 , 6 7 2 5 , 1 5 2 7 , 0 4 0 0 8 . 6 6 3 9 Exchanges - 2 7 , 4 9 9 - 4 9 , 4 3 4 - 5 3 , 3 1 5 0 - 1 2 , 6 3 3 - 3 , 1 0 9 - 3 , 3 3 3 - 7 , 3 9 6 0 - 6 , 6 0 8
10 Redemptions 1 ,996 2 , 6 7 6 1 ,429 5 6 8 0 0 3 6 7 8 8 7 0 7 8 7 One to five years
11 Gross purchases 2 0 , 0 8 0 12 ,901 1 9 , 7 3 1 1 ,723 8 9 0 7 0 6 2 . 2 5 9 2 , 5 0 8 2 , 3 8 5 7 3 4 12 Gross sales 0 0 0 0 0 0 0 0 0 0 13 Maturity shifts - 3 7 , 9 8 7 - 3 7 , 7 7 7 - 4 4 , 0 3 2 0 - 1 0 , 3 3 4 - 4 , 6 7 2 - 5 , 1 5 2 - 3 , 4 3 9 0 - 8 , 6 6 3 14 Exchanges 2 0 , 2 7 4 3 7 , 1 5 4 4 2 , 6 0 4 0 1 0 , 0 6 3 3 , 1 0 9 3 , 3 3 3 5 , 4 1 8 0 6 , 6 0 8
Five to ten years 15 Gross purchases 3 , 4 4 9 2 , 2 9 4 4 , 3 0 3 9 3 0 0 0 0 1 ,914 4 4 8 0 16 Gross sales 0 0 0 0 0 0 0 0 0 0 17 Maturity shifts - 1 , 9 5 4 - 5 , 9 0 8 - 5 , 8 4 1 0 - 1 , 5 5 2 0 0 - 3 , 6 0 1 0 0 18 Exchanges 5 , 2 1 5 7 , 4 3 9 7 , 5 8 3 0 2 , 5 7 0 0 0 1 ,254 0 0
More than ten years 19 Gross purchases 5 , 8 9 7 4 , 8 8 4 9 , 4 2 8 0 5 2 8 1 ,151 5 0 0 7 2 7 5 4 7 9 8 2 7,0 Gross sales 0 0 0 0 0 0 0 0 0 0 21 Maturity shifts - 1 , 7 7 5 - 2 , 3 7 7 - 7 1 7 0 - 1 , 1 7 7 0 0 0 0 0 2 2 Exchanges 2 , 3 6 0 4 , 8 4 2 3 , 1 3 9 0 0 0 0 7 2 4 0 0
All maturities 2 3 Gross purchases 4 4 , 1 2 2 2 9 , 9 2 6 4 5 , 3 5 7 4 , 9 4 7 1 ,582 3 , 7 3 2 5 , 8 6 8 8 , 4 5 0 4 , 3 2 6 2 , 4 9 5 2 4 Gross sales 0 0 0 0 0 0 0 0 0 0 2 5 Redemptions 1 ,996 4 , 6 7 6 1 ,429 1 ,347 2 , 2 9 7 4 , 1 8 8 5 , 2 6 9 4 , 3 2 5 3 , 8 9 8 3 , 4 4 3
Matched transactions 2 6 Gross purchases 3 , 5 9 1 , 2 1 0 4 , 4 3 0 , 4 5 7 4 , 4 1 3 , 4 3 0 3 3 6 , 1 0 3 3 5 7 , 3 5 5 3 6 8 , 3 9 6 3 4 4 , 9 3 5 3 8 1 , 3 4 9 3 3 5 , 3 2 1 3 4 4 , 9 2 0 2 7 Gross sales 3 , 5 9 3 , 5 3 0 4 , 4 3 4 , 3 5 8 4 , 4 3 1 , 6 8 5 3 3 4 , 7 5 1 3 5 6 , 6 4 0 3 6 9 , 7 3 9 3 4 4 , 3 8 4 3 8 1 , 4 7 5 3 3 4 , 5 3 0 3 4 6 , 4 2 8
Repurchase agreements 0 0 0 2 8 Gross purchases 8 1 0 , 4 8 5 5 1 2 , 6 7 1 2 8 1 , 5 9 9 0 0 0 0 0 0 0
2 9 Gross sales 8 0 9 , 2 6 8 5 1 4 , 1 8 6 3 0 1 , 2 7 3 0 0 0 0 0 0 0
3 0 Net change in U.S. Treasury securities 4 1 , 0 2 2 1 9 , 8 3 5 5 , 9 9 9 4 , 9 5 2 - 1 -1 ,800 1 ,150 3 , 9 9 9 1 ,219 - 2 , 4 5 7
Federal agency Obligations
Outright transactions 31 Gross purchases 0 0 0 0 0 0 0 0 0 0 3 2 Gross sales 0 2 5 0 0 0 0 0 0 0 0 3 3 Redemptions 1 ,540 3 2 2 157 10 0 0 0 0 10 0
Repurchase agreements 0 3 4 Gross purchases 1 6 0 , 4 0 9 2 8 4 , 3 1 6 3 6 0 , 0 6 9 0 0 0 0 0 0 0
3 5 Gross sales 1 5 9 , 3 6 9 2 7 6 , 2 6 6 3 7 0 , 7 7 2 0 0 0 0 0 0 0
3 6 Net change in federal agency obligations - 5 0 0 7 , 7 0 3 - 1 0 , 8 5 9 - 1 0 0 0 0 0 - 1 0 0
Reverse repurchase agreements 37 Gross purchases 0 0 0 0 0 0 0 0 0 0 38 Gross sales 0 0 0 0 0 0 0 0 0 0
Repurchase agreements 3 9 Gross purchases 0 0 3 0 4 , 9 8 9 7 9 , 5 8 5 1 0 7 , 3 7 5 7 0 , 8 5 0 6 6 , 4 8 5 4 7 , 2 6 5 6 6 , 0 8 0 6 4 , 4 2 8 4 0 Gross sales 0 0 1 6 4 , 3 4 9 7 8 , 4 2 5 1 0 5 , 8 8 5 7 0 , 3 1 5 7 5 , 9 2 5 46,230 67,285 62,308
41 Net change in triparty obligations 0 0 140,640 1,160 1 ,490 535 - 9 , 4 4 0 1,035 -1,205 2,120
42 Total net change in System Open Market Account. . 40,522 27,538 135,780 6,102 1,489 -1 ,265 -8 ,290 5,034 4 - 3 3 7
1. Sales, redemptions, and negative figures reduce holdings of the System Open Market 2. Transactions exclude changes in compensation for the effects of inflation on the principal Account; all other figures increase such holdings. of inflation-indexed securities.
Digitized for FRASER http://fraser.stlouisfed.org/ Federal Reserve Bank of St. Louis

A10 Domestic Nonfinancial Statistics • February 2001
1.18 FEDERAL RESERVE BANKS Condition and Federal Reserve Note Statements' Millions of dollars
Account
Wednesday End of month
Account 2000 2000 Account
Nov. 1 Nov. 8 Nov. 15 Nov. 22 Nov. 29 Sept. 30 Oct. 31 Nov. 30
Consolidated condition statement
ASSETS
1 Gold certificate account 11,046 11,046 11,046 11,046 11,046 11,046 11,046 11,046 2 Special drawing rights certificate account 3,200 3,200 3,200 3,200 3,200 3,200 3,200 3,200 3 Coin 886 906 909 905 892 831 887 901
Loans 4 To depository institutions 203 159 407 146 438 372 248 136 5 Other 0 0 0 0 0 0 0 0 6 Acceptances held under repurchase agreements 0 0 0 0 0 0 0 0
Triparty Obligations 7 Repurchase agreements—triparty" 24,940 11,975 25,795 24,615 25,630 17,320 19,440 27,270
Federal agency obligations3
8 Bought outright 130 130 130 130 130 130 130 130 9 Held under repurchase agreements 0 0 0 0 0 0 0 0
10 Total U.S. Treasury securities3 510,302 514,015 511,748 513,813 514,308 511,413 508,961 512,327
11 Bought outright4 510.302 514.015 511,748 513,813 514,308 511,413 508,961 512,327 17 Bills 182,312 185.320 183,044 183,883 183,817 184,356 180,971 182,615 13 235,603 236,014 236,021 237,245 237,804 235,725 235,603 237,025 14 Bonds 92,387 92.680 92,682 92,685 92,687 91,332 92,387 92,687 15 Held under repurchase agreements 0 0 0 0 0 0 0 0
16 Total loans and securities 535,575 526,279 538,080 538,704 540,506 529,235 528,779 539,863
17 Items in process of collection 8,834 10.238 7,922 8,472 7,198 5,424 10,945 5,237 18 Bank premises 1,434 1.435 1,442 1,443 1,441 1,430 1,433 1,440
Other assets 19 Denominated in foreign currencies' 15,298 15,304 15,310 15.316 15,323 15,642 15,297 15,348 20 All other" 19,454 19.959 16,761 17,206 17,677 18,817 19,616 17,083
21 Total assets 595,727 588,367 594,669 596,293 597,282 585,625 591,203 594,118
LIABILITIES
22 Federal Reserve notes 542,757 544.466 545,812 550,192 550,957 538,816 542,479 549,627 23 Reverse repurchase agreements—triparty" 0 0 0 0 0 0 0 0
24 Total deposits 27,995 19,098 24,183 20,987 21,718 26,399 22,793 20,621
25 Depository institutions 22,494 13.338 18,978 16,270 16,362 17,624 17,074 15,858 26 U.S. Treasury—General account 5,149 5.459 4.850 4,413 5,056 8,459 5,360 4,382 7.1 Foreign—Official accounts 75 72 90 71 73 139 115 104 28 Other 278 229 266 233 227 177 245 276
?9 Deferred credit items 8.526 7,749 7,356 7,445 6,694 5,168 9,514 5,672 30 Other liabilities and accrued dividends7 4,296 4.272 4,364 4,368 4,409 4 , 4 4 7 4,325 4,590
31 Total liabilities 583,574 575,585 581,716 582,992 583,778 574,830 579,111 580,510
C A P I T A L A C C O U N T S
3? Capital paid in 6,987 6,988 6,988 7,030 7,071 6,933 6,986 7,076 33 Surplus 2.679 2.679 2,679 2,679 2,679 2,679 2,679 2,679 34 Other capital accounts 2,487 3.115 3,287 3.592 3,754 1,184 2,426 3,853
35 Total liabilities and capital accounts 595,727 588,367 594,669 596,293 597,282 585,625 591,203 594,118
M E M O 36 Marketable U.S. Treasury securities held in custody for
foreign and international accounts n.a. n.a. n.a. n.a. n.a. n.a. n.a. n.a.
Federal Reserve note statement
37 Federal Reserve notes outstanding (issued to Banks) . LESS: Held by Federal Reserve Banks Federal Reserve notes, net
Co/lateral held against notes, net 40 Gold certificate account 41 Special drawing rights certificate account 42 Other eligible assets 43 U.S. Treasury and agency securities
44 Total collateral
759,820 217,063 542.757
759.105 214,638 544,466
758,530 212,718 545,812
757,512 207,320 550,192
756,715 205,757 550,957
764,756 225,940 538,816
760,004 217,525 542,479
756,527 206,900 549,627
11,046 3,200
0 528,511
11,046 3.200 4,104
526.120
11,046 3,200
0 531,566
11,046 3,200
0 535,946
11,046 3,200
0 536,712
11,046 3,200
0 524,570
11,046 3,200
0 528,233
11,046 3,200
0 535,381
542,757 544,466 545,812 550,192 550,957 538,816 542,479 549,627
1. Some of the data in this table also appear in the Board's H.4.1 (503) weekly statistical release. For ordering address, see inside front cover.
2. Cash value of agreements arranged through third-party custodial banks. 3. Face value of the securities. 4. Includes securities loaned—fully guaranteed by U.S. Treasury securities pledged with
Federal Reserve Banks—and includes compensation that adjusts for the effects of inflation on the principal of inflation-indexed securities. Excludes securities sold and scheduled to be bought back under matched sale-purchase transactions.
5. Valued monthly at market exchange rates. 6. Includes special investment account at the Federal Reserve Bank of Chicago in Treasury
bills maturing within ninety days. 7. Includes exchange-translation account reflecting the monthly revaluation at market
exchange rates of foreign exchange commitments.
Digitized for FRASER http://fraser.stlouisfed.org/ Federal Reserve Bank of St. Louis

Federal Reserve Banks A l l
1.19 FEDERAL RESERVE BANKS Maturity Distribution of Loan and Security Holding
Millions of dollars
Type of holding and maturity
Wednesday End of month
Type of holding and maturity 2000 2000 Type of holding and maturity
Nov. 1 Nov. 8 Nov. 15 Nov. 22 Nov. 29 Sept. 30 Oct. 31 Nov. 30
1 Total loans 203 159 407 146 438 372 248 136
2 Within fifteen days1 180 111 336 125 421 221 152 86 3. Sixteen days to ninety days 23 48 71 21 18 151 96 50 4. 91 days to 1 year 0 0 0 0 0 0 0 0
5 Total U.S. Treasury securities2 510,302 514,015 511,748 513,813 514,308 511,413 508,961 512,327
6 Within fifteen days' 17,950 17,053 17,502 17,639 15,478 8,978 12,494 4,706 7 Sixteen days to ninety days 105,007 116,675 108,823 112,587 114,311 116,776 109,123 119,433 8 Ninety-one days to one year 131,002 123,240 128,476 125,994 126,364 128,981 131,002 130,868 9 One year to five years 130,667 131,364 131,941 132,580 132,581 131,987 130,667 131,745
10 Five years to ten years 53,530 53,536 54,117 54,123 54,681 53,527 53,530 54,682 11 More than ten years 72,145 72,147 70,889 70,891 70,893 71,162 72,145 70,893
12 Total federal agency obligations 130 130 130 130 130 130 130 130
13 Within fifteen days1 0 0 0 0 0 0 0 0 14 Sixteen days to ninety days 0 0 0 0 0 0 0 0 15 Ninety-one days to one year 0 0 0 0 0 0 0 0 16 One year to five years 30 30 30 30 30 30 30 30 17 Five years to ten years 100 100 100 100 100 100 100 100 18 More than ten years 0 0 0 0 0 0 0 0
1. Holdings under repurchase agreements are classified as maturing within fifteen days in 2. Includes compensation that adjusts for the effects of inflation on the principal of accordance with maximum maturity of the agreements. inflation-indexed securities.
Digitized for FRASER http://fraser.stlouisfed.org/ Federal Reserve Bank of St. Louis

A12 Domestic Nonfinancial Statistics • February 2001
1.20 AGGREGATE R E S E R V E S O F D E P O S I T O R Y I N S T I T U T I O N S A N D M O N E T A R Y B A S E 1
Billions of dollars, averages of daily figures
Item 1996 1997 1998 1999 2000
Item Dec. Dec. Dec. Dec. Apr. May June July Aug. Sept. Oct. Nov.
ADJUSTED FOR CHANGES IN RESERVE REQUIREMENTS"
1 Total reserves3
2 Nonborrowed reserves4
3 Nonborrowed reserves plus extended c r e d i t 5 . . . . 4 Required reserves 5 Monetary base6
6 Total reserves7
7 Nonborrowed reserves 8 Nonborrowed reserves plus extended credit5
9 Required reserves8
10 Monetary base9
N O T ADJUSTED FOR CHANGES IN RESERVE REQUIREMENTS
11 Total reserves" 12 Nonborrowed reserves 13 Nonborrowed reserves plus extended credit5
14 Required reserves 15 Monetary base12
16 Excess reserves13
17 Borrowings from the Federal Reserve
Seasonally adjusted
50.17 46.87 45.19 41.74 40.93 41.36 39.96 40.26 39.94 39.86 39.54 39.45 50.02 46.54 45.07 41.42 40.63 41.00 39.48 39.69 39.37 39.38 39.12r 39.16 50.02 46.54 45.07 41.42 40.63 41.00 39.48 39.69 39.37 39.38 39.12r 39.16 48.76 45.18 43.68 40.44 39.78 40.41 38.89 39.19 38.93 38.76 38.41 38.24
451.62 479.17 512.75 591.18 573.08 574.29 575.63 577.41 577.69 r 579.26r 580.94 r 580.04
Not seasonally adjusted
51.45 48.01 45.31 41.89 40.61 41.58 39.24 39.70 39.52 39.29 38.90 38.84 51.30 47.69 45.19 41.57 40.31 41.22 38.76 39.13 38.94 38.82 38.48 38.55 51.30 47.69 45.19 41.57 40.31 41.22 38.76 39.13 38.94 38.82 38.48 38.55 50.04 46.33 43.80 40.58 39.47 40.64 38.18 38.63 38.50 38.19 37.77 37.63
456.63 484.98 518.27 600.63 571.51 573.26 574.55 577.19 576.60 576.79r 578.34 r 582.21
51.17 47.92 45.21 41.66 40.59 41.56 39.22 39.67 39.49 39.26 38.85r 38.79 51.02 47.60 45.09 41.33 40.29 41.20 38.74 39.10 38.91 38.78 38.44 38.51 51.02 47.60 45.09 41.33 40.29 41.20 38.74 39.10 38.91 38.78 38.44 38.51 49.76 46.24 43.70 40.35 39.45 40.62 38.15 38.60 38.47 38.16 37.73 37.59
463.40 491.79 525.06 607.94 578.33 580.09 581.44 583.99 583.34 583.48r 585.07' 588.98 1.42 1.69 1.51 1.31 1.15 .94 1.06 1.07 1.01 1.10 1.13 1.20 .16 .32 .12 .32 .30 .36 .48 .57 .58 .48 .42 .28
1. Latest monthly and biweekly figures are available from the Board's H.3 (502) weekly statistical release. Historical data starting in 1959 and estimates of the effect on required reserves of changes in reserve requirements are available from the Money and Reserves Projections Section, Division of Monetary Affairs, Board of Governors of the Federal Reserve System, Washington, DC 20551.
2. Figures reflect adjustments for discontinuities, or "breaks," associated with regulatory changes in reserve requirements. (See also table 1.10.)
3. Seasonally adjusted, break-adjusted total reserves equal seasonally adjusted, break-adjusted required reserves (line 4) plus excess reserves (line 16).
4. Seasonally adjusted, break-adjusted nonborrowed reserves equal seasonally adjusted, break-adjusted total reserves (line 1) less total borrowings of depository institutions from the Federal Reserve (line 17).
5. Extended credit consists of borrowing at the discount window under the terms and conditions established for the extended credit program to help depository institutions deal with sustained liquidity pressures. Because there is not the same need to repay such borrowing promptly as with traditional short-term adjustment credit, the money market effect of extended credit is similar to that of nonborrowed reserves.
6. The seasonally adjusted, break-adjusted monetary base consists of (1) seasonally adjusted, break-adjusted total reserves (line 1), plus (2) the seasonally adjusted currency component of the money stock, plus (3) (for all quarterly reporters on the "Report of Transaction Accounts, Other Deposits and Vault Cash" and for all those weekly reporters whose vault cash exceeds their required reserves) the seasonally adjusted, break-adjusted difference between current vault cash and the amount applied to satisfy current reserve requirements.
7. Break-adjusted total reserves equal break-adjusted required reserves (line 9) plus excess reserves (line 16).
8. To adjust required reserves for discontinuities that are due to regulatory changes in reserve requirements, a multiplicative procedure is used to estimate what required reserves would have been in past periods had current reserve requirements been in effect. Break-adjusted required reserves include required reserves against transactions deposits and nonper-sonal time and savings deposits (but not reservable nondeposit liabilities).
9. The break-adjusted monetary base equals (1) break-adjusted total reserves (line 6), plus (2) the (unadjusted) currency component of the money stock, plus (3) (for all quarterly reporters on the "Report of Transaction Accounts, Other Deposits and Vault Cash" and for ail those weekly reporters whose vault cash exceeds their required reserves) the break-adjusted difference between current vault cash and the amount applied to satisfy current reserve requirements.
10. Reflects actual reserve requirements, including those on nondeposit liabilities, with no adjustments to eliminate the effects of discontinuities associated with regulatory changes in reserve requirements.
11. Reserve balances with Federal Reserve Banks plus vault cash used to satisfy reserve requirements.
12. The monetary base, not break-adjusted and not seasonally adjusted, consists of (1) total reserves (line 11), plus (2) required clearing balances and adjustments to compensate for float at Federal Reserve Banks, plus (3) the currency component of the money stock, plus (4) (for all quarterly reporters on the "Report of Transaction Accounts, Other Deposits and Vault Cash" and for all those weekly reporters whose vault cash exceeds their required reserves) the difference between current vault cash and the amount applied to satisfy current reserve requirements. Since February 1984, currency and vault cash figures have been measured over the computation periods ending on Mondays.
13. Unadjusted total reserves (line 11) less unadjusted required reserves (line 14).
Digitized for FRASER http://fraser.stlouisfed.org/ Federal Reserve Bank of St. Louis

Monetary and Credit Aggregates A13
1.21 MONEY STOCK A N D DEBT MEASURES1
Billions of dollars, averages of daily figures
2000
Item 1996 1997 1998 1999 Item Dec. Dec. Dec. Dec. Aug.r Sept.r Oct.r Nov.
Seasonally adjusted
Measures2
1 Ml 1,081.1 1,073.9 1,097.4 1,123.0 1,101.5 1,096.7 1,100.9 1,091.1 2 M2 3,813.3r 4,028.9r 4,380.6r 4,643.7 4,821.3 4,857.5 4,876.0 4,887.1 3 M3 4,949.4r 5,400.2r 5,994.0r 6,489.8 6,863.3 6,913.4 6,936.3 6,955.0 4 Debt 14,430.8 15,223.1 16,276.0r 17,376.7 17,999.1 18,074.5 18,115.0 n.a.
Ml components 5 Currency3 394.3 424.8 459.5 515.5 523.0 524.0 525.9 526.5 6 Travelers checks4 8.3 8.1 8.2 8.3 9.2 8.8 8.4 8.0 7 Demand deposits5 402.3 395.3 379.3 355.2 328.3 324.9 325.7 317.3 8 Other checkable deposits6 276.1 245.8 250.3 244.0 241.0 239.0 240.9 239.2
Nonlransaction components 9 In M27 2,732.3r 2,955.0r 3,283.2r 3,520.7 3,719.8 3,760.8 3,775.1 3,796.0
10 In M3 only8 i , i 3 6 . r l,371.3r l,613.5r 1,846.1 2,042.0 2,055.9 2,060.3 2,067.9
Commercial banks 11 Savings deposits, including MMDAs 904.0 1,020.5 1,184.8 1,285.7 1,358.9 1,384.1 1,385.8 1,397.9 12 Small time deposits9 593.3 625.4 626.1 634.6 686.2 688.6 689.4 692.8 13 Large time deposits10, 11 413.9 488. r 539.l r 614.0 670.5 660.4 655.3 662.9
Thrift institutions 14 Savings deposits, including MMDAs 366.6 376.6 413.8 448.8 454.3 455.3 455.5 454.7 15 Small time deposits9 353.6 342.8 325.6 320.6 337.6 340.1 342.5 345.0 16 Large time deposits10 78.3 85.6 88.9 91.5 99.1 99.6 101.4 103.1
Money market mutual funds 17 Retail 514.8r 589.8r 733.0r 831.0 882.8 892.7 901.9 905.7 18 Institution-only 318.6r 390.9r 532. l r 625.0 721.0 740.4 744.5 751.4
Repurchase agreements and eurodollars 19 Repurchase agreements12 210.7 256.0 300.8 344.3 363.1 362.0 362.0 354.4 20 Eurodollars12 114.6 150.7 152.6 171.3 188.3 193.5 197.1 196.0
Debt components 21 Federal debt 3,781.3 3,800.6 3,751.2 3,660.2 3,488.9 3,475.0 3,445.9 n.a. 22 Nonfederal debt 10,649.5 11,422.5 12,524.7r 13,716.5 14.510.2 14,599.5 14,669.2 n.a.
Not seasonally adjusted
Measures1
23 Ml 1,105.1 1,097.7 1,121.3 1,147.4 1,095.3 1,089.3 1,092.8 1,094.3 24 M2 3,835.6r 4,052. r 4,405.8r 4,671.9 4,808.0 4,843.4 4,857.8 4,889.5 25 M3 4,970.5r 5,424.4r 6,023.9r 6,525.0 6,834.9 6,881.0 6,907.8 6,969.3 26 Debt 14,428.4 15,218.5 16,271.3r 17,372.0 17,935.7 18,015.7 18,064.7 n.a.
Ml components 27 Currency3 397.9 428.9 464.1 521.2 521.6 522.4 524.2 527.5 28 Travelers checks4 8.6 8.3 8.4 8.4 8.9 8.7 8.4 8.2 29 Demand deposits5 419.9 412.4 395.9 371.2 326.3 321.7 322.1 320.3 30 Other checkable deposits6 278.8 248.2 252.8 246.6 238.4 236.4 238.2 238.3
Nontransaction components 31 In M2 2,730.5r 2,954.4r 3,284.5r 3,524.5 3,712.7 3,754.1 3,765.0 3,795.1 32 In M3 only8 1,134.9r l,372.3r l,618.1r 1,853.1 2,027.0 2,037.6 2,050.0 2,079.9
Commercial banks 33 Savings deposits, including MMDAs 903.3 1,020.4 1,186.0 1,288.5 1,356.5 1,381.1 1,380.0 1,397.4 34 Small time deposits9 592.7 625.3 626.5 635.4 684.2 687.9 690.7 694.8 35 Large time deposits10, " 413.2 487. r 537.61" 612.1 668.6 663.3 659.8 666.2
Thrift institutions 36 Savings deposits, including MMDAs 366.3 376.5 414.2 449.8 453.5 454.3 453.6 454.5 37 Small time deposits9 353.2 342.8 325.8 321.0 336.6 339.8 343.2 346.0 38 Large time deposits10 78.1 85.4 88.6 91.2 98.8 100.1 102.1 103.6
Money market mutual funds 39 Retail 514.8r 589.4r 731.9r 829.7 881.9 890.9 897.5 902.4 40 Institution-only 322.2r 397,0r 541.9r 636.9 709.5 721.5 734.7 755.9
Repurchase agreements and eurodollars 41 Repurchase agreements12 205.7 250.5 295.4 339.5 362.8 360.9 358.3 357.6 42 Eurodollars12 115.7 152.3 154.5 173.4 187.3 191.8 195.1 196.6
Debt components 43 Federal debt 3,787.9 3,805.8 3,754.9 3,663.1 3,437.7 3,426.5 3,395.5 n.a. 44 Nonfederal debt 10,640.4 11,412.7 12,516.3 13,709.0 14,498.1 14,589.2 14,669.2 n.a.
Footnotes appear on following page.
Digitized for FRASER http://fraser.stlouisfed.org/ Federal Reserve Bank of St. Louis

A14 Domestic Nonfinancial Statistics • February 2001
NOTES TO TABLE 1.21
1. Latest monthly and weekly figures are available from the Board's H.6 (508) weekly statistical release. Historical data starting in 1959 are available from the Money and Reserves Projections Section, Division of Monetary Affairs, Board of Governors of the Federal Reserve System, Washington, DC 20551.
2. Composition of the money stock measures and debt is as follows: Ml : (I) currency outside the U.S. Treasury, Federal Reserve Banks, and the vaults of
depository institutions; (2) travelers checks of nonbank issuers; (3) demand deposits at all commercial banks other than those owed to depository institutions, the U.S. government, and foreign banks and official institutions, less cash items in the process of collection and Federal Reserve float; and (4) other checkable deposits (OCDs), consisting of negotiable order of withdrawal (NOW) and automatic transfer service (ATS) accounts at depository institutions, credit union share draft accounts, and demand deposits at thrift institutions. Seasonally adjusted Ml is computed by summing currency, travelers checks, demand deposits, and OCDs, each seasonally adjusted separately.
M2: Ml plus (1) savings deposits (including MMDAs), (2) small-denomination time deposits (time deposits—including retail RPs—in amounts of less than $100,000), and (3) balances in retail money market mutual funds. Excludes individual retirement accounts (IRAs) and Keogh balances at depository institutions and money market funds. Seasonally adjusted M2 is calculated by summing savings deposits, small-denomination time deposits, and retail money fund balances, each seasonally adjusted separately, and adding this result to seasonally adjusted Ml .
M3: M2 plus (1) large-denomination time deposits (in amounts of $100,000 or more) issued by all depository institutions, (2) balances in institutional money funds, (3) RP liabilities (overnight and term) issued by all depository institutions, and (4) eurodollars (overnight and term) held by U.S. residents at foreign branches of U.S. banks worldwide and at all banking offices in the United Kingdom and Canada. Excludes amounts held by depository institutions, the U.S. government, money market funds, and foreign banks and official institutions. Seasonally adjusted M3 is calculated by summing large time deposits, institutional money fund balances, RP liabilities, and eurodollars, each seasonally adjusted separately, and adding this result to seasonally adjusted M2.
Debt: The debt aggregate is the outstanding credit market debt of the domestic nonfinancial sectors—the federal sector (U.S. government, not including government-sponsored enter-
prises or federally related mortgage pools) and the nonfederal sectors (state and local governments, households and nonprofit organizations, nonfinancial corporate and nonfarm noncorporate businesses, and farms). Nonfederal debt consists of mortgages, tax-exempt and corporate bonds, consumer credit, bank loans, commercial paper, and other loans. The data, which are derived from the Federal Reserve Board's flow of funds accounts, are break-adjusted (that is, discontinuities in the data have been smoothed into the series) and month-averaged (that is, the data have been derived by averaging adjacent month-end levels).
3. Currency outside the U.S. Treasury, Federal Reserve Banks, and vaults of depository institutions.
4. Outstanding amount of U.S. dollar-denominated travelers checks of nonbank issuers. Travelers checks issued by depository institutions are included in demand deposits.
5. Demand deposits at commercial banks and foreign-related institutions other than those owed to depository institutions, the U.S. government, and foreign banks and official institu-tions, less cash items in the process of collection and Federal Reserve float.
6. Consists of NOW and ATS account balances at all depository institutions, credit union share draft account balances, and demand deposits at thrift institutions.
7. Sum of (1) savings deposits (including MMDAs), (2) small time deposits, and (3) retail money fund balances.
8. Sum of (1) large time deposits, (2) institutional money fund balances, (3) RP liabilities (overnight and term) issued by depository institutions, and (4) eurodollars (overnight and term) of U.S. addressees.
9. Small time deposits—including retail RPs—are those issued in amounts of less than $100,000. All IRAs and Keogh accounts at commercial banks and thrift institutions are subtracted from small time deposits.
10. Large time deposits are those issued in amounts of $100,000 or more, excluding those booked at international banking facilities.
11. Large time deposits at commercial banks less those held by money market funds, depository institutions, the U.S. government, and foreign banks and official institutions.
12. Includes both overnight and term.
Digitized for FRASER http://fraser.stlouisfed.org/ Federal Reserve Bank of St. Louis

Commercial Banking Institutions—Assets and Liabilities A15
1.26 COMMERCIAL BANKS IN THE UNITED STATES Assets and Liabilities'
A. All commercial banks Billions of dollars
Monthly averages Wednesday figures
Account 1999 2000 2000
Nov.1" Mayr Juner July1' Aug.r Sept.1" Oct.r Nov. Nov. 8 Nov. 15 Nov. 22 Nov. 29
Seasonally adjusted
Assets 1 Bank credit 4,694.0 5,005.5 5,041.8 5,079.7 5,121.9 5,170.3 5,145.0 5,157.3 5,138.0 5,141.7 5,167.8 5,177.8 2 Securities in bank credit 1,249.5 1,313.8 1,313.5 1,318.5 1,321.9 1,332.5 1,310.4 1,302.5 1,297.2 1,297.6 1,307.5 1,306.6 3 U.S. government securities 801.9 815.4 818.5 820.7 813.8 808.2 793.2 782.7 784.6 782.9 782.7 780.1 4 Other securities 447.6 498.4 494.9 497.8 508.1 524.3 517.2 519.8 512.7 514.7 524.7 526.5 5 Loans and leases in bank credit2 . . . 3,444.5 3,691.7 3,728.3 3,761.2 3,800.0 3,837.8 3,834.6 3,854.8 3,840.8 3,844.2 3,860.3 3,871.2 6 Commercial and industrial 996.0 1,058.1 1,066.6 1,072.1 1,079.9 1,079.9 1,079.0 1,080.2 1,074.7 1,081.7 1.082.5 1.081.6 7 Real estate 1,436.9 1,580.3 1,598.4 1,614.5 1,624.5 1,634.9 1,632.5 1,643.9 1,639.8 1,641.1 1,645.7 1,647.9 8 Revolving home equity 100.8 114.7 115.7 117.1 118.3 120.2 123.4 125.1 124.7 124.9 125.1 125.4 9 Other 1,336.1 1,465.6 1,482.7 1,497.4 1,506.2 1,514.7 1,509.0 1,518.8 1,515.1 1,516.2 1,520.6 1,522.5
10 Consumer 482.7 509.3 516.0 519.6 528.1 531.4 531.3 535.0 529.9 535.7 537.5 537.4 11 Security3 133.7 144.8 149.4 151.5 158.3 179.4 177.7 179.3 177.3 171.5 177.9 188.2 12 Other loans and leases 395.2 399.2 397.8 403.5 409.3 412.1 414.2 416.4 418.9 414.1 416.7 416.0 13 Interbank loans 224.2 226.7 227.1 240.4 247.1 240.1 250.6 250.1 253.2 252.3 244.5 249.7 14 Cash assets4 274.5 275.1 270.6 271.1 271.5 269.1 267.4 255.0 255.6 252.8 270.0 238.7 15 Other assets5 367.6 375.9 377.7 396.0 397.1 396.2 409.6 400.0 401.3 397.7 402.1 397.9
16 Total assets6 5,501.0 5,823.4 5,857.1 5,926.0 5,975.5 6.013.2 6,010.5 5,999.9 5,986.0 5,982.3 6,022.2 6,001.0
Liabilities 17 Deposits 3,485.9 3,633.7 3,667.0 3,725.8 3,753.5 3,771.4 3,786.9 3.774.6 3,768.0 3,782.5 3.794.0 3,744.9 18 Transaction 626.4 629.2 617.0 612.1 618.0 610.6 614.4 599.7 582.9 596.9 624.7 596.4 19 Nontransaction 2,859.5 3,004.5 3,050.0 3,113.7 3,135.5 3,160.8 3,172.4 3,174.9 3,185.1 3,185.5 3,169.3 3,148.6 20 Large time 805.1 879.9 899.0 921.3 930.9 920.4 915.2 912.3 913.8 913.1 912.1 908.6 21 Other 2,054.4 2,124.6 2,151.0 2,192.4 2,204.7 2,240.4 2,257.3 2,262.6 2,271.3 2,272.5 2.257.2 2,240.0 22 Borrowings 1,060.1 1,201.3 1,203.8 1,221.9 1,227.9 1,219.9 1,210.4 1,206.5 1,214.1 1,188.0 1,195.1 1,222.8 23 From banks in the U.S 350.3 385.0 378.4 390.1 389.3 373.4 369.2 365.1 372.4 367.5 353.4 362.9 24 From others 709.8 816.2 825.4 831.8 838.6 846.4 841.2 841.4 841.7 820.4 841.7 859.8 25 Net due to related foreign offices 224.0 254.4 263.5 261.9 269.7 269.1 251.7 241.3 230.4 243.0 245.3 251.0 26 Other liabilities 294.7 310.4 300.6 296.5 312.6 331.6 338.9 339.4 340.1 339.5 341.2 336.0
27 Total liabilities 5,064.7 5,399.7 5,434.8 5,506.1 5,563.7 5,592.0 5,587.8 5,561.7 5,552.6 5,552.9 5,575.6 5,554.7
28 Residual (assets less liabilities)7 436.3 423.7 422.4 419.9 411.8 421.3 422.7 438.2 433.3 429.4 446.5 446.3
Not seasonally adjusted
Assets 29 Bank credit 4,721.9 4,997.0 5,024.5 5,048.1 5,093.1 5,157.0 5,158.7 5,188.2 5,171.9 5,173.0 5,193.4 5,210.6 30 Securities in bank credit 1,263.8 1,311.1 1,302.7 1,301.0 1,309.2 1,327.3 1,314.8 1,317.5 1,312.1 1,312.5 1,321.6 1,322.4 31 U.S. government securities 804.7 820.8 817.8 812.2 804.9 800.2 788.1 785.3 787.4 785.3 783.7 783.9 32 Other securities 459.1 490.4 485.0 488.8 504.3 527.1 526.7 532.2 524.7 527.3 5.37.9 538.5 33 Loans and leases in bank credit2 . . . 3,458.1 3,685.9 3,721.7 3,747.1 3,783.9 3,829.7 3,843.9 3,870.7 3.859.8 3,860.5 3,871.9 3,888.2 34 Commercial and industrial 999.8 1,061.0 1,066.0 1,067.3 1,069.5 1,075.8 1,079.8 1,084.4 1.079.3 1,086.0 1,086.7 1,085.6 35 Real estate 1,443.4 1,577.7 1,595.0 1,610.7 1,624.6 1,635.3 1,638.2 1,651.8 1,651.6 1,650.0 1,651.1 1,654.1 36 Revolving home equity 101.2 114.3 115.8 117.1 118.5 121.0 124.0 125.6 125.2 125.5 125.6 125.9 37 Other 1,342.2 1,463.4 1,479.3 1,493.6 1,506.1 1,514.4 1,514.2 1,526.3 1,526.4 1.524.5 1,525.5 1,528.2 38 Consumer 481.4 508.9 514.1 516.1 526.9 532.1 529.0 534.1 527.6 534.1 537.0 537.9 39 Credit cards and related plans. . n.a. n.a. n.a. 195.2 202.8 206.0 202.9 206.8 200.7 207.2 209.8 210.0 40 Other n.a. n.a. n.a. 320.9 324.2 326.2 326.1 327.2 326.9 326.9 327.2 328.0 41 Security3 135.8 143.3 149.3 148.6 153.2 172.5 181.5 181.6 181.3 173.1 179.5 190.0 42 Other loans and leases 397.7 395.0 397.4 404.4 409.7 413.8 415.4 418.8 420.0 417.3 417.6 420.6 43 Interbank loans 228.1 226.6 226.8 236.4 237.1 233.8 244.4 255.2 258.0 259.9 246.1 255.8 44 Cash assets4 283.4 272.9 266.7 261.8 259.2 264.8 268.4 262.9 252.1 270.8 268.8 258.3 45 Other assets5 364.6 379.0 379.2 395.4 395.4 394.6 402.4 397.0 400.1 395.6 392.9 398.0
46 Total assets6 5,538.4 5,815.6 5,837.0 5,8805 5,922.5 5,987.5 6,012.0 6,040.7 6,019.9 6,036.9 6,038.7 6,059.4
Liabilities 47 Deposits 3.513.7 3,619.1 3,655.0 3,701.1 3,721.2 3,755.3 3,779.9 3,804.0 3,794.9 3,822.8 3.807.1 3,784.0 48 Transaction 634.6 619.9 615.9 605.6 602.3 604.2 606.3 607.3 580.0 613.1 621.4 617.5 49 Nontransaction 2,879.1 2,999.2 3,039.1 3,095.5 3,118.9 3,151.0 3,173.5 3,196.7 3,215.0 3,209.7 3,185.7 3.166.5 50 Large time 815.2 876.1 888.1 904.6 913.9 909.5 912.4 923.0 921.9 921.9 923.9 923.3 51 Other 2,063.9 2,123.1 2,151.0 2,191.0 2,205.0 2,241.5 2,261.1 2,273.7 2,293.1 2,287.8 2,261.8 2,243.2 52 Borrowings 1,068.1 1,210.7 1,207.2 1,209.4 1,200.6 1,215.5 1,212.1 1,215.5 1,217.5 1,199.2 1,200.3 1,239.5 53 From banks in the U.S 353.7 385.7 379.4 387.3 384.9 373.0 368.2 368.6 373.4 371.4 356.0 369.6 54 From others 714.4 825.0 827.8 822.1 815.7 842.4 843.8 846.9 844.1 827.8 844.3 869.9 55 Net due to related foreign offices . . . . 228.1 254.9 253.9 253.4 267.0 264.1 252.9 246.5 231.4 241.2 253.7 264.9 56 Other liabilities 295.7 308.8 298.9 294.2 312.2 331.0 338.0 340.4 340.4 340.4 342.2 337.7
57 Total liabilities 5,105.6 5,393.5 5,414.9 5,458.1 5,501.0 5,565.8 5,582.8 5,606.4 5,584.2 5,603.6 5,603.3 5,626.2
58 Residual (assets less liabilities)7 432.8 422.1 422.1 422.4 421.6 421.7 429.1 434.2 435.7 433.2 435.4 433.2
Footnotes appear on p. A21.
Digitized for FRASER http://fraser.stlouisfed.org/ Federal Reserve Bank of St. Louis

A16 Domestic Financial Statistics • February 2001
1.26 COMMERCIAL BANKS IN THE UNITED STATES Assets and Liabilities1—Continued B. Domestically chartered commercial banks Billions of dollars
Monthly averages Wednesday figures
Account 1999 2000 2000
Nov. Mayr Juner Julyr Aug/ Sept.1" Oct.r Nov. Nov. 8 Nov. 15 Nov. 22 Nov. 29
Seasonally adjusted
Assets 1 Bank credit 4,152.2 4,417.1 4,460.4 4.497.7 4,535.4 4,576.4 4,564.6 4,582.4 4,563.4 4,575.6 4.591.1 4,599.1 7 Securities in bank credit 1,052.5 1,099.0 1,103.5 1.108.8 1,111.6 1,124.1 1,118.7 1,119.0 1,113.0 1,116.7 1,122.0 1,125.2
U.S. government securities 722.2 736.0 740.1 741.6 734.6 731.4 724.1 717.2 717.6 717.3 717.4 716.2 4 Other securities 330.3 363.0 363.4 367.2 377.0 392.7 394.6 401.8 395.4 399.4 404.6 408.9
Loans and leases in bank credit2 3,099.7 3,318.1 3,356.8 3,389.0 3,423.8 3,452.4 3,445.9 3,463.3 3,450.4 3,458.9 3,469.2 3,473.9 6 Commercial and industrial 799.9r 851.8 859.9 867.2 873.3 875.5 877.2 878.4 873.1 879.8 881.1 879.3 7 Real estate l,419.4r 1,562.0 1,579.8 1,595.7 1,605.7 1,615.5 1,613.7 1,624.5 1,620.6 1,621.7 1,626.2 1,628.5 8 Revolving home equity 100.8 114.7 115.7 117.1 118.3 120.2 123.4 125.1 124.7 124.9 125.1 125.4 9 Other l,318.6r 1,447.3 1,464.0 1,478.7 1,487.4 1,495.3 1,490.3 1,499.4 1,495.9 1,496.8 1,501.1 1,503.1 in Consumer 482.7 509.3 516.0 519.6 528.1 531.4 531.3 535.0 529.9 535.7 537.5 537.4
u Security3 68.3 64.0 68.6 70.0 76.6 85.1 75.6 76.0 74.3 73.5 75.7 80.0 i? Other loans and leases 329.5 331.1 332.5 336.5 340.3 344.9 348.1 349.4 352.5 348.2 348.8 348.6 n Interbank loans 200.1 196.3 200.8 216.9 224.6 215.9 222.9 222.4 226.2 225.8 219.2 218.3 14 Cash assets4 226.0 230.6 225.1 225.3 226.3 223.6 224.4 215.5 215.8 212.1 231.0 200.3 15 Other assets5 333.3 335.6 335.2 354.1 356.2 356.8 373.5 365.4 365.9 364.1 368.1 362.3
16 Total assets6 4,852.6 5,120.2 5,161.8 5,233.1 5,280.7 5,310.7 5,323.6 5,323.6 5,309.6 5,315.8 5,347.6 5,317.2
Liabilities 17 3,128.4 3,250.1 3,281.8 3,335.4 3,358.0 3,383.1 3,402.5 3,391.7 3,383.9 3,399.5 3,409.9 3,365.0 18 Transaction 615.8 618.1 605.6 600.8 607.2 600.9 604.0 589.2 572.2 586.6 614.2 586.1 19 Nontransaction 2,512.6 2,632.0 2,676.2 2,734.6 2,750.8 2,782.2 2,798.5 2,802.5 2,811.7 2,812.9 2,795.7 2,779.0 ?0 Large time 460.9r 510.0 526.0 544.6 548.6 544.4 543.9 542.6 542.4 542.7 541.0 542.7 ">1 Other 2,051.7' 2,122.1 2,150.1 2,190.1 2,202.2 2,237.8 2,254.6 2,260.0 2,269.3 2,270.2 2,254.7 2,236.3 77. Borrowings 877.0 998.4 1,001.2 1,019.4 1,029.0 1,005.6 991.8 984.5 987.§ 973.5 978.7 996.1 n From banks in the U.S 325.3 367.0 359.2 369.2 372.3 354.1 350.3 345.6 348.1 348.0 338.7 344.6 74 From others 551.7 631.4 642.0 650.2 656.7 651.5 641.5 639.0 639.7 625.5 640.1 651.6 75 Net due to related foreign offices . . . . 178.9 232.5 243.3 243.7 246.3 244.8 235.0 235.2 226.2 235.0 240.5 243.2 26 Other liabilities 229.9r 231.7 228.6 222.8 239.6 255.1 263.1 269.1 268.6 271.3 269.8 266.9
27 Total liabilities 4,414.3 4,712.7 4,754.9 4,821.2 4,872.9 4,888.5 4,892.4 4,880.6 4,866.6 4,879.4 4,898.9 4,871.2
28 Residual (assets less liabilities)7 438.3 407.5 407.0 411.9 407.8 422.2 431.2 443.0 443.0 436.4 448.7 446.0
Not seasonally adjusted
Assets 29 Bank credit 4,167.1 4,417.3 4,453.1 4.477.0 4,516.4 4,563.9 4,569.4 4,599.1 4,582.6 4,592.4 4,603.2 4,618.0 30 Securities in bank credit 1,056.9 1,099.6 1,099.1 1,098.3 1,104.6 1,118.7 1,115.6 1,123.2 1,116.4 1,120.1 1,125.6 1,131.3 31 U.S. government securities 723.5 740.4 739.3 734.2 727.3 725.5 719.4 718.4 718.7 718.3 717.7 718.6 32 Other securities 333.4 359.2 359.7 364.2 377.3 393.2 396.2 404.8 397.8 401.8 407.9 412.7 33 Loans and leases in bank credit2 3,110.2 3,317.7 3,354.0 3,378.7 3,411.8 3,445.2 3,453.8 3,475.9 3,466.1 3,472.2 3,477.6 3,486.7 34 Commercial and industrial 800.7r 858.9 862.6 864.9 865.6 871.4 876.6 879.2 874.6 880.8 881.8 879.8 35 Real estate l,425.8r 1,559.5 1,576.5 1,592.2 1,605.9 1,616.2 1,619.1 1,632.4 1,632.1 1,630.6 1,631.6 1,634.7 36 Revolving home equity 101.2 114.3 115.8 117.1 118.5 121.0 124.0 125.6 125.2 125.5 125.6 125.9 37 Other l,324.6r 1,445.1 1,460.8 1.475.0 1,487.4 1,495.2 1,495.1 1,506.9 1,506.9 1,505.1 1,506.0 1,508.8 38 Consumer 481.4 508.9 514.1 516.1 526.9 532.1 529.0 534.1 527.6 534.1 537.0 537.9 39 Credit cards and related plans. . n.a. n.a. n.a. 195.2 202.8 206.0 202.9 206.8 200.7 207.2 209.8 210.0 40 Other n.a. n.a. n.a. 320.9 324.2 326.2 326.1 327.2 326.9 326.9 327.2 328.0 41 Security3 71.0 62.6 68.1 67.3 71.2 78.4 80.1 79.2 78.8 76.3 78.2 82.1 42 Other loans and leases 331.4 327.8 332.6 338.3 342.1 347.1 349.0 351.1 353.0 350.5 349.1 352.2 43 Interbank loans 204.0 196.2 200.5 212.9 214.6 209.6 216.7 227.6 231.0 233.3 220.8 224.3 44 Cash assets4 232.0 229.6 222.0 217.6 215.4 220.2 224.5 221.0 210.6 227.4 227.6 216.8 45 Other assets5 330.2 339.3 338.9 355.4 355.2 355.9 367.1 362.3 365.0 362.5 358.8 361.8
46 Total assets6 4,874.1 5,122.8 5,154.6 5,202.1 5,239.9 5,287.2 5,316.0 5,347.8 5,327.1 5,353.4 5,348.3 5,358.0
Liabilities 47 Deposits 3,153.5 3,234.6 3,274.2 3,319.6 3,337.6 3,373.3 3,400.0 3.418.0 3,409.4 3,437.5 3,419.0 3,398.4 48 Transaction 623.9 609.2 605.0 594.4 591.6 594.1 595.8 596.7 569.4 602.5 610.8 606.9 49 Nontransaction 2,529.7 2,625.4 2,669.3 2,725.2 2,746.0 2,779.3 2,804.2 2,821.3 2,840.0 2,834.9 2,808.2 2,791.6 50 Large time 468.2r 504.7 520.6 536.4 543.2 540.0 545.3 549.8 549.2 549.4 548.7 550.6 51 Other 2,061.5r 2,120.7 2,148.7 2,188.7 2,202.8 2,239.3 2,258.8 2,271.4 2,290.8 2,285.5 2,259.5 2,241.0 52 Borrowings 885.0 1,007.9 1,004.6 1,006.9 1,001.7 1,001.2 993.5 993.5 991.2 984.7 983.9 1,012.8 53 From banks in the U.S 328.8 367.6 360.2 366.3 367.9 353.7 349.3 349.1 349.1 351.9 341.3 351.2 54 From others 556.3 640.3 644.4 640.6 633.8 647.5 644.2 644.5 642.1 632.8 642.7 661.6 55 Net due to related foreign offices . . . . 181.2 237.2 235.1 236.1 243.8 240.4 236.1 238.8 227.8 232.3 246.5 252.9 56 Other liabilities 229.9 231.7 228.4 222.1 239.6 254.8 262.7 269.1 268.6 271.4 269.6 267.0
57 Total liabilities 4,449.7 4,711.4 4,742.3 4,784.6 4,822.6 4,869.8 4,892.3 4,919.5 4,897.1 4,925.9 4,919.0 4,931.1
58 Residual (assets less liabilities)7 424.4r 411.5 412.4 417.5 417.2 417.4 423.8 428.3 430.0 427.5 429.3 426.9
Footnotes appear on p. A21.
Digitized for FRASER http://fraser.stlouisfed.org/ Federal Reserve Bank of St. Louis

Commercial Banking Institutions—Assets and Liabilities A17
1.26 COMMERCIAL BANKS IN THE UNITED STATES Assets and Liabilities1—Continued C. Large domestically chartered commercial banks Billions of dollars
Account
Monthly averages Wednesday figures
Account 1999 2000 2000 Account
Nov.1 May r June r Julyr Aug.1' Sept.r Oct.r Nov. Nov. 8 Nov. 15 Nov. 22 Nov. 29
Seasonally adjusted
Assets 1 Bank credit 2,333.2 2,484.5 2,500.2 2,510.2 2,528.1 2,551.6 2,527.8 2,527.2 2,520.7 2,521.8 2,530.7 2,536.2 2 Securities in bank credit 544.3 579.9 581.3 578.8 577.0 585.1 576.1 572.0 568.3 571.2 574.4 575.5 3 U.S. government securities 352.9 359.8 362.7 363.5 359.4 357.5 351.2 344.6 344.7 345.0 344.7 344.1 4 Trading account 18.2 23.5 22.7 24.3 23.7 23.2 21.1 20.5 19.9 20.1 20.9 20.7 5 Investment account 334.7 336.3 339.9 339.2 335.7 334.3 330.1 324.2 324.7 324.9 323.8 323.4 6 Other securities 191.4 220.1 218.7 215.3 217.6 227.6 224.9 227.4 223.6 226.2 229.6 231.3 7 Trading account 82.1 101.2 100.2 97.2 102.5 114.5 112.7 116.0 111.9 114.4 118.9 119.9 8 Investment account 109.4 118.9 118.5 118.1 115.0 113.2 112.2 111.4 111.7 111.8 110.7 111.5 9 State and local government . 24.0 25.4 25.6 26.1 25.9 25.8 26.1 26.3 26.1 26.4 26.5 26.5
10 Other 85.4 93.5 92.9 92.0 89.1 87.4 86.1 85.1 85.7 85.5 84.2 85.0 11 Loans and leases in bank credit2 . . . 1,788.9 1,904.6 1,918.8 1,931.3 1,951.2 1,966.5 1,951.7 1,955.2 1,952.4 1,950.6 1,956.3 1,960.8 12 Commercial and industrial 548.5 579.5 582.9 583.4 586.5 586.7 586.0 584.2 580.2 585.5 586.1 584.5 13 Bankers acceptances 1.1 1.1 1.0 1.0 .9 .9 .8 .9 .8 .9 .9 .8 14 Other 547.4 578.4 581.8 582.4 585.5 585.9 585.2 583.3 579.4 584.6 585.2 583.7 15 Real estate 717.2 797.2 803.5 812.1 817.8 818.9 810.9 813.8 814.3 812.3 814.0 814.0 16 Revolving home equity 64.7 74.2 74.5 75.4 76.3 75.2 77.1 78.3 78.1 78.1 78.3 78.5 17 Other 652.5 723.1 729.0 736.7 741.5 743.7 733.8 735.5 736.2 734.1 735.7 735.5 18 Consumer 217.7 227.0 227.8 229.0 231.2 232.1 233.3 234.9 234.2 234.2 234.5 236.6 19 Security3 61.6 57.8 62.1 63.1 69.3 77.9 68.1 68.5 66.6 65.8 68.3 72.7 20 Federal funds sold to and
repurchase agreements with broker-dealers 43.9 38.9 43.9 44.6 50.7 58.6 49.6 50.6 47.6 46.6 51.4 56.0
21 Other 17.6 18.9 18.2 18.6 18.6 19.3 18.5 17.9 18.9 19.2 17.0 16.7 22 State and local government 11.8 12.4 12.3 12.2 12.3 12.4 12.4 12.4 12.4 12.4 12.4 12.3 23 Agricultural 8.9 9.6 9.6 9.5 9.5 9.4 9.4 9.5 9.4 9.4 9.5 9.6 24 Federal funds sold to and
repurchase agreements with others 12.2 13.2 13.5 12.8 14.4 17.0 17.7 20.2 20.1 20.0 20.7 21.1
25 All other loans 92.6 87.7 84.7 84.2 84.1 85.4 85.3 82.8 86.3 82.2 81.8 80.9 26 Lease-financing receivables 118.5 120.3 122.5 125.0 126.1 126.7 128.6 129.0 128.9 128.8 129.1 129.1 27 Interbank loans 134.5 130.7 133.6 141.5 140.1 130.6 136.2 139.9 141.3 141.5 138.2 138.9 28 Federal funds sold to and
repurchase agreements with commercial banks 61.0 66.8 67.8 73.6 66.0 56.4 57.5 60.6 58.5 63.1 60.3 60.8
29 Other 73.4 63.9 65.8 67.9 74.1 74.3 78.7 79.3 82.8 78.4 77.9 78.1 30 Cash assets4 144.2 149.8 146.0 143.9 144.6 141.5 141.9 136.8 139.5 134.5 147.3 124.2 31 Other assets5 234.3 222.7 223.3 243.3 246.0 247.9 261.3 257.6 258.5 258.5 256.3 256.6
32 Total assets6 2310.8 2,952.9 2,968.5 3,003.8 3,023.4 3,036.0 3,032.0 3,026.1 3,024.7 3,021.1 3,037.4 3,020.0
Liabilities 33 Deposits 1,597.2 1,644.9 1,638.4 1,638.9 1,634.5 1,634.1 1,637.1 1,620.8 1,623.9 1,628.4 1,630.0 1,596.0 34 Transaction 318.2 316.6 309.4 302.9 305.4 301.5 303.8 293.5 286.2 292.7 309.1 287.4 35 Nontransaction 1,279.0 1,328.2 1,329.0 1,336.0 1,329.1 1,332.6 1,333.3 1,327.3 1,337.7 1,335.7 1,321.0 1,308.6 36 Large time 224.6 251.8 258.6 266.8 265.2 257.2 254.0 249.9 250.9 250.5 247.5 249.3 37 Other 1,054.4 1,076.4 1,070.3 1,069.1 1,063.9 1,075.4 1,079.3 1,077.4 1,086.8 1,085.2 1,073.5 1,059.3 38 Borrowings 581.7 652.2 656.6 678.7 689.3 671.4 664.2 661.2 662.7 650.9 657.5 672.6 39 From banks in the U.S 178.6 203.3 197.0 205.1 207.5 192.2 196.4 193.7 195.7 195.5 188.9 192.4 40 From others 403.1 448.9 459.6 473.6 481.8 479.2 467.8 467.5 467.0 455.3 468.6 480.1 41 Net due to related foreign offices 174.4 226.5 234.2 221.3 222.7 224.4 211.7 211.7 204.5 211.8 215.2 218.6 42 Other liabilities 169.9 172.8 173.8 177.3 193.3 207.4 213.9 218.7 218.5 221.4 218.5 216.2
43 Total liabilities 2,523.2 2,6963 2,702.9 2,716.1 2,739.8 2,7373 2,726.9 2,7123 2,709.6 2,712.5 2,721.2 2,703.4
44 Residual (assets less liabilities)7 287.6 256.6 265.6 287.6 283.6 298.8 305.0 313.8 315.1 308.5 316.2 316.6
Footnotes appear on p. A21.
Digitized for FRASER http://fraser.stlouisfed.org/ Federal Reserve Bank of St. Louis
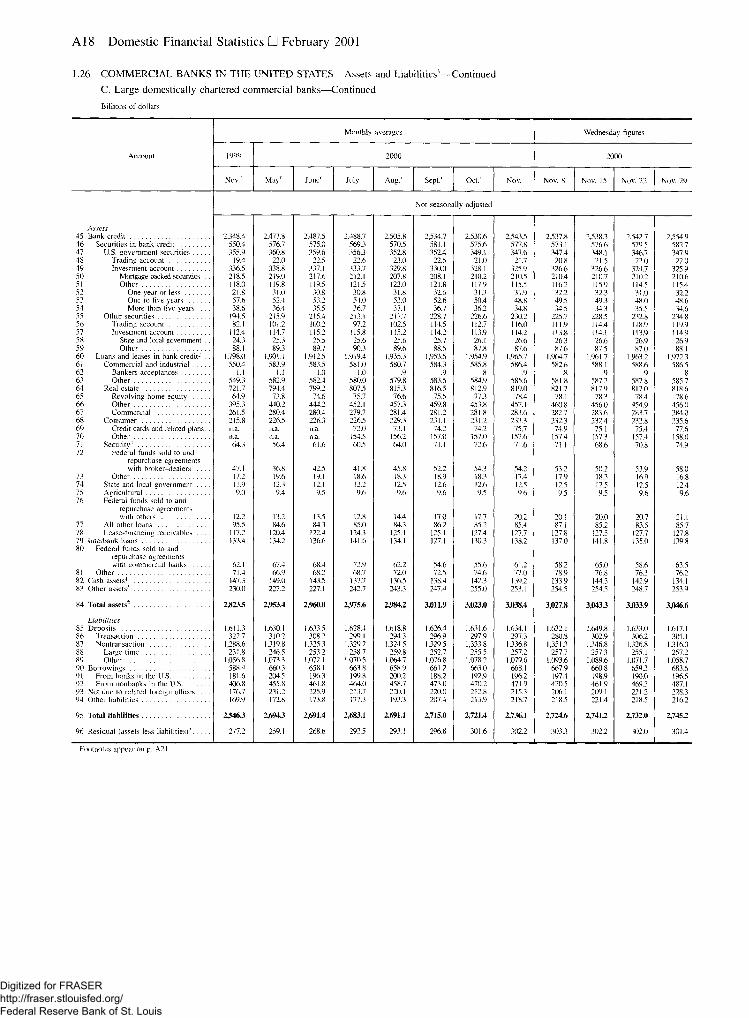
A18 Domestic Nonfinancial Statistics • February 2001
1.26 COMMERCIAL BANKS IN THE UNITED STATES Assets and Liabilities1—Continued C. Large domestically chartered commercial banks—Continued Billions of dollars
Account
Monthly averages Wednesday figures
Account 1999 2000 2000 Account
Nov.r May1" Juner Julyr Aug/ Sept.1" Oct.r Nov. Nov. 8 Nov. 15 Nov. 22 Nov. 29
Not seasonally adjusted
Assets 45 Bank credit 2,348.4 2,477.8 2,487.5 2.488.7 2,505.8 2,534.7 2,530.6 2,543.5 2,537.8 2,538.3 2,542.7 2.554.9 46 Securities in bank credit 550.4 576.7 575.0 569.3 570.5 581.1 575.6 577.8 573.1 576.6 579.5 582.7 47 U.S. government securities 355.9 360.8 359.6 356.3 352.8 352.4 349.1 347.6 347.4 348.1 346.7 347.9 48 Trading account 19.4 22.0 22.5 22.6 23.0 22.5 21.0 21.7 20.8 21.5 22.0 22.0 49 Investment account 336.5 338.8 337.1 333.7 329.8 330.0 328.1 325.9 326.6 326.6 324.7 325.9 50 Mortgage-backed securities . . 218.5 219.0 217.6 212.1 207.8 208.1 210.2 210.5 210.4 210.7 210.2 210.6 51 Other 118.0 119.8 119.5 121.5 122.0 121.8 117.9 115.5 116.2 115.9 114.5 115.4 52 One year or less 21.8 31.0 30.8 30.8 31.8 32.6 31.3 31.9 32.2 32.3 31.0 32.2 53 One to five years 57.6 52.4 53.2 54.0 53.0 52.6 50.4 48.8 49.5 49.3 48.0 48.6 54 More than five years . . . 38.6 36.4 35.5 36.7 37.1 36.7 36.2 34.8 34.5 34.3 35.5 34.6 55 Other securities 194.5 215.9 215.4 213.1 217.7 228.7 226.6 230.2 225.7 228.5 232.8 234.8 56 Trading account 82.1 101.2 100.2 97.2 102.5 114.5 112.7 116.0 111.9 114.4 118.9 119.9 57 Investment account 112.4 114.7 115.2 115.8 115.2 114.2 113.9 114.2 113.8 114.1 113.9 114.9 58 State and local government . . 24.3 25.3 25.5 25.6 25.6 25.7 26.1 26.6 26.3 26.6 26.9 26.9 59 Other 88.1 89.3 89.7 90.3 89.6 88.5 87.8 87.6 87.6 87.5 87.0 88.1 60 Loans and leases in bank credit2 . . 1,798.0 1,901.1 1.912.5 1.919.4 1,935.3 1,953.5 1,954.9 1,965.7 1,964.7 1,961.7 1,963.2 1,972.3 61 Commercial and industrial 550.4 583.9 583.5 581.0 580.7 584.3 585.8 586.4 582.6 588.1 588.6 586.5 62 Bankers acceptances 1.1 1.1 1.0 1.0 .9 .9 .8 .9 .8 .9 .9 .8 63 Other 549.3 582.9 582.4 580.0 579.8 583.5 584.9 585.6 581.8 587.2 587.8 585.7 64 Real estate 721.7 794.4 799.2 807.5 815.3 816.5 812.9 819.0 821.7 817.9 817.0 818.6 65 Revolving home equity 64.9 73.8 74.6 75.7 76.6 75.5 77.3 78.4 78.1 78.3 78.4 78.6 66 Other 395.3 440.2 444.2 452.1 457.3 459.8 453.8 457.1 460.8 456.0 454.9 456.0 67 Commercial 261.5 280.4 280.4 279.7 281.4 281.2 281.8 283.6 282.7 283.6 283.7 284.0 68 Consumer 215.8 226.5 226.3 226.5 229.3 231.1 231.2 233.3 232.3 232.4 232.8 235.6 69 Credit cards and related plans. . n.a. n.a. n.a. 72.0 73.1 74.2 74.2 75.7 74.9 75.1 75.4 77.6 70 Other n.a. n.a. n.a. 154.5 156.2 157.0 157.0 157.6 157.4 157.3 157.4 158.0 71 Security' 64.3 56.4 61.6 60.5 64.0 71.1 72.6 71.6 71.1 68.6 70.8 74.9 72 Federal funds sold to and
repurchase agreements with broker-dealers . . . . 47.1 36.8 42.5 41.8 45.8 52.2 54.3 54.2 53.2 50.2 53.9 58.0
73 Other 17.2 19.6 19.1 18.6 18.3 18.9 18.3 17.4 17.9 18.3 16.9 16.8 74 State and local government . . . . 11.9 12.3 12.1 12.2 12.5 12.6 12.6 12.5 12.5 12.5 12.5 12.4 75 Agricultural 9.0 9.4 9.5 9.6 9.6 9.6 9.5 9.6 9.5 9.5 9.6 9.6 76 Federal funds sold to and
repurchase agreements with others 12.2 13.2 13.5 12.8 14.4 17.0 17.7 20.2 20.1 20.0 20.7 21.1
77 All other loans 95.5 84.6 84.3 85.0 84.3 86.2 85.2 85.4 87.1 85.2 83.5 85.7 78 Lease-financing receivables . . . . 117.2 120.4 122.4 124.3 125.1 125.1 127.4 127.7 127.8 127.5 127.7 127.8 79 Interbank loans 133.4 134.2 136.6 141.6 134.1 127.1 130.3 138.2 137.0 141.8 135.0 139.8 80 Federal funds sold to and
repurchase agreements with commercial banks 62.1 67.4 68.4 72.9 62.2 54.6 55.6 61.2 58.2 65.0 58.6 63.5
81 Other 71.4 66.9 68.2 68.7 72.0 72.5 74.6 77.0 78.9 76.8 76.3 76.2 82 Cash assets4 147.3 149.0 143.5 137.7 136.5 138.4 142.3 139.2 133.9 144.3 142.9 134.1 83 Other assets5 230.0 227.2 227.1 242.7 243.3 247.4 255.0 253.1 254.5 254.5 248.7 253.9
84 Total assets6 2,823.5 2,953.4 2,960.0 2,975.6 2,9^4.2 3,011.9 3,023.0 3,038.4 3,027.8 3,0433 3,033.9 3,046.6
Liabilities 85 Deposits 1,611.3 1.630.1 1.633.5 1.628.4 1,618.8 1,626.4 1,631.6 1.634.1 1.632.1 1,649.8 1,633.0 1,617.1 86 Transaction 322.7 310.2 308.2 299.1 294.3 296.9 297.9 297.3 280.8 302.9 306.2 301.1 87 Nontransaction 1,288.6 1,319.8 1,325.3 1.329.2 1.324.5 1,329.5 1,333.8 1,336.8 1,351.3 1,346.8 1,326.8 1,316.0 88 Large time 231.8 246.5 253.2 258.7 259.8 252.7 255.5 257.2 257.7 257.3 255.1 257.2 89 Other 1,056.8 1,073.3 1,072.1 1.070.5 1.064.7 1,076.8 1,078.2 1,079.6 1,093.6 1.089.6 1,071.7 1,058.7 90 Borrowings 588.4 660.3 658.1 663.8 658.9 661.2 663.0 668.1 667.9 660.8 659.3 683.6 91 From banks in the U.S 181.6 204.5 196.3 199.8 200.2 188.2 192.9 196.2 197.4 198.9 190.0 196.5 92 From nonbanks in the U.S 406.8 455.8 461.8 464.0 458.7 473.0 470.2 471.9 470.5 461.9 469.3 487.1 93 Net due to related foreign offices . . . 176.7 231.2 225.9 213.7 220.1 220.0 212.8 215.3 206.1 209.1 221.2 228.3 94 Other liabilities 169.9 172.8 173.8 177.3 193.3 207.4 213.9 218.7 218.5 221.4 218.5 216.2
95 Total liabilities 2,5463 2,6943 2,691.4 2,683.1 2,691.1 2,715.0 2,721.4 2,736.1 2,724.6 2,741.2 2,732.0 2,745.2
96 Residual (assets less liabilities)7 277.2 259.1 268.6 292.5 293.1 296.8 301.6 302.2 303.3 302.2 302.0 301.4
Footnotes appear on p. A21.
Digitized for FRASER http://fraser.stlouisfed.org/ Federal Reserve Bank of St. Louis

Commercial Banking Institutions—Assets and Liabilities A19
1.26 COMMERCIAL BANKS IN THE UNITED STATES Assets and Liabilities1—Continued
D. Small domestically chartered commercial banks
Billions of dollars
Monthly averages Wednesday figures
Account 1999 2000 2000
Nov.r Mayr Juner Julyr Aug.r Sept.r Oct.r Nov. Nov. 8 Nov. 15 Nov. 22 Nov. 29
Seasonally adjusted
Assets 1 Bank credit 1,819.0 1,932.6 1,960.2 1,987.5 2,007.3 2,024.8 2,036.8 2,055.2 2,042.8 2,053.8 2,060.5 2,062.8 7 Securities in bank credit 508.1 519.1 522.2 529.9 534.6 538.9 542.6 547.0 544.8 545.5 547.6 549.7
U.S. government securities 369.3 376.3 377.5 378.1 375.2 373.9 372.9 372.5 372.9 372.3 372.6 372.1 4 Other securities 138.9 142.8 144.7 151.8 159.4 165.0 169.7 174.5 171.9 173.2 175.0 177.6
Loans and leases in bank credit2 1,310.8 1,413.5 1,438.0 1,457.6 1,472.6 1,485.9 1,494.2 1,508.2 1,498.0 1,508.3 1,512.9 1,513.1 6 Commercial and industrial 251.4 272.3 277.1 283.8 286.8 288.8 291.2 294.2 292.8 294.4 295.0 294.8 7 Real estate 702.2 764.8 776.3 783.6 787.8 796.6 802.8 810.7 806.3 809.5 812.2 814.5 8 Revolving home equity 36.1 40.6 41.2 41.6 42.0 45.0 46.4 46.8 46.6 46.8 46.8 46.9 9 Other 666.2 724.2 735.1 741.9 745.8 751.6 756.4 763.9 759.7 762.7 765.4 767.5 in Consumer 265.1 282.3 288.2 290.6 296.9 299.3 298.0 300.2 295.7 301.5 303.0 300.9 11 Security3 6.7 6.2 6.5 6.8 7.2 7.2 7.5 7.5 7.7 7.7 7.3 7.3 I? Other loans and leases 85.5 87.9 89.9 92.8 93.9 94.0 94.7 95.5 95.4 95.3 95.3 95.7 n Interbank loans 65.7 65.6 67.2 75.4 84.5 85.3 86.7 82.6 84.9 84.3 81.0 79.3 14 Cash assets4 81.7 80.8 79.1 81.3 81.7 82.2 82.5 78.7 76.3 77.6 83.7 76.1 15 Other assets5 98.9 112.9 111.9 110.9 110.2 108.9 112.2 107.8 107.4 105.6 111.8 105.7
16 Total assets6 2,041.8 2,167.2 2,193J 2,2293 2,257.4 2,274.6 2,291.6 2,297.5 2,284.9 2,294.7 2310.2 2,297.2
Liabilities 17 Deposits 1,531.2 1,605.3 1,643.4 1,696.5 1,723.5 1,749.0 1,765.4 1,770.9 1,760.0 1,771.1 1,779.8 1,769.0 18 Transaction 297.6 301.4 296.2 297.9 301.8 299.4 300.2 295.7 286.0 293.9 305.1 298.6 19 Nontransaction 1,233.6 1,303.8 1,347.2 1,398.7 1,421.7 1,449.6 1,465.2 1,475.2 1,474.0 1,477.2 1,474.7 1,470.3 7.0 Large time 236.3 258.2 267.4 277.7 283.4 287.3 289.8 292.7 291.5 292.1 293.6 293.4 71 Other 997.3 1,045.7 1,079.8 1,120.9 1,138.3 1,162.3 1,175.4 1,182.6 1,182.5 1,185.0 1,181.2 1,177.0 22 Borrowings 295.3 346.3 344.6 340.7 339.7 334.2 327.6 323.4 325.1 322.6 321.3 323.5 73 From banks in the U.S 146.7 163.7 162.2 164.1 164.8 161.9 153.9 151.9 152.4 152.5 149.8 152.1 74 From others 148.6 182.5 182.4 176.6 174.9 172.3 173.7 171.5 172.7 170.1 171.5 171.4 25 Net due to related foreign offices . . . . 4.5 6.0 9.1 22.4 23.7 20.4 23.3 23.5 21.8 23.2 25.3 24.7 26 Other liabilities 60.0 58.9 54.8 45.5 46.3 47.7 49.2 50.5 50.1 49.9 51.3 50.7
27 Total liabilities 1391.1 2,016.4 2,051.9 2,105.1 2,133.1 2,151.2 2,165.4 2,1683 2,157.0 2,166.8 2,177.6 2,167.9
28 Residual (assets less liabilities)7 150.7 150.9 141.4 124.2 124.2 123.4 126.2 129.2 127.9 127.9 132.5 129.4
Not seasonally adjusted
Assets ?9 Bank credit 1,818.7 1,939.4 1,965.6 1,988.3 2,010.7 2,029.2 2,038.8 2,055.6 2,044.7 2,054.0 2,060.5 2,063.1 30 Securities in bank credit 506.5 522.9 524.1 529.0 534.2 537.6 540.0 545.4 543.3 543.5 546.1 548.6 31 U.S. government securities 367.5 379.5 379.7 377.9 374.6 373.0 370.3 370.8 371.2 370.2 370.9 370.7 3? Other securities 138.9 143.3 144.4 151.1 159.6 164.5 169.7 174.6 172.1 173.3 175.1 177.9 33 Loans and leases in bank credit2 1,312.2 1,416.6 1,441.5 1,459.3 1,476.5 1,491.7 1,498.8 1,510.2 1,501.4 1,510.5 1,514.4 1,514.5 34 Commercial and industrial 250.4 274.9 279.1 283.9 284.9 287.1 290.9 292.7 292.0 292.7 293.2 293.3 35 Real estate 704.1 765.1 777.3 784.6 790.6 799.7 806.2 813.4 810.5 812.7 814.5 816.0 36 Revolving home equity 36.3 40.5 41.1 41.4 41.9 45.5 46.7 47.2 47.1 47.2 47.2 47.3 37 Other 667.8 724.6 736.2 743.2 748.7 754.2 759.5 766.2 763.4 765.5 767.3 768.8 38 Consumer 265.5 282.4 287.9 289.6 297.6 301.0 297.7 300.8 295.3 301.7 304.2 302.3 39 Credit cards and related plans. . n.a. n.a. n.a. 123.1 129.6 131.8 128.6 131.1 125.8 132.1 134.4 132.4 40 Other n.a. n.a. n.a. 166.5 168.0 169.2 169.1 169.7 169.5 169.6 169.8 169.9 41 Security3 6.7 6.2 6.5 6.8 7.2 7.2 7.5 7.5 7.7 7.7 7.3 7.3 47 Other loans and leases 85.6 87.9 90.7 94.4 96.2 96.6 96.6 95.7 95.9 95.7 95.2 95.6 41 Interbank loans 70.5 62.0 63.9 71.3 80.4 82.5 86.4 89.3 93.9 91.6 85.8 84.5 44 Cash assets4 84.7 80.6 78.5 80.0 78.9 81.8 82.2 81.9 76.6 83.1 84.7 82.7 45 Other assets5 100.1 112.0 111.7 112.8 111.9 108.5 112.1 109.2 110.4 108.0 110.1 107.8
46 Total assets6 2,050.6 2,169.4 2,194.6 2,226.5 2,255.7 2,275.4 2,293.0 2309.4 2,2993 2310.1 2314.4 2311.4
Liabilities 47 Deposits 1,542.2 1,604.5 1,640.7 1,691.2 1,718.8 1,746.9 1,768.3 1,783.9 1,777.3 1,787.7 1,786.0 1,781.3 48 Transaction 301.2 299.0 296.7 295.3 297.3 297.2 297.9 299.4 288.6 299.6 304.5 305.7 49 Nontransaction 1,241.0 1,305.6 1,344.0 1,396.0 1,421.5 1,449.8 1,470.4 1,484.5 1,488.7 1,488.1 1,481.4 1,475.6 50 Large time 236.3 258.2 267.4 277.7 283.4 287.3 289.8 292.7 291.5 292.1 293.6 293.4 51 Other 1,004.7 1,047.4 1,076.6 1,118.2 1,138.1 1,162.5 1,180.6 1,191.8 1,197.2 1,196.0 1,187.9 1,182.2 52 Borrowings 296.6 347.6 346.5 343.1 342.8 340.0 330.5 325.5 323.4 323.9 324.6 329.2 53 From banks in the U.S 147.2 163.1 163.9 166.5 167.7 165.5 156.5 152.9 151.7 153.0 151.3 154.7 54 From others 149.5 184.5 182.6 176.6 175.1 174.5 174.0 172.6 171.6 170.9 173.4 174.4 5.5 Net due to related foreign offices . . . . 4.5 6.0 9.1 22.4 23.7 20.4 23.3 23.5 21.8 23.2 25.3 24.7 56 Other liabilities 60.0 58.9 54.5 44.8 46.2 47.4 48.8 50.5 50.1 50.0 51.1 50.8
57 Total liabilities 1,903.4 2,017.0 2,050.9 2,10 IS 2,131.6 2,154.8 2,170.9 2,1833 2,172.5 2,184.7 2,187.0 2,185.9
58 Residual (assets less liabilities)7 147.2 152.4 143.7 125.0 124.1 120.6 122.1 126.1 126.8 125.4 127.4 125.5
Footnotes appear on p. A21.
Digitized for FRASER http://fraser.stlouisfed.org/ Federal Reserve Bank of St. Louis
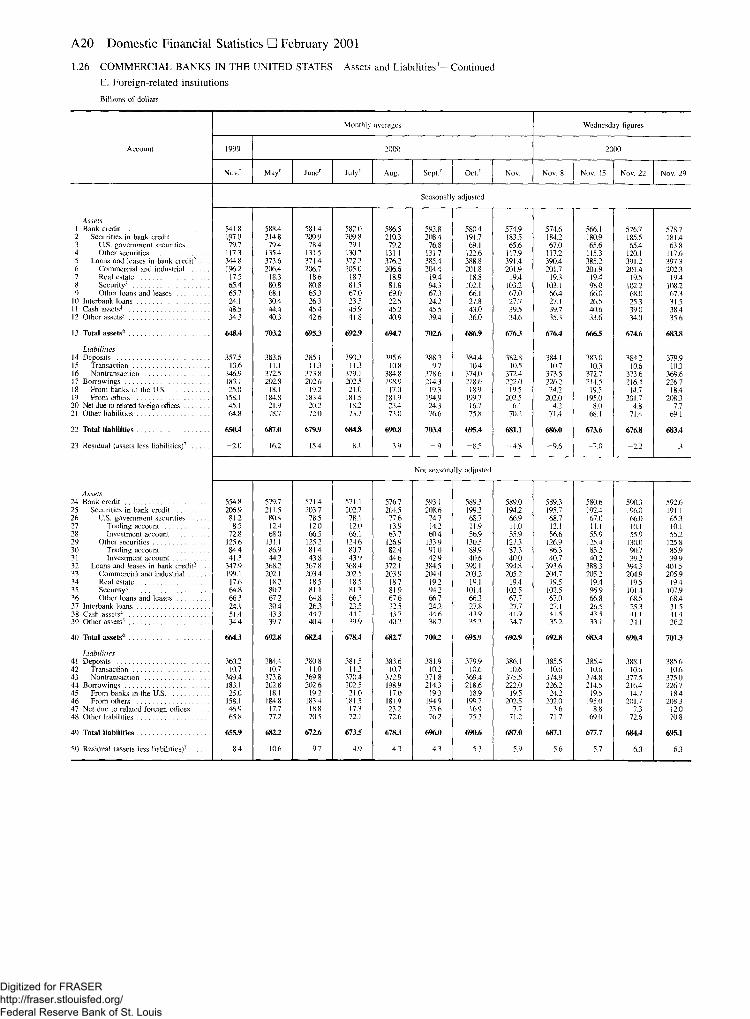
A20 Domestic Nonfinancial Statistics • February 2001
1.26 COMMERCIAL BANKS IN THE UNITED STATES Assets and Liabilities'—Continued E. Foreign-related institutions Billions of dollars
Monthly averages Wednesday figures
Account 1999 2000 2000
Nov.r Mayr Juner July1" Aug/ Sept.r Oct/ Nov. Nov. 8 Nov. 15 Nov. 22 Nov. 29
Seasonally adjusted
Assets 1 Bank credit 541.8 588.4 581.4 582.0 586.5 593.8 580.4 574.9 574.6 566.1 576.7 578.7 2 Securities in bank credit 197.0 214.8 209.9 209.8 210.3 208.4 191.7 183.5 184.2 180.9 185.5 181.4 3 U.S. government securities 79.7 79.4 78.4 79.1 79.2 76.8 69.1 65.6 67.0 65.6 65.4 63.8 4 Other securities 117.3 135.4 131.5 130.7 131.1 131.7 122.6 117.9 117.2 115.3 120.1 117.6 5 Loans and leases in bank credit2 . . . 344.8 373.6 371.4 372.2 376.2 385.4 388.8 391.4 390.4 385.2 391.2 397.3 6 Commercial and industrial 196.2 206.4 206.7 205.0 206.6 204.4 201.8 201.9 201.7 201.9 201.4 202.3 7 Real estate 17.5 18.3 18.6 18.7 18.9 19.4 18.8 19.4 19.3 19.4 19.5 19.4 8 Security3 65.4 80.8 80.8 81.5 81.8 94.3 102.1 103.2 103.1 98.0 102.2 108.2 9 Other loans and leases 65.7 68.1 65.3 67.0 69.0 67.3 66.1 67.0 66.4 66.0 68.0 67.3
10 Interbank loans 24.1 30.4 26.3 23.5 22.5 24.2 27.8 27.7 27.1 26.5 25.3 31.5 11 Cash assets4 48.5 44.4 45.4 45.9 45.2 45.5 43.0 39.5 39.7 40.6 39.0 38.4 12 Other assets5 34.3 40.3 42.6 41.8 40.9 39.4 36.0 34.6 35.3 33.6 34.0 35.6
13 Total assets6 648.4 703.2 695J 692.9 694.7 702.6 686.9 676.3 676.4 666.5 674.6 683.8
Liabilities 14 Deposits 357.5 383.6 385.1 390.3 395.6 388.3 384.4 382.8 384.1 383.0 384.2 379.9 15 Transaction 10.6 11.1 11.3 11.3 10.8 9.7 10.4 10.5 10.7 10.3 10.6 10.3 16 Nontransaction 346.9 372.5 373.8 379.1 384.8 378.6 374.0 372.4 373.5 372.7 373.6 369.6 17 Borrowings 183.1 202.8 202.6 202.5 198.9 214.3 218.6 222.0 226.2 214.5 216.4 226.7 18 From banks in the U.S 25.0 18.1 19.2 21.0 17.0 19.3 18.9 19.5 24.2 19.5 14.7 18.4 19 From others 158.1 184.8 183.4 181.5 181.9 194.9 199.7 202.5 202.0 195.0 201.7 208.3 20 Net due to related foreign offices 45.1 21.9 20.2 18.2 23.4 24.3 16.7 6.1 4.2 8.0 4.8 7.7 21 Other liabilities 64.8 78.7 72.0 73.7 73.0 76.6 75.8 70.2 71.4 68.1 71.4 69.1
22 Total liabilities 650.4 687.0 679.9 684.8 690.8 703.4 695.4 681.1 686.0 673.6 676.8 683.4
23 Residual (assets less liabilities)7 -2 .0 16.2 15.4 8.1 3.9 - . 9 -8 .5 -4 .8 -9 .6 -7 .0 -2 .2 .3
Not seasonally adjusted
Assets 24 Bank credit 554.8 579.7 571.4 571.1 576.7 593.1 589.3 589.0 589.3 580.6 590.3 592.6 25 Securities in bank credit 206.9 211.5 203.7 202.7 204.5 208.6 199.2 194.2 195.7 192.4 196.0 191.1 26 U.S. government securities 81.2 80.4 78.5 78.1 77.6 74.7 68.7 66.9 68.7 67.0 66.0 65.3 27 Trading account 8.5 12.4 12.0 12.0 13.9 14.2 11.9 11.0 12.1 11.1 10.1 10.1 28 Investment account 72.8 68.0 66.5 66.1 63.7 60.4 56.9 55.9 56.6 55.9 55.9 55.2 29 Other securities 125.6 131.1 125.2 124.6 126.9 133.9 130.5 127.3 126.9 125.4 130.0 125.8 30 Trading account 84.4 86.9 81.4 80.7 82.4 91.0 89.9 87.3 86.3 85.2 90.7 85.9 31 Investment account 41.3 44.2 43.8 43.9 44.6 42.9 40.6 40.0 40.7 40.2 39.2 39.9 32 Loans and leases in bank credit2 . . . 347.9 368.2 367.8 368.4 372.1 384.5 390.1 394.8 393.6 388.3 394.3 401.5 33 Commercial and industrial 199.1 202.1 203.4 202.5 203.9 204.4 203.2 205.2 201.7 205.2 204.9 205.9 34 Real estate 17.6 18.2 18.5 18.5 18.7 19.2 19.1 19.4 19.5 19.4 19.5 19.4 35 Security3 64.8 80.7 81.1 81.3 81.9 94.2 101.4 102.5 102.5 96.9 101.4 107.9 36 Other loans and leases 66.3 67.2 64.8 66.2 67.6 66.7 66.3 67.7 67.0 66.8 68.5 68.4 37 Interbank loans 24.1 30.4 26.3 23.5 22.5 24.2 27.8 27.7 27.1 26.5 25.3 31.5 38 Cash assets4 51.4 43.3 44.7 44.2 43.7 44.6 43.9 41.9 41.5 43.5 41.1 41.4 39 Other assets5 34.4 39.7 40.4 39.9 40.2 38.7 35.3 34.7 35.2 33.1 34.1 36.2
40 Total assets6 664.3 692.8 682.4 678.4 682.7 700.2 695.9 692.9 692.8 683.4 690.4 7013
Liabilities 41 Deposits 360.2 384.4 380.8 381.5 383.6 381.9 379.9 386.1 385.5 385.4 388.1 385.6 42 Transaction 10.7 10.7 11.0 11.2 10.7 10.2 10.6 10.6 10.6 10.6 10.6 10.6 43 Nontransaction 349.4 373.8 369.8 370.4 372.9 371.8 369.4 375.5 374.9 374.8 377.5 375.0 44 Borrowings 183.1 202.8 202.6 202.5 198.9 214.3 218.6 222.0 226.2 214.5 216.4 226.7 45 From banks in the U.S 25.0 18.1 19.2 21.0 17.0 19.3 18.9 19.5 24.2 19.5 14.7 18.4 46 From others 158.1 184.8 183.4 181.5 181.9 194.9 199.7 202.5 202.0 195.0 201.7 208.3 47 Net due to related foreign offices . . . . 46.9 17.7 18.8 17.3 23.2 23.6 16.9 7.7 3.6 8.8 7.3 12.0 48 Other liabilities 65.8 77.2 70.5 72.1 72.6 76.2 75.2 71.2 71.7 69.0 72.6 70.8
49 Total liabilities 655.9 682^ 672.6 673.5 678.3 696.0 690.6 687.0 687.1 677.7 684.4 695.1
50 Residual (assets less liabilities)7 8.4 10.6 9.7 4.9 4.3 4.3 5.3 5.9 5.6 5.7 6.0 6.3
Digitized for FRASER http://fraser.stlouisfed.org/ Federal Reserve Bank of St. Louis

Commercial Banking Institutions—Assets and Liabilities A21
1.26 COMMERCIAL BANKS IN THE UNITED STATES Assets and Liabilities'—Continued
E. Foreign-related institutions—Continued
Billions of dollars
Account
Monthly averages Wednesday figures
Account 1999 2000 2000 Account
Nov.r May' Juner Julyr Aug.r Sept.' Oct.r Nov. Nov. 8 Nov. 15 Nov. 22 Nov. 29
Not seasonally adjusted
M E M O Large domestically chartered banks.
adjusted for mergers 51 Revaluation gains on off-balance-sheet
items8 59.6 72.4 68.3 63.1 66.5 74.4 70.9 68.0 67.7 66.6 68.4 69.1 52 Revaluation losses on off-balance-
sheet items8 59.7 72.9 68.5 62.9 67.3 73.9 72.8 72.6 72.0 71.1 73.4 73.4 53 Mortage-backed securities9 251.0 252.6 250.0 242.2 237.8 238.0 239.4 239.6 239.6 239.5 239.1 240.1 54 Pass-through 173.0 178.0 177.7 173.0 169.8 170.3 173.2 173.6 173.0 173.7 173.5 174.3 55 CMO, REMIC, and other 78.0 74.6 72.2 69.2 68.1 67.6 66.2 65.9 66.5 65.8 65.6 65.8 56 Net unrealized gains (losses) on
available-for-sale securities10 . . . . -11.0 -10.3 -8 .7 -11.5 -10.8 -9 .7 —8.7 -8 .0 -8 .3 -8 .1 -8 .1 -7 .8 57 Off-shore credit to U.S. residents". . . . 24.8 23.5 22.4 22.2 22.1 22.1 22.3 23.1 23.0 23.6 23.0 23.0 58 Securitized consumers loans12 n.a. n.a. n.a. 87.4 86.6 85.9 80.8 80.5 80.4 80.1 80.6 80.6 59 Credit cards and related plans n.a. n.a. n.a. 72.4 72.0 71.8 67.2 67.3 67.1 66.9 67.5 67.5 60 Other n.a. n.a. n.a. 15.0 14.6 14.1 13.6 13.2 13.4 13.2 13.1 13.1 61 Securitized business loans12 n.a. n.a. n.a. 17.0 16.2 15.3 15.2 17.8 17.6 17.6 17.5 18.6
Small domestically chartered commercial banks, adjusted for mergers
62 Mortgage-backed securities9 197.1 206.8 207.7 207.7 210.4 212.0 213.2 214.4 214.0 213.8 215.9 213.9 63 Securitized consumer loans'2 n.a. n.a. n.a. 220.5 220.8 221.5 223.7 224.6 226.4 223.1 223.5 225.3 64 Credit cards and related plans n.a. n.a. n.a. 211.5 212.0 212.9 214.0 214.7 216.5 213.2 213.6 215.5 65 Other n.a. n.a. n.a. 9.0 8.8 8.6 9.7 9.9 9.9 9.9 9.9 9.8
Foreign-related institutions 66 Revaluation gains on off-balance-
sheet items8 44.8 51.2 44.7 41.4 43.0 48.6 47.5 44.8 45.3 44.0 46.3 43.2 67 Revaluation losses on off-balance-
sheet items8 42.9 47.7 40.7 38.2 40.1 45.3 44.6 40.8 41.2 40.1 42.2 39.2 68 Securitized business loans12 n.a. n.a. n.a. 23.9 23.7 23.1 23.0 22.8 22.8 22.8 23.0 22.4
NOTE. Tables 1.26, 1.27, and 1.28 have been revised to reflect changes in the Board's H.8 statistical release, "Assets and Liabilities of Commercial Banks in the United States." Table 1.27, "Assets and Liabilities of Large Weekly Reporting Commercial Banks," and table 1.28, "Large Weekly Reporting U.S. Branches and Agencies of Foreign Banks," are no longer being published in the Bulletin. Instead, abbreviated balance sheets for both large and small domestically chartered banks have been included in table 1.26, parts C and D. Data are both merger-adjusted and break-adjusted. In addition, data from large weekly reporting U.S. branches and agencies of foreign banks have been replaced by balance sheet estimates of all foreign-related institutions and are included in table 1.26, part E. These data are break-adjusted.
The not-seasonally-adjusted data for all tables now contain additional balance sheet items, which were available as of October 2, 1996.
I. Covers the following types of institutions in the fifty states and the District of Columbia: domestically chartered commercial banks that submit a weekly report of condition (large domestic); other domestically chartered commercial banks (small domestic); branches and agencies of foreign banks, and Edge Act and agreement corporations (foreign-related institutions). Excludes International Banking Facilities. Data are Wednesday values or pro rata averages of Wednesday values. Large domestic banks constitute a universe; data for small domestic banks and foreign-related institutions are estimates based on weekly samples and on quarter-end condition reports. Data are adjusted for breaks caused by reclassifications of assets and liabilities.
The data for large and small domestic banks presented on pp. A17-19 are adjusted to remove the estimated effects of mergers between these two groups. The adjustment for mergers changes past levels to make them comparable with current levels. Estimated quantities of balance sheet items acquired in mergers are removed from past data for the bank group that contained the acquired bank and put into past data for the group containing the
acquiring bank. Balance sheet data for acquired banks are obtained from Call Reports, and a ratio procedure is used to adjust past levels.
2. Excludes federal funds sold to, reverse RPs with, and loans made to commercial banks in the United States, all of which are included in "Interbank loans."
3. Consists of reverse RPs with brokers and dealers and loans to purchase and carry securities.
4. Includes vault cash, cash items in process of collection, balances due from depository institutions, and balances due from Federal Reserve Banks.
5. Excludes the due-from position with related foreign offices, which is included in "Net due to related foreign offices."
6. Excludes unearned income, reserves for losses on loans and leases, and reserves for transfer risk. Loans are reported gross of these items.
7. This balancing item is not intended as a measure of equity capital for use in capital adequacy analysis. On a seasonally adjusted basis, this item reflects any differences in the seasonal patterns estimated for total assets and total liabilities.
8. Fair value of derivative contracts (interest rate, foreign exchange rate, other commodity and equity contracts) in a gain/loss position, as determined under FASB Interpretation No. 39.
9. Includes mortgage-backed securities issued by U.S. government agencies, U.S. government-sponsored enterprises, and private entities.
10. Difference between fair value and historical cost for securities classified as available-for-sale under FASB Statement No. 115. Data are reported net of tax effects. Data shown are restated to include an estimate of these tax effects.
11. Mainly commercial and industrial loans but also includes an unknown amount of credit extended to other than nonfinancial businesses.
12. Total amount outstanding.
Digitized for FRASER http://fraser.stlouisfed.org/ Federal Reserve Bank of St. Louis

A22 Domestic Nonfinancial Statistics • February 2001
1.32 COMMERCIAL PAPER AND BANKERS DOLLAR ACCEPTANCES OUTSTANDING A. Commercial Paper Millions of dollars, seasonally adjusted, end of period
Item
Year ending December 2000 Item
1995 1996 1997 1998 1999 May June July Aug. Sept. Oct.
1 All issuers 674,904 775,371 966,699 1,163,303 1,403,023 1,497,712 1,516,205 1,551,668 1.559,054 1,557,700 1,587,591
Financial companies' 2 Dealer-placed paper, total2 275,815 361,147 513,307 614,142 786,643 884,299 884,578 900,651 905,634 899,853 912,739 3 Directly placed paper, total3 210,829 229,662 252,536 322.030 337,240 302,305 300,718 309,076 303,307 315,039 328,049
4 Nonfinancial companies4 188,260 184.563 200,857 227,132 279,140 311,109 330,909 341,941 350,113 342,809 346,803
1. Institutions engaged primarily in commercial, savings, and mortgage banking; sales, personal, and mortgage financing; factoring, finance leasing, and other business lending; insurance underwriting; and other investment activities.
2. Includes all financial-company paper sold by dealers in the open market.
3. As reported by financial companies that place their paper directly with investors. 4. Includes public utilities and firms engaged primarily in such activities as communica-
tions, construction, manufacturing, mining, wholesale and retail trade, transportation, and services.
B. Bankers Dollar Acceptances1
Millions of dollars, not seasonally adjusted, year ending September2
Item 1997 1998 1999 2000
1 Total amount of reporting banks ' acceptances in existence 25,774 14,363 10,094 9,881
2 Amount of other banks' eligible acceptances held by reporting banks 736 523 461 462 3 Amount of own eligible acceptances held by reporting banks (included in item 1) 6,862 4,884 4,261 3,789 4 Amount of eligible acceptances representing goods stored in, or shipped between, foreign countries
(included in item 1) 10,467 5,413 3,498 3,689
1. Includes eligible, dollar-denominated bankers acceptances legally payable in the United States. Eligible acceptances are those that are eligible for discount by Federal Reserve Banks; that is, those acceptances that meet the criteria of Paragraph 7 of Section 13 of the Federal Reserve Act (12 U.S.C. §372).
2. Data on bankers dollar acceptances are gathered from approximately 40 institutions; includes U.S. chartered commerical banks (domestic and foreign offices), U.S. branches and agencies of foreign banks, and Edge and agreement corporations. The reporting group is revised every year.
1.33 PRIME RATE CHARGED BY BANKS Short-Term Business Loans1
Percent per year
Date of change Average rate
1998—Jan. 1 Sept. 30 Oct. 16 Nov. 18
1999—July 1 Aug. 25 Nov. 17
2000—Feb. 3 Mar. 22 May 17
8.50 8.25 8.00 7.75
8.00 8.25 8.50
8.75 9.00 9.50
1998 1999 2000
1998—Jan. Feb. Mar. Apr. May June July Aug. Sept. Oct Nov. Dec.
8.35 8.00 9.23
8.50 8.50 8.50 8.50 8.50 8.50 8.50 8.50 8.49 8 .12 7.89 7.75
1999—Jan. . Feb. Mar. Apr. May June July . Aug Sept. Oct. . Nov. Dec.
7.75 7.75 7.75 7.75 7.75 7.75 8.00 8.06 8.25 8.25 8.37 8.50
2000—Jan. . Feb. Mar. Apr. May June July . Aug. Sept. Oct. . Nov. Dec.
1. The prime rate is one of several base rates that banks use to price short-term business Report. Data in this table also appear in the Board's H.15 (519) weekly and G.13 (415) loans. The table shows the date on which a new rate came to be the predominant one quoted monthly statistical releases. For ordering address, see inside front cover, by a majority of the twenty-five largest banks by asset size, based on the most recent Call
Digitized for FRASER http://fraser.stlouisfed.org/ Federal Reserve Bank of St. Louis

Financial Markets A23
1.35 INTEREST RATES Money and Capital Markets
Percent per year; figures are averages of business day data unless otherwise noted
Item 1997 1998 1999 2000 2000, week ending
Item 1997 1998 1999
Aug. Sept. Oct. Nov. Oct. 27 Nov. 3 Nov. 10 Nov. 17 Nov. 24
MONEY MARKET INSTRUMENTS
1 Federal funds1 '2 '3 5.46 5.35 4.97 6.50 6.52 6.51 6.51 6.51 6.55 6.49 6.52 6.51 2 Discount window borrowing2'4 5.00 4.92 4.62 6.00 6.00 6.00 6.00 6.00 6.00 6.00 6.00 6.00
Commercial paper*"5,6
Nonfinancia! 3 1-month 5.57 5.40 5.09 6.47 6.48 6.48 6.49 6.47 6.50 6.47 6.49 6.50 4 2-month 5.57 5.38 5.14 6.48 6.47 6.48 6.52 6.48 6.48 6.51 6.52 6.52 5 3-month 5.56 5.34 5.18 6.49 6.47 6.51 6.50 6.50 6.50 6.49 6.51 6.48
Financial 6 1-month 5.59 5.42 5.11 6.49 6.49 6.48 6.49 6.48 6.49 6.48 6.49 6.49 7 2-month 5.59 5.40 5.16 6.49 6.48 6.47 6.54 6.46 6.49 6.52 6.54 6.57 8 3-month 5.60 5.37 5.22 6.49 6.47 6.52 6.52 6.52 6.52 6.51 6.52 6.53
Commercial paper (historical)3'5'7
9 1-month 5.54 n.a. n.a. n.a. n.a. n.a. n.a. n.a. n.a. n.a. n.a. n.a. 10 3-month 5.58 n.a. n.a. n.a. n.a. n.a. n.a. n.a. n.a. n.a. n.a. n.a. 11 6-month 5.62 n.a. n.a. n.a. n.a. n.a. n.a. n.a. n.a. n.a. n.a. n.a.
Finance)xiper, directly placed (historical)3'5'8
12 1-month 5.44 n.a. n.a. n.a. n.a. n.a. n.a. n.a. n.a. n.a. n.a. n.a. 13 3-month 5.48 n.a. n.a. n.a. n.a. n.a. n.a. n.a. n.a. n.a. n.a. n.a. 14 6-month 5.48 n.a. n.a. n.a. n.a. n.a. n.a. n.a. n.a. n.a. n.a. n.a.
Bankers acceptances3'5'9
15 3-month 5.54 5.39 5.24 n.a. n.a. n.a. n.a. n.a. n.a. n.a. n.a. n.a. 16 6-month 5.57 5.30 5.30 n.a. n.a. n.a. n.a. n.a. n.a. n.a. n.a. n.a.
Certificates of deposit, secondary market3'10
17 1-month 5.54 5.49 5.19 6.55 6.56 6.55 6.56 6.55 6.55 6.55 6.55 6.56 18 3-month 5.62 5.47 5.33 6.61 6.60 6.67 6.65 6.65 6.66 6.65 6.64 6.65 19 6-month 5.73 5.44 5.46 6.76 6.68 6.65 6.63 6.64 6.65 6.65 6.62 6.61
20 Eurodollar deposits, 3-month3 '" 5.61 5.45 5.31 6.61 6.59 6.66 6.64 6.65 6.63 6.65 6.64 6.64
U.S. Treasury bills Secondary market3'5
21 3-month 5.06 4.78 4.64 6.09 6.00 6.11 6.17 6.18 6.19 6.22 6.18 6.18 22 6-month 5.18 4.83 4.75 6.07 5.98 6.04 6.06 6.08 6.09 6.10 6.07 6.06 23 1-year 5.32 4.80 4.81 5.87 5.79 5.72 5.84 5.74 5.86 5.89 5.86 5.87
Auction high""1" 24 3-month 5.07 4.81 4.66 n.a. n.a. n.a. n.a. n.a. n.a. n.a. n.a. n.a. 25 6-month 5.18 4.85 4.76 n.a. n.a. n.a. n.a. n.a. n.a. n.a. n.a. n.a. 26 1-year 5.36 4.85 4.78 n.a. n.a. n.a. n.a. n.a. n.a. n.a. n.a. n.a.
U.S. TREASURY NOTES AND BONDS
Constant maturitiesL
7.7 1-year 5.63 5.05 5.08 6.18 6.13 6.01 6.09 6.01 6.11 6.14 6.09 6.09 28 2-year 5.99 5.13 5.43 6.23 6.08 5.91 5.88 5.88 5.92 5.97 5.89 5.86 29 3-year 6.10 5.14 5.49 6.17 6.02 5.85 5.79 5.80 5.86 5.90 5.80 5.75 30 5-year 6.22 5.15 5.55 6.06 5.93 5.78 5.70 5.73 5.82 5.82 5.69 5.63 31 7-year 6.33 5.28 5.79 6.05 5.98 5.84 5.78 5.75 5.85 5.93 5.79 5.71 32 10-year 6.35 5.26 5.65 5.83 5.80 5.74 5.72 5.66 5.76 5.85 5.73 5.65 33 20-year 6.69 5.72 6.20 6.02 6.09 6.04 5.98 5.94 6.02 6.09 5.99 5.91 34 30-year 6.61 5.58 5.87 5.72 5.83 5.80 5.78 5.72 5.80 5.88 5.79 5.71
Composite 35 More than 10 years (long-term) 6.67 5.69 6.14 n.a. n.a. n.a. n.a. n.a. n.a. n.a. n.a. n.a.
STATE AND LOCAL NOTES AND BONDS
Moody's series14
36 Aaa 5.32 4.93 5.28 5.43 5.40 5.46 5.38 5.42 5.35 5.32 5.44 5.44 37 Baa 5.50 5.14 5.70 6.01 6.12 6.22 6.17 6.18 6.15 6.15 6.20 6.21 38 Bond Buyer series'5 5.52 5.09 5.43 5.51 5.56 5.59 5.54 5.53 5.54 5.60 5.57 5.55
CORPORATE BONDS
39 Seasoned issues, all industries16 7.54 6.87 7.45 7.88 7.98 7.95 7.90 7.89 7.93 7.98 7.89 7.86
Rating group 40 Aaa 7.27 6.53 7.05 7.55 7.62 7.55 7.45 7.45 7.49 7.53 7.45 7.41 41 Aa 7.48 6.80 7.36 7.70 7.83 7.81 7.75 7.75 7.79 7.84 7.75 7.71 42 A 7.54 6.93 7.53 8.02 8.13 8.11 8.09 8.06 8.11 8.17 8.09 8.05 43 Baa 7.87 7.22 7.88 8.26 8.35 8.34 8.28 8.29 8.31 8.35 8.26 8.27
M E M O Dividend-price ratio17
44 Common stocks 1.77 1.49 1.25 1.09 1.10 1.15 1.16 1.16 1.12 1.13 1.15 1.20
NOTE. Some of the data in this table also appear in the Board's H.15 (519) weekly and G. 13 (415) monthly statistical releases. For ordering address, see inside front cover.
1. The daily effective federal funds rate is a weighted average of rates on trades through New York brokers.
2. Weekly figures are averages of seven calendar days ending on Wednesday of the current week; monthly figures include each calendar day in the month.
3. Annualized using a 360-day year or bank interest. 4. Rate for the Federal Reserve Bank of New York. 5. Quoted on a discount basis. 6. Interest rates interpolated from data on certain commercial paper trades settled by the
Depository Trust Company. The trades represent sales of commercial paper by dealers or direct issuers to investors (that is, the offer side). See Board's Commercial Paper Web pages (http://www.federalreserve.gov/releases/cp) for more information.
7. An average of offering rates on commercial paper for firms whose bond rating is AA or the equivalent. Series ended August 29, 1997.
8. An average of offering rates on paper directly placed by finance companies. Series ended August 29, 1997.
9. Representative closing yields for acceptances of the highest-rated money center banks. 10. An average of dealer offering rates on nationally traded certificates of deposit. 11. Bid rates for eurodollar deposits collected around 9:30 a.m. Eastern time. Data are for
indication purposes only. 12. Auction date for daily data; weekly and monthly averages computed on an issue-date
basis. On or after October 28, 1998, data are stop yields from uniform-price auctions. Before that, they are weighted average yields from multiple-price auctions.
13. Yields on actively traded issues adjusted to constant maturities. Source: U.S. Depart-ment of the Treasury.
14. General obligation bonds based on Thursday figures; Moody's Investors Service. 15. State and local government general obligation bonds maturing in twenty years are used
in compiling this index. The twenty-bond index has a rating roughly equivalent to Moodys' Al rating. Based on Thursday figures.
16. Daily figures from Moody's Investors Service. Based on yields to maturity on selected long-term bonds.
17. Standard & Poor's corporate series. Common stock ratio is based on the 500 stocks in the price index.
Digitized for FRASER http://fraser.stlouisfed.org/ Federal Reserve Bank of St. Louis

A24 Domestic Nonfinancial Statistics • February 2001
1.36 STOCK MARKET Selected Statistics
2000 Indicator 1997 1999 Indicator 1997 1999
Mar. Apr. May June July Aug. Sept. Oct. Nov.
Prices and trading volume (averages of daily figures)
Common stock prices (indexes) 1 New York Stock Exchange
(Dec. 31, 1965 = 50) 456.99 550.65 619.52 622.28 646.82 640.07 649.61 653.27 666.14 667.05 646.53 646.64 2 Industrial 574.97 684.35 775.29 790.35 822.76 814.75 819.54 825.28 837.23 829.99 797.00 800.88 3 Transportation 415.08 468.61 491.62 384.39 406.14 411.50 395.09 410.67 419.84 404.23 403.20 434.92 4 Utility 143.87 190.52 284.82 509.59 502.78 487.17 501.93 484.19 459.91 463.76 469.16 455.66 5 Finance 424.84 516.65 530.97 491.29 524.05 523.22 544.51 556.32 597.17 616.89 587.76 600.45
6 Standard & Poor's Corporation (1941-43 = 10)1 873.43 1,085.50 1,327.33 1,442.21 1.461.36 1,418.48 1,461.96 1,473.00 1,485.46 1,468.06 1.390.14 1,375.04
7 American Stock Exchange (Aug. 31, 1973 = 50)2 628.34 682.69 770.90 1,014.03 918.77 917.76 934.90 930.66 920.54 952.74 913.64 892.60
Volume of trading (thousands of shares) 8 New York Stock Exchange 523,254 666,534 799,554 1.124,097 1,047,960 893,896 971,137 941,694 875,087 1,026,597 1,167,025 1,015,606 9 American Stock Exchange 24,390 28,870 32,629 59,449 63,054 44,146 42,490 36,486 35,695 47,047 57,915 58,541
Customer financing (millions of dollars, end-of-period balances)
10 Margin credit at broker-dealers
Free credit balances at brokers4
11 Margin accounts5
12 Cash accounts
1,361,600 1,685,820 2,130,152 278,530 251,700 240,660 247,200 244,970 247,560 250,780 233,376 219,110
293,000 405,180 532.500 65,020 65,930 66,170 64,970 71,730 68,020 70,959 83,131 96,730 517,030 633,725 757.345 85,530 76,190 73,500 74,140 74,970 72,640 74,766 73,271 74,050
Margin requirements (percent of market value and effective date)6
Mar. 11, 1968 June 8. 1968 May 6, 1970 Dec. 6, 1971 Nov. 24, 1972 Jan. 3, 1974
13 Margin stocks 70 80 65 55 65 50 14 Convertible bonds 50 60 50 50 50 50 15 Short sales 70 80 65 55 65 50
1. In July 1976 a financial group, composed of banks and insurance companies, was added to the group of stocks on which the index is based. The index is now based on 400 industrial stocks (formerly 425), 20 transportation (formerly 15 rail), 40 public utility (formerly 60), and 40 financial.
2. On July 5, 1983, the American Stock Exchange rebased its index, effectively cutting previous readings in half.
3. Since July 1983, under the revised Regulation T, margin credit at broker-dealers has included credit extended against stocks, convertible bonds, stocks acquired through the exercise of subscription rights, corporate bonds, and government securities. Separate report-ing of data for margin stocks, convertible bonds, and subscription issues was discontinued in April 1984.
4. Free credit balances are amounts in accounts with no unfulfilled commitments to brokers and are subject to withdrawal by customers on demand.
5. Series initiated in June 1984.
6. Margin requirements, stated in regulations adopted by the Board of Governors pursuant to the Securities Exchange Act of 1934, limit the amount of credit that can be used to purchase and carry "margin securities" (as defined in the regulations) when such credit is collateralized by securities. Margin requirements on securities are the difference between the market value (100 percent) and the maximum loan value of collateral as prescribed by the Board. Regulation T was adopted effective Oct. 15, 1934; Regulation U, effective May 1, 1936; Regulation G, effective Mar. 11, 1968; and Regulation X, effective Nov. 1, 1971.
On Jan. 1, 1977, the Board of Governors for the first time established in Regulation T the initial margin required for writing options on securities, setting it at 30 percent of the current market value of the stock underlying the option. On Sept. 30, 1985, the Board changed the required initial margin, allowing it to be the same as the option maintenance margin required by the appropriate exchange or self-regulatory organization; such maintenance margin rules must be approved by the Securities and Exchange Commission.
Digitized for FRASER http://fraser.stlouisfed.org/ Federal Reserve Bank of St. Louis

Federal Finance A25
1.38 FEDERAL FISCAL A N D FINANCING OPERATIONS
Millions of dollars
Type of account or operation
Fiscal year Calendar year
Type of account or operation 1998 1999 2000
2000 Type of account or operation 1998 1999 2000
June July Aug. Sept. Oct. Nov.
U.S. budget1
1 Receipts, total 2 On-budget 3 Off-budget 4 Outlays, total 5 On-budget 6 Off-budget 7 Surplus or deficit ( - ) , total 8 On-budget 9 Off-budget
Source of financing (total) 10 Borrowing from the public 11 Operating cash (decrease, or increase (—)) 12 Other2
M E M O 13 Treasury operating balance (level, end of
period) 14 Federal Reserve Banks 15 Tax and loan accounts
1,721,798 1,305,999
415,799 1,652,224 1,335,948
316,604 69,246
-29,949 99,195
-51,211 4,743
-22,778
38,878 4,952
33,926
1,827,454 1,382,986
444,468 1,702,942 1,382,262
320,778 124,414
724 123,690
-88,674 -17,580 -18,160
56,458 6,641
49,817
2,025,038 1,544,455
480,583 1,788,140 1,457,376
330,765 236,897
87,079 149,818
-222,672 3,799
-18,024
52,659 8,459
44,199
214,875 168,319 46,556
158,987 152,308
6,679 55,888 16,011 39,877
-23,131 -34 ,350
1,593
57,437 6,208
51,229
134,074 97,681 36,393
129,013 99,404 29,609
5,061 -1 ,723
6,784
-31,307 23,384
2,862
34,053 5,392
28,661
138,128 101,429 36,699
148,555 115,539 33,016
-10 ,427 -14,110
3,683
9,995 20,873
-20,441
13,180 5,961 7,218
219,471 176,692 42,779
153,744 114,748 38,901 65,727 61,944
3,878
-32,334 -39,479
6,086
52,659 8,459
44,199
135,111 101,121 33,990
146,431 115,840 30,592
-11,321 -14,719
3,398
-29,666 42,653
-1 ,666
10,006 5,360 4,646
125,666 89,216 36,450
149,356 116,737 32,619
-23 ,690 -27,521
3,831
41,325 -1 ,431
-16 ,204
11,437 4,382 7,055
1. Since 1990, off-budget items have been the social security trust funds (Federal Old-Age, Survivors, and Disability Insurance) and the U.S. Postal Service.
2. Includes special drawing rights (SDRs); reserve position on the U.S. quota in the International Monetary Fund (IMF); loans to the IMF; other cash and monetary assets; accrued interest payable to the public; allocations of SDRs; deposit funds; miscellaneous liability (including checks outstanding) and asset accounts; seigniorage; increment on gold;
net gain or loss for U.S. currency valuation adjustment; net gain or loss for IMF loan-valuation adjustment; and profit on sale of gold.
SOURCE. Monthly totals: U.S. Department of the Treasury, Monthly Treasury Statement of Receipts and Outlays of the U.S. Government, fiscal year totals: U.S. Office of Management and Budget, Budget of the U.S. Government when available.
Digitized for FRASER http://fraser.stlouisfed.org/ Federal Reserve Bank of St. Louis

A26 Domestic Nonfinancial Statistics • February 2001
1.39 U.S. BUDGET RECEIPTS AND OUTLAYS1
Millions of dollars
Source or type
Fiscal year Calendar year
Source or type
1999 2000
1998 1999 2000 2000 Source or type
1999 2000
H2 HI H2 HI Sept. Oct. Nov.
RECEIPTS
1 All sources 1,827,454 2,025,038 825,057 966,045 892,266 1,089,760 219,471 135,111 125,666
2 Individual income taxes, net 879,480 1,004.461 392,332 481,907 425,451 550,208 104,402 75,969 60,489 3 Withheld 693,940 780,397 339,144 351,068 372,012 388,526 59,766 68,287 62,855 4 Nonwithheld 308,185 358,049 65,204 240,278 68,302 281,103 48,229 8,799 2,320 5 Refunds 122,706 134,046 12,032 109,467 14,841 119,477 3,593 1,118 4,686
Corporation income taxes 6 Gross receipts 216,324 235,655 104,163 106,861 110,111 119,166 46,183 7,113 4,292 7 Refunds 31,645 28.367 14,250 17,092 13,996 13,781 2,746 5,404 2,245 8 Social insurance taxes and contributions, net . . . 611,833 652,851 268,466 324,831 292,551 353,514 56,293 47,155 51,383 9 Employment taxes and contributions2 580,880 620,447 256,142 306,235 280,059 333,584 55,682 45,247 48,536
10 Unemployment insurance 26,480 27,641 10,121 16,378 10,173 17,562 168 1,509 2,43! 11 Other net receipts3 4,473 4,763 2,202 2,216 2,319 2,368 443 399 416
12 Excise taxes 70,414 68,866 33,366 31,015 34,262 33,532 7,769 4,235 6,030 13 Customs deposits 18,336 19,913 9.838 8,440 10,287 9,218 1,823 1,900 1,640 14 Estate and gift taxes 27,782 29,010 12,359 14,915 14,001 15,073 2,168 2,868 2,141 15 Miscellaneous receipts4 34,929 42,647 18,735 15,140 19,569 22,831 3,579 1,275 1,935
OUTLAYS
16 All types l,702,942 r l,788,140 r 877,414 817,227 882,465 892,947 153,744r 146,431 149,356
17 National defense 274,873 293,856 140,196 134,414 149,573 143,476 28,243 21,478 24,445 18 International affairs 15,243 17,252 8,297 6,879 8,530 7,250 1,553 1,795 1,326 19 General science, space, and technology 18,125 19,707 10,142 9,319 10,089 9,601 1,716 1,676 1,776 20 Energy 912 - 1 , 0 2 0 699 797 - 9 0 - 8 9 3 530 - 1 , 2 0 0 74 21 Natural resources and environment 23,970 23,295 12,671 10,351 12,100 10,814 2,542 2,132 2,100 22 Agriculture 23,011 38,472 16,757 9,803 20,887 11,164 6,842 5,025 3,547
23 Commerce and housing credit 2,649 3,321 4,046 - 1 , 6 2 9 7,353 - 2 , 4 9 7 4,591 843 - 7 0 9 24 Transportation 42,531 46,211 20,836 17,082 23,199 21,054 4,209 4,729 4,221 25 Community and regional development 11,870 11,687 6,972 5,368 6,806 5,050 975 1,211 1,133 26 Education, training, employment, and
social services 56,402 58,364 27,762 29,003 27,532 31,234 3,616 5,061 5,014
27 Health 141,079 154,215 67,838 69,320 74,490 75,871 13,566 14,799 13,111 28 Social security and Medicare 580,488 606,552 316,809 261,146 295,030 306,966 50,381 51,766 51,481 29 Income security 237,707 247,380 109.481 126,552 113,504 133,915 20,031 16,485 18,950
30 Veterans benefits and services 43,212 47,084 22.750 20,105 23,412 23,174 5,619 2,222 3,644 31 Administration of justice 25,924 27,704 12,041 13,149 13,459 13,981 2,398 2,545 2,741 32 General government 15,771 13,721 9,136 6,641 7,010 6,198 1,017 1,239 1,134 33 Net interest5 229,735 222,825 116,954 116,655 112,420 115,545 12,584 18,399 18,916 34 Undistributed offsetting receipts6 -40 ,445 -42 ,581 -25 ,793 -17 ,724 - 2 2 , 8 5 0 -19 ,346 - 6 , 7 6 6 - 3 , 7 7 5 - 3 , 5 4 7
1. Functional details do not sum to total outlays for calendar year data because revisions to monthly totals have not been distributed among functions. Fiscal year total for receipts and outlays do not correspond to calendar year data because revisions from the Budget have not been fully distributed across months.
2. Old-age, disability, and hospital insurance, and railroad retirement accounts. 3. Federal employee retirement contributions and civil service retirement and
disability fund.
4. Deposits of earnings by Federal Reserve Banks and other miscellaneous receipts. 5. Includes interest received by trust funds. 6. Rents and royalties for the outer continental shelf, U.S. government contributions for
employee retirement, and certain asset sales. SOURCE. Fiscal year totals: U.S. Office of Management and Budget, Budget of the U.S.
Government. Fiscal Year 200I\ monthly and half-year totals: U.S. Department of the Trea-sury, Monthly Treasury Statement of Receipts and Outlays of the U.S. Government.
Digitized for FRASER http://fraser.stlouisfed.org/ Federal Reserve Bank of St. Louis

Federal Finance All
1.40 FEDERAL DEBT SUBJECT TO STATUTORY LIMITATION
Billions of dollars, end of month
Item
1998 1999 2000
Item Sept. 30 Dec. 31 Mar. 31 June 30 Sept. 30 Dec. 31 Mar. 31 June 30 Sept. 30
1 Federal debt outstanding 5,556 5,643 5,681 5,668 5,685 5,805 5,802 5,714 5,702
2 Public debt securities 5,526 5,614 5,652 5,639 5,656 5,776 5,773 5,686 5,674 3 Held by public 3,761 3,787 3,795 3,685 3,667 3,716 3,688 3,496 n.a. 4 Held by agencies 1,766 1,827 1,857 1,954 1,989 2,061 2,085 2,190 n.a.
5 Agency securities 29 29 29 29 29 29 28 28 28 6 Held by public 26 29 28 28 28 28 28 28 n.a. 7 Held by agencies 4 1 1 1 1 1 0 0 n.a.
8 Debt subject to s ta tutory limit 5,440 5,530 5,566 5,552 5,568 5,687 5,687 5,601 5,592
9 Public debt securities 5,439 5,530 5,566 5,552 5,568 5,687 5,686 5,601 5,591 10 Other debt1 0 0 0 0 0 0 0 0 0
MEMO 11 Statutory debt limit 5,950 5,950 5,950 5,950 5,950 5,950 5,950 5,950 5,950
1. Consists of guaranteed debt of U.S. Treasury and other federal agencies, specified SOURCE. U.S. Department of the Treasury, Monthly Statement of the Public Debt of the participation certificates, notes to international lending organizations, and District of Colum- United States and Treasury Bulletin. bia stadium bonds.
1.41 GROSS PUBLIC DEBT OF U.S. TREASURY Types and Ownership
Billions of dollars, end of period
Type and holder 1996 1997 1998 1999
1999 2000
Type and holder 1996 1997 1998 1999
Q4 Ql Q2 Q3
1 Total gross public debt 5,323.2 5,502.4 5,614.2 5,776.1 5,776.1 5,773.4 5,685.9 5,674.2
By type 2 Interest-bearing 5,317.2 5,494.9 5,605.4 5,766.1 5,766.1 5,763.8 5,675.9 5,622.1 3 Marketable 3,459.7 3,456.8 3,355.5 3,281.0 3,281.0 3,261.2 3,070.7 2,992.8 4 Bills 777.4 715.4 691.0 737.1 737.1 753.3 629.9 616.2 5 Notes 2,112.3 2,106.1 1,960.7 1,784.5 1,784.5 1,732.6 1,679.1 1,611.3 6 Bonds 555.0 587.3 621.2 643.7 643.7 653.0 637.7 635.3 7 Inflation-indexed notes and bonds' n.a. 33.0 67.6 100.7 100.7 107.4 109.0 115.0 8 Nonmarketable2 1,857.5 2,038.1 2,249.9 2,485.1 2,485.1 2,502.6 2,605.2 2,629.3 9 State and local government series 101.3 124.1 165.3 165.7 165.7 161.9 160.4 153.3
10 Foreign issues3 37.4 36.2 34.3 31.3 31.3 28.8 27.7 25.4 11 Government 47.4 36.2 34.3 31.3 31.3 28.8 27.7 25.4 12 Public .0 .0 .0 .0 .0 .0 .0 .0 13 Savings bonds and notes 182.4 181.2 180.3 179.4 179.4 178.6 177.7 177.7 14 Government account series4 1,505.9 1,666.7 1,840.0 2,078.7 2,078.7 2,103.3 2,209.4 2,242.9 15 Non-interest-bearing 6.0 7.5 8.8 10.0 10.0 9.6 10.1 52.1
By holder 5
16 U.S. Treasury and other federal agencies and trust funds 1,497.2 1,655.7 1,826.8 2,060.6 2,060.6 2,085.4 2,190.2 2,235.7 17 Federal Reserve Banks 410.9 451.9 471.7 477.7 477.7 501.7 505.0 511.4 18 Private investors 3,431.2 3,414.6 3,334.0 3,233.9 3,233.9 3,182.8 2,987.4 2,936.2 19 Depository institutions 296.6 300.3 237.3 246.3 246.3r 235.1 219.7 n.a. 20 Mutual funds 315.8 321.5 343.2 348.6r 348.6r 338.9r 318.6 n.a. 21 Insurance companies 214.1 176.6 144.5 125.3r 125.3r 124.0r 120.9 n.a. 22 State and local treasuries6 257.0 239.3 269.3 266.8 266.8 257.2 256.4 n.a.
Individuals 23 Savings bonds 187.0 186.5 186.7 186.5 186.5r 185.3 184.6r 184.7 24 Pension funds 342.8 359.4 374.4 384.5 384.5 385.9 384.5 n.a. 25 Private 139.3 142.5 157.8 171.3 171.3 174.8 175.5 n.a. 26 State and Local 203.5 216.9 216.6 213.2 213.2 211. V 209.0 n.a. 27 Foreign and international7 1,102.1 1,241.6 1,278.7 1,268.8 1,268.8 1,273.9 1,248.9 1,225.2 28 Other miscellaneous investors6 '8 715.8 589.5 498.8 407.1 407.1 382.5 253.8 n.a.
1. The US. Treasury first issued inflation-indexed securities during the first quarter of 1997. 2. Includes (not shown separately) securities issued to the Rural Electrification Administra-
tion, depository bonds, retirement plan bonds, and individual retirement bonds. 3. Nonmarketable series denominated in dollars, and series denominated in foreign cur-
rency held by foreigners. 4. Held almost entirely by U.S. Treasury and other federal agencies and trust funds. 5. Data for Federal Reserve Banks and U.S. government agencies and trust funds are actual
holdings; data for other groups are Treasury estimates. 6. In March 1996, in a redefinition of series, fully defeased debt backed by nonmarketable
federal securities was removed from "Other miscellaneous investors" and added to "State and local treasuries." The data shown here have been revised accordingly.
7. Includes nonmarketable foreign series treasury securities and treasury deposit funds. Excludes treasury securities held under repurchase agreements in custody accounts at the Federal Reserve Bank of New York.
8. Includes individuals, government-sponsored enterprises, brokers and dealers, bank personal trusts and estates, corporate and noncorporate businesses, and other investors.
SOURCE. U.S. Treasury Department, data by type of security, Monthly Statement of the Public Debt of the United States; data by holder, Treasury Bulletin.
Digitized for FRASER http://fraser.stlouisfed.org/ Federal Reserve Bank of St. Louis

A28 Domestic Nonfinancial Statistics • February 2001
1.42 U.S. GOVERNMENT SECURITIES DEALERS Transactions' Millions of dollars, daily averages
Item 2000 2000, week ending
Item Aug. Sept. Oct. Oct. 4 Oct. 11 Oct. 18 Oct. 25 Nov. 1 Nov. 8 Nov. 15 Nov. 22 Nov. 29
OUTRIGHT TRANSACTIONS 2
By type of security 1 U.S. Treasury bills 21,487 24,438 26,999 26,749 25,644 24,964 21,269 38,246 38,933 32,325 22,990 35,664
Coupon securities, by maturity 2 Five years or less 84,941 117,915 139,243 121,841 142,852 146,449 141,987 136,248 123,038 114,912 86,544 120,857 3 More than five years 62,777 69,458 67,524 67,886 62,610 68,600 67,826 70,445 68,022 62,882 49,039 59,954 4 Inflation-indexed 1,185 1,490 1,987 1,000 4,070 2,150 1,675 831 938 643 1,071 1,446
Federal agency 5 Discount notes 53,668 50,165 51,052 54,014 50,581 51,999 47,189 52,948 46,558 46,902 56,595 57,434
Coupon securities, by maturity 6 One year or less 1,314 1,160 1,082 1,058 730 1,107 1,164 1,317 1,324 1,024 974 749 7 More than one year, but less than
or equal to five years 8,879 9,860 12,597 9,922 15,099 10,935 16,278 9,580 10,633 11,754 6,812 9,376 8 More than five years 7,002 9,925 11,659 8,365 11,972 8,979 12,925 15,584 7,445 6,924 5,193 7,128 9 Mortgage-backed 67,487r 76,954r 80,367r 60,673r 109,182r 112,689 51,511 61,990 115,204 99,137 38,129 71,318
By type of counterparty With interdealer broker
10 U.S. Treasury 81,566 101,973 102,544 103,159 102,320 105,704 99,613 102,022 98,148 89,680 71,765 96,092 11 Federal agency 8,089 9,811 10,680 8,589 10.182 9,385 14,588 9,482 8,447 9,271 7,446 8,418 12 Mortgage-backed 25,460 28,514r 26,882 19,705 34,264 33,514 20,349 24,761 32,315 24,834 14,081 22,691
With other 13 U.S. Treasury 88,823 111,328 133,209 114,317 132,855 136,460 133,144 143,747 132,782 121,081 87,878 121,829 14 Federal agency 62,774 61,299 65,710 64,770 68,199 63,635 62,968 69,946 57,513 57,333 62,127 66,269 15 Mortgage-backed 42,027r 48,440r 53,485r 40,968r 74,918r 79,175 31,162 37,229 82,889 74,302 24,048 48,627
FUTURES TRANSACTIONS 3
By type of deliverable security 16 U.S. Treasury bills n.a. 0 0 0 0 n.a. 0 0 0 n.a. n.a. n.a.
Coupon securities, by maturity 17 Five years or less 3,467 3,119 2,497 1,678 2,547 2,534 3,263 2,058 1,965 2,663 2,849 6,098 18 More than five years 10,960 11,756 10,472 10.390 9,507 10,129 10,740 11,590 11,889 10,599 10,120 19,774 19 Inflation-indexed 0 0 0 0 0 0 0 0 0 0 0 0
Federal agency 20 Discount notes 0 0 0 0 0 0 0 0 0 0 0 0
Coupon securities, by maturity 21 One year or less 0 0 0 0 0 0 0 0 0 0 0 0 22 More than one year, but less than
or equal to five years 0 0 0 0 0 0 0 0 0 0 0 0 23 More than five years 109 165 86 n.a. 131 57 106 52 34 60 67 46 24 Mortgage-backed 0 0 0 0 0 0 0 0 0 0 0 0
OPTIONS TRANSACTIONS 4
By type of underlying security 25 U.S. Treasury bills 0 0 0 0 0 0 0 0 0 0 0 0
Coupon securities, by maturity 26 Five years or less 1,149 1,350 1,217 751 970 1,799 956 1,412 2,012 1,285 1,879 900 27 More than five years 2,821 3,382 3,829 3,640 3,835 4,313 3,367 3,939 4,820 3,605 2,926 3,048 28 Inflation-indexed 0 0 0 0 0 0 0 0 0 0 0 0
Federal agency 29 Discount notes 0 0 0 0 0 0 0 0 0 0 0 0
Coupon securities, by maturity 30 One year or less 0 0 0 0 0 0 0 0 0 0 0 0 31 More than one year, but less than
or equal to five years 34 38 0 0 0 0 0 0 0 0 0 0 32 More than five years 2 6 102 n.a. n.a. 102 n.a. n.a. 0 320 n.a. 104 33 Mortgage-backed 1,145 1,097 1,189 1,578 1,719 874 1,287 638 2,510 703 1,353 360
1. Transactions are market purchases and sales of securities as reported to the Federal Reserve Bank of New York by the U.S. government securities dealers on its published list of primary dealers. Monthly averages are based on the number of trading days in the month. Transactions are assumed to be evenly distributed among the trading days of the report week. Immediate, forward, and futures transactions are reported at principal value, which does not include accrued interest; options transactions are reported at the face value of the underlying securities.
Dealers report cumulative transactions for each week ending Wednesday. 2. Outright transactions include immediate and forward transactions. Immediate delivery
refers to purchases or sales of securities (other than mortgage-backed federal agency securi-ties) for which delivery is scheduled in five business days or less and "when-issued" securities that settle on the issue date of offering. Transactions for immediate delivery of mortgage-backed agency securities include purchases and sales for which delivery is scheduled in thirty business days or less. Stripped securities are reported at market value by maturity of coupon or corpus.
Forward transactions are agreements made in the over-the-counter market that specify delayed delivery. Forward contracts for U.S. Treasury securities and federal agency debt securities are included when the time to delivery is more than five business days. Forward contracts for mortgage-backed agency securities are included when the time to delivery is more than thirty business days.
3. Futures transactions are standardized agreements arranged on an exchange. All futures transactions are included regardless of time to delivery.
4. Options transactions are purchases or sales of put and call options, whether arranged on an organized exchange or in the over-the-counter market, and include options on futures contracts on U.S. Treasury and federal agency securities.
NOTE, "n.a." indicates that data are not published because of insufficient activity.
Digitized for FRASER http://fraser.stlouisfed.org/ Federal Reserve Bank of St. Louis
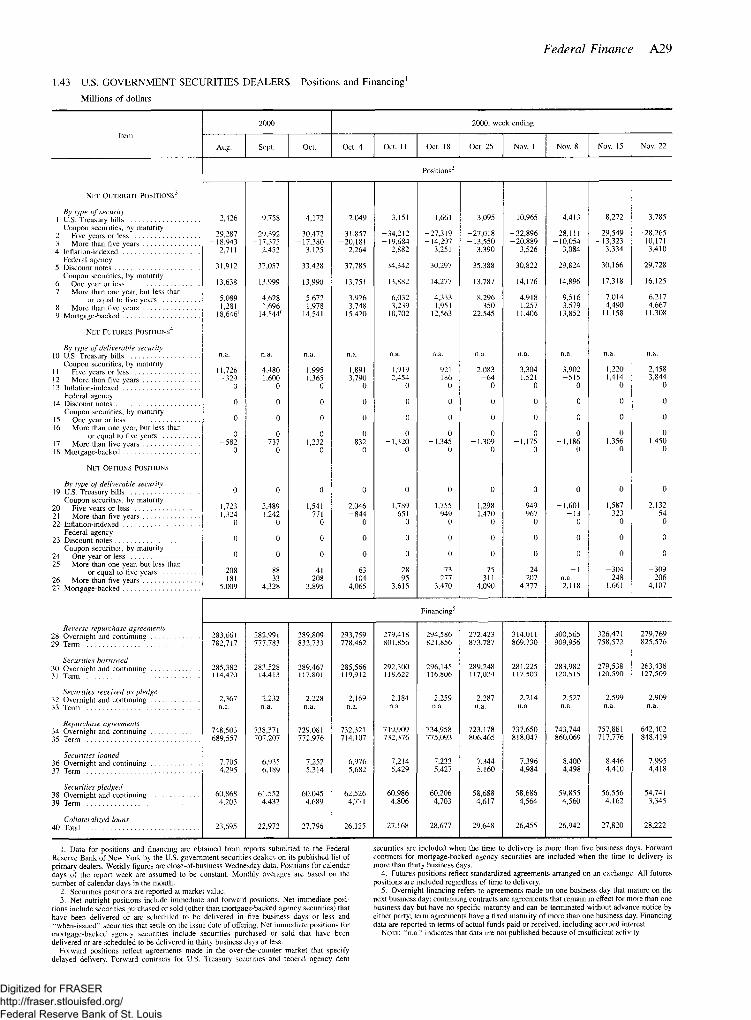
Federal Finance A29
1.43 U.S. GOVERNMENT SECURITIES DEALERS Positions and Financing1
M i l l i o n s of do l l a r s
Item
2000 2000, week ending
Item
Aug. Sept. Oct. Oct. 4 Oct. 11 Oct. 18 Oct. 25 Nov. 1 Nov. 8 Nov. 15 Nov. 22
Positions2
NET OUTRIGHT POSITIONS^
By type of security 1 U.S. Treasury bills
Coupon securities, by maturity 2 Five years or less 3 More than five years 4 Inflation-indexed
Federal agency 5 Discount notes
Coupon securities, by maturity 6 One year or less 7 More than one year, but less than
or equal to five years 8 More than five years 9 Mortgage-backed
N E T FUTURES POSITIONS4
By type of deliverable security 10 U.S.'Treasury bills .'
Coupon securities, by maturity 11 Five years or less 12 More than five years 13 Inflation-indexed
Federal agency 14 Discount notes
Coupon securities, by maturity 15 One year or less 16 More than one year, but less than
or equal to five years 17 More than five years 18 Mortgage-backed
NET OPTIONS POSITIONS
By type of deliverable security 19 U.S. Treasury bills
Coupon securities, by maturity 20 Five years or less 21 More than five years 22 Inflation-indexed
Federal agency 23 Discount notes
Coupon securities, by maturity 24 One year or less 25 More than one year, but less than
or equal to five years 26 More than five years 27 Mortgage-backed
Reverse repurchase agreements 28 Overnight and continuing 29 Term
Securities borrowed 30 Overnight and continuing 31 Term
Securities received as pledge 32 Overnight and continuing 33 Term
Repurchase agreements 34 Overnight and continuing 35 Term
Securities loaned 36 Overnight and continuing 37 Term
Securities pledged 38 Overnight and continuing 39 Term
Collateralized loans 40 Total
2,426 9,758 4,172 2,049 3,151 1,661 3,095 10,965 4,413 8,272 3,785
- 2 9 , 2 8 7 - 1 8 , 9 4 3
2,711
- 2 9 , 3 9 2 -17 ,375
2,452
- 3 0 , 4 7 2 - 1 7 , 3 8 0
3,125
- 3 1 , 8 5 7 -20 ,181
2,264
- 3 4 , 2 1 2 - 1 9 , 6 8 4
2,882
- 2 7 , 3 1 9 - 1 4 , 2 9 7
3,251
- 2 7 , 0 1 8 - 1 3 , 5 5 0
3,390
- 3 2 , 8 9 6 - 2 0 , 8 8 9
3,526
- 2 8 , 1 1 1 - 1 0 , 0 5 4
3,084
- 2 9 , 5 4 9 - 1 3 , 3 2 3
3,334
- 2 8 , 2 6 5 - 1 0 , 1 7 1
3,410
31,912 37,057 33,428 37,785 34,342 30,297 35,388 30,822 29,824 30,166 29,728
13,638 13,999 13,990 13,751 13,882 14,277 13,787 14,176 14,896 17,318 16,125
5,089 1,281
18,646r
4,628 1,696
14,544r
5,672 1,978
14,541
3,926 3,748
15,420
6,032 3,239
10,702
4,333 1,951
12,563
8,296 350
22,545
4,918 1,257
11,406
9,516 3,579
13,852
7,014 4,490
11,158
6,217 4,667
11,308
n.a. n.a. n.a. n.a. n.a. n.a. n.a. n.a. n.a. n.a. n.a.
11,726 - 3 2 9
0
4,480 1,600
0
1,995 1,365
0
1,891 3,790
0
1,919 2,454
0
921 186
0
2,083 - 6 4
0
3,304 1,521
0
3,902 - 5 1 5
0
1,220 - 1 , 4 1 4
0
2,458 - 3 , 8 4 4
0
0 0 0 0 0 0 0 0 0 0 0
0 0 0 0 0 0 0 0 0 0 0
0 - 5 8 2
0
0 - 7 3 7
0
0 - 1 , 2 3 2
0
0 - 8 3 2
0
0 - 1 , 3 2 0
0
0 - 1 , 3 4 5
0
0 - 1 , 3 0 9
0
0 - 1 , 1 7 5
0
0 - 1 , 1 8 6
0
0 - 1 , 3 5 6
0
0 - 1 , 4 5 0
0
0 0 0 0 0 0 0 0 0 0 0
1,723 1,324
0
2,489 1,242
0
1,541 771
0
2,046 - 8 4 4
0
1,789 651
0
1,755 949
0
1,298 1,470
0
949 967
0
- 1 , 6 0 1 - 1 3
0
- 1 , 5 8 7 323
0
- 2 , 1 3 2 54
0
0 0 0 0 0 0 0 0 0 0 0
0 0 0 0 0 0 0 0 0 0 0
208 181
5,009
88 33
4,328
41 208
3,895
63 104
4,065
28 95
3,615
73 277
3,470
25 311
4,090
24 207
4,377
- 1 n.a. 2,118
- 3 0 4 248
1,661
- 3 0 9 206
4,107
Financing5
283,661 782,717
282,991 777,783
289,809 832,733
293,759 778,462
279,418 801,856
294,586 821,856
272,423 873,787
314,011 869,730
300,565 909,956
326,471 758,572
279,769 825,576
285,382 114,470
283,528 1 14,413
289,467 117,801
285,566 119,912
292,300 118,622
296,145 116,806
289,248 117,024
281,225 117,503
283,982 120,515
279,538 120,590
263,438 127,509
2,367 n.a.
2,232 n.a.
2,228 n.a.
2,169 n.a.
2,184 n.a.
2,259 n.a.
2,287 n.a.
2,214 n.a.
2,527 n.a.
2,599 n.a.
2,909 n.a.
748,503 689,557
738,371 707,207
729,081 772,976
732,321 714,107
719,909 732,376
734,958 775,093
723,178 806,465
737,650 818,047
743,744 860,069
757,881 717,776
642,402 848,419
7,705 4,295
6,935 6,189
7,252 5,314
6,976 5,682
7,214 5,429
7,233 5,427
7,344 5,160
7,396 4,984
8,400 4,498
8,446 4,410
7,995 4,418
60,868 4,203
61,552 4,432
60,045 4,689
62,526 4,771
60,986 4,806
60,206 4,703
58,688 4,617
58,686 4,564
59,855 4,560
56,556 4,162
54,741 3,345
23,695 22,972 27,796 26,125 27,168 28,677 29,648 26,455 26,942 27,820 28,222
1. Data for positions and financing are obtained from reports submitted to the Federal Reserve Bank of New York by the U.S. government securities dealers on its published list of primary dealers. Weekly figures are close-of-business Wednesday data. Positions for calendar days of the report week are assumed to be constant. Monthly averages are based on the number of calendar days in the month.
2. Securities positions are reported at market value. 3. Net outright positions include immediate and forward positions. Net immediate posi-
tions include securities purchased or sold (other than mortgage-backed agency securities) that have been delivered or are scheduled to be delivered in five business days or less and "when-issued" securities that settle on the issue date of offering. Net immediate positions for mortgage-backed agency securities include securities purchased or sold that have been delivered or are scheduled to be delivered in thirty business days or less.
Forward positions reflect agreements made in the over-the-counter market that specify delayed delivery. Forward contracts for U.S. Treasury securities and federal agency debt
securities are included when the time to delivery is more than five business days. Forward contracts for mortgage-backed agency securities are included when the time to delivery is more than thirty business days.
4. Futures positions reflect standardized agreements arranged on an exchange. All futures positions are included regardless of time to delivery.
5. Overnight financing refers to agreements made on one business day that mature on the next business day; continuing contracts are agreements that remain in effect for more than one business day but have no specific maturity and can be terminated without advance notice by either party; term agreements have a fixed maturity of more than one business day. Financing data are reported in terms of actual funds paid or received, including accrued interest.
NOTE, "n.a." indicates that data are not published because of insufficient activity.
Digitized for FRASER http://fraser.stlouisfed.org/ Federal Reserve Bank of St. Louis

A30 Domestic Nonfinancial Statistics • February 2001
1.44 FEDERAL AND FEDERALLY SPONSORED CREDIT AGENCIES Debt Outstanding Millions of dollars, end of period
Agency 1996 1997 1998 1999
2000
Agency 1996 1997 1998 1999 May June July Aug. Sept.
1 Federal and federally sponsored agencies 925,823 1,022,609 1,296,477 1,616,492 193,776 1,706,709 1,726,016 1,763,089 1,776,334
2 Federal agencies 29,380 27,792 26,502 26,376 26,052 26,669 26,094 25,892 25,993 3 Defense Department1 6 6 6 6 6 6 6 6 6 4 Export-Import Bank2 '3 1,447 552 n.a. n.a. n.a. n.a. n.a. n.a. n.a. 5 Federal Housing Administration4 84 102 205 126 184 185 205 210 227 6 Government National Mortgage Association certificates of
participation5 n.a. n.a. n.a. n.a. n.a. n.a. n.a. n.a. n.a. 7 Postal Service6 n.a. n.a. n.a. n.a. n.a. n.a. n.a. n.a. n.a. 8 Tennessee Valley Authority 27,853 27,786 26,496 26,370 26,046 26,663 26,088 25,886 25,987 9 United States Railway Association6 n.a. n.a. n.a. n.a. n.a. n.a. n.a. n.a. n.a.
10 Federally sponsored agencies7 896,443 994,817 1,269,975 1,590,116 1,677,265 1,680,040 1,699,922 1,737,197 1,750,341 11 Federal Home Loan Banks 263,404 313,919 382,131 529,005 557,506 568,438 565,037 572,836 580,579 12 Federal Home Loan Mortgage Corporation 156,980 169,200 287,396 360,711 392,555 384,286 399,370 412,656 406,936 13 Federal National Mortgage Association 331,270 369,774 460,291 547,619 571,800 578,500 579,448 595,117 607,000 14 Farm Credit Banks8 60,053 63,517 63,488 68,883 70,036 69,541 69,757 70,139 71,055 15 Student Loan Marketing Association9 44,763 37,717 35,399 41,988 43,144 37,263 44,223 44,113 42,423 16 Financing Corporation10 8,170 8,170 8,170 8,170 8,170 8,170 8,170 8,170 8,170 1/ Farm Credit Financial Assistance Corporation" 1,261 1,261 1,261 1,261 1,261 1,261 1,261 1,261 1,261 18 Resolution Funding Corporation12 29,996 29,996 29,996 29,996 29,996 29,996 29,996 29,996 29,996
M E M O 19 Federal Financing Bank debt1 3 58,172 49,090 44,129 42,152 39,102 38,513 38,143 38,040 42,837
Lending to federal and federally sponsored agencies 20 Export-Import Bank3 1,431 552 4 * f 21 Postal Service6 n.a. n.a. T T T T T T T 22 Student Loan Marketing Association n.a. n.a. n.a. n.a. n.a. n.a. n.a. n.a. n.a. 23 Tennessee Valley Authority n.a. n.a. 1 1 1 1 I 1 I 24 United States Railway Association6 n.a. n.a. • i 1 t 1 1 t
Other lending14
25 Farmers Home Administration 18,325 13,530 9,500 6,665 6,140 6,040 5,760 5,660 5,540 26 Rural Electrification Administration 16,702 14,898 14,091 14,085 13,221 13,121 13,165 13,238 12,989 27 Other 21,714 20,110 20,538 21,402 19,741 19,352 19,218 19,142 24,308
1. Consists of mortgages assumed by the Defense Department between 1957 and 1963 under family housing and homeowners assistance programs.
2. Includes participation certificates reclassified as debt beginning Oct. 1, 1976. 3. On-budget since Sept. 30, 1976. 4. Consists of debentures issued in payment of Federal Housing Administration insurance
claims. Once issued, these securities may be sold privately on the securities market. 5. Certificates of participation issued before fiscal year 1969 by the Government National
Mortgage Association acting as trustee for the Farmers Home Administration; the Department of Health, Education, and Welfare; the Department of Housing and Urban Development; the Small Business Administration; and the Veterans Administration.
6. Off-budget. 7. Includes outstanding noncontingent liabilities: notes, bonds, and debentures. Includes
Federal Agricultural Mortgage Corporation; therefore, details do not sum to total. Some data are estimated.
8. Excludes borrowing by the Farm Credit Financial Assistance Corporation, which is shown on line 17.
9. Before late 1982, the association obtained financing through the Federal Financing Bank (FFB). Borrowing excludes that obtained from the FFB, which is shown on line 22.
10. The Financing Corporation, established in August 1987 to recapitalize the Federal Savings and Loan Insurance Corporation, undertook its first borrowing in October 1987.
11. The Farm Credit Financial Assistance Corporation, established in January 1988 to provide assistance to the Farm Credit System, undertook its first borrowing in July 1988.
12. The Resolution Funding Corporation, established by the Financial Institutions Reform, Recovery, and Enforcement Act of 1989, undertook its first borrowing in October 1989.
13. The FFB, which began operations in 1974, is authorized to purchase or sell obligations issued, sold, or guaranteed by other federal agencies. Because FFB incurs debt solely for the purpose of lending to other agencies, its debt is not included in the main portion of the table to avoid double counting.
14. Includes FFB purchases of agency assets and guaranteed loans; the latter are loans guaranteed by numerous agencies, with the amounts guaranteed by any one agency generally being small. The Farmers Home Administration entry consists exclusively of agency assets, whereas the Rural Electrification Administration entry consists of both agency assets and guaranteed loans.
Digitized for FRASER http://fraser.stlouisfed.org/ Federal Reserve Bank of St. Louis
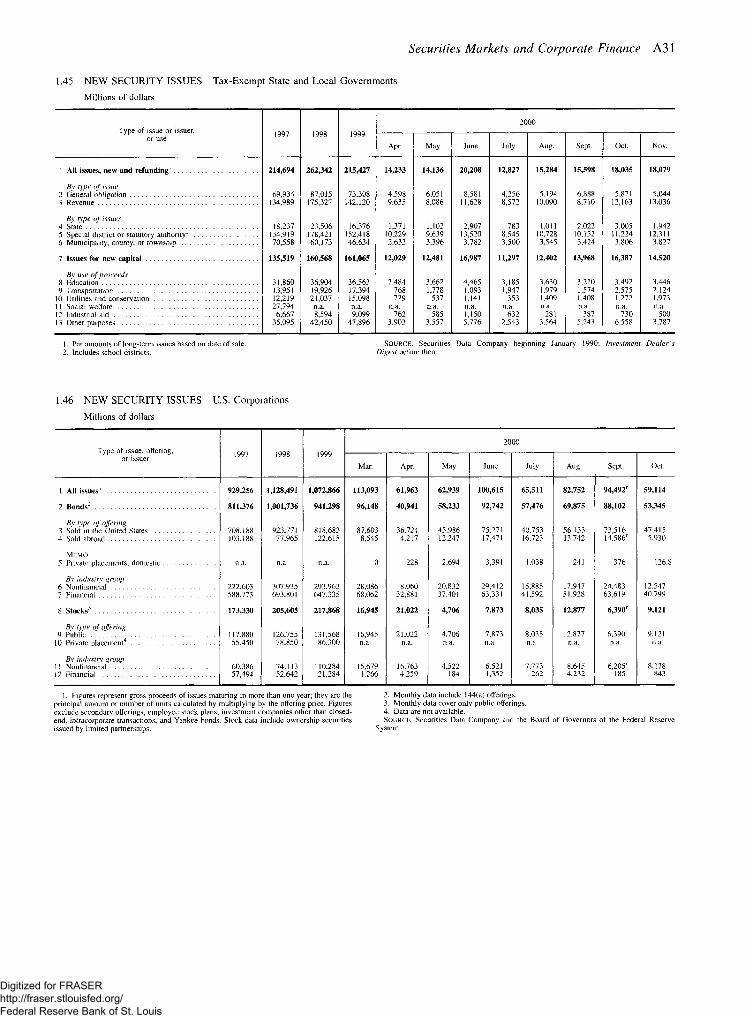
Securities Markets and Corporate Finance A31
1.45 NEW SECURITY ISSUES Tax-Exempt State and Local Governments Millions of dollars
Type of issue or issuer, or use 1997 1998 1999
2000 Type of issue or issuer,
or use 1997 1998 1999 Apr. May June July Aug. Sept. Oct. Nov.
1 All issues, new and refunding1 214,694 262,342 215,427 14,233 14,136 20,208 12,827 15,284 15,598 18,035 18,079
By type of issue 2 General obligation 69,934 87,015 73,308 4,598 6,051 8,581 4,256 5,194 6,888 5,871 5,044 3 Revenue 134,989 175,327 142,120 9,635 8,086 11,628 8,572 10,090 8,710 12,163 13,036
By type of issuer 4 State 18,237 23,506 16,376 1,371 1,102 2,907 783 1,011 2,022 3,005 1,942 5 Special district or statutory authority2 134,919 178,421 152,418 10,229 9,639 13,520 8,545 10,728 10,152 11,224 12,311 6 Municipality, county, or township 70,558 60,173 46,634 2,633 3,396 3,782 3,500 3,545 3,424 3,806 3,827
7 Issues for new capital 135,519 160,568 161,065 12,029 12,481 16,987 11,297 12,402 13,968 16,387 14,520
By use of proceeds 8 Education 31,860 36,904 36,563 2,484 3,662 4,465 3,185 3,630 3,210 3,492 3,446 9 Transportation 13,951 19,926 17,394 768 1,778 1,093 1,947 1,979 1,574 2,575 2,124
10 Utilities and conservation 12,219 21,037 15,098 729 537 1,141 353 1,409 1,408 1,272 1,973 11 Social welfare 27,794 n.a. n.a. n.a. n.a. n.a. n.a. n.a. n.a. n.a. n.a. 12 Industrial aid 6,667 8,594 9,099 762 585 1,150 632 281 387 730 500 13 Other purposes 35,095 42,450 47,896 3,903 3,557 5,776 2,543 3,564 5,243 6,558 3,787
1. Par amounts of long-term issues based on date of sale. SOURCE. Securities Data Company beginning January 1990; Investment Dealer's 2. Includes school districts. Digest before then.
1.46 NEW SECURITY ISSUES U.S. Corporations Millions of dollars
Type of issue, offering, or issuer 1997 1998 1999
2000 Type of issue, offering,
or issuer 1997 1998 1999 Mar. Apr. May June July Aug. Sept. Oct.
1 AH issues1 929,256 1,128,491 1,072,866 113,093 61,963 62,939 100,615 65,511 82,752 94,492r 59,114
2 Bonds2 811,376 1,001,736 941,298 96,148 40,941 58,233 92,742 57,476 69,875 88,102 53,345
By type of offering 3 Sold in the United States 708,188 923,771 818,683 87,603 36,724 45,986 75,271 40,753 56,133 73,516 47,415 4 Sold abroad 103,188 77,965 122,615 8,545 4,217 12,247 17,471 16,723 13,742 14,586r 5,930
M E M O 5 Private placements, domestic n.a. n.a. n.a. 0 228 2,694 3,391 1,038 241 376 126.8
By industry group 6 Nonfinancial 222,603 307,935 293,963 28,086 8,060 20,832 29,412 15,885 17,947 24,483 12,547 7 Financial 588,773 693,801 647,335 68,062 32,881 37,401 63,331 41,592 51,928 63,619 40,799
8 Stocks3 173,330 205,605 217,868 16,945 21,022 4,706 7,873 8,035 12,877 6,390r 9,121
By type of offering 9,121 9 Public 117,880 126,755 131,568 16,945 21,022 4,706 7,873 8,035 12,877 6,390r 9,121
10 Private placement4 55,450 78,850 86,300 n.a. n.a. n.a. n.a. n.a. n.a. n.a. n.a.
By industry group 11 Nonfinancial 60,386 74,113 110,284 15,679 16,763 4,522 6,521 7.773 8,645 6,205r 8,278 12 Financial 57,494 52,642 21,284 1,266 4,259 184 1,352 262 4,232 185 843
1. Figures represent gross proceeds of issues maturing in more than one year; they are the principal amount or number of units calculated by multiplying by the offering price. Figures exclude secondary offerings, employee stock plans, investment companies other than closed-end, intracorporate transactions, and Yankee bonds. Stock data include ownership securities issued by limited partnerships.
2. Monthly data include 144(a) offerings. 3. Monthly data cover only public offerings. 4. Data are not available. SOURCE. Securities Data Company and the Board of Governors of the Federal Reserve
System.
Digitized for FRASER http://fraser.stlouisfed.org/ Federal Reserve Bank of St. Louis

A32 Domestic Nonfinancial Statistics • February 2001
1.47 OPEN-END INVESTMENT COMPANIES Net Sales and Assets1
Millions of dollars
Item 1998 1999 2000
Item 1998 1999 Apr. May June July Aug. Sept. Oct/ Nov.
1 Sales of own shares2 1,461,430 1,791,894 202,248 172,718 181,866 166,815 179,890 159,809 169,071 147,268
2 Redemptions of own shares 1,217,022 1,621,987 176,671 162,984 161,462 151,717 159,027 147,644 153,067 139,300 3 Net sales3 244,408 169,906 25,577 9,735 20,404 15,098 20,864 12,166 16,004 7,968
4 Assets4 4,173,531 5,233,191 5,391,187 5,232,319 5,458,914 5,392,308 5,745,264 5,550,176 5,442,937 5,004,095
5 Cash5 191,393 219,189 254,819 260,426 259,241 258,472 261,967 280,192 302,682 304,462 6 Other 3,982,138 5,014,002 5,136,368 4,971,892 5,199,673 5,133,836 5,483,298 5,269,984 5,140,255 4,699,633
1. Data include stock, hybrid, and bond mutual funds and exclude money market mutual funds.
2. Excludes reinvestment of net income dividends and capital gains distributions and share issue of conversions from one fund to another in the same group.
3. Excludes sales and redemptions resulting from transfers of shares into or out of money market mutual funds within the same fund family.
4. Market value at end of period, less current liabilities. 5. Includes all U.S. Treasury securities and other short-term debt securities. SOURCE. Investment Company Institute. Data based on reports of membership, which
comprises substantially all open-end investment companies registered with the Securities and Exchange Commission. Data reflect underwritings of newly formed companies after their initial offering of securities.
1.48 CORPORATE PROFITS AND THEIR DISTRIBUTION Billions of dollars; quarterly data at seasonally adjusted annual rates
Account 1997 1998 1999 1998 1999 2000
Account 1997 1998 1999 Q4 Q1 Q2 Q3 Q4 Ql Q2 Q3r
1 Profits with inventory valuation and capital consumption adjustment 833.8 815.0 856.0 803.4 852.0 836.8 842.0 893.2 936.3 963.6 970.3
2 Profits before taxes 792.4 758.2 823.0 742.3 797.6 804.5 819.0 870.7 920.7 942.5 945.1 3 Profits-tax liability 237.2 244.6 255.9 239.4 247.8 250.8 254.2 270.8 286.3 292.0 290.6 4 Profits after taxes 555.2 513.6 567.1 502.9 549.9 553.7 564.8 599.9 634.4 650.4 654.4 5 Dividends 335.2 351.5 370.7 356.1 361.1 367.2 373.9 380.6 387.3 393.0 400.1 6 Undistributed profits 220.0 162.1 196.4 146.9 188.7 186.5 190.9 219.3 247.1 257.4 254.4
7 Inventory valuation 8.4 17.0 - 9 . 1 19.9 11.4 - 8 . 9 - 1 9 . 7 - 1 9 . 2 - 2 5 . 0 - 1 3 . 6 - 4 . 5 8 Capital consumption adjustment 32.9 39.9 42.1 41.2 42.9 41.2 42.7 41.6 40.6 34.7 29.7
SOURCE. U.S. Department of Commerce, Survey of Current Business.
1.51 DOMESTIC FINANCE COMPANIES Assets and Liabilities1
Billions of dollars, end of period; not seasonally adjusted
Account 1997 1998 1999
1999 2 0 0 0
Account 1997 1998 1999
Ql Q 2 Q 3 Q 4 Qi Q2R Q 3
ASSETS
1 Accounts receivable, gross2 6 6 3 . 3 7 1 1 . 7 8 1 1 . 5 7 3 3 . 8 7 5 6 . 5 7 7 6 . 3 811 .5 8 4 8 . 7 8 8 4 . 4 9 0 0 . 1 2 Consumer 2 5 6 . 8 2 6 1 . 8 2 7 9 . 8 2 6 1 . 7 2 6 9 . 2 2 7 1 . 0 2 7 9 . 8 2 8 5 . 4 2 9 4 . 1 3 0 1 . 9 3 Business 3 1 8 . 5 3 4 7 . 5 4 0 5 . 2 3 6 2 . 8 3 7 3 . 7 3 8 3 . 0 4 0 5 . 2 4 3 4 . 6 4 5 4 . 1 4 5 5 . 7 4 Real estate 8 7 . 9 102.3 126.5 109.2 113.5 122 .3 126.5 128.8 136.2 142 .4
5 LESS; Reserves for unearned income 52 .7 5 6 . 3 53 .5 5 2 . 9 5 3 . 4 5 4 . 0 53 .5 5 4 . 0 57.1 5 8 . 8 6 Reserves for losses 13.0 13.8 13.5 13.4 13.4 13.6 13.5 14.0 14.4 14.2
7 Accounts receivable, net 5 9 7 . 6 6 4 1 . 6 7 4 4 . 6 6 6 7 . 6 6 8 9 . 7 7 0 8 . 6 7 4 4 . 6 7 8 0 . 7 8 1 3 . 0 8 2 7 . 1 8 All other 3 1 2 . 4 3 3 7 . 9 4 0 6 . 3 3 6 3 . 3 3 7 3 . 2 3 6 8 . 5 4 0 6 . 3 4 1 2 . 7 4 1 8 . 3 4 4 1 . 4
9 Total assets 910.0 979.5 1,150.9 1,030.8 1,062.9 1,077.2 1,150.9 1,193.4 1,231.3 1,268.4
LIABILITIES AND CAPITAL
10 Bank loans 24 .1 2 6 . 3 35 .1 24 .8 25 .1 2 7 . 0 35 .1 28 .5 3 2 . 5 35 .4 11 Commercial paper 2 0 1 . 5 2 3 1 . 5 2 2 7 . 9 2 2 2 . 9 2 3 1 . 0 2 0 5 . 3 2 2 7 . 9 2 3 0 . 2 2 2 1 . 3 2 1 5 . 6
Debt 12 Owed to parent 64 .7 6 1 . 8 123.8 6 4 . 6 6 5 . 4 84 .5 123 .8 145.1 137.1 144 .3 13 Not elsewhere classified 3 2 8 . 8 3 3 9 . 7 3 9 7 . 0 3 6 6 . 7 383 .1 3 9 6 . 2 3 9 7 . 0 4 1 2 . 0 4 4 5 . 4 4 6 5 . 5 14 All other liabilities 189 .6 2 0 3 . 2 2 2 2 . 7 2 2 0 . 3 2 2 6 . 1 2 1 6 . 0 2 2 2 . 7 2 4 7 . 6 2 5 9 . 3 2 6 9 . 2 15 Capital, surplus, and undivided profits 101.3 117.0 144.5 131.5 132.2 148 .2 144.5 130.1 135 .6 138 .3
16 Total liabilities and capital 910.0 979.5 1,150.9 1,030.8 1,062.9 1,077.2 1,150.9 1,193.4 1,231.3 1,268.4
1. Includes finance company subsidiaries of bank holding companies but not of retailers 2. Before deduction for unearned income and losses. Excludes pools of securitized assets, and banks. Data are amounts carried on the balance sheets of finance companies; securitized pools are not shown, as they are not on the books.
Digitized for FRASER http://fraser.stlouisfed.org/ Federal Reserve Bank of St. Louis

Securities Market and Corporate Finance A33
1.52 DOMESTIC FINANCE COMPANIES Owned and Managed Receivables1
Billions of dollars, amounts outstanding
Type of credit 1997 1998 1999 2000
Type of credit 1997 1998 1999 May June July Aug. Sept. Oct.
Seasonally adjusted
1 Total
2 Consumer 3 Real estate 4 Business .
810.5 875.8 993.9 1,074.9 1,076.9 1,089.1 1,094.1 l,110.0 r 1,129.8
327.9 352.8 385.3 400.7 401.4 405.9 411.1 419.7r 437.8 121.1 131.4 154.7 164.7 163.7 167.5 169.0 170.9 174.1 361.5 391.6 453.9 509.5 511.7 515.8 514.1 519.5r 517.8
Not seasonally adjusted
5 Total 818.1 884.0 1,003.2 1,074.8 1,082.3 1,082.2 1,087.9 l,104.8 r 1,127.8
6 Consumer 330.9 356.1 388.8 399.4 403.9 408.3 412.3 421.0r 438.4 7 Motor vehicles loans 87.0 103.1 114.7 124.1 126.5 129.4 130.7 130.1 131.8 8 Motor vehicle leases 96.8 93.3 98.3 104.1 103.9 104.4 105.4 104.6 104.3 9 Revolving" 38.6 32.3 33.8 31.6 33.1 33.6 33.6 35.4 37.1
10 Other3 34.4 33.1 33.1 31.9 30.7 31.5 32.3 31.7r 31.8 Securitized assets4
11 Motor vehicle loans 44.3 54.8 71.1 71.9 74.1 74.5 76.2 78.8 84.3 12 Motor vehicle leases 10.8 12.7 9.7 8.2 7.9 7.6 7.4 7.2 7.0 13 Revolving .0 8.7 10.5 11.1 11.1 10.9 10.7 17.2 26.3 14 Other 19.0 18.1 17.7 16.5 16.6 16.4 16.2 16.0 15.7 15 Real estate 121.1 131.4 154.7 164.7 163.7 167.5 169.0 170.9 174.1 16 One- to four-family 59.0 75.7 88.3 97.3 96.6 100.5 101.7 100.9 104.5 17 Other 28.9 26.6 38.3 39.4 39.6 39.7 40.2 41.5 41.4
Securitized real estate assets4
18 One- to four-family 33.0 29.0 28.0 27.7 27.4 27.1 26.8 26.5 26.3 19 Other .2 .1 .2 .2 .2 .2 .2 1.9 1.9 20 Business 366.1 396.5 459.6 510.7 514.7 506.4 506.7 512.9r 515.3 21 Motor vehicles 63.5 79.6 87.8 94.8 94.5 89.4 89.6 94.1 96.0 22 Retail loans 25.6 28.1 33.2 33.3 33.8 34.1 34.3 34.8 34.7 23 Wholesale loans5 27.7 32.8 34.7 39.5 38.4 32.9 32.6 35.5 37.5 24 Leases 10.2 18.7 19.9 22.0 22.3 22.3 22.7 23.7 23.8 25 Equipment 203.9 198.0 221.9 247.3 250.0 248.6 250.0 256.7 257.3 26 Loans 51.5 50.4 52.2 55.9 56.7 54.8 54.3 55.8 55.7 27 Leases 152.3 147.6 169.7 191.5 193.3 193.9 195.8 200.9 201.6 28 Other business receivables6 51.1 69.9 95.5 106.6 109.7 109.4 108.3 104.9 104.3
Securitized assets4
29 Motor vehicles 33.0 29.2 31.5 32.0 31.7 29.8 29.6 29.9r 30.1 30 Retail loans 2.4 2.6 2.9 3.0 2.9 2.8 2.7 2.4 2.3 31 Wholesale loans 30.5 24.7 26.4 26.7 26.4 24.6 24.5 2 5 . r 25.4 32 Leases .0 1.9 2.1 2.4 2.4 2.4 2.4 2.4 2.4 33 Equipment 10.7 13.0 14.6 21.5 22.3 22.5 22.4 21.4 21.7 34 Loans 4.2 6.6 7.9 15.0 15.8 16.0 15.9 15.1 14.9 35 Leases 6.5 6.4 6.7 6.5 6.4 6.5 6.5 6.4 6.7 36 Other business receivables6 4.0 6.8 8.4 8.4 6.6 6.8 6.8 5.8 5.8
NOTE. This table has been revised to incorporate several changes resulting from the benchmarking of finance company receivables to the June 1996 Survey of Finance Compa-nies. In that benchmark survey, and in the monthly surveys that have followed, more detailed breakdowns have been obtained for some components. In addition, previously unavailable data on securitized real estate loans are now included in this table. The new information has resulted in some reclassification of receivables among the three major categories (consumer, real estate, and business) and in discontinuities in some component series between May and June 1996.
Includes finance company subsidiaries of bank holding companies but not of retailers and banks. Data in this table also appear in the Board's G.20 (422) monthly statistical release. For ordering address, see inside front cover.
1. Owned receivables are those carried on the balance sheet of the institution. Managed receivables are outstanding balances of pools upon which securities have been issued; these balances are no longer carried on the balance sheets of the loan originator. Data are shown
before deductions for unearned income and losses. Components may not sum to totals because of rounding.
2. Excludes revolving credit reported as held by depository institutions that are subsidiar-ies of finance companies.
3. Includes personal cash loans, mobile home loans, and loans to purchase other types of consumer goods, such as appliances, apparel, boats, and recreation vehicles.
4. Outstanding balances of pools upon which securities have been issued; these balances are no longer carried on the balance sheets of the loan originator.
5. Credit arising from transactions between manufacturers and dealers, that is, floor plan financing.
6. Includes loans on commercial accounts receivable, factored commercial accounts, and receivable dealer capital; small loans used primarily for business or farm purposes; and wholesale and lease paper for mobile homes, campers, and travel trailers.
Digitized for FRASER http://fraser.stlouisfed.org/ Federal Reserve Bank of St. Louis

A34 Domestic Nonfinancial Statistics • February 2001
1.53 MORTGAGE MARKETS Mortgages on New Homes Millions of dollars except as noted
Item 1997 1998 1999 2000
Item 1997 1998 1999
May June July Aug. Sept. Oct. Nov.
Terms and yields in primary and secondary markets
PRIMARY MARKETS
Terms' 1 Purchase price (thousands of dollars) 180.1 195 .2 2 1 0 . 7 2 3 2 . 2 2 3 8 . 6 2 3 5 . 8 2 3 7 . 0 2 4 1 . 9 2 4 0 . 2 2 4 7 . 2 2 Amount of loan (thousands of dollars) 140 .3 151.1 161.7 176 .3 178 .3 178 .3 179 .7 182 .5 180 .4 184 .2 3 Loan-to-price ratio (percent) 8 0 . 4 8 0 . 0 7 8 . 7 7 8 . 0 7 6 . 9 7 7 . 7 7 7 . 7 77 .1 7 7 . 2 7 6 . 2 4 Maturity (years) 2 8 . 2 2 8 . 4 2 8 . 8 2 9 . 2 2 9 . 2 2 9 . 3 2 9 . 3 2 9 . 2 2 9 . 2 2 9 . 2 5 Fees and charges (percent of loan amount)2 1.02 .89 .77 .71 .69 . 6 6 .68 .70 .69 . 6 9
Yield (percent per year) 6 Contract rate' 7 . 5 7 6 . 9 5 6 . 9 4 7 . 4 4 7 . 4 0 7 .41 7 . 4 4 7.41 7 . 4 3 7 . 3 6 1 Effective rate1,3 7 . 7 3 7 . 0 8 7 . 0 6 7 . 5 5 7 . 5 0 7 .51 7 . 5 4 7 . 5 2 7 . 5 3 7 . 4 7 8 Contract rate (HUD series)4 7 . 7 6 7 . 0 0 7 . 4 5 8 . 2 6 n.a. n.a. n.a. n.a. n.a. n.a.
SECONDARY MARKETS
Yield (percent per xear) 9 FHA mortgages (Section 203)5 7 . 8 9 7 . 0 4 7 . 7 4 8 . 5 8 n.a. n.a. n.a. n.a. n.a. n.a.
10 GNMA securities6 7 . 2 6 6 . 4 3 7 . 0 3 8 . 0 6 7 . 6 9 7 . 5 9 7 . 4 4 7 . 4 3 7 . 3 0 7 . 2 2
Activity in secondary markets
FEDERAL NATIONAL MORTGAGE ASSOCIATION
Mortgage holdings (end of period) 11 Total 316,678 414,515 523,941 545,803 552,166 561,045 568,187 574,087 586,756 598,951 12 F H A / V A i n s u r e d 31,925 33,770 55,318 59,140 59,703 60,397 60,150 59,961 60,329 n.a. 13 Conventional 284,753 380,745 468,623 486,663 492,463 500,648 508,037 514,126 526,427 n.a.
14 Mortgage transactions purchased (during period) 70,465 188,448 195,210 12,872 12,842 15,128 13,352 11,501 18,444 17,322
Mortgage commitments (during period) 15 Issued7 69,965 193,795 187,948 10,450 11,825 16,660 14,253 16,143 17,435 15,287 16 To sell8 1,298 1,880 5,900 1,594 1,254 436 236 693 268 676
FEDERAL H O M E LOAN MORTGAGE CORPORATION
Mortgage holdings (end of period f 17 Total 164,421 255,010 324,443 347,370 350,836 354,020 357,002 361,624 365,198 372,819 18 F H A / V A i n s u r e d 177 785 1,836 3,116 2,892 2,858 2,903 3,517 3,530 3,321 19 Conventional 164,244 254,225 322,607 344,254 347,944 351,162 354,099 358,107 361,668 369.498
Mortgage transactions (during period) 20 Purchases 117,401 267,402 239,793 15,741 12,271 10,912 16,056 21,748 16,195 19,402 21 114,258 250,565 233,031 15,261 11,806 10,539 15,558 21,189 15,614 18,823
22 Mortgage commitments contracted (during period)9 120,089 281,899 228,432 13,807 13,596 10,803 17,468 19,481 17,915 20,012
1. Weighted averages based on sample surveys of mortgages originated by major institu-tional lender groups for purchase of newly built homes; compiled by the Federal Housing Finance Board in cooperation with the Federal Deposit Insurance Corporation.
2. Includes all fees, commissions, discounts, and "points" paid (by the borrower or the seller) to obtain a loan.
3. Average effective interest rate on loans closed for purchase of newly built homes, assuming prepayment at the end of ten years.
4. Average contract rate on new commitments for conventional first mortgages; from U.S. Department of Housing and Urban Development (HUD). Based on transactions on the first day of the subsequent month.
5. Average gross yield on thirty-year, minimum-downpayment first mortgages insured by the Federal Housing Administration (FHA) for immediate delivery in the private secondary market. Based on transactions on first day of subsequent month.
6. Average net yields to investors on fully modified pass-through securities backed by mortgages and guaranteed by the Government National Mortgage Association (GNMA), assuming prepayment in twelve years on pools of thirty-year mortgages insured by the Federal Housing Administration or guaranteed by the Department of Veterans Affairs.
7. Does not include standby commitments issued, but includes standby commitments converted.
8. Includes participation loans as well as whole loans. 9. Includes conventional and government-underwritten loans. The Federal Home Loan
Mortgage Corporation's mortgage commitments and mortgage transactions include activity under mortgage securities swap programs, whereas the corresponding data for FNMA exclude swap activity.
Digitized for FRASER http://fraser.stlouisfed.org/ Federal Reserve Bank of St. Louis

Real Estate A35
1.54 MORTGAGE DEBT OUTSTANDING1
Millions of dollars, end of period
Type of holder and property 1996 1997 1998 1999 2000
Type of holder and property 1996 1997 1998 Q2 Q3 Q4 Ql Q2
1 All holders 4,865,412 5,197,838 5,722,645 6,015,365 6,224,771 6,375,447 6,489,770 6,659,097
By type of property 2 One- to four-family residences 3,716,055 3,967,842 4,353,048 4,559,021 4,690,310 4,786,609 4,862,747 4,982,853 3 Multifamily residences 288,579 301,838 329,813 348,658 359,323 373,189 381,699 392,919 4 Nonfarm, nonresidential 773,643 837,859 943,278 1,008,048 1,073,743 1,112,686 1,141,577 1,175,641 5 Farm 87,134 90,299 96,506 99,638 101,395 102,962 103,748 107,685
By type of holder 6 Major financial institutions 1,981,886 2,083,881 2,194,813 2,242,431 2,321,356 2,394,923 2,456,786 2,551,751 7 Commercial banks" 1,145,389 1,245,315 1,337,217 1,361,365 1,418,819 1,495,502 1,546,816 1,614,307 8 One- to four-family 677,603 745,510 797,492 790,372 827,291 879.552 904,581 948,496 9 Multifamily 45,451 49,670 54,116 60,529 63,964 67,591 72,431 75,713
10 Nonfarm, nonresidential 397,452 423,148 456,574 479,930 496,246 516,520 537,131 556,382 11 Farm 24,883 26,986 29,035 30,536 31,320 31,839 32,673 33,717 12 Savings institutions3 628,335 631,726 643,957 656,518 676,346 668,634 680,745 701,992 13 One- to four-family 513,712 520,682 533,918 544,962 560,622 549,072 560,046 578,641 14 Multifamily 61,570 59,540 56,821 55,016 57,282 59,138 57,759 59,142 15 Nonfarm, nonresidential 52,723 51,150 52,801 56,096 57,983 59,948 62,447 63,691 16 Farm 331 354 417 443 459 475 493 518 17 Life insurance companies 208,162 206,840 213,640 224,548 226,190 230,787 229,225 235,452 18 One- to four-family 6,977 7,187 6,590 7,292 7,432 5,934 5,874 4,826 19 Multifamily 30,750 30,402 31,522 31,800 31,998 32,818 32,602 33,669 20 Nonfarm, nonresidential 160,315 158,779 164,004 173,495 174,571 179,048 177,870 182,514 21 Farm 10,120 10,472 11,524 11,961 12,189 12,987 12,879 14,444
22 Federal and related agencies 295,192 286,194 293,613 289,519 322,572 322,352 323,145 334,715 23 Government National Mortgage Association 2 8 7 8 8 7 7 7 24 One- to four-family 2 8 7 8 8 7 7 7 25 Multifamily 0 0 0 0 0 0 0 0 26 Farmers Home Administration4 41,596 41,195 40,851 40,766 73,705 73,871 72,899 72,896 27 One- to four-family 17,303 17,253 16,895 16,653 16,583 16,506 16,456 16,435 28 Multifamily 11,685 11,720 11,739 11,735 11,745 11,741 11,732 11,729 29 Nonfarm, nonresidential 6,841 7,370 7,705 7,943 41,068 41,355 40,509 40,554 30 Farm 5,768 4,852 4,513 4,435 4,308 4,268 4,202 4,179 31 Federal Housing and Veterans' Administrations 6,244 3,811 3,674 3,490 3,889 3,712 3,794 3,845 32 One- to four-family 3,524 1,767 1,849 1,623 2,013 1,851 1,847 1,832 33 Multifamily 2,719 2,044 1,825 1,867 1,876 1,861 1,947 2,013 34 Resolution Trust Corporation 0 0 0 0 0 0 0 0 35 One- to four-family 0 0 0 0 0 0 0 0 36 Multifamily 0 0 0 0 0 0 0 0 37 Nonfarm, nonresidential 0 0 0 0 0 0 0 0 38 Farm 0 0 0 0 0 0 0 0 39 Federal Deposit Insurance Corporation 2,431 724 361 189 163 152 98 72 40 One- to four-family 365 109 54 28 24 23 15 11 41 Multifamily 413 123 61 32 28 26 17 12 42 Nonfarm, nonresidential 1,653 492 245 129 111 103 67 49 43 Farm 0 0 0 0 0 0 0 0 44 Federal National Mortgage Association 168,813 161,308 157,675 155,637 153,172 151,500 150,312 155,364 45 One- to four-family 155,008 149,831 147,594 145,033 142,982 141,195 139,986 144,335 46 Multifamily 13,805 11,477 10,081 10,604 10,190 10,305 10,326 11.029 47 Federal Land Banks 29,602 30,657 32,983 33,666 34,217 34,187 34,142 34,820 48 One- to four-family 1,742 1,804 1,941 1,981 2,013 2,012 2,009 2,039 49 Farm 0 0 0 0 0 0 0 0 50 Federal Home Loan Mortgage Corporation 46,504 48,454 57,085 54,282 55,695 56,676 57,009 56,972 51 One- to four-family 41,758 42,629 49,106 43,574 44,010 44,321 43,384 42,892 52 Multifamily 4,746 5,825 7,979 10,708 11,685 12,355 13,625 14,080
53 Mortgage pools or trusts' 4,865,412 5,197,838 5,722,645 6,015,365 6,224,771 6,375,447 6,489,770 6,659,097 54 Government National Mortgage Association 506,246 536,879 537,446 553,196 569,038 582,263 589,203 590,903 55 One- to four-family 494,064 523,225 522,498 537,287 552,670 565,189 571,517 572,856 56 Multifamily 12,182 13,654 14,948 15,909 16,368 17,074 17,686 18,047 57 Federal Home Loan Mortgage Corporation 554,260 579,385 646,459 718,085 738,581 749,081 757,106 768,641 58 One- to four-family 551,513 576,846 643,465 714,844 735,088 744,619 752,607 763,890 59 Multifamily 2,747 2,539 2,994 3,241 3,493 4,462 4,499 4,751 60 Federal National Mortgage Association 650,779 709,582 834,517 911,435 938,484 960,883 975,815 995,815 61 One- to four-family 633,209 687,981 804,204 877,863 903,531 924,941 938,898 957,584 62 Multifamily 17,570 21,601 30,313 33,572 34,953 35,942 36,917 38,231 63 Farmers Home Administration4 3 2 1 1 0 0 0 0 64 One- to four-family 0 0 0 0 0 0 0 0 65 Multifamily 0 0 0 0 0 0 0 0 66 Nonfarm, nonresidential 0 0 0 0 0 0 0 0 67 Farm 3 2 1 1 0 0 0 0 68 Private mortgage conduits 329,559 413,502 571,340 627,402 645,084 662,565 678,156 686,037 69 One- to four-family6 258,800 316,400 412,700 447,938 455,276 462,600 471,390 471,000 70 Multifamily 16,369 21,591 34,323 39,435 40,936 42,628 43,835 44,931 71 Nonfarm, nonresidential 54,390 75,511 124,317 140,029 148,873 157,337 162,930 170,106 72 Farm 0 0 0 0 0 0 0 0
73 Individuals and others7 547,486 588,413 644,456 673,297 689,656 703,379 709,560 731,235 74 One- to four-family 360,476 376,574 413,770 428,202 439,219 446,771 449,496 467,572 75 Multifamily 68,572 71,651 73,081 74,090 74,629 77,016 78,074 79,272 76 Nonfarm, nonresidential 100,269 121,409 137,632 150,428 154,892 158,375 160,622 162,345 77 Farm 18,169 18,779 19,974 20,577 20,916 21,217 21,368 22,046
1. Multifamily debt refers to loans on structures of five or more units. 2. Includes loans held by nondeposit trust companies but not loans held by bank trust
departments. 3. Includes savings banks and savings and loan associations. 4. FmHA-guaranteed securities sold to the Federal Financing Bank were reallocated from
FmHA mortgage pools to FmHA mortgage holdings in 1986:Q4 because of accounting changes by the Farmers Home Administration.
5. Outstanding principal balances of mortgage-backed securities insured or guaranteed by the agency indicated.
6. Includes securitized home equity loans. 7. Other holders include mortgage companies, real estate investment trusts, state and local
credit agencies, state and local retirement funds, noninsured pension funds, credit unions, and finance companies.
SOURCE. Based on data from various institutional and government sources. Separation of nonfarm mortgage debt by type of property, if not reported directly, and interpolations and extrapolations, when required for some quarters, are estimated in part by the Federal Reserve. Line 69 from Inside Mortgage Securities and other sources.
Digitized for FRASER http://fraser.stlouisfed.org/ Federal Reserve Bank of St. Louis

A36 Domestic Nonfinancial Statistics • February 2001
1.55 CONSUMER CREDIT1
Millions of dollars, amounts outstanding, end of period
Holder and type of credit 1997 1998 1999 2000
Holder and type of credit 1997 1998 1999
May June July Aug. Sept. Oct.
Seasonally adjusted
1 Total
2 Revolving 3 Nonrevolving2
1,234,461
531,163 703,297
1,301,023
560,504 740,519
1,393,657
595,610 798,047
1,447,368
628,764 818,604
1,462,821
634,652 828,170
1,470,768
638,406 832,363
1,484,081
645,121 838,961
1,492,934
649,297 843,637
1,509,568
656,666 852,902
Not seasonally adjusted
4 Total 1,264,103 1,331,742 1,426,151 1,434,251 1,454,035 1,463,292 1,486,048 1,495,627 1,513,688
By major holder 5 Commercial banks 512,563 508,932 499,758 502,030 506,245 506,254 520,431 521,767 521,515 6 Finance companies 160,022 168,491 181,573 187,610 190,268 194,438 196,555 197,276 200,815 / Credit unions 152,362 155,406 167,921 173,471 176,030 178,034 180,679 181,597 183,010 8 Savings institutions 47,172 51,611 61,527 60,289 60,951 61,493 62,037 62,580 62,815 9 Nonfinancial business 78,927 74,877 80,311 73,523 73,500 71,956 73,030 72,091 70,842
10 Pools of securitized assets3 313,057 372,425 435,061 437,328 447,041 451,117 453,316 460,316 474,691
By major type of credit4
11 Revolving 555,858 586,528 623.245 621,127 627,909 630,633 641,298 645,820 654,678 12 Commercial banks 219,826 210,346 189,352 192,352 194,793 194,496 204,016 202,362 201,874 13 Finance companies 38,608 32,309 33,814 31,628 33,063 33,565 33,558 35,405 37,147 14 Credit unions 19,552 19,930 20,641 19,930 20,172 20,476 20,796 20,783 20,824 15 Savings institutions 11,441 12,450 15.838 15,295 15,455 15,745 16,036 16,327 16,505 16 Nonfinancial business 44,966 39,166 42,783 37,766 37,098 36,078 36,669 35,817 34,495 1/ Pools of securitized assets3 221,465 272,327 320,817 324,156 327,328 330,273 330,223 335,126 343,833
18 Nonrevolving 708,245 745,214 802,906 813,124 826,126 832,659 844,750 849,807 859,010 19 Commercial banks 292,737 298,586 310,406 309,678 311,452 311,758 316,415 319,405 319,641 20 Finance companies 121,414 136.182 147,759 155,982 157,205 160,873 162,997 161,871 163,668 21 Credit unions 132,810 135,476 147,280 153,541 155,858 157,558 159,883 160,814 162,186 22 Savings institutions 35,731 39,161 45,689 44,994 45,496 45,748 46,001 46,253 46,310 23 Nonfinancial business 33,961 35,711 37,528 35,757 36,402 35,878 36,361 36,274 36,347 24 Pools of securitized assets3 91,592 100,098 114,244 113,172 119,713 120,844 123,093 125,190 130,858
1. The Board's series on amounts of credit covers most short- and intermediate-term credit extended to individuals, excluding loans secured by real estate. Data in this table also appear in the Board's G.19 (421) monthly statistical release. For ordering address, see inside front cover.
2. Comprises motor vehicle loans, mobile home loans, and all other loans that are not included in revolving credit, such as loans for education, boats, trailers, or vacations. These loans may be secured or unsecured.
3. Outstanding balances of pools upon which securities have been issued; these balances are no longer carried on the balance sheets of the loan originator.
4. Totals include estimates for certain holders for which only consumer credit totals are available.
1.56 TERMS OF CONSUMER CREDIT1
Percent per year except as noted
Item 1997 1998 1999 2000
Item 1997 1998 1999
Apr. May June July Aug. Sept. Oct.
INTEREST RATES
Commercial banks2
1 48-month new car 9.02 8.72 8.44 n.a. 9.21 n.a. n.a. 9.62 n.a. n.a. 2 24-month personal 13.90 13.74 13.39 n.a. 13.88 n.a. n.a. 13.85 n.a. n.a.
Credit card plan 3 All accounts 15.77 15.71 15.21 n.a. 15.39 n.a. n.a. 15.98 n.a. n.a. 4 Accounts assessed interest 15.57 15.59 14.81 n.a. 14.74 n.a. n.a. 15.35 n.a. n.a.
Auto finance companies 5 New car 7.12 6.30 6.66 6.38 6.51 6.40 6.55 7.46 7.16 4.74 6 Used car 13.27 12.64 12.60 13.52 13.47 13.58 13.64 13.70 13.91 13.87
OTHER TERMS 3
Maturity (months) 7 New car 54.1 52.1 52.7 53.8 53.5 55.6 55.6 55.7 55.9 57.6 8 Used car 51.0 53.5 55.9 57.1 57.1 57.3 57.2 57.2 57.0 57.0
Loan-to-value ratio 9 New car 92 92 92 93 93 92 92 92 91 93
10 Used car 99 99 99 98 99 99 100 100 100 100
Amount financed (dollars) 11 New car 18,077 19,083 19,880 20,542 20,621 20,349 20,406 20,664 21,010 22,069 12 Used car 12,281 12,691 13,642 13,871 14,132 14,245 14,269 14,166 13,950 13,978
1. The Board's series on amounts of credit covers most short- and intermediate-term credit 2. Data are available for only the second month of each quarter, extended to individuals. Data in this table also appear in the Board's G.19 (421) monthly 3. At auto finance companies, statistical release. For ordering address, see inside front cover.
Digitized for FRASER http://fraser.stlouisfed.org/ Federal Reserve Bank of St. Louis

Flow of Funds A37
1.57 FUNDS RAISED IN U.S. CREDIT MARKETS1
Billions of dollars; quarterly data at seasonally adjusted annual rates
19 99 2000 Transaction category or sector 1994 1995 Transaction category or sector 1994 1995
Ql Q2 Q3 Q4 Ql Q2 Q3
Nonfinancial sectors
1 Total net borrowing by domestic nonfinancial sectors . . . 559.3 71X.3 731.4 804.3 1,042.9 1,277.7 938.8 1,170.1 1,094.8 940.7 958.3 758.5
By sector and instrument 7 Federal government 155.9 144.4 145.0 23.1 - 5 2 . 6 -83 .4 - 9 8 . 5 - 7 1 . 4 - 3 1 . 5 -215 .5 -414 .0 -219 .0 3 Treasury securities 155.7 142.9 146.6 23.2 - 5 4 . 6 -81 .9 -99 .1 - 7 1 . 5 -31 .5 -213 .5 -415 .8 -216 .6 4 Budget agency securities and mortgages .2 1.5 - 1 . 6 - . 1 2.0 - 1 . 5 .6 .0 .0 - 2 . 1 1.8 - 2 . 4
5 Nonfederal 403.4 566.9 586.3 781.2 1,095.5 1,361.2 1,037.3 1,241.6 1,126.3 1,156.3 1,372.3 977.5
By instrument Commercial paper 21.4 18.1 - . 9 13.7 24.4 58.3 - 2 . 6 49.8 44.0 36.2 116.9 62.5
1 Municipal securities and loans - 3 5 . 9 -48 .2 2.6 71.4 96.8 92.1 56.8 71.3 52.5 8.9 34.0 29.8 8 Corporate bonds 23.3 91.1 116.3 150.5 218.7 274.0 287.6 202.8 155.2 186.2 153.8 184.4 9 Bank loans n.e.c 75.2 103.7 70.5 106.5 108.2 86.0 24.0 112.3 108.6 131.9 163.1 32.0
in Other loans and advances 34.0 67.2 33.5 69.1 74.3 148.0 2.3 79.2 55.4 162.1 104.3 - 1 7 . 3 n Mortgages 160.5 196.0 275.7 317.5 505.5 572.2 607.8 650.0 601.1 488.9 665.7 565.7 V Home 183.2 180.7 242.5 252.3 386.9 411.2 440.1 479.4 398.3 343.9 496.6 443.4 n Multifamily residential - 3 . 6 5.8 9.4 8.3 20.3 35.5 33.1 44.2 47.9 32.3 43.9 23.6 14 Commercial - 2 1 . 3 7.9 21.3 53.7 92.0 122.0 125.6 119.4 152.4 105.8 116.3 90.8 is Farm 2.2 1.6 2.6 3.2 6.2 3.6 9.0 7.0 2.5 6.9 8.9 7.9 16 Consumer credit 124.9 138.9 88.8 52.5 67.6 130.5 61.4 76.2 109.5 142.0 134.6 120.4
By borrowing sector 17 Household 318.5 363.2 358.1 345.8 488.1 562.7 526.4 589.5 513.6 534.7 650.4 564.8 18 Nonfinancial business 131.2 255.1 235.0 379.3 527.1 718.8 467.2 599.6 579.1 617.8 701.1 387.5 19 Corporate 123.7 228.0 148.8 266.1 416.3 625.2 371.6 468.2 456.1 500.5 581.4 292.7 20 Nonfarm noncorporate 3.1 24.3 81.4 107.0 103.2 88.6 93.9 122.9 117.4 102.5 111.4 87.2 ?1 Farm 4.4 2.9 4.8 6.2 7.7 4.9 1.7 8.5 5.6 14.7 8.3 7.6 22 State and local government -46 .2 -51 .5 - 6 . 8 56.1 80.3 79.8 43.6 52.5 33.6 3.8 20.8 25.2
23 Foreign net borrowing in United States -13 .9 78.5 88.4 71.8 43.3 30.7 -24 .5 77.3 17.6 116.9 - 1 0 . 9 61.6 24 Commercial paper -26 .1 13.5 11.3 3.7 7.8 18.0 -27 .5 41.1 33.6 56.7 10.9 5.9 ?5 Bonds 12.2 57.1 67.0 61.4 34.8 15.4 .2 44.0 - 2 . 7 45.7 - 2 9 . 6 36.0 26 Bank loans n.e.c 1.4 8.5 9.1 8.5 6.7 .9 5.6 - 6 . 6 2.3 15.4 5.7 11.8 27 Other loans and advances - 1 . 4 - . 5 1.0 - 1 . 8 - 6 . 0 - 3 . 5 - 2 . 8 - 1 . 1 - 1 5 . 5 - . 9 2.0 7.8
28 Total domestic plus foreign 545.3 789.8 819.8 876.1 1,086.2 1,308.5 914.3 1,247.5 1,112.4 1,057.6 947.4 820.1
Financial sectors
29 Total net borrowing bv financial sectors 468.4 453.9 545.8 653.7 1,073.9 1,228.8 995.3 1,064.2 1,063.4 618.3 817.0 715.4
By instrument 30 Federal government-related 287.5 204.1 231.5 212.8 470.9 589.5 576.6 651.6 550.3 249.2 370.4 504.4 31 Government-sponsored enterprise securities 176.9 105.9 90.4 98.4 278.3 193.0 304.7 407.1 367.9 104.9 248.9 279.3 32 Mortgage pool securities 115.4 98.2 141.1 114.5 192.6 396.6 271.9 244.5 182.4 144.3 121.6 225.1 33 Loans from U.S. government - 4 . 8 .0 .0 .0 .0 .0 .0 .0 .0 .0 .0 .0
34 Private 180.9 249.8 314.4 440.9 603.0 639.2 418.8 412.6 513.0 369.2 446.6 211.0 35 Open market paper 40.5 42.7 92.2 166.7 161.0 78.7 57.3 89.9 479.0 130.9 77.4 65.2 36 Corporate bonds 121.8 195.9 173.8 210.5 296.9 473.8 254.8 179.5 - 2 1 . 0 166.5 230.7 177.2 37 Bank loans n.e.c -13 .7 2.5 12.6 13.2 30.1 - 6 . 7 11.0 - 5 . 9 - 5 5 . 6 .3 5.4 - . 7 38 Other loans and advances 22.6 3.4 27.9 35.6 90.2 73.3 107.9 139.8 107.5 64.4 123.1 -36 .7 39 Mortgages 9.8 5.3 7.9 14.9 24.8 20.1 - 1 2 . 3 9.4 3.2 7.0 10.0 6.0
By borrowing sector 40 Commercial banking 20.1 22.5 13.0 46.1 72.9 46.1 61.5 107.0 54.1 72.4 113.2 17.4 41 Savings institutions 12.8 2.6 25.5 19.7 52.2 75.2 59.2 51.9 5.8 40.6 59.1 -17 .2 47 Credit unions .2 - . 1 .1 .1 .6 1.5 1.4 2.8 3.3 - 2 . 9 .9 1.1 43 Life insurance companies .3 - . 1 1.1 .2 .7 3.3 3.0 1.1 - 4 . 4 - . 7 - 1 . 1 - . 3 44 Government-sponsored enterprises 172.1 105.9 90.4 98.4 278.3 193.0 304.7 407.1 367.9 104.9 248.9 279.3 45 Federally related mortgage pools 115.4 98.2 141.1 114.5 192.6 396.6 271.9 244.5 182.4 144.3 121.6 225.1 46 Issuers of asset-backed securities (ABSs) 76.5 142.4 150.8 202.2 321.4 289.7 301.5 220.5 124.2 166.0 154.8 136.8 47 Finance companies 48.6 50.2 45.9 48.7 43.0 77.0 90.5 -17 .2 99.2 52.3 103.9 96.9 48 Mortgage companies -11 .5 - 2 . 2 4.1 - 4 . 6 1.6 - 4 . 6 5.1 - 6 . 1 6.2 - 3 . 0 2.7 - . 3 49 Real estate investment trusts (REITs) 10.2 4.5 11.9 39.6 62.7 25.6 -19 .7 7.9 11.3 11.5 9.8 - 2 . 4 50 Brokers and dealers .5 - 5 . 0 - 2 . 0 8.1 7.2 -31 .1 -17 .4 16.9 - 3 7 . 3 44.4 - . 7 25.2 51 Funding corporations 23.1 34.9 64.1 80.7 40.7 156.5 -66 .2 27.9 250.6 - 1 1 . 4 4.0 -46 .2
Digitized for FRASER http://fraser.stlouisfed.org/ Federal Reserve Bank of St. Louis

A38 Domestic Nonfinancial Statistics • February 2001
1.57 F U N D S RAISED IN U.S. CREDIT MARKETS1—Continued
Billions of dollars; quarterly data at seasonally adjusted annual rates
1999 2000 Transaction category or sector 1994 1995 1996 1997 Transaction category or sector 1994 1995 1996 1997
Ql Q2 Q3 Q4 Ql Q2 Q3
All sectors
52 Total net borrowing, all sectors 1,013.8 1,243.8 1,365.6 1,529.8 2,160.1 2,537.2 1,909.6 2,311.7 2,175.8 1,676.0 1,764.4 1,535.5
53 Open market paper 35.7 74.3 102.6 184.1 193.1 155.1 27.2 180.7 556.6 223.7 205.1 133.6 54 U.S. government securities 448.1 348.5 376.5 235.9 418.3 506.1 478.1 580.1 518.9 33.6 - 4 3 . 5 285.4 55 Municipal securities - 3 5 . 9 -48 .2 2.6 71.4 96.8 92.1 56.8 71.3 52.5 8.9 34.0 29.8 56 Corporate and foreign bonds 157.3 344.1 357.0 422.4 550.4 763.1 542.6 426.3 131.5 398.4 355.0 397.7 57 Bank loans n.e.c 62.9 114.7 92.1 128.2 145.0 80.1 40.6 99.8 55.2 147.7 174.2 43.1 58 Other loans and advances 50.4 70.1 62.5 102.8 158.5 217.8 107.5 217.9 147.3 225.7 229.4 - 4 6 . 2 59 Mortgages 170.3 201.3 283.6 332.4 530.3 592.4 595.6 659.4 604.3 496.0 675.6 571.7 60 Consumer credit 124.9 138.9 88.8 52.5 67.6 130.5 61.4 76.2 109.5 142.0 134.6 120.4
Funds raised through mutual funds and corporate equities
61 Total net issues 113.4 131.5 231.9 181.2 100.0 154.2 178.5 120.4 172.8 409.3 115.0 150.0
62 Corporate equities 12.8 - 1 6 . 0 - 5 . 7 -83 .9 -174 .6 -86 .4 - 3 3 . 9 - 7 . 0 .0 103.2 -122 .6 -111 .5 63 Nonfinancial corporations - 4 4 . 9 - 5 8 . 3 -69 .5 -114 .4 -267 .0 - 5 2 . 1 -338 .4 -128 .4 - 5 5 . 0 60.8 -248 .8 - 8 7 . 6 64 Foreign shares purchased by U.S. residents 48.1 50.4 82.8 57.6 101.2 - 1 9 . 8 284.4 121.7 71.3 63.3 135.0 13.0 65 Financial corporations 9.6 - 8 . 1 -19 .0 -27 .1 - 8 . 9 - 1 4 . 5 20.2 - . 3 - 1 6 . 3 - 2 0 . 8 - 8 . 8 -36 .9 66 Mutual fund shares 100.6 147.4 237.6 265.1 274.6 240.6 212.4 127.5 172.8 306.1 237.6 261.5
1. Data in this table also appear in the Board's Z. 1 (780) quarterly statistical release, tables F.2 through F.4. For ordering address, see inside front cover.
Digitized for FRASER http://fraser.stlouisfed.org/ Federal Reserve Bank of St. Louis

Flow of Funds A39
1.58 SUMMARY OF FINANCIAL TRANSACTIONS1
Billions of dollars except as noted; quarterly data at seasonally adjusted annual rates
Transaction category or sector 1994 1995 1996 1997 1998 1999 2000
Transaction category or sector 1994 1995 1996 1997 1998
Ql Q2 Q3 Q4 Ql Q2 Q3
NET LENDING IN CREDIT MARKETS 2
1 Total net lending in credit markets 1 , 0 1 3 . 8 1 , 2 4 3 . 8 1 , 3 6 5 . 6 1 , 5 2 9 . 8 2 , 1 6 0 . 1 2 , 5 3 7 . 2 1 , 9 0 9 . 6 2 , 3 1 1 . 7 2 , 1 7 5 . 8 1 , 6 7 6 . 0 1 , 7 6 4 . 4 1 , 5 3 5 . 5
2 Domestic nonfederal nonfinancial sectors 210.0 - 6 1 . 3 80.5 17.1 131.8 472.8 328.4 230.0 - 6 . 4 -143 .9 137.1 -323 .2 Household 246.8 34.1 128.7 31.8 -16 .7 270.5 247.7 221.8 8.1 -239 .1 88.6 -299 .2
4 Nonfinancial corporate business 17.7 - 8 . 8 -10 .2 -12 .7 14.0 67.0 - 1 . 4 49.8 - 1 8 . 3 90.4 4.3 - 9 . 0 5 Nonfarm noncorporate business .6 4.7 - 4 . 3 - 2 . 1 .1 2.8 1.2 .8 1.4 2.6 2.8 3.8 6 State and local governments - 5 5 . 0 - 9 1 . 4 -33 .7 .1 134.5 132.5 81.0 - 4 2 . 4 2.4 2.3 41.4 - 1 9 . 0 7 Federal government - 2 7 . 4 - . 2 - 7 . 4 5.1 13.5 17.0 6.7 11.2 - 1 1 . 8 6.2 7.8 15.6 8 Rest of the world 132.3 273.9 414.4 311.3 254.2 256.9 61.6 385.3 138.7 334.9 185.6 199.4 9 Financial sectors 698.8 1,031.4 878.1 1,196.3 1,760.6 1,790.6 1,512.8 1,685.2 2,055.3 1,478.7 1,433.9 1,643.8
10 Monetary authority 31.5 12.7 12.3 38.3 21.1 64.5 59.8 20.6 - 4 2 . 2 103.4 - 3 . 9 27.3 1 1 Commercial banking 163.4 265.9 187.5 324.3 305.2 68.1 166.6 449.4 548.7 377.1 484.6 370.2 1? U.S.-chartered banks 148.1 186.5 119.6 274.9 312.0 131.5 259.4 421.9 457.7 409.2 505.6 333.1 13 Foreign banking offices in United States 11.2 75.4 63.3 40.2 - 1 1 . 9 -53 .1 -102 .5 33.2 42.0 4.8 - 2 9 . 9 31.5 14 Bank holding companies .9 - . 3 3.9 5.4 - . 9 - 6 . 0 .4 - 1 2 . 4 42.6 - 4 2 . 2 3.5 - 6 . 7 IS Banks in U.S. affiliated areas 3.3 4.2 .7 3.7 6.0 - 4 . 4 9.2 6.6 6.3 5.4 5.4 12.3 16 Savings institutions 6.7 - 7 . 6 19.9 - 4 . 7 36.3 111.0 85.3 58.1 20.2 50.2 73.0 56.5 17 Credit unions 28.1 16.2 25.5 16.8 19.0 30.9 32.7 27.5 18.8 35.6 36.6 41.8 18 Bank personal trusts and estates 7.1 - 8 . 3 - 7 . 7 - 2 5 . 0 - 1 2 . 8 27.8 27.8 27.8 27.8 21.9 16.8 20.6 19 Life insurance companies 72.0 100.0 69.6 104.8 76.9 78.4 68.2 36.8 30.7 57.2 52.0 51.4 20 Other insurance companies 24.9 21.5 22.5 25.2 20.4 -19 .7 26.7 - 1 4 . 4 - 9 . 4 - 1 4 . 0 -18 .1 8.7 21 Private pension funds 45.0 20.2 - 5 . 8 19.5 57.8 57.5 86.6 32.0 54.0 46.1 22.8 55.5 22 State and local government retirement funds 30.9 33.6 37.3 63.8 71.5 76.0 25.1 40.0 58.2 55.3 20.7 35.4 2 3 Money market mutual funds 30.0 86.5 88.8 87.5 244.0 215.7 - 6 7 . 0 224.8 354.5 208.8 -156 .2 244.9 24 Mutual funds - 7 . 1 52.5 48.9 80.9 124.8 97.4 117.2 - 1 3 . 0 -12 .7 - 7 7 . 8 63.7 56.5 7 5 Closed-end funds - 3 . 7 10.5 4.7 - 2 . 9 4.5 3.1 3.1 3.1 3.1 3.1 3.1 3.1 26 Government-sponsored enterprises 117.8 86.7 84.2 94.3 261.7 189.1 251.5 280.7 221.0 138.2 229.7 208.3 27 Federally related mortgage pools 115.4 98.2 141.1 114.5 192.6 396.6 271.9 244.5 182.4 144.3 121.6 225.1 78 Asset-backed securities issuers (ABSs) 69.4 120.6 120.5 163.8 281.7 272.1 284.8 212.0 94.4 145.3 120.3 101.6 29 Finance companies 48.3 49.9 18.4 21.9 51.9 85.3 88.1 91.7 114.4 132.9 138.9 81.4 30 Mortgage companies - 2 4 . 0 - 3 . 4 8.2 - 9 . 1 3.2 - 9 . 1 10.2 -12 .1 12.3 - 6 . 0 5.5 - . 5 31 Real estate investment trusts (REITs) - . 7 1.4 4.4 20.2 - 5 . 1 1.7 - 2 . 2 - 2 . 7 - 7 . 0 - 1 6 . 3 - 2 . 5 - 3 . 6 3 ? Brokers and dealers - 4 4 . 2 90.1 -15 .7 14.9 6.8 34.6 -119 .7 -22 .2 - 1 5 . 9 106.9 38.0 183.5 33 Funding corporations -12 .1 -15 .7 13.6 47.4 - 1 . 0 9.5 96.2 .6 401.9 - 3 3 . 5 187.5 -124.1
RELATION OF LIABILITIES TO FINANCIAL ASSETS
34 Net flows through credit markets 1 , 0 1 3 . 8 1 , 2 4 3 . 8 1 , 3 6 5 . 6 1 , 5 2 9 . 8 2 , 1 6 0 . 1 2 , 5 3 7 . 2 1 , 9 0 9 . 6 2 , 3 1 1 . 7 2 , 1 7 5 . 8 1 , 6 7 6 . 0 1 , 7 6 4 . 4 1 , 5 3 5 . 5
Other financial sources 1.5 -10 .2 35 Official foreign exchange - 5 . 8 8.8 - 6 . 3 .7 6.6 - 1 4 . 0 - 5 . 4 - 8 . 5 - 7 . 0 1.5 -10 .2 - . 9
36 Special drawing rights certificates .0 2.2 - . 5 - . 5 .0 - 4 . 0 .0 - 4 . 0 - 4 . 0 .0 - 8 . 0 - 4 . 0 37 Treasury currency .7 .7 - . 6 - . 7 - . 8 .0 - 2 . 1 - 4 . 1 .0 - 2 . 2 - 2 . 3 - 4 . 2 38 Foreign deposits 52.9 35.3 85.9 108.9 2.0 113.7 110.1 69.4 52.7 258.5 - 1 . 1 51.4 39 Net interbank transactions 89.8 10.0 - 5 1 . 6 -19 .7 - 3 2 . 3 48.3 93.4 - 3 0 . 8 -40 .7 -71 .1 177.7 - 6 1 . 8 40 Checkable deposits and currency - 9 . 7 - 1 2 . 8 15.7 41.2 47.4 63.6 37.5 139.3 365.2 -219 .1 - 6 5 . 0 49.0 41 Small time and savings deposits - 3 9 . 9 96.6 97.2 97.1 152.4 - 7 4 . 8 106.6 119.1 28.0 104.3 130.3 235.7 47 Large time deposits 19.6 65.6 114.0 122.5 92.1 18.0 42.4 102.7 359.4 149.2 108.4 145.3 43 Money market fund shares 40.5 141.2 145.4 155.9 287.2 221.3 115.3 174.3 485.5 241.0 48.2 241.9 44 Security repurchase agreements 78.2 110.5 41.4 120.9 91.3 258.0 -26 .1 135.9 319.0 276.1 130.4 240.5 45 Corporate equities 12.8 -16 .0 - 5 . 7 - 8 3 . 9 -174 .6 -86 .4 - 3 3 . 9 - 7 . 0 .0 103.2 -122 .6 -111 .5 46 Mutual fund shares 100.6 147.4 237.6 265.1 274.6 240.6 212.4 127.5 172.8 306.1 237.6 261.5 47 Trade payables 120.0 128.9 114.1 131.2 27.0 121.7 225.3 231.5 160.1 244.3 114.7 160.2 48 Security credit - . 1 26.7 52.4 111.0 103.3 -62 .2 139.7 18.9 277.8 566.3 - 9 9 . 8 58.9 49 Life insurance reserves 35.5 45.8 44.5 59.3 48.0 55.4 42.1 48.1 57.6 49.8 59.7 47.0 50 Pension fund reserves 257.4 171.0 163.0 278.8 248.7 204.5 248.8 266.7 294.6 266.1 280.7 228.1 51 Taxes payable 2.6 6.2 16.2 15.7 12.0 - 1 . 8 47.3 .1 18.2 28.2 22.9 .7 52 Investment in bank personal trusts 17.8 6.4 - 5 . 3 - 4 9 . 9 -42 .5 - 7 . 2 - 7 . 1 - 7 . 2 - 6 . 9 - 2 . 9 - 7 . 6 - 3 . 6 53 Noncorporate proprietors' equity 43.1 34.6 - 3 . 4 - 4 6 . 0 - 4 1 . 4 - 8 . 3 21.4 - 5 6 . 0 12.3 - 1 5 . 5 - 2 . 9 28.9 54 Miscellaneous 278.3 503.8 537.4 512.5 844.4 406.7 1,454.9 507.0 596.3 870.3 1,120.2 1,242.4
55 Total financial sources 2 , 1 0 8 . 0 2 , 7 5 6 . 6 2 , 9 5 7 . 0 3 , 3 5 0 . 0 4 , 1 0 5 . 4 4 , 0 3 0 . 3 4 , 7 3 2 . 2 4 , 1 3 4 . 6 5 , 3 1 6 . 7 4 , 8 3 0 . 2 3 , 8 7 5 . 7 4 , 3 4 1 . 1
Liabilities not identified as assets ( - ) 56 Treasury currency - . 2 - . 3 - 1 . 6 - 1 . 4 - 1 . 4 - 1 . 5 - 3 . 5 - 5 . 9 - 2 . 2 - 6 . 1 - 6 . 2 - 6 . 7 57 Foreign deposits 43.0 25.1 59.6 107.4 - 6 . 4 49.3 96.8 27.4 92.5 189.4 - 6 2 . 6 21.0 58 Net interbank liabilities - 2 . 7 - 3 . 1 - 3 . 3 -19 .9 3.4 49.7 - 4 . 8 - 7 . 0 -23 .7 24.4 - 4 . 3 - 1 8 . 8 59 Security repurchase agreements 73.5 25.7 4.1 64.3 61.4 213.5 54.3 77.8 -217 .4 553.2 5.4 128.8 60 Taxes payable 16.6 21.1 23.1 28.0 13.9 - 8 . 8 25.0 2.7 - 5 . 1 13.4 - 1 . 3 - 1 0 . 0 61 Miscellaneous -114 .0 -166 .5 -76 .4 -69 .1 -46 .1 -522 .5 -131 .8 -454 .8 -132.1 -342 .9 -196 .1 -83 .9
Floats not included in assets ( - ) 62 Federal government checkable deposits - 4 . 8 - 6 . 0 .5 - 2 . 7 2.6 - 2 . 1 - 2 7 . 0 8.6 - 9 . 2 28.7 - 3 . 4 - 2 . 7 63 Other checkable deposits - 2 . 8 - 3 . 8 - 4 . 0 - 3 . 9 - 3 . 1 - 2 . 1 - . 9 - . 3 .0 .6 1.5 1.9 64 Trade credit 27.4 15.6 -21 .2 -29 .4 -42 .1 45.6 - 6 3 . 7 75.3 119.3 24.5 - 7 4 . 8 - 6 8 . 6
65 Total identified to sectors as assets 2 , 0 7 2 . 1 2 , 8 4 9 . 0 2 , 9 7 6 . 4 3 , 2 7 6 . 5 4 , 1 2 3 . 3 4 , 2 0 9 . 1 4 , 7 8 7 . 8 4 , 4 1 0 . 7 5 , 4 9 4 . 7 4 , 3 4 5 . 0 4 , 2 1 7 . 6 4 , 3 8 0 . 2
1. Data in this table also appear in the Board's Z. 1 (780) quarterly statistical release, tables 2. Excludes corporate equities and mutual fund shares. F. 1 and F.5. For ordering address, see inside front cover.
Digitized for FRASER http://fraser.stlouisfed.org/ Federal Reserve Bank of St. Louis

A40 Domestic Nonfinancial Statistics • February 2001
1.59 SUMMARY OF CREDIT MARKET DEBT OUTSTANDING1
Billions of dollars, end of period
1999 2000 tyy3 tyyo
Ql Q2 Q3 Q4 Ql Q2 Q3
Nonfinancial sectors
1 Total credit market debt owed by domestic nonlinancial sectors 13,712.9 14,444.2 15,247.0 16,289.9 16,605.4 16,784.8 17,105.1 17,445.0 17,677.8 17,853.8 18,054.1
By sector and instrument 2 Federal government 3,636.7 3,781.8 3,804.9 3,752.2 3,759.7 3,651.7 3,632.7 3,681.0 3,653.5 3,464.0 3,410.3 3 Treasury securities 3,608.5 3,755.1 3.778.3 3,723.7 3,731.6 3,623.4 3,604.5 3,652.8 3,625.8 3,435.7 3,382.7 4 Budget agency securities and mortgages 28.2 26.6 26.5 28.5 28.1 28.3 28.3 28.3 27.8 28.2 27.6
5 Nonfederal 10,076.1 10,662.5 11,442.1 12,537.7 12,845.7 13,133.1 13,472.4 13,763.9 14,024.3 14,389.9 14,643.8
By instrument 6 Commercial paper 157.4 156.4 168.6 193.0 223.9 232.4 239.3 230.3 260.8 296.8 307.0 / Municipal securities and loans 1,293.5 1,296.0 1,367.5 1,464.3 1,491.0 1,510.0 1,518.6 1,532.5 1,539.2 1,551.6 1,550.3 8 Corporate bonds 1,344.1 1,460.4 1,610.9 1,829.6 1,898.1 1,970.0 2,020.7 2,059.5 2,106.0 2,144.5 2,190.6 y Bank loans n.e.c 863.6 934.1 1.040.5 1,148.8 1,165.2 1,178.5 1,202.9 1,231.5 1,259.1 1,307.2 1,311.7
10 Other loans and advances 736.9 770.4 839.5 913.8 957.4 956.0 969.8 985.3 1,032.4 1,056.2 1,057.1 n Mortgages 4,557.9 4,833.6 5,151.1 5,656.6 5,790.9 5,945.9 6,151.0 6,298.7 6,410.8 6,579.6 6,731.6 12 Home 3,510.5 3,719.2 3,971.5 4,358.4 4,451.1 4,564.1 4,693.6 4,790.7 4,866.5 4,993.0 5,114.4 13 Multifamily residential 265.5 278.6 286.9 307.3 316.4 324.6 335.7 347.7 355.7 366.7 372.6 14 Commercial 697.3 748.7 802.3 894.4 926.1 957.5 1,020.3 1,058.4 1,084.8 1,113.9 1,136.6 15 Farm 84.6 87.1 90.3 96.5 97.4 99.6 101.4 102.0 103.7 106.0 107.9 lb Consumer credit 1,122.8 1,211.6 1,264.1 1,331.7 1,319.3 1,340.4 1,370.1 1,426.2 1,416.0 1,454.0 1,495.6
By borrowing sector 1/ Household 4,898.2 5,222.7 5,568.8 6,056.9 6,138.8 6,282.3 6,448.5 6,605.2 6,678.8 6,851.5 7,024.3 18 Nonfinancial business 4,107.7 4,376.4 4.753.9 5,281.0 5,483.8 5,612.6 5,781.5 5,906.6 6,088.3 6,272.7 6,356.1 iy Corporate 2,913.1 3,095.6 3,359.8 3,776.1 3,957.9 4,059.5 4,195.9 4,290.7 4,445.5 4,596.8 4,656.9 20 Nonfarm noncorporate 1,049.5 1,130.9 1.237.9 1,341.1 1,363.5 1,387.0 1,417.0 1,446.8 1,472.7 1,500.6 1,521.7 21 Farm 145.1 149.9 156.1 163.8 162.4 166.1 168.6 169.0 170.1 175.3 177.5 22 State and local government 1,070.2 1,063.4 1.119.5 1,199.8 1,223.2 1,238.2 1,242.4 1,252.1 1,257.3 1,265.7 1,263.5
23 Foreign credit market debt held in United States 453.7 542.2 608.0 651.4 659.2 652.7 672.9 676.9 704.6 698.8 720.7
24 Commercial paper 56.2 67.5 65.1 72.9 77.2 70.1 81.8 89.2 101.6 101.2 109.8 25 Bonds 299.4 366.3 427.7 462.5 466.3 466.4 477.4 476.7 488.1 480.7 489.7 26 Bank loans n.e.c 34.6 43.7 52.1 58.9 59.1 60.5 58.8 59.4 63.3 64.7 67.6 21 Other loans and advances 63.6 64.7 63.0 57.2 56.5 55.8 55.0 51.7 51.7 52.1 53.5
28 Total credit market debt owed by nonfinancial sectors, domestic and foreign 14,166.5 14,986.4 15,855.0 16,941.3 17,264.6 17,437.5 17,778.0 18,121.9 18,382.5 18,552.6 18,774.8
Financial sectors
29 Total credit market debt owed by financial sectors 4,278.8 4,824.6 5,445.2 6,519.1 6,809.0 7,073.3 7,346.8 7,607.0 7,744.5 7,964.5 8,155.8
By instrument 30 Federal government-related 2,376.8 2,608.3 2,821.1 3,292.0 3,434.1 3,580.7 3,745.9 3,884.0 3,940.3 4,035.5 4,164.5 31 Government-sponsored enterprise securities 806.5 896.9 995.3 1,273.6 1,321.8 1,398.0 1,499.8 1,591.7 1,618.0 1,680.2 1,750.0 32 Mortgage pool securities 1,570.3 1,711.4 1,825.8 2,018.4 2,112.3 2,182.7 2,246.1 2,292.3 2,322.3 2,355.4 2,414.5 33 Loans from U.S. government .0 .0 .0 .0 .0 .0 .0 .0 .0 .0 .0 34 Private 1,901.9 2,216.3 2.624.1 3,227.1 3,374.9 3.492.6 3,601.0 3,723.0 3,804.2 3,928.9 3,991.3 35 Open market paper 486.9 579.1 745.7 906.7 926.4 940.9 963.4 1,082.9 1,115.7 1,135.2 1,151.6 36 Corporate bonds 1,204.7 1,378.4 1,555.9 1,852.8 1,968.6 2,042.8 2,091.1 2,074.6 2,114.2 2,183.2 2,234.6 3/ Bank loans n.e.c 51.4 64.0 77.2 107.2 104.1 106.8 105.2 92.9 91.4 92.7 92.5 38 Other loans and advances 135.0 162.9 198.5 288.7 299.1 328.6 365.4 395.8 404.4 436.9 430.2 3y Mortgages 24.1 31.9 46.8 71.6 76.6 73.6 75.9 76.7 78.5 81.0 82.5
By borrowing sector 40 Commercial banks 102.6 113.6 140.6 188.6 187.5 202.7 224.2 230.0 242.2 265.4 263.6 41 Bank holding companies 148.0 150.0 168.6 193.5 202.6 205.5 211.8 219.3 221.4 229.3 236.9 42 Savings institutions 115.0 140.5 160.3 212.4 226.9 241.6 255.4 260.4 266.9 280.7 277.5 43 Credit unions .4 .4 .6 1.1 1.5 1.8 2.5 3.4 2.6 2.9 3.1 44 Life insurance companies .5 1.6 1.8 2.5 3.3 4.0 4.3 3.2 3.0 2.7 2.7 45 Government-sponsored enterprises 806.5 896.9 995.3 1,273.6 1,321.8 1,398.0 1,499.8 1,591.7 1,618.0 1,680.2 1,750.0 46 Federally related mortgage pools 1,570.3 1,711.4 1,825.8 2,018.4 2,112.3 2,182.7 2,246.1 2,292.3 2,322.3 2,355.4 2,414.5 47 Issuers of asset-backed securities (ABSs) 712.5 863.3 1.076.6 1,398.0 1,463.1 1,539.9 1,599.1 1,632.0 1,665.8 1,706.4 1,749.0 48 Brokers and dealers 29.3 27.3 35.3 42.5 34.8 30.4 34.6 25.3 36.4 36.2 42.5 4y Finance companies 483.9 529.8 554.5 597.5 614.4 639.2 628.5 659.9 670.7 699.2 716.5 50 Mortgage companies 16.5 20.6 16.0 17.7 16.5 17.8 16.3 17.8 17.1 17.8 17.7 51 Real estate investment trusts (REITs) 44.6 56.5 96.1 158.8 165.2 160.3 162.2 165.1 167.9 170.4 169.8 52 Funding corporations 248.6 312.7 373.7 414.4 459.1 449.5 462.0 506.6 510.1 517.9 512.0
All sectors
53 Total credit market debt, domestic and foreign . . . 18,445.3 19,811.0 21,300.2 23,460.4 24,073.5 24,510.8 25,124.9 25,728.9 26,126.9 26,517.1 26,930.6
54 Open market paper 700.4 803.0 979.4 1,172.6 1,227.6 1,243.3 1,284.5 1,402.4 1,478.1 1,533.3 1,568.3 53 U.S. government securities 6,013.6 6,390.0 6.626.0 7,044.3 7,193.8 7,232.4 7,378.6 7,565.0 7,593.8 7,499.5 7,574.8 36 Municipal securities 1,293.5 1,296.0 1,367.5 1,464.3 1,491.0 1,510.0 1,518.6 1,532.5 1,539.2 1,551.6 1,550.3 3/ Corporate and foreign bonds 2,848.1 3,205.1 3,594.5 4,144.9 4.333.0 4,479.2 4,589.1 4,610.8 4,708.3 4,808.3 4,914.9 38 Bank loans n.e.c 949.6 1,041.7 1.169.8 1,314.9 1,328.3 1,345.7 1,366.9 1,383.8 1,413.7 1,464.6 1,471.7 sy Other loans and advances 935.4 998.0 1,101.0 1,259.6 1,313.0 1,340.3 1,390.1 1,432.7 1,488.5 1,545.2 1,540.8 60 Mortgages 4,581.9 4,865.5 5.197.9 5,728.2 5,867.6 6,019.5 6,226.9 6,375.5 6,489.3 6,660.6 6,814.1 61 Consumer credit 1,122.8 1,211.6 1,264.1 1,331.7 1,319.3 1,340.4 1,370.1 1,426.2 1,416.0 1,454.0 1,495.6
1. Data in this table also appear in the Board's Z. 1 (780) quarterly statistical release, tables L.2 through L.4. For ordering address, see inside front cover.
Digitized for FRASER http://fraser.stlouisfed.org/ Federal Reserve Bank of St. Louis

Flow of Funds A41
1.60 SUMMARY OF FINANCIAL ASSETS A N D LIABILITIES1
Billions of dollars except as noted, end of period
Transaction category or sector 1995 1996 1997 1998
1999 2000
Transaction category or sector 1995 1996 1997 1998
Ql Q2 Q3 Q4 Ql Q2 Q3
CREDIT M A R K E T DEBT OUTSTANDING 2
1 Total credit market assets 1 8 , 4 4 5 . 3 1 9 , 8 1 1 . 0 2 1 , 3 0 0 . 2 2 3 , 4 6 0 . 4 2 4 , 0 7 3 . 5 2 4 , 5 1 0 . 8 2 5 , 1 2 4 . 9 2 5 , 7 2 8 . 9 2 6 , 1 2 6 . 9 2 6 , 5 1 7 . 1 2 6 , 9 3 0 . 6
? Domestic nonfederal nonfinancial sectors 2,905.5 3,031.3 3,004.7 3,108.2 3,199.5 3,255.5 3,311.9 3,434.5 3,368.4 3,377.1 3,303.4 Household 1,944.3 2,118.3 2,106.4 2,061.4 2,124.7 2,155.3 2,208.2 2,318.5 2,252.7 2,244.2 2,174.1
4 Nonfinancial corporate business 280.4 270.2 257.5 271.5 266.1 268.5 284.7 295.7 294.7 298.3 300.8 Nonfarm noncorporate business 42.3 38.0 35.9 35.9 36.6 36.9 37.1 37.5 38.1 38.8 39.8
6 State and local governments 638.6 604.8 605.0 739.4 772.1 794.8 781.9 782.8 782.9 795.8 788.7 7 Federal government 207.5 200.2 205.5 219.1 223.3 225.0 260.7 258.0 259.6 261.5 265.4 8 Rest of the world 1,531.1 1,926.6 2,257.3 2,539.8 2,608.3 2,621.3 2,718.1 2,678.0 2,765.9 2,809.7 2,860.0 9 Financial sectors 13,801.1 14,652.9 15,832.7 17,593.3 18,042.4 18,409.0 18,834.0 19,358.4 19,733.1 20,068.7 20.501.8
10 Monetary authority 380.8 393.1 431.4 452.5 466.0 485.1 489.3 478.1 501.9 505.1 511.5 11 Commercial banking 3,520.1 3,707.7 4,031.9 4,335.7 4,338.4 4,383.4 4,488.3 4,643.9 4,725.0 4,847.4 4,931.2 17 U.S.-chartered banks 3,056.1 3,175.8 3,450.7 3,761.2 3,782.9 3,847.6 3,944.3 4,078.9 4,171.3 4,295.4 4,368.3 N Foreign banking offices in United States 412.6 475.8 516.1 504.2 487.8 465.7 475.3 484.1 482.0 478.1 487.6 14 Bank holding companies 18.0 22.0 27.4 26.5 25.0 25.1 22.0 32.7 22.1 23.0 21.3 15 Banks in U.S.-affiliated areas 33.4 34.1 37.8 43.8 42.7 45.0 46.7 48.3 49.6 51.0 54.0 16 Savings institutions 913.3 933.2 928.5 964.8 990.8 1,011.4 1,030.8 1,033.4 1,044.5 1,061.7 1,080.9 17 Credit unions 263.0 288.5 305.3 324.2 330.2 341.0 348.5 351.7 359.0 370.8 381.9 18 Bank personal trusts and estates 239.7 232.0 207.0 194.1 201.1 208.0 215.0 222.0 227.4 231.7 236.8 19 Life insurance companies 1,587.5 1,657.0 1,751.1 1,828.0 1,853.5 1,869.6 1,880.4 1,886.0 1,901.5 1,913.4 1,927.9 20 Other insurance companies 468.7 491.2 515.3 535.7 530.8 537.5 533.9 531.6 528.0 523.5 525.7 21 Private pension funds 633.1 627.3 646.8 704.7 719.0 740.7 748.7 762.2 773.7 779.4 793.3 22 State and local government retirement funds 531.0 568.2 632.0 703.6 722.6 728.9 738.9 753.4 767.2 772.4 781.3 23 Money market mutual funds 545.5 634.3 721.9 965.9 1,036.2 1,001.8 1,049.7 1,147.8 1,217.1 1,159.4 1,212.5 ?4 Mutual funds 771.3 820.2 901.1 1,025.9 1,050.8 1,083.7 1,083.0 1,073.1 1,053.7 1,073.9 1,090.6 2 5 Closed-end funds 96.4 101.1 98.3 102.8 103.6 104.3 105.1 105.9 106.7 107.4 108.2 26 Government-sponsored enterprises 750.0 807.9 902.2 1,163.9 1,203.1 1,268.4 1,340.2 1,399.5 1,426.4 1,485.3 1,546.7 27 Federally related mortgage pools 1,570.3 1,711.4 1,825.8 2,018.4 2,112.3 2,182.7 2,246.1 2,292.3 2,322.3 2,355.4 2,414.5 ?H Asset-backed securities issuers (ABSs) 653.4 773.9 937.7 1,219.4 1,280.1 1,352.7 1,409.8 1,435.3 1,463.9 1,495.8 1,529.6 29 Finance companies 526.2 544.5 566.4 618.4 639.9 660.9 678.2 713.3 747.0 780.6 795.5 30 Mortgage companies 33.0 41.2 32.1 35.3 33.0 35.6 32.5 35.6 34.1 35.5 35.4 31 Real estate investment trusts (REITs) 26.0 30.4 50.6 45.5 45.9 45.3 44.7 42.9 38.8 38.2 37.3 32 Brokers and dealers 183.4 167.7 182.6 189.4 211.4 162.9 167.0 158.6 201.1 189.3 245.2 33 Funding corporations 108.4 122.0 164.7 165.2 173.8 204.9 204.0 291.9 293.8 342.7 315.8
RELATION OF LIABILITIES TO FINANCIAL ASSETS
34 Total credit market debt 1 8 , 4 4 5 . 3 1 9 , 8 1 1 . 0 2 1 , 3 0 0 . 2 2 3 , 4 6 0 . 4 2 4 , 0 7 3 . 5 2 4 , 5 1 0 . 8 2 5 , 1 2 4 . 9 2 5 , 7 2 8 . 9 2 6 , 1 2 6 . 9 2 6 , 5 1 7 . 1 2 6 , 9 3 0 . 6
Other liabilities 3 5 Official foreign exchange 63.7 53.7 48.9 60.1 53.6 50.9 52.1 50.1 49.4 46.5 44.9 36 Special drawing rights certificates 10.2 9.7 9.2 9.2 8.2 8.2 7.2 6.2 6.2 4.2 3.2 37 Treasury currency 18.3 17.7 17.0 16.2 16.2 15.7 14.6 14.6 14.1 13.4 12.4 38 Foreign deposits 418.8 521.7 619.7 639.0 667.4 694.9 712.3 725.8 790.4 790.2 803.0 39 Net interbank liabilities 290.7 240.8 219.4 189.0 182.0 207.1 199.6 204.5 168.1 215.9 200.2 40 Checkable deposits and currency 1,229.1 1,244.8 1,286.1 1,333.4 1,310.5 1,353.1 1,353.8 1,484.8 1,392.9 1,409.7 1,385.7 41 Small time and savings deposits 2,279.7 2,377.0 2,474.1 2,626.5 2,637.6 2,644.6 2,665.9 2,671.2 2,728.0 2,738.8 2,790.2 42 Large time deposits 476.9 590.9 713.4 805.5 804.3 809.0 837.5 936.1 966.5 987.4 1,026.8 43 Money market fund shares 741.3 886.7 1,042.5 1,329.7 1,411.7 1,393.5 1,444.9 1.578.8 1,666.0 1,627.1 1,697.8 44 Security repurchase agreements 660.0 701.5 822.4 913.7 980.3 970.8 999.3 1,085.4 1,155.8 1,185.1 1,239.2 45 Mutual fund shares 1,852.8 2,342.4 2,989.4 3,610.5 3,758.1 4,049.1 3,931.5 4,553.4 4,863.3 4,759.6 4,816.4 46 Security credit 305.7 358.1 469.1 572.3 552.7 589.3 593.2 665.9 803.7 780.5 794.5 47 Life insurance reserves 566.2 610.6 665.0 718.3 735.9 749.8 756.2 783.9 799.9 809.4 8 2 1 . 2 48 Pension fund reserves 5,812.8 6,548.6 7,817.4 8,913.1 9,065.3 9,480.0 9,151.1 10,000.0 10,230.0 10,155.0 10,348.6 49 Trade payables 1,698.0 1,812.1 1,943.3 1,970.3 1,973.9 2,031.1 2,095.1 2,155.0 2,189.6 2,218.8 2,265.7 50 Taxes payable 107.6 123.8 139.5 151.5 158.8 162.4 167.5 167.5 182.3 179.5 185.3 51 Investment in bank personal trusts 803.0 871.3 942.5 1,001.0 1,016.5 1,061.0 1,019.0 1,130.4 1,163.8 1,125.6 1,124.5 52 Miscellaneous 5,953.4 6,349.8 6,699.6 7,268.4 7,267.8 7,459.1 7,468.8 7,812.0 7,984.0 8,235.4 8,696.4
53 Total liabilities 4 1 , 7 3 3 . 4 4 5 , 4 7 2 . 1 5 0 , 2 1 8 . 5 5 5 , 5 8 8 . 1 5 6 , 6 7 4 . 4 5 8 , 2 4 0 . 5 5 8 , 5 9 4 . 5 6 1 , 7 5 4 . 5 6 3 , 2 8 0 . 9 6 3 , 7 9 9 . 2 6 5 , 1 8 6 . 6
Financial assets not included in liabilities ( + ) 54 Gold and special drawing rights 22.1 21.4 21.1 21.6 20.7 20.8 21.3 21.4 21.4 21.5 21.4 55 Corporate equities 8,495.7 10,255.8 13,201.3 15,427.8 15,919.1 17,060.4 16,214.9 19,576.3 20,232.0 19,246.8 19,047.1 56 Household equity in noncorporate business 3,683.6 3,889.2 4,164.4 4,414.7 4,487.4 4,548.8 4,623.1 4,704.5 4,732.2 4,779.1 4,848.4
Liabilities not identified as assets (—) 57 Treasury currency - 5 . 7 - 7 . 3 - 8 . 6 -10 .1 -10 .5 - 1 1 . 3 - 1 2 . 8 - 1 3 . 4 - 1 4 . 9 - 1 6 . 6 -18 .2 58 Foreign deposits 360.2 437.0 538.3 548.2 560.5 584.7 591.5 615.0 662.4 646.7 652.0 59 Net interbank transactions - 9 . 0 - 1 0 . 6 -32 .2 - 2 7 . 0 - 1 1 . 3 - 1 0 . 6 - 1 3 . 2 - 2 5 . 5 -13 .9 -11 .6 -17 .7 60 Security repurchase agreements 107.4 111.5 175.8 237.2 296.7 308.2 327.7 269.3 414.2 413.9 445.0 61 Taxes payable 62.4 76.9 92.6 102.0 89.8 112.2 96.4 95.5 90.8 102.5 94.9 62 Miscellaneous -1,052.2 -1,512.3 -1,868.4 -2,404.7 -2,618.2 -2,651.5 -2,957.4 -2,847.2 -2,992.2 -2,980.4 -2,787.4
Floats not included in assets (—) 63 Federal government checkable deposits 3.1 - 1 . 6 - 8 . 1 - 3 . 9 - 7 . 2 - 1 2 . 4 - 1 0 . 2 - 9 . 9 - 6 . 5 - 5 . 2 - 7 . 8 64 Other checkable deposits 34.2 30.1 26.2 23.1 18.9 22.1 14.5 22.3 18.7 22.5 15.5 65 Trade credit 196.8 174.6 135.5 94.5 56.3 19.4 37.0 136.1 92.3 51.4 34.5
66 Total identified to sectors as assets 5 4 , 2 3 7 . 8 6 0 , 3 4 0 . 1 6 8 , 5 5 4 . 3 7 6 , 8 9 2 . 9 7 8 , 7 2 6 . 6 8 1 , 5 0 9 . 7 8 1 , 3 8 0 . 2 8 7 , 8 1 4 . 5 9 0 , 0 1 5 . 5 8 9 , 6 2 3 . 3 9 0 , 6 9 2 . 7
1. Data in this table also appear in the Board's Z. 1 (780) quarterly statistical release, tables 2. Excludes corporate equities and mutual fund shares. L. 1 and L.5. For ordering address, see inside front cover.
Digitized for FRASER http://fraser.stlouisfed.org/ Federal Reserve Bank of St. Louis

A42 Domestic Nonfinancial Statistics • February 2001
2.10 NONFINANCIAL BUSINESS ACTIVITY Selected Measures Monthly data seasonally adjusted, and indexes 1992=100, except as noted
Measure 1997 1998 1999 2000
Measure 1997 1998 1999 Mar. Apr. May June July' Aug.' Sept.' Oct. Nov.?
1 Industrial production' 127.7r 134.0r 139.6r 145.2r 146.3r 147.2r 147.9r 147.6 148.6 149.1 148.9 148.6
Market groupings 2 Products, total 121.5r 127.2r 131.2r 134.4r 135.3' 135.5r 136.0r 135.8 136.6 136.9 136.4 136.4 3 Final, total 123.2r 129.3r 133.3r 136.0r 137.2r 137.5r 138.3r 138.1 139.2 139.4 138.8 139.0 4 Consumer goods 115.9r 118.4r 120.8r 122.2r 123.2r 123.5r 124.2r 122.9 123.8 124.1 123.0 123.2 5 Equipment 135.4r 147.1r 153.8r 161.3' 162.8r 163.1r I64.3r 166.3 167.9 167.9 168.4 168.7 6 Intermediate 116.3r 121.0r 125.1r 129.5r 129.3r 129.4r 129.0r 128.7 128.8 129.1 129.2 128.3 7 Materials 138.0r 145.7r 154.5r 164.7r 166.1' 168.4r 169.4r 169.0 170.5 171.5 171.7 170.8
Industry groupings 8 Manufacturing 130.8r 138.2r 144.8C 151.3r 152.2' 153.1' 153.8' 153.7 154.6 155.2 155.1 154.4
9 Capacity utilization, manufacturing (percent)2. . 82.7r 81.3r 80.5r 81.6r 81.8r 81.9r 82.0' 81.6 81.7 81.7 81.4 80.6
10 Construction contracts3 144.2 161.2 177.5 195.0 186.0 179.0 188.0 178.0 175.0 182.0 187.0 n.a.
11 Nonagricultural employment, total4 120.3 123.4 126.2 128.5 128.9 129.1 129.1 129.1 129.0 129.2 129.3 129.4 12 Goods-producing, total 101.2 102.7 102.3 104.3 104.3 104.1 104.2 104.4 103.9 103.9 104.0 104.0 13 Manufacturing, total 98.3 98.8 97.0 97.3 97.3 97.3 97.3 97.6 97.0 96.7 96.7 96.7 14 Manufacturing, production workers 99.6 99.8 97.8 97.9 98.0 97.9 97.9 98.4 97.5 97.2 97.1 97.1 15 Service-producing 126.5 130.0 133.8 136.2 136.8 137.0 137.1 137.0 137.0 137.3 137.3 137.5 16 Personal income, total 175.1 186.5 196.6 206.0 207.2 207.9 208.9 209.5 210.1 212.5 212.2 213.0 17 Wages and salary disbursements 171.3 184.6 196.9 206.4 208.2 208.4 209.8 211.0 211.3 212.7 214.1 214.9 18 Manufacturing 144.6 152.3 157.4 162.0 163.6 162.9 164.3 165.8 164.9 165.1 166.5 167.2 19 Disposable personal income5 172.5 182.7 191.9 199.8 200.6 201.3 202.1 202.5 202.9 205.2 204.5 205.1 20 Retail sales5 169.8 178.4 194.6 209.3 208.3 208.5 209.3 211.1 211.0 212.7 212.7 211.9
Prices6
21 Consumer (1982-84=100) 160.5 163.0 166.6 171.2 171.3 171.5 172.4 172.8 172.8 173.7 174.0 174.1 22 Producer finished goods (1982= 100) 131.8 130.7 133.0 136.8 136.7 137.3 138.6 138.6 138.1 139.2 140.0 139.9
1. Data in this table appear in the Board's G. 17 (419) monthly statistical release. The data are also available on the Board's web site, http://www.federalreserve.gov/releases/gl7. The latest historical revision of the industrial production index and the capacity utilization rates was released in December 2000. The recent annual revision is described in an article in the March 2001 issue of the Bulletin. For a description of the methods of estimating industrial production and capacity utilization, see "Industrial Production and Capacity Utilization: Historical Revision and Recent Developments," Federal Reserve Bulletin, vol. 83 (February 1997), pp. 67-92, and the references cited therein. For details about the construction of individual industrial production series, see "Industrial Production: 1989 Developments and Historical Revision," Federal Reserve Bulletin, vol. 76 (April 1990), pp. 187-204.
2. Ratio of index of production to index of capacity. Based on data from the Federal Reserve, U.S. Department of Commerce, and other sources.
3. Index of dollar value of total construction contracts, including residential, nonresiden-tial, and heavy engineering, from McGraw-Hill Information Systems Company, F.W. Dodge Division.
4. Based on data from the U.S. Department of Labor, Employment and Earnings. Series covers employees only, excluding personnel in the armed forces.
5. Based on data from U.S. Department of Commerce, Survey of Current Business. 6. Based on data not seasonally adjusted. Seasonally adjusted data for changes in the price
indexes can be obtained from the U.S. Department of Labor, Bureau of Labor Statistics, Monthly Labor Review.
NOTE. Basic data (not indexes) for series mentioned in notes 4 and 5, and indexes for series mentioned in notes 3 and 6, can also be found in the Survey of Current Business.
2.11 LABOR FORCE, EMPLOYMENT, AND UNEMPLOYMENT Thousands of persons; monthly data seasonally adjusted
Category 1997 1998 1999
2000 Category 1997 1998 1999
Apr. May June July Aug. Sept.' Oct. Nov.p
HOUSEHOLD SURVEY DATA1
1 Civilian labor force2 136,297 137,673 139,368 141,230 140,489 140,762 140,399 140,742 140,639 140,918 141,052
? Employment Nonagricultural industries3 126,159 128,085 130,207 132,351 131,417 131,858 131,450 131,569 131,821 132,188 132,219
3 Agriculture 3,399 3,378 3,281 3,355 3,298 3,321 3,299 3,344 3,340 3,233 3,154
4 6,739 6,210 5,880 5,524 5,774 5,583 5,650 5,829 5,477 5,496 5,679 5 Rate (percent of civilian labor force) 4.9 4.5 4.2 3.9 4.1 4.0 4.0 4.1 3.9 3.9 4.0
ESTABLISHMENT SURVEY DATA
6 Nonagricultural payroll employment4 122,690 125,826 128,616 131,419 131,590 131,647 131,607 131,528 131,723 131,800 131,894
7 Manufacturing 18,675 18,772 18,431 18,492 18,479 18,493 18,548 18,432 18,380 18,377 18,378 8 Mining 596 590 535 539 539 539 538 537 539 541 542 9 Contract construction 5,691 5,985 6,273 6,694 6,666 6,668 6,670 6,675 6,720 6,742 6,736
10 Transportation and public utilities 6,408 6,600 6,792 6,970 6,962 6,985 7,010 6,941 7,037 7,046 7,062 11 Trade 28,614 29,127 29,792 30,252 30,112 30,171 30,246 30,253 30,249 30,278 30,338 12 Finance 7,109 7,407 7,632 7,610 7,600 7,588 7,586 7,608 7,622 7,637 7,648 1.3 Service 36,040 37,526 39,000 40,195 40,220 40,401 40,403 40,572 40,685 40,685 40,750 14 Government 19,557 19,819 20,161 20,667 21,012 20,802 20,606 20,510 20,491 20,494 20,440
1. Beginning January 1994, reflects redesign of current population survey and population controls from the 1990 census.
2. Persons sixteen years of age and older, including Resident Armed Forces. Monthly figures are based on sample data collected during the calendar week that contains the twelfth day; annual data are averages of monthly figures. By definition, seasonality does not exist in population figures.
3. Includes self-employed, unpaid family, and domestic service workers.
4. Includes all full- and part-time employees who worked during, or received pay for, the pay period that includes the twelfth day of the month; excludes proprietors, self-employed persons, household and unpaid family workers, and members of the armed forces. Data are adjusted to the March 1992 benchmark, and only seasonally adjusted data are available at this time.
SOURCE. Based on data from U.S. Department of Labor, Employment and Earnings.
Digitized for FRASER http://fraser.stlouisfed.org/ Federal Reserve Bank of St. Louis

Selected Measures A43
2.12 OUTPUT, CAPACITY, AND CAPACITY UTILIZATION1
Seasonally adjusted
Series 1999 2000 1999 2000 1999 2000
Series Q4 Ql Q2 Q3r Q4 Ql Q2 Q3 Q4 Ql Q2 Q3
Output (1992=100) Capacity (percent of 1992 output) Capacity utilization rate (percent)2
1 Total industry 142.1 144.4 147.1 148.5 174.1 176.1 178.1 180.1 81.6 82.0 82.6 82.5
2 Manufacturing 147.6 150.1 153.0 154.5 182.4 184.6 186.9 189.2 80.9 81.3 81.9 81.7
3 Primary processing3 169.2 173.5 178.6 180.3 200.0 203.0 206.9 211.2 84.6 85.4 86.4 85.4 4 Advanced processing4 135.6 137.3 139.0 140.3 171.2 172.7 174.1 175.2 79.2 79.5 79.8 80.1
.5 Durable goods 181.2 186.7 192.9 196.6 223.9 228.5 233.3 238.3 81.0 81.7 82.7 82.5 6 Lumber and products 122.1 122.4 120.3 117.0 146.6 147.0 147.5 147.9 83.3 83.3 81.6 79.1 7 Primary metals 135.2 136.1 137.0 133.4 152.6 153.0 153.3 153.4 88.6 88.9 89.4 87.0 8 Iron and steel 132.8 135.0 136.1 130.6 152.3 152.8 153.1 153.4 87.2 88.4 88.9 85.2 9 Nonferrous 138.1 137.4 138.2 136.8 152.7 153.2 153.4 153.4 90.4 89.7 90.1 89.2
10 Industrial machinery and equipment 228.9 242.2 249.4 257.2 286.8 296.3 304.5 311.1 79.8 81.7 81.9 82.7 11 Electrical machinery 434.5 476.7 535.1 581.1 520.7 552.1 591.7 639.1 83.4 86.3 90.4 90.9 12 Motor vehicles and parts 170.6 171.8 175.9 170.7 205.8 207.0 208.2 209.2 82.9 83.0 84.5 81.6 13 Aerospace and miscellaneous
transportation equipment 95.1 93.7 92.9 93.5 130.6 130.7 130.7 130.4 72.8 71.7 71.1 71.7
14 Nondurable goods 116.2 116.3 116.7 116.3 143.4 143.8 144.1 144.4 81.0 80.9 80.9 80.5 15 Textile mill products 102.8 104.0 103.3 100.1 124.8 124.4 123.9 123.3 82.4 83.6 83.4 81.1 16 Paper and products 118.6 117.6 117.9 114.0 136.8 136.9 137.2 137.5 86.7 85.8 85.9 82.9 17 Chemicals and products 126.2 124.8 125.8 125.7 160.9 161.9 163.0 164.1 78.4 77.1 77.2 76.6 18 Plastics materials 142.5 141.6 140.9 137.6 151.5 151.5 151.6 151.9 94.0 93.5 93.0 90.5 19 Petroleum products 114.6 116.0 118.3 117.4 123.1 123.2 123.2 123.2 93.2 94.1 96.0 95.3
20 Mining 98.9 99.4 100.0 100.6 116.8 116.7 116.5 116.3 84.7 85.2 85.8 86.5 21 Utilities 116.1 117.4 120.7 121.5 130.1 131.2 132.3 133.4 89.2 89.5 91.2 91.1 22 Electric 120.0 120.5 124.3 124.7 128.2 129.5 130.9 132.3 93.6 93.1 94.9 94.2
1973 1975 Previous cycle5 Latest cycle6 1999 2000
High Low High Low High Low Nov. June July Aug.r Sept.r Oct. Nov.p
Capacity utilization rate (percent)2
1 Total industry 89.2 72.6 87.3 71.1 85.4 78.1 81.5 82.7 82.3 82.6 82.5 82.1 81.6
2 Manufacturing 88.5 70.5 86.9 69.0 85.7 76.6 80.9 82.0 81.6 81.7 81.7 81.4 80.6
3 Primary processing3 91.2 68.2 88.1 66.2 88.9 77.7 84.7 86.5 85.6 85.4 85.2 84.8 83.3 4 Advanced processing4 87.2 71.8 86.7 70.4 84.2 76.1 79.1 79.9 79.8 80.2 80.2 79.9 79.7
5 Durable goods 89.2 68.9 87.7 63.9 84.6 73.1 80.9 82.8 82.3 82.6 82.6 81.8 80.8 6 Lumber and products 88.7 61.2 87.9 60.8 93.6 75.5 83.0 80.4 80.3 78.1 79.0 78.1 76.9 7 Primary metals 100.2 65.9 94.2 45.1 92.7 73.7 88.5 89.0 87.3 86.3 87.3 85.2 83.4 8 Iron and steel 105.8 66.6 95.8 37.0 95.2 71.8 87.9 88.5 84.8 84.5 86.2 83.4 79.7 9 Nonferrous 90.8 59.8 91.1 60.1 89.3 74.2 89.4 89.7 90.5 88.5 88.7 87.5 87.9
10 Industrial machinery and equipment 96.0 74.3 93.2 64.0 85.4 72.3 79.6 81.7 82.1 82.9 83.0 83.5 82.7
11 Electrical machinery 89.2 64.7 89.4 71.6 84.0 75.0 82.9 91.5 91.8 90.8 90.2 88.3 86.6 12 Motor vehicles and parts 93.4 51.3 95.0 45.5 89.1 55.9 83.2 84.5 78.1 83.1 83.6 80.5 78.1 13 Aerospace and miscellaneous
transportation equipment 78.4 67.6 81.9 66.6 87.3 79.2 72.9 71.6 72.7 71.7 70.6 71.8 73.4
14 Nondurable goods 87.8 71.7 87.5 76.4 87.3 80.7 81.1 80.9 80.6 80.5 80.4 80.6 80.1 15 Textile mill products 91.4 60.0 91.2 72.3 90.4 77.7 81.5 83.3 82.1 80.6 80.7 80.4 79.2 16 Paper and products 97.1 69.2 96.1 80.6 93.5 85.0 86.6 86.5 83.6 82.3 82.6 85.0 83.6 17 Chemicals and products 87.6 69.7 84.6 69.9 86.2 79.3 79.1 77.1 76.2 76.7 76.9 77.0 76.9 18 Plastics materials 102.0 50.6 90.9 63.4 97.0 74.8 94.8 93.5 92.8 89.1 89.8 89.2 87.9 19 Petroleum products 96.7 81.1 90.0 66.8 88.5 85.1 92.4 96.4 95.0 95.5 95.4 95.5 95.5
20 Mining 94.3 88.2 96.0 80.3 88.0 87.0 85.1 86.2 86.3 86.9 86.3 86.3 86.5 21 Utilities 96.2 82.9 89.1 75.9 92.6 83.4 87.2 91.7 89.5 91.5 92.2 90.2 93.2 22 Electric 99.0 82.7 88.2 78.9 95.0 87.1 93.4 95.0 91.8 95.3 95.6 93.3 95.7
1. Data in this table appear in the Board's G.17 (419) monthly statistical release. The data are also available on the Board's web site, http://www.federalreserve.gov/releases/gl7. The latest historical revision of the industrial production index and the capacity utilization rates was released in December 2000. The recent annual revision is described in an article in the March 2001 issue of the Bulletin. For a description of the methods of estimating industrial production and capacity utilization, see "Industrial Production and Capacity Utilization: Historical Revision and Recent Developments," Federal Reserve Bulletin, vol. 83 (February 1997), pp. 67-92, and the references cited therein. For details about the construction of individual industrial production series, see "Industrial Production: 1989 Developments and Historical Revision," Federal Reserve Bulletin, vol. 76 (April 1990), pp. 187-204.
2. Capacity utilization is calculated as the ratio of the Federal Reserve's seasonally adjusted index of industrial production to the corresponding index of capacity.
3. Primary processing includes textiles; lumber; paper; industrial chemicals; synthetic materials; fertilizer materials; petroleum products; rubber and plastics; stone, clay, and glass; primary metals; and fabricated metals.
4. Advanced processing includes foods; tobacco; apparel; furniture and fixtures; printing and publishing; chemical products such as drugs and toiletries; agricultural chemicals; leather and products; machinery; transportation equipment; instruments; and miscellaneous manufac-tures.
5. Monthly highs, 1978-80; monthly lows, 1982. 6. Monthly highs, 1988-89; monthly lows, 1990-91.
Digitized for FRASER http://fraser.stlouisfed.org/ Federal Reserve Bank of St. Louis

A44 Domestic Nonfinancial Statistics • February 2001
2.13 INDUSTRIAL PRODUCTION Indexes and Gross Value1
Monthly data seasonally adjusted
1992 1999 2000 Group pro- 1999 Group por- avg.
Nov.p tion Nov. Dec. Jan. Feb. Mar. Apr. May June July Aug.r Sept.r Oct. Nov.p
Index (1992 = 100)
MAJOR MARKETS
1 Total index 100.0 139.6 141.9 142.8 143.6 144.3 145.2 146.3 147.2 147.9 147.6 148.6 149.1 148.9 148.6
2 Products 60.5 131.2 131.8 132.7 133.3 134.2 134.4 135.3 135.5 136.0 135.8 136.6 136.9 136.4 136.4 3 Final products 46.3 133.3 133.6 134.4 135.1 135.9 136.0 137.2 137.5 138.3 138.1 139.2 139.4 138.8 139.0 4 Consumer goods, total 29.1 120.8 121.5 122.4 122.1 122.8 122.2 123.2 123.5 124.2 122.9 123.8 124.1 123.0 123.2 5 Durable consumer goods 6.1 158.3 160.4 161.6 162.9 162.6 162.1 164.7 163.8 164.4 158.7 160.0 162.3 157.1 156.0 6 Automotive products 2.6 152.6 155.0 153.3 156.9 154.8 155.3 157.6 157.9 157.8 149.4 153.8 156.2 147.8 146.0 7 Autos and trucks 1.7 167.9 171.1 166.2 171.4 169.0 170.3 173.7 175.7 174.8 160.5 169.8 172.7 159.4 156.1 8 Autos, consumer .9 113.6 117.7 112.0 116.5 116.3 115.1 118.5 119.7 118.1 113.6 120.3 120.5 107.7 103.7 9 Trucks, consumer .7 223.9 226.3 222.1 228.2 223.7 227.3 230.7 233.7 233.2 209.8 221.8 227.1 212.7 209.7
10 Auto parts and allied goods . . . . .9 129.1 130.2 132.8 134.3 132.5 131.9 132.7 130.6 131.6 131.6 129.1 130.7 129.3 129.8 11 Other 3.5 162.9 164.6 168.7 167.6 169.1 167.7 170.6 168.5 169.8 166.7 165.2 167.3 165.2 164.7 12 Appliances, televisions, and air
conditioners 1.0 309.8 326.3 336.5 328.3 336.1 332.3 341.1 334.6 348.2 322.3 325.0 340.5 333.2 338.0 13 Carpeting and furniture .8 127.3 123.2 128.2 129.2 129.7 128.3 131.8 130.8 130.1 131.5 128.6 130.7 129.3 127.2 14 Miscellaneous home goods 1.6 121.0 121.5 122.8 122.7 122.7 122.1 122.7 121.6 120.5 121.3 119.7 118.1 117.3 116.4 15 Nondurable consumer goods 23.0 112.0 112.4 113.3 112.7 113.5 112.9 113.6 114.1 114.8 114.5 115.2 115.2 114.9 115.3 16 Foods and tobacco 10.3 109.2 109.6 109.7 110.3 110.6 110.8 110.9 110.3 110.8 111.0 111.4 110.4 110.4 110.0 17 Clothing 2.4 87.8 86.9 86.8 86.3 87.5 87.2 87.5 86.8 85.1 85.6 84.2 83.3 82.6 82.0 18 Chemical products 4.5 132.7 136.5 137.3 132.9 133.5 134.9 136.5 138.5 139.3 137.4 139.4 140.3 140.4 141.7 19 Paper products 2 .9 106.7 109.3 108.5 109.1 109.6 108.3 108.2 109.0 111.6 112.4 112.4 112.4 113.2 111.3 20 Energy 2.9 114.0 108.3 113.8 113.1 116.2 110.7 113.6 116.0 117.0 114.9 117.1 119.3 117.1 121.7 21 Fuels .8 111.4 110.7 112.1 108.4 111.0 114.9 112.1 113.1 113.4 112.6 113.1 115.8 114.1 116.5 22 Residential utilities 2.1 114.7 106.4 114.0 115.1 118.5 107.4 113.8 117.1 118.5 115.6 119.0 120.7 118.2 124.2
23 Equipment 17.2 153.8 155.3 155.7 158.7 159.8 161.3 162.8 163.1 164.3 166.3 167.9 167.9 168.4 168.7 24 Business equipment 13.2 176.4 179.8 180.6 185.2 187.0 188.9 191.1 191.6 192.8 195.0 197.8 198.9 199.2 199.1 25 Information processing and related 5.4 257.6 270.8 274.9 284.8 289.2 293.5 298.8 302.5 307.0 313.9 322.1 326.4 330.8 334.1 26 Computer and office equipment 1.1 791.2 890.2 930.2 979.1 1,019.5 1,044.0 1,062.0 1,087.8 1,130.8 1.182.8 1,229.0 1,264.1 1,295.8 1,321.2 27 Industrial 4 . 0 135.6 136.4 137.3 140.4 142.1 142.2 142.9 143.4 143.8 144.4 147.7 145.7 146.8 145.5 28 Transit 2.5 134.8 132.5 128.8 130.9 130.6 131.5 131.3 129.0 130.1 127.6 126.8 127.2 121.4 122.2 29 Autos and trucks 1.2 148.3 151.7 147.1 153.8 154.2 154.0 156.5 153.9 152.9 141.5 142.8 144.0 130.6 129.7 30 Other 1.3 137.1 136.0 137.7 138.6 138.5 142.9 146.7 145.8 142.8 148.1 144.8 149.4 151.5 146.9 31 Defense and space equipment 3.3 80.8 79.1 78.5 77.1 75.9 76.0 75.5 75.5 76.3 77.9 76.1 73.7 75.2 77.0 32 Oil and gas well drilling .6 103.3 116.5 120.1 121.1 124.6 126.7 126.7 130.3 130.8 136.2 137.1 132.8 136.5 137.0 33 Manufactured homes .2 159.6 144.1 142.0 138.5 133.8 131.7 127.2 122.9 121.9 116.8 115.5 109.3 96.8 93.2
34 Intermediate products, total 14.2 125.1 126.3 127.4 127.8 128.9 129.5 129.3 129.4 129.0 128.7 128.8 129.1 129.2 128.3 35 Construction supplies 5.3 138.5 140.4 142.2 142.6 143.4 144.6 144.4 143.1 143.4 143.8 142.7 143.2 143.0 141.6 36 Business supplies 8.9 117.2 118.0 118.7 119.0 120.3 120.6 120.4 121.3 120.5 119.8 120.6 120.7 121.1 120.4
37 Materials 39.5 154.5 160.0 161.0 162.0 162.4 164.7 166.1 168.4 169.4 169.0 170.5 171.5 171.7 170.8 38 Durable goods materials 20.8 198.5 207.8 210.6 213.4 215.4 220.0 222.7 227.6 230.3 230.5 233.8 235.9 235.9 233.9 39 Durable consumer parts 4.0 156.9 162.5 163.8 164.3 163.2 164.9 162.2 169.9 165.7 158.3 168.3 169.4 171.0 166.2 40 Equipment parts 7.6 353.0 381.7 392.6 404.2 416.6 434.2 451.9 466.8 486.2 499.9 505.7 513.1 515.7 519.3 41 Other 9.2 131.7 134.4 134.8 135.3 134.8 135.9 135.7 135.9 135.9 135.3 134.7 135.3 134.1 132.2 42 Basic metal materials 3.1 125.9 130.1 131.0 130.7 128.8 131.1 131.9 130.8 130.7 128.5 127.5 128.8 126.6 124.4 43 Nondurable goods materials 8.9 114.3 117.6 116.8 116.2 115.3 115.6 115.2 115.7 115.2 113.9 112.8 112.8 113.8 112.8 44 Textile materials 1.1 100.9 102.0 100.7 100.4 101.9 102.2 101.1 100.9 101.7 97.9 99.3 97.4 97.8 96.5 45 Paper materials 1.8 117.0 119.0 118.4 118.2 116.7 118.1 118.7 117.5 118.1 114.9 112.8 113.8 117.3 115.3 46 Chemical materials 3.9 116.5 121.9 120.1 119.7 118.6 118.6 118.1 119.8 118.4 117.0 116.8 116.2 116.1 115.4 47 Other 2.1 113.7 114.3 116.1 114.6 113.0 113.5 112.6 112.4 112.3 113.7 110.2 111.8 113.5 112.5 48 Energy materials 9.7 103.1 103.3 103.1 102.6 102.1 102.5 103.5 103.3 103.1 102.9 104.2 104.4 103.9 104.9 49 Primary energy 6.3 98.9 99.4 98.5 97.2 96.2 97.7 98.8 98.3 98.4 98.7 98.9 98.7 98.2 98.8 50 Converted fuel materials 3.3 111 .4 111.1 112.5 113.9 114.6 112.3 113.0 113.7 112.4 110.8 115.1 116.7 116.3 118.5
SPECIAL AGGREGATES
51 Total excluding autos and trucks 97.1 139.0 141.3 142.4 143.0 143.8 144.8 145.7 146.7 147.5 147.5 148.4 148.9 149.1 148.8 52 Total excluding motor vehicles and parts 95.1 138.3 140.5 141.5 142.2 143.0 143.9 144.9 145.8 146.5 146.9 147.4 147.9 148.0 147.9 53 Total excluding computer and office
equipment 98.2 134.1 135.9 136.7 137.2 137.8 138.6 139.6 140.4 141.0 140.5 141.4 141.8 141.5 141.1 54 Consumer goods excluding autos and trucks . 2 7 . 4 118.3 118.8 120.0 119.5 120.3 119.6 120.5 120.7 121.5 120.9 121.3 121.5 121.0 121.4 55 Consumer goods excluding energy 26.2 121.6 123.1 123.5 123.2 123.5 123.6 124.4 124.4 125.0 123.9 124.5 124.6 123.7 123.2 56 Business equipment excluding autos and
trucks 12.0 179.7 183.1 184.5 188.9 190.8 193.1 195.2 196.1 197.6 201.5 204.5 205.6 207.7 207.7 57 Business equipment excluding computer and
office equipment 12.1 149.8 150.5 150.3 153.6 154.4 155.7 157.4 157.3 157.6 158.6 160.3 160.6 160.3 159.7 58 Materials excluding energy 29.8 170.6 177.8 179.3 180.8 181.5 184.6 186.0 189.3 190.7 190.3 191.8 193.1 193.6 191.9
Digitized for FRASER http://fraser.stlouisfed.org/ Federal Reserve Bank of St. Louis

Selected Measures A45
2.13 INDUSTRIAL PRODUCTION Indexes and Gross Value1—Continued
Monthly data seasonally adjusted
Group SIC2
code
1992 pro-por-tion
1999 avg.
Apr. May July Aug.' Sept.' Nov.p
Index (1992 = 100)
MAJOR INDUSTRIES
59 Total index 100.0 139.6 141.9 142.8 143.6 144.3 145.2 146.3 147.2 147.9 147.6 148.6 149.1 148.9 148.6
60 Manufacturing 85.4 144.8 147.5 148.4 149.2 149.9 151.3 152.2 153.1 153.8 153.7 154.6 155.2 155.1 154.4 61 Primary processing 26.5 163.3 169.4 170.9 171.9 173.0 175.5 177.1 178.7 180.1 179.4 180.3 181.3 181.7 179.8 62 Advanced processing 58.9 133.6 135.5 135.9 136.8 137.1 137.9 138.5 139.1 139.4 139.5 140.5 140.8 140.6 140.4
63 Durable goods 45.0 175.6 181.0 182.6 185.1 186.3 188.9 191.0 193.0 194.6 194.7 196.9 198.3 197.7 196.9 64 Lumber and products " ' 24 2.0 122.4 121.7 122.8 122.9 122.3 121.9 121.6 120.5 118.7 118.6 115.5 117.0 115.7 114.1 65 Furniture and fixtures 25 1.4 137.0 137.5 138.9 138.9 140.7 139.3 140.7 143.0 141.9 142.6 143.8 145.9 144.3 143.6 66 Stone, clay, and glass
products 32 2.1 131.6 134.2 133.4 132.8 133.6 134.4 132.9 134.2 134.6 136.3 136.1 136.5 136.1 134.4 67 Primary metals 33 3.1 130.4 135.0 136.6 136.3 134.7 137.1 137.8 136.7 136.4 133.9 132.4 134.0 130.8 128.1 68 Iron and steel 331,2 1.7 126.7 133.9 135.4 134.8 133.5 136.9 136.8 135.9 135.5 129.9 129.7 132.3 128.0 122.4 69 Raw steel 331PT .1 116.5 126.4 127.4 126.4 121.7 125.8 127.3 127.1 128.2 126.4 123.9 117.7 115.6 111.0 70 Nonferrous 333-6,9 1.4 135.0 136.5 138.3 138.3 136.4 137.6 139.1 137.9 137.6 138.8 135.7 136.1 134.3 134.9 71 Fabricated metal products . . 34 5.0 131.9 133.6 133.3 134.9 135.8 135.6 135.9 136.2 135.7 136.1 136.3 136.0 135.7 134.6 72 Industrial machinery and
equipment 35 8.0 219.0 228.3 232.8 238.7 242.1 245.8 247.2 249.9 250.9 253.9 257.9 259.9 263.2 262.2 73 Computer and office
equipment 357 1.8 936.6 1,049.0 1,094.0 1,149.5 1,195.9 1,224.7 1,245.1 1,272.3 1,316.2 1,370.4 1,421.6 1,464.2 1,498.8 1.526.2 74 Electrical machinery 36 7.3 399.4 431.7 445.5 460.2 474.8 495.2 516.5 533.8 555.0 571.2 580.0 591.9 595.5 600.9 75 Transportation equipment. . . 37 9.5 131.4 132.0 130.7 132.0 130.7 131.9 132.1 133.6 133.5 128.0 132.4 132.2 130.0 128.8 76 Motor vehicles and parts . 371 4.9 165.8 171.1 169.4 172.7 170.3 172.5 174.1 177.6 176.1 163.1 173.9 175.2 168.9 164.1 77 Autos and light trucks . 371PT 2.6 153.8 157.0 152.2 157.1 155.1 156.0 159.2 161.1 160.1 147.8 156.4 158.8 146.1 142.7 78 Aerospace and
miscellaneous transportation equipment 372-6,9 4.6 98.9 95.2 94.2 93.8 93.5 93.7 92.7 92.3 93.6 94.9 93.5 92.0 93.5 95.5
79 Instruments 38 5.4 119.7 121.3 120.8 120.6 119.7 120.2 121.5 121.3 122.2 122.6 123.3 123.3 122.6 122.8 80 Miscellaneous 39 1.3 127.4 129.8 130.9 131.6 130.9 130.6 130.9 130.7 130.5 132.1 130.8 130.9 131.0 129.8
81 Nondurable goods 40.4 115.4 116.3 116.5 116.0 116.3 116.6 116.7 116.7 116.7 116.3 116.3 116.2 116.6 115.9 82 Foods " ' 20 9.4 112.5 113.2 113.0 113.3 114.1 114.9 114.7 114.2 114.9 115.0 115.1 114.6 114.9 114.6 83 Tobacco products 21 1.6 97.1 96.1 97.8 99.8 97.4 94.3 95.6 95.3 93.8 95.8 96.6 94.5 93.3 91.7 84 Textile mill products 22 1.8 104.0 101.7 103.4 103.6 103.8 104.4 104.4 102.6 103.1 101.4 99.4 99.4 98.9 97.3 85 Apparel products 23 2.2 94.8 94.0 94.0 93.4 94.3 94.1 94.6 93.0 91.2 92.0 90.7 89.7 89.0 88.4 86 Paper and products 26 3.6 117.2 118.4 118.8 117.5 117.4 117.8 118.4 116.5 118.8 114.9 113.3 113.7 117.1 115.3 87 Printing and publishing . . . . 27 6.7 106.8 108.8 108.6 108.9 108.9 109.7 109.1 109.9 109.1 110.0 110.4 110.8 111.3 110.1 88 Chemicals and products . . . . 28 9.9 126.1 127.3 127.0 124.8 124.9 124.9 125.2 126.3 125.9 124.8 125.9 126.4 126.7 126.8 89 Petroleum products 29 1.4 115.3 113.7 115.4 113.7 115.5 118.9 117.2 118.9 118.8 117.0 117.6 117.5 117.6 117.6 90 Rubber and plastic products . 30 3.5 139.7 141.4 142.7 143.2 143.2 143.0 143.5 142.6 143.5 144.4 142.1 141.6 141.2 139.5 91 Leather and products 31 .3 72.9 71.0 70.5 72.1 71.4 70.6 70.0 70.5 69.3 70.0 68.8 69.6 68.2 69.0
92 Mining 6.9 98.0 99.4 98.7 98.6 99.1 100.4 99.9 99.6 100.4 100.5 101.0 100.3 100.2 100.3 93 Metal 10 .5 99.9 98.7 98.6 101.3 99.1 99.7 98.8 95.7 97.5 92.9 95.8 95.2 95.3 93.6 94 Coal 12 1.0 107.8 108.7 108.2 106.8 102.6 110.1 112.6 112.2 113.6 110.3 109.3 107.0 110.2 108.6 95 Oil and gas extraction 13 4.8 92.5 94.2 93.4 93.5 94.0 94.6 94.0 94.3 94.8 95.7 96.3 95.7 95.3 95.7 96 Stone and earth minerals 14 .6 124.9 126.4 126.3 124.9 131.7 133.4 130.4 123.9 127.7 124.4 125.0 124.1 124.1 122.7
97 Utilities 7.7 117.1 113.5 117.4 117.8 119.5 114.7 118.7 121.6 121.7 119.1 122.1 123.4 120.9 125.3 98 Electric 491,493PT 6.2 120.2 119.7 121.2 120.8 121.0 119.7 122.8 125.2 124.8 121.1 126.1 127.0 124.3 128.1 99 Gas 492.493PT 1.6 106.1 92.8 104.1 106.8 113.1 98.3 104.4 108.7 110.5 111.0 108.4 110.6 108.8 114.5
SPECIAL AGGREGATES
100 Manufacturing excluding motor vehicles and parts 80.5 143.6 146.2 147.2 147.9 148.7 150.1 151.0 151.7 152.6 153.2 153.5 154.1 154.4 153.9
101 Manufacturing excluding computer and office equipment 83.6 138.4 140.6 141.2 141.9 142.3 143.6 144.4 145.2 145.8 145.4 146.2 146.6 146.5 145.6
102 Computers, communications equipment, and semiconductors 5.9 777.6 869.9 905.9 955.1 999.4 1,048.5 1,097.8 1,140.2 1,193.1 1,248.0 1,281.6 1.311.9 1,334.0 1.353.6
103 Manufacturing excluding computers and semiconductors 81.1 125.5 126.6 126.9 127.1 127.1 127.8 128.0 128.4 128.4 127.7 128.2 128.4 128.2 127.4
104 Manufacturing excluding computers, communications equipment, and semiconductors 79.5 123.0 124.1 124.3 124.3 124.3 124.9 125.1 125.4 125.3 124.5 124.9 125.1 124.8 123.9
Gross value (billions of 1992 dollars, annual rates)
Major Markets
105 Products, total 2,001.9 2,784.6 2,795.0 2,812.2 2,828.5 2,846.9 2,853.1 2,868.9 2,872.7 2,883.5 2,865.7 2,882.9 2,892.7 2,872.3 2,870.3
106 Final 1,552.1 2,142.0 2,146.0 2,156.4 2,170.2 2,183.5 2,186.3 2,202.8 2,205.6 2,218.6 2,202.8 2,220.5 2,228.6 2,206.6 2,211.0
107 Consumer goods 1,049.6 1,322.9 1,328.0 1,337.2 1,334.8 1,342.3 1,338.5 1,347.2 1,349.8 1,357.8 1,338.7 1,348.7 1,356.2 1,338.3 1.342.0 108 Equipment 502.5 813.1 821.3 822.1 840.3 846.2 854.0 862.2 862.2 867.3 872.8 880.8 880.8 877.8 878.2 109 Intermediate 449.9 642.5 648.1 654.7 657.2 662.3 665.6 665.0 666.0 663.9 661.8 661.5 663.2 664.6 658.5
1. Data in this table appear in the Board's G.17 (419) monthly statistical release. The data are also available on the Board's web site, http://www.federalreserve.gov/releases/gl7. The latest historical revision of the industrial production index and the capacity utilization rates was released in December 2000. The recent annual revision is described in an article in the March 2001 issue of the Bulletin. For a description of the methods of estimating industrial production and capacity utilization, see "Industrial Production and Capacity Utilization:
Historical Revision and Recent Developments," Federal Reserve Bulletin, vol. 83 (February 1997), pp. 67-92, and the references cited therein. For details about the construction of individual industrial production series, see "Industrial Production: 1989 Developments and Historical Revision," Federal Reserve Bulletin, vol. 76 (April 1990), pp. 187-204.
2. Standard industrial classification.
Digitized for FRASER http://fraser.stlouisfed.org/ Federal Reserve Bank of St. Louis

A46 Domestic Nonfinancial Statistics • February 2001
2.14 HOUSING A N D CONSTRUCTION
Monthly figures at seasonally adjusted annual rates except as noted
Item 1997 1998 1999 2000
Item 1997 1998 1999 Jan. Feb. Mar. Apr. May June July Aug. Sept. Oct.
Private residential real estate activity (thousands of units except as noted)
N E W UNITS
1 Permits authorized 1,441 1,612 1,664 1,762 1,661 1,597 1,559 1,511 1,528 1,511 1,486 1,518 1,546 2 One-family 1,062 1,188 1,247 1,317 1,223 1,238 1,164 1,150 1,127 1,117 1,140 1,157 1,191 3 Two-family or more 379 425 417 445 438 359 395 361 401 394 346 361 355 4 Started 1,474 1,617 1,667 1,744 1,822 1,630 1,652 1,591 1,571 1,527 1,519 1,537 1,528 5 One-family 1,134 1,271 1,335 1,361 1,324 1,327 1,310 1,258 1,227 1,201 1,229 1,226 1,225 6 Two-family or more 340 346 332 383 498 303 342 333 344 326 290 311 303 7 Under constniction at end of period1 847 971 993 1,033 1,041 1,031 1,029 1,023 1,024 1,020 1,016 1,011 1,009 8 One-family 555 659 679 712 712 706 703 697 696 691 692 690 693 9 Two-family or more 292 312 314 321 329 325 326 326 328 329 324r 321 316
10 Completed 1,400 1,474 1,636 1,599 1,732 1,728 1,660 1,705 1,545 1,531 1,612 1,569 1,555 11 One-family 1,116 1,160 1,307 1,296 1,382 1,375 1,354 1,377 1,222 1,216 1,266 1,225 1,208 12 Two-family or more 284 315 329 303 350 353 306 328 323 315 346 344 347r
13 Mobile homes shipped 354 374 348 307 291 287 271 265 262 251 249 231 213
Merchant builder activity in one-family units
14 Number sold 804 886 907 927 905 947 865 875 827 914 852 953 928 15 Number for sale at end of period1 287 300 326 321 309 321 305 308 312 311 313 311 317
Price of units sold (thousands of dollars)2
16 Median 146.0 152.5 160.0 163.0 162.3 165.7 163.1 165.0 159.9 168.6 165.0 169.9 174.9 17 Average 176.2 181.9 195.8 200.1 199.6 205.3 207.5 200.1 197.7 202.4 199.3 204.3 218.4
EXISTING UNITS ( o n e - f a m i l y )
18 Number sold 4,382 4,970 5,197 4,450 4,760 5,200 4,880 5,090 5,310 4,820 5,280 5,160 4,960
Price of units sold (thousands of dollars)2
19 Median 121.8 128.4 133.3 132.2 133.7 134.7 136.1 137.6 140.2 143.3 143.2 141.6 138.2 20 Average 150.5 159.1 168.3 168.9 168.1 171.5 173.3 176.0 178.9 177.7 183.0 178.6 177.8
Value of new construction (millions of dollars)3
CONSTRUCTION
21 Total put in place 656,084 710,104 765,719 806,099 816,012 829,517 816,156 811,816 798,860 786,390 802,723 818,021 824,960
22 Private 501,426 550,983 592,037 614.584 629,590 637,743 629,491 629,820 624,383 612,031 617,988 630,529 639,183 23 Residential 289,101 314,058 348,584 365,149 368,745 372,118 368,948 367,653 363,756 347,488 350,489 353,003 360,537 24 Nonresidential 212,325 236,925 243,454 249,435 260,845 265,625 260,543 262,167 260,627 264,543 267,499 277,526 278,646 25 Industrial buildings 36,696 40,464 35,016 33,947 38,538 39,030 38,670 39,814 39,951 42,165 41,552 42,378 44,579 26 Commercial buildings 86,151 95,753 103,759 107,961 115,440 116,030 115,042 113,381 112,834 112,167 115,497 118,807 120,001 27 Other buildings 37,193 39,607 41,279 43,350 45,553 45,808 44,136 45,540 44,559 45,772 46,765 47,458 47,449 28 Public utilities and other 52,287 61,101 63,400 64,177 61,314 64,757 62,695 63,432 63,283 64,439 63,685 68,883 66,617
29 Public 154,657 159,121 173,682 191,515 186,422 191,774 186,665 181,995 174,477 174,359 184,735 187,492 185,777 30 Military 2,561 2,538 2,122 1,782 3,011 2,249 2,180 2,246 2,157 2,102 2,318 2,420 1,873 31 Highway 43,886 48,339 54,447 63,368 53,145 59,007 55,923 51,966 48,148 49,664 52,658 52,874 47,353 32 Conservation and development 5,708 5,421 6,002 6.223 6,975 6,494 5,840 5,363 5,832 4,864 5,614 5,972 6,792 33 Other 102,502 102,823 111,110 120,142 123,291 124,024 122,722 122,420 118,340 117,729 124,145 126,226 129,759
1. Not at annual rates. 2. Not seasonally adjusted. 3. Recent data on value of new construction may not be strictly comparable with data for
previous periods because of changes by the Bureau of the Census in its estimating techniques. For a description of these changes, see Construction Reports (C-30-76-5), issued by the Census Bureau in July 1976.
SOURCE. Bureau of the Census estimates for all series except (1) mobile homes, which are private, domestic shipments as reported by the Manufactured Housing Institute and season-ally adjusted by the Census Bureau, and (2) sales and prices of existing units, which are published by the National Association of Realtors. All back and current figures are available from the originating agency. Permit authorizations are those reported to the Census Bureau from 19,000 jurisdictions beginning in 1994.
Digitized for FRASER http://fraser.stlouisfed.org/ Federal Reserve Bank of St. Louis

Selected Measures A47
2.15 CONSUMER A N D PRODUCER PRICES
Percentage changes based on seasonally adjusted data except as noted
Item
Change from 12 months earlier
Change from 3 months earlier (annual rate) Change from 1 month earlier
Index level, Nov.
2 0 0 0 1
Item 1999 Nov.
2000 Nov.
1999 2000 2 0 0 0
Index level, Nov.
2 0 0 0 1
Item 1999 Nov.
2000 Nov.
Dec. Mar. June Sept. July Aug. Sept. Oct. Nov.
Index level, Nov.
2 0 0 0 1
CONSUMER PRICES 2
(1982-84=100)
1 AH items 2.6 3.4 2.4 6.1 2.6 2.8 . 2 -.1 . 5 .2 .2 174.1
? Food 1.9 2.2 2.2 1.7 2.7 3.9 .5 2 .2 .1 .0 168 .9 3 Energy items 10.6 16.0 7.8 5 0 . 5 6.6 3 . 5 .1 - 2 . 9 3 . 8 .2 .1 129 .0
4 All items less food and energy 2.1 2.6 1.8 3.4 2.2 2.7 .2 .2 .3 .2 .3 183 .0 Commodities .8 .7 - . 6 .3 .0 1.7 .0 - . 1 .5 - . 1 .3 146 .0
6 Services 2.7 3.4 3.1 4.7 3.0 3 . 0 .3 .3 .1 .2 .3 2 0 4 . 2
PRODUCER PRICES (1982=100)
7 Finished goods 3.1 3.7 .9 7.9 2.3 2.0 .1' — ,4R .9 .4 .1 139 .9 8 Consumer foods .4 2.0 - 2 . 0 3.6 2.7 - 2 . 3 - . R - , 8 R .4 .8 .2 138.1
9 Consumer energy 14.8 18.8 5.9 51.8 8.3 8.6 —1.4' 3 .7 1.4 .4 9 9 . 3
10 Other consumer goods 2.9 1.0 1.1 .8 1.0 2.1 A .1 .4 .0 - . 1 155 .0
11 Capital equipment .1 1.1 1.2 .9 1.2 1.7 . R , l r .2 .0 .0 139 .8
Intermediate materials 17 Excluding foods and feeds 3.1 4.4 3.6 9.5 3 .1 3.1 ,4r - , 3 R .7 .2 - . 2 131 .5
13 Excluding energy 1.5 1.7 2.1 4.2 2.7 .3 .2 - . 1 .0 .0 - . 1 136 .7
Crude materials 14 Foods - 2 . 8 1.0 - 3 . 6 21.5 -10 .4 - 1 4 . 0 - 2 . 9 - 4 . 5 3 . 9 3 .5 1.3 100 .5 15 Energy 47.8 36.3 - 2 7 . 9 84.9 163.6 11.8 - 2 . 3 R -2.1' 8.1 4 . 6 - 4 . 1 134 .8
16 Other 9.5 - 3 . 4 26.2 9.9 -10 .7 -10 .5 - 1 . 6 R — 1.4r .3 - . 6 - 2 . 3 137 .7
1. Not seasonally adjusted. SOURCE. U.S. Department of Labor, Bureau of Labor Statistics. 2. Figures for consumer prices are for all urban consumers and reflect a rental-equivalence
measure of homeownership.
Digitized for FRASER http://fraser.stlouisfed.org/ Federal Reserve Bank of St. Louis

A48 Domestic Nonfinancial Statistics • February 2001
2.16 GROSS DOMESTIC PRODUCT A N D INCOME
Billions of current dollars except as noted; quarterly data at seasonally adjusted annual rates
Account 1997 1998 1999 1999 2000
Account 1997 1998 1999
Q3 Q4 Ql Q2 Q3r
GROSS DOMESTIC PRODUCT
1 Total 8318.4 8,790.2 9,299.2 9,340.9 9,559.7 9,752.7 9,945.7 10,039.4
By source 2 Personal consumption expenditures 5,529.3 5,850.9 6,268.7 6,319.9 6,446.2 6,621.7 6,706.3 6,810.8 3 Durable goods 642.5 693.9 761.3 767.2 787.6 826.3 814.3 824.7 4 Nondurable goods 1.641.6 1,707.6 1,845.5 1,860.0 1,910.2 1,963.9 1,997.6 2,031.5 5 Services 3,245.2 3,449.3 3,661.9 3,692.7 3,748.5 3,831.6 3,894.4 3,954.6
6 Gross private domestic investment 1,390.5 1,549.9 1,650.1 1,659.1 1,723.7 1,755.7 1,852.6 1,869.3 7 Fixed investment 1,327.7 1,472.9 1,606.8 1,622.4 1,651.0 1,725.8 1,780.5 1,803.0 8 Nonresidential 999.4 1,107.5 1,203.1 1,216.8 1,242.2 1,308.5 1,359.2 1,390.6 9 Structures 255.8 283.2 285.6 281.2 290.4 308.9 315.1 330.1
10 Producers' durable equipment 743.6 824.3 917.4 935.6 951.8 999.6 1,044.1 1,060.5 11 Residential structures 328.2 365.4 403.8 405.6 408.8 417.3 421.3 412.4
12 Change in business inventories 62.9 77.0 43.3 36.7 72.7 29.9 72.0 66.4 13 Nonfarm 60.0 76.4 43.6 42.0 71.8 32.4 72.2 67.5
14 Net exports of goods and services - 8 9 . 3 -151 .5 -254 .0 -280 .5 -299 .1 -335 .2 -355 .4 -389 .5 15 Exports 966.4 966.0 990.2 999.5 1,031.0 1,051.9 1,092.9 1,130.8 16 Imports 1.055.8 1,117.5 1,244.2 1,280.0 1,330.1 1,387.1 1,448.3 1,520.3
17 Government consumption expenditures and gross investment 1,487.9 1,540.9 1,634.4 1,642.4 1,688.8 1,710.4 1,742.2 1,748.8 18 Federal 538.2 540.6 568.6 570.4 591.6 580.1 604.5 594.2 19 State and local 949.7 1,000.3 1,065.8 1,072.1 1,097.3 1,130.4 1,137.7 1,154.6
By major type of product 20 Final sales, total 8,255.5 8,713.2 9,255.9 9,304.2 9,486.9 9,722.8 9,873.7 9,973.1 21 Goods 3,082.5 3,239.3 3,467.0 3,490.6 3,566.0 3,680.3 3,734.1 3,776.5 22 Durable 1,436.2 1,532.3 1,651.1 1,669.4 1,701.8 1,773.7 1,809.6 1,830.6 23 Nondurable 1,646.4 1,707.1 1,815.8 1,821.1 1,864.1 1,906.6 1,924.5 1,945.9 24 Services 4,442.1 4.673.0 4,934.6 4,965.2 5,050.3 5,135.2 5,231.4 5,281.6 25 Structures 730.9 800.9 854.3 848.5 870.7 907.4 908.2 915.0
26 Change in business inventories 62.9 77.0 43.3 36.7 72.7 29.9 72.0 66.4 27 Durable goods 33.1 45.8 27.2 27.6 47.5 20.7 48.3 39.2 28 Nondurable goods 29.8 31.2 16.1 9.1 25.2 9.2 23.7 27.2
M E M O 29 Total GDP in chained 1996 dollars 8,159.5 8,515.7 8,875.8 8,905.8 9,084.1 9,191.8 9,318.9 9,369.5
NATIONAL INCOME
30 Total 6,618.4 7,038.1 7,469.7 7,493.1 7,680.7 7,833.5 7,983.2 8,088.5
31 Compensation of employees 4,651.3 4,984.2 5,299.8 5,340.9 5,421.1 5,512.2 5,603.5 5,679.6 32 Wages and salaries 3.886.0 4,192.8 4,475.1 4,512.2 4,583.5 4,660.4 4,740.1 4,804.9 33 Government and government enterprises 664.3 692.7 724.4 727.5 734.5 749.9 760.2 765.4 34 Other 3,221.7 3,500.1 3,750.7 3,784.7 3,849.0 3,910.5 3,980.0 4,039.5 35 Supplement to wages and salaries 765.3 791.4 824.6 828.7 837.7 851.8 863.3 874.7 36 Employer contributions for social insurance 289.9 305.9 323.6 325.9 330.3 337.8 342.9 347.1 37 Other labor income 475.4 485.5 501.0 502.8 507.4 514.0 520.5 527.6
38 Proprietors' income1 581.2 620.7 663.5 659.7 689.6 693.9 709.5 724.8 39 Business and professional1 551.5 595.2 638.2 644.2 657.9 674.8 688.1 693.1 40 Farm1 29.7 25.4 25.3 15.5 31.7 19.1 21.5 31.7
41 Rental income of persons" 128.3 135.4 143.4 136.6 146.2 145.6 140.8 138.1
42 Corporate profits' 833.8 815.0 856.0 842.0 893.2 936.3 963.6 970.3 43 Profits before tax3 792.4 758.2 823.0 819.0 870.7 920.7 942.5 945.1 44 Inventory valuation adjustment 8.4 17.0 - 9 . 1 -19 .7 - 1 9 . 2 - 2 5 . 0 —13.6 - 4 . 5 45 Capital consumption adjustment 32.9 39.9 42.1 42.7 41.6 40.6 34.7 29.7
46 Net interest 423.9 482.7 507.1 513.8 530.6 545.4 565.9 575.7
1. With inventory valuation and capital consumption adjustments. 2. With capital consumption adjustment.
3. For after-tax profits, dividends, and the like, see table 1.48. SOURCE. U.S. Department of Commerce, Survey of Current Business.
Digitized for FRASER http://fraser.stlouisfed.org/ Federal Reserve Bank of St. Louis

Selected Measures A49
2.17 PERSONAL INCOME AND SAVING
Billions of current dollars except as noted; quarterly data at seasonally adjusted annual rates
Account 1997 1998 1999
1999 2 0 0 0
Account 1997 1998 1999
Q 3 Q 4 Ql Q2 Q3R
PERSONAL INCOME AND SAVING
1 Total personal income 6 , 9 3 7 . 0 7 , 3 9 1 . 0 7 , 7 8 9 . 6 7 , 8 2 8 . 5 7 , 9 7 2 . 3 8 , 1 0 5 . 8 8 , 2 4 2 . 1 8 , 3 4 9 . 0
7 Wage and salary disbursements 3 , 8 8 8 . 9 4 , 1 9 0 . 7 4 , 4 7 0 . 0 4 , 5 0 7 . 0 4 , 5 7 8 . 3 4 , 6 6 0 . 4 4 , 7 4 0 . 1 4 , 8 0 4 . 9 3 Commodity-producing industries 9 7 5 . 1 1 ,038 .6 1 ,089.2 1 ,097 .8 1 ,111 .2 1 ,130 .9 1 ,147.1 1 ,161.4
4 Manufacturing 7 1 8 . 4 7 5 6 . 6 7 8 2 . 4 7 8 9 . 0 7 9 5 . 1 8 0 2 . 8 8 1 3 . 1 8 2 1 . 4 Distributive industries 8 7 9 . 6 9 4 9 . 1 1 ,020 .3 1 ,029 .9 1 ,049 .4 1 ,070 .9 1 ,095.7 1,118.1
6 Service industries 1 ,369 .9 1 ,510.3 1 ,636 .0 1 ,651 .8 1 ,683 .2 1 ,708 .6 1 ,737.2 1 ,760.1 7 Government and government enterprises 6 6 4 . 3 6 9 2 . 7 7 2 4 . 4 7 2 7 . 5 7 3 4 . 5 7 4 9 . 9 7 6 0 . 2 7 6 5 . 4
8 Other labor income 4 7 5 . 4 4 8 5 . 5 5 0 1 . 0 5 0 2 . 8 5 0 7 . 4 5 1 4 . 0 5 2 0 . 5 5 2 7 . 6 <3 Proprietors' income' 5 8 1 . 2 6 2 0 . 7 6 6 3 . 5 6 5 9 . 7 6 8 9 . 6 6 9 3 . 9 7 0 9 . 5 7 2 4 . 8
in Business and professional 5 5 1 . 5 5 9 5 . 2 6 3 8 . 2 6 4 4 . 2 6 5 7 . 9 6 7 4 . 8 6 8 8 . 1 693 .1 11 Farm 29 .7 2 5 . 4 2 5 . 3 15.5 31 .7 19.1 2 1 . 5 31 .7 n Rental income of persons" 128.3 135.4 143.4 136 .6 146.2 145 .6 140.8 138.1 n Dividends 3 3 4 . 9 3 5 1 . 1 3 7 0 . 3 3 7 3 . 5 3 8 0 . 2 3 8 6 . 9 3 9 2 . 6 3 9 9 . 7 14 Personal interest income 8 6 4 . 0 9 4 0 . 8 9 6 3 . 7 9 6 9 . 4 9 8 9 . 0 1 ,011 .6 1 ,031.3 1 ,042 .9 15 Transfer payments 9 6 2 . 2 9 8 3 . 0 1 ,016.2 1 ,020 .3 1 ,027.4 1 ,046 .9 1 ,066.1 1 ,074.2 16 Old age survivors, disability, and health insurance benefits 5 6 5 . 8 5 7 8 . 0 5 8 8 . 0 5 8 9 . 7 5 9 2 . 8 6 0 7 . 9 6 2 4 . 3 6 2 7 . 2
17 LESS: Personal contributions for social insurance 2 9 7 . 9 3 1 6 . 2 3 3 8 . 5 3 4 1 . 0 3 4 5 . 9 3 5 3 . 4 3 5 8 . 8 363 .1
18 EQUALS: Personal income 6 , 9 3 7 . 0 7 , 3 9 1 . 0 7 , 7 8 9 . 6 7 , 8 2 8 . 5 7 , 9 7 2 . 3 8 , 1 0 5 . 8 8 ,242 .1 8 , 3 4 9 . 0
19 LESS: Personal tax and nontax payments 9 6 8 . 8 1 ,070 .9 1 ,152 .0 1 ,164 .0 1 ,197.3 1 ,239 .3 1 ,277.2 1,308.1
2 0 EQUALS: Disposable personal income 5 , 9 6 8 . 2 6 , 3 2 0 . 0 6 , 6 3 7 . 7 6 , 6 6 4 . 5 6 , 7 7 5 . 0 6 , 8 6 6 . 5 6 , 9 6 4 . 9 7 , 0 4 0 . 9
21 LESS: Personal outlays 5 , 7 1 5 . 3 6 , 0 5 4 . 7 6 ,490 .1 6 , 5 4 3 . 3 6 , 6 7 4 . 1 6 , 8 5 5 . 6 6 , 9 4 4 . 3 7 , 0 5 4 . 7
2 2 EQUALS: Personal saving 2 5 2 . 9 2 6 5 . 4 147 .6 121.1 101.0 11.0 2 0 . 6 - 1 3 . 8
MEMO Per capita (chained 1996 dollars)
33,153.5 R 3 3 , 4 8 5 . 6 33 ,874.7 R 3 3 , 9 8 4 . 3 Gross domestic product 3 0 , 4 3 4 . 4 3 1 , 4 7 4 . 2 3 2 , 5 1 2 . 4 32 ,586 .0 R 33,153.5 R 3 3 , 4 8 5 . 6 33 ,874.7 R 3 3 , 9 8 4 . 3 24 Personal consumption expenditures 2 0 , 2 3 0 . 9 2 0 , 9 8 8 . 5 2 1 , 9 0 0 . 7 2 2 , 0 0 4 . 4 2 2 , 2 6 6 . 4 22 ,635.5 R 22 ,757 .7 R 2 2 , 9 5 9 . 1 2 5 Disposable personal income 2 1 , 8 3 8 . 0 2 2 , 6 7 2 . 0 2 3 , 1 9 1 . 0 2 3 , 2 0 3 . 0 2 3 , 4 0 4 . 0 2 3 , 4 7 2 . 0 2 3 , 6 3 9 . 0 2 3 , 7 3 2 . 0
2 6 Saving rate (percent) 4 .2 4 .2 2 .2 1.8 1.5 2 .3 — 2
GROSS SAVING
27 Gross saving 1 , 5 0 2 . 3 1 ,654 .4 1 , 7 1 7 . 6 1 , 7 1 6 . 8 1 , 7 4 6 . 3 1 , 7 7 7 . 0 1 ,844 .5 1 , 8 5 4 . 7
2 8 Gross private saving 1,343.7 1 ,375.7 1 ,343.5 1 ,321.1 1 ,331.4 1 ,279 .2 1 ,328 .8 1 ,319.2
7 9 Personal saving 2 5 2 . 9 2 6 5 . 4 147 .6 121.1 101 .0 11.0 2 0 . 6 - 1 3 . 8 30 Undistributed corporate profits 2 6 1 . 3 2 1 8 . 9 2 2 9 . 4 2 1 4 . 0 2 4 1 . 7 2 6 2 . 7 2 7 8 . 5 2 7 9 . 6 31 Corporate inventory valuation adjustment 8.4 17.0 - 9 . 1 - 1 9 . 7 - 1 9 . 2 - 2 5 . 0 - 1 3 . 6 - 4 . 5
Capital consumption allowances 731 .1 7 5 0 . 0 37 Corporate 5 8 1 . 5 6 2 4 . 3 6 7 6 . 9 6 8 7 . 7 6 9 4 . 8 7 1 1 . 5 731 .1 7 5 0 . 0
3 3 Noncorporate 2 5 0 . 9 2 6 5 . 1 2 8 4 . 5 2 9 3 . 1 2 8 8 . 7 2 9 4 . 1 2 9 8 . 7 3 0 3 . 3
3 4 Gross government saving 158.6 2 7 8 . 7 3 7 4 . 1 3 9 5 . 7 4 1 4 . 9 4 9 7 . 7 5 1 5 . 7 5 3 5 . 5 35 Federal 3 3 . 4 137.4 2 1 7 . 3 2 4 0 . 6 2 3 8 . 4 3 3 3 . 0 3 3 9 . 9 3 5 4 . 1 3 6 Consumption of fixed capital 8 6 . 8 88 .4 9 2 . 8 9 3 . 4 9 5 . 0 9 7 . 2 9 8 . 9 100 .8 37 Current surplus or deficit ( —), national accounts - 5 3 . 3 4 9 . 0 124.4 147.3 143 .3 2 3 5 . 8 2 4 0 . 9 2 5 3 . 3 38 State and local 125.2 141.3 156.8 155.1 176 .6 164 .7 175 .8 181.4 39 Consumption of fixed capital 9 4 . 2 9 9 . 5 106.8 107.7 109.9 112 .7 115 .6 118.2 4 0 Current surplus or deficit ( —), national accounts 3 1 . 0 41 .7 5 0 . 0 4 7 . 4 6 6 . 6 5 2 . 0 60 .1 6 3 . 2
4 1 Gross investment 1 , 5 3 2 . 1 1 , 6 2 9 . 6 1 , 6 4 5 . 6 1 , 6 2 7 . 3 1 , 6 7 8 . 5 1 , 6 9 9 . 3 1 , 7 7 1 . 9 1 , 7 5 2 . 8
4? Gross private domestic investment 1 ,390 .5 1 ,549 .9 1 .650.1 1,659.1 1 ,723 .7 1 ,755.7 1 ,852 .6 1 ,869.3 4 3 Gross government investment 2 6 4 . 6 2 7 8 . 8 3 0 8 . 7 3 0 8 . 0 3 2 4 . 4 3 3 4 . 2 3 3 1 . 9 3 3 3 . 6 4 4 Net foreign investment - 1 2 3 . 1 - 1 9 9 . 1 - 3 1 3 . 2 - 3 3 9 . 8 - 3 6 9 . 6 - 3 9 0 . 7 - 4 1 2 . 5 - 4 5 0 . 1
4 5 Statistical discrepancy 2 9 . 7 - 2 4 . 8 - 7 1 . 9 - 8 9 . 5 - 6 7 . 8 - 7 7 . 7 - 7 2 . 5 -101.8
1. With inventory valuation and capital consumption adjustments. SOURCE. U.S. Department of Commerce, Survey of Current Business. 2. With capital consumption adjustment.
Digitized for FRASER http://fraser.stlouisfed.org/ Federal Reserve Bank of St. Louis
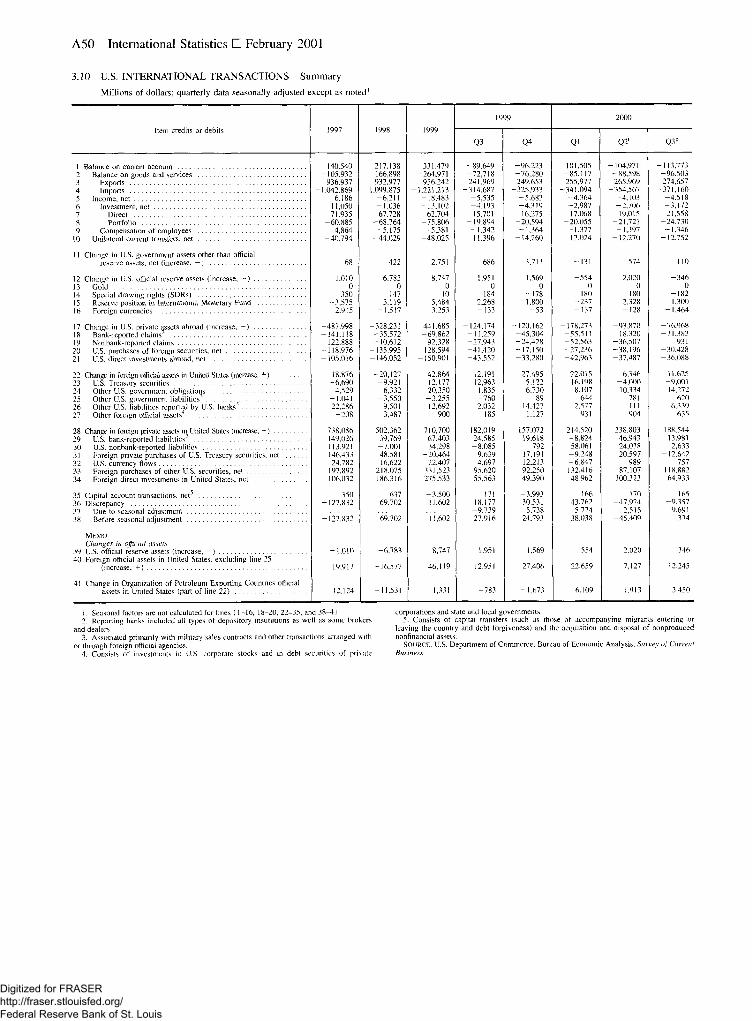
A50 International Statistics • February 2001
3.10 U.S. INTERNATIONAL TRANSACTIONS Summary
Millions of dollars; quarterly data seasonally adjusted except as noted1
Item credits or debits 1997 1998 1999 1999 2000
Item credits or debits 1997 1998 1999
Q3 Q4 Ql Q2r Q3P
1 Balance on current account -140.540 -217,138 -331,479 -89,649 -96,223 -101,505 -104,971 -113,773 ? Balance on goods and services -105.932 -166,898 -264,971 -72,718 -76 ,280 -85,117 -88,598 -96,503 3 Exports 936,937 932,977 956,242 241,969 249,653 255,977 265,969 274,657 4 Imports -1,042,869 -1,099,875 -1,221,213 -314,687 -325,933 -341,094 -354,567 -371,160 5 Income, net 6.186 -6,211 -18,483 -5 ,535 -5 ,683 -4 ,364 -4 ,103 -4 ,518 6 Investment, net 11,050 -1 ,036 -13,102 -4 ,193 -4 ,319 -2 ,987 -2 ,706 -3 ,172 7 Direct 71,935 67,728 62,704 15,701 16,275 17,068 19,015 21,558 8 Portfolio -60,885 -68,764 -75,806 -19,894 -20,594 -20.055 -21,721 -24,730 9 Compensation of employees -4 ,864 -5 ,175 -5 ,381 -1 ,342 -1 ,364 -1 ,377 -1 ,397 -1 ,346
10 Unilateral current transfers, net -40 ,794 -44,029 -48 ,025 -11 ,396 -14 ,260 -12 ,024 -12 .270 -12,752
11 Change in U.S. government assets other than official 110 reserve assets, net (increase, —) 68 - 4 2 2 2,751 - 6 8 6 3,711 - 1 3 1 - 5 7 4 110
12 Change in U.S. official reserve assets (increase, - ) -1 ,010 -6 ,783 8,747 1,951 1,569 - 5 5 4 2.020 - 3 4 6 13 Gold 0 0 0 0 0 0 0 0 14 Special drawing rights (SDRs) - 3 5 0 - 1 4 7 10 - 1 8 4 - 1 7 8 - 1 8 0 - 1 8 0 - 1 8 2 15 Reserve position in International Monetary Fund -3 ,575 -5 ,119 5,484 2,268 1,800 - 2 3 7 2,328 1,300 16 Foreign currencies 2.915 -1 ,517 3,253 - 1 3 3 - 5 3 - 1 3 7 - 1 2 8 -1 ,464
17 Change in U.S. private assets abroad (increase, —) -487.998 -328,231 -441,685 -124,174 -120,162 -178,273 -93,870 -76.968 18 Bank-reported claims' -141.118 -35,572 -69,862 -11,259 -45,304 -55,511 18,320 -11,383 19 Nonbank-reported claims -122,888 -10,612 -92,328 -27,943 -24.428 -52,563 -36,507 931 20 U.S. purchases of foreign securities, net -118,976 -135,995 -128,594 -41 ,420 -17,150 -27,236 -38,196 -30,428 21 U.S. direct investments abroad, net -105,016 -146,052 -150,901 -43,552 -33 ,280 -42,963 -37,487 -36,088
22 Change in foreign official assets in United States (increase, +) 18,876 -20,127 42,864 12,191 27,495 22,015 6.346 11,625 23 U.S. Treasury securities -6 ,690 -9 .921 12,177 12,963 5,122 16,198 -4 ,000 -9,001 24 Other U.S. government obligations 4,529 6,332 20,350 1,835 6,730 8,107 10.334 14,272 25 Other U.S. government liabilities' -1 ,041 -3 ,550 -3 ,255 - 7 6 0 89 - 6 4 4 - 7 8 1 - 6 2 0 26 Other U.S. liabilities reported by U.S. banks3 22,286 -9 ,501 12,692 -2 ,032 14,427 -2 ,577 - 1 1 1 6,339 27 Other foreign official assets4 - 2 0 8 -3 ,487 900 185 1,127 931 904 635
28 Change in foreign private assets in United States (increase, +) 738.086 502,362 710,700 182,019 157.072 214.520 238.803 188,544 29 U.S. bank-reported liabilities" 149,026 39,769 67,403 24,585 19,618 -8 ,824 46,943 13.981 30 U.S. nonbank-reported liabilities 113,921 -7 ,001 34,298 -8 .085 792 58,061 24,038 2,633 31 Foreign private purchases of U.S. Treasury securities, net 146,433 48,581 -20,464 9,639 -17,191 -9 ,248 -20,597 -12,642 3? U.S. currency flows 24,782 16,622 22,407 4,697 12,213 -6 ,847 989 757 33 Foreign purchases of other U.S. securities, net 197,892 218,075 331,523 95,620 92,250 132,416 87,107 118,882 34 Foreign direct investments in United States, net 106.032 186,316 275,533 55,563 49,390 48,962 100,323 64,933
35 Capital account transactions, net5 350 637 -3 ,500 171 -3 ,993 166 170 165 36 Discrepancy -127,832 69,702 11,602 18,177 30,531 43,762 -47,924 -9 .357 37 Due to seasonal adjustment -9 ,739 5,738 5,724 -2 ,515 -9 ,691 38 Before seasonal adjustment -127.832 69.702 11,602 27,916 24,793 38,038 -45,409 334
M E M O Changes in official assets
- 3 4 6 39 U.S. official reserve assets (increase, —) -1 ,010 -6 ,783 8,747 1,951 1,569 - 5 5 4 2,020 - 3 4 6 40 Foreign official assets in United States, excluding line 25
(increase, +) 19,917 -16,577 46,119 12,951 27.406 22,659 7,127 12,245
41 Change in Organization of Petroleum Exporting Countries official 3,450 assets in United States (part of line 22) 12.124 -11,531 1,331 - 7 8 3 -1 ,673 6.109 1,913 3,450
1. Seasonal factors are not calculated for lines 11-16, 18-20, 22-35, and 38—4-1. 2. Reporting banks included all types of depository institutions as well as some brokers
and dealers. 3. Associated primarily with military sales contracts and other transactions arranged with
or through foreign official agencies. 4. Consists of investments in U.S. corporate stocks and in debt securities of private
corporations and state and local governments. 5. Consists of capital transfers (such as those of accompanying migrants entering or
leaving the country and debt forgiveness) and the acquisition and disposal of nonproduced nonfinancial assets.
SOURCE. U.S. Department of Commerce, Bureau of Economic Analysis, Swrvev of Current Business.
Digitized for FRASER http://fraser.stlouisfed.org/ Federal Reserve Bank of St. Louis

Summary Statistics A51
3.11 U.S. FOREIGN TRADE1
Millions of dollars; monthly data seasonally adjusted
Item 1997 1998 1999
2000
Item 1997 1998 1999
Apr.r May r June' July' Aug. ' Sept. Oct.p
1 Goods and services, balance -105 ,932 - 1 6 6 , 8 9 8 -264 ,971 - 2 9 , 1 7 1 - 2 9 , 6 0 4 - 2 9 , 8 2 6 - 3 1 , 8 2 4 - 3 0 , 0 5 9 - 3 3 , 7 4 1 - 3 3 , 1 8 4 2 Merchandise -196 ,665 - 2 4 6 , 8 5 4 - 3 4 5 , 5 5 9 - 3 6 , 8 9 4 - 3 6 , 4 7 5 - 3 6 , 8 6 2 - 3 8 , 5 2 4 - 3 6 , 6 8 4 - 3 9 , 3 2 9 - 3 9 , 4 8 8 3 Services 90,733 79,956 80,588 7,723 6,871 7,036 6,700 6,625 5,588 6,304
4 Goods and services, exports 936,937 932,977 956,242 87,606 87,074 91,288 89,655 92,868 92,654 91,231 5 Merchandise 679,702 670,324 684,358 62,566 62,749 66,468 65,096 67,973 67,836 66,431 6 Services 257,235 262,653 271,884 25,040 24,325 24,820 24,559 24,895 24,818 24,800
7 Goods and services, imports 1,042,869 1,099,875 1,221,213 - 1 1 6 , 7 7 7 -116 ,678 - 1 2 1 , 1 1 4 - 1 2 1 , 4 7 9 - 1 2 2 , 9 2 7 - 1 2 6 , 3 9 5 - 1 2 4 , 4 1 5 8 Merchandise 876,367 917,178 1,029,917 - 9 9 , 4 6 0 - 9 9 , 2 2 4 - 1 0 3 , 3 3 0 - 1 0 3 , 6 2 0 - 1 0 4 , 6 5 7 - 1 0 7 , 1 6 5 - 1 0 5 , 9 1 9 9 Services 166,502 182,697 191,296 - 1 7 , 3 1 7 - 1 7 , 4 5 4 - 1 7 , 7 8 4 - 1 7 , 8 5 9 - 1 8 , 2 7 0 - 1 9 , 2 3 0 - 1 8 , 4 9 6
1. Data show monthly values consistent with quarterly figures in the US. balance of SOURCE. FT900, US. Department of Commerce, Bureau of the Census and Bureau of payments accounts. Economic Analysis.
3.12 U.S. RESERVE ASSETS Millions of dollars, end of period
Asset 1997 1998 1999
2000
Asset 1997 1998 1999
May June July Aug. Sept. Oct. Nov. D e c ?
1 Total 69,954 81,761° 71,516 67,160 67,955° 66,516 65 ,333 66,256 65,257 65,523 67,647
2 Gold stock1 11,047° 11,046° 11,048° 11,048 11,046° 11,046 11,046 11,046 11,046 11,046 11,046 3 Special drawing rights2'3 10,027 10,603 10,336 10,310 10,444 10,257 10,371 10,316 10,169 10,369 10,539 4 Reserve position in International Monetary
Fund2 18,071 24,111 17,950 15,373 15,428 15,083 13,798 13,685 13,528 13,491 14,824 5 Foreign currencies4 30,809 36,001 32,182 30,429 31,037 30,130 30,118 31,209 30,514 30,617 31,238
1. Gold held "under earmark" at Federal Reserve Banks for foreign and international accounts is not included in the gold stock of the United States; see table 3.13, line 3. Gold stock is valued at $42.22 per fine troy ounce.
2. Special drawing rights (SDRs) are valued according to a technique adopted by the International Monetary Fund (IMF) in July 1974. Values are based on a weighted average of exchange rates for the currencies of member countries. From July 1974 through December 1980, sixteen currencies were used; since January 1981, five currencies have been used. U.S.
SDR holdings and reserve positions in the IMF also have been valued on this basis since July 1974.
3. Includes allocations of SDRs by the International Monetary Fund on Jan. 1 of the year indicated, as follows: 1970—$867 million; 1971—$717 million; 1972—$710 million; 1979— $1,139 million; 1980—$1,152 million; 1981—$1,093 million; plus net transactions in SDRs.
4. Valued at current market exchange rates.
3.13 FOREIGN OFFICIAL ASSETS HELD AT FEDERAL RESERVE BANKS1
Millions of dollars, end of period
Asset 1997 1998 1999
2000
Asset 1997 1998 1999
May June July Aug. Sept. Oct. Nov. Dec.p
1 Deposits 457 167 71 110 104 76 78 139 115 104 215
Held in custody 2 U.S. Treasury securities2 620,885 607,574 632,482 623,553 627,081 624,177 628,001 611,641 595,591 591,071 594,094 3 Earmarked gold3 10,763 10,343 9,933 9,711 9,688 9,688 9,674 9,620 9,565 9,505 9,451
1. Excludes deposits and U.S. Treasury securities held for international and regional 3. Held in foreign and international accounts and valued at $42.22 per fine troy ounce; not organizations. included in the gold stock of the United States.
2. Marketable U.S. Treasury bills, notes, and bonds and nonmarketable U.S. Treasury securities, in each case measured at face (not market) value.
Digitized for FRASER http://fraser.stlouisfed.org/ Federal Reserve Bank of St. Louis

A52 International Statistics • February 2001
3.15 SELECTED U.S. LIABILITIES TO FOREIGN OFFICIAL INSTITUTIONS Millions of dollars, end of period
Item 1998 1999 2000
Item 1998 1999
Apr.r Mayr Juner Julyr Aug.1" Sept. Oct.P
1 Total1 759,928 806,288 834,154 826,302 836,075 846,739 849,469 848,840 849,860
By type 2 Liabilities reported by banks in the United States" 125.883 138.817 137,724 135,802 136,129 139,627 136,989 143,010 145,902 3 U.S. Treasury bills and certificates' 134,177 156,177 157,607 148,820 157,190 160,093 159,781 155,498 155,101
U.S. Treasury bonds and notes 4 Marketable 432,127 422,266 436,640 435,235 433,823 433,184 433,633 427,007 419,857 5 Nonmarketable4 6,074 6,111 5,770 5,808 5,740 5,180 5,213 5.247 5,280 6 U.S. securities other than U.S. Treasury securities5 61,667 82,917 96,413 100,637 103,193 108,655 113,853 118,078 123,720
By area 7 Europe1 256,026 244,805 249,685 250,306 253,416 257,712 255,635 257.498 263,601 8 Canada 10,552 12,503 13,338 13,027 13,542 13,728 12,992 13,121 12,932 9 Latin America and Caribbean 79,503 73,518 72,407 69,508 71,220 73,344 76,347 77,542 77.500
10 Asia 400,631 463,673 486,133 482,134 485,424 487,417 490,110 486,890 481,344 11 Africa 10,059 7,523 8,024 7,709 7,849 8,656 8,707 8,466 8,323 12 Other countries 3,157 4,266 4,567 3,618 4,624 5,882 5,678 5,323 6,160
1. Includes the Bank for International Settlements. 2. Principally demand deposits, time deposits, bankers acceptances, commercial paper,
negotiable time certificates of deposit, and borrowings under repurchase agreements. 3. Includes nonmarketable certificates of indebtedness and Treasury bills issued to official
institutions of foreign countries. 4. Excludes notes issued to foreign official nonreserve agencies. Includes current value of
zero-coupon Treasury bond issues to foreign governments as follows: Mexico, beginning March 1988, 20-year maturity issue and beginning March 1990, 30-year maturity issue;
Venezuela, beginning December 1990, 30-year maturity issue; Argentina, beginning April 1993, 30-year maturity issue.
5. Debt securities of U.S. government corporations and federally sponsored agencies, and U.S. corporate stocks and bonds.
SOURCE. Based on U.S. Department of the Treasury data and on data reported to the department by banks (including Federal Reserve Banks) and securities dealers in the United States, and on the 1994 benchmark survey of foreign portfolio investment in the United States.
3.16 LIABILITIES TO, AND CLAIMS ON, FOREIGNERS Reported by Banks in the United States' Payable in Foreign Currencies Millions of dollars, end of period
Item 1996 1997 1998 1999 2000
Item 1996 1997 1998 Dec. Mar. Juner Sept.
1 Banks' liabilities 103,383 117,524 101,125 88.537 85,649 85,842 78,872 2 Banks' claims 66,018 83,038 78,162 67.365 63,492 67,862 60,355 3 Deposits 22,467 28.661 45.985 34.426 32,967 31,224 25,847 4 Other claims 43,551 54,377 32,177 32.939 30,525 36,638 34,508 5 Claims of banks' domestic customers2 10,978 8,191 20.718 20.826 21,753 18,802 19,123
1. Data on claims exclude foreign currencies held by U.S. monetary authorities. 2. Assets owned by customers of the reporting bank located in the United States that represent claims on foreigners held by reporting banks for the accounts of the domestic customers.
Digitized for FRASER http://fraser.stlouisfed.org/ Federal Reserve Bank of St. Louis

Bank-Reported Data A53
3.17 LIABILITIES TO FOREIGNERS Reported by Banks in the United States1
Payable in U.S. dollars Millions of dollars, end of period
Item 1997 1998 1999 2000
Item 1997 1998 1999 Apr. May June July Aug. Sept. Oct.p
BY HOLDER AND TYPE OF LIABILITY
1 Total, all foreigners 1 , 2 8 3 , 0 2 7 1 , 3 4 7 , 8 3 7 1 , 4 1 3 , 6 2 2 1 , 4 0 8 , 2 2 3 1 , 4 5 7 , 6 2 9 1 , 4 5 6 , 5 6 0 1 , 4 8 6 , 5 6 8 L , 4 4 9 , 6 9 3 R 1 , 4 5 3 , 6 4 4 1 , 5 0 2 , 8 0 5
2 Banks' own liabilities 882,980 884,939 976,400 976,662 1,036,677 1,017,559 1,056,717 1,018,63 l r 1,027,139 1,073,381 3 Demand deposits 31,344 29,558 42,884 30,202 29,097 30,719 34,914 30,101 31,964 29,500 4 Time deposits2 198,546 151,761 163,595 182,657 176,927 182,787 186,483 184,820 184,822 185,520 5 Other3 168,011 140,752 162,749 165,626 179,090 175,905 178,711 179,177 174,458 194,516 6 Own foreign offices4 485,079 562,868 607,172 598,177 651,563 628,148 656,609 624,533r 635,895 663,845
7 Banks' custodial liabilities5 400,047 462,898 437,222 431,561 420,952 439,001 429,851 431,062 426,505 429,424 8 U.S. Treasury bills and certificates6 193.239 183,494 185,736 184,159 174,310 180,951 182,699 180,925 174,604 173,984 9 Other negotiable and readily transferable
instruments7 93,641 141,699 132,575 124,207 123,580 124,670 120,624 119,212 120,296 122,525 10 Other 113,167 137,705 118,911 123,195 123,062 133,380 126,528 130,925 131,605 132,915
11 Nonmonetary international and regional organizations8 . . 11,690 11,883 15,276 20,590 22,807 21,366 16,689 14,630 15,658 17,104 12 Banks' own liabilities 11,486 10,850 14,357 19,800 22,109 20,924 16,294 14,377 15,404 16,751 13 Demand deposits 16 172 98 58 36 34 30 26 19 48 14 Time deposits2 5,466 5,793 10,349 11,338 11,393 12,545 10,305 9,062 7,627 5,925 15 Other3 6.004 4,885 3,910 8,404 10,680 8,345 5,959 5,289 7,758 10,778
16 Banks' custodial liabilities5 204 1,033 919 790 698 442 395 253 254 353 17 U.S. Treasury bills and certificates6 69 636 680 623 582 432 371 217 223 215 18 Other negotiable and readily transferable
instruments7 133 397 233 77 113 10 21 26 26 138 19 Other 2 0 6 90 3 0 3 10 5 0
20 Official institutions9 283,685 260,060 294,994 295,331 284,622 293,319 299,720 296,770 298,508 301,003 21 Banks' own liabilities 102,028 80,256 97,615 87,379 87.931 88,449 92,739 90,985 95,049 102,104 22 Demand deposits 2,314 3,003 3,341 2,620 2,781 2,887 4,063 4,573 5,213 4,361 23 Time deposits' 41,396 29,506 28,942 36,587 31,645 33,520 34,641 32,009 36,679 34,015 24 Other3 58,318 47,747 65,332 48,172 53,505 52,042 54,035 54,403 53,157 63,728
25 Banks' custodial liabilities5 181,657 179,804 197,379 207,952 196,691 204,870 206,981 205,785 203,459 198,899 26 U.S. Treasury bills and certificates6 148,301 134,177 156,177 157,607 148,820 157,190 160,093 159,781 155,498 155,101 27 Other negotiable and readily transferable
instruments7 33,151 44,953 41,152 50,118 47,734 47,611 46,363 45,644 47,660 43,753 28 Other 205 674 50 227 137 69 525 360 301 45
29 Banks10 815,247 885,336 905,347 892,804 941,920 930,663 961,456 926,392r 927,116 963,227 30 Banks' own liabilities 641,447 676,057 733,381 732,303 781,795 759,887 798,322 759,304r 762,409 796,950 31 Unaffiliated foreign banks 156,368 113,189 126,209 134,126 130,232 131,739 141,713 134,771 126,514 133,105 32 Demand deposits 16,767 14,071 17,583 14,404 13,254 14,543 17,508 11,959 12,918 12,160 33 Time deposits" 83,433 45,904 48,140 57,240 55,167 58,095 60,703 62,841 59,958 64,467 34 Other3 56,168 53,214 60,486 62,482 61,811 59,101 63,502 59,971 53,638 56,478 35 Own foreign offices4 485,079 562,868 607,172 598,177 651,563 628,148 656,609 624,533r 635,895 663,845
36 Banks' custodial liabilities5 173,800 209,279 171,966 160,501 160,125 170,776 163,134 167,088 164,707 166,277 37 U.S. Treasury bills and certificates6 31,915 35,359 16,875 13,931 14,179 13,239 12,657 12,251 10,667 9,972 38 Other negotiable and readily transferable
instruments7 35,393 45,332 45,695 33,790 33,667 34,657 34,018 33,893 32,679 34,232 39 Other 106,492 128,588 109,396 112,780 112,279 122,880 116,459 120,944 121,361 122,073
40 Other foreigners 172,405 190,558 198,005 199,498 208,280 211,212 208,743 211,901 212,362 221,471 41 Banks' own liabilities 128,019 117,776 131,047 137,180 144,842 148,299 149,362 153,965 154,277 157,576 42 Demand deposits 12,247 12,312 21,862 13,120 13,026 13,255 13,313 13,543 13,814 12,931 43 Time deposits" 68,251 70,558 76,164 77,492 78,722 78,627 80,834 80,908 80,558 81,113 44 Other3 47,521 34,906 33,021 46,568 53,094 56,417 55,215 59,514 59,905 63,532
45 Banks' custodial liabilities5 44,386 72,782 66,958 62,318 63,438 62,913 59,381 57,936 58,085 63,895 46 U.S. Treasury bills and certificates6 12,954 13,322 12,004 11,998 10,729 10,090 9,579 8,676 8,216 8,696 47 Other negotiable and readily transferable
instruments7 24,964 51,017 45,495 40,222 42,066 42,392 40,261 39,649 39,931 44,402 48 Other 6,468 8,443 9,459 10,098 10,643 10,431 9,541 9,611 9,938 10,797
M E M O 49 Negotiable time certificates of deposit in custody for
foreigners 16,083 27,026 30,345 26,087 27,238 26,571 26,186 25,911 25,991 27,164
1. Reporting banks include all types of depository institutions as well as some brokers and dealers. Excludes bonds and notes of maturities longer than one year.
2. Excludes negotiable time certificates of deposit, which are included in "Other negotia-ble and readily transferable instruments."
3. Includes borrowing under repurchase agreements. 4. For U.S. banks, includes amounts owed to own foreign branches and foreign subsidiar-
ies consolidated in quarterly Consolidated Reports of Condition filed with bank regulatory agencies. For agencies, branches, and majority-owned subsidiaries of foreign banks, consists principally of amounts owed to the head office or parent foreign bank, and to foreign branches, agencies, or wholly owned subsidiaries of the head office or parent foreign bank.
5. Financial claims on residents of the United States, other than long-term securities, held by or through reporting banks for foreign customers.
6. Includes nonmarketable certificates of indebtedness and Treasury bills issued to official institutions of foreign countries.
7. Principally bankers acceptances, commercial paper, and negotiable time certificates of deposit.
8. Principally the International Bank for Reconstruction and Development, the Inter-American Development Bank, and the Asian Development Bank. Excludes "holdings of dollars" of the International Monetary Fund.
9. Foreign central banks, foreign central governments, and the Bank for International Settlements.
10. Excludes central banks, which are included in "Official institutions."
Digitized for FRASER http://fraser.stlouisfed.org/ Federal Reserve Bank of St. Louis

A54 International Statistics • February 2001
3.17 LIABILITIES TO FOREIGNERS Reported by Banks in the United States1—Continued Payable in U.S. dollars Millions of dollars, end of period
Item 1997 1998 1999
2 0 0 0
Item 1997 1998 1999
Apr. May June July Aug. Sept. Oct.p
AREA
5 0 Total, all foreigners 1,283,027 1,347,837 1,413,622 1,408,223 1,457,629 1,456,560 1,486,568 l,449,693r 1,453,644 1,502,805
51 Foreign countries 1,271,337 1,335,954 1,398,346 1,387,633 1,434,822 1,435,194 1,469,919 l,435,063r 1,437,986 1,485,701
5 2 Europe 4 1 9 , 6 7 2 4 2 7 , 3 7 5 4 4 8 , 0 7 0 4 3 3 , 7 8 2 4 3 5 , 6 9 4 4 4 8 , 7 4 5 4 8 1 , 8 0 2 455,479 R 4 5 9 , 5 9 5 4 7 9 , 8 9 4 5 3 Austria 2 ,717 3 ,178 2 ,789 2 ,302 2 ,468 2 ,697 3 ,239 2 ,783 2 ,541 2 ,037 5 4 Belgium and Luxembourg 4 1 , 0 0 7 4 2 , 8 1 8 4 4 , 6 9 2 3 3 , 1 0 0 3 1 , 6 5 6 3 1 , 2 4 6 3 3 , 2 8 2 31 ,281 2 9 , 8 2 8 2 9 , 4 3 8 55 Denmark 1,514 1,437 2 ,196 2 ,601 3 ,629 3 , 4 4 4 3 ,521 3 ,689 3 ,429 3 ,001 56 Finland 2 , 2 4 6 1 ,862 1,658 1,744 1,529 1 ,380 1,751 1,618 1,512 1,418 57 France 4 6 , 6 0 7 4 4 , 6 1 6 49,790 45,324 43,577 42,105 42,379 42,723 39,693 41,065 5 8 Germany 23,737 21,357 24,748 23,710 24,875 28,943 26,484 25,893 26,212 28,658 5 9 Greece 1,552 2,066 3,748 3,188 3,030 2,765 2,917 3,455 3,331 3,420 6 0 Italy 11,378 7,103 6,775 4,788 7,142 6,676 5,700 5,566 5,959 5,700 61 Netherlands 7,385 10,793 8,310 7,277 6,823 8,728 12,313 13,087 10,311 14,253 6 2 Norway 317 710 1,327 1,197 963 2,189 2,337 1,636 3,501 4,101 63 Portugal 2,262 3,236 2,228 1,913 1,964 2,373 2,169 2,144 2,244 2,261 6 4 Russia 7,968 2,439 5,475 10,065 11,716 11,884 14,960 14,252 15,970 17,230 65 Spain 18,989 15,781 10,426 11,208 10,796 9,999 8,829 8,791 8,410 9,270 66 Sweden 1,628 3,027 4,652 5,165 4,390 5,434 5,100 5,992 6,220 6,247 67 Switzerland 39,023 50,654 65,985 69,208 63,700 59,561 78,195 77,578 88,276 97,099 68 Turkey 4,054 4,286 7,842 8,016 7,501 8,472 8,341 7,999 8,173 8,492 69 United Kingdom 181,904 181,554 176,234 169,221 176,824 187,806 197,309 174,653r 171,867 170,376 70 Yugoslavia" 239 233 286 265 275 276 277 277 275 271 71 Other Europe and other former U.S.S.R.12 25,145 30,225 28,909 33,490 32,836 32,767 32,699 32,062 31,843 35,557
72 Canada 28,341 30,212 34,119 40,562 36,229 37,256 37,231 33,722 33,881 27,198
73 Latin America and Caribbean 536,393 554,866 577,737 606,768 663,827 641,087 644,766 634,413 637,604 658,168 74 Argentina 20,199 19,014 18,633 18,487 16,496 16,540 19,092 17,552 18,560 18,746 75 Bahamas 112,217 118,085 134,407 159,115 173,589 181,673 170,535 176,109 171,457 180,951 76 Bermuda 6,911 6,846 7,877 9,710 8,713 8,021 7,074 8,157 8,100 8,730 7 7 Brazil 31,037 15,815 12,860 10,305 9,945 10,905 11,950 12,351 11,537 10,204 78 British West Indies 276,418 302,486 312,779 317,044 360,314 325,537 340,713 322,831 331,097 340,895 7 9 Chile 4,072 5,015 7,008 5,933 6,095 6,192 5,440 5,296 5,346 5,105 8 0 Colombia 3,652 4,624 5,669 4,243 4,237 4,360 4,627 4,735 4,658 4,945 81 Cuba 66 62 75 77 77 85 122 91 88 93 82 Ecuador 2,078 1,572 1,956 2,193 2,274 2,272 2,219 2,082 2,074 2,084 83 Guatemala 1,494 1,336 1,626 1,628 1,669 1,649 1,730 1,659 1,671 1,667 84 Jamaica 450 577 520 670 706 674 725 915 830 680 85 Mexico 33,972 37,157 30,717 32,832 33,915 33,937 33,379 33,291 33,878 36,054 86 Netherlands Antilles 5,085 5,010 3,997 5,108 6,561 7,885 7.164 6,373 5,159 4,614 87 Panama 4,241 3,864 4,415 3,788 3,764 3,822 3,353 3,561 3,661 3,788 8 8 Peru 893 840 1,142 1,021 1,100 1,125 1,097 1,065 1,091 1,153 89 Uruguay 2,382 2,486 2,386 2,431 2,520 2,680 2,179 2,541 2,567 2,512 90 Venezuela 21,601 19,894 20,189 21,140 20,469 22,263 21,462 23,909 23,997 24,283 91 Other 9,625 10,183 11,481 11,043 11,383 11,467 11,905 11,895 11,833 11,664
92 Asia 269,379 307,960 319,302 288,739 282,325 290,016 285,018 291,017 286,551 299,145 China
93 Mainland 18,252 13,441 12,325 8,529 7,824 9,930 9,385 11,769 11,830 13,719 94 Taiwan 11,840 12,708 13,600 14,483 14,113 13,584 13,156 14,675 15,140 18,289 95 Hong Kong 17,722 20,900 27,697 22,873 23,951 23,952 25,675 26,749 26,583 25,784 96 India 4,567 5,250 7,367 5,586 5,703 5,558 5,712 5,547 5,838 5,548 97 Indonesia 3,554 8 ,282 6,567 7,275 7 , 0 6 4 7,400 7 ,342 7 ,318 7 ,310 7,589 98 Israel 6,281 7,749 7,488 7,058 5,541 6.123 5,794 5,951 7,132 6,668 9 9 Japan 143,401 168,563 159,075 147,409 148,668 153,662 147,549 146,382 142,782 150,196
100 Korea (South) 13,060 12,524 12,853 16,820 12,941 10,324 8,618 8,819 9,043 6,684 101 Philippines 3,250 3,324 3,253 2,290 1,750 1,999 1,649 1,679 1,822 1,676 102 Thailand 6,501 7,359 6,050 3,628 3,428 3.529 3,900 3,504 3,330 3,178 103 Middle Eastern oil-exporting countries 14,959 15,609 21,284 19,005 18,647 18,538 22,195 21,968 21,851 23,852 104 Other 25,992 32,251 41,743 33,783 32,695 35,417 34,043 36,656 33,890 35,962
105 Africa 10,347 8,905 9,468 8,576 8,437 8,718 9,739 9,607 9,821 9,625 106 Egypt 1,663 1.339 2,022 1,663 1,722 1,962 1,780 1,615 1,544 1,546 107 Morocco 138 97 179 106 122 149 118 109 112 121 108 South Africa 2,158 1,522 1,495 687 662 595 792 708 842 767 109 Zaire 10 5 14 7 13 6 5 7 5 4 110 Oil-exporting countries'4 3,060 3,088 2,914 3,558 3,298 3,405 4,258 4,470 4,499 4,406 111 Other 3 ,318 2,854 2 , 8 4 4 2,555 2,620 2,601 2,786 2,698 2,819 2,781
112 Other 7,205 6,636 9,650 9,206 8,310 9,372 11,363 10,825 10,534 11,671 113 Australia 6,304 5,495 8,377 8,413 7,586 8,564 10,346 9,825 9,507 10,562 114 Other 901 1,141 1,273 793 724 808 1,017 1,000 1,027 1,109
115 Nonmonetary international and regional organizations . . 11,690 11,883 15,276 20,590 22,807 21,366 16,689 14,630 15,658 17,104 116 International'5 10,517 10,221 12,876 19,207 21,375 20,106 15,295 13,118 14,387 16,126 117 Latin American regional16 424 594 1,150 518 624 768 786 1,146 888 589 118 Other regional'7 749 1,068 1,250 865 808 492 608 366 383 389
11. Since December 1992, has excluded Bosnia, Croatia, and Slovenia. 12. Includes the Bank for International Settlements. Since December 1992, has
included all parts of the former U.S.S.R. (except Russia), and Bosnia, Croatia, and Slovenia. 13. Comprises Bahrain, Iran, Iraq, Kuwait, Oman, Qatar, Saudi Arabia, and United Arab
Emirates (Trucial States). 14. Comprises Algeria, Gabon, Libya, and Nigeria.
15. Principally the International Bank for Reconstruction and Development. Excludes "holdings of dollars" of the International Monetary Fund.
16. Principally the Inter-American Development Bank. 17. Asian, African, Middle Eastern, and European regional organizations, except the Bank
for International Settlements, which is included in "Other Europe."
Digitized for FRASER http://fraser.stlouisfed.org/ Federal Reserve Bank of St. Louis

Bank-Reported Data A55
3.18 BANKS' OWN CLAIMS ON FOREIGNERS Reported by Banks in the United States1
Payable in U.S. Dollars Millions of dollars, end of period
Area or country 1997 1998 1999 2000
Area or country 1997 1998 1999 Apr. May June July Aug. Sept. Oct.P
1 Total, all foreigners 708,225 734,995 795,377 815,083 820,782 825,898 833,459 800,472 840,425 856,474
2 Foreign countries 705,762 731,378 790,814 810,081 816,439 820,887 829,573 796,695 835,560 851,251
3 Europe 199,880 233,321 315,905 350,067 359,895 357,243 361,594 331,384 359,865 359,753 4 Austria 1,354 1,043 2,643 2,429 2,242 2,148 2,617 1,956 2,584 2,820
Belgium and Luxembourg 6,641 7,187 10,193 7,939 5,959 6,393 6,302 5,819 6,344 6,009 6 Denmark 980 2,383 1,669 1,940 2,001 3,440 3,349 3,278 3,403 3,093 7 Finland 1,233 1,070 2,020 2,087 2,414 2,650 2,897 2,701 3,561 4,927 8 France 16,239 15,251 29,142 30,958 35,217 28,633 25,845 23,229 27,062 29,093 9 Germany 12,676 15,923 29,205 33,991 31,521 33,585 30,452 31,804 33,229 33,017
10 Greece 402 575 806 864 828 837 754 557 516 526 11 Italy 6,230 7,284 8,496 7,034 6,565 7,724 6,447 7,358 6,215 6,482 P Netherlands 6,141 5,697 11,810 13,932 14,377 15,668 13,159 14,999 15,507 16,226 13 Norway 555 827 1,000 1,499 1,832 1,935 2,401 1,448 4,474 4,655 14 Portugal 111 669 1,571 1,085 1,268 1,424 1,454 1,273 1,480 1,574 15 Russia 1,248 789 713 709 715 744 718 666 643 647 16 Spain 2,942 5,735 3,796 3,217 3,126 3,844 4,767 3,566 3,208 3,360 17 Sweden 1,854 4,223 3,264 8,100 7,112 8,744 8,404 8,761 8,501 8,504 18 Switzerland 28,846 46,874 79,158 97,688 105,573 86,284 94,550 87,172 100,345 103,724 19 Turkey 1,558 1,982 2,617 3,148 3,269 3,189 2,735 2,855 2,821 3,065 20 United Kingdom 103,143 106,349 120,190 125,935 128,259 141,769 147,073 127,335 132,503 121,921 21 Yugoslavia2 52 53 50 51 49 49 49 49 49 49 22 Other Europe and other former U.S.S.R.-1 7,009 9,407 7,562 7,461 7,568 8,183 7,621 6,558 7,420 10,061
23 Canada 27,189 47,037 37,206 43,300 45,481 42,591 40,420 37,934 37,610 38,647
74 Latin America and Caribbean 343,730 342,654 353,416 328,769 321,219 328,629 334,855 338,764 347,550 357,575 75 Argentina 8,924 9,552 10,167 9,732 9,507 9,386 10,630 10,597r 10,840 11,166 76 Bahamas 89,379 96,455 99,324 72,312 71,459 80,393 76,477 78,896 83,126 83,525 71 Bermuda 8,782 5,011 8,007 5,685 6,478 6,285 6,906 4,684 6,265 8,426 ?8 Brazil 21,696 16,184 15,706 16,210 16,376 16,544 18,199 18,555 19,061 20,197 ?9 British West Indies 145,471 153,749 167,189 173,907 165,920 164,969 172,262 175,936r 178,744 184,796 30 Chile 7,913 8,250 6,607 6,447 6,399 6,213 6,070 5,985 5,954 5,755 31 Colombia 6,945 6,507 4,524 3,907 4,032 3,796 3,909 3,953 3,850 3,846 3? Cuba 0 0 0 0 0 0 0 3 0 0 33 Ecuador 1,311 1,400 760 662 640 613 610 607 623 639 34 Guatemala 886 1,127 1,135 1,252 1,245 1,235 1,215 1,277 1,226 1,245 35 Jamaica 424 239 295 316 300 291 299 305 337 379 36 Mexico 19,428 21,212 17,899 16,944 16,771 17,066 16,426 16,840 16,849 16,737 37 Netherlands Antilles 17,838 6,779 5,982 6,388 6,579 6,502 6,652 5,804 5,770 6,158 38 Panama 4,364 3,584 3,387 2,844 2,984 3,063 2,981 2,882 2,781 2,674 39 Peru 3,491 3,275 2,529 2,356 2,515 2,458 2,488 2,487 2,697 2,670 40 Uruguay 629 1,126 801 714 708 620 649 111 728 663 41 Venezuela 2,129 3,089 3,494 3,474 3,595 3,471 3,357 3,410 3,390 3,321 42 Other 4,120 5,115 5,610 5,619 5,711 5,724 5,725 5,766 5,309 5,378
43 125,092 98,607 74,914 78,257 80,221 82,415 83,127 79,022 81,655 87,465 China
44 Mainland 1,579 1,261 2,090 4,532 2,611 1,688 1,822 1,601 1,519 1,912 45 Taiwan 922 1,041 1,390 1,080 1,732 1,339 922 790 2,475 3,691 46 Hong Kong 13,991 9,080 5,893 4,546 4,573 4,266 5,777 5,403 6,014 6,540 47 India 2,200 1,440 1,738 1,786 1,941 1,905 2,013 2,037 2,006 1,787 48 Indonesia 2,651 1,942 1,776 1,821 1,819 1,856 1,940 1,880 1,982 2,009 49 Israel 768 1,166 1,875 3,293 2,857 1,610 1,982 2,281 1,116 1,551 50 Japan 59,549 46,713 28,636 30,381 31,689 33,256 31,209 32,494 35,234 35,775 51 Korea (South) 18,162 8,289 9,262 12,209 14,018 15,866 18,915 16,924 14,457 18,587 52 Philippines 1,689 1,465 1,410 1,714 1,884 1,865 1,802 1,483 1,495 1,473 53 Thailand 2,259 1,807 1,515 1,081 1,137 1,255 1,051 1,059 1,071 1,046 54 Middle Eastern oil-exporting countries4 10,790 16,130 14,252 10,765 11,666 12,128 10,367 10,006 9,961 9,650 55 Other 10,532 8,273 5,077 5,049 4,294 5.381 5,327 3,064 4,325 3,444
56 Africa 3,530 3,122 2,268 2,054 2,109 2,494 2,505 2,215 2,597 2,235 57 Egypt 247 257 258 206 218 230 217 186 176 201 58 Morocco 511 372 352 300 271 259 272 247 254 252 59 South Africa 805 643 622 360 341 772 411 358 372 322 60 Zaire 0 0 24 0 0 0 0 0 0 0 61 Oil-exporting countries' 1,212 936 276 394 508 430 751 616 913 656 62 Other 755 914 736 794 771 803 854 808 882 804
63 Other 6,341 6,637 7,105 7,634 7,514 7,515 7,072 7,376 6,283 5,576 64 Australia 5,300 6,173 6,824 7,225 7,139 7,240 6,891 7,036 6,036 5,238 65 Other 1,041 464 281 409 375 275 181 340 247 338
66 Nonmonetary international and regional organizations6. . . 2,463 3,617 4,563 5,002 4,343 5,011 3,886 3,777 4,865 5,223
1. Reporting banks include all types of depository institutions as well as some brokers and dealers.
2. Since December 1992, has excluded Bosnia, Croatia, and Slovenia. 3. Includes the Bank for International Settlements. Since December 1992, has included all
parts of the former U.S.S.R. (except Russia), and Bosnia, Croatia, and Slovenia.
4. Comprises Bahrain, Iran, Iraq, Kuwait, Oman, Qatar, Saudi Arabia, and United Arab Emirates (Trucial States).
5. Comprises Algeria, Gabon, Libya, and Nigeria. 6. Excludes the Bank for International Settlements, which is included in "Other Europe."
Digitized for FRASER http://fraser.stlouisfed.org/ Federal Reserve Bank of St. Louis

A56 International Statistics • February 2001
3.19 BANKS' OWN AND DOMESTIC CUSTOMERS' CLAIMS ON FOREIGNERS Reported by Banks in the United States1
Payable in U.S. Dollars
Millions of dollars, end of period
Type of claim 1997 1998 1999
2000
Type of claim 1997 1998 1999
Apr. May June July Aug. Sept. Oct.p
1 Total 852,852 875,891 947,175 r 1,010,005 1,009,934
2 Banks' claims 708.225 734,995 795,377 815,083 820,782 825,898 833,459 800.472 840,425 856,474 3 Foreign public borrowers 20,581 23,542 35.090 37,300 43,092 41,461 48,424 41,459r 40,436 49,691 4 Own foreign offices" 431.685 484,535 528,397 557,339 549,165 553,262 557,557 544,142 576,452 581,277 5 Unaffiliated foreign banks 109.230 106,206 101,227 91,849 92,280 92,911 89,352 82,536 87,276 82,250 6 Deposits 30.995 27,230 34,360 22.399 24,769 22,373 21,856 21,822 23,765 22,830 7 Other 78.235 78,976 66,867 69,450 67,511 70,538 67,496 60,714 63,511 59,420 8 All other foreigners 146,729 120,712 130,663 128,595 136,245 138,264 138,126 132,335r 136,261 143,256
9 Claims of banks' domestic customers3 144,627 140,896 151,798r 184,107 169,509 10 Deposits 73,110 79,363 88,006 106,055 87,340 11 Negotiable and readily transferable
instruments4 53,967 47,914 51,161 62,975 70,334 12 Outstanding collections and other
claims 17,550 13,619 12,631r 15,077 11,835
M E M O 13 Customer liability on acceptances 9,624 4,520 4,553 5,056r 4,827
14 Dollar deposits in banks abroad, reported by nonbanking business enterprises in the United States5 33,816 39,978 31,125 45,383 45,468 44,139 46,337 55,293 57,784 53,848
1. For banks' claims, data are monthly; for claims of banks' domestic customers, data are for quarter ending with month indicated.
Reporting banks include all types of depository institution as well as some brokers and dealers.
2. For U.S. banks, includes amounts due from own foreign branches and foreign subsidiar-ies consolidated in quarterly Consolidated Reports of Condition filed with bank regulatory agencies. For agencies, branches, and majority-owned subsidiaries of foreign banks, consists
principally of amounts due from the head office or parent foreign bank, and from foreign branches, agencies, or wholly owned subsidiaries of the head office or parent foreign bank.
3. Assets held by reporting banks in the accounts of their domestic customers. 4. Principally negotiable time certificates of deposit, bankers acceptances, and commercial
paper. 5. Includes demand and time deposits and negotiable and nonnegotiable certificates of
deposit denominated in U.S. dollars issued by banks abroad.
3.20 BANKS' OWN CLAIMS ON UNAFFILIATED FOREIGNERS Reported by Banks in the United States1
Payable in U.S. Dollars Millions of dollars, end of period
Maturity, by borrower and area2 1996 1997 1998
1999 2000
Maturity, by borrower and area2 1996 1997 1998
Dec. Mar. Juner Sept.p
1 Total 258,106 276,550 250,418 267,082 r 262,173 r 273,139 263,500
By borrower 2 Maturity of one year or less 211,859 205,781 186,526 187,894r 181,050r 185,927 174,809 3 Foreign public borrowers 15,411 12,081 13,671 22,811 23,436 24,850 23,647 4 All other foreigners 196,448 193,700 172,855 165,083r 157,614r 161,077 151,162 5 Maturity of more than one year 46,247 70,769 63,892 79,188r 81,123r 87,212 88,691 6 Foreign public borrowers 6,790 8,499 9,839 12,013 12,852r 15,905 16,236 7 All other foreigners 39,457 62,270 54,053 67,175r 68,27 l r 71,307 72,455
By area Maturity of one year or less
8 Europe 55,690 58,294 68,679 80,842 79,638r 75,561 69,486 9 Canada 8,339 9,917 10,968 7,859 8,408 7,344 8,225
10 Latin America and Caribbean 103,254 97,207 81,766 69,498r 62,923r 66,140 65,918 11 Asia 38,078 33,964 18,007 21,802 23,002 29,091 23,874 12 Africa 1,316 2,211 1,835 1,122 957 1,520 1,594 13 All other3 5,182 4,188 5,271 6,771 6,122 6,271 5,712
Maturity of more than one year 14 Europe 6,965 13,240 14,923 22,951 23,951 25,404 27,550 15 Canada 2,645 2,525 3,140 3,192 3,127 3,323 3,261 16 Latin America and Caribbean 24,943 42,049 33,442 39,05 r 39,714r 42,427 41,166 17 Asia 9,392 10,235 10,018 11,257 11,612 12,549 13,131 18 Africa t ,36 1,236 1,232 1,065 965 924 895 19 Allother 3 941 1,484 1,137 1,672 1,754 2,585 2,688
1. Reporting banks include all types of depository institutions as well as some brokers and 2. Maturity is time remaining until maturity, dealers. 3. Includes nonmonetary international and regional organizations.
Digitized for FRASER http://fraser.stlouisfed.org/ Federal Reserve Bank of St. Louis

Bank-Reported Data A57
3.21 CLAIMS ON FOREIGN COUNTRIES Held by U.S. and Foreign Offices of U.S. Banks1
Billions of dollars, end of period
Area or country 1996 1997 1998 1999 2000
Area or country 1996 1997 Sept. Dec. Mar. June Sept. Dec. Mar. June Sept.p
1 Total 645.8 721.8 1071.9 1051.6 992.8 939.4 936.8 936.7 952.7 991.5r 952.4
2 G-10 countries and Switzerland 228.3 242.8 240.0 217.7 208.7 223.1 206.4 236.5 284.1 324.2r 286.9 3 Belgium and Luxembourg 11.7 11.0 11.7 10.7 15.6 16.1 15.7 14.3 14.2 13.8 13.0 4 France 16.6 15.4 20.3 18.4 21.6 20.4 19.9 29.0 27.1 32.6 29.1
Germany 29.8 28.6 31.4 30.9 34.7 32.1 37.4 38.7 37.3 31.5 37.8 6 Italy 16.0 15.5 18.5 11.5 17.8 16.4 15.0 18.1 20.0 20.8r 18.8 7 Netherlands 4.0 6.2 8.4 7.8 10.7 13.3 10.6 12.3 17.1 16.1 17.6 8 Sweden 2.6 3.3 2.1 2.3 4.0 2.6 3.6 3.0 3.9 3.5 4.3 9 Switzerland 5.3 7.2 7.6 8.5 7.8 8.2 8.8 10.3 10.1 13.8 10.9
10 United Kingdom 104.7 113.4 100.1 85.4 56.1 74.3 51.9 72.4 113.5 148.3 118.7 1 1 Canada 14.0 13.7 15.9 16.8 15.9 17.1 17.9 16.3 17.5 18.2 18.7 12 Japan 23.7 28.6 23.9 25.4 24.6 22.6 25.6 22.0 23.5 25.4 18.1
13 Other industrialized countries 66.1 65.5 78.5 69.0 80.1 79.7 71.7 68.4 62.8 75.3r 72.5 14 Austria 1.1 1.5 2.1 1.4 2.8 2.8 3.0 3.5 2.6 2.8 3.5 15 Denmark 1.5 2.4 3.0 2.2 3.4 2.9 2.1 2.6 1.5 1.2 1.8 16 Finland .8 1.3 1.6 1.4 1.5 .9 .9 .9 .8 1.3 2.8 17 Greece 6.7 5.1 5.8 5.9 6.5 5.9 6.6 6.0 5.7 6.8 6.4 18 Norway 8.0 3.6 3.2 3.2 3.1 3.0 3.8 3.3 3.0 4.6 8.5 19 Portugal .9 .9 1.1 1.4 1.4 1.2 1.2 1.0 1.0 2.0 1.5 20 Spain 13.3 12.6 19.5 13.7 15.7 16.6 15.1 12.1 11.3 12.2 10.5 21 Turkey 2.7 4.5 5.2 4.8 5.2 4.9 4.7 4.8 5.1 5.6 5.6 22 Other Western Europe 4.9 8.3 10.4 10.4 10.2 10.2 9.2 6.8 8.3 7.9r 8.4 23 South Africa 2.0 2.2 5.4 4.4 4.8 4.7 4.0 3.8 4.8 4.6 2.9 24 Australia 24.0 23.1 21.4 20.3 25.4 26.6 21.1 23.5 18.6 26.3 20.5
25 OPEC2 19.8 26.0 26.0 27.1 26.2 26.1 30.1 31.4 28.9 32.3 31.8 26 Ecuador 1.1 1.3 1.2 1.3 1.2 1.1 .9 .8 .7 .7 .6 27 Venezuela 2.4 2.5 3.1 3.2 3.5 3.2 3.0 2.8 3.0 2.9 2.9 7.8 Indonesia 5.2 6.7 4.7 4.7 4.5 5.0 4.4 4.2 3.9 4.1 4.4 29 Middle East countries 10.7 14.4 16.1 17.0 16.7 16.5 21.4 23.0 21.1 24.0 22.7 30 African countries .4 1.2 .8 1.0 .4 .4 .5 .5 .2 .7 1.2
31 Non-OPEC developing countries 130.3 139.2 140.4 143.4 146.7 148.6 142.5 147.3 152.5 155.6 150.5
Latin America 32 Argentina 14.3 18.4 22.9 23.1 24.3 22.8 22.1 22.4 21.3 20.3 21.4 33 Brazil 20.7 28.6 24.0 24.7 24.2 25.1 22.1 26.4 26.9 27.0 28.5 34 Chile 7.0 8.7 8.5 8.3 8.6 8.2 7.7 7.4 8.2 8.1 7.4 35 Colombia 4.1 3.4 3.4 3.2 3.3 3.1 2.7 2.5 2.5 2.4 2.4 36 Mexico 16.2 17.4 18.7 18.9 19.7 18.5 19.4 18.7 18.3 20.5 17.5 37 1.6 2.0 2.2 2.2 2.2 2.1 1.8 1.7 1.9 2.1 2.1 38 Other 3.3 4.1 4.6 5.4 5.3 5.5 5.5 5.9 6.5 6.7 6.3
Asia China
39 Mainland 2.5 3.2 2.8 3.0 5.0 5.3 3.3 3.6 4.6 3.8 3.4 40 Taiwan 10.3 9.5 12.5 13.3 11.8 12.6 12.3 12.0 12.6 12.6 12.8 41 India 4.3 4.9 5.3 5.5 5.5 6.7 7.0 7.7 7.9 8.2 5.8 42 Israel .5 .7 .9 1.1 1.1 2.0 1.0 1.8 3.3 1.5 1.1 43 Korea (South) 21.5 15.6 13.1 13.7 13.7 15.3 16.0 15.1 17.4 21.2 21.0 44 Malaysia 6.0 5.1 5.0 5.6 5.9 6.0 6.1 6.1 6.5 6.8 6.4 45 Philippines 5.8 5.7 4.7 5.1 5.4 5.7 5.8 6.2 5.3 5.3 4.7 46 Thailand 5.7 5.4 5.3 4.7 4.5 4.2 4.0 4.1 4.3 4.0 3.9 47 Other Asia 4.1 4.3 3.1 2.9 3.0 2.8 2.8 2.9 2.6 2.5 2.3
Africa 48 Egypt .7 .9 1.7 1.3 1.4 1.4 1.3 1.4 1.4 1.3 1.1 49 Morocco .7 .6 .5 .5 .5 .5 .5 .4 .3 .3 .4 50 Zaire .1 .0 .0 .0 .0 .0 .0 .0 .0 .0 .0 51 Other Africa3 .9 .8 1.1 1.0 1.2 1.0 1.0 1.0 .9 .9 2.1
52 Eastern Europe 6.9 9.1 6.3 5.5 7.1 5.8 5.4 5.2 6.3 9.4 9.1 53 Russia4 3.7 5.1 2.8 2.2 2.3 2.1 2.0 1.6 1.7 1.5 1.4 54 Other 3.2 4.0 3.5 3.3 4.8 3.7 3.4 3.6 4.7 7.9 7.6
55 Offshore banking centers 135.1 140.2 121.0 93.9 93.6 75.9 89.4 60.1 42.0 52.4 50.6 56 Bahamas 20.5 24.2 30.7 35.4 32.6 20.4 28.6 13.9 2.4 .5 .6 57 Bermuda 4.5 9.8 10.4 4.6 3.9 5.7 8.2 8.0 7.3 6.3 6.3 58 Cayman Islands and other British West Indies 37.2 43.4 27.8 12.8 13.9 7.2 6.3 1.3 .0 5.1 5.9 59 Netherlands Antilles 26.1 14.6 6.0 2.6 2.7 1.3 9.1 1.7 2.5 2.6 1.9 60 Panama5 2.0 3.1 4.0 3.9 3.9 3.9 3.9 3.9 3.4 3.3 2.5 61 Lebanon .1 .1 .2 .1 .1 .1 .2 .1 .1 .1 .1 62 Hong Kong, China 27.9 32.2 30.6 23.3 22.8 22.0 22.4 21.0 22.2 20.7 20.5 63 Singapore 16.7 12.7 11.1 11.1 13.5 15.2 10.6 10.1 4.1 13.6 12.7 64 Other6 .1 .1 .2 .2 .2 .1 .2 .1 .1 .1 .1 65 Miscellaneous and unallocated7 59.6 99.1 459.9 495.1 430.4 380.2 391.2 387.9 376.1 342.4r 351.1
1. The banking offices covered by these data include U.S. offices and foreign branches of U.S. banks, including U.S. banks that are subsidiaries of foreign banks. Offices not covered include U.S. agencies and branches of foreign banks. Beginning March 1994, the data include large foreign subsidiaries of U.S. banks. The data also include other types of U.S. depository institutions as well as some types of brokers and dealers. To eliminate duplication, the data are adjusted to exclude the claims on foreign branches held by a U.S. office or another foreign branch of the same banking institution.
These data are on a gross claims basis and do not necessarily reflect the ultimate country risk or exposure of U.S. banks. More complete data on the country risk exposure of U.S. banks are available in the quarterly Country Exposure Lending Survey published by the Federal Financial Institutions Examination Council.
2. Organization of Petroleum Exporting Countries, shown individually; other members of OPEC (Algeria, Gabon, Iran, Iraq, Kuwait, Libya, Nigeria, Qatar, Saudi Arabia, and United Arab Emirates); and Bahrain and Oman (not formally members of OPEC).
3. Excludes Liberia. Beginning March 1994 includes Namibia. 4. As of December 1992, excludes other republics of the former Soviet Union. 5. Includes Canal Zone. 6. Foreign branch claims only. 7. Includes New Zealand, Liberia, and international and regional organizations.
Digitized for FRASER http://fraser.stlouisfed.org/ Federal Reserve Bank of St. Louis

A58 International Statistics • February 2001
3.22 LIABILITIES TO UNAFFILIATED FOREIGNERS Reported by Nonbanking Business Enterprises in the United States Millions of dollars, end of period
Type of liability, and area or country 1996 1997 1998 1999 2000
Type of liability, and area or country 1996 1997 1998 Mar. June Sept. Dec. Mar. June
1 Total 61,782 57,382 46,570 46,663 49,337 52,979 53,044 53,489r 70,534
2 Payable in dollars 39,542 41,543 36,668 34,030 36,032 36,296 37,605 35,614r 47,864 3 Payable in foreign currencies 22,240 15,839 9,902 12,633 13,305 16,683 15,415 17,875 22,670
By type 4 Financial liabilities 33,049 26,877 19,255 22,458 25,058 27.422 27,980 29,180r 44,068 5 Payable in dollars 11,913 12,630 10,371 11,225 13,205 12,231 13,883 12,858r 22,803 6 Payable in foreign currencies 21,136 14,247 8,884 11,233 11,853 15,191 14,097 16,322 21,265
7 Commercial liabilities 28,733 30,505 27,315 24,205 24,279 25,557 25,064 24,309 26,466 8 Trade payables 12,720 10.904 10,978 9,999 10,935 12,651 12,857 12,401 13,764 9 Advance receipts and other liabilities 16,013 19,601 16,337 14,206 13,344 12,906 12,207 11,908 12,702
10 Payable in dollars 27,629 28,913 26,297 22,805 22,827 24,065 23,722 22,756 25,061 11 Payable in foreign currencies 1,104 1,592 1,018 1,400 1,452 1,492 1,318 1,553 1,405
By area or country Financial liabilities
12 Europe 23,179 18,027 12,589 16,098 19,578 21,695 23,241 24,050r 30,332 13 Belgium and Luxembourg 632 186 79 50 70 50 31 4 163 14 France 1,091 1,425 1,097 1,178 1,287 1,675 1,659 l,849r 1,702 15 Germany 1,834 1,958 2,063 1,906 1,959 1,712 1,974 l,880r 1,671 16 Netherlands 556 494 1,406 1,337 2,104 2,066 1,996 1,970 2,035 17 Switzerland 699 561 155 141 143 133 147 97 137 18 United Kingdom 17,161 11.667 5,980 9,729 13,097 15,096 16,521 16,579 21,463
19 Canada 1,401 2,374 693 781 320 344 284 313 714
20 Latin America and Caribbean 1,668 1,386 1,495 1,528 1,369 1,180 892 846 2,874 21 Bahamas 236 141 7 1 1 1 1 1 78 22 Bermuda 50 229 101 78 52 26 5 1 1,016 23 Brazil 78 143 152 137 131 122 126 128 146 24 British West Indies 1,030 604 957 1,064 944 786 492 489 463 25 Mexico 17 26 59 22 19 28 25 22 26 26 Venezuela 1 1 2 2 1 0 0 0 0
27 Asia 6,423 4,387 3,785 3,475 3,217 3,622 3,437 3,275 9,453 28 Japan 5,869 4,102 3,612 3,337 3,035 3,384 3,142 2,985 6,024 29 Middle Eastern oil-exporting countries' 25 27 0 1 2 3 3 4 5
30 Africa 38 60 28 31 29 31 28 28 33 31 Oil-exporting countries" 0 0 0 2 0 0 0 0 0
32 All other1 340 643 665 545 545 550 98 668 662
Commercial liabilities 33 Europe 9,767 10,228 10,030 8,580 8,718 9,265 9,262 8,646 9,293 34 Belgium and Luxembourg 479 666 278 229 189 128 140 78 178 33 France 680 764 920 654 656 620 672 539 711 36 Germany 1,002 1,274 1,392 1,088 1,143 1,201 1,131 914 948 37 Netherlands 766 439 429 361 432 535 507 648 562 38 Switzerland 624 375 499 535 497 593 626 536 565 39 United Kingdom 4,303 4,086 3,697 3,008 2,959 3,175 3,071 2,661 2,982
40 Canada 1,090 1,175 1,390 1,597 1,670 1,753 1,775 2,024 2,053
41 Latin America and Caribbean 2,574 2,176 1,618 1,612 1,674 1,957 2,310 2,286 2,607 42 Bahamas 63 16 14 11 19 24 22 9 10 43 Bermuda 297 203 198 225 180 178 152 287 300 44 Brazil 196 220 152 107 112 120 145 115 119 45 British West Indies 14 12 10 7 5 39 48 23 22 46 Mexico 665 565 347 437 490 704 887 805 1,073 47 Venezuela 328 261 202 155 149 182 305 193 239
48 Asia 13,422 14,966 12,342 10,428 10,039 10,428 9,886 9,681 10,965 49 Japan 4,614 4,500 3,827 2,715 2,753 2,689 2,609 2,274 2,200 50 Middle Eastern oil-exporting countries' 2,168 3,111 2,852 2,479 2,209 2,618 2,551 2,308 3,489
51 Africa 1,040 874 794 727 832 959 950 943 950 52 Oil-exporting countries" 532 408 393 377 392 584 499 536 575
53 Other3 840 1,086 1,141 1,261 1,346 1,195 881 729 598
1. Comprises Bahrain, Iran, Iraq, Kuwait, Oman, Qatar, Saudi Arabia, and United Arab 2. Comprises Algeria, Gabon, Libya, and Nigeria. Emirates (Trucial States). 3. Includes nonmonetary international and regional organizations.
Digitized for FRASER http://fraser.stlouisfed.org/ Federal Reserve Bank of St. Louis

Nonbank-Reported Data A59
3.23 CLAIMS ON UNAFFILIATED FOREIGNERS Reported by Nonbanking Business Enterprises in the United States
Millions of dollars, end of period
Type of claim, and area or country 1996 1997 1998 1999 2000
Type of claim, and area or country 1996 1997 1998 Mar. June Sept. Dec. Mar. June
1 Total 65,897 68,128 77,462 69,054 63,884 67,566 76,669 84,266 80,725r
2 Payable in dollars 59,156 62,173 72,171 64,026 57,006 60,456 69,170 74,331 72,294r
3 Payable in foreign currencies 6,741 5,955 5,291 5,028 6,878 7,110 7,472 9,935 8,431
By typ e 4 Financial claims 37,523 36,959 46,260 38,217 31,957 33,877 40,231 47,798 44,303 5 Deposits 21,624 22,909 30,199 18,686 13,350 15,192 18,566 23,316 17,462 6 Payable in dollars 20,852 21,060 28,549 17,101 11,636 13,240 16,373 21,442 15,361 7 Payable in foreign currencies 772 1,849 1,650 1,585 1,714 1,952 2,193 1,874 2,101 8 Other financial claims 15,899 14,050 16,061 19,531 18,607 18,685 21,665 24,482 26,841 9 Payable in dollars 12,374 11,806 14,049 17,457 14,800 15,718 18,593 19,659 22,384
10 Payable in foreign currencies 3,525 2,244 2,012 2,074 3,807 2,967 3,072 4,823 4,457
11 Commercial claims 28,374 31,169 31,202 30,837 31,927 33,689 36,438 36,468 36,422r
12 Trade receivables 25,751 27,536 27,202 26,724 27,791 29,397 32,629 31,443 31,277r
13 Advance payments and other claims 2,623 3,633 4,000 4,113 4,136 4,292 3,809 5,025 5,145
14 Payable in dollars 25,930 29,307 29,573 29,468 30,570 31,498 34,204 33,230 34,549r
15 Payable in foreign currencies 2,444 1,862 1,629 1,369 1,357 2,191 2,207 3,238 1,873
By area or country Financial claims
16 Europe 11,085 14,999 12,294 12,881 13,978 13,878 13,023 16,789 18,254 17 Belgium and Luxembourg 185 406 661 469 457 574 529 540 317 18 France 694 1,015 864 913 1,368 1,212 967 1,835 1,292 19 Germany 276 427 304 302 367 549 504 669 576 20 Netherlands 493 677 875 993 997 1,067 1,229 1,981 1,984 21 Switzerland 474 434 414 530 504 559 643 612 624 22 United Kingdom 7,922 10,337 7,766 8,400 8,631 8,157 7,561 9,044 11,668
23 Canada 3,442 3,313 2,503 3,111 2,828 3,172 2,553 3,175 5,799
24 Latin America and Caribbean 20,032 15,543 27,714 18,825 11,486 12,749 18,206 21,945 14,874 25 Bahamas 1,553 2,308 403 666 467 755 1,593 1,299 655 76 Bermuda 140 108 39 41 39 524 11 11 34 27 Brazil 1,468 1,313 835 1,112 1,102 1,265 1,476 1,646 1,666 28 British West Indies 15,536 10,462 24,388 14,621 7,393 7,263 12,099 15,814 7,751 29 Mexico 457 537 1,245 1,583 1,702 1,791 1,798 1,979 2,048 30 Venezuela 31 36 55 72 71 47 48 65 78
31 Asia 2,221 2,133 3,027 2,648 2,801 3,205 5,457 4,430 3,923 32 Japan 1,035 823 1,194 942 949 1,250 3,262 2,021 1,410 33 Middle Eastern oil-exporting countries' 22 11 9 8 5 5 21 29 42
34 Africa 174 319 159 174 228 251 286 232 320 35 Oil-exporting countries2 14 15 16 26 5 12 15 15 39
36 All other3 569 652 563 578 636 622 706 1,227 1,133
Commercial claims 37 Europe 10,443 12,120 13,246 12,782 12,961 14,367 16,389 16,118 15,928r
38 Belgium and Luxembourg 226 328 238 281 286 289 316 271 425 39 France 1,644 1,796 2,171 2,173 2,094 2,375 2,236 2,520 2,692r
40 Germany 1,337 1,614 1,822 1,599 1,660 1,944 1,960 2,034 1,906r
41 Netherlands 562 597 467 415 389 617 1,429 1,337 1,242r
42 Switzerland 642 554 483 367 385 714 610 611 563 43 United Kingdom 2,946 3,660 4,769 4,529 4,615 4,789 5,827 5,354 4,929r
44 Canada 2,165 2,660 2,617 2,983 2,855 2,638 2,757 3,088 3,250r
4S Latin America and Caribbean 5,276 5,750 6,296 5,930 6,278 5,879 5,959 5,899 5,792r
46 Bahamas 35 27 24 10 21 29 20 15 48 47 Bermuda 275 244 536 500 583 549 390 404 381r
48 Brazil 1,303 1,162 1,024 936 887 763 905 849 894 49 British West Indies 190 109 104 117 127 157 181 95 51 50 Mexico 1,128 1,392 1,545 1,431 1,478 1,613 1,678 1,529 l,565r
51 Venezuela 357 576 401 361 384 365 439 435 466r
52 Asia 8,376 8,713 7,192 7,080 7,690 8,579 9,165 9,101 9,173r
53 Japan 2,003 1,976 1,681 1,486 1,511 1,823 2,074 2,082 l,882r
54 Middle Eastern oil-exporting countries' 971 1,107 1,135 1,286 1,465 1,479 1,625 1,533 1,241
55 Africa 746 680 711 685 738 682 631 716 766r
56 Oil-exporting countries2 166 119 165 116 202 221 171 82 160
57 Other3 1,368 1,246 1,140 1,377 1,405 1,544 1,537 1,546 l,513r
1. Comprises Bahrain, Iran, Iraq, Kuwait, Oman, Qatar, Saudi Arabia, and United Arab 2. Comprises Algeria, Gabon, Libya, and Nigeria. Emirates (Trucial States). 3. Includes nonmonetary international and regional organizations.
Digitized for FRASER http://fraser.stlouisfed.org/ Federal Reserve Bank of St. Louis

A60 International Statistics • February 2001
3.24 FOREIGN TRANSACTIONS IN SECURITIES Millions of dollars
2 0 0 0 2 0 0 0
Transaction, and area or country 1998 1 9 9 9 Jan . -Oct. Apr. May June July Aug. Sept. Oct.p
U.S. corporate securities
STOCKS
1 Foreign purchases 1 , 5 7 4 , 1 9 2 2 , 3 4 0 , 6 5 9 3 , 0 3 4 , 2 1 5 3 0 9 , 7 7 8 2 6 8 , 4 5 4 3 0 0 , 3 5 6 2 7 1 , 1 4 5 2 8 6 . 8 1 9 2 9 7 , 6 2 6 3 4 0 , 6 0 8 2 Foreign sales 1 , 5 2 4 , 2 0 3 2 , 2 3 3 , 1 3 7 2 . 8 8 0 , 1 0 6 3 0 6 , 4 7 4 2 6 2 , 1 4 2 2 8 2 , 5 6 3 2 5 5 , 9 9 9 2 6 2 , 7 7 5 2 8 9 , 0 6 7 3 2 4 , 2 1 5
3 Net purchases, or sales (—) 49,989 107,522 154,109 3,304 6,312 17,793 15,146 24,044 8,559 16,393
4 Foreign countries 50,369 107,578 154,090 3,243 6,291 17,823 15,136 24,020 8,603 16,395
5 Europe 6 8 , 1 2 4 9 8 , 0 6 0 1 4 5 , 9 5 7 12 ,289 7 , 4 9 6 1 4 , 8 5 3 1 2 , 9 2 2 1 5 , 6 7 8 1 0 , 0 1 4 1 4 , 0 3 2 6 France 5 , 6 7 2 3 , 8 1 3 5 , 2 7 9 1,341 - 5 8 8 - 6 5 3 1 ,292 5 7 5 - 5 6 5 1 ,757 7 Germany 9 , 1 9 5 1 3 , 4 1 0 2 9 , 9 9 8 3 , 4 3 1 3 , 3 5 5 2 , 5 4 4 3 7 1 2 , 6 7 0 6 4 3 1 , 3 9 4 8 Netherlands 8 , 2 4 9 8 , 0 8 3 2 , 8 6 9 113 - 1 1 3 5 8 4 5 5 4 5 9 4 7 9 2 - 1 6 7 9 Switzerland 5 , 0 0 1 5 , 6 5 0 1 3 , 2 4 5 1 ,689 5 8 5 6 7 1 ,702 1 , 1 1 4 7 8 0 4 9 1
10 United Kingdom 2 3 , 9 5 2 4 2 , 9 0 2 4 7 , 3 5 5 5 5 8 1 ,440 7 , 0 2 6 6 , 0 3 3 7 , 0 9 8 5 , 1 6 3 6 , 3 1 2 11 Canada - 4 , 6 8 9 - 3 3 5 2 , 8 4 5 9 8 3 4 - 4 6 - 1 6 6 1 ,038 - 9 2 2 2 5 6 12 Latin America and Caribbean 7 5 7 5 , 1 8 7 - 1 2 , 0 7 5 - 1 1 , 4 4 1 - 2 , 6 3 3 1 , 8 9 8 1 ,363
9 8 4 , 9 0 7 - 3 , 4 0 5 - 4 , 4 0 3
13 Middle East1 - 1 , 4 4 9 - 1 , 0 6 6 8 , 5 7 2 2 , 0 7 1 7 0 5 4 1 ,363
9 8 9 0 8 5 2 7 5 4 14 Other Asia - 1 2 , 3 5 1 4 , 4 4 5 7 , 7 3 6 5 2 - 1 2 1 8 7 0 8 1 5 1 ,789 2 , 7 0 4 5 , 8 4 8 15 Japan - 1 , 1 7 1 5 , 7 2 3 - 1 9 6 - 4 4 6 - 1 , 0 4 5 4 3 9 4 9 2 5 6 8 2 , 4 6 7 2 , 6 5 1 16 Africa 6 3 9 3 7 2 3 7 9 2 2 8 - 5 0 5 4 - 1 2 4 2 - 5 6 - 2 8 17 Other countries - 6 6 2 9 1 5 6 7 6 3 5 6 0 190 2 2 8 - 3 0 2 2 1 6 - 6 4
18 Nonmonetary international and regional organizations - 3 8 0 - 5 6 21 61 21 - 3 0 10 24 - 4 2 - 2
BONDS 2
19 Foreign purchases 9 0 5 , 7 8 2 8 5 4 , 6 9 2 9 7 3 , 7 0 0 8 8 , 5 5 5 8 9 , 7 6 0 1 0 7 , 2 8 1 8 7 . 5 8 0 1 0 7 , 8 0 8 1 0 6 , 3 8 4 102 ,981 2 0 Foreign sales 7 2 7 , 0 4 4 6 0 2 , 1 0 0 7 0 3 , 5 7 5 7 0 , 8 5 1 6 8 , 2 1 2 7 5 , 1 1 7 6 7 , 0 1 0 6 9 , 5 1 4 7 6 , 2 2 5 7 1 , 6 1 2
2 1 Net purchases, or sales ( - ) 178,738 252,592 270,125 17,704 21,548 32,164 20,570 38,294 30,159 31,369
2 2 Foreign countries 179,081 252,994 270,093 17,709 21,490 32,215 20,482 38,215 30,161 31,382
2 3 Europe 1 3 0 , 0 5 7 1 4 0 , 6 7 4 1 4 6 , 5 4 7 7 , 6 4 0 9 , 4 7 5 1 9 , 3 7 8 7 , 7 8 9 2 1 , 6 1 8 1 7 , 0 5 8 1 6 , 9 8 9 2 4 France 3 , 3 8 6 1 ,870 1 ,806 - 3 4 104 159 8 5 3 3 4 - 8 1 9 3 4 7 2 5 Germany 4 , 3 6 9 7 , 7 2 3 3 ,611 2 8 8 175 8 9 7 154 1 ,185 4 4 4 3 6 2 6 Netherlands 3 , 4 4 3 2 , 4 4 6 6 7 2 2 7 9 2 8 3 - 1 6 9 - 5 7 5 8 5 0 - 8 1 8 8 4 8 2 7 Switzerland 4 , 8 2 6 4 , 5 5 3 3 , 4 3 8 - 1 8 9 3 2 4 1 ,003 7 5 7 3 3 3 3 4 9 2 8 United Kingdom 9 9 , 6 3 7 1 0 6 , 3 4 4 1 1 4 , 3 8 0 4 , 2 7 4 6 , 2 3 7 1 6 , 2 1 8 4 , 0 0 3 15 ,909 1 5 , 9 5 0 1 2 , 5 0 8 2 9 Canada 6 , 1 2 1 6 , 0 4 3 1 1 , 6 9 4 7 6 4 1 ,076 1 ,092 9 4 3 1 ,965 8 1 1 8 9 7 3 0 Latin America and Caribbean 2 3 , 9 3 8 5 8 , 7 8 3 4 8 , 7 2 0 4 , 8 2 3 2 , 7 8 6 4 , 3 9 0 4 , 7 4 3 3 , 8 2 9 6 , 3 3 8 5 , 0 2 1 31 Middle East1 4 , 9 9 7 1 .979 3 6 8 3 4 7 - 4 7 9 9 2 6 4 5 4 - 7 0 2 - 5 4 3 2 Other Asia 1 2 , 6 6 2 4 2 , 8 1 7 6 0 , 9 0 2 4 , 1 0 3 7 , 9 9 6 7 , 0 5 9 6 , 6 0 1 1 0 , 5 6 2 6 , 7 7 7 8 , 2 1 4 3 3 Japan 8 , 3 8 4 17,541 2 8 , 4 7 5 5 8 0 3 , 4 9 1 3 , 9 4 5 3 , 3 2 0 5 , 6 6 4 3 . 5 7 3 3 , 6 9 0 3 4 Africa 190 1 ,411 8 3 7 3 5 4 0 7 2 10 3 7 4 9 5 8 3 5 Other countries 1 ,116 1 ,287 1 ,025 - 3 164 125 132 150 - 1 7 0 2 5 7
3 6 Nonmonetary international and regional organizations - 3 4 3 - 4 0 2 63 - 5 58 - 5 1 88 110 - 2 - 1 3
Foreign securities
3 7 Stocks, net purchases, or sales ( —) 6 , 2 2 7 1 5 , 6 4 0 - 9 , 8 2 1 5 7 6 8 , 3 3 4 - 2 , 0 4 6 - 1 4 , 9 7 3 6 0 2 10 ,479 3 , 1 5 2 3 8 Foreign purchases 9 2 9 , 9 2 3 1 , 1 7 7 . 3 0 3 1 . 5 2 4 , 1 4 5 1 5 4 , 3 2 2 1 4 4 , 5 9 2 1 5 2 , 1 4 9 1 3 3 , 9 0 2 1 4 3 , 6 1 8 1 4 9 , 6 9 6 1 5 5 , 7 0 5 3 9 Foreign sales 9 2 3 , 6 9 6 1 . 1 6 1 , 6 6 3 1 , 5 3 3 , 9 6 6 1 5 3 , 7 4 6 1 3 6 , 2 5 8 1 5 4 , 1 9 5 1 4 8 , 8 7 5 1 4 3 , 0 1 6 1 3 9 , 2 1 7 1 5 2 , 5 5 3 4 0 Bonds, net purchases, or sales ( - ) - 1 7 , 3 5 0 - 5 , 6 7 6 - 1 0 , 6 1 3 7 9 8 4 , 2 6 3 5 , 7 7 0 - 6 , 4 8 4 - 2 , 8 1 1 2 6 7 - 3 , 1 5 7 4 1 Foreign purchases 1 ,328 ,281 7 9 8 , 2 6 7 7 8 1 , 4 6 5 6 3 , 9 1 6 7 9 , 5 3 4 8 2 , 9 5 1 6 8 , 4 2 0 7 4 , 8 0 3 9 2 , 1 8 2 9 9 , 2 5 5 4 2 Foreign sales 1 , 3 4 5 , 6 3 1 8 0 3 , 9 4 3 7 9 2 , 0 7 8 6 3 , 1 1 8 7 5 , 2 7 1 7 7 , 1 8 1 7 4 , 9 0 4 7 7 , 6 1 4 9 1 , 9 1 5 1 0 2 , 4 1 2
4 3 Net purchases, or sales ( - ) , of stocks and bonds . . . . -11 ,123 9,964 -20,434 1,374 12,597 3,724 -21,457 -2 ,209 10,746 - 5
4 4 Foreign countries -10 ,778 9,679 -20 ,761 1,209 12,521 3,874 -21,216 -2 ,055 10,570 - 1 7 2
4 5 Europe 12 ,632 5 9 , 2 4 7 - 2 7 , 1 8 3 1 ,535 10 ,113 - 1 , 4 3 4 - 2 3 , 8 5 6 - 6 , 1 9 0 6 , 5 3 0 - 3 , 7 4 8 4 6 Canada - 1 , 9 0 1 - 9 9 9 - 2 , 1 6 6 - 4 2 2 - 1 , 2 3 4 1 ,399 2 7 9 9 1 6 - 1 , 1 4 2 1 ,774 4 7 Latin America and Caribbean - 1 3 , 7 9 8 - 4 , 7 2 6 - 1 3 , 6 0 1 - 5 , 1 5 5 - 8 4 5 1,981 - 7 1 5 - 5 6 2 6 6 5 1 ,195 4 8 - 3 , 9 9 2 - 4 2 , 9 6 1 19 ,697 5 ,641 4 , 7 7 0 1 . 8 7 8 3 , 1 4 5 3 , 1 6 0 3 , 8 6 7 8 0 4 9 Japan - 1 , 7 4 2 - 4 3 . 6 3 7 18 ,581 4 , 6 8 8 5 , 7 7 7 3 , 2 4 3 3 , 9 0 4 1 ,478 2 , 0 8 2 - 1 , 1 0 5 5 0 Africa - 1 , 2 2 5 7 1 0 9 8 3 - 1 4 3 - 5 1 - 3 3 5 3 2 - 5 0 4 9 12 5 1 Other countries - 2 , 4 9 4 - 1 . 5 9 2 1 ,509 - 2 4 7 - 2 3 2 8 3 - 6 0 1 6 7 1 6 0 1 5 1 5
5 2 Nonmonetary international and regional organizations - 3 4 5 285 331 165 76 - 1 5 0 - 2 4 1 - 1 5 4 180 167
1. Comprises oil-exporting countries as follows: Bahrain, Iran, Iraq, Kuwait, Oman, Qatar, 2. Includes state and local government securities and securities of U.S. government Saudi Arabia, and United Arab Emirates (Trucial States). agencies and corporations. Also includes issues of new debt securities sold abroad by U.S.
corporations organized to finance direct investments abroad.
Digitized for FRASER http://fraser.stlouisfed.org/ Federal Reserve Bank of St. Louis

Securities Holdings and Transactions A61
3.25 MARKETABLE U.S. TREASURY BONDS A N D NOTES Foreign Transactions'
Millions of dollars; net purchases, or sales ( —) during period
Area or country 1998 1999
2000 2000
Area or country 1998 1999 Jan.— Oct. Apr. May June July Aug. Sept. Oct.p
1 Total estimated 49,039 -9 ,953 -29 ,830 14,520 -7 ,018 -17 ,932 -6 ,061 - 1 1 4 -8 ,516 -2 ,944
2 Foreign countries 46,570 -10,518 -29,410 14,484 -6 ,820 -17,597 -5 ,746 - 1 1 7 -8 ,741 -3 ,129
3 Europe 23,797 -38,228 -32,727 - 6 3 2 -2 ,526 -9 ,935 -6 ,351 3,707 -1 ,284 -3 ,506 4 Belgium and Luxembourg 3,805 - 8 1 116 - 4 9 8 - 7 4 3 252 - 1 3 8 138 - 1 2 7 320 5 Germany 144 2,285 -4 ,054 -1 ,676 74 609 -2 ,199 - 3 6 -1 ,738 1,424 6 Netherlands -5 ,533 2,122 3.498 700 -1 ,159 - 3 8 9 - 5 8 4 91 836 183 7 Sweden 1,486 1,699 858 - 2 8 9 266 - 4 7 114 56 214 - 1 1 8 8 Switzerland 5,240 -1 ,761 -10,090 - 2 8 8 - 3 3 7 -1 ,928 -1 ,398 - 3 3 8 - 9 5 9 - 5 8 9 United Kingdom 14,384 -20,232 -23,227 - 5 3 3 178 -9 ,243 -4 ,372 3,054 -1 ,865 -3 ,585
10 Other Europe and former U.S.S.R 4,271 -22 ,260 172 1,952 - 8 0 5 811 2,226 742 2,355 -1 ,672 11 Canada 615 7,348 2,357 1,819 - 6 8 1 226 - 8 7 2 222 1,417 160
12 Latin America and Caribbean -3 ,662 -7 ,523 -4 ,238 2,509 -3 ,122 -3 ,839 1,415 245 -4 ,979 3,887 13 Venezuela 59 362 737 26 4 16 89 45 314 152 14 Other Latin America and Caribbean 9,523 1,661 -8 ,649 258 - 5 4 8 -4 ,748 1,261 61 -4 ,936 2,954 15 Netherlands Antilles -13,244 -9 ,546 3,674 2,225 -2 ,578 893 65 139 - 3 5 7 781 16 Asia 27,433 29,359 3,350 11,166 - 9 0 8 -3 ,988 - 4 8 8 -4 ,918 -3 ,319 -4 ,719 17 Japan i 3,048 20,102 9,959 10,855 -2 ,486 -2 ,660 672 367 1,717 1,577 18 Africa 751 -3 ,021 - 3 5 4 4 - 1 1 4 - 1 3 0 4 9 - 1 3 9 - 6 19 Other -2 ,364 1,547 2,202 - 3 8 2 531 69 546 618 - 4 3 7 1,055
20 Nonmonetary international and regional organizations 2,469 565 - 4 2 0 36 - 1 9 8 - 3 3 5 - 3 1 5 3 225 185 21 International 1,502 190 - 3 5 2 30 - 1 5 8 - 2 8 6 - 3 3 3 15 391 39 22 Latin American regional 199 666 71 6 - 1 4 - 9 - 1 - 1 0 1 28
M E M O 23 Foreign countries 46,570 -10,518 -29,410 14,484 -6 ,820 -17,597 -5 ,746 - 1 1 7 -8 ,741 -3 ,129 24 Official institutions 4,123 -9 ,861 -2 ,409 6,403 -1 ,405 -1 ,412 - 6 3 9 449 -6 ,626 -7 ,150 25 Other foreign 42.447 - 6 5 7 -27,001 8,081 -5 ,415 -16,185 -5 ,107 - 5 6 6 -2 ,115 4,021
Oil-exporting countries 26 Middle East* -16,554 2,207 4,338 811 572 859 267 217 -1 ,030 - 7 2 4 27 2 0 0 0 0 0 0 0 0 0
1. Official and private transactions in marketable U.S. Treasury securities having an original maturity of more than one year. Data are based on monthly transactions reports. Excludes nonmarketable U.S. Treasury bonds and notes held by official institutions of foreign countries.
2. Comprises Bahrain, Iran, Iraq, Kuwait, Oman, Qatar, Saudi Arabia, and United Arab Emirates (Trucial States).
3. Comprises Algeria, Gabon, Libya, and Nigeria.
Digitized for FRASER http://fraser.stlouisfed.org/ Federal Reserve Bank of St. Louis
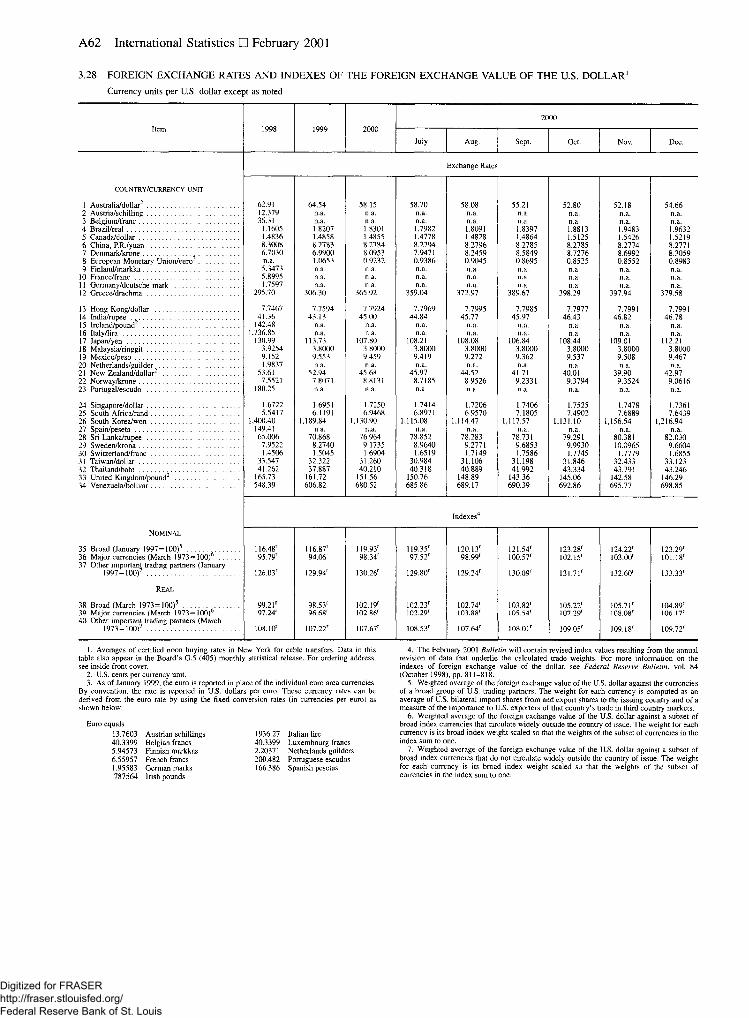
A62 International Statistics • February 2001
3.28 FOREIGN EXCHANGE RATES AND INDEXES OF THE FOREIGN EXCHANGE VALUE OF THE U.S. DOLLAR1
Currency units per U.S. dollar except as noted
2000 1999 2000 1999 2000
July Aug. Sept. Oct. Nov. Dec.
Exchange Rates
COUNTRY/CURRENCY UNIT
1 Australia/dollar2 62.91 64.54 58.15 58.70 58.08 55.21 52.80 52.18 54.66 2 Austria/schilling 12.379 n.a. n.a. n.a. n.a. n.a. n.a. n.a. n.a. 3 Belgium/franc 36.31 n.a. n.a. n.a. n.a. n.a. n.a. n.a. n.a. 4 Brazil/real 1.1605 1.8207 1.8301 1.7982 1.8091 1.8397 1.8813 1.9483 1.9632 5 Canada/dollar 1.4836 1.4858 1.4855 1.4778 1.4828 1.4864 1.5125 1.5426 1.5219 6 China, P.R./yuan 8.3008 8.2783 8.2784 8.2794 8.2796 8.2785 8.2785 8.2774 8.2771 7 Denmark/krone 6.7030 6.9900 8.0953 7.9471 8.2459 8.5849 8.7276 8.6992 8.3059 8 European Monetary Union/euro3 n.a. 1.0653 0.9232 0.9386 0.9045 0.8695 0.8525 0.8552 0.8983 9 Finland/markka 5.3473 n.a. n.a. n.a. n.a. n.a. n.a. n.a. n.a.
10 France/franc 5.8995 n.a. n.a. n.a. n.a. n.a. n.a. n.a. n.a. 11 Germany/deutsche mark 1.7597 n.a. n.a. n.a. n.a. n.a. n.a. n.a. n.a. 12 Greece/drachma 295.70 306.30 365.92 359.04 372.97 389.67 398.29 397.94 379.58
13 Hong Kong/dollar 7.7467 7.7594 7.7924 7.7969 7.7995 7.7985 7.7977 7.7991 7.7991 14 India/rupee 41.36 43.13 45.00 44.84 45.77 45.97 46.43 46.82 46.78 15 Ireland/pound2 142.48 n.a. n.a. n.a. n.a. n.a. n.a. n.a. n.a. 16 Italy/lira 1,736.85 n.a. n.a. n.a. n.a. n.a. n.a. n.a. n.a. 17 Japan/yen 130.99 113.73 107.80 108.21 108.08 106.84 108.44 109.01 112.21 18 Malaysia/ringgit 3.9254 3.8000 3.8000 3.8000 3.8000 3.8000 3.8000 3.8000 3.8000 19 Mexico/peso 9.152 9.553 9.459 9.419 9.272 9.362 9.537 9.508 9.467 20 Netherlands/guilder 1.9837 n.a. n.a. n.a. n.a. n.a. n.a. n.a. n.a. 21 New Zealand/dollar2 53.61 52.94 45.68 45.97 44.52 41.71 40.01 39.90 42.97 22 Norway/krone 7.5521 7.8071 8.8131 8.7185 8.9526 9.2331 9.3794 9.3524 9.0616 23 Portugal/escudo 180.25 n.a. n.a. n.a. n.a. n.a. n.a. n.a. n.a.
24 Singapore/dollar 1.6722 1.6951 1.7250 1.7414 1.7206 1.7406 1.7525 1.7478 1.7361 2.5 South Africa/rand 5.5417 6.1191 6.9468 6.8971 6.9570 7.1805 7.4902 7.6889 7.6439 26 South Korea/won 1,400.40 1,189.84 1,130.90 1,115.08 1,114.47 1,117.57 1,131.10 1,156.54 1,216.94 27 Spain/peseta 149.41 n.a. n.a. n.a. n.a. n.a. n.a. n.a. n.a. 28 Sri Lanka/rupee 65.006 70.868 76.964 78.852 78.283 78.731 79.291 80.381 82.030 2 9 Sweden/krona 7.9522 8.2740 9.1735 8.9640 9.2771 9.6853 9.9930 10.0965 9.6604 30 Switzerland/franc 1.4506 1.5045 1.6904 1.6519 1.7149 1.7586 1.7745 1.7779 1.6855 31 Taiwan/dollar 33.547 32.322 31.260 30.984 31.106 31.198 31.846 32.433 33.123 32 Thailand/baht 41.262 37.887 40.210 40.318 40.889 41.992 43.334 43.791 43.246 33 United Kingdom/pound2 165.73 161.72 151.56 150.76 148.89 143.36 145.06 142.58 146.29 34 Venezuela/bolivar 548.39 606.82 680.52 685.86 689.17 690.39 692.86 695.77 698.85
Indexes4
NOMINAL
35 Broad (January 1997= 100)5 116.48' 116.87' 119.93' 119.35' 120.13' 121.54' 123.28' 124.22' 123.29' 36 Major currencies (March 1973= 100)6 95.79' 94.06' 98.34' 97.52' 98.99' 100.57' 102.15' 103.00' 101.18' 37 Other important trading partners (January
1997= 100)7 126.03' 129.94' 130.26' 129.80' 129.24' 130.09' 131.71' 132.60' 133.33'
REAL
38 Broad (March 1973= 100)5 99.2 l r 98.53' 102.19' 102.23' 102.74' 103.82' 105.22' 105.71' 104.89' 39 Major currencies (March 1973= 100)6 97.24' 96.68' 102.86' 102.29' 103.88' 105.54' 107.29' 108.08' 106.17' 40 Other important trading partners (March
1973=100)' 108.10' 107.22' 107.67' 108.53' 107.64' 108.01' 109.05' 109.18' 109.72'
1. Averages of certified noon buying rates in New York for cable transfers. Data in this table also appear in the Board's G.5 (405) monthly statistical release. For ordering address, see inside front cover.
2. US. cents per currency unit. 3. As of January 1999, the euro is reported in place of the individual euro area currencies.
By convention, the rate is reported in U.S. dollars per euro. These currency rates can be derived from the euro rate by using the fixed conversion rates (in currencies per euro) as shown below:
Euro equals 13.7603 Austrian schillings 1936.27 40.3399 Belgian francs 40.3399 5.94573 Finnish markkas 2.20371 6.55957 French francs 200.482 1.95583 German marks 166.386 .787564 Irish pounds
4. The February 2001 Bulletin will contain revised index values resulting from the annual revision of data that underlie the calculated trade weights. For more information on the indexes of foreign exchange value of the dollar, see Federal Reserve Bulletin, vol. 84 (October 1998), pp. 811-818.
5. Weighted average of the foreign exchange value of the U.S. dollar against the currencies of a broad group of U.S. trading partners. The weight for each currency is computed as an average of U.S. bilateral import shares from and export shares to the issuing country and of a measure of the importance to U.S. exporters of that country's trade in third country markets.
6. Weighted average of the foreign exchange value of the U.S. dollar against a subset of broad index currencies that circulate widely outside the country of issue. The weight for each currency is its broad index weight scaled so that the weights of the subset of currencies in the index sum to one.
7. Weighted average of the foreign exchange value of the U.S. dollar against a subset of broad index currencies that do not circulate widely outside the country of issue. The weight for each currency is its broad index weight scaled so that the weights of the subset of currencies in the index sum to one.
Italian lire Luxembourg francs Netherlands guilders Portuguese escudos Spanish pesetas
Digitized for FRASER http://fraser.stlouisfed.org/ Federal Reserve Bank of St. Louis

A63
Guide to Statistical Releases and Special Tables
STATISTICAL RELEASES—List Published Semiannually, with Latest Bulletin Reference
Issue Page Anticipated schedule of release dates for periodic releases December 2000 A72
SPECIAL TABLES—Data Published Irregularly, with Latest Bulletin Reference
Title and Date Issue Page
Assets and liabilities of commercial banks December 31, 1999 May 2000 A64 March 31, 2000 August 2000 A64 June 30, 2000 November 2000 A64 September 30, 2000 February 2001 A64
Terms of lending at commercial banks February 2000 May 2000 A66 May 2000 August 2000 A66 August 2000 November 2000 A66 November 2000 February 2001 A66
Assets and liabilities of U.S. branches and agencies of foreign banks December 31, 1999 May 2000 A72 March 31, 2000 August 2000 A72 June 30, 2000 November 2000 A72 September 30, 2000 February 2001 A72
Pro forma balance sheet and income statements for priced service operations March 31, 2000 August 2000 A76 June 30, 2000 November 2000 A76 September 30, 2000 February 2001 A76
Residential lending reported under the Home Mortgage Disclosure Act 1998 September 1999 A64 1999 September 2000 A64
Disposition of applications for private mortgage insurance 1998 September 1999 A73 1999 September 2000 A73
Small loans to businesses and farms 1998 September 1999 A76 1999 September 2000 A76
Community development lending reported under the Community Reinvestment Act 1998 September 1999 A79 1999 September 2000 A79
Digitized for FRASER http://fraser.stlouisfed.org/ Federal Reserve Bank of St. Louis

A64 Special Tables • February 2001
4.20 DOMESTIC A N D FOREIGN OFFICES Insured Commercial Bank Assets and Liabilities Consolidated Report of Condition, September 30, 2000
Millions of dollars except as noted
Item Total Domestic total
Banks with foreign offices' Banks with domestic offices only2
Item Total Domestic total
Total Domestic Over 100 Under 100
1 Total assets3 5,991,548 5,288,698 4,167,981 3,465,131 1,556,846 266,721
2 Cash and balances due from depository institutions 327,364 234,607 257,843 165,087 57,626 11,894 3 Cash items in process of collection, unposted debits, and currency and coin 119,249 115,946 29,339 f 4 Cash items in process of collection and unposted debits I n.a. 92,949 19,221 1 5 Currency and coin n.a. n.a. n.a. 22,997 10,118 n.a. 6 Balances due from depository institutions in the United States 1 39,569 29,181 19,511 1 7 Balances due from banks in foreign countries and foreign central banks 1 86,109 7,135 1,008 1 8 Balances due from Federal Reserve Banks 1 12,916 12,824 7,769 i
M E M O 9 Non-interest-bearing balances due from commercial banks in the United States
(included in balances due from depository institutions in the United States) n.a. 38,411 n.a. 19,009 14,936 4,466
10 Total securities, held-to-maturity (amortized cost) and available-for-sale (fair value) 1,042,258 595,992 379,692 66,574 11 U.S. Treasury securities 92,355 63,503 23,716 5,135 12 U.S. government agency and corporation obligations (excludes mortgage-backed
223,907 82,806 106,231 34,870 223,907 82,806 106,231 34,870 13 Issued by U.S. government agencies 4,969 2,466 1,862 640 14 Issued by U.S. government-sponsored agencies 218,938 80,340 104,368 34,230 15 Securities issued by states and political subdivisions in the United States 89,922 30,316 48,283 11,323 16 General obligations 64,748 20,205 36,435 8.108 17 Revenue obligations 24,553 9,721 11.660 3,172 18 Industrial development and similar obligations 621 389 187 44 19 Mortgage-backed securities (MBS) 442,916 286,928 144,039 11,949 20 Pass-through securities 280,165 191,994 80,099 8,072 21 Guaranteed by GNMA 70,248 n.a. 40,639 n.a. 26,570 3,039 22 Issued by FNMA and FHLMC 207,585 149,791 52,801 4,993 23 Privately issued 2,332 1,563 728 41 24 Other mortgage-backed securities (includes CMOs, REMICs, and stripped MBS) 162,752 94,935 63,940 3,877 25 Issued or guaranteed by FNMA, FHLMC, or GNMA 106,355 63,892 38,904 3,558 26 Collateralized by MBS issued or guaranteed by FNMA, FHLMC, or GNMA 4,258 3,418 739 101 27 All other mortgage-backed securities 52,139 27,625 24,296 218 28 Other debt securities 153,873 105,443 46,461 1,968 29 Other domestic debt securities n.a. 51,361 42,102 n.a. 30 Foreign debt securities n.a. 54,082 4,359 n.a. 31 39,285 26,995 10,963 1,327 32 Investments in mutual funds and other equity securities with readily determinable
12,384 9,517 2,552 315 33 All other equity securities 26,901 17,478 8,410 1,012
34 Federal funds sold and securities purchased under agreements to resell 223,594 178,110 176,735 131,250 35,941 10,918
35 Total loans and lease-financing receivables, gross 3,737,074 3,444,328 2,551,833 2,259,087 1,017,042 168,199 36 LESS: Unearned income on loans 2,940 2,385 1,486 932 1,188 265 37 Total loans and leases (net of unearned income) 3,734,134 3,441,943 2,550,347 2,258,155 1,015,854 167,934 38 LESS: Allowance for loan and lease losses 61,319 n.a. 42,605 n.a. 16,443 2,270 39 LESS: Allocated transfer risk reserves 123 n.a. 121 n.a. 1 1 40 EQUALS: Total loans and leases, net 3,672,693 n.a. 2,507,620 n.a. 999,410 165,663
Total loans and leases, gross, by category 975,871 572,157 98,043 41 Loans secured by real estate 1,646,072 1,614,630 975,871 944,429 572,157 98,043
42 Construction and land development f 155,590 f 83,958 62,526 9,106 43 Farmland 33,919 6,664 15,872 11,383 44 One- to four-family residential properties 1 912,161 1 593,813 271,706 46,642 45 Revolving, open-end loans, extended under lines of credit n.a. 122,853 n.a. 8 9 , 2 1 7 31,056 2,580 46 All other loans 1 789,307 1 504,595 240,650 44,062 47 Multifamily (five or more) residential properties 1 59,903 1 33,385 24,297 2,221 48 Nonfarm nonresidential properties • 453,058 1 226,610 197,756 28,691 49 Loans to depository institutions 121,840 105,012 108,989 92,161 12,754 97 50 Commercial banks in the United States n.a. n.a. 74,487 73,624 12,485 n.a. 51 Other depository institutions in the United States n.a. n.a. 11,650 11,629 174 n.a. 52 Banks in foreign countries n.a. n.a. 22,852 6,909 95 n.a. 53 Loans to finance agricultural production and other loans to farmers 47,094 46,204 12,510 11,620 18,299 16,286 54 Commercial and industrial loans 1,037,675 872,892 834,855 670,072 173,484 29,336 55 U.S. addressees (domicile) n.a. n.a. 682,661 659,947 172,699 n.a. 56 Non-U.S. addressees (domicile) n.a. n.a. 152,194 10,125 785 n.a. 57 Acceptances of other banks 1,316 645 1,243 572 68 5 58 U.S. banks n.a. n.a. 315 268 n.a. n.a. 59 Foreign banks n.a. n.a. 929 305 n.a. n.a. 60 Loans to individuals for household, family, and other personal expenditures (includes
purchased paper) 565,100 521,737 327,109 283,747 215,784 22,207 61 Credit cards and related plans 214,559 n.a. 119,478 n.a. 94,157 925 62 Other (includes single payment and installment) 350,541 n.a. 207,632 n.a. 121,627 21,282 63 Obligations (other than securities) of states and political subdivisions in the United States
6,223 765 (includes nonrated industrial development obligations) 20,975 20,960 13,987 13,972 6,223 765 64 135,918 107,129 127,653 9 8,865 7,484 780 65 Loans to foreign governments and official institutions n.a. n.a. 6,811 1,957 9 n.a. 66 n.a. n.a. 120,842 96,908 7,475 n.a. 67 Loans for purchasing and carrying securities n.a. n.a. n.a. 21,057 1,518 n.a. 68 All other loans (excludes consumer loans) n.a. n.a. n.a. 75,851 5,957 n.a. 69 161,085 155,119 149,615 143,649 10,790 680
70 Assets held in trading accounts 279,519 f 278,703 f 811 1
71 Premises and fixed assets (including capitalized leases) 73,771 1 45,828 1 22,677 5,266 17 Other real estate owned 3,105 n.a. 1,652 n.a. 1,154 299 73 Investments in unconsolidated subsidiaries and associated companies 9,371 I 8,919 I 403 50 74 Customers' liability on acceptances outstanding 9,292 1 9,076 1 214 2 75 Net due from own foreign offices, Edge Act and agreement subsidiaries, and IBFs n.a. 19,458 n.a. 19,458 n.a. n.a. 76 Intangible assets 101,515 n.a. 87,232 n.a. 13,413 870 77 All other assets 249,066 n.a. 198,380 n.a. 45,506 5,180
Digitized for FRASER http://fraser.stlouisfed.org/ Federal Reserve Bank of St. Louis

Commercial Banks A65
4.20 DOMESTIC A N D FOREIGN OFFICES Insured Commercial Bank Assets and Liabilities—Continued Consolidated Report of Condition, September 30, 2000
Millions of dollars except as noted
Item Total Domestic total
Banks with foreign offices' Banks with domestic offices only2
Item Total Domestic total
Total Domestic Over 100 Under 100
78 Total liabilities, limited-life preferred stock, and equity capital 5,991,546 n.a. 4,167,981 n.a. 1,556,844 266,721
79 Total liabilities 5,480,528 4,777,677 3,827,322 3,124,472 1,414,916 238,289
80 Total deposits 3,990,401 3,296,441 2,639,176 1,945,215 1,126,624 224,602 81 Individuals, partnerships, and corporations 3,555,181 3,069,559 2,309,114 1,823,492 1,043,541 202,527 82 U.S. government n.a. 7,737 n a. 6,728 872 137 83 States and political subdivisions in the United States n.a. 150,981 n.a. 68,561 64,358 18,063 84 Commercial banks in the United States 100,601 33,820 91,848 25,068 7,748 1,004 85 Other depository institutions in the United States n.a. 8,142 n.a. 3,402 3,341 1,399 86 Foreign banks, governments, and official institutions 141,849 9,602 141,312 9,065 525 11 87 Banks n.a. n.a. 103,410 8,038 521 n.a. 88 Governments and official institutions n.a. n.a. 37,902 1,027 4 n.a. 89 Certified and official checks 17,825 16,599 10,126 8,900 6,239 1,461
90 Total transaction accounts 621,916 353,094 207,182 61,640 91 Individuals, partnerships, and corporations 526,894 294,175 178,901 53,818 92 U.S. government 1,489 1,114 322 53 93 States and political subdivisions in the United States 43,108 20,242 16,870 5,996 94 Commercial banks in the United States 24,370 20,221 3,923 226 95 Other depository institutions in the United States 2,711 1,967 668 75 96 Foreign banks, governments, and official institutions 6,745 6,475 259 11 97 Banks n.a. 5,938 255 n.a. 98 Governments and official institutions n.a. 537 4 n.a. 99 Certified and official checks 16,599 8,900 6,239 1,461
100 Demand deposits (included in total transaction accounts) 484,062 314,282 136,615 33,165 101 Individuals, partnerships, and corporations 414,199 263,835 120,175 30,189 102 U.S. government 1,368 1,070 255 43 103 States and political subdivisions in the United States 18,095 11,818 5,115 1,162 104 Commercial banks in the United States n.a. 24,363 n.a. 20,220 3,918 226 105 Other depository institutions in the United States 2,695 1,967 654 74 106 Foreign banks, governments, and official institutions 6,743 6,473 259 11 107 Banks n.a. 5,938 255 n.a. 108 Governments and official institutions n.a. 536 4 n.a. 109 Certified and official checks 16,599 8,900 6,239 1,461
110 Total nontransaction accounts 2,674,525 1,592,122 919,442 162,961 111 Individuals, partnerships, and corporations 2,542,666 1,529,318 864,639 148,709 112 U.S. government 6,248 5,614 550 84 113 States and political subdivisions in the United States 107,873 48,319 47,488 12,066 114 Commercial banks in the United States 9,449 4,846 3,826 778 115 Other depository institutions in the United States 5,431 1,435 2,673 1,324 116 Foreign banks, governments, and official institutions 2,857 2,591 266 1 117 Banks n.a. 2,101 266 n.a. 118 Governments and official institutions n.a. 490 0 n.a.
119 Federal funds purchased and securities sold under agreements to repurchase 457,647 426,278 369,047 337,678 85,125 3,475 120 Demand notes issued to the U.S. Treasury 37,835 37,835 34,985 34,985 2,758 91 121 Trading liabilities 195,336 n.a. 195,271 n.a. 64 0 122 Other borrowed money 537,689 492,579 362,272 317,162 167,602 7,815 123 Banks' liability on acceptances executed and outstanding 9,346 6,784 9,130 6,568 214 2 124 Notes and debentures subordinated to deposits 83,863 n.a. 79,674 n.a. 4,169 19 125 Net due to own foreign offices, Edge Act and agreement subsidiaries, and IBFs n.a. 201,572 n.a. 201,572 n.a. n.a. 126 All other liabilities 168,412 n.a. 137,768 n.a. 28,360 2,284
127 Total equity capital 511,019 n.a. 340,659 n.a. 141,928 28,432
M E M O 128 Trading assets at large banks4 279,248 132,420 278,683 131,854 565 129 U.S. Treasury securities (domestic offices) • • 15,932 - • 15,919 13 130 U.S. government agency corporation obligations 5,816 5,714 102 131 Securities issued by states and political subdivisions in the United States n.a. 1,852 n.a. 1,670 181 n.a. 132 Mortgage-backed securities 5,622 5,526 97 133 Other debt securities 24,428 24,417 11 134 Other trading assets 13,222 13,152 70 135 Trading assets in foreign banks 146,828 0 146,828 0 0 136 Revaluation gains on interest rate, foreign exchange rate, and other
commodity and equity contracts 65,548 65,548 65,457 65,457 91 n.a. 137 Total individual retirement (IRA) and Keogh plan accounts 156,092 81,421 63,536 11,135 138 Total brokered deposits 160,274 76,148 81,807 2,318 139 Fully insured brokered deposits 115,581 43,116 70,378 2,087 140 Issued in denominations of less than $100,000 20,434 4,694 14,614 1,125 141 Issued in denominations of $100,000, or in denominations greater than $100,000 and
20,434 4,694
participated out by the broker in shares of $100,000 or less n.a. 95,147 n.a. 38,421 55,764 962 142 Money market deposit accounts (MMDAs) 933,241 637,835 269,294 26,112 143 Other savings deposits (excluding MMDAs) 419,155 262,802 136,885 19,468 144 Total time deposits of less than $100,000 782,658 378,205 322,393 82,060 145 Total time deposits of $100,000 or more 539,471 313,279 190,870 35,322 146 All negotiable order of withdrawal (NOW) accounts 135,992 38,787 69,319 27,887
147 Number of banks ,350 8,350 159 n.a. 3,013 5,178
NOTE. The notation "n.a." indicates the lesser detail available from banks that don't have foreign offices, the inapplicability of certain items to banks that have only domestic offices, or the absence of detail on a fully consolidated basis for banks that have foreign offices.
1. All transactions between domestic and foreign offices of a bank are reported in "net due from" and "net due to" lines. All other lines represent transactions with parties other than the domestic and foreign offices of each bank. Because these intra-office transactions are nullified by consolidation, total assets and total liabilities for the entire bank may not equal the sum of assets and liabilities respectively of the domestic and foreign offices.
Foreign offices include branches in foreign countries, Puerto Rico, and U.S. territories and possessions; subsidiaries in foreign countries; all offices of Edge Act and agreement corpora-tions wherever located; and IBFs.
2. "Over 100" refers to banks whose assets, on June 30 of the preceding calendar year,
were $100 million or more. (These banks file the FFIEC 032 or FFIEC 033 Call Report.) "Under 100" refers to banks whose assets, on June 30 of the preceding calendar year, were less than $100 million. (These banks file the FFIEC 034 Call Report.)
3. Because the domestic portion of allowances for loan and lease losses and allocated transfer risk reserves are not reported for banks with foreign offices, the components of total assets (domestic) do not sum to the actual total (domestic).
4. Components of "Trading assets at large banks" are reported only by banks with either total assets of $1 billion or more or with $2 billion or more in the par/notional amount of their off-balance-sheet derivative contracts.
Digitized for FRASER http://fraser.stlouisfed.org/ Federal Reserve Bank of St. Louis

A70 Special Tables • February 2001
4.23 TERMS OF LENDING AT COMMERCIAL BANKS Survey of Loans Made, November 6-10 , 2000
E. Commercial and industrial loans made by U.S. branches and agencies of foreign banks'
Weighted-average effective loan rate
(percent)2
Amount of loans
(millions of dollars)
Average loan size
(thousands of dollars)
Weighted-average
maturity3
Days
Amount of loans (percent)
Secured by collateral
Subject to prepayment
penalty Made under commitment
L O A N R I S K 5
1 All commercial and industrial loans 2 Minimal risk 3 Low risk 4 Moderate risk 5 Other
By maturity/repricing interval6
6 Zero interval 7 Minimal risk 8 Low risk 9 Moderate risk
10 Other
11 Daily 12 Minimal risk 13 Low risk 14 Moderate risk 15 Other
16 2 to 30 days 17 Minimal risk 18 Low risk 19 Moderate risk 20 Other
21 31 to 365 days 22 Minimal risk 23 Low risk 24 Moderate risk 25 Other
26 More than 365 days 27 Minimal risk . . . 28 Low risk 29 Moderate risk . . 30 Other
8.15 7.54 7.55 8.33 8.85
9.39 9.81 7.97 9.39
10.34
7.84 7.23 7.51 8.02
7.99 7.12 7.39 8.04 8.90
7.93 7.82 7.66 8.35 8.65
7.97 9.25 8.36 9.05 9.13
SIZE O F L O A N (thousands of dollars)
31 1-99 32 100-999 33 1,000-9,999 34 10,000 or more
B A S E R A T E O F L O A N 4
35 Prime7
36 Fed funds 37 Other domestic 38 Foreign 39 Other
10.32 9.65
10.12 7.43 7.61 7.97 7.88
118,805 6,845
21,357 36,786 22,404
18,618 439
2,189 5,725 2,979
50,383 3,823
10,527 14,489 9,226
27,080 1,486 5,900
10,025 5,734
17,383 770
2,501 4,878 3,926
4,502 324 203
1,447 287
2,635 10,346 34,445 71,379
20,739 30,753 14,503 31,403 21,407
765 1,103 1,391
663 524
425 343 705 313 212
1,031 5,897 3,306
893 627
1.464 2,562 3,778 1,345
936
624 240 416 598 917
347 721 149 345 122
Weighted-average risk
rating5
3.2 3.2 3.0 2.8
3.3 2.8 2.4 2.9 3.1
374 390 306 447 309
535 509 631
207 301 271 243 153
329 459 281 391 313
382 251 254 750 339
Weighted-average
maturity/ repricing interval6
Days
140 107 63
103
83 11 31 40
343
41.0 49.3 22.7 37.2 37.3
58.2 77.2 68.9
32.7 71.2 15.8 23.2 25.5
27.7 9.0
11.1 24.3 39.8
54.9 21.7 34.2 52.0 31.1
83.0 2.5
69.5 87.2 68.5
83.1 69.7 42.5 34.6
70.1 35.6 12.3 29.8 56.5
8.9 14.9 17.8 8.0 5.1
12.8 44.3 50.0 12.5 7.5
10.1 9.6
17.6 10.1 6.3
4.7 6.9 8.2 3.5 2.1 3.5 5.0
12.9 3.1 1.2
11.3 97.9
2.2 7.0 3.9
27.5 17.0 7.3 7.7
17.7 7.9
20.3 2.9 2.6
24.9 62.4 42.0 26.6 12.7
4.1 23.0
8.3 7.0 2.3
26.8 85.7 37.2 27.3
3.6
44.5 56.9 69.2 39.4 28.4
18.7 6.3
31.0 28.7 20.1
2.1 .6
4.8 3.7 5.8
2.2 6.9
22.8 29.4
3.7 1 6 . 0 69.3 39.9
6.3
71.7 90.3 67.8 78.9 73.1
55.6 82.7 48.3 97.6 96.3
62.8 99.5 52.8 64.9 52.6
86.1 92.7 87.2 82.5
89.9 53.3 88.6 90.8 87.6
77.5 98.9 65.1 44.7 87.0
77.9 84.9 78.3 66.3
75.3 47.4 72.9 82.2
Footnotes appear at end of table.
Digitized for FRASER http://fraser.stlouisfed.org/ Federal Reserve Bank of St. Louis

Financial Markets A67
4.23 TERMS OF LENDING AT COMMERCIAL BANKS Survey of Loans Made, November 6-10, 2000
B. Commercial and industrial loans made by all domestic banks '
Weighted-average effective loan rate (percent)2
Amount of loans
(millions of dollars)
Average loan size
(thousands of dollars)
Weighted-average
maturity3
Days
Amount of loans (percent)
Secured by collateral Callable
Subject to prepayment
penalty Made under commitment
LOAN RISK 3
1 All commercial and industrial loans 2 Minimal risk 3 Low risk 4 Moderate risk 5 Other
By maturity/repricing interval6
6 Zero interval 7 Minimal risk 8 Low risk 9 Moderate risk
10 Other
11 Daily 12 Minimal risk 13 Low risk 14 Moderate risk 15 Other
16 2 to 30 days 17 Minimal risk 18 Low risk 19 Moderate risk 20 Other
21 31 to 365 days 22 Minimal risk 23 Low risk 24 Moderate risk 25 Other
26 More than 365 days 27 Minimal risk . . . 28 Low risk 29 Moderate risk . . 30 Other
8.50 7.58 7.57 8.55 9.69
9.37 9.81 7.97 9.36
10.32
8.03 7.23 7.35 8.20 9.38
8.15 7.10 7.47 8.19 9.65
8.65 8.11 8.11 8.75 9.28
9.05 9.25 8.36 9.05 9.14
SIZE OF LOAN (thousands of dollars)
31 1-99 32 100-999 33 1,000-9,999 34 10,000 or more
BASE RATE OF L O A N 4
35 Prime7
36 Fed funds 37 Other domestic 38 Foreign 39 Other
10.34 9.77
10.13 7.31 7.52 8.14 8.40
72,874 5,985
14,387 26,200 10,890
1 8 , 2 1 6 432
2,187 5,440 2,872
27,728 3,627 6,090 8,776 3,721
17,110 1,088 4,676 7,268 2,790
6,559 513
1,194 3,055 1,054
2,699 323 203
1,446
2,585 9,165
22,750 38,375
18,777 9,886
10,560 20,273 13,379
496 1.004 1.005
422 340 708 300 210
594 5,977 2,070
562 266
1,048 2,211 3,471 1,064
531
263 165 219 405 335
210 736 149 345 121
Weighted-average risk
rating5
3.2 3.2 3.0 2.5
3.3 2.3 2.3 2.8 3.0
475 416 372 569 522
457 909 535 486 615
317 313 380 312 279
431 509 291 495 490
782 313 220
1,128 834
Weighted-average
maturity/ repricing interval6
Days
142 112 69 56
15 40 37 160
43.5 56.0 30.3 43.7 63.0
57.5 76.8 68.9 67.1 70.1
38.7 75.1 27.0 31.8 53.5
28.7 10.9 11.3 26.9
49.8 32.6 42.7 54.3 55.7
71.7 2.5
69.5 87.2 68.2
83.9 73.4 46.0 32.1
71.9 56.3 14.9 30.7 36.0
12.9 17.0 24.9
9.8 7.8
13.0 45.1 49.9 13.1 7.7
15.8 10.1 29.1 12.5 9.5
7.4 9.4
10.4 4.8 4.2
7.3 7.4
15.9 4.8 4.4
18.8 98.1 2.2 7.0 3.3
27.6 17.3 8.4
13.6
14.5 24.6 27.8
3.8 4.1
24.3 66.2 47.4 22.6
8.5
2.8 23.4
8.3 2.8 2.3
33.0 88.5 54.3 29.2
1.4
41.5 55.6 67.7 38.3 19.5
13.2 9.1
12.6 11.7 23.1
3.3 .3
4.8 3.7 5.7
1.9 4.1
16.1 35.5
1.4 32.1 58.2 33.8
9.6
75.5 88.9 76.4 89.2 87.4
54.6 82.4 48.3 97.5 96.3
77.1 99.5 72.7 85.7 73.7
93.8 81.0 91.9 96.4 97.2
82.9 29.9 87.9 88.1 84.6
62.5 98.9 65.1 44.7 86.9
77.8 84.7 77.5 72.0
74.2 55.6
73.8 84.5
Footnotes appear at end of table.
Digitized for FRASER http://fraser.stlouisfed.org/ Federal Reserve Bank of St. Louis

A70 Special Tables • February 2001
4.23 TERMS OF LENDING AT COMMERCIAL BANKS Survey of Loans Made, November 6-10, 2000
E. Commercia l and industrial loans made by U.S. branches and agencies of foreign banks '
Weighted-average effective loan rate (percent)2
Amount of loans
(millions of dollars)
Average loan size
(thousands of dollars)
Weighted-average
maturity3
Days
Amount of loans (percent)
Secured by collateral
Subject to prepayment
penalty Made under commitment
LOAN RISK 5
1 All commercial and industrial loans 2 Minimal risk 3 Low risk 4 Moderate risk 5 Other
By maturity/repricing interval6
6 Zero interval 7 Minimal risk 8 Low risk 9 Moderate risk
10 Other
11 Daily 12 Minimal risk 13 Low risk 14 Moderate risk 15 Other
16 2 to 30 days 17 Minimal risk 18 Low risk 19 Moderate risk 20 Other
21 31 to 365 days 22 Minimal risk 23 Low risk 24 Moderate risk 25 Other
26 More than 365 days 27 Minimal risk . . . 28 Low risk 29 Moderate risk 30 Other
8.40 7.49 7.43 8.46 9.63
9.30 9.91 7.67 9.28
10.35
7.95 7.23 7.31 8.08 9.27
8.15 7.18 7.47 8,17 9.65
8.51 7.29 7.55 8.65 9.26
8.82 9.23 7.66 8.96 8.47
SIZE OF LOAN (thousands of dollars)
31 1-99 32 100-999 33 1,000-9,999 34 10,000 or more
BASE RATE OF LOAN'
35 Prime7
36 Fed funds 37 Other domestic 38 Foreign 39 Other
10.16 9.70 8.82 7.88
10.08 7.29 7.49 8.13 8.34
66,315 5,173
13,210 24,309
9,478
15,854 283
1,740 4,730 2,247
26,556 3,619 5,868 8,329 3,409
16,147 861 4,542 7,004 2,653
5,310 92
896 2,875
912
1,911 316 128
1,166 90
1,347 6,823
20,192 37,952
15,485 9,705
10,312 19,343 11,470
4.460 3,278
864 407
714 1,070 1,957
441 307
757 9,799 3,441
767 336
1,506 3,825 4,952 1,827
699
1,672 462
2,880 2,628 1,208
1,227 4,732 1,435 2,058
288
Weighted-average risk
rating5
3.4 3.3 3.1 2.5
3.3 2.3 2.3 2.8 3.1
454 421 352 553 487
448 815 539 479 651
309 313 376 300 258
446 622 289 505 501
879 438 244
1,159 827
Weighted-average
maturity/ repricing interval6
Days
72 3
32 28
112
40.9 58.2 27.6 41.3 59.8
54.2 67.7 75.4 64.2 63.7
37.1 75.2 26.1 29.2 50.8
27.8 7.7
10.0 26.2 67.6
47.1 33.3 28.6 52.5 54.2
70.6 .4
56.2 93.3 67.3
83.4 69.6 45.3 31.9
69.7 55.8 13.1 30.1 32.7
12.6 18.3 26.6
11.5 65.8 61.3
9.9 4.9
15.7 10.0 29.8 11.9 9.1
7.5 9.4
10.7 4.8 4.1
6.6 .6
19.5 4.8 2.3
18.6 99.3
3.5 2.8
.5
30.3 16.2 8.0
13.7
12.7 25.0 27.7
3.9 2.9
26.3 75.6 51.6 23.7
9.3
2.7 17.0 10.2 3.0 2.7
34.3 88.7 56.4 30.3
1.4
43.5 70.2 69.7 38.6 20.5
15.8 50.4 16.8 11.9 25.2
3.6 .3
7.6 4.2 4.6
1.9 3.6
18.0 35.7
1.2 32.6 59.5 34.8 10.8
75.5 99.2 76.2 89.7 87.5
49.7 99.1 39.4 98.5 97.9
76.5 99.5 72.1 85.5 72.3
95.1 97.9 91.7 96.8 97.7
90.9 100.0 91.2 90.4 87.3
62.1 100.0 97.9 39.9 93.1
87.8 87.2 77.8 71.8
71.6 55.5 89.3 72.9 89.7
Footnotes appear at end of table.
Digitized for FRASER http://fraser.stlouisfed.org/ Federal Reserve Bank of St. Louis

Financial Markets A69
4.23 TERMS OF LENDING AT COMMERCIAL BANKS Survey of Loans Made, November 6-10, 2000
D. Commercial and industrial loans made by small domestic banks '
Weighted-average effective loan rate (percent)2
Amount of loans
(millions of dollars)
Average loan size
(thousands of dollars)
Weighted-average
maturity3
Days
Amount of loans (percent)
Secured by collateral
Subject to prepayment
penalty Made under commitment
LOAN RISK 5
1 All commercial and industrial loans 2 Minimal risk 3 Low risk 4 Moderate risk 5 Other
By maturity/repricing interval6
6 Zero interval 7 Minimal risk 8 Low risk 9 Moderate risk
10 Other
11 Daily 12 Minimal risk 13 Low risk 14 Moderate risk 15 Other
16 2 to 30 days 17 Minimal risk 18 Low risk 19 Moderate risk 20 Other
21 31 to 365 days 22 Minimal risk 23 Low risk 24 Moderate risk 25 Other
26 More than 365 days 27 Minimal risk . . . 28 Low risk 29 Moderate risk . . 30 Other
9.48 8.14 9.05 9.80
10.05
9.84 9.61 9.14 9.87
10.23
9.98 8.81 8.63
10.36 10.49
8.21 6.81 7.49 8.77 9.72
9.25 8.28 9.80
10.30 9.43
9.54 9.40 9.44
SIZE OF LOAN (thousands of dollars)
31 1-99 32 100-999 33 1,000-9,999 34 10,000 or more
BASE RATE OF L O A N 4
35 Prime7
36 Fed funds 37 Other domestic 38 Foreign 39 Other
10.53 9.96 8.64 8.87
10.36 8.42 9.10 8.17 8.76
1,177 1,891 1,412
2,362 149 447 709 625
1,171 8
222 447 312
963 227 134 264 138
1,249 421 298 179 142
75 281 194
1,238 2,341 2,558
423
3,292 181 248 930
1,909
92 169 114 75
112 148 203
96 99
101 35
179 94
172 850 313
88 94
57 144 58 28 59
Weighted-average risk
rating5
3.0 2.9 2.6 2.9
3.1 2.6 2.1 2.9 2.3
684 383 570 782 752
511 1,090
529 530 498
516 334 463 547 521
178 38
354 233 278
149 639 874
103 74
Weighted-average
maturity/ repricing interval6
Days
248 309 299
3
167 612 363 213 448
69.4 41.7 60.0 75.6 84.5
79.9 93.9 43.5 86.3 93.3
75.3 42.6 51.2 81.5 83.3
42.9 22.9 55.3 45.6 89.6
61.5 32.4 85.0 83.5 64.9
92.1 61.5 68.6
84.4 84.3 51.4 51.3
82.2 80.7 89.2 43.8 56.1
16.6 9.1 5.8
23.9 14.0
23.0 5.8 5.8
34.7 18.0
16.6 30.2 11.7 24.4 13.4
5.1 9.5
.2 4.7 6.2
9.9 8.9 5.2 3.6
17.8
24.4 4.7
24.7 20.5 12.0
23.0 6.2
32.9 1.9
11.7
3.9 6.5
.3 8.2 2.5
3.1 35.6
.6 1.7 .9
4.0
.5 9.2 1.4
31.2 .0
2.4 .0
8.3 9.8
.1 1.7 6.1
1.9 5.4 1.6
15.0
2.5 2.0 3.2
11.9 2.7
75.6 23.0 79.5 82.4 86.5
87.8 50.8 83.0 91.1 90.6
90.0 100.0 87.7 89.2 88.4
72.8 17.0 96.5 87.0 87.2
49.2 14.6 77.8 52.0 67.5
9.6 64.7 84.0
66.9 77.2 75.3 94.6
86.0 59.2 58.7 92.7 53.2
Footnotes appear at end of table.
Digitized for FRASER http://fraser.stlouisfed.org/ Federal Reserve Bank of St. Louis

A70 Special Tables • February 2001
4.23 TERMS OF LENDING AT COMMERCIAL BANKS Survey of Loans Made, November 6-10, 2000
E. Commercia l and industrial loans made by U.S. branches and agencies of foreign banks '
Weighted-average effective loan rate (percent)2
Amount of loans
(millions of dollars)
Average loan size
(thousands of dollars)
Weighted-average
maturity3
Days
Amount of loans (percent)
Secured by collateral
Subject to prepayment
penalty Made under commitment
LOAN RISK 5
1 All commercial and industrial loans 2 Minimal risk 3 Low risk 4 Moderate risk 5 Other
By maturity/repricing interval6
6 Zero interval 7 Minimal risk 8 Low risk 9 Moderate risk
10 Other
11 Daily 12 Minimal risk 13 Low risk 14 Moderate risk 15 Other
16 2 to 30 days 17 Minimal risk 18 Low risk 19 Moderate risk 20 Other
21 31 to 365 days 22 Minimal risk 23 Low risk 24 Moderate risk 25 Other
26 More than 365 days 27 Minimal risk . . . 28 Low risk 29 Moderate risk . . 30 Other
7.59 7.24 7.53 7.77 8.06
10.12 10.88
7.73 7.74 7.70
7.71 7.18 7.07 7.63 8.20
7.49 7.24 7.25 7.68 8.42
SIZE OF LOAN (thousands of dollars)
31 1-99 32 100-999 33 1,000-9,999 34 10,000 or more
BASE RATE OF L O A N 4
35 Prime7
36 Fed funds 37 Other domestic 38 Foreign 39 Other
9.34 8.71 7.85 7.46
10.05 7.50 7.83 7.68 7.01
45,930 860
6,970 10,587 11,514
403
285 108
22,655
4,437 5,714 5,505
9,970 398
1,224 2,758 2,944
10,824 256
1,307 1,823 2,871
50 1,181
11,695 33,004
1,962 20,867
3,943 11,130 8,028
5,445 3,529 6,711 5,245 3,413
1,836 277
10,148
18,341 9,262 7,640
4,583 4,522 5,710 4,397 3,374
3,709 2,749 2,306 2,997 2,537
15,120
Weighted-average risk
rating5
3.5 3.6 3.1 3.2
3.5 3.1 2.7 3.1 4.8
223 211 191 151 122
935 993
147 137 71
158 323 247 118 153
141 126 285 128 154
Weighted-average
maturity/ repricing interval
Days
49 64 49
159
20 9 6
45 641
37.0 2 .8 7.0
20.9 13.1
96.9 61.9
.4 9.9 6.6
25.9 4.1
10.2 17.6 12.5
58.0
26.5 48.1 22.1
41.7 41.6 35.6 37.4
52.4 25.8
5.4 28.1 90.5
3.0 3.5 2.5
1.8 6.3 4.1
.2
1.3
10.1 .4
21.0 14.5 5.2
.9
.0 1.3
25.9 36.0 30.8 36.4 16.7
13.7 24.5
5.1
49.5 60.6 74.7 42.3 36.9
22.1 .7
47.8 57.1 19.0
19.9 29.0 35.8 22.3
24.9 8.4
99.1 51.1
.9
65.6 100.0 49.9 53.3 59.6
99.1 97.5
25.6 33.0 38.3
72.0 100.0 95.8 63.1 68.6
94.1 100.0 89.3 95.2 88.7
85.6 87.2 79.9 59.7
86.1 43.6 30.7 97.5 90.6
Footnotes appear at end of table.
Digitized for FRASER http://fraser.stlouisfed.org/ Federal Reserve Bank of St. Louis

Financial Markets hi 1
NOTES TO TABLE 4.23 NOTE. The Survey of Terms of Business Lending collects data on gross loan extensions
made during the first full business week in the mid-month of each quarter. The authorized panel size for the survey is 348 domestically chartered commercial banks and 50 U.S. branches and agencies of foreign banks. The sample data are used to estimate the terms of loans extended during that week at all domestic commercial banks and all U.S. branches and agencies of foreign banks. Note that the terms on loans extended during the survey week may differ from those extended during other weeks of the quarter. The estimates reported here are not intended to measure the average terms on all business loans in bank portfolios.
1. As of December 31, 1996, assets of most of the large banks were at least $7.0 billion. Median total assets for all insured banks were roughly $62 million. Assets at all U.S. branches and agencies averaged 1.3 billion.
2. Effective (compounded) annual interest rates are calculated from the stated rate and other terms of the loans and weighted by loan amount. The standard error of the loan rate for all commercial and industrial loans in the current survey (line 1, column 1) is 0.21 percentage point. The chances are about two out of three that the average rate shown would differ by less than this amount from the average rate that would be found by a complete survey of the universe of all banks.
3. Average maturities are weighted by loan amount and exclude loans with no stated maturities.
4. The most common base pricing rate is that used to price the largest dollar volume of loans. Base pricing rates include the prime rate (sometimes referred to as a bank's "base" or "reference" rate); the federal funds rate; domestic money market rates other than the prime rate and the federal funds rate; foreign money market rates; and other base rates not included in the foregoing classifications.
5. A complete description of these risk categories is available from the Banking Analysis Section, Mail Stop 81, Board of Governors of the Federal Reserve System, Washington, DC 20551. The category "Moderate risk" includes the average loan, under average economic conditions, at the typical lender. The category "Other" includes loans rated "acceptable" as well as special mention or classified loans. The weighted-average risk ratings published for loans in rows 31-39 are calculated by assigning a value of "1" to minimal risk loans; "2" to low risk loans; "3" to moderate risk loans, "4" to acceptable risk loans; and "5" to special mention and classified loans. These values are weighted by loan amount and exclude loans with no risk rating. Some of the loans in lines 1,6, 11, 16, 21, 26, and 31-39 are not rated for risk.
6. The maturity/repricing interval measures the period from the date the loan is made until it first may reprice or it matures. For floating-rate loans that are subject to repricing at any time—such as many prime-based loans—the maturity/repricing interval is zero. For floating-rate loans that have a scheduled repricing interval, the maturity/repricing interval measures the number of days between the date the loan is made and the date on which it is next scheduled to reprice. For loans having rates that remain fixed until the loan matures (fixed-rate loans), the maturity/repricing interval measures the number of days between the date the loan is made and the date on which it matures. Loans that reprice daily mature or reprice on the business day after they are made. Owing to weekends and holidays, such loans may have maturity/repricing intervals in excess of one day; such loans are not included in the "2 to 30 day" category.
7. For the current survey, the average reported prime rate, weighted by the amount of loans priced relative to a prime base rate, was 9.51 percent for all banks; 9.50 percent for large domestic banks, 9.56 percent for small domestic banks; and 9.50 percent for U.S. branches and agencies of foreign banks.
Digitized for FRASER http://fraser.stlouisfed.org/ Federal Reserve Bank of St. Louis

A74 Special Tables • February 2001
4.30 ASSETS A N D LIABILITIES of U.S. Branches and Agencies of Foreign Banks, September 30, 20001—Continued
Millions of dollars except as noted
Item
All states- New York California Illinois
Item Total including
IBFs3
IBFs only'
Total including
IBFs IBFs only
Total including
IBFs IBFs only
Total including
IBFs
IBFs only
1 Total assets4 941,110 183,880 776,872 154,401 25,985 6,445 45,990 4,969
2 Claims on nonrelated parties 751,152 77,500 609,470 67,217 25,371 1,796 45,969 2,811 3 Cash and balances due from depository institutions 78,279 36,171 72,521 32,855 905 262 3,312 2,729 4 Cash items in process of collection and unposted debits 2,534 0 2,477 0 3 0 28 0 5 Currency and coin (U.S. and foreign) 16 n.a. 11 n.a. 1 n.a. 0 n.a. 6 Balances with depository institutions in United States 51,207 14.744 48,283 13,940 695 85 832 423 7 U.S. branches and agencies of other foreign banks
51,207 48,283 13,940
(including IBFs) 44,731 14,059 42,341 13,370 542 85 722 333 8 Other depository institutions in United States (including IBFs) . . . 6,475 685 5.942 570 153 0 110 90 9 Balances with banks in foreign countries and with foreign central
banks 24,194 21,427 21,512 18,915 180 177 2,441 2,306 10 Foreign branches of U.S. banks 836 764 814 743 0 0 18 18 11 Banks in home country and home-country central banks 6,739 6.122 6,650 6,044 38 38 35 35 12 All other banks in foreign countries and foreign central banks . . . . 16,619 14,540 14,048 12,127 141 139 2,388 2,254 13 Balances with Federal Reserve Banks 329 n.a. 237 n.a. 27 n.a. 11 n.a.
14 Total securities and loans 431,156 33,907 338,569 27,258 23,637 1,462 31,555 26
15 Total securities, book value 104,740 3,995 96,418 3,494 1,184 453 5,589 11 16 U.S. Treasury 12,613 n.a. 11,810 n.a. 59 n.a. 728 n.a. 1/ Obligations of U.S. government agencies and corporations 44,512 n.a. 42,071 n.a. 174 n.a. 2,064 n.a. 18 Other bonds, notes, debentures, and corporate stock (including state
44,512 42,071 2,064
and local securities) 47,615 3,995 42,537 3,494 952 453 2,797 11 19 Securities of foreign governmental units 9,858 1,982 9,530 1,891 175 78 11 11 20 All Other 37,757 2,013 33,008 1,603 777 375 2,785 0
21 Federal funds sold and securities purchased under agreements to resell 105,167 5,397 101,699 5,297 302 33 2,435 0
22 U.S. branches and agencies of other foreign banks 10,692 3.020 9,907 2,946 159 8 251 0 2 3 Commercial banks in United States 13,287 60 12,409 34 89 25 434 0 24 Other 81,188 2,317 79,383 2,317 55 0 1,750 0
25 Total loans, gross 326,783 29,956 242,425 23,802 22,494 1,010 1
25,984 15 26 LESS: Unearned income on loans 367 45 274 38 41
1,010 1 18 0
27 EQUALS: L o a n s , ne t 326,416 29,912 242,151 23,764 22,453 1,009 25,966 15
Total loans, gross, by category 28 Real estate loans 17,399 90 12,478 90 3,075 0 134 0 29 Loans to depository institutions 22,541 13,960 15,931 9,850 1,393 807 164 11 30 Commercial banks in United States (including IBFs) 5,809 2,442 4,123 1,769 1,169 611 1 0 31 U.S. branches and agencies of other foreign banks 3,730 2,142 2,293 1,470 1,107 611 0 0 32 Other commercial banks in United States 2,079 299 1,831 299 62 0 1 0 33 Other depository institutions in United States (including IBFs) 15 0 0 0 0 0 0 0 34 Banks in foreign countries 16,717 11,518 11,807 8,081 • 225 196 164 11 35 Foreign branches of U.S. banks 939 617 900 582 0 0 0 0 36 Other banks in foreign countries 15,779 10.901 10,908 7,499 225 196 164 11 3/ Loans to other financial institutions 49,069 1,807 38,036 1,565 1,253 0 5,285 0
38 Commercial and industrial loans 211,915 11,956 153,356 10,330 16,152 180 18,782 0 39 U.S. addressees (domicile) 173,924 31 126,257 31 14,772 0 16,531 0 40 Non-U.S. addressees (domicile) 37,991 11,925 27,099 10,299 1,380 180 2,251 0 41 Acceptances of other banks 686 12 150 12 33 0 501 0 42 U.S. banks 8 0 3 0 3 0 0 0 43 Foreign banks 678 12 147 12 30 0 501 0 44 Loans to foreign governments and official institutions (including
foreign central banks) 3,620 2,014 3,041 1,864 139 23 237 3 45 Loans for purchasing or carrying securities (secured and unsecured) . . . 12,596 12 12,246 12 0 0 0 0 46 All other loans 8,088 105 6,949 78 449 0 250 0
47 Lease financing receivables (net of unearned income) 868 0 238 0 0 0 630 0 48 U.S. addressees (domicile) 868 0 238 0 0 0 630 0 49 Non-U.S. addressees (domicile) 0 0 0 0 0 0 0 0 50 Trading assets 102,510 625 66,556 625 43 0 6,782 0 51 All other assets 34,040 1,400 30,126 1,182 484 39 1,885 56 52 Customers' liabilities on acceptances outstanding 1,406 n.a. 995 n.a. 147 n.a. 228 n.a. 53 U.S. addressees (domicile) 723 n.a. 566 n.a. 144 n.a. 12 n.a. 54 Non-U.S. addressees (domicile) 683 n.a. 429 n.a. 3 n.a. 216 n.a. 55 Other assets including other claims on nonrelated parties 32,634 1,400 29,131 1,182 336 39 1,657 56 56 Net due from related depository institutions5 189,958 106,380 167,402 87.184 613 4,649 20 2,158 57 Net due from head office and other related depository institutions . . . 189,958 n.a. 167,402 n.a. 613 n.a. 20 n.a. 58 Net due from establishing entity, head office, and other related
189,958 167,402
depository institutions5 n.a. 106,380 n.a. 87,184 n.a. 4,649 n.a. 2,158
59 Total liabilities4 941,110 183,880 776,872 154,401 25,985 6,445 45,990 4,969
60 Liabilities to nonrelated parties 823,043 164,220 704,302 137,701 10,416 6,310 34,544 3,309
Footnotes appear at end of table.
Digitized for FRASER http://fraser.stlouisfed.org/ Federal Reserve Bank of St. Louis

U.S. Branches and Agencies A73
4.30 ASSETS AND LIABILITIES of U.S. Branches and Agencies of Foreign Banks, September 30, 2000'—Continued
Millions of dollars except as noted
Item
All states- New York California Illinois
Item Total excluding
IBFs3
IBFs only3
Total excluding
IBFs IBFs only
Total excluding
IBFs IBFs only
Total excluding
IBFs IBFs only
61 Total deposits and credit balances 376,632 121,299 319,971 106,288 3,012 1,072 11,753 2,142 62 Individuals, partnerships, and corporations 286,493 10,648 237,872 5,356 2,542 181 9,498 28 63 U.S. addressees (domicile) 270,860 1 228,877 0 1,008 0 9,418 0 64 Non-U.S. addressees (domicile) 15,633 10,647 8,995 5,356 1,534 181 80 28 65 Commercial banks in United States (including IBFs) 43,443 15,813 38,633 14,972 325 87 721 168 66 U.S. branches and agencies of other foreign banks 19,590 14,130 16,010 13,366 0 87 295 163 67 Other commercial banks in United States 23,853 1,683 22,623 1,606 325 0 426 5 68 Banks in foreign countries 6,363 67,898 6,085 65,726 10 78 150 439 69 Foreign branches of U.S. banks 1,434 4,619 1,433 4,532 0 0 0 87 70 Other banks in foreign countries 4,930 63,278 4,652 61,193 10 78 150 352 71 Foreign governments and official institutions
(including foreign central banks) 20,795 26,903 18,952 20,196 9 726 1,382 1,507 72 All other deposits and credit balances 19,054 37 17,967 37 120 0 0 0 73 Certified and official checks 484 462 6 1
74 Transaction accounts and credit balances (excluding IBFs) 8,524 6,805 349 208 75 Individuals, partnerships, and corporations 6,912 5,413 331 206 76 U.S. addressees (domicile) 4,807 4,223 222 .88 77 Non-U.S. addressees (domicile) 2,105 1,190 109 18 78 Commercial banks in United States (including IBFs) 40 36 0 0 79 U.S. branches and agencies of other foreign banks 3 3 0 0 80 Other commercial banks in United States 37 33 0 0 81 Banks in foreign countries 577 467 10 0 82 Foreign branches of U.S. banks 2 1 0 0 83 Other banks in foreign countries 576 466 10 0 84 Foreign governments and official institutions
(including foreign central banks) 362 319 1 1 85 All other deposits and credit balances 149 108 1 0 86 Certified and official checks 484 462 6 1
87 Demand deposits (included in transaction accounts and credit balances) 7,965 6,506 279 205
88 Individuals, partnerships, and corporations 6,442 5,200 261 203 89 U.S. addressees (domicile) 4,617 4,139 195 185 90 Non-U.S. addressees (domicile) 1,824 1,061 66 18 91 Commercial banks in United States (including IBFs) 35 n.a. 31 n a. 0 n.a. 0 n.a. 92 U.S. branches and agencies of other foreign banks 2 1 0 0 93 Other commercial banks in United States 33 30 0 0 94 Banks in foreign countries 564 454 10 0 95 Foreign branches of U.S. banks 1 0 0 0 96 Other banks in foreign countries 563 454 10 0 97 Foreign governments and official institutions
(including foreign central banks) 357 314 1 1 98 All other deposits and credit balances 85 46 0 0 99 Certified and official checks 484 462 6 1
100 Nontransaction accounts (including MMDAs, excluding IBFs) 368 108 313,166 2,662 11,544 101 Individuals, partnerships, and corporations 279,581 232,459 2,211 9.292 102 U.S. addressees (domicile) 266,052 224,654 786 9,230 103 Non-U.S. addressees (domicile) 13,528 7,805 1,425 62 104 Commercial banks in United States (including IBFs) 43,403 38,597 325 721 105 U.S. branches and agencies of other foreign banks 19,586 16,007 0 295 106 Other commercial banks in United States 23,816 22,589 325 426 107 Banks in foreign countries 5,786 5,618 0 150 108 Foreign branches of U.S. banks 1,432 1,432 0 0 109 Other banks in foreign countries 4,354 4,186 0 .50 110 Foreign governments and official institutions
(including foreign central banks) 20,434 18,633 9 1,381 111 All other deposits and credit balances 18,905 17,859 119 0
112 IBF deposit liabilities 121.299 106,288 1,072 2,142 113 Individuals, partnerships, and corporations in 648 5.356 181 78 114 U.S. addressees (domicile) 1 0 0 0 115 Non-U.S. addressees (domicile) 10,647 5,356 181 78 116 Commercial banks in United States (including IBFs) 15,813 14,972 87 168 117 U.S. branches and agencies of other foreign banks 14,130 13,366 87 163 118 Other commercial banks in United States n.a. 1,683 n.a. 1,606 n a. 0 n.a. 5 119 Banks in foreign countries 67,898 65,726 78 439 120 Foreign branches of U.S. banks 4,619 4,532 0 87 121 Other banks in foreign countries 63.278 61.193 78 352 122 Foreign governments and official institutions
(including foreign central banks) 26.903 20.196 726 1.507 123 All other deposits and credit balances 37 37 0 0
Footnotes appear at end of table.
Digitized for FRASER http://fraser.stlouisfed.org/ Federal Reserve Bank of St. Louis
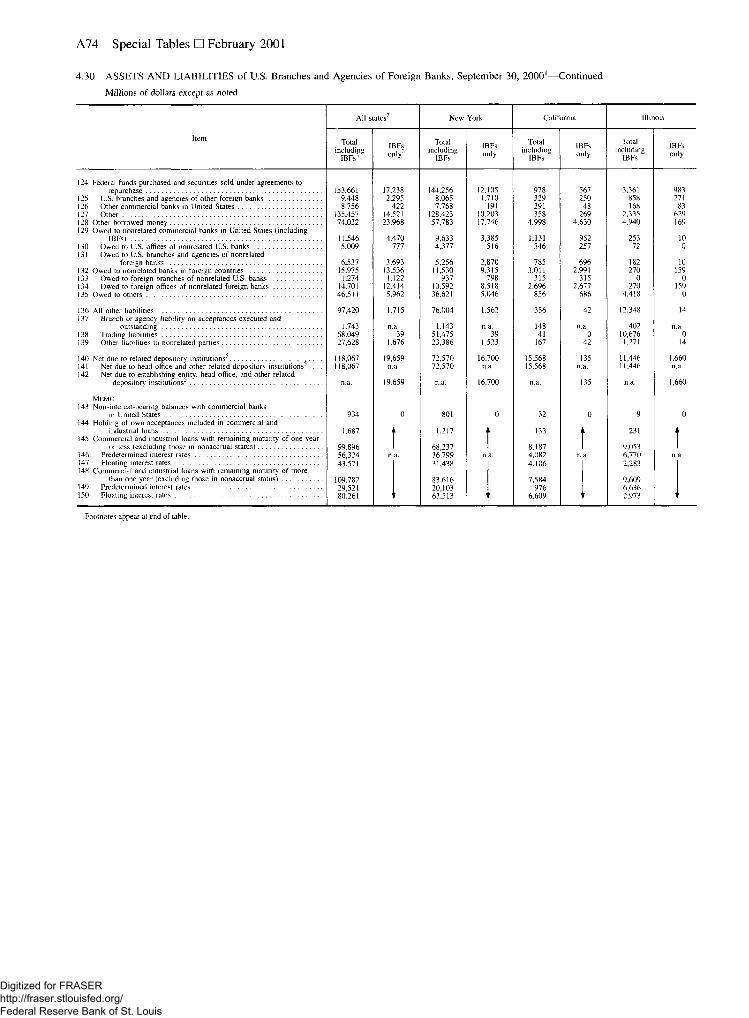
A74 Special Tables • February 2001
4.30 ASSETS AND LIABILITIES of U.S. Branches and Agencies of Foreign Banks, September 30, 20001—Continued
Millions of dollars except as noted
Item
All states2 New York California Illinois
Item Total including
IBFs1
IBFs only3
Total including
IBFs IBFs only
Total including
IBFs IBFs only
Total including
IBFs
IBFs only
124 Federal funds purchased and securities sold under agreements to repurchase 153 ,661 17 ,238 1 4 4 , 2 5 6 1 2 , 1 0 5 9 7 8 5 6 7 3 , 3 6 1 9 8 3
125 U.S. branches and agencies of other foreign banks 9 , 4 4 8 2 , 2 9 5 8 , 0 6 5 1 ,710 3 2 9 2 5 0 8 5 8 2 7 1 126 Other commercial banks in United States 8 , 7 5 6 4 2 2 7 , 7 6 8 191 2 9 1 4 8 168 8 3 127 Other 1 3 5 , 4 5 7 14,521 1 2 8 , 4 2 3 1 0 , 2 0 3 3 5 8 2 6 9 2 , 3 3 5 6 2 9 128 Other borrowed money 7 4 , 0 3 2 2 3 , ?68 5 7 , 7 8 3 1 7 , 7 4 6 4 , 9 9 8 4 , 6 3 0 4 , 9 4 0 169 129 Owed to nonrelated commercial banks in United States (including
IBFs) 1 1 , 5 4 6 4 , 4 7 0 9 , 6 3 3 3 , 3 8 5 1 ,131 9 5 2 2 5 3 10 130 Owed to U.S. offices of nonrelated U.S. banks 5 , 0 0 9 7 7 7 4 , 3 7 7 5 1 6 3 4 6 2 5 7 7 2 0 131 Owed to U.S. branches and agencies of nonrelated
foreign banks 6 , 5 3 7 3 , 6 9 3 5 , 2 5 6 2 , 8 7 0 7 8 5 6 9 6 182 10 132 Owed to nonrelated banks in foreign countries 1 5 , 9 7 5 1 3 , 5 3 6 1 1 , 5 3 0 9 , 3 1 5 3 , 0 1 1 2 , 9 9 1 2 7 0 159 133 Owed to foreign branches of nonrelated U.S. banks 1 ,274 1 ,122 9 3 7 7 9 8 3 1 5 3 1 5 0 0 134 Owed to foreign offices of nonrelated foreign banks 14,701 1 2 , 4 1 4 1 0 , 5 9 2 8 , 5 1 8 2 , 6 9 6 2 , 6 7 7 2 7 0 1 5 9 135 Owed to others 4 6 , 5 1 1 5 , 9 6 2 3 6 , 6 2 1 5 , 0 4 6 8 5 6 6 8 6 4 , 4 1 8 0
136 All other liabilities 9 7 , 4 2 0 1 ,715 7 6 , 0 0 4 1 ,562 3 5 6 4 2 12 ,348 14 137 Branch or agency liability on acceptances executed and
outstanding 1 ,743 n.a. 1,143 n.a. 148 n.a. 4 0 2 n.a. 138 Trading liabilities 6 8 , 0 4 9 3 9 5 1 , 4 7 5 3 9 4 1 0 1 0 , 6 7 6 0 139 Other liabilities to nonrelated parties 2 7 , 6 2 8 1 ,676 2 3 , 3 8 6 1 ,523 167 4 2 1 ,271 14
140 Net due to related depository institutions5 1 1 8 , 0 6 7 1 9 , 6 5 9 7 2 , 5 7 0 1 6 , 7 0 0 1 5 , 5 6 8 135 1 1 , 4 4 6 1 , 6 6 0 141 Net due to head office and other related depository institutions5 . . . . 1 1 8 , 0 6 7 n.a. 7 2 , 5 7 0 n.a. 15 ,568 n.a. 1 1 , 4 4 6 n.a. 142 Net due to establishing entity, head office, and other related
depository institutions5 n.a. 1 9 , 6 5 9 n.a. 1 6 , 7 0 0 n.a. 135 n.a. 1 , 6 6 0
M E M O 143 Non-interest-bearing balances with commercial banks
in United States 9 3 4 0 8 0 1 0 3 2 0 9 0 144 Holding of own acceptances included in commercial and
industrial loans 1,687 • • 1,217 • > 133 • 2 3 1 • • 145 Commercial and industrial loans with remaining maturity of one year
or less (excluding those in nonaccrual status) 9 9 , 8 9 6 6 8 , 2 3 7 8 , 1 8 7 9 , 0 5 3 146 Predetermined interest rates 5 6 , 3 2 4 n.a. 3 6 , 7 9 9 n.a. 4 , 0 8 2 n.a. 6 , 7 7 0 n.a. 147 Floating interest rates 4 3 , 5 7 1 3 1 , 4 3 8 4 , 1 0 6 2 , 2 8 3 148 Commercial and industrial loans with remaining maturity of more
4 3 , 5 7 1 3 1 , 4 3 8
than one year (excluding those in nonaccrual status) 1 0 9 , 7 8 2 8 3 , 6 1 6 7 , 5 8 4 9 , 6 0 9 149 Predetermined interest rates 2 9 , 5 2 1 2 0 , 1 0 3 9 7 6 6 , 6 3 6 150 Floating interest rates 8 0 , 2 6 1 6 3 , 5 1 3 6 , 6 0 9 2 , 9 7 3
Footnotes appear at end of table.
Digitized for FRASER http://fraser.stlouisfed.org/ Federal Reserve Bank of St. Louis

U.S. Branches and Agencies A75
4.30 ASSETS A N D LIABILITIES of U.S. Branches and Agencies of Foreign Banks, September 30, 2000'—Continued
Millions of dollars except as noted
Item
All states2 New York California Illinois
Item Total excluding
IBFs3
IBFs only3
Total excluding
IBFs IBFs only
Total excluding
IBFs IBFs only
Total excluding
IBFs IBFs only
151 Components of total nontransaction accounts, included in total deposits and credit balances (excluding IBFs)
152 Time deposits of $100,000 or more 153 Time CDs in denominations of $100,000 or more
with remaining maturity of more than 12 months
154 Immediately available funds with a maturity greater than one day included in other borrowed money
155 Number of reports filed6
370,830 364,354
6,477
n.a. n.a.
n.a.
317,076 310,663
6,413
n.a. n.a.
n.a.
2,504 2,479
24
n.a. n.a.
n.a.
11,487 11,485
2
n.a. n.a.
n.a.
151 Components of total nontransaction accounts, included in total deposits and credit balances (excluding IBFs)
152 Time deposits of $100,000 or more 153 Time CDs in denominations of $100,000 or more
with remaining maturity of more than 12 months
154 Immediately available funds with a maturity greater than one day included in other borrowed money
155 Number of reports filed6
All states2 New York California Illinois
151 Components of total nontransaction accounts, included in total deposits and credit balances (excluding IBFs)
152 Time deposits of $100,000 or more 153 Time CDs in denominations of $100,000 or more
with remaining maturity of more than 12 months
154 Immediately available funds with a maturity greater than one day included in other borrowed money
155 Number of reports filed6
Total including
IBFs IBFs only
Total including
IBFs IBFs only
Total including
IBFs IBFs only
Total including
IBFs IBFs only
151 Components of total nontransaction accounts, included in total deposits and credit balances (excluding IBFs)
152 Time deposits of $100,000 or more 153 Time CDs in denominations of $100,000 or more
with remaining maturity of more than 12 months
154 Immediately available funds with a maturity greater than one day included in other borrowed money
155 Number of reports filed6 27,185
344 n.a.
0 24,082
180 n.a. 0
2,156 70
n.a. 0
292 28
n.a. 0
1. Data are aggregates of categories reported on the quarterly form FFIEC 002, "Report of Assets and Liabilities of U.S. Branches and Agencies of Foreign Banks." The form was first used for reporting data as of June 30, 1980, and was revised as of December 31, 1985. From November 1972 through May 1980, U.S. branches and agencies of foreign banks had filed a monthly FR 886a report. Aggregate data from that report were available through the Federal Reserve monthly statistical release G. 11, last issued on July 10, 1980. Data in this table and in the G.l 1 tables are not strictly comparable because of differences in reporting panels and in definitions of balance sheet items.
2. Includes the District of Columbia. 3. Effective December 1981, the Federal Reserve Board amended Regulations D and Q to
permit banking offices located in the United States to operate international banking facilities (IBFs). Since December 31, 1985, data for IBFs have been reported in a separate column. These data are either included in or excluded from the total columns as indicated in the headings. The notation "n.a." indicates that no IBF data have been reported for that item,
either because the item is not an eligible IBF asset or liability or because that level of detail is not reported for IBFs. From December 1981 through September 1985, IBF data were included in all applicable items reported.
4. Total assets and total liabilities include net balances, if any, due from or owed to related banking institutions in the United States and in foreign countries (see note 5). On the former monthly branch and agency report, available through the G. l l monthly statistical release, gross balances were included in total assets and total liabilities. Therefore, total asset and total liability figures in this table are not comparable to those in the G. 11 tables.
5. Related depository institutions includes the foreign head office and other U.S. and foreign branches and agencies of a bank, a bank's parent holding company, and majority-owned banking subsidiaries of the bank and of its parent holding company (including subsidiaries owned both directly and indirectly).
6. In some cases, two or more offices of a foreign bank within the same metropolitan area file a consolidated report.
Digitized for FRASER http://fraser.stlouisfed.org/ Federal Reserve Bank of St. Louis

A76 Special Tables • February 2001
4.31 PRO FORMA FINANCIAL STATEMENTS FOR FEDERAL RESERVE PRICED SERVICES
A. Pro forma balance sheet Millions of dollars
Item Sept. 30, 2000 Sept. 30, 1999
Short-term assets (Note 1) Imputed reserve requirement on clearing balances Investment in marketable securities Receivables Materials and supplies Prepaid expenses Items in process of collection
603.4 5,430.6
71.8 3.2
22.9 3,152.5
680.5 6.124.5
70.7 4.3
21.0 3.532.6
Total short-term assets 9,284.4 10,433.7
Long-term assets (Note 2) Premises Furniture and equipment Leases and leasehold improvements Prepaid pension costs
459.9 163.2 46.1
629.4
418.8 145.7 40.9
516.4
Total long-term assets 1,298.5 1,121.8
Total assets 10,582.9 11,555.5
Short-term liabilities Clearing balances and balances arising from early credit
of uncollected items Deferred-availability items Short-term debt
5,718.1 3,468.4
97.9
7.076.8 3.260.9
96.0
Total short-term liabilities 9,284.4 10,433.7
Long-term liabilities Obligations under capital leases Long-term debt Postretirement/postemployment benefits obligation
0.0 417.3 239.5
0.0 225.2 215.9
Total long-term liabilities 656.7 441.1
Total liabilities 9,941.1 10,874.7
641.8 680.7
Total liabilities and equity (Note 3) 10,582.9 11,555.5
NOTE. Components may not sum to totals because of rounding. The priced services financial statements consist of these tables and the accompanying notes.
(1 ) SHORT-TERM ASSETS
The imputed reserve requirement on clearing balances held at Reserve Banks by depository institutions reflects a treatment comparable to that of compensating balances held at corre-spondent banks by respondent institutions. The reserve requirement imposed on respondent balances must be held as vault cash or as nonearning balances maintained at a Reserve Bank; thus, a portion of priced services clearing balances held with the Federal Reserve is shown as required reserves on the asset side of the balance sheet. The remainder of clearing balances is assumed to be invested in three-month Treasury bills, shown as investment in marketable securities.
Receivables are (1) amounts due the Reserve Banks for priced services and (2) the share of suspense-account and difference-account balances related to priced services.
Materials and supplies are the inventory value of short-term assets. Prepaid expenses include salary advances and travel advances for priced-service personnel. Items in process of collection is gross Federal Reserve cash items in process of collection
(CIPC) stated on a basis comparable to that of a commercial bank. It reflects adjustments for intra-System items that would otherwise be double-counted on a consolidated Federal Reserve balance sheet; adjustments for items associated with non-priced items, such as those collected for government agencies; and adjustments for items associated with providing fixed availability or credit before items are received and processed. Among the costs to be recovered under the Monetary Control Act is the cost of float, or net CIPC during the period (the difference between gross CIPC and deferred-availability items which is the portion of gross CIPC that involves a financing cost), valued at the federal funds rate.
(2 ) LONG-TERM ASSETS
Consists of long-term assets used solely in priced services, the priced-services portion of long-term assets shared with nonpriced services, and an estimate of the assets of the Board of Governors used in the development of priced services. Effective Jan. 1, 1987, the Reserve Banks implemented the Financial Accounting Standards Board's Statement of Financial Accounting Standards No. 87, Employers' Accounting for Pensions (SFAS 87). Accordingly, the Federal Reserve Banks recognized credits to expenses of $24.9 million in the third quarter of 1999, $54.2 million in the second quarter of 1999, $21.9 million in the first quarter of 1999, $86.6 million in the third quarter of 2000, $57.7 million in the second quarter of 2000, and $28.9 million in the first quarter of 2000, and corresponding increases in this asset account.
(3 ) LIABILITIES AND EQUITY
Under the matched-book capital structure for assets that are not "self-financing," short-term assets are financed with short-term debt. Long-term assets are financed with long-term debt and equity in a proportion equal to the ratio of long-term debt to equity for the fifty largest bank holding companies, which are used in the model for the private-sector adjustment factor (PSAF). The PSAF consists of the taxes that would have been paid and the return on capital that would have been provided had priced services been furnished by a private-sector firm. Other short-term liabilities include clearing balances maintained at Reserve Banks and deposit balances arising from float. Other long-term liabilities consist of obligations on capital leases.
Digitized for FRASER http://fraser.stlouisfed.org/ Federal Reserve Bank of St. Louis

Bank-Reported Data All
4.31 PRO FORMA FINANCIAL STATEMENTS FOR FEDERAL RESERVE PRICED SERVICES
B. Pro forma income statement Millions of dollars
Item Quarter ending Sept. 30, 2000 Quarter ending Sept. 30, 1999
Revenue from services provided to depository institutions (Note 4) 221.5 210.9 Operating expenses (Note 5) 173.3 173.6
Income from operations 48.2 37.3 Inputed costs (Note 6)
Interest on float Interest on debt Sales taxes FDIC insurance
2.5 7.8 1.9 0.0 12.2
1.0 4.6 2.3 0.9 8.8
Income from operations after imputed costs 36.0 28.5 Other income and expenses (Note 7)
Investment income on clearing balances Earnings credits
102.5 94.0 8.5
84.6 (79.2) 5.4
Income before income taxes 44.5 33.9 Inputed income taxes (Note 8) 14.0 10.9 Net income 30.5 23.1 M E M O Targeted return on equity (Note 9) 24.6 14.3
Nine months ending Sept. 30, 2000 Nine months ending Sept. 30, 1999
Revenue from services provided to depository institutions (Note 4) 654.9 619.3 Operating expenses (Note 5) 519.7 508.5
Income from operations 135.2 110.8 Imputed costs (Note 6)
Interest on float Interest on debt Sales taxes FDIC insurance
5.7 23.6
6.1 0.0 35.4
6.9 13.8 6.9 2.5 30.2
Income from operations after imputed costs 99.8 80.7 Other income and expenses (Note 7)
Investment income on clearing balances Earnings credits
306.2 (275.8) 30.5
243.8 (220.2) 23.6
Income before income taxes 130.2 104.3 Imputed income taxes (Note 8) 41.0 33.4
Net income 89.2 70.9 MEMO Targeted return on equity (Note 9) 73.8 45.8
NOTE. Components may not sum to totals because of rounding. The priced services financial statements consist of these tables and the accompanying notes.
(4) REVENUE
Revenue represents charges to depository institutions for priced services and is realized from each institution through one of two methods: direct charges to an institution's account or charges against its accumulated earnings credits.
(5) OPERATING EXPENSES
Operating expenses consist of the direct, indirect, and other general administrative expenses of the Reserve Banks for priced services plus the expenses for staff members of the Board of Governors working directly on the development of priced services. The expenses for Board staff members totaled $3.15 million for the first, second, and third quarters of 2000 and $.85 million for the first, second, and third quarters of 1999. The credit to expenses under SFAS 87 (see note 2) is reflected in operating expenses.
(6) IMPUTED COSTS
Imputed costs consist of interest on float, interest on debt, sales taxes, and the FDIC assessment. Interest on float is derived from the value of float to be recovered, either explicitly or through per-item fees, during the period. Float costs include costs for checks, book-entry securities, noncash collection, ACH, and funds transfers.
Interest is imputed on the debt assumed necessary to finance priced-service assets. The sales taxes and FDIC assessment that the Federal Reserve would have paid had it been a private-sector firm are among the components of the PSAF (see note 3).
Float costs are based on the actual float incurred for each priced service, multiplied by the appropriate federal funds rate. Other imputed costs are allocated among priced services according to the ratio of operating expenses less shipping expenses for each service to the total expenses for all services less the total shipping expenses for all services.
The following list shows the daily average recovery of float (before converting to float costs) by the Reserve Banks for the third quarter of 2000 and 1999 in millions of dollars:
2000 1999
Total float 725.4 437.1 Unrecovered float 145.6 (148.5) Float subject to recovery 579.8 585.6 Sources of float recovery
Income on clearing balances 58.0 44.3 As-of adjustments 430.8 352.0 Direct charges 314.2 100.2 Per-item fees (223.2) 89.0
Unrecovered float includes float generated by services to government agencies and by other central bank services. Float recovered through income on clearing balances is the result of the increase in investable clearing balances; the increase is produced by a deduction for float for cash items in process of collection, which reduces imputed reserve requirements. The income on clearing balances reduces the float to be recovered through other means. As-of adjustments are memorandum adjustments to an institution's reserve or clearing position to recover float incurred by the institution. Direct charges are billed to the institution for float incurred when an institution chooses to close on a normal business day and for float incurred on interterritory check transportation. Float recovered through direct charges is valued at cost using the federal funds rate and charged directly to an institution's account. Float recovered through per-item fees is valued at the federal funds rate and has been added to the cost base subject to recovery in the third quarters of 2000 and 1999.
(7) OTHER INCOME AND EXPENSES
Consists of imputed investment income on clearing balances and the actual cost of earnings credits. Investment income on clearing balances represents the average coupon-equivalent yield on three-month Treasury bills applied to the total clearing balance maintained, adjusted for the effect of reserve requirements on clearing balances. Expenses for earnings credits granted to depository institutions on their clearing balances are derived by applying the average federal funds rate to the required portion of the clearing balances, adjusted for the net effect of reserve requirements on clearing balances.
(8) INCOME TAXES
Imputed income taxes are calculated at the effective tax rate derived from the PSAF model (see note 3).
(9) RETURN ON EQUITY
Represents the after-tax rate of return on equity that the Federal Reserve would have earned had it been a private business firm, as derived from the PSAF model (see note 3). This amount is adjusted to reflect the recovery of automation consolidation costs of $0.0 million for the first, second, and third quarters of 2000, $0.3 million for the third quarter of 1999, $3.5 million for the second quarter of 1999, and $3.3 million for the first quarter of 1999. The Reserve Banks recovered these amounts, along with a finance charge, by the end of 1999.
Digitized for FRASER http://fraser.stlouisfed.org/ Federal Reserve Bank of St. Louis

A78 Federal Reserve Bulletin • February 2001
Index to Statistical Tables
References are to pages A3-A77, although the prefix 'A" is omitted in this index.
ACCEPTANCES, bankers (See Bankers acceptances) Assets and liabilities (See also Foreigners)
Commercial banks, 15-21, 64-65 Domestic finance companies, 32, 33 Federal Reserve Banks, 10 Foreign banks, U.S. branches and agencies, 72-5 Foreign-related institutions, 20
Automobiles Consumer credit, 36 Production, 44, 45
BANKERS acceptances, 5, 10, 22, 23 Bankers balances, 15-21, 72-5. (See also Foreigners) Bonds (See also U.S. government securities)
New issues, 31 Rates, 23
Business activity, nonfinancial, 42 Business loans (See Commercial and industrial loans)
CAPACITY utilization, 43 Capital accounts
Commercial banks, 15-21, 64-65 Federal Reserve Banks, 10
Certificates of deposit, 23 Commercial and industrial loans
Commercial banks, 15-21, 64-71 Weekly reporting banks, 17, 18
Commercial banks Assets and liabilities, 15-21, 64-65 Commercial and industrial loans, 15-21, 64-65, 66-71 Consumer loans held, by type and terms, 36, 66-71 Real estate mortgages held, by holder and property, 35 Terms of lending, 64-65 Time and savings deposits, 4
Commercial paper, 22, 23, 32 Condition statements (See Assets and liabilities) Construction, 42, 46 Consumer credit, 36 Consumer prices, 42 Consumption expenditures, 48, 49 Corporations
Profits and their distribution, 32 Security issues, 31, 61
Cost of living (See Consumer prices) Credit unions, 36 Currency in circulation, 5, 13 Customer credit, stock market, 24
DEBT (See specific types of debt or securities) Demand deposits, 15-21 Depository institutions
Reserve requirements, 8 Reserves and related items, 4-6, 12, 64-65
Deposits (See also specific types) Commercial banks, 4, 15-21, 64-65 Federal Reserve Banks, 5, 10
Discount rates at Reserve Banks and at foreign central banks and foreign countries (See Interest rates)
Discounts and advances by Reserve Banks (See Loans) Dividends, corporate, 32
EMPLOYMENT, 42 Euro, 62
FARM mortgage loans, 35 Federal agency obligations, 5, 9-11, 28, 29
Federal credit agencies, 30 Federal finance
Debt subject to statutory limitation, and types and ownership of gross debt, 27
Receipts and outlays, 25, 26 Treasury financing of surplus, or deficit, 25 Treasury operating balance, 25
Federal Financing Bank, 30 Federal funds, 23, 25 Federal Home Loan Banks, 30 Federal Home Loan Mortgage Corporation, 30, 34, 35 Federal Housing Administration, 30, 34, 35 Federal Land Banks, 35 Federal National Mortgage Association, 30, 34, 35 Federal Reserve Banks
Balance sheet, priced services, 76 Condition statement, 10, 77 Discount rates (See Interest rates) US. government securities, 5, 10, 11, 27
Federal Reserve credit, 5, 6, 10, 12 Federal Reserve notes, 10 Federal Reserve System
Balanced sheet for priced services, 76, 77 Condition statement for priced services, 76, 77
Federally sponsored credit agencies, 30 Finance companies
Assets and liabilities, 32 Business credit, 33 Loans, 36 Paper, 22, 23
Float, 5 Flow of funds, 37-41 Foreign banks, US. branches and agencies, 71-5 Foreign currency operations, 10 Foreign deposits in U.S. banks, 5 Foreign exchange rates, 62 Foreign-related institutions, 20 Foreign trade, 51 Foreigners
Claims on, 52, 55-7, 59 Liabilities to, 51-3, 58, 60, 61
GOLD Certificate account, 10 Stock, 5, 51
Government National Mortgage Association, 30, 34, 35 Gross domestic product, 48, 49
HOUSING, new and existing units, 46
INCOME and expenses, Federal Reserve System, 76, 77 Income, personal and national, 42, 48, 49 Industrial production, 42, 44 Insurance companies, 27, 35 Interest rates
Bonds, 23 Commercial banks, 66-71 Consumer credit, 36 Federal Reserve Banks, 7 Money and capital markets, 23 Mortgages, 34 Prime rate, 22, 66-71
International capital transactions of United States, 50-61 International organizations, 52, 53, 55, 58, 59 Inventories, 48 Investment companies, issues and assets, 32
Digitized for FRASER http://fraser.stlouisfed.org/ Federal Reserve Bank of St. Louis

A79
Investments (See also specific types) Commercial banks, 4, 15-21, 66-71 Federal Reserve Banks, 10, 11 Financial institutions, 35
LABOR force, 42 Life insurance companies (See Insurance companies) Loans (See also specific types)
Commercial banks, 15-21, 64-65, 66-71 Federal Reserve Banks, 5-7, 10, 11 Federal Reserve System, 76, 77 Financial institutions, 35 Foreign banks, U.S. branches and agencies, 72 Insured or guaranteed by United States, 34, 35
MANUFACTURING Capacity utilization, 43 Production, 43, 45
Margin requirements, 24 Member banks, reserve requirements, 8 Mining production, 45 Mobile homes shipped, 46 Monetary and credit aggregates, 4, 12 Money and capital market rates, 23 Money stock measures and components, 4, 13 Mortgages (See Real estate loans) Mutual funds, 13, 32 Mutual savings banks (See Thrift institutions)
NATIONAL defense outlays, 26 National income, 48
OPEN market transactions, 9
PERSONAL income, 49 Priced services, Federal Reserve income statements, 76, 77 Prices
Consumer and producer, 42, 47 Stock market, 24
Prime rate, 22, 66-71 Producer prices, 42, 47 Production, 42, 44 Profits, corporate, 32
REAL estate loans Banks, 15-21, 35 Terms, yields and activity, 34 Type and holder and property mortgaged, 35
Reserve requirements, 8 Reserves
Commercial banks, 15-21 Depository institutions, 4-6, 12 Federal Reserve Banks, 10 U.S. reserve assets, 51
Residential mortgage loans, 34, 35 Retail credit and retail sales, 36, 42
SAVING Flow of funds, 37-41 National income accounts, 48
Savings deposits (See Time and savings deposits) Savings institutions, 35, 36, 37-41 Securities (See also specific types)
Federal and federally sponsored credit agencies, 30 Foreign transactions, 60 New issues, 31 Prices, 24
Special drawing rights, 5, 10, 50, 51 State and local governments
Holdings of U.S. government securities, 27 New security issues, 31 Rates on securities, 23
Stock market, selected statistics, 24 Stocks (See also Securities)
New issues, 31 Prices, 24
Student Loan Marketing Association, 30
TAX receipts, federal, 26 Thrift institutions, 4. (See also Credit unions and Savings
institutions) Time and savings deposits, 4, 13, 15-21, 64-65 Trade, foreign, 51 Treasury cash, Treasury currency, 5 Treasury deposits, 5, 10, 25 Treasury operating balance, 25 UNEMPLOYMENT, 42 U.S. government balances
Commercial bank holdings, 15-21 Treasury deposits at Reserve Banks, 5, 10, 25
U.S. government securities Bank holdings, 15-21, 27 Dealer transactions, positions, and financing, 29 Federal Reserve Banks holdings, 5, 10, 11, 27 Foreign and international holdings and transactions, 10, 27, 61 Open market transactions, 9 Outstanding, by type and holder, 27, 28 Rates, 23
U.S. international transactions, 50-62 Utilities, production, 45
VETERANS Administration, 34, 35
WEEKLY reporting banks, 17, 18 Wholesale (producer) prices, 42, 47
YIELDS (See Interest rates)
Digitized for FRASER http://fraser.stlouisfed.org/ Federal Reserve Bank of St. Louis

A80 Federal Reserve Bulletin • February 2001
Federal Reserve Board of Governors and Official Staff
ALAN GREENSPAN, Chairman EDWARD W . KELLEY, JR. ROGER W . FERGUSON, JR., Vice Chairman LAURENCE H . MEYER
OFFICE OF BOARD MEMBERS L Y N N S . FOX, Assistant to the Board D O N A L D J. W I N N , Assistant to the Board WINTHROP P. HAMBLEY, Deputy Congressional Liaison B O B STAHLY MOORE, Special Assistant to the Board ROSANNA PIANALTO-CAMERON, Special Assistant to the Board DAVID W . SKIDMORE, Special Assistant to the Board D I A N E E . WERNEKE, Special Assistant to the Board
LEGAL DIVISION J. VIRGIL MATTINGLY, JR., General Counsel SCOTT G . ALVAREZ, Associate General Counsel RICHARD M . A S H T O N , Associate General Counsel KATHLEEN M . O ' D A Y , Associate General Counsel A N N E . MISBACK, Assistant General Counsel S A N D R A L . RICHARDSON, Assistant General Counsel STEPHEN L . SICILIANO, Assistant General Counsel KATHERINE H . WHEATLEY, Assistant General Counsel
OFFICE OF THE SECRETARY JENNIFER J. JOHNSON, Secretary ROBERT DEV. FRIERSON, Associate Secretary BARBARA R . LOWREY, Associate Secretary and Ombudsman
DIVISION OF BANKING SUPERVISION AND REGULATION RICHARD SPILLENKOTHEN, Director STEPHEN C . SCHEMERING, Deputy Director HERBERT A . BIERN, Senior Associate Director ROGER T. COLE, Senior Associate Director WILLIAM A . RYBACK, Senior Associate Director GERALD A . EDWARDS, JR., Associate Director STEPHEN M . HOFFMAN, JR., Associate Director JAMES V. H O U P T , Associate Director JACK P. JENNINGS, Associate Director MICHAEL G . MARTINSON, Associate Director MOLLY S . WASSOM, Associate Director HOWARD A . AMER, Deputy Associate Director N O R A H M . BARGER, Deputy Associate Director BETSY CROSS, Deputy Associate Director RICHARD A . SMALL, Deputy Associate Director DEBORAH P. BAILEY, Assistant Director BARBARA J. BOUCHARD, Assistant Director A N G E L A DESMOND, Assistant Director JAMES A . EMBERSIT, Assistant Director CHARLES H . HOLM, Assistant Director HEIDI W . RICHARDS, Assistant Director WILLIAM G . SPANIEL, Assistant Director DAVID M . WRIGHT, Assistant Director SIDNEY M . SUSSAN, Adviser WILLIAM C . SCHNEIDER, JR., Project Director,
National Information Center
DIVISION OF INTERNATIONAL FINANCE K A R E N H . JOHNSON, Director
DAVID H. HOWARD, Deputy Director VINCENT R. REINHART, Deputy Director THOMAS A. CONNORS, Associate Director DALE W. HENDERSON, Associate Director RICHARD T. FREEMAN, Assistant Director WILLIAM L. HELKIE, Assistant Director STEVEN B. KAMIN, Assistant Director RALPH W. TRYON, Assistant Director
DIVISION OF RESEARCH AND STATISTICS DAVID J. STOCKTON, Director
EDWARD C. ETTIN, Deputy Director DAVID WILCOX, Deputy Director WILLIAM R. JONES, Associate Director MYRON L. KWAST, Associate Director STEPHEN D. OLINER, Associate Director PATRICK M. PARKINSON, Associate Director LAWRENCE SLIFMAN, Associate Director CHARLES S. STRUCKMEYER, Associate Director MARTHA S. SCANLON, Deputy Associate Director JOYCE K. ZICKLER, Deputy Associate Director WAYNE S. PASSMORE, Assistant Director DAVID L. REIFSCHNEIDER, Assistant Director JANICE SHACK-MARQUEZ, Assistant Director ALICE PATRICIA WHITE, Assistant Director GLENN B. CANNER, Senior Adviser DAVID S. JONES, Senior Adviser THOMAS D. SIMPSON, Senior Adviser
DIVISION OF MONETARY AFFAIRS D O N A L D L . K O H N , Director
DAVID E. LINDSEY, Deputy Director BRIAN F. MADIGAN, Associate Director RICHARD D. PORTER, Deputy Associate Director WILLIAM C. WHITESELL, Assistant Director NORMAND R. V. BERNARD, Special Assistant to the Board
DIVISION OF CONSUMER AND COMMUNITY AFFAIRS DOLORES S . SMITH, Director
GLENN E. LONEY, Deputy Director SANDRA F. BRAUNSTEIN, Assistant Director MAUREEN P. ENGLISH, Assistant Director ADRIENNE D. HURT, Assistant Director IRENE SHAWN MCNULTY, Assistant Director
Digitized for FRASER http://fraser.stlouisfed.org/ Federal Reserve Bank of St. Louis

A81
EDWARD M . GRAMLICH
OFFICE OF STAFF DIRECTOR FOR MANAGEMENT STEPHEN R . MALPHRUS, Staff Director
MANAGEMENT DIVISION STEPHEN J. CLARK, Associate Director, Finance Function DARRELL R . PAULEY, Associate Director, Human Resources
Function CHRISTINE M . FIELDS, Assistant Director, Human Resources
Function SHEILA CLARK, EEO Programs Director
DIVISION OF SUPPORT SERVICES ROBERT E . FRAZIER, Director GEORGE M . LOPEZ, Assistant Director DAVID L . WILLIAMS, Assistant Director
DIVISION OF INFORMATION TECHNOLOGY RICHARD C . STEVENS, Director M A R I A N N E M . EMERSON, Deputy Director M A U R E E N T. H A N N A N , Associate Director TILLENA G . CLARK, Assistant Director GEARY L . C U N N I N G H A M , Assistant Director Po K Y U N G KIM, Assistant Director RAYMOND H . MASSEY, Assistant Director S H A R O N L . M O W R Y , Assistant Director D A Y W . RADEBAUGH, JR., Assistant Director
DIVISION OF RESERVE BANK OPERATIONS AND PAYMENT SYSTEMS LOUISE L . ROSEMAN, Director PAUL W . BETTGE, Associate Director K E N N E T H D . BUCKLEY, Assistant Director JOSEPH H . HAYES, JR., Assistant Director JEFFREY C . MARQUARDT, Assistant Director EDGAR A . MARTINDALE, Assistant Director M A R S H A REIDHILL, Assistant Director JEFF J. STEHM, Assistant Director
OFFICE OF THE INSPECTOR GENERAL BARRY R . SNYDER, Inspector General D O N A L D L . ROBINSON, Deputy Inspector General
Digitized for FRASER http://fraser.stlouisfed.org/ Federal Reserve Bank of St. Louis

A82 Federal Reserve Bulletin • February 2001
Federal Open Market Committee and Advisory Councils
FEDERAL OPEN MARKET COMMITTEE
MEMBERS
A L A N GREENSPAN, Chairman WILLIAM J. M C D O N O U G H , Vice Chairman
ROGER W . FERGUSON, JR. EDWARD W . KELLEY, JR. MICHAEL H . MOSKOW EDWARD M . GRAMLICH LAURENCE H . MEYER WILLIAM POOLE THOMAS M . HOENIG CATHY E . M I N E H A N
ALTERNATE MEMBERS
JERRY L. JORDAN ROBERT D . MCTEER, JR.
A N T H O N Y M . SANTOMERO GARY H . STERN
JAMIE B . STEWART, JR.
STAFF
DONALD L . KOHN, Secretary and Economist NORMAND R . V . BERNARD, Deputy Secretary L Y N N S . FOX, Assistant Secretary GARY P. GILLUM, Assistant Secretary J. VIRGIL MATTINGLY, JR., General Counsel THOMAS C . BAXTER, JR., Deputy General Counsel KAREN H . JOHNSON, Economist DAVID J. STOCKTON, Economist
L Y N N E. BROWNE, Associate Economist CHRISTINE M . CUMMING, Associate Economist CRAIG S . HAKKIO, Associate Economist DAVID H . HOWARD, Associate Economist WILLIAM C . HUNTER, Associate Economist DAVID E . LINDSEY, Associate Economist ROBERT H . RASCHE, Associate Economist VINCENT R . REINHART, Associate Economist
PETER R . FISHER, Manager, System Open Market Account
FEDERAL ADVISORY COUNCIL
LAWRENCE K. FISH, First District DOUGLAS A. WARNER III, Second District RONALD L. HANKEY, Third District DAVID A. DABERKO, Fourth District L. M. BAKER, JR., Fifth District L. PHILLIP HUMANN, Sixth District
ALAN G. MCNALLY, Seventh District KATIE S. WINCHESTER, Eighth District R. SCOTT JONES, Ninth District CAMDEN R. FINE, Tenth District RICHARD W. EVANS, JR., Eleventh District LINNET F. DEILY, Twelf th District
JAMES ANNABLE, Co-Secretary WILLIAM J. KORSVIK, Co-Secretary
Digitized for FRASER http://fraser.stlouisfed.org/ Federal Reserve Bank of St. Louis

A83
CONSUMER ADVISORY COUNCIL
LAUREN ANDERSON, New Orleans, Louisiana, Chairman DOROTHY BROADMAN, San Francisco, California, Vice Chairman
ANTHONY S. ABBATE, Saddlebrook, N e w Jersey TERESA A. BRYCE, St. Louis, Missouri MALCOLM M. BUSH, Chicago, Illinois MANUEL CASANOVA, JR., Brownsvi l le , Texas CONSTANCE K. CHAMBERLIN, Richmond, Virginia ROBERT M . CHEADLE, A d a , O k l a h o m a MARY ELLEN DOMEIER, N e w U l m , M i n n e s o t a LESTER W. FIRSTENBERGER, Evansvil le , Indiana JOHN C. GAMBOA, San Francisco, California EARL JAROLIMEK, Fargo, North Dakota WILLIE M. JONES, Boston, Massachusetts M. DEAN KEYES, St. Louis, Missouri
ANNE S. LI, Trenton, New Jersey J. PATRICK LIDDY, Cincinnati, Ohio OSCAR MARQUIS, Park Ridge, Illinois JEREMY NOWAK, Philadelphia, Pennsylvania NANCY PIERCE, Kansas City, Missouri MARTA RAMOS, San Juan, Puerto Rico RONALD A. REITER, San Francisco, California ELIZABETH RENUART, Boston, Massachusetts RUSSELL W. SCHRADER, San Francisco, California FRANK TORRES, JR., Washington, District of Columbia GARY S. WASHINGTON, Chicago, Illinois ROBERT L. WYNN II, Madison, Wiscons in
THRIFT INSTITUTIONS ADVISORY COUNCIL
THOMAS S. JOHNSON, New York, New York, President MARK H . WRIGHT, San Antonio, Texas, Vice President
TOM R. DORETY, Tampa, Florida RONALD S. ELIASON, Provo, Utah D. R. GRIMES, Alpharetta, Georgia CORNELIUS D. MAHONEY, Westfield, Massachusetts KAREN L. MCCORMICK, Port Angeles, Washington
JAMES F. MCKENNA, Brookfield, Wiscons in CHARLES C. PEARSON, JR., Harrisburg, Pennsylvania HERBERT M. SANDLER, Oakland, California EVERETT STILES, Franklin, North Carolina CLARENCE ZUGELTER, Kansas City, Missouri
Digitized for FRASER http://fraser.stlouisfed.org/ Federal Reserve Bank of St. Louis

A84 Federal Reserve Bulletin • February 2001
Federal Reserve Board Publications
For ordering assistance, write PUBLICATIONS SERVICES, MS-127, Board of Governors of the Federal Reserve System, Washington, DC 20551, or telephone (202) 452-3244, or FAX (202) 728-5886. You may also use the publications order form available on the Board's World Wide Web site (http://www.federalreserve.gov). When a charge is indicated, pay-ment should accompany request and be made payable to the Board of Governors of the Federal Reserve System or may be ordered via Mastercard, Visa, or American Express. Payment from foreign residents should be drawn on a U.S. bank.
BOOKS AND MISCELLANEOUS PUBLICATIONS T H E FEDERAL RESERVE SYSTEM—PURPOSES AND FUNCTIONS.
1 9 9 4 . 1 5 7 pp. A N N U A L REPORT, 1 9 9 9 . A N N U A L REPORT: BUDGET REVIEW, 2 0 0 0 . FEDERAL RESERVE BULLETIN. M o n t h l y . $ 2 5 . 0 0 p e r y e a r o r $ 2 . 5 0
each in the United States, its possessions, Canada, and Mexico. Elsewhere, $35.00 per year or $3.00 each.
ANNUAL STATISTICAL DIGEST: period covered, release date, num-ber of pages, and price.
1981 October 1982 239 pp. $ 6.50 1982 December 1983 266 pp. $ 7.50 1983 October 1984 264 pp. $11.50 1984 October 1985 254 pp. $12.50 1985 October 1986 231 pp. $15.00 1986 November 1987 288 pp. $15.00 1987 October 1988 272 pp. $15.00 1988 November 1989 256 pp. $25.00 1980-89 March 1991 712 pp. $25.00 1990 November 1991 185 pp. $25.00 1991 November 1992 215 pp. $25.00 1992 December 1993 215 pp. $25.00 1993 December 1994 281 pp. $25.00 1994 December 1995 190 pp. $25.00 1990-95 November 1996 404 pp. $25.00
SELECTED INTEREST AND EXCHANGE RATES—WEEKLY SERIES OF CHARTS. Weekly. $30.00 per year or $.70 each in the United States, its possessions, Canada, and Mexico. Elsewhere, $35.00 per year or $.80 each.
REGULATIONS OF THE BOARD OF GOVERNORS OF THE FEDERAL RESERVE SYSTEM.
A N N U A L PERCENTAGE RATE TABLES ( T r u t h in L e n d i n g — Regulation Z) Vol. I (Regular Transactions). 1969. 100 pp. Vol. II (Irregular Transactions). 1969. 116 pp. Each volume $5.00.
GUIDE TO THE FLOW OF FUNDS ACCOUNTS. January 2 0 0 0 . 1,186 pp. $20.00 each.
FEDERAL RESERVE REGULATORY SERVICE. L o o s e - l e a f ; updated monthly. (Requests must be prepaid.)
Consumer and Community Affairs Handbook. $75.00 per year. Monetary Policy and Reserve Requirements Handbook. $75.00
per year. Securities Credit Transactions Handbook. $75.00 per year. The Payment System Handbook. $75.00 per year. Federal Reserve Regulatory Service. Four vols. (Contains all
four Handbooks plus substantial additional material.) $200.00 per year.
Rates for subscribers outside the United States are as follows and include additional air mail costs:
Federal Reserve Regulatory Service, $250.00 per year. Each Handbook, $90.00 per year.
FEDERAL RESERVE REGULATORY SERVICE FOR PERSONAL COMPUTERS. CD-ROM; updated monthly.
Standalone PC. $300 per year. Network, maximum 1 concurrent user. $300 per year. Network, maximum 10 concurrent users. $750 per year. Network, maximum 50 concurrent users. $2,000 per year. Network, maximum 100 concurrent users. $3,000 per year. Subscribers outside the United States should add $50 to cover
additional airmail costs. T H E FEDERAL RESERVE A C T AND OTHER STATUTORY PROVISIONS
AFFECTING THE FEDERAL RESERVE SYSTEM, a s a m e n d e d through October 1998. 723 pp. $20.00 each.
T H E U . S . ECONOMY IN AN INTERDEPENDENT WORLD: A M U L T I -
COUNTRY MODEL, May 1984. 5 9 0 pp. $14 .50 each. INDUSTRIAL PRODUCTION — 1 9 8 6 EDITION. D e c e m b e r 1986 .
440 pp. $9.00 each. FINANCIAL FUTURES AND OPTIONS IN THE U . S . ECONOMY.
December 1986. 264 pp. $10.00 each. FINANCIAL SECTORS IN O P E N ECONOMIES: EMPIRICAL ANALY-
SIS AND POLICY ISSUES. August 1990. 608 pp. $25.00 each. RISK MEASUREMENT AND SYSTEMIC RISK: PROCEEDINGS OF A
JOINT CENTRAL B A N K RESEARCH CONFERENCE. 1 9 9 6 . 578 pp. $25.00 each.
EDUCATION PAMPHLETS Short pamphlets suitable for classroom use. Multiple copies are available without charge.
Consumer Handbook on Adjustable Rate Mortgages Consumer Handbook to Credit Protection Laws A Guide to Business Credit for Women, Minorities, and Small
Businesses Series on the Structure of the Federal Reserve System
The Board of Governors of the Federal Reserve System The Federal Open Market Committee Federal Reserve Bank Board of Directors Federal Reserve Banks
A Consumer's Guide to Mortgage Lock-Ins A Consumer's Guide to Mortgage Settlement Costs A Consumer's Guide to Mortgage Refinancings Home Mortgages: Understanding the Process and Your Right
to Fair Lending How to File a Consumer Complaint about a Bank Making Sense of Savings SHOP: The Card You Pick Can Save You Money Welcome to the Federal Reserve When Your Home is on the Line: What You Should Know
About Home Equity Lines of Credit Keys to Vehicle Leasing Looking for the Best Mortgage
Digitized for FRASER http://fraser.stlouisfed.org/ Federal Reserve Bank of St. Louis

A85
STAFF STUDIES: Only Summaries Printed in the BULLETIN
Studies and papers on economic and financial subjects that are of general interest. Requests to obtain single copies of the full text or to be added to the mailing list for the series may be sent to Publications Services.
Staff Studies 1-158, 161, 163, 165, 166, 168, and 169 are out of print. Staff Studies 167-174 are available on line at w w w .federalreserve. go v/pubs/staffstudies.
1 5 9 . N E W DATA ON THE PERFORMANCE OF N O N B A N K SUBSIDI-ARIES OF BANK HOLDING COMPANIES, by N e l l i e L iang and Donald Savage. February 1990. 12 pp.
1 6 0 . BANKING MARKETS AND THE U S E OF FINANCIAL SER-VICES BY SMALL A N D M E D I U M - S I Z E D BUSINESSES, b y Gregory E. Elliehausen and John D. Wolken. September 1 9 9 0 . 3 5 pp.
1 6 2 . EVIDENCE ON THE SIZE OF BANKING MARKETS FROM MORT-GAGE L O A N RATES IN TWENTY CITIES, b y S t e p h e n A . Rhoades. February 1992. 11 pp.
1 6 4 . T H E 1 9 8 9 - 9 2 CREDIT C R U N C H FOR R E A L ESTATE, b y James T. Fergus and John L. Goodman, Jr. July 1993. 20 pp.
1 6 7 . A SUMMARY OF MERGER PERFORMANCE STUDIES IN B A N K -ING, 1 9 8 0 - 9 3 , AND AN ASSESSMENT OF THE "OPERATING PERFORMANCE" AND " E V E N T S T U D Y " METHODOLOGIES, by Stephen A. Rhoades. July 1994. 37 pp.
1 7 0 . T H E COST OF IMPLEMENTING CONSUMER FINANCIAL R E G U -LATIONS: A N ANALYSIS OF EXPERIENCE WITH THE TRUTH IN SAVINGS ACT, by Gregory Elliehausen and Barbara R. Lowrey. December 1997. 17 pp.
1 7 1 . T H E COST OF B A N K REGULATION: A REVIEW OF THE EVI-DENCE, by Gregory Elliehausen. April 1998. 35 pp.
1 7 2 . USING SUBORDINATED D E B T AS AN INSTRUMENT OF M A R -KET DISCIPLINE, by Study Group on Subordinated Notes and Debentures, Federal Reserve System. December 1999. 6 9 pp.
1 7 3 . IMPROVING PUBLIC DISCLOSURE IN B A N K I N G , b y S t u d y Group on Disclosure, Federal Reserve System. March 2000. 3 5 pp.
1 7 4 . B A N K MERGERS AND BANKING STRUCTURE IN THE U N I T E D STATES, 1 9 8 0 - 9 8 , by Stephen Rhoades. August 2000 . 33 pp.
Digitized for FRASER http://fraser.stlouisfed.org/ Federal Reserve Bank of St. Louis

A86 Federal Reserve Bulletin • February 2001
Maps of the Federal Reserve System
. jmrnmrnsmi
1 Bos I ON
P ^ B N I - W Y O R K
" C l e v e l a n d p B l m „ , P H i a
Louis
8 imlT^^ • • S
•D RICHMOND
A t l a n t a
M \SK\ HAWAII
L E G E N D
Both pages
• Federal Reserve Bank city
• Board of Governors of the Federal Reserve System, Washington, D.C.
Facing page
• Federal Reserve Branch city
— Branch boundary
N O T E
The Federal Reserve officially identifies Districts by num-ber and Reserve Bank city (shown on both pages) and by letter (shown on the facing page).
In the 12th District, the Seattle Branch serves Alaska, and the San Francisco Bank serves Hawaii.
The System serves commonwealths and territories as follows: the New York Bank serves the Commonwealth
of Puerto Rico and the U.S. Virgin Islands; the San Fran-cisco Bank serves American Samoa, Guam, and the Com-monwealth of the Northern Mariana Islands. The Board of Governors revised the branch boundaries of the System most recently in February 1996.
Digitized for FRASER http://fraser.stlouisfed.org/ Federal Reserve Bank of St. Louis

A87
1 - A
VT
NH
M A ® CT
BOSTON
2 - B
, CT
' ' / Buffalo B j
/ NY
N E W YORK
3 - C
PHILADELPHIA
4 - D Pittsburgh
: X '
cmnati
KY
CLEVELAND
5 - E Baltimore MD
V t f '
wv • Chariot ic
sc
RICHMOND
6 - F TN—*• • Nashville
Birmingham AL \
MS
LA
_ OA
1 * J;ickson\ ille
New Orleans
Miami
ATLANTA
7 - G
MI WI
IL IN
CHICAGO
8 - H
"A
KY , „ ' J Lofsvi l le
L_F — TN
"A • Memphis Little / Rock ( MS
ST L o u i s
9 - 1 9 - 1 M T l i i i i l ^ M M> M K
• Helen IHHHHIHI IFIBBBR^^
• /•wMHHMBHB®
MINNEAPOLIS
10—J \VY
. 1 NE
(X) Omaha*
• Denver
KS •
Oklahoma Cit\ • OK
KANSAS CITY
1 1 - K
S;ui Antonio
DALLAS
1 2 - L
S A N FRANCISCO
Digitized for FRASER http://fraser.stlouisfed.org/ Federal Reserve Bank of St. Louis
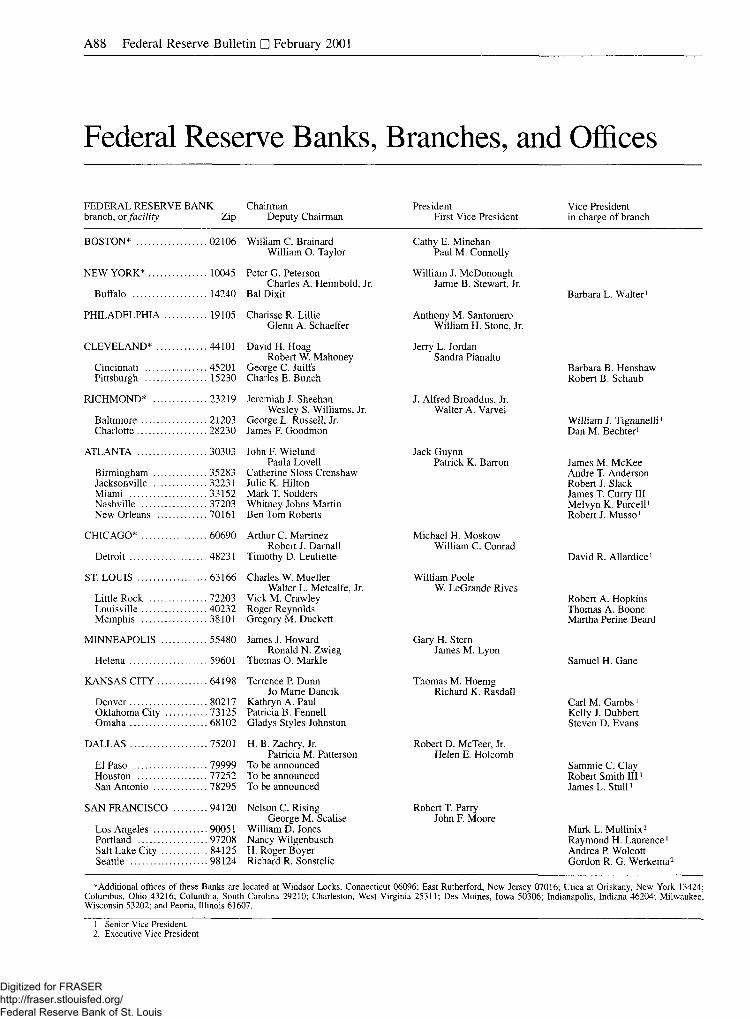
A88 Federal Reserve Bulletin • February 2001
Federal Reserve Banks, Branches, and Offices
FEDERAL RESERVE BANK Chairman President Vice President branch, or facility Zip Deputy Chairman First Vice President in charge of branch
BOSTON* 02106 William C. Brainard Cathy E. Minehan William O. Taylor Paul M. Connolly
NEW YORK* 10045 Peter G. Peterson William J. McDonough Charles A. Heimbold, Jr. Jamie B. Stewart, Jr.
Buffalo 14240 Bal Dixit Barbara L. Walter1
PHILADELPHIA 19105 Charisse R. Lillie Anthony M. Santomero Glenn A. Schaeffer William H. Stone, Jr.
CLEVELAND* 44101 David H. Hoag Jerry L. Jordan Robert W. Mahoney Sandra Pianalto
Cincinnati 45201 George C. Juilfs Barbara B. Henshaw Pittsburgh 15230 Charles E. Bunch Robert B. Schaub
RICHMOND* 23219 Jeremiah J. Sheehan J. Alfred Broaddus, Jr. Wesley S. Williams, Jr. Walter A. Varvel
Baltimore 21203 George L. Russell, Jr. William J. Tignanelli1
Charlotte 28230 James F. Goodmon Dan M. Bechter1
ATLANTA 30303 John F. Wieland Jack Guynn Paula Lovell Patrick K. Barron James M. McKee
Birmingham 35283 Catherine Sloss Crenshaw Andre T. Anderson Jacksonville 32231 Julie K. Hilton Robert J. Slack Miami 33152 Mark T. Sodders James T. Curry III Nashville 37203 Whitney Johns Martin Melvyn K. Purcell1
New Orleans 70161 Ben Tom Roberts Robert J. Musso1
CHICAGO* 60690 Arthur C. Martinez Michael H. Moskow Robert J. Darnall William C. Conrad
Detroit 48231 Timothy D. Leuliette David R. Allardice1
ST. LOUIS 63166 Charles W. Mueller William Poole Walter L. Metcalfe, Jr. W. LeGrande Rives
Little Rock 72203 Vick M. Crawley Robert A. Hopkins Louisville 40232 Roger Reynolds Thomas A. Boone Memphis 38101 Gregory M. Duckett Martha Perine Beard
MINNEAPOLIS 55480 James J. Howard Gary H. Stern Ronald N. Zwieg James M. Lyon
Helena 59601 Thomas O. Markle Samuel H. Gane
KANSAS CITY 64198 Terrence P. Dunn Thomas M. Hoenig Jo Marie Dancik Richard K. Rasdall
Denver 80217 Kathryn A. Paul Carl M. Gambs1
Oklahoma City 73125 Patricia B. Fennell Kelly J. Dubbert Omaha 68102 Gladys Styles Johnston Steven D. Evans
DALLAS 75201 H. B. Zachry, Jr. Robert D. McTeer, Jr. Patricia M. Patterson Helen E. Holcomb
El Paso 79999 To be announced Sammie C. Clay Houston 77252 To be announced Robert Smith III1
San Antonio 78295 To be announced James L. Stull1
SAN FRANCISCO 94120 Nelson C. Rising Robert T. Parry George M. Scalise John F. Moore
Los Angeles 90051 William D. Jones Mark L. Mullinix2
Portland 97208 Nancy Wilgenbusch Raymond H. Laurence1
Salt Lake City 84125 H. Roger Boyer Andrea P. Wolcott Seattle 98124 Richard R. Sonstelie Gordon R. G. Werkema2
* Additional offices of these Banks are located at Windsor Locks, Connecticut 06096; East Rutherford, New Jersey 07016; Utica at Oriskany, New York 13424; Columbus, Ohio 43216; Columbia, South Carolina 29210; Charleston, West Virginia 25311; Des Moines, Iowa 50306; Indianapolis, Indiana 46204; Milwaukee, Wisconsin 53202; and Peoria, Illinois 61607.
1. Senior Vice President. 2. Executive Vice President
Digitized for FRASER http://fraser.stlouisfed.org/ Federal Reserve Bank of St. Louis

A89
Publications of Interest
FEDERAL RESERVE REGULATORY SERVICE
To promote public understanding of its regulatory func-tions, the Board publishes the Federal Reserve Regu-latory Service, a four-volume loose-leaf service con-taining all Board regulations as well as related statutes, interpretations, policy statements, rulings, and staff opinions. For those with a more specialized interest in the Board's regulations, parts of this service are pub-lished separately as handbooks pertaining to monetary policy, securities credit, consumer affairs, and the pay-ment system.
These publications are designed to help those who must frequently refer to the Board's regulatory materi-als. They are updated monthly, and each contains cita-tion indexes and a subject index.
The Monetary Policy and Reserve Requirements Handbook contains Regulations A, D, and Q, plus related materials.
The Securities Credit Transactions Handbook con-tains Regulations T, U, and X, dealing with exten-sions of credit for the purchase of securities, together with related statutes, Board interpretations, rulings, and staff opinions. Also included is the Board's list of foreign margin stocks.
The Consumer and Community Affairs Handbook contains Regulations B, C, E, M, Z, AA, BB, and DD, and associated materials.
The Payment System Handbook deals with expedited funds availability, check collection, wire transfers, and risk-reduction policy. It includes Regulations CC, J, and EE, related statutes and commentaries, and policy statements on risk reduction in the payment system.
For domestic subscribers, the annual rate is $200 for the Federal Reserve Regulatory Service and $75 for each handbook. For subscribers outside the United States, the price including additional air mail costs is $250 for the service and $90 for each handbook.
The Federal Reserve Regulatory Service is also avail-able on CD-ROM for use on personal computers. For a standalone PC, the annual subscription fee is $300. For network subscriptions, the annual fee is $300 for 1 con-current user, $750 for a maximum of 10 concurrent users, $2,000 for a maximum of 50 concurrent users, and $3,000 for a maximum of 100 concurrent users. Subscribers outside the United States should add $50 to cover additional airmail costs. For further informa-tion, call (202) 452-3244.
All subscription requests must be accompanied by a check or money order payable to the Board of Gover-nors of the Federal Reserve System. Orders should be addressed to Publications Services, mail stop 127, Board of Governors of the Federal Reserve System, Washing-ton, DC 20551.
GUIDE TO THE FLOW OF FUNDS ACCOUNTS
A new edition of Guide to the Flow of Funds Accounts is now available from the Board of Governors. The new edition incorporates changes to the accounts since the initial edition was published in 1993. Like the earlier publication, it explains the principles underlying the flow of funds accounts and describes how the accounts are constructed. It lists each flow series in the Board's flow of funds publication, "Flow of Funds Accounts of the United States" (the Z.l quarterly statistical release),
and describes how the series is derived from source data. The Guide also explains the relationship between the flow of funds accounts and the national income and product accounts and discusses the analytical uses of flow of funds data. The publication can be purchased, for $20.00, from Publications Services, Board of Gover-nors of the Federal Reserve System, Washington, DC 20551.
Digitized for FRASER http://fraser.stlouisfed.org/ Federal Reserve Bank of St. Louis

A90 Federal Reserve Bulletin • February 2001
Federal Reserve Statistical Releases Available on the Commerce Department's Economic Bulletin Board
The Board of Governors of the Federal Reserve Sys-tem makes some of its statistical releases available to the public through the U.S. Department of Com-merce's economic bulletin board. Computer access to the releases can be obtained by subscription.
For further information regarding a subscription to the economic bulletin board, please call (202) 482-1986. The releases transmitted to the economic bulle-tin board, on a regular basis, are the following:
Reference Number Statistical release Frequency of release
H.3 Aggregate Reserves Weekly/Thursday
H.4.1 Factors Affecting Reserve Balances Weekly/Thursday
H.6 Money Stock Weekly/Thursday
H.8 Assets and Liabilities of Insured Domestically Chartered Weekly/Monday and Foreign Related Banking Institutions
H.10 Foreign Exchange Rates Weekly/Monday
H.15 Selected Interest Rates Weekly/Monday
G.5 Foreign Exchange Rates Monthly/end of month
G.17 Industrial Production and Capacity Utilization Monthly/midmonth
G.19 Consumer Installment Credit Monthly/fifth business day
Z. 1 Flow of Funds Quarterly
Digitized for FRASER http://fraser.stlouisfed.org/ Federal Reserve Bank of St. Louis


