Embed Size (px)
Citation preview

Reportby the Comptroller and Auditor General
Cross-government
Fraud landscape review
HC 850 SESSION 2015-16 23 FEBRUARY 2016

Our vision is to help the nation spend wisely.
Our public audit perspective helps Parliament hold government to account and improve public services.
The National Audit Office scrutinises public spending for Parliament and is independent of government. The Comptroller and Auditor General (C&AG), Sir Amyas Morse KCB, is an Officer of the House of Commons and leads the NAO, which employs some 810 people. The C&AG certifies the accounts of all government departments and many other public sector bodies. He has statutory authority to examine and report to Parliament on whether departments and the bodies they fund have used their resources efficiently, effectively, and with economy. Our studies evaluate the value for money of public spending, nationally and locally. Our recommendations and reports on good practice help government improve public services, and our work led to audited savings of £1.15 billion in 2014.
Report by the Comptroller and Auditor General
Ordered by the House of Commons to be printed on 22 February 2016
This report has been prepared under Section 6 of the National Audit Act 1983 for presentation to the House of Commons in accordance with Section 9 of the Act
Sir Amyas Morse KCB Comptroller and Auditor General National Audit Office
18 February 2016
HC 850 | £10.00
Cross-government
Fraud landscape review

This is a high level review of the fraud landscape, examining the government’s approach to tackling fraud in the public sector.
© National Audit Office 2016
The material featured in this document is subject to National Audit Office (NAO) copyright. The material may be copied or reproduced for non-commercial purposes only, namely reproduction for research, private study or for limited internal circulation within an organisation for the purpose of review.
Copying for non-commercial purposes is subject to the material being accompanied by a sufficient acknowledgement, reproduced accurately, and not being used in a misleading context. To reproduce NAO copyright material for any other use, you must contact [email protected]. Please tell us who you are, the organisation you represent (if any) and how and why you wish to use our material. Please include your full contact details: name, address, telephone number and email.
Please note that the material featured in this document may not be reproduced for commercial gain without the NAO’s express and direct permission and that the NAO reserves its right to pursue copyright infringement proceedings against individuals or companies who reproduce material for commercial gain without our permission.
Links to external websites were valid at the time of publication of this report. The National Audit Office is not responsible for the future validity of the links.
10945 02/16 NAO
The National Audit Office study team consisted of: Stephen Ferris and Ee-Ling Then, under the direction of Paul Oliffe.
This report can be found on the National Audit Office website at www.nao.org.uk
For further information about the National Audit Office please contact:
National Audit Office Press Office 157–197 Buckingham Palace Road Victoria London SW1W 9SP
Tel: 020 7798 7400
Enquiries: www.nao.org.uk/contact-us
Website: www.nao.org.uk
Twitter: @NAOorguk
Contents
Summary 4
Part OneBackground 8
Part TwoWhat is the scale of fraud? 14
Part ThreeWhat government set out to do 23
Part FourChallenges and opportunities 32
Appendix OneOur approach 38

4 Summary Fraud landscape review
Summary
1 Fraud is an act of deception carried out for personal gain or to cause a loss to another party. In the public sector, fraud can be committed internally by public sector workers or externally by suppliers, contractors and members of the public. Fraud covers a wide spectrum of activities and can affect all departments.
2 Preventing and detecting fraud are key to minimising loss and ensuring that public funds are spent in the way that taxpayers would expect. With ongoing pressure to cut costs, reducing loss of public funds through fraud is an opportunity for the government to make potentially significant savings.
3 In 2011, the government set out its priorities for reducing fraud in the public sector and in 2012 it developed a programme of work focusing on welfare fraud.1, 2 Since then it has changed some of the bodies involved in preventing fraud including closing the National Fraud Authority and has published little up-to-date information on progress, particularly on the non-welfare side. Fraud risks have also changed, for example there has been an increase in online fraud and in the number of government services provided by third parties. However, levels of reported fraud remain low at 0.02% of expenditure across government.3
4 This is a review of the fraud landscape, examining the government’s approach to tackling fraud in the public sector. It focuses on fraud associated with central government expenditure other than tax credit and benefit fraud as this is an area that has had less attention. HM Revenue & Customs (HMRC) and the Department for Work & Pensions (DWP) regularly report estimated levels of fraud and error. These have been the subject of our recent Fraud and error stocktake.4 We also do not cover fraud in local government or fraud against members of the public.
5 We sought to answer the following questions:
• What is the scale of fraud in the public sector?
• What did the government set out to achieve in tackling fraud and what has it done?
• What are the challenges in reducing fraud and how will the government meet these challenges in future?
1 Cabinet Office, Eliminating Public Sector Fraud, The Counter Fraud Taskforce Interim Report, June 2011.2 Cabinet Office, Tackling Fraud and Error in Government, a Report of the Fraud, Error and Debt Taskforce, February 2012.3 The Cabinet Office estimate ‘true’ detected fraud to be £72.9 million from a spend of £306 billion (0.02%) in 2014-15
excluding the Department for Work & Pensions, HM Revenue & Customs and local government.4 Comptroller and Auditor General, Fraud and error stocktake, Session 2015-16, HC 267, National Audit Office, July 2015.
Fraud landscape review Summary 5
6 This is a summary of the government’s objectives and projects and the outcomes achieved. It reports progress but does not evaluate the success of the activities or individual initiatives. We intend to follow up on the results of the government’s anti-fraud work in the future. We recognise that detection of fraud and error are related and report data on both but the report focuses specifically on government’s management of fraud risk.
7 Our methods are set out in Appendix One.
Key findings
8 Our work on fraud and error in the tax and benefits sector has demonstrated the need for an approach that includes:
• clear strategies and governance;
• an effective, well implemented control environment; and
• an ability to measure and evaluate performance.
Reducing fraud and error has been a major focus of the tax and benefits sectors for many years. They have established approaches to tackling fraud and error that include annual measurement exercises to estimate the scale of both fraud and error. For the rest of government, where the scale of fraud is less well known, there are fundamental issues to be resolved before the government can demonstrate that resources are being targeted effectively.
The scale of fraud
9 The exact scale of fraud within the government is unknown. The quality and completeness of fraud data is often variable and not sufficient to accurately assess the extent of fraud. The most comprehensive data relates to areas of known risk – tax credit and benefit fraud, as noted above – but information across the rest of government is incomplete. The Cabinet Office has recently started collecting fraud returns from departments but there are gaps and inconsistencies in the data sets. What the data does indicate however, is that departments are reporting less loss than expected given the scale of expenditure and range of activities. Some submitted nil returns despite reporting cases of fraud elsewhere. The Cabinet Office is working with departments to improve the completeness and quality of their data returns (paragraphs 2.16 to 2.19).
10 Detected fraud across government was equivalent to only 0.02% of total expenditure (excluding tax credit and benefit fraud). In 2014-15, detected fraud across government ranged from £27.6 million to £72.9 million, depending on the source, from a total expenditure of £306 billion (paragraphs 2.11 to 2.13, 2.17 and Figure 5).

6 Summary Fraud landscape review
11 There is a large disparity between the level of fraud and error that is reported and the level that other available estimates suggest might be occurring which needs explaining. The UK figure of 0.02% of expenditure compares with estimates of 3% to 5% in the European Union and United States. While these comparisons need to be treated with caution, they suggest that there could be significant fraud and error that is unreported or undetected and losses that are not being adequately addressed. Given current fiscal challenges, reducing the level of fraud is one potential way of making savings while protecting services (paragraph 2.17).
Government action
12 The National Fraud Authority, the previous lead on fraud across government, closed in March 2014. Its responsibilities passed to a number of bodies: the City of London Police, the National Crime Agency, the Home Office and Cabinet Office. However, a few of its functions such as producing the annual fraud indicator have not continued (paragraphs 2.7 and 3.2).
13 The Cabinet Office is now the policy lead for fraud but relies on departments to manage fraud risk individually. The government publicly set out an approach to reducing fraud and error in 2011 and internally revised this approach in 2013. A small team in the Cabinet Office together with a fraud, error and debt task force (set up in 2010 to look across government then refocused on tax and welfare in 2013), are responsible for setting government’s policy and priorities. During the first few years, the government’s approach to reducing fraud was to develop a range of counter fraud initiatives, mainly in tax and welfare. In 2013, it revisited this approach and asked departments to assess their own counter fraud capacity. Initiatives since then have targeted specific areas of departmental weakness. They have focused on improving accountability, measurement and reporting and using data sharing and analytical techniques to share intelligence and detect more fraud (paragraphs 3.5, 3.8 to 3.14 and 3.18 to 3.19).
14 The Cabinet Office has provided valuable central guidance and expertise to departments to improve the way they manage fraud. The Cabinet Office’s small policy team is growing into a centre of expertise with a broader programme of work. It has tried to raise the profile of counter fraud activity and has taken steps to improve understanding of the cross-government picture by collecting data and surveying department’s counter fraud capacity. In the absence of firm levers, it has tried to improve aspects of governmental capability through influence, and promote collaboration between departments. However, some areas of its work have less defined plans for achieving the government’s ambitions to reduce fraud and there is a need for clearer measures of success to assess progress and the impact of central initiatives (paragraphs 3.3 to 3.4).

Fraud landscape review Summary 7
15 Departments’ capacity and capability to manage fraud is mixed. Departments reported varying abilities to understand and address fraud risks within their organisations. Some may lack an understanding of their exposure to fraud including knowing what their riskiest processes are. Consideration of fraud risk early in policy/programme development through ‘fraud risk assessments’ is also not widespread. Those departments with dedicated fraud resources tend to focus on investigating cases of fraud rather than preventing it (paragraphs 3.16, 3.17 and 4.10).
16 There are few incentives for departments to record and report the true scale of potential fraud. Historically, those departments that report high levels of fraud attract more attention than those departments that report no or low risks of fraud. However, departments might report high levels of fraud because they have invested in identifying and assessing fraud (paragraphs 2.19 and 4.11).
17 Measuring certain types of fraud is inherently difficult and there is a trade‑off to be made in respect of the time and costs in doing so. Organisations need to consciously invest resources and decide what approach is best suited to their circumstances and exposure to risk. Efforts by central government to detect and measure fraud and error have focused on asking departments to conduct random sampling of high-risk areas with mixed success. However, this will be only one source of information about government’s exposure to fraud risk (paragraphs 3.20 and 4.5).
18 It is hard for government to assess the extent and nature of potential fraud and the areas most at risk of loss given the lack of good quality data. Lack of data makes it difficult for the government to formulate a response to the risk of fraud and focus resources effectively. Without fully understanding the level of risk, departments cannot put in place a strategy to mitigate risk and cannot design or implement preventative controls or undertake targeted interventions. Attempts to understand the key risks across government rather than at a departmental level are also at an early stage (paragraphs 4.15, 4.17 and 4.18).
19 The lack of data and absence of metrics to evaluate performance make it difficult to assess whether the government’s actions are improving the detection and prevention of fraud. Most central government activity so far has focused on getting departments to recognise the risks and establish governance structures and processes to better identify and prevent fraud. These are necessary steps to being able to evaluate success. There has been early progress in identifying more fraud but it is too early to tell if this is a sustained trend (paragraphs 3.18, 3.19, and 3.23).

8 Part One Fraud landscape review
Part One
Background
What is fraud?
1.1 In 2014, the government set out an agreed standard for fraud.5 This draws on the legal definition set out in the Fraud Act 2006:
“The making of a false representation or failing to disclose relevant information, or the abuse of position, in order to make a financial gain or misappropriate assets”.
1.2 It also recognises the civil definition and states that “cases should… be recorded as fraud where the department judges that the misrepresentation, omission or abuse of position has been made fraudulently on the balance of probabilities”.
Fraud within the public sector
1.3 The risk of fraud affects all departments across the public sector. While fraud associated with the tax and benefits systems accounts for the largest recorded losses,there are significant losses relating to other forms of expenditure. These include procurement spending, and grants, where people seek to exploit government schemes for their personal gain.
Common types of fraud
1.4 Fraud can be committed internally by public sector workers or externally by suppliers, contractors and members of the public. It covers a wide spectrum of activities.
Internal fraud
1.5 Case example 1 provides examples of known internal fraud cases across departments.
5 Cabinet Office, Common areas of spend, Fraud, error and debt, Standard Definition v2.1, July 2014, available at: www.gov.uk/government/uploads/system/uploads/attachment_data/file/340578/CAS-FED-Guidance-version-2.1-July-2014_P1.pdf

Fraud landscape review Part One 9
Case example 1Examples of internal fraud in departments
Payment fraud
An individual who was employed in the public sector for six months used another log-in and password to access the department’s finance system. He/she transferred £35 million to a third party bank account. This was recovered after the bank contacted the department involved. A second payment was identified and also recovered.
False expense claims
A former secretary defrauded a department by submitting false expense claims over the course of two years. She falsified emails authorising payment and managed to take £100,276, of which £85,500 was stolen in her last four days in the role. In 2015, she was convicted and sentenced to 22 months in prison.
Misuse of leave
An individual who worked in the public sector for 15 years falsified records over a period of time to change flexi days to annual leave. They were responsible for their own flexi sheets, with their manager checking periodically. The individual was dismissed and recovery action taken for loss of around £3,000.
Source: Cabinet offi ce examples, Example 2 from media, ‘MoD secretary Yasmin Disney jailed for £100k fraud’, The Independent, 10 June 2015, available at: www.independent.co.uk/news/uk/home-news/mod-secretary-yasmin-disney-jailed-for-100k-fraud-10309105.html
1.6 There is limited information on the value and frequency of the types of fraud that have occurred (see Part Two for a discussion on the limitations of the data). Based on the data available in 2014-15, government departments reported 52 instances of internal fraud to the Cabinet Office, totalling £1.6 million. Figure 1 overleaf draws on returns from departments and shows the reported internal fraud types by value.
1.7 As part of a capability review in 2013, the Cabinet Office asked departments to identify the processes that they perceived most at risk of fraud. For internal processes, answers related to:
• travel and subsistence claims;
• staff reporting of absence; and
• change of supplier details for payments.

10 Part One Fraud landscape review
Fig
ure
1Va
lue
of in
tern
al fr
aud
by t
ype
Valu
e (£
000)
Sum
mar
y o
f d
epar
tmen
tal d
ata
retu
rns
Sou
rce:
Con
solid
ated
dat
a re
que
st 2
014-
15
Inte
rnal
frau
d t
ype
0
100
200
300
400
500
600
700
Exp
loiti
ng
asse
tsId
entit
y th
eft
Sta
ff co
llusi
onG
over
nmen
t pr
ocur
emen
t ca
rd
Man
agem
ent
repo
rtin
g fra
ud
Rec
eipt
Pay
men
tP
erso
nnel
m
anag
emen
tO
ther
Thef
t of
asse
tsTr
avel
and
ex
pens
es
579
468
222
205
143
1

Fraud landscape review Part One 11
External fraud
1.8 Areas of external fraud include:
• procurement fraud such as tendering irregularities or payment for goods and services not delivered (see Case example 2);
• fraudulent claiming of grants or public funding like social benefits;
• tax/income – theft and/or evasion of revenues due to the public sector and/or false claiming or over-claiming of benefits (see Case example 3);6 and
• entitlement to public service – fraudulent use of public services to which the user is not entitled (see Case example 4 overleaf).
6 See footnote 5, page 11.
Case example 2External fraud in departments
Procurement fraud
A former senior commercial officer at the Ministry of Defence (MoD) admitted accepting payments worth £66,500 to favour a supplier bidding for CCTV contracts. According to the Serious Fraud Office (SFO), he received the bribes from the owner of a security company who sought favourable consideration for the tendering and continuation of CCTV contracts with the MoD.
He pleaded guilty at Belfast Crown Court to 11 counts of corruption related to receiving bribes, and to three counts of money laundering. The supplier secured contracts worth a total of £16.2 million through the bribes, and pleaded guilty to 16 counts of corruption involving payments to MoD employees.
Source: Angeline Albert, ‘Former MoD buyer pleads guilty to accepting bribes’; Supply Management, 23 February 2012, available at: www.supplymanagement.com/news/2012/former-mod-buyer-pleads-guilty-to-accepting-bribes
Case example 3External fraud in departments
NHS dental fraud claims
A Birmingham dentist was jailed for seven years in 2012 for stealing £1.4 million from the NHS. The dentist submitted over 7,000 false claims for payment to the NHS, for work she had not performed including for deceased patients and patients she had never met. Almost 75% of the payments made under her NHS contract were based on false claims. She was found guilty of conspiracy to defraud the NHS in July 2012 and later pleaded guilty to intending to pervert the course of justice.
Source: ‘Birmingham fraud dentist Joyce Trail ordered to return money to NHS’, NHS Business Services Authority, 6 March 2014, available at: www.nhsbsa.nhs.uk/4456.aspx

12 Part One Fraud landscape review
1.9 Based on the data available, government reported 47 instances of external fraud, totalling £30.5 million in 2014-15. Figure 2 summarises the departmental returns for external fraud split into four broad categories.
1.10 When departments assessed their perceived external fraud risks, responses related to:
• processes/payments that people apply for such as identity documents, benefit payments, student support payments;
• inappropriate grant payments; and
• external contracts/subcontracts.
Case example 4External fraud in departments
Student visa fraud
Fraud was uncovered in English language testing where overseas students applying for extensions to their student visas could buy falsified results for the language test. An estimated 48,000 immigrants may have fraudulently obtained English language certificates despite being unable to speak English. Of the 48,000 certificates, 29,000 were invalid and 19,000 were ‘questionable’. The Minister for Immigration and Security said:
“Facilitated by organised criminals, this typically involved invigilators supplying, even reading out, answers to whole exam rooms or gangs of imposters being allowed to step into the exam candidates’ places to sit the test. Evidently this could only happen with considerable collusion by the test centres concerned”.
An inquiry into abuse of the student visa system found evidence of systematic cheating and criminal activity. The Home Office suspended the licenses for admitting foreign students of several universities and private colleges for their failure to ensure that their students met the criteria set out in immigration rules. Immigration enforcement officers also identified migrants who were in the country illegally as a result of the falsified language tests and took action to remove them.
Sources: Available at: www.gov.uk/government/speeches/statement-on-abuse-of-student-visas--2, Home Offi ce annual report and accounts 2014-15, p 16, www.gov.uk/government/uploads/system/uploads/attachment_data/fi le/441282/HO-AR15_web.pdf and media reports, www.theguardian.com/uk-news/2014/jun/24/english-language-tests-cheating-results-invalid-overseas-students, www.bbc.co.uk/news/uk-politics-27993775

Fraud landscape review Part One 13
Figure 2Frequency and value of external fraud 2014-15
Type of external fraud Value (£ to nearest 000)
Number of incidences
Income – tax fraud, fine/charge evasion 01, 2 0
Supplier – exploiting assets/information, post contract fraud, identity theft
933,000 6
Third party – cheque, mandate, card, e-enabled fraud and unsolicited requests for payment
3,273,000 21
Expenditure – procurement, grant, loans, means tested payments 26,297,000 20
Notes
1 Departments reported nil incidences of ‘income’ related external fraud. This does not refl ect fi gures reported elsewhere.
2 Also excludes separately published numbers on the tax gap which is the difference between the amount of tax that is due and the amount that is collected.
Source: Consolidated data request 2014-15

14 Part Two Fraud landscape review
Part Two
What is the scale of fraud?
2.1 This part summarises the available data on the value and nature of fraud within the public sector. The data is not sufficient to enable the government to understand the scale of fraud or the areas of high risk. This is because much fraud goes undetected or unreported by public sector bodies.
What is known
2.2 There are various sources of information on the level of fraud across government. Data is available from:
• an annual fraud indicator which was last produced up to 2013; and
• figures that government departments report to the Cabinet Office on losses they have detected.
2.3 The data is a mixture of actual detected loss and estimates of total fraud, including fraud that is undetected. In addition, fraud by its nature is hard to identify and distinguish from ‘error’. This means there are inconsistencies in reporting that make it difficult to compare the figures across government, or externally. Departments also report some fraud through their annual accounts and in the whole of government accounts but these are less complete.
Reported fraud
Annual fraud indicator
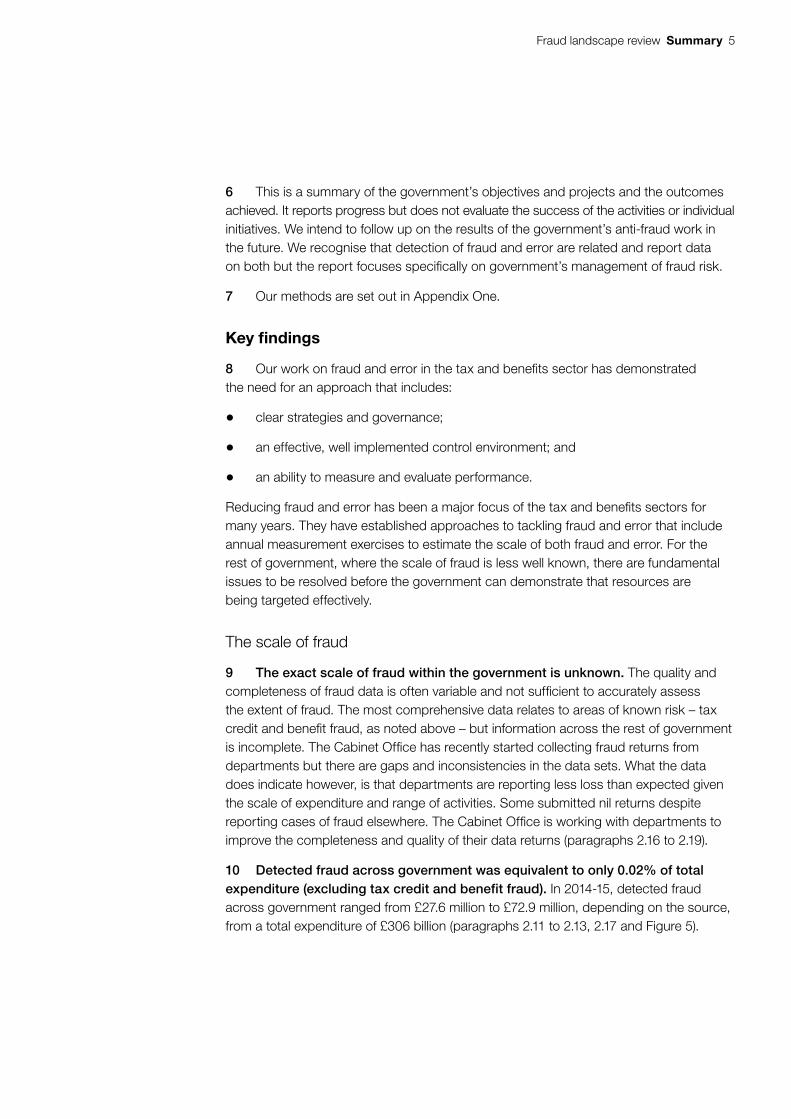
2.4 The annual fraud indicator is a collection of fraud loss indicators drawn together to estimate the possible scale, prevalence and cost of fraud. The last estimate from June 2013 reported fraud against the public sector to be £20.6 billion each year. Of this, it is estimated that central government might be losing £2.6 billion and local government £2.1 billion to fraud. A further £14.0 billion is estimated to be lost to tax fraud and vehicle excise fraud, and £1.9 billion to benefit and tax credit fraud (Figure 3).7 This report focuses on fraud affecting central government as this area has had less attention. We have previously examined fraud in tax credits and benefits.
2.5 Figure 4 breaks down the loss to central government in more detail and shows the level of confidence (judged by the National Fraud Authority) in each estimate.
7 National Fraud Authority, Annual fraud indicator, June 2013, available at: www.gov.uk/government/uploads/system/uploads/attachment_data/file/206552/nfa-annual-fraud-indicator-2013.pdf
Fraud landscape review Part Two 15
Figure 3Value of fraud against public sector (£ billion)
Tax system£14bn
Central government£2.6bn
Local government£2.1bn
Benefits and tax credit £1.9bn
Source: Annual Fraud indicator 2013
Fraud loss estimated in 2013
Figure 4Central government fraud loss by type (excluding tax and benefi ts) 2013
Level of confidence in estimate1
Type Estimatedfraud loss
(£m)
Identified fraud2
Hidden fraud
Procurement fraud 1,400 1,400
Grant fraud 504 504
TV license fee evasion 204 204
Payroll fraud 181 181 Unknown
NHS patient charges fraud 1563 156 Unknown
NHS dental charges fraud 734 73 Unknown
Student finance fraud 31 31 Unknown
Pension fraud 14 14 Unknown
National Savings & investments (NS&I)
0.4 0.4 Unknown
Excellent Good Poor
Notes
1 The level of confi dence varies from poor, average, good, excellent.
2 The category ‘identifi ed’ fraud is not the same as the government’s defi nition of ‘detected fraud.’
3 This comprises prescription, optical and dental patient losses. More up-to-date fi gures are available for prescription fraud – the latest value is £237 million.
4 More up-to-date fi gures are available – the latest value is £92 million.
Source: Table on page 14 and 65 of National Fraud Authority, Annual fraud indicator, June 2013, available at: www.gov.uk/government/uploads/system/uploads/attachment_data/fi le/206552/nfa-annual-fraud-indicator-2013.pdf

16 Part Two Fraud landscape review
2.6 The fraud indicator collates primary and secondary data sources into a single document containing fraud loss estimates. Its data is not comparable from year to year so it cannot be used to analyse trends. Also, each estimate is calculated in a different way so estimates are not always comparable. The Cabinet Office’s main concern with the fraud indicator is that it excludes areas of government spend where there is known fraud so may be incomplete. Also the big areas of spend are based on broad estimates. Estimating fraud is not an exact science, and the nature of some of the fraud types makes it difficult to measure and cost.
2.7 The National Fraud Authority was responsible for producing the indicator from 2010 to 2013. Since it was closed no fraud loss indicators have been published. From 2016, the indicator will be produced by an independent third party, with the government represented through a steering group.
2.8 The National Fraud Initiative, previously led by the Audit Commission and now by the Cabinet Office is another means of detecting fraud in local and central government. It detects potential fraud by matching electronic data sets within and between 1,300 public and 77 private sector bodies to detect fraudulent patterns of activity. In 2014, it identified £229 million of fraudulent or incorrect UK public sector payments over the previous two years. The total value of cases of fraud, overpayment or error identified was lower than in previous years, however, the number of cases detected rose by 19%. Pension fraud, overpayment and error make up the largest proportion of public sector fraud in England (£74 million), followed by council tax single person discount (£39 million) and then housing benefit (£33 million).8 It is not compulsory for central government bodies to participate in the National Fraud Initiative. In this last exercise (2014), only 13 central government departments or arm’s-length bodies opted to do so. However, some of these bodies chose to submit only some of the possible data sets, or a sample.9
Data returns
2.9 From July 2011, the government required departments to record their detected and prevented fraud and error in data summaries. The fraud, error and debt team in the Cabinet Office collate this data. Before this, no department-level data on fraud existed. This request was in response to recommendations by the Committee of Public Accounts that it should collect information on fraud across all departments so that it can disclose all money lost through fraud and error.10
8 Pat Sweet, Audit Commission identifies £229 million fraud in UK public sector payments, CCH Daily, 12 June 2014, available at: www.accountancylive.com/audit-commission-identifies-%C2%A3229m-fraud-uk-public-sector-payments and National Fraud initiative, National report, June 2014, available at: www.gov.uk/government/uploads/system/uploads/attachment_data/file/400955/NFI-national-report-FINAL-11-June-2014.pdf
9 Central government participants included: Cabinet Office, Home Office, Department for Communities and Local Government, Highways Agency, Department of Health, HM Revenue & Customs and Department for Work & Pensions.
10 HC Committee of Public Accounts, Whole of government accounts 2012-13, Twenty-sixth Report of Session 2014-15, HC 678, January 2015.

Fraud landscape review Part Two 17
2.10 Since 2014, there have been two fraud and error data returns provided by departments:
• Quarterly Data Set (QDS) was introduced in 2012 and then paused in 2015-16. It was collected quarterly and submitted annually and is broken down by:
• detected fraud and error – includes instances of identified fraud where, post-payment, it was decided that on the balance of probabilities the intention was to defraud; and
• prevented fraud – any incidents of fraud that have been prevented (in the reference period) as a result of specific fraud prevention processes or transactions identified as being fraudulent before payment was made.11
• Consolidated Data Request (CDR) was introduced in 2014. It is collected and submitted quarterly. It is more detailed as it breaks fraud into defined categories. Initially, it did not include prevented fraud but there are plans to include this (to replace reporting through QDS which stopped in 2015-16).
2.11 The Cabinet Office has taken both of these data returns and developed a ‘true’ detected fraud figure. This uses the most accurate data from either the QDS or the CDR plus figures that were not reported in either return but appeared in other published reports and exercises. Figure 5 overleaf presents a summary of findings from 2014-15 showing the QDS, CDR and ‘true fraud’ data by department. Figure 6 on page 19 draws out the key figures across government.
2.12 Departments and their arm’s-length bodies identified a total of £27.6 million in detected fraud and error in 2014-15 in their QDS. This compares with £43 million the previous year. In total, departments reported that they prevented £27.5 million of fraud (excluding £28 billion from the Department for Work & Pensions (DWP) and HM Revenue & Customs (HMRC)). This was an increase on the previous year where £9 million was reported as prevented.
2.13 Departments detected £58.3 million of fraud and error in the CDR of which £29.7 million was fraud. As 2014-15 was the first year of complete data, it is difficult to draw conclusions on the patterns across government.
11 See footnote 5.

18 Part Two Fraud landscape review
Figure 5Summary of detected fraud by department 2014-15
Department Expenditure1
(£m)
QDS detected fraud and error2
(£m)
CDR detected fraud and error2
(£m)
CDR detected fraud2
(£m)
‘True’ detected fraud3
(£m)
Department for Business, Innovation & Skills
23,700 4.9 21.2 21.2 21.2
Department of Energy & Climate Change
5,700 0 0.14 0.14 0.136
Cabinet Office 807.4 0 0 0 0.001
Department for Communities and Local Government (excluding grants to local authorities)
4,600 0.03 0.037 0 0.037
Department for Culture, Media & Sport
3,700 0.04 0 0 0.144
Department for Transport 20,080 0.36 0.21 0 0.4
Department for Environment, Food & Rural Affairs
6,300 0.83 0.7 0.3 1.42
Foreign & Commonwealth Office
1,780 0.92 0.91 0.91 0.92
Ministry of Justice 9,300 2.18 3.65 0.89 3.65
Ministry of Defence 35,800 1.45 1.23 1.23 1.45
Home Office 15,000 1.7 16.5 1.19 16.5
Department for International Development
9,800 2.30 2.30 2.30 2.30
Department of Health (including NHS)
113,300 2.32 2.11 1.5 14.2
HM Treasury 1,472 0.65 0.29 0 0.65
Department for Education 54,980 9.88 9.12 0 9.88
Total 306bn 27.6m 58.3m 29.7m 72.9m
Notes
1 Expenditure fi gures taken from annual report and/or NAO short guides.
2 Detected fraud and error fi gures provided by departments to the Cabinet Offi ce. Some departmental fi gures include fraud detected by arm’s-length bodies as well as central departments.
3 ‘True’ detected fraud takes the most accurate data from either the QDS or the CDR plus fi gures that were not reported in the returns but appeared in other published reports and exercises.
4 Figures have been rounded which may account for discrepancies in the totals.
Source: Cabinet Offi ce data provided to the National Audit Offi ce

Fraud landscape review Part Two 19
Figure 6Key fraud and error fi gures across government
‘True’ detected fraud and error
Based on best information from QDS, CDR and
other sources
£72.9m
Quarterly Data Summary (2014‑15)
Detected fraud and error
Prevented fraud
£27.6m (£43.3m)*
£27.5m (£9m)*
Consolidated Data Request (2014‑15)
Detected fraud and error
Detected fraud
Recovered fraud
£58.3m
£29.7m
£27.3m
Note
1 Excludes Department for Work & Pensions and HM Revenue & Customs.
Source: Data returns
*2013-14 figures

20 Part Two Fraud landscape review
2.14 The Cabinet Office recognises that there are serious limitations in the data available:
• There are substantial inconsistencies in the data with discrepancies between the two sets of data returns. Total detected fraud and error in the CDR was £58.3 million, almost double the total detected fraud and error in the QDS which was £27.6 million. In theory, they should be the same.
• Departments’ processes for collecting the data are unclear, particularly in those departments that do not have resources dedicated to fraud and error. Some departments include arm’s-length bodies in their submissions, others report them separately or partly include them. Some departments may report a mixture of fraud and error and can define and measure fraud differently. Response rates are also low with some departments reporting no fraud when there are known cases.
• The definition of fraud is subjective so people can interpret it differently. There is a civil definition (see paragraph 1.3) and also a criminal definition where fraud offences are defined under the Fraud Act 2006. The agreed government definition recommends recording fraud using the civil burden of proof. This requires departments to make a judgement on whether the action or inaction was more likely than not to have been made to defraud the department rather than being erroneous.
2.15 The Cabinet Office intends to provide individual support to departments to ensure that the submissions are more accurate and internally consistent. It reviewed the 2014-15 submissions and has assessed the confidence level of each individual department’s reporting, challenging them on the comprehensiveness and quality of their returns. It has agreed that it could have been clearer in communicating what to provide and when. It has decided to simplify the process by only requesting the CDR from departments. It also created a ‘Prevention panel’ to improve reporting of savings made through preventing fraud. This panel was used to endorse methodologies and approve savings.
What is unknown
Unreported and hidden fraud
2.16 The full extent of public sector losses is unknown as much fraud is hidden, difficult to find or remains unreported. There are large gaps in knowledge about fraud losses, and methods to measure fraud accurately are still developing. Fraud reported to the Cabinet Office and the authorities (eg investigators like the police) is only a small proportion of the fraud detected. This in turn, is potentially only a fraction of the fraud that remains undetected.
Fraud landscape review Part Two 21
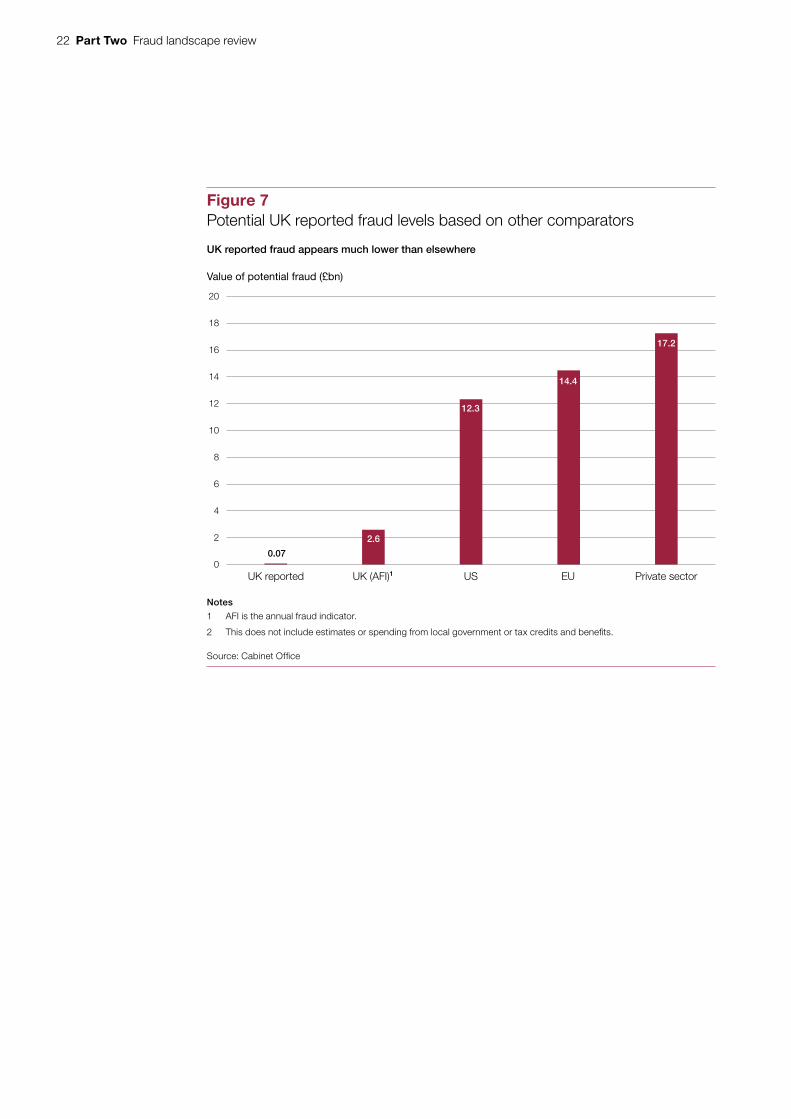
2.17 The government reported level of fraud is 0.02% of its expenditure which is significantly lower than the few available comparators that estimate the total level of fraud.12 For example, the last annual fraud indicator estimated losses equivalent to 0.8% of expenditure. In comparison, the US government reports around 4% in ‘improper payments’; the EU reports 4.7% in ‘error’ (a broad term that encompasses some fraud) and the private sector level is 5.6%.13,14,15 When applied to UK expenditure, these percentages would be equivalent to between £15 billion and £22 billion of fraud in the UK. The significance of the disparity may be because these are not like-for-like comparators. However, it may also suggest higher levels of undetected and unreported fraud within the UK public sector.
2.18 Figure 7 overleaf shows the potential loss for the UK if fraud was equivalent to the same percentage loss rate as the US, EU, and private sector benchmarks.
2.19 Three departments reported zero fraud in their CDR in 2014-15, some of which had reported fraud elsewhere. A nil return does not necessarily mean there is no fraud; it may indicate that there is no system in place to detect and/or measure fraud within the organisation. Conversely, it can also be a sign of a strong control environment.
12 Cabinet office estimate ‘true’ detected fraud to be £72.9 million from a spend of £306 billion (0.02%) in 2014-15 excluding Department for Work & Pensions, HM Revenue & Customs and local government.
13 The US has a legal requirement for designated major US public sector bodies to measure and report ‘improper payments’. In 2014, Federal agencies reported a government-wide improper payment rate of 4.02%. Note that not all improper payments are fraud, and not all improper payments represent a loss to the government. This value includes some social security benefits which we have excluded from the UK figure. Further details available at: https://paymentaccuracy.gov/about-improper-payments
14 This is the EU error rate which measures the money that should not have been paid from the EU budget because it was not used in accordance with EU rules, European Court of Auditors, Annual report 2013, November 2014, available at: www.eca.europa.eu/en/Pages/AR_2013.aspx
15 Gee & Button, The financial cost of fraud 2015, February 2015, available at: www.pkf-littlejohn.com/the-financial-cost-of-fraud-2015. The estimate is the average percentage loss across 382 loss measurement exercises undertaken between 1997–2013 across 40 different types of expenditure across 46 organisations in 9 countries.
22 Part Two Fraud landscape review
0.07
2.6
12.3
14.4
17.2
0
2
4
6
8
10
12
14
16
18
20
UK reported UK (AFI)1 US EU Private sector
Figure 7Potential UK reported fraud levels based on other comparators
Value of potential fraud (£bn)
UK reported fraud appears much lower than elsewhere
Notes
1 AFI is the annual fraud indicator.
2 This does not include estimates or spending from local government or tax credits and benefits.
Source: Cabinet Office
Fraud landscape review Part Three 23
Part Three
What government set out to do
3.1 This part summarises recent government activity to tackle fraud. The Cabinet Office relies on departments to manage fraud risk individually, but it has also set out minimum expectations, provided guidance, advice and support. The extent to which departments act reflects their differing perceptions of risk exposure and variable capacity and capability. It is difficult to establish what impact the Cabinet Office’s activities have had.
Role of departments and central government
3.2 The National Fraud Authority was previously the lead fraud body in government; however, it was dissolved in March 2014 and its functions were transferred to the National Crime Agency, City of London Police, Home Office and Cabinet Office. The Cabinet Office is the policy lead for fraud but departments are individually responsible for managing fraud risk.
3.3 The Cabinet Office’s fraud, error and debt team initially consisted of two staff and has grown to include 14 staff.16 It aims to improve the measurement, detection and reporting of fraud loss across government. It has two roles:
• to develop and propose policies on how to reduce fraud in the public sector, agree cross-government fraud and error policies and then implement those policies; and
• to lead on data sharing strategies including the development of data analytics and analytic capability to prevent fraud.
3.4 The team works with all departments and agrees what they need to do to manage fraud. It does this bilaterally, giving attention to individual departments on specific issues.
16 Cabinet Office staff numbers: two in policy from 2011–2013 increasing to ten. Two staff on data analytics which increased to four in 2013 when the counter fraud checking service transferred to the Cabinet Office. This excludes staff handling the National Fraud Initiative.

24 Part Three Fraud landscape review
3.5 Accounting officers are ultimately responsible for managing risks within their organisations, including fraud.17 As part of this role, they are expected to take the following steps:
• assess their organisation’s vulnerability to fraud;
• evaluate the scale of fraud risk;
• respond to fraud risk;
• measure the organisation’s effectiveness of fraud risk strategy; and
• report fraud.
3.6 Most public sector fraud is prevented, identified and handled at departmental level. Each department can investigate fraud with its internal audit or investigation teams. In the case of social security, welfare benefits and tax credit fraud, the Department for Work & Pensions (DWP), HM Revenue & Customs (HMRC) and local authorities share a single fraud investigation service.
Government priorities
3.7 The government set out its priorities for reducing fraud in the public sector in 2011:
• Collaboration – silos must be removed; all parts of the public sector must work together by: sharing intelligence on fraudsters; developing cross-cutting capabilities; initiating joint projects using data analytics; and ensuring we jointly procure data analytics to drive down costs.
• Assessment of risk and measurement of losses – fraud risk must be assessed before projects and programmes are under way. Losses should also be recorded and reported via the quarterly data summary.
• Prevention – investment and resource should go into prevention, not just detection and punishment. When vulnerabilities are detected as part of risk assessment, they should be designed out.
• Zero tolerance – there is no acceptable level of fraud.18
17 HM Treasury, Managing public money, Annex 4.9.18 Cabinet Office and National Fraud Authority, Eliminating public sector fraud, the counter fraud taskforce interim report,
June 2011, available at: www.gov.uk/government/uploads/system/uploads/attachment_data/file/61023/eliminating-public-sector-fraud-final.pdf

Fraud landscape review Part Three 25
3.8 Alongside this, the government set up a fraud and error task force in late 2010. This was a strategic decision-making body at ministerial and senior official-level which developed fraud and error, debt and grant efficiency initiatives across government. It was chaired by the Cabinet Office Minister and comprised ministers and senior officials from government departments. It also brought together expertise from the private and public sectors.
3.9 The task force’s role was to provide a forum where ministers, experts and officials could:
• provide strategic guidance and oversight of cross-government initiatives;
• jointly monitor the progress of initiatives; and
• support the development and delivery of programmes by working together to solve any pro blems, or to resolve escalated issues.
3.10 It was supported by a fraud and error programme board that monitored the delivery of fraud initiatives in the public sector. The board received regular progress reports, discussed risks and issues and ensured that activities were carried out successfully and on time. Two ‘expert advisory panels’ also supported the task force and associated programme boards. The purpose of the expert advisory panels was to support, challenge and provide insight into the task force’s work.
3.11 In 2013, the task force began to focus on fraud, error and debt within the welfare system. In 2015, the task force was replaced by the fraud, error and debt steering group, which comprises senior officials from HM Treasury, the Cabinet Office, HMRC and DWP. The steering group meets regularly to monitor departments’ progress and consider ways to further reduce loss and recover more debt. There is no equivalent forum for the rest of government.
3.12 In February 2012, government set out a number of cross-government activities to achieve these goals (Figure 8 overleaf).19
19 Cabinet Office, Tackling Fraud and Error in Government, A Report of the Fraud, Error and Debt Taskforce, February 2012.

26 Part Three Fraud landscape review
Figure 8Counter fraud activities
Theme Project Objective Implemented Impact
Data analytics Spend recovery audits Payment by results contracts to identify duplicate payments
Yes £21.4 million incorrect payments recovered
Sharing information/technology
Fraud alert system Share fraud incidences/ perpetrators across government
Now run by National Fraud Intelligence Bureau
n/a
Sharing skills Fraud and error panel to support project gateway reviews
Identify and address fraud and error risks early in major programmes and projects
Not progressed systematically
n/a
Building accountability and capacity
Counter fraud champions network
Share knowledge and provide input to central team
Yes Members find forum useful and they have agreed a programme of work
Fraud awareness campaign
E-training for civil servants
Raise awareness Yes, run by National Fraud Authority
Awareness of policies and personal responsibilities increased
Measurement and reporting
Guidance to define common fraud reporting standards
Standardise and improve reporting of fraud
Yes More consistent reporting though still scope for improvement
Source: National Audit Offi ce summary of Cabinet Offi ce papers

Fraud landscape review Part Three 27
3.13 In 2013, the government revised its approach and set out a long-term vision. It did not publicly announce this. The vision for the future was:
• There is clear accountability within and between departments for reducing fraud and error loss.
• There is a clear view, held in one place in government, on who is undertaking what activity in the fraud and error agenda and what the level of capability is across government.
• Government departments and public sector organisations have a clear understanding of their fraud and error risks. They have a proportionate risk assessment that establishes which risks are most likely to lead to significant loss.
• In key risk areas, government departments are able to estimate their overall fraud and error exposure through a recognised measurement process.
• The Cabinet Office will work with selected departments based on their need by:
• supporting departments who have a clear understanding of their fraud and error risks and are working to reduce them;
• working with departments who wish to share best practice, assets and resources to increase capability and capacity within other departments or identify areas for improvement; and
• challenging departments that are not able to present a complete picture of their fraud and error risk.
• Barriers to data sharing are broken down and departments have easier and more cost-effective access to data to enable them to reduce their risk of fraud and error.
• There is an agreed framework for measuring fraud and error loss across government. This may be used in different ways depending on the individual department’s circumstances.
3.14 To work towards this vision, the government took a more fundamental look at what was going on in departments and as a first step, asked them to complete a self-assessment of fraud capability in September 2013.20 This followed an organisational capability assessment which departments completed in 2010. It was designed to help departments evaluate their capabilities in relation to managing the risks of financial loss.21
20 All departments and bodies with expenditure of over £100 million were required to complete an assessment.21 HM Treasury, DAO(GEN)01/10.

28 Part Three Fraud landscape review
3.15 The Cabinet Office analysed the results and found that:
• the government employs around 2,000 fraud specialists excluding tax and welfare staff in HMRC and DWP; and
• the public sector is covered by a relatively small number of investigators (1,250 staff) spread across a large number of organisations, with some organisations having no dedicated fraud resources at all.
3.16 The quality of departments’ counter fraud capabilities is mixed and limited. Some key findings from the 2013 assessments include:
• 22% of departments could not identify their five riskiest processes;22
• 74% lacked outcome measures to assess the effectiveness of counter fraud work;23
• 19% of bodies did not have a database for recording allegations of fraud;24
• 36% of bodies did not have a counter fraud strategy, and 6% did not have a policy;25, 26 and
• 32% of bodies did not do any form of fraud risk assessment of new policies or services.
3.17 The Cabinet Office repeated the exercise in 2015. Of the 24 bodies that responded, 17% did not have a counter fraud strategy and 30% did not have a fraud risk assessment in place.
3.18 The Cabinet Office used these findings to inform its decisions on the priority actions for departments. For example, it set out annual ‘mandates’ for all departments to carry out specific actions to tackle perceived weaknesses in fraud management. In 2013, the Public Expenditure Committee required departments to:
• appoint a board-level individual accountable for fraud; and
• develop an action plan based on an assessment of the department’s capacity to measure the risk of fraud and error losses.
3.19 In 2014, departments were asked to:
• undertake two targeted random sampling exercises to identify and measure fraud losses in the highest risk payment areas; and
• develop outcome-based metrics to measure the success of their counter fraud activity.
22 15 out of 68 organisations.23 46 bodies had no metrics to measure the effectiveness of counter fraud activities.24 13 bodies.25 25 bodies.26 4 bodies had no policy.
Fraud landscape review Part Three 29
3.20 A best practice framework on random sampling methodology was developed and agreed by a group of experts and an oversight board which also monitored delivery. Overall, 14 departments carried out random sampling exercises of 28 payment processes. They found just over £6 million in irregular transactions. The Cabinet Office extrapolated this to the whole population and estimated that there could be up to £79 million of potentially irregular transactions, implying that there is a significant level of undetected fraud. The government intends to continue random sampling each year until at least 2018-19. The second exercise has begun and will report in April 2016.
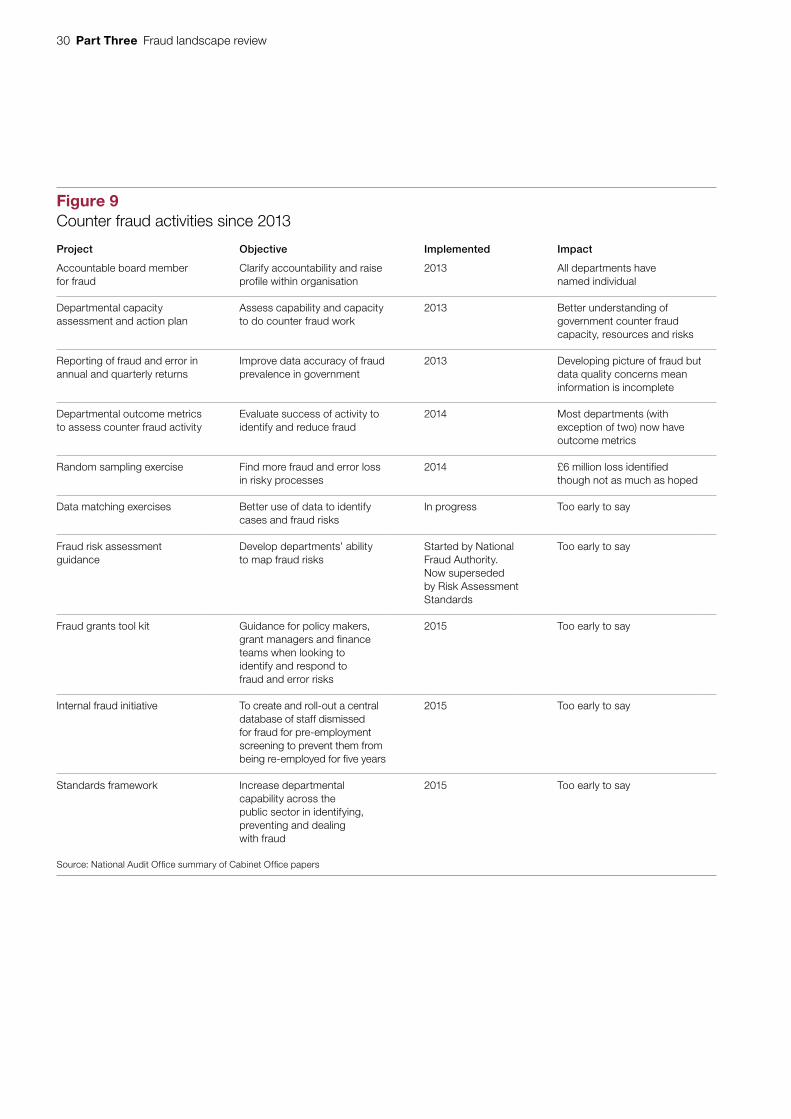
3.21 The Cabinet Office also facilitate a ‘counter fraud champion’s network’ and centrally collate information on reported fraud levels submitted by departments and facilitate data sharing. A key requirement has been to standardise reporting and for departments to provide data on levels of fraud and error. Other collaborative groups include a government investigators network, an internal fraud hub, a ‘lead group’ and professionals board to implement counter fraud initiatives. Figure 9 overleaf sets out the full range of counter fraud activities that have taken place since 2013 and their impact.
3.22 The fraud, error and debt team has also provided tailored support to departments to help address specific fraud concerns. Figure 10 on page 31 gives examples.
What has been the impact?
Savings
3.23 There is a lack of data on the extent of fraud and no metrics to evaluate the government’s performance in detecting and preventing it. This makes it is difficult to assess whether the government’s actions are improving fraud detection or prevention. There are some indications that there has been a rise in detected and prevented fraud as departments have started to identify and report it more. This is mainly the result of central initiatives like the random sampling which picked up and quantified £6 million of fraud that was previously unknown to departments.
30 Part Three Fraud landscape review
Figure 9Counter fraud activities since 2013
Project Objective Implemented Impact
Accountable board member for fraud
Clarify accountability and raise profile within organisation
2013 All departments have named individual
Departmental capacity assessment and action plan
Assess capability and capacity to do counter fraud work
2013 Better understanding of government counter fraud capacity, resources and risks
Reporting of fraud and error in annual and quarterly returns
Improve data accuracy of fraud prevalence in government
2013 Developing picture of fraud but data quality concerns mean information is incomplete
Departmental outcome metrics to assess counter fraud activity
Evaluate success of activity to identify and reduce fraud
2014 Most departments (with exception of two) now have outcome metrics
Random sampling exercise Find more fraud and error loss in risky processes
2014 £6 million loss identified though not as much as hoped
Data matching exercises Better use of data to identify cases and fraud risks
In progress Too early to say
Fraud risk assessment guidance
Develop departments’ ability to map fraud risks
Started by National Fraud Authority. Now superseded by Risk Assessment Standards
Too early to say
Fraud grants tool kit Guidance for policy makers, grant managers and finance teams when looking to identify and respond to fraud and error risks
2015 Too early to say
Internal fraud initiative To create and roll-out a central database of staff dismissed for fraud for pre-employment screening to prevent them from being re-employed for five years
2015 Too early to say
Standards framework Increase departmental capability across the public sector in identifying, preventing and dealing with fraud
2015 Too early to say
Source: National Audit Offi ce summary of Cabinet Offi ce papers

Fraud landscape review Part Three 31
3.24 There are no targets or outcome measures at the whole of government level for fraud and error. Only the DWP and HMRC have targets for reducing fraud and error and have publicly committed to reducing loss.
3.25 In August 2015, the government reported savings of £676 million through a range of counter fraud. error and debt initiatives, specifically:
• the DWP collecting debt, administering penalties and preventing overpayments;
• recoveries of duplicate or overpayments to suppliers; and
• stopping of ineligible student loan claims.27
3.26 In addition, departments have reported £27.2 million in recoveries through the consolidated data requests for the last year.
27 Government Internal Audit Agency and Cabinet Office, 2014-15 Savings validation summary report, July 2015, available at: www.gov.uk/government/uploads/system/uploads/attachment_data/file/453542/2014-15_savings_validation__report.pdf
Figure 10Examples of support to departments
Health fraud and error
The Cabinet Office fraud, error and debt team supported the Department of Health in developing and implementing plans to reduce the level of fraud loss in dental contracts and prescriptions. The team worked with the Department to examine options and gave advice to senior officials and ministers on the best course of action. The team also led on the work to share data between DWP and the NHS so that prescriptions could be checked effectively, and with minimal disruption to those claiming prescription exemptions. As a result, post prescription checking has restarted and there is more audit activity within dental contracts to identify irregular payments.
High Speed Two (HS2) Ltd
The fraud, error and debt team pulled together a group of fraud experts from across the government to act as an advisory panel to HS2 as it develops its fraud response.
Random Sampling
The Cabinet Office ran workshops with departments throughout the random sampling exercise. This included helping them to risk assess their areas of spending, select the appropriate areas of spending and create testing processes to identify fraud and error.
Source: Cabinet Offi ce

32 Part Four Fraud landscape review
Part Four
Challenges and opportunities
4.1 This part draws out the challenges that government faces in reducing fraud and its plan to address it going forward.
4.2 The government lacks a clear understanding of the scale of the fraud problem and departments vary in their ability to identify and address the risk of fraud. The Cabinet Office is attempting to improve the quality of information and raise departments’ ability to tackle fraud risks. However, there are some significant challenges and opportunities in doing so.
A challenging context
4.3 Fraud is becoming more complex and diverse as the government increases the complexity of its delivery channels. For example, greater use of third parties and digital channels could create new opportunities for fraud.
4.4 Collectively, fraud is a concern for the government with substantial estimated losses of public funds involved across all departments. However, many departments report small losses and regard their exposure to fraud risk as low. As such, fraud appears to be a low priority
4.5 Fraud is difficult to find, measure and address without investing time and resources. Such an investment can be difficult for departments to justify in the current fiscal environment. Increasing cost pressures mean that longer-term savings from fraud can lose out against shorter-term objectives to reduce costs and staff. This is particularly the case where information on the impact of counter fraud activities is either unavailable or difficult to assess. There is little information on the scale of the fraud problem – the data that does exist is patchy, inconsistent and of variable quality. It is difficult to formulate solutions if the scale and nature of the problem is unknown.
Fraud landscape review Part Four 33
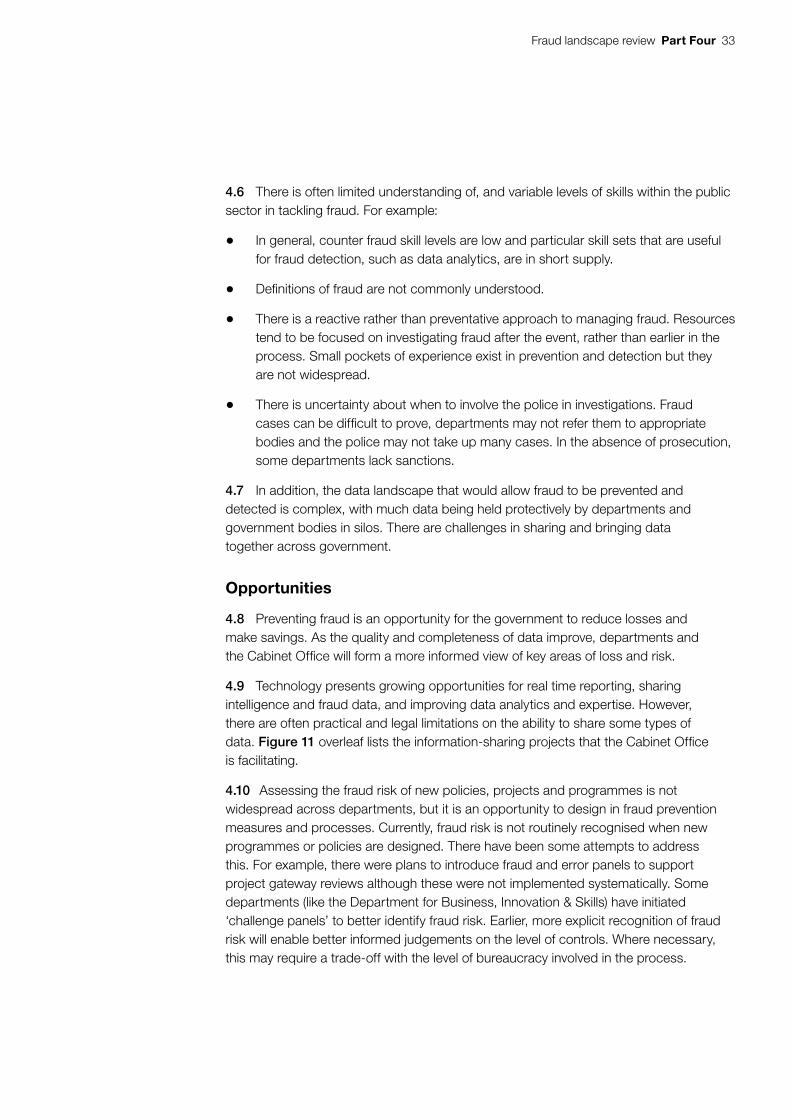
4.6 There is often limited understanding of, and variable levels of skills within the public sector in tackling fraud. For example:
• In general, counter fraud skill levels are low and particular skill sets that are useful for fraud detection, such as data analytics, are in short supply.
• Definitions of fraud are not commonly understood.
• There is a reactive rather than preventative approach to managing fraud. Resources tend to be focused on investigating fraud after the event, rather than earlier in the process. Small pockets of experience exist in prevention and detection but they are not widespread.
• There is uncertainty about when to involve the police in investigations. Fraud cases can be difficult to prove, departments may not refer them to appropriate bodies and the police may not take up many cases. In the absence of prosecution, some departments lack sanctions.
4.7 In addition, the data landscape that would allow fraud to be prevented and detected is complex, with much data being held protectively by departments and government bodies in silos. There are challenges in sharing and bringing data together across government.
Opportunities
4.8 Preventing fraud is an opportunity for the government to reduce losses and make savings. As the quality and completeness of data improve, departments and the Cabinet Office will form a more informed view of key areas of loss and risk.
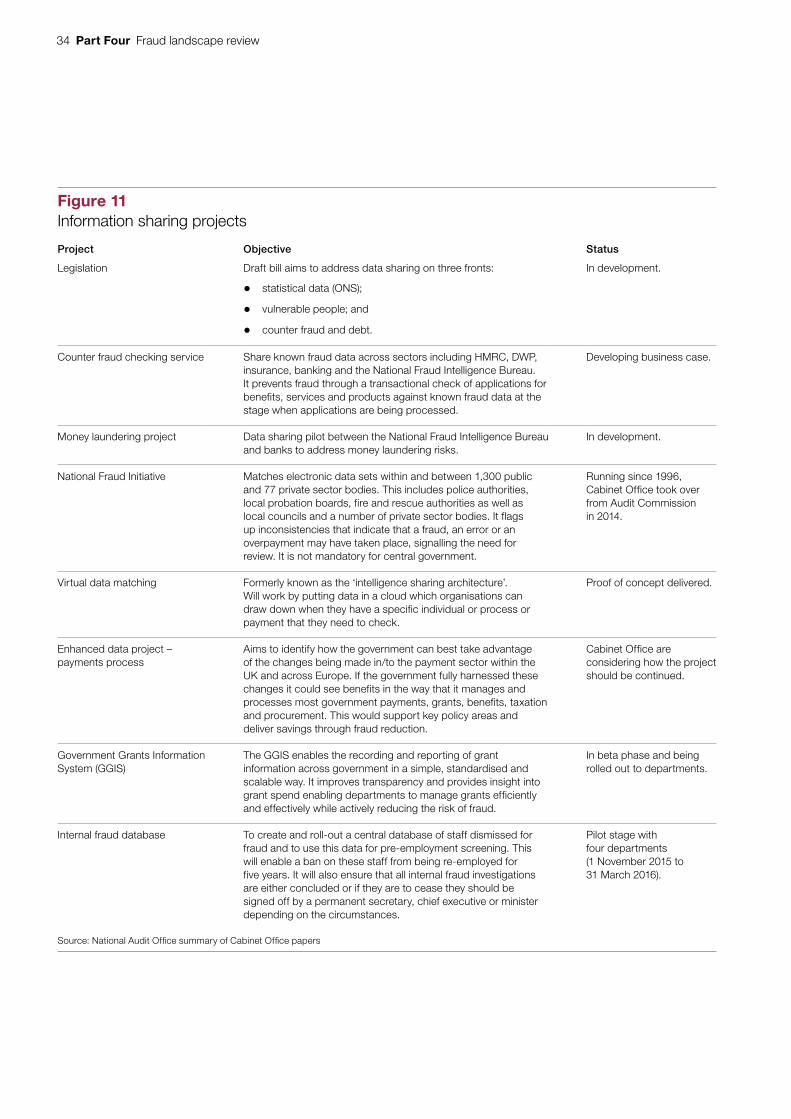
4.9 Technology presents growing opportunities for real time reporting, sharing intelligence and fraud data, and improving data analytics and expertise. However, there are often practical and legal limitations on the ability to share some types of data. Figure 11 overleaf lists the information-sharing projects that the Cabinet Office is facilitating.
4.10 Assessing the fraud risk of new policies, projects and programmes is not widespread across departments, but it is an opportunity to design in fraud prevention measures and processes. Currently, fraud risk is not routinely recognised when new programmes or policies are designed. There have been some attempts to address this. For example, there were plans to introduce fraud and error panels to support project gateway reviews although these were not implemented systematically. Some departments (like the Department for Business, Innovation & Skills) have initiated ‘challenge panels’ to better identify fraud risk. Earlier, more explicit recognition of fraud risk will enable better informed judgements on the level of controls. Where necessary, this may require a trade-off with the level of bureaucracy involved in the process.
34 Part Four Fraud landscape review
Figure 11Information sharing projects
Project Objective Status
Legislation Draft bill aims to address data sharing on three fronts:
• statistical data (ONS);
• vulnerable people; and
• counter fraud and debt.
In development.
Counter fraud checking service Share known fraud data across sectors including HMRC, DWP, insurance, banking and the National Fraud Intelligence Bureau. It prevents fraud through a transactional check of applications for benefits, services and products against known fraud data at the stage when applications are being processed.
Developing business case.
Money laundering project Data sharing pilot between the National Fraud Intelligence Bureau and banks to address money laundering risks.
In development.
National Fraud Initiative Matches electronic data sets within and between 1,300 public and 77 private sector bodies. This includes police authorities, local probation boards, fire and rescue authorities as well as local councils and a number of private sector bodies. It flags up inconsistencies that indicate that a fraud, an error or an overpayment may have taken place, signalling the need for review. It is not mandatory for central government.
Running since 1996, Cabinet Office took over from Audit Commission in 2014.
Virtual data matching Formerly known as the ‘intelligence sharing architecture’. Will work by putting data in a cloud which organisations can draw down when they have a specific individual or process or payment that they need to check.
Proof of concept delivered.
Enhanced data project – payments process
Aims to identify how the government can best take advantage of the changes being made in/to the payment sector within the UK and across Europe. If the government fully harnessed these changes it could see benefits in the way that it manages and processes most government payments, grants, benefits, taxation and procurement. This would support key policy areas and deliver savings through fraud reduction.
Cabinet Office are considering how the project should be continued.
Government Grants Information System (GGIS)
The GGIS enables the recording and reporting of grant information across government in a simple, standardised and scalable way. It improves transparency and provides insight into grant spend enabling departments to manage grants efficiently and effectively while actively reducing the risk of fraud.
In beta phase and being rolled out to departments.
Internal fraud database To create and roll-out a central database of staff dismissed for fraud and to use this data for pre-employment screening. This will enable a ban on these staff from being re-employed for five years. It will also ensure that all internal fraud investigations are either concluded or if they are to cease they should be signed off by a permanent secretary, chief executive or minister depending on the circumstances.
Pilot stage with four departments (1 November 2015 to 31 March 2016).
Source: National Audit Offi ce summary of Cabinet Offi ce papers
Fraud landscape review Part Four 35
4.11 Part of the Cabinet Office’s agenda is to change the government’s culture so that it recognises and values bodies that identify fraud. More generally, it aims to increase the amount of fraud identified and reduce its prevalence. Part of this will involve cultural change to increase departments’ appetite to identify, estimate and report fraud as well as undertaking changes to business processes to incorporate and benefit from better use of data.
4.12 Accounting officers are responsible for the proper stewardship of resources and for making decisions for their department. However, the Cabinet Office can seek to influence and incentivise the right kinds of behaviour including promoting collaboration, innovation and lessons learned. The Cabinet Office does not have strong levers to direct actions as even ‘mandates’ have to be negotiated and agreed. However, other means of influences might include: funding incentives; additional performance objectives; ensuring long-term costs and benefits are taken into account; clearly demonstrating the value for money of adopting a central approach; or softer strategies such as bringing department experts together to find solutions.
4.13 The Cabinet Office told us that its next area of focus is to build a fraud profession, and develop the counter fraud capability of departments so that they can lead the agenda with minimal central support. It has developed a new counter fraud framework in conjunction with other departments. This sets out a range of specialisms, recognising that traditionally the focus on counter fraud skills and resources has been on the reactive, investigation focused work. It aims to create standards for each of the specialisms and review training and accreditation.
What needs to happen
Departments
4.14 Our fraud and error stocktake set out the critical success factors for managing fraud in a framework.28 This framework sets out the need to establish clear strategies and governance; design controls into the way departments work; implement controls and interventions effectively; and measure and evaluate performance. This applies regardless of the type of fraud. Departments should use this framework as a means of improving their fraud management capacity.
28 Comptroller and Auditor General, Fraud and error stocktake, Session 2015-16, HC 267, National Audit Office, July 2015. Figure 1.
36 Part Four Fraud landscape review
4.15 Departments, with support from the Cabinet Office should build on existing work in the following ways:
• Set clear plans for achieving counter fraud ambitions and develop associated success measures to assess progress and the impact of initiatives. These measures will enable departments to be held to account for performance.
• Improve the quality and completeness of fraud data. Once the Cabinet Office is confident about the quality of this data, it should publish an annual report on fraud losses across government. This will improve transparency and raise awareness of fraud. This report should explain the gap that currently exists between reported fraud across government and that which could be reasonably expected when considering levels of fraud elsewhere.
• Improve understanding of where fraud risks sit within their organisations and the government more broadly. Ensure there are mitigations in place to manage those risks where they are significant.
• Undertake a thorough fraud risk assessment of all new policies/programmes as a routine part of planning, consulting counter fraud specialists as required.
• Improve the sharing of data between departments and develop analytical tools and capabilities to support the management and mitigation of risks.
Cabinet Office
4.16 The Cabinet Office has provided policy leadership of fraud across government, providing expertise in a key area of activity. So far, it has mainly focused on benefit and tax fraud. But it has taken steps to improve understanding of fraud across government by collecting data and surveying counter fraud capacity in departments. It has tried to improve the government’s capability, and promote collaboration between departments.
4.17 The Cabinet Office should continue to broaden its focus from fraud relating to HM Revenue & Customs and the Department for Work & Pensions. It should gain an understanding of what is happening in other departments where fraud has had less central scrutiny. The Cabinet Office has scope to assess and monitor performance across government better and should set an objective system for measuring the government’s performance and the impacts of initiatives. This will allow it to identify priority problem areas, support departments in dealing with them before issues become significant, and intervene where necessary.

Fraud landscape review Part Four 37
4.18 The Cabinet Office should consider:
• setting clear plans for achieving the government’s counter fraud ambitions and associated success measures to assess progress and the impact of initiatives;
• how it uses its management information and growing knowledge of the sector to develop a targeted approach. This will enable it to address departments or types of fraud that it considers to be at particular risk of loss for government; and
• developing mechanisms for holding departments to account for performance.

38 Appendix One Fraud landscape review
Appendix One
Our approach
Scope
1 This work focused on fraud in central government other than tax credit and benefit fraud.
2 We sought to answer the following questions:
• What is the scale of fraud in the public sector?
• What did the government set out to achieve and what has it done?
• What are the challenges to reducing fraud and what is being done to address fraud going forward?
3 This is a summary of the government’s objectives and projects and the outcomes it has achieved. It reports progress but does not evaluate the success of the government’s counter fraud general approach or individual activities. We intend to do a more detailed assessment in the future.
Methods
4 In examining these issues, we drew on a variety of evidence sources.
5 We interviewed key individuals from the Cabinet Office and a selection of departments to establish the approaches they were taking to manage fraud at government and departmental levels. The people we interviewed included:
• representatives from the fraud, error and debt team of the Cabinet Office; and
• fraud representatives from the Department for Business, Innovation & Skills, the Department for Environment, Food & Rural Affairs and the Foreign & Commonwealth Office.

Fraud landscape review Appendix One 39
6 We reviewed policy documents, analysis papers, meeting minutes and presentations from the Cabinet Office fraud, error and debt team.
7 We also examined data from:
• survey responses to departmental self-assessments completed in 2013 and 2015;
• the quarterly and consolidated data requests on detected and prevented fraud levels from departments from 2014-15; and
• the annual fraud indicator and national fraud initiative.
8 The report draws on these data sources. We did not audit or quality assure the data.

This report has been printed on Evolution Digital Satin and contains material sourced from responsibly managed and sustainable forests certified in accordance with the FSC (Forest Stewardship Council).
The wood pulp is totally recyclable and acid-free. Our printers also have full ISO 14001 environmental accreditation, which ensures that they have effective procedures in place to manage waste and practices that may affect the environment.

£10.00
9 781786 040329
ISBN 978-1-78604-032-9
Design and Production by NAO Communications DP Ref: 10945-001

![Sizmek Document Templat-90% 压缩版-4€¦ · coolpad "ãIE]Ð" Google ñ2ÆìÊ The Fraud Landscape Mobile Apps Total (Manuany tested Android iOS The Fraud Landscape Mobile App](https://img.dokumen.tips/doc/110x75/5ecdcbed0334f65af775971e/sizmek-document-templat-90-cc-4-coolpad-ie-google-2.jpg)