Embed Size (px)
Citation preview

FRAUD Investigation
Report
January – March 2005
California Department of Social Services Data Systems and Survey Design Bureau
September 2005

STATE OF CALIFORNIA – HEALTH AND HUMAN SERVICES AGENCY CALIFORNIA DEPARTMENT OF SOCIAL SERVICES DATA SYSTEMS AND SURVEY DESIGN BUREAU
Fraud Investigation Report Table of Contents
January – March 2005
Page
Summary........................................................................................................................... 1 California Work Opportunity and Responsibility to Kids (CalWORKs) Statewide Highlights.......................................................................................................... 2 Food Stamp Statewide Highlights ..................................................................................... 3 Welfare Fraud Special Investigative Units......................................................................... 4 CalWORKs Program Table 1 Fraud Investigations by Special Investigative Units........................................... 5 Table 2 Requests Accepted for Investigation by Primary Element of Fraud................... 6 Table 3 Investigation Results ......................................................................................... 7 Table 4 District Attorney Prosecution Activity................................................................. 8 Table 5 Prosecution Outcomes ...................................................................................... 9 Table 6 Fraud Overpayments and Collections ............................................................... 10 Food Stamp Program Table 7 Fraud Investigations by Special Investigative Units........................................... 11 Table 8 Requests Accepted for Investigation by Primary Element of Fraud................... 12 Table 9 Investigation Results ......................................................................................... 13 Table 10 District Attorney Prosecution Activity................................................................. 14 Table 11 Prosecution Outcomes ...................................................................................... 15 Table 12 Fraud Overissuances and Collections............................................................... 16

STATE OF CALIFORNIA – HEALTH AND HUMAN SERVICES AGENCY CALIFORNIA DEPARTMENT OF SOCIAL SERVICES DATA SYSTEMS AND SURVEY DESIGN BUREAU
Page 1 of 16
Fraud Investigation Report Summary
January – March 2005 In California, fraud prevention and detection is an integral part of the overall management of public assistance programs. The fraud prevention program is administered at the local level by 58 county welfare departments. The California Department of Social Services (CDSS) is responsible for developing regulations and disseminating policy information/interpretation to local entities. Within the county welfare departments, the income and maintenance units have primary responsibility for determining eligibility and computing grant amounts. If fraud is suspected, the case is referred for investigation to the Special Investigative Unit (SIU). At the discretion of the county, the SIU may be placed in the county welfare department or within another county law enforcement agency such as the District Attorney’s or Sheriff’s Office. It is the responsibility of the SIU to conduct an investigation of such cases for the purpose of establishing whether or not evidence exists to support a charge of welfare fraud. The Fraud Investigation Report provides statewide and county-specific fraud activity data on the California Work Opportunity and Responsibility to Kids (CalWORKs) and Food Stamp programs. Investigation activity by the SIUs is reflected in this report. Data shown represents the most current statistics available at the time of publication. The following three reports are the data sources for this publication, and are available on the CDSS Research and Data Reports (RADR) internet website at http://www.cdss.ca.gov/research. • DPA 266 - Fraud Investigation Activity Report
January, February and March 2005
• CA 237 CW - CalWORKs Cash Grant Caseload Movement Report January, February and March 2005
• DFA 256 - Food Stamp Program Participation and Benefit Issuance Report
January, February and March 2005 Unless otherwise stated, each data item in the publication is a quarterly rollup of three months of data from the DPA 266 – Fraud Investigation Activity Report.

STATE OF CALIFORNIA – HEALTH AND HUMAN SERVICES AGENCY CALIFORNIA DEPARTMENT OF SOCIAL SERVICES DATA SYSTEMS AND SURVEY DESIGN BUREAU
Page 2 of 16
CalWORKs Statewide Highlights
January – March 2005 Investigation Requests
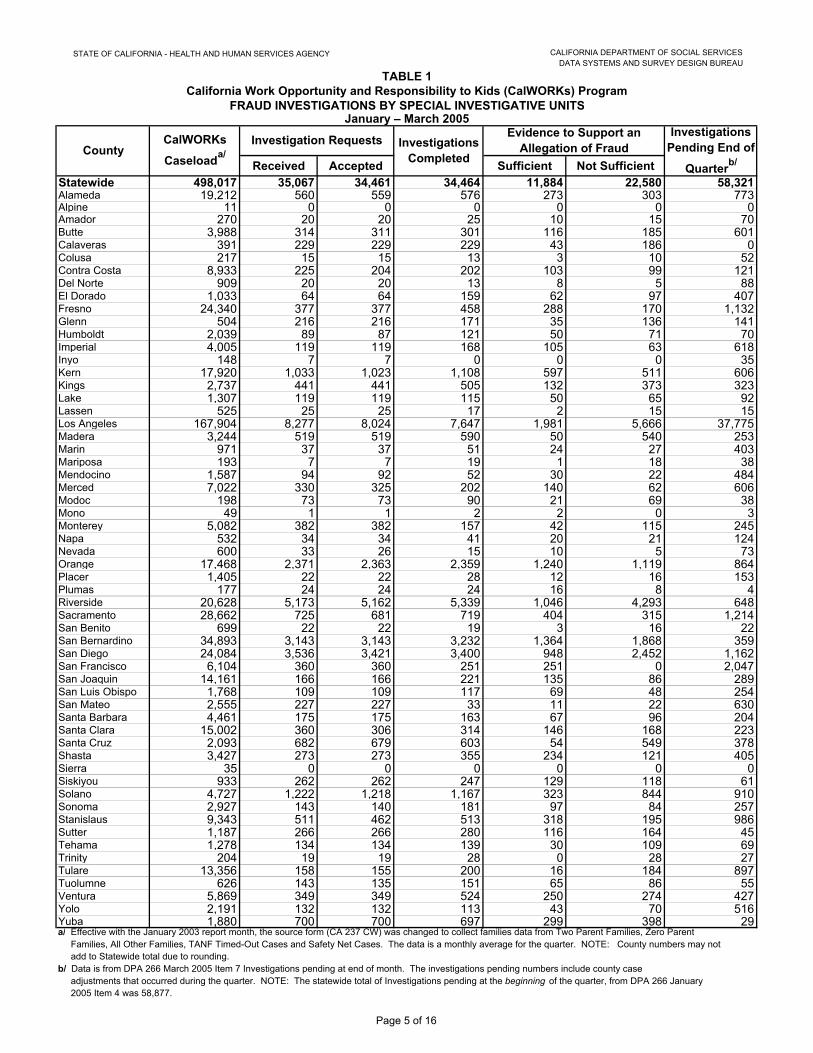
35,067 requests for investigation were received by California Special Investigative Units (SIUs) during the quarter, with a monthly average during the quarter of 11,689 investigation requests. The monthly average of investigation requests represents 2.35% of the 498,017 CalWORKs statewide caseload (monthly average during January – March 2005).
34,461 investigation requests were accepted for investigation during the quarter. This is 98% of the 35,067
investigation requests received. 21,804 (63%) were Early Fraud Prevention/Detection Program requests. 5,451 (16%) were investigation requests for other reasons including other unreported income, homeless
assistance, unreported resources/assets, duplicate/replaced warrants, duplicate aid, forgery, residence, fictitious identity, internal affairs, child care, drug felon, fleeing felon, probation/parole violators, and other miscellaneous elements of fraud.
4,281 (12%) were Income and Eligibility Verification System (IEVS) requests. 2,925 (9%) were family (household) composition requests.
93,338 investigations were available during the quarter.
58,877 (63%) of the available investigations were pending at the beginning of the quarter. 34,461 (37%) of the available investigations were accepted for investigation during the quarter.
Investigations Completed and the Results
34,464 investigations were completed during the quarter. This is 37% of the 93,338 total investigations available. 11,884 (34%) of the completed cases had evidence sufficient to support an allegation of fraud. 22,580 (66%) of the completed cases did not have evidence sufficient to support an allegation of fraud.
Of the 34,464 completed investigations, the results included:
6,229 (18%) of the cases were denied, reduced or discontinued due to the Early Fraud Prevention/Detection Program.
2,273 (7%) of the cases had fraud found, but with no adverse financial impact. 1,745 (5%) of the cases had restitution action taken. 1,668 (5%) of the cases were reduced or discontinued in non-Early Fraud cases. 735 (2%) of the cases were referred for prosecution. 194 (.56%) of the cases were referred to an Administrative Disqualification Hearing. 129 (.37%) of the cases had expiration of statutes.
Note: Completed investigations could have multiple results. Completed investigations with allegation unfounded, insufficient evidence, and other miscellaneous results included in the 34,464 are not shown in this report.
Prosecution Activity
2,592 referrals were available to the District Attorney for prosecution during the quarter. 1,902 (73%) were referrals pending at the beginning of the quarter. 690 (27%) were referrals received during the quarter.
There were 2,592 referrals available to the District Attorney for prosecution consideration during the quarter.
618 prosecutions were filed. This is 24% of the available prosecution referrals.
There were 618 prosecutions filed by the District Attorney during the quarter. 591 convictions were obtained. Some convictions obtained were from prosecutions filed in prior quarters.
Overpayments and Collections
$5,888,470 fraud overpayments were identified during the quarter. $5,127,008 collections were made during the quarter. Some collections obtained were from overpayments identified
in prior quarters.

STATE OF CALIFORNIA – HEALTH AND HUMAN SERVICES AGENCY CALIFORNIA DEPARTMENT OF SOCIAL SERVICES DATA SYSTEMS AND SURVEY DESIGN BUREAU
Page 3 of 16
Food Stamp Statewide Highlights
January – March 2005 Investigation Requests
51,818 requests for investigation were received by California Special Investigative Units (SIUs) during the quarter, with a monthly average during the quarter of 17,273 investigation requests. The monthly average of investigation requests represents 2.48% of the 696,441 Food Stamp statewide caseload (monthly average during January – March 2004, as January – March 2005 data was incomplete due to C-IV programming).
50,936 investigation requests were accepted for investigation during the quarter. This is 98% of the 51,818
investigation requests received. 30,547 (60%) were Early Fraud Prevention/Detection Program requests. 8,847 (17%) were Income and Eligibility Verification System (IEVS) requests. 8,204 (16%) were investigation requests for other reasons including other unreported income, unreported resources/assets, duplicate/replaced Food Stamps, duplicate aid, forgery, residence, fictitious identity, Food
Stamp trafficking, internal affairs, child care, drug felon, fleeing felon, probation/parole violators, and other miscellaneous elements of fraud.
3,338 (7%) were family (household) composition requests.
147,142 investigations were available during the quarter. 96,206 (65%) of the available investigations were pending at the beginning of the quarter. 50,936 (35%) of the available investigations were accepted for investigation during the quarter.
Investigations Completed and the Results
50,656 investigations were completed during the quarter. This is 34% of the 147,142 total investigations available. 16,511 (33%) of the completed cases had evidence sufficient to support an allegation of fraud. 34,145 (67%) of the completed cases did not have evidence sufficient to support an allegation of fraud.
Of the 50,656 completed investigations, the results included:
9,094 (18%) of the cases were denied, reduced or discontinued due to the Early Fraud Prevention/Detection Program.
2,611 (5%) of the cases had fraud found, but with no adverse financial impact. 2,406 (5%) of the cases had restitution action taken. 2,255 (4%) of the cases were reduced or discontinued in non-Early Fraud cases. 877 (2%) of the cases were referred for prosecution. 216 (.43%) of the cases were referred to an Administrative Disqualification Hearing. 121 (.24%) of the cases had expiration of statutes.
Note: Completed investigations could have multiple results. Completed investigations with allegation unfounded, insufficient evidence, and other miscellaneous results included in the 50,656 are not shown in this report.
Prosecution Activity
3,316 referrals were available to the District Attorney for prosecution during the quarter. 2,488 (75%) were referrals pending at the beginning of the quarter. 828 (25%) were referrals received during the quarter.
There were 3,316 referrals available to the District Attorney for prosecution consideration during the quarter.
734 prosecutions were filed. This is 22% of the available prosecution referrals.
There were 734 prosecutions filed by the District Attorney during the quarter. 648 convictions were obtained. Some convictions obtained were from prosecutions filed in prior quarters.
Overissuances and Collections
$3,607,249 fraud overissuances were identified during the quarter. $1,752,342 collections were made during the quarter. Some collections obtained were from overissuances identified
in prior quarters.

STATE OF CALIFORNIA - HEALTH AND HUMAN SERVICES AGENCY CALIFORNIA DEPARTMENT OF SOCIAL SERVICESDATA SYSTEMS AND SURVEY DESIGN BUREAU
County County Welfare Department
District Attorney's Office
County Welfare Department and District Attorney's Office
Sheriff's Office
Statewide 26 21 9 2AlamedaAlpine AmadorButteCalaveras Colusa Contra CostaDel NorteEl DoradoFresnoGlennHumboldtImperialInyoKernKingsLakeLassenLos AngelesMaderaMarinMariposaMendocinoMercedModocMonoMontereyNapaNevadaOrangePlacerPlumasRiversideSacramentoSan BenitoSan BernardinoSan Diego San Francisco San JoaquinSan Luis ObispoSan MateoSanta BarbaraSanta ClaraSanta CruzShastaSierraSiskiyouSolanoSonomaStanislausSutterTehama TrinityTulare TuolumneVentura YoloYuba
Welfare Fraud Special Investigative Units
Below is a listing of the locations of each county's Welfare Fraud Special Investigative Unit(s).January – March 2005
Page 4 of 16

CalWORKs
Tables
STATE OF CALIFORNIA - HEALTH AND HUMAN SERVICES AGENCY CALIFORNIA DEPARTMENT OF SOCIAL SERVICESDATA SYSTEMS AND SURVEY DESIGN BUREAU
Received Accepted Sufficient Not SufficientStatewide 498,017 35,067 34,461 34,464 11,884 22,580 58,321Alameda 19,212 560 559 576 273 303 773Alpine 11 0 0 0 0 0 0Amador 270 20 20 25 10 15 70Butte 3,988 314 311 301 116 185 601Calaveras 391 229 229 229 43 186 0Colusa 217 15 15 13 3 10 52Contra Costa 8,933 225 204 202 103 99 121Del Norte 909 20 20 13 8 5 88El Dorado 1,033 64 64 159 62 97 407Fresno 24,340 377 377 458 288 170 1,132Glenn 504 216 216 171 35 136 141Humboldt 2,039 89 87 121 50 71 70Imperial 4,005 119 119 168 105 63 618Inyo 148 7 7 0 0 0 35Kern 17,920 1,033 1,023 1,108 597 511 606Kings 2,737 441 441 505 132 373 323Lake 1,307 119 119 115 50 65 92Lassen 525 25 25 17 2 15 15Los Angeles 167,904 8,277 8,024 7,647 1,981 5,666 37,775Madera 3,244 519 519 590 50 540 253Marin 971 37 37 51 24 27 403Mariposa 193 7 7 19 1 18 38Mendocino 1,587 94 92 52 30 22 484Merced 7,022 330 325 202 140 62 606Modoc 198 73 73 90 21 69 38Mono 49 1 1 2 2 0 3Monterey 5,082 382 382 157 42 115 245Napa 532 34 34 41 20 21 124Nevada 600 33 26 15 10 5 73Orange 17,468 2,371 2,363 2,359 1,240 1,119 864Placer 1,405 22 22 28 12 16 153Plumas 177 24 24 24 16 8 4Riverside 20,628 5,173 5,162 5,339 1,046 4,293 648Sacramento 28,662 725 681 719 404 315 1,214San Benito 699 22 22 19 3 16 22San Bernardino 34,893 3,143 3,143 3,232 1,364 1,868 359San Diego 24,084 3,536 3,421 3,400 948 2,452 1,162San Francisco 6,104 360 360 251 251 0 2,047San Joaquin 14,161 166 166 221 135 86 289San Luis Obispo 1,768 109 109 117 69 48 254San Mateo 2,555 227 227 33 11 22 630Santa Barbara 4,461 175 175 163 67 96 204Santa Clara 15,002 360 306 314 146 168 223Santa Cruz 2,093 682 679 603 54 549 378Shasta 3,427 273 273 355 234 121 405Sierra 35 0 0 0 0 0 0Siskiyou 933 262 262 247 129 118 61Solano 4,727 1,222 1,218 1,167 323 844 910Sonoma 2,927 143 140 181 97 84 257Stanislaus 9,343 511 462 513 318 195 986Sutter 1,187 266 266 280 116 164 45Tehama 1,278 134 134 139 30 109 69Trinity 204 19 19 28 0 28 27Tulare 13,356 158 155 200 16 184 897Tuolumne 626 143 135 151 65 86 55Ventura 5,869 349 349 524 250 274 427Yolo 2,191 132 132 113 43 70 516Yuba 1,880 700 700 697 299 398 29
January – March 2005
b/ Data is from DPA 266 March 2005 Item 7 Investigations pending at end of month. The investigations pending numbers include county case adjustments that occurred during the quarter. NOTE: The statewide total of Investigations pending at the beginning of the quarter, from DPA 266 January 2005 Item 4 was 58,877.
CalWORKs
Caseloada/CountyEvidence to Support an
Allegation of FraudInvestigations
Pending End of
Quarterb/
a/ Effective with the January 2003 report month, the source form (CA 237 CW) was changed to collect families data from Two Parent Families, Zero Parent Families, All Other Families, TANF Timed-Out Cases and Safety Net Cases. The data is a monthly average for the quarter. NOTE: County numbers may not add to Statewide total due to rounding.
Investigation Requests Investigations Completed
TABLE 1California Work Opportunity and Responsibility to Kids (CalWORKs) Program
FRAUD INVESTIGATIONS BY SPECIAL INVESTIGATIVE UNITS
Page 5 of 16

STATE OF CALIFORNIA - HEALTH AND HUMAN SERVICES AGENCY CALIFORNIA DEPARTMENT OF SOCIAL SERVICESDATA SYSTEMS AND SURVEY DESIGN BUREAU
CountyEarly Fraud Prevention/Detection
Income and Eligibility
Verification System
Family (Household) Composition
Other Unreported
IncomeResidence
Unreported Resources/
AssetsOthera/
Statewide 21,804 4,281 2,925 1,328 923 225 2,975Alameda 446 34 35 13 1 8 22Alpine 0 0 0 0 0 0 0Amador 0 0 6 3 2 1 8Butte 8 6 88 33 22 8 146Calaveras 175 19 8 5 8 1 13Colusa 0 0 3 4 2 0 6Contra Costa 104 21 19 35 0 1 24Del Norte 0 0 7 2 2 0 9El Dorado 1 2 21 24 7 2 7Fresno 94 87 106 48 21 3 18Glenn 75 16 32 41 26 5 21Humboldt 13 0 31 21 3 1 18Imperial 77 0 23 4 14 0 1Inyo 3 2 1 1 0 0 0Kern 442 29 236 107 58 12 139Kings 329 0 61 21 11 0 19Lake 7 9 54 7 15 2 25Lassen 14 0 8 0 2 1 0Los Angeles 3,943 2,870 150 128 0 13 920Madera 451 12 32 12 3 1 8Marin 8 5 4 3 2 0 15Mariposa 1 0 3 0 2 0 1Mendocino 3 64 15 5 1 3 1Merced 66 31 90 26 24 1 87Modoc 59 1 5 1 4 0 3Mono 0 0 0 1 0 0 0Monterey 135 24 16 52 58 5 92Napa 0 1 14 6 2 3 8Nevada 8 0 11 2 4 1 0Orange 2,131 41 51 43 14 4 79Placer 0 0 9 3 3 2 5Plumas 14 0 8 1 0 1 0Riverside 4,723 135 109 37 26 20 112Sacramento 341 156 58 39 17 1 69San Benito 0 1 8 2 1 0 10San Bernardino 1,732 11 578 98 224 12 488San Diego 3,012 130 70 92 24 1 92San Francisco 97 258 0 0 0 0 5San Joaquin 131 14 10 2 1 4 4San Luis Obispo 28 7 33 9 11 8 13San Mateo 78 4 57 60 18 2 8Santa Barbara 40 15 53 20 16 2 29Santa Clara 212 41 33 7 5 3 5Santa Cruz 421 35 109 78 15 6 15Shasta 125 0 81 21 10 0 36Sierra 0 0 0 0 0 0 0Siskiyou 71 0 45 16 48 70 12Solano 976 102 86 24 13 1 16Sonoma 41 15 34 7 3 0 40Stanislaus 111 54 170 27 56 3 41Sutter 199 0 18 25 11 2 11Tehama 22 0 55 25 7 0 25Trinity 4 1 5 0 1 0 8Tulare 0 13 89 21 7 4 21Tuolumne 113 0 10 1 4 0 7Ventura 138 3 0 33 53 4 118Yolo 64 11 21 12 8 1 15Yuba 518 1 46 20 33 2 80a/ "Other" includes homeless assistance, duplicate warrants, duplicate (multiple) aid, forgery, fictitious identity, internal affairs, child care, drug felon, fleeing felon, probation/parole violators, and other miscellaneous elements of fraud.
TABLE 2
January – March 2005
California Work Opportunity and Responsibility to Kids (CalWORKs) ProgramREQUESTS ACCEPTED FOR INVESTIGATION BY PRIMARY ELEMENT OF FRAUD
Page 6 of 16

STATE OF CALIFORNIA - HEALTH AND HUMAN SERVICES AGENCY CALIFORNIA DEPARTMENT OF SOCIAL SERVICESDATA SYSTEMS AND SURVEY DESIGN BUREAU
ProsecutionAdministrative Disqualification
HearingStatewide 6,229 735 194 1,745 1,668 2,273 129Alameda 223 22 0 14 6 8 33Alpine 0 0 0 0 0 0 0Amador 0 4 0 1 8 0 0Butte 43 28 0 6 45 2 0Calaveras 25 0 0 1 13 4 0Colusa 0 0 0 0 3 0 2Contra Costa 26 6 0 45 0 26 0Del Norte 1 0 0 6 1 0 0El Dorado 1 2 0 11 13 36 0Fresno 40 49 154 1 46 0 39Glenn 7 1 0 9 9 9 0Humboldt 19 0 0 11 27 1 0Imperial 38 0 0 1 24 4 0Inyo 0 0 0 0 0 0 0Kern 172 74 0 43 167 79 1Kings 73 12 0 4 28 15 0Lake 14 4 0 8 27 7 0Lassen 0 1 0 0 1 0 0Los Angeles 1,012 137 0 573 16 680 0Madera 7 3 0 13 22 5 0Marin 1 0 0 9 9 5 0Mariposa 0 0 0 0 0 1 6Mendocino 1 0 0 26 2 3 0Merced 15 18 0 12 66 42 0Modoc 16 2 0 0 2 1 0Mono 0 2 0 0 0 0 0Monterey 249 1 0 0 23 1 0Napa 4 0 0 8 1 7 0Nevada 5 0 0 0 4 1 0Orange 777 29 7 68 343 184 0Placer 1 0 0 7 5 0 0Plumas 8 0 0 2 2 4 0Riverside 853 51 0 130 5 7 0Sacramento 209 12 0 120 59 4 0San Benito 0 0 0 0 3 0 0San Bernardino 454 37 0 6 269 566 0San Diego 665 56 32 203 6 81 0San Francisco 0 1 0 2 0 0 0San Joaquin 70 39 0 2 5 20 0San Luis Obispo 14 8 0 12 30 6 1San Mateo 54 6 1 15 25 22 0Santa Barbara 19 8 0 25 24 7 0Santa Clara 87 16 0 8 0 35 8Santa Cruz 52 5 0 6 0 0 1Shasta 53 7 0 45 40 89 10Sierra 0 0 0 0 0 0 0Siskiyou 9 0 0 20 28 72 0Solano 226 15 0 36 15 31 2Sonoma 30 2 0 82 50 46 19Stanislaus 64 20 0 94 142 95 3Sutter 60 11 0 14 15 20 1Tehama 3 7 0 1 12 9 0Trinity 2 0 0 0 3 0 3Tulare 0 9 0 4 3 0 0Tuolumne 40 3 0 0 6 16 0Ventura 239 11 0 0 0 0 0Yolo 13 13 0 10 0 7 0Yuba 235 3 0 31 15 15 0
January – March 2005
TABLE 3
INVESTIGATION RESULTSa/California Work Opportunity and Responsibility to Kids (CalWORKs) Program
a/ This table reflects the outcome of an investigation. In some instances an investigation may have more than one outcome reported. Therefore, the data displayed on this table may not correspond to the numbers on Table 1.
County
Early Fraud (Denials/Benefits
Reduced/Discontinuances)
Expiration of Statutes
Referred forRestitution
Action
Benefits Reduced or
Discontinued(Non-Early Fraud)
Fraud Found, No Adverse
Financial Impact
Page 7 of 16
STATE OF CALIFORNIA - HEALTH AND HUMAN SERVICES AGENCY CALIFORNIA DEPARTMENT OF SOCIAL SERVICESDATA SYSTEMS AND SURVEY DESIGN BUREAU
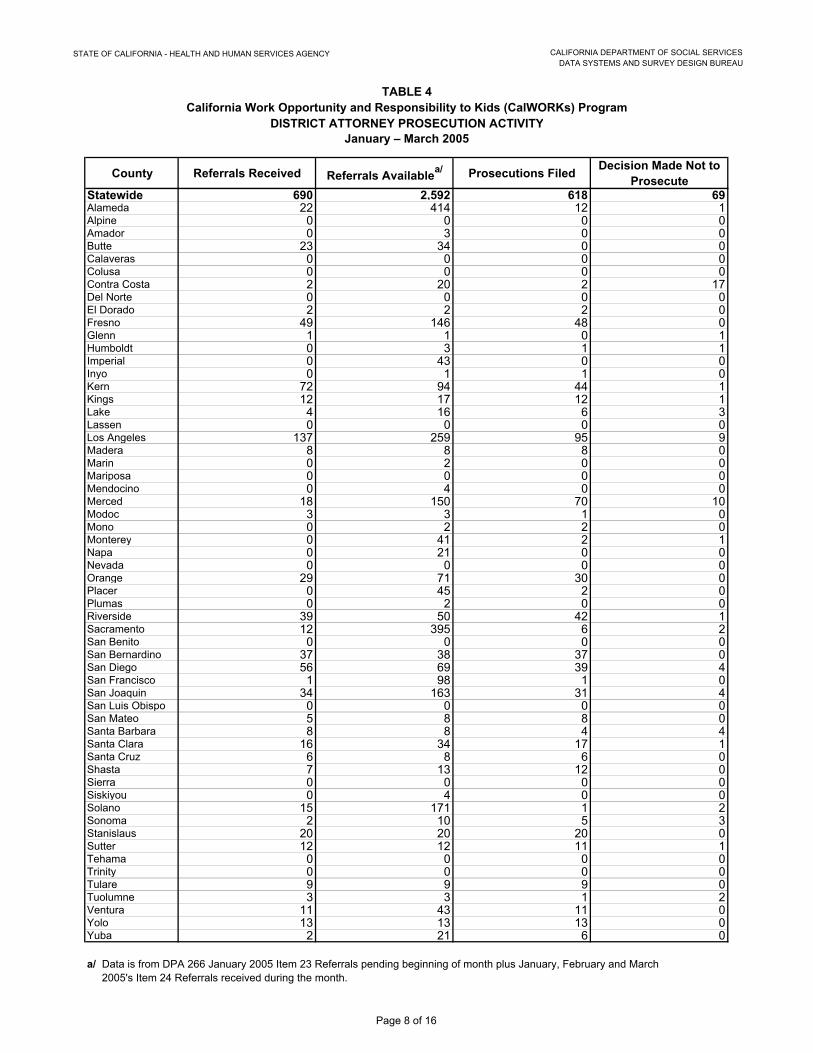
County Referrals Received Referrals Availablea/ Prosecutions Filed Decision Made Not to Prosecute
Statewide 690 2,592 618 69Alameda 22 414 12 1Alpine 0 0 0 0Amador 0 3 0 0Butte 23 34 0 0Calaveras 0 0 0 0Colusa 0 0 0 0Contra Costa 2 20 2 17Del Norte 0 0 0 0El Dorado 2 2 2 0Fresno 49 146 48 0Glenn 1 1 0 1Humboldt 0 3 1 1Imperial 0 43 0 0Inyo 0 1 1 0Kern 72 94 44 1Kings 12 17 12 1Lake 4 16 6 3Lassen 0 0 0 0Los Angeles 137 259 95 9Madera 8 8 8 0Marin 0 2 0 0Mariposa 0 0 0 0Mendocino 0 4 0 0Merced 18 150 70 10Modoc 3 3 1 0Mono 0 2 2 0Monterey 0 41 2 1Napa 0 21 0 0Nevada 0 0 0 0Orange 29 71 30 0Placer 0 45 2 0Plumas 0 2 0 0Riverside 39 50 42 1Sacramento 12 395 6 2San Benito 0 0 0 0San Bernardino 37 38 37 0San Diego 56 69 39 4San Francisco 1 98 1 0San Joaquin 34 163 31 4San Luis Obispo 0 0 0 0San Mateo 5 8 8 0Santa Barbara 8 8 4 4Santa Clara 16 34 17 1Santa Cruz 6 8 6 0Shasta 7 13 12 0Sierra 0 0 0 0Siskiyou 0 4 0 0Solano 15 171 1 2Sonoma 2 10 5 3Stanislaus 20 20 20 0Sutter 12 12 11 1Tehama 0 0 0 0Trinity 0 0 0 0Tulare 9 9 9 0Tuolumne 3 3 1 2Ventura 11 43 11 0Yolo 13 13 13 0Yuba 2 21 6 0
a/ Data is from DPA 266 January 2005 Item 23 Referrals pending beginning of month plus January, February and March 2005's Item 24 Referrals received during the month.
TABLE 4
January – March 2005DISTRICT ATTORNEY PROSECUTION ACTIVITY
California Work Opportunity and Responsibility to Kids (CalWORKs) Program
Page 8 of 16

STATE OF CALIFORNIA - HEALTH AND HUMAN SERVICES AGENCY CALIFORNIA DEPARTMENT OF SOCIAL SERVICESDATA SYSTEMS AND SURVEY DESIGN BUREAU
County Convictions Administrative Action
Disqualification Consent
Agreements
Charge Pleaded Dismissals Acquittals Declinations Expiration
of Statutes
Statewide 591 5 25 82 58 3 27 2Alameda 15 1 1 0 10 0 1 0Alpine 0 0 0 0 0 0 0 0Amador 0 0 0 0 0 0 0 0Butte 3 0 2 0 0 0 0 0Calaveras 0 0 0 0 0 0 0 0Colusa 0 0 0 0 0 0 0 0Contra Costa 0 0 0 0 1 0 2 0Del Norte 0 0 0 0 0 0 0 0El Dorado 0 0 0 0 0 0 0 0Fresno 51 0 0 0 3 0 0 0Glenn 1 0 2 0 0 0 1 0Humboldt 2 0 4 0 1 0 0 0Imperial 0 0 0 0 0 0 0 0Inyo 0 0 0 0 0 0 0 0Kern 41 0 0 0 5 0 0 0Kings 7 0 0 0 0 0 1 0Lake 0 0 0 4 0 0 0 0Lassen 0 0 0 2 0 0 0 0Los Angeles 79 0 0 0 8 0 0 0Madera 7 0 7 0 0 0 0 0Marin 0 0 0 0 0 0 0 0Mariposa 1 0 0 0 0 0 0 0Mendocino 0 0 0 0 0 0 0 0Merced 21 0 0 0 2 0 9 1Modoc 0 0 0 0 1 0 0 0Mono 0 0 0 0 0 0 0 0Monterey 0 0 0 2 2 0 0 0Napa 0 0 0 0 0 0 0 0Nevada 1 0 0 0 0 0 0 0Orange 21 3 0 0 2 2 0 0Placer 0 0 0 0 0 0 0 0Plumas 0 0 0 0 0 0 0 0Riverside 33 0 0 36 1 0 0 0Sacramento 30 0 0 0 0 0 1 0San Benito 0 0 0 0 0 0 0 0San Bernardino 41 0 0 0 8 0 0 0San Diego 61 0 0 0 6 0 0 0San Francisco 0 0 0 0 0 0 0 0San Joaquin 21 0 0 0 4 0 4 0San Luis Obispo 5 0 0 0 0 0 0 0San Mateo 1 0 0 1 0 0 0 0Santa Barbara 16 1 4 0 0 0 0 0Santa Clara 39 0 0 0 0 0 0 0Santa Cruz 0 0 0 0 0 0 0 0Shasta 20 0 0 0 2 0 1 0Sierra 0 0 0 0 0 0 0 0Siskiyou 0 0 0 0 0 0 0 0Solano 8 0 0 0 0 0 4 0Sonoma 3 0 0 0 1 0 3 0Stanislaus 12 0 0 0 1 0 0 1Sutter 0 0 1 3 0 0 0 0Tehama 0 0 0 0 0 0 0 0Trinity 0 0 0 0 0 0 0 0Tulare 29 0 0 28 0 0 0 0Tuolumne 3 0 2 0 0 0 0 0Ventura 8 0 0 0 0 1 0 0Yolo 11 0 0 0 0 0 0 0Yuba 0 0 2 6 0 0 0 0a/ This table reflects the outcome of a prosecution. In some instances a prosecution may have more than one outcome reported.
California Work Opportunity and Responsibility to Kids (CalWORKs) Program
PROSECUTION OUTCOMESa/
January – March 2005
TABLE 5
Page 9 of 16

STATE OF CALIFORNIA - HEALTH AND HUMAN SERVICES AGENCY CALIFORNIA DEPARTMENT OF SOCIAL SERVICESDATA SYSTEMS AND SURVEY DESIGN BUREAU
County Fraud Overpayments Identified Total CollectionsStatewide $5,888,470 $5,127,008Alameda 198,038 479,271Alpine 0 0Amador 97 1,239Butte 65,666 6,861Calaveras 0 1,188Colusa 0 359Contra Costa 39,760 43,623Del Norte 8,903 5,112El Dorado 8,999 19,733Fresno 90,995 149,905Glenn 21,368 4,647Humboldt 14,253 9,353Imperial 0 0Inyo 0 8,671Kern 340,830 101,812Kings 23,812 57,991Lake 14,281 3,861Lassen 5,698 1,319Los Angeles 2,557,706 1,672,100Madera 41,327 22,724Marin 7,524 20,937Mariposa 0 2,547Mendocino 45,490 46,175Merced a/ 17,432 2,455Modoc 6,431 250Mono 4,736 0Monterey 5,378 68,202Napa 11,245 12,419Nevada 0 2,758Orange 96,091 178,218Placer b/ 12,798 13,617Plumas 1,209 2,347Riverside a/ 259,154 194,979Sacramento b/ 280,164 366,978San Benito 6,488 26,631San Bernardino a/ 129,558 96,046San Diego 371,955 367,428San Francisco 99,119 130,928San Joaquin 123,229 52,768San Luis Obispo 32,437 5,500San Mateo 20,250 2,471Santa Barbara 26,631 145,750Santa Clara 145,834 353,621Santa Cruz 16,875 21,917Shasta 72,863 19,226Sierra 0 100Siskiyou 60,000 73,000Solano 76,253 86,289Sonoma 84,894 83,439Stanislaus c/ 265,480 0Sutter 29,134 4,321Tehama 0 2,029Trinity 0 212Tulare 101,655 13,134Tuolumne 4,245 7,210Ventura 1,118 86,617Yolo 20,147 34,731Yuba 20,921 11,989
TABLE 6
January – March 2005
b/ Placer and Sacramento's collections data was generated by CalWIN system and may be incomplete/incorrect for this period.c/ Stanislaus' collections data is not available for this period due to C-IV programming problems.
a/ Merced, Riverside and San Bernardino's collections data was generated by C-IV system and may be incomplete/incorrect for this period.
California Work Opportunity and Responsibility to Kids (CalWORKs) ProgramFRAUD OVERPAYMENTS AND COLLECTIONS
Page 10 of 16

Food Stamp
Tables

STATE OF CALIFORNIA - HEALTH AND HUMAN SERVICES AGENCY CALIFORNIA DEPARTMENT OF SOCIAL SERVICESDATA SYSTEMS AND SURVEY DESIGN BUREAU
Received Accepted Sufficient Not Sufficient
Statewide 696,441 51,818 50,936 50,656 16,511 34,145 96,435Alameda 26,016 1,051 1,050 1,043 514 529 826Alpine 32 2 2 1 1 0 1Amador 483 29 29 28 13 15 91Butte 6,663 340 336 322 184 138 606Calaveras 786 488 488 488 88 400 0Colusa 468 23 23 21 5 16 65Contra Costa 11,110 300 282 274 144 130 225Del Norte 1,572 29 29 16 7 9 113El Dorado 1,804 114 114 232 95 137 421Fresno 38,537 444 444 485 313 172 881Glenn 844 396 396 353 68 285 328Humboldt 4,791 151 149 181 70 111 84Imperial 5,786 123 123 176 111 65 679Inyo 442 6 6 0 0 0 45Kern 26,577 1,371 1,359 1,422 895 527 701Kings 4,964 616 616 697 188 509 409Lake 2,306 173 173 159 75 84 126Lassen 832 38 38 23 3 20 23Los Angeles 282,195 13,960 13,532 13,098 2,847 10,251 67,826Madera 5,355 856 856 948 79 869 316Marin 2,243 114 114 160 53 107 1,022Mariposa 345 7 7 26 3 23 51Mendocino 3,404 117 116 69 39 30 525Merced 3,198 537 525 362 266 96 834Modoc 305 165 165 217 57 160 65Mono 126 0 0 0 0 0 2Monterey 7,206 582 582 266 56 210 278Napa 1,066 67 67 77 33 44 204Nevada 991 43 36 26 21 5 87Orange 30,210 2,723 2,710 2,718 1,541 1,177 794Placer 672 44 44 49 23 26 177Plumas 278 35 35 33 22 11 18Riverside 8,308 8,857 8,840 9,087 1,776 7,311 925Sacramento 38,578 739 700 579 375 204 3,360San Benito 1,144 36 36 36 5 31 27San Bernardino 15,278 1,955 1,955 2,407 903 1,504 295San Diego 30,070 3,624 3,501 3,407 1,076 2,331 1,169San Francisco 19,355 713 713 501 498 3 4,210San Joaquin 5,113 182 182 238 150 88 325San Luis Obispo 3,213 154 154 174 109 65 306San Mateo 3,609 517 517 58 18 40 1,368Santa Barbara 7,759 350 350 348 148 200 266Santa Clara 22,720 1,284 1,209 1,196 462 734 266Santa Cruz 4,556 1,962 1,961 1,935 336 1,599 444Shasta 5,424 397 397 489 316 173 478Sierra 62 0 0 0 0 0 0Siskiyou 1,670 729 729 742 403 339 52Solano 6,307 1,573 1,568 1,466 402 1,064 1,171Sonoma 5,612 343 340 338 126 212 647Stanislaus 4,156 674 607 665 414 251 1,207Sutter 1,924 391 391 413 175 238 55Tehama 2,079 134 134 139 30 109 68Trinity 365 42 42 50 2 48 47Tulare 20,312 169 166 233 19 214 648Tuolumne 1,109 355 304 323 161 162 93Ventura 9,996 413 413 604 242 362 406Yolo 3,332 207 207 185 86 99 748Yuba 2,784 1,074 1,074 1,073 465 608 31
b/ Data is from DPA 266 March 2005 Item 7 Investigations pending at the end of the month. The investigations pending numbers include county case adjustments that occurred during the quarter. NOTE: The statewide total of Investigations pending at the beginning of the quarter from DPA 266 January 2005 Item 4 was 96,206.
Evidence to Support an Allegation of Fraud
Investigations Pending End of
Quarterb/
Investigation RequestsCounty
TABLE 7
a/ Data is the monthly average of the Federal and State Public Assistance and Nonassistance Food Stamp participating households from the DFA 256 report. NOTE: County numbers may not add to Statewide total due to rounding.
Participating Householdsa/
Investigations Completed
Food Stamp ProgramFRAUD INVESTIGATIONS BY SPECIAL INVESTIGATIVE UNITS
January – March 2005
Page 11 of 16

STATE OF CALIFORNIA - HEALTH AND HUMAN SERVICES AGENCY CALIFORNIA DEPARTMENT OF SOCIAL SERVICESDATA SYSTEMS AND SURVEY DESIGN BUREAU
CountyEarly Fraud Prevention/Detection
Income and Eligibility
Verification System
Family (Household) Composition
Other Unreported
IncomeResidence
Unreported Resources/
AssetsOthera/
Statewide 30,547 8,847 3,338 1,811 1,180 410 4,803Alameda 516 37 35 13 1 8 440Alpine 0 0 0 1 0 0 1Amador 0 0 10 3 3 0 13Butte 8 7 97 48 25 8 143Calaveras 400 33 12 6 11 8 18Colusa 0 0 3 4 3 0 13Contra Costa 91 65 28 44 0 1 53Del Norte 1 0 8 3 4 0 13El Dorado 6 9 29 35 13 2 20Fresno 113 103 122 62 23 3 18Glenn 172 28 44 72 40 12 28Humboldt 13 1 36 27 5 1 66Imperial 79 0 24 5 14 0 1Inyo 3 1 1 1 0 0 0Kern 673 38 263 130 74 16 165Kings 486 5 61 25 19 0 20Lake 12 11 69 9 21 3 48Lassen 21 0 12 0 3 2 0Los Angeles 5,540 6,341 187 316 0 17 1,131Madera 767 13 36 18 3 2 17Marin 12 18 4 5 4 0 71Mariposa 1 0 3 0 2 0 1Mendocino 2 80 16 5 6 3 4Merced 88 79 103 37 24 2 192Modoc 147 1 6 2 5 0 4Mono 0 0 0 0 0 0 0Monterey 200 25 19 67 65 8 198Napa 3 1 15 9 8 2 29Nevada 17 0 11 2 4 1 1Orange 2,482 60 54 52 17 5 40Placer 1 0 9 5 5 2 22Plumas 22 0 11 1 0 1 0Riverside 8,250 204 165 40 24 18 139Sacramento 224 282 52 36 19 1 86San Benito 1 2 6 1 1 11 14San Bernardino 56 17 604 101 265 14 898San Diego 3,059 218 72 106 37 1 8San Francisco 128 571 0 0 1 0 13San Joaquin 143 16 10 2 2 4 5San Luis Obispo 37 12 39 13 17 10 26San Mateo 200 9 97 96 69 10 36Santa Barbara 160 32 62 29 18 3 46Santa Clara 1,094 60 34 7 5 4 5Santa Cruz 1,641 67 117 84 18 6 28Shasta 230 0 87 28 10 1 41Sierra 0 0 0 0 0 0 0Siskiyou 329 0 60 37 80 192 31Solano 1,242 200 65 25 16 2 18Sonoma 45 73 33 10 5 1 173Stanislaus 130 88 241 36 58 5 49Sutter 309 0 28 24 15 2 13Tehama 22 0 55 25 7 0 25Trinity 15 2 5 0 2 1 17Tulare 0 13 98 24 9 3 19Tuolumne 271 0 11 3 6 0 13Ventura 78 3 0 42 45 11 234Yolo 111 17 22 14 10 1 32Yuba 896 5 47 21 39 2 64a/ "Other" includes replaced lost Food Stamps, duplicate (multiple) aid, forgery, fictitious identity, Food Stamp trafficking, internal affairs, child care, drug felon, fleeing felon, probation/parole violators, and other miscellaneous elements of fraud.
TABLE 8
January – March 2005
Food Stamp ProgramREQUESTS ACCEPTED FOR INVESTIGATION BY PRIMARY ELEMENT OF FRAUD
Page 12 of 16

STATE OF CALIFORNIA - HEALTH AND HUMAN SERVICES AGENCY CALIFORNIA DEPARTMENT OF SOCIAL SERVICESDATA SYSTEMS AND SURVEY DESIGN BUREAU
ProsecutionAdministrative Disqualification
Hearing
Statewide 9,094 877 216 2,406 2,255 2,611 121Alameda 460 23 0 20 7 4 28Alpine 1 0 0 0 0 0 0Amador 0 6 0 1 11 0 0Butte 109 30 0 5 46 2 0Calaveras 68 0 0 1 13 6 0Colusa 0 0 0 0 3 2 2Contra Costa 34 6 1 83 0 20 0Del Norte 1 0 0 5 1 0 0El Dorado 4 3 0 13 22 54 0Fresno 43 51 165 1 53 0 27Glenn 17 1 0 16 18 16 0Humboldt 29 1 0 17 33 2 0Imperial 40 0 0 1 26 4 0Inyo 0 0 0 0 0 0 0Kern 411 83 0 50 203 94 3Kings 108 21 0 8 29 22 0Lake 21 5 0 22 39 7 0Lassen 1 1 0 0 1 0 0Los Angeles 1,547 153 0 774 79 915 0Madera 13 6 0 27 28 5 0Marin 2 0 0 17 24 10 0Mariposa 1 0 0 0 1 1 13Mendocino 2 0 0 29 6 4 1Merced 19 33 0 32 128 77 0Modoc 47 3 0 0 4 3 0Mono 0 0 0 0 0 0 0Monterey 89 1 0 0 33 3 0Napa 7 0 0 13 4 9 0Nevada 14 0 0 0 6 1 0Orange 972 37 9 91 417 93 0Placer 2 0 0 8 14 0 0Plumas 15 0 0 2 4 1 0Riverside 1,507 62 0 191 10 6 0Sacramento 209 6 0 130 30 0 0San Benito 3 0 0 1 1 0 0San Bernardino 293 43 0 30 382 195 0San Diego 711 63 40 283 13 82 0San Francisco 0 1 0 2 1 0 0San Joaquin 79 42 0 2 5 23 0San Luis Obispo 21 9 0 19 52 8 1San Mateo 98 6 1 29 38 34 0Santa Barbara 58 18 0 56 41 15 0Santa Clara 264 22 0 7 0 169 1Santa Cruz 325 5 0 8 1 0 1Shasta 85 25 0 41 53 112 11Sierra 0 0 0 0 0 0 0Siskiyou 70 0 0 31 59 291 0Solano 286 15 0 49 16 36 7Sonoma 29 2 0 98 52 61 18Stanislaus 77 20 0 133 179 130 3Sutter 104 16 0 12 18 30 1Tehama 3 7 0 1 12 9 0Trinity 6 0 0 0 6 2 3Tulare 0 11 0 4 3 1 1Tuolumne 123 3 0 0 7 28 0Ventura 236 6 0 0 0 0 0Yolo 30 24 0 21 0 11 0Yuba 400 7 0 22 23 13 0
Referred forEarly Fraud
(Denials/Benefits Reduced/
Discontinuances)
County Restitution Action
a/ This table reflects the outcome of an investigation. In some instances an investigation may have more than one outcome reported. Therefore, the data displayed on this table may not correspond to the numbers on Table 7.
TABLE 9
January – March 2005
Food Stamp Program
Benefits Reduced or
Discontinued (Non-Early Fraud)
Fraud Found, No Adverse
Financial Impact
Expiration of Statutes
INVESTIGATION RESULTSa/
Page 13 of 16

STATE OF CALIFORNIA - HEALTH AND HUMAN SERVICES AGENCY CALIFORNIA DEPARTMENT OF SOCIAL SERVICESDATA SYSTEMS AND SURVEY DESIGN BUREAU
County Referrals Received Referrals Availablea/ Prosecutions Filed Decision Made Not to Prosecute
Statewide 828 3,316 734 104Alameda 23 314 12 2Alpine 0 0 0 0Amador 0 5 0 0Butte 23 38 0 0Calaveras 0 0 0 0Colusa 0 0 0 0Contra Costa 1 17 2 15Del Norte 0 0 0 0El Dorado 3 3 2 0Fresno 51 119 53 0Glenn 1 1 0 1Humboldt 1 5 2 2Imperial 0 44 0 0Inyo 0 1 1 0Kern 82 108 55 1Kings 21 30 16 1Lake 4 22 6 3Lassen 0 0 0 0Los Angeles 153 842 87 9Madera 15 15 15 0Marin 0 3 0 0Mariposa 0 0 0 0Mendocino 0 4 0 0Merced 33 267 125 14Modoc 4 4 1 0Mono 0 2 0 0Monterey 0 45 2 1Napa 0 24 0 0Nevada 0 0 0 0Orange 36 78 42 0Placer 0 55 2 0Plumas 1 2 0 0Riverside 46 60 48 1Sacramento 6 299 6 2San Benito 0 1 0 0San Bernardino 43 44 43 0San Diego 63 107 41 7San Francisco 1 143 1 0San Joaquin 42 193 33 7San Luis Obispo 0 0 0 0San Mateo 5 10 8 0Santa Barbara 18 18 7 8Santa Clara 22 39 17 1Santa Cruz 3 5 3 0Shasta 25 32 13 18Sierra 0 0 0 0Siskiyou 0 4 0 0Solano 15 168 1 2Sonoma 2 11 5 4Stanislaus 20 20 20 0Sutter 19 19 16 3Tehama 0 0 0 0Trinity 0 0 0 0Tulare 11 11 11 0Tuolumne 3 4 1 2Ventura 6 33 7 0Yolo 24 24 24 0Yuba 2 23 6 0
DISTRICT ATTORNEY PROSECUTION ACTIVITY
TABLE 10
January – March 2005
a/ Data is from DPA 266 January 2005 Item 23 Referrals pending beginning of month plus January, February and March 2005's Item 24 Referrals received during the month.
Food Stamp Program
Page 14 of 16

STATE OF CALIFORNIA - HEALTH AND HUMAN SERVICES AGENCY CALIFORNIA DEPARTMENT OF SOCIAL SERVICESDATA SYSTEMS AND SURVEY DESIGN BUREAU
County Convictions Administrative Action
Disqualification Consent
Agreements
Charge Pleaded Dismissals Acquittals Declinations Expiration
of Statutes
Statewide 648 7 44 87 73 4 40 2Alameda 17 1 1 0 11 0 2 0Alpine 0 0 0 0 0 0 0 0Amador 0 0 0 0 0 0 0 0Butte 3 0 3 0 0 0 0 0Calaveras 0 0 0 0 0 0 0 0Colusa 0 0 0 0 0 0 0 0Contra Costa 0 0 0 0 1 0 2 0Del Norte 0 0 0 0 0 0 0 0El Dorado 0 0 0 0 0 0 0 0Fresno 53 1 0 0 3 0 0 0Glenn 1 0 2 0 0 0 1 0Humboldt 4 0 4 0 1 0 0 0Imperial 0 0 0 0 0 0 0 0Inyo 0 0 0 0 0 0 0 0Kern 49 0 0 0 6 0 0 0Kings 12 0 0 0 2 0 1 0Lake 0 0 0 5 0 0 0 0Lassen 0 0 0 2 0 0 0 0Los Angeles 77 0 0 0 10 0 0 0Madera 8 0 15 0 0 0 0 0Marin 0 0 0 0 0 0 0 0Mariposa 1 0 0 0 0 0 0 0Mendocino 0 0 0 0 0 0 0 0Merced 31 0 0 0 4 0 17 1Modoc 0 0 0 0 1 0 0 0Mono 0 0 0 0 0 0 0 0Monterey 0 0 0 0 0 0 0 0Napa 0 0 0 0 0 0 0 0Nevada 1 0 0 0 0 0 0 0Orange 26 3 0 0 2 2 0 0Placer 0 0 0 0 0 0 0 0Plumas 0 0 0 0 0 0 0 0Riverside 38 0 0 43 2 0 0 0Sacramento 25 0 0 0 0 0 1 0San Benito 0 0 0 0 0 0 0 0San Bernardino 57 0 0 0 10 0 0 0San Diego 53 0 0 0 7 0 0 0San Francisco 0 0 0 0 0 0 0 0San Joaquin 25 0 0 0 4 0 7 0San Luis Obispo 4 0 0 0 0 0 0 0San Mateo 1 0 0 1 0 0 0 0Santa Barbara 19 2 8 0 1 0 0 0Santa Clara 39 0 0 0 0 0 0 0Santa Cruz 0 0 0 0 0 0 0 0Shasta 21 0 0 0 5 0 1 0Sierra 0 0 0 0 0 0 0 0Siskiyou 0 0 0 0 0 0 0 0Solano 9 0 0 0 0 0 4 0Sonoma 3 0 0 0 1 0 4 0Stanislaus 12 0 0 0 1 0 0 1Sutter 0 0 3 4 0 0 0 0Tehama 0 0 0 0 0 0 0 0Trinity 0 0 0 0 0 0 0 0Tulare 27 0 0 26 0 0 0 0Tuolumne 3 0 2 0 0 0 0 0Ventura 8 0 0 0 0 2 0 0Yolo 21 0 0 0 1 0 0 0Yuba 0 0 6 6 0 0 0 0a/ This table reflects the outcome of a prosecution. In some instances a prosecution may have more than one outcome reported.
Food Stamp ProgramPROSECUTION OUTCOMESa/
TABLE 11
January – March 2005
Page 15 of 16

STATE OF CALIFORNIA - HEALTH AND HUMAN SERVICES AGENCY CALIFORNIA DEPARTMENT OF SOCIAL SERVICESDATA SYSTEMS AND SURVEY DESIGN BUREAU
County Fraud Overissuances Identified Total CollectionsStatewide $3,607,249 $1,752,342Alameda 77,533 118,264Alpine 0 0Amador 688 548Butte 41,414 4,233Calaveras 0 269Colusa 0 715Contra Costa 46,614 8,384Del Norte 16,799 2,540El Dorado 12,182 11,799Fresno 69,476 44,650Glenn 14,390 4,554Humboldt 5,812 10,718Imperial 0 0Inyo 0 502Kern 228,692 101,337Kings 17,060 33,557Lake 4,432 8,107Lassen 678 1,055Los Angeles 963,466 181,610Madera 42,284 16,601Marin 7,133 8,720Mariposa 0 867Mendocino 29,397 20,079Merced a/ 44,624 7,114Modoc 6,459 0Mono 0 0Monterey 4,492 37,540Napa 8,219 6,283Nevada 0 634Orange 68,978 51,034Placer b/ 4,477 4,807Plumas 535 1,848Riverside a/ 215,984 124,441Sacramento b/ 255,537 139,682San Benito 2,970 11,982San Bernardino a/ 129,274 105,598San Diego 237,811 53,002San Francisco 130,702 76,815San Joaquin 85,845 17,800San Luis Obispo 16,621 2,593San Mateo 20,170 2,507Santa Barbara 33,859 52,374Santa Clara 110,591 173,184Santa Cruz 22,338 2,629Shasta 46,521 10,567Sierra 183 233Siskiyou 128,000 136,000Solano 47,456 48,472Sonoma 44,669 46,333Stanislaus c/ 198,404 0Sutter 19,132 4,214Tehama 0 1,549Trinity 0 390Tulare 69,770 9,066Tuolumne 1,078 6,522Ventura 37,323 4,568Yolo 27,411 26,934Yuba 9,766 6,517
c/ Stanislaus' collections data is not available for this period due to C-IV programming problems.
a/ Merced, Riverside and San Bernardino's collections data was generated by C-IV system and may be incomplete/incorrect for this period.
FRAUD OVERISSUANCES AND COLLECTIONSFood Stamp Program
TABLE 12
January – March 2005
b/ Placer and Sacramento's collections data was generated by CalWIN system and may be incomplete/incorrect for this period.
Page 16 of 16

STATE OF CALIFORNIA Arnold Schwarzenegger, Governor
HEALTH AND HUMAN SERVICES AGENCY
Kimberly Belshé, Secretary
CALIFORNIA DEPARTMENT OF SOCIAL SERVICES Dennis J. Boyle, Director