Embed Size (px)
Citation preview

Fraud and Error in the Benefit System 2016/17 Preliminary Estimates
Biannual Published: 18 May 2017 Great Britain
The Department for Work and Pensions administers welfare benefits to around 22 million people. ‘Fraud and Error in the Benefit System’ estimates overpayments (the total amount of money lost to the department because claimants are paid too much) and underpayments (the total amount of money lost to claimants who are not paid enough). Further information on how these statistics are compiled can be found in the Background and Methodology document.
Main stories
2.0% of expenditure overpaid
This has increased from 1.9% in 2015/16. It amounts to £3.5bn of overpayments.
We changed the way we categorise overpayments after 2014/15
We have tightened up the evidence gathering process within the measurement system. This is driving recent trends: fraud is now at its highest recorded rate; claimant error is at its lowest recorded rate.
0.9% of expenditure underpaid
This has decreased from 1.0% in 2015/16. It amounts to £1.6bn of underpayments.
2.0%
0.9%
0.0%
0.5%
1.0%
1.5%
2.0%
2.5%
2005/06 2016/17P
Overpayments
Underpayments
1.2%
0.5%
0.4%
0.0%
0.4%
0.8%
1.2%
1.6%
2009/10 2016/17P
FraudClaimant ErrorOfficial Error

2
What you need to know
At a glance Page
Total overpayments have risen compared with 2015/16
3
Housing Benefit overpayments are the highest recorded
4
Employment and Support Allowance overpayments are the highest recorded
5
Pension Credit overpayments have decreased
6
The rate of Jobseeker’s Allowance overpayments has increased
7
Univeral Credit overpayments have increased
8
Statistical significance
These estimates are based on a sample of benefit claims in payment. Statistical significance is an expression that says whether an estimated value is likely to have arisen only from variations in the sampling. It is most often used when talking about a change or a difference: a significant change or difference is one that is not likely to be due only to the sampling, and therefore likely to be a real change/difference. Plotting estimates and their confidence intervals (a measure of the uncertainty of an estimate) gives an indication of whether or not a difference is significant. In general, if the confidence intervals of two estimates do not overlap, the estimates are significantly different:
SIGNIFICANT NOT SIGNIFICANT
Confidence Interval
Central Estimate
A B A B
Lead Statistician: Eve Smith
DWP Press Office: 0203 267 5129
Comments? Feedback is welcome
Report Benefit Fraud
Telephone: 0800 854 440
Next edition available: Nov/Dec 2017
ISBN: 978-1-78425-935-8 © Crown copyright
In this document
This report provides estimates of fraud and error in benefits funded by the Department for Work and Pensions (DWP). It includes the preliminary 2016/17 financial year estimates, covering cases reviewed during the period October 2015 to September 2016. These statistics have been developed in accordance with the Code of Practice for Official Statistics and supporting Principles. Monetary values for individual benefits and tables may differ from the overall overpayments and underpayments as the latter are based on more up-to-date expenditure.
It contains estimates of overpayments (when a claimant is paid more in benefit than they are entitled to) and underpayments (when a claimant is not paid enough). We measure fraud and error all the time for some benefits, randomly sampling people and checking that the information we hold is up-to-date. For benefits we don’t measure all the time we use either old estimates or a proxy (based on a similar benefit or an average rate). This allows us to estimate the total rate of overpayments or underpayments for all benefits funded by DWP. More information about which benefits we measure and how we measure them can be found in the Background and Methodology document. Throughout the document we have rounded monetary values of totals and error categories (fraud, claimant error and official error) to the nearest £10m; monetary values of error causes are rounded to the nearest £1m.
3
Total overpayments have risen compared with 2015/16
Fraud and Error in the Benefit System: 2016/17P, Tables 2 and 8
1.2%
0.0%
0.5%
1.0%
1.5%
2005/06 2016/17P
Fraud
0.0%
2005/06 2016/17P
0.5%
0.0%
0.5%
1.0%
1.5%
2005/06 2016/17P
Claimant Error
0.6%
2005/06 2016/17P
0.4%
0.0%
0.5%
1.0%
1.5%
2005/06 2016/17P
Official Error
0.3%
2005/06 2016/17P
Overpayments Underpayments Main Messages
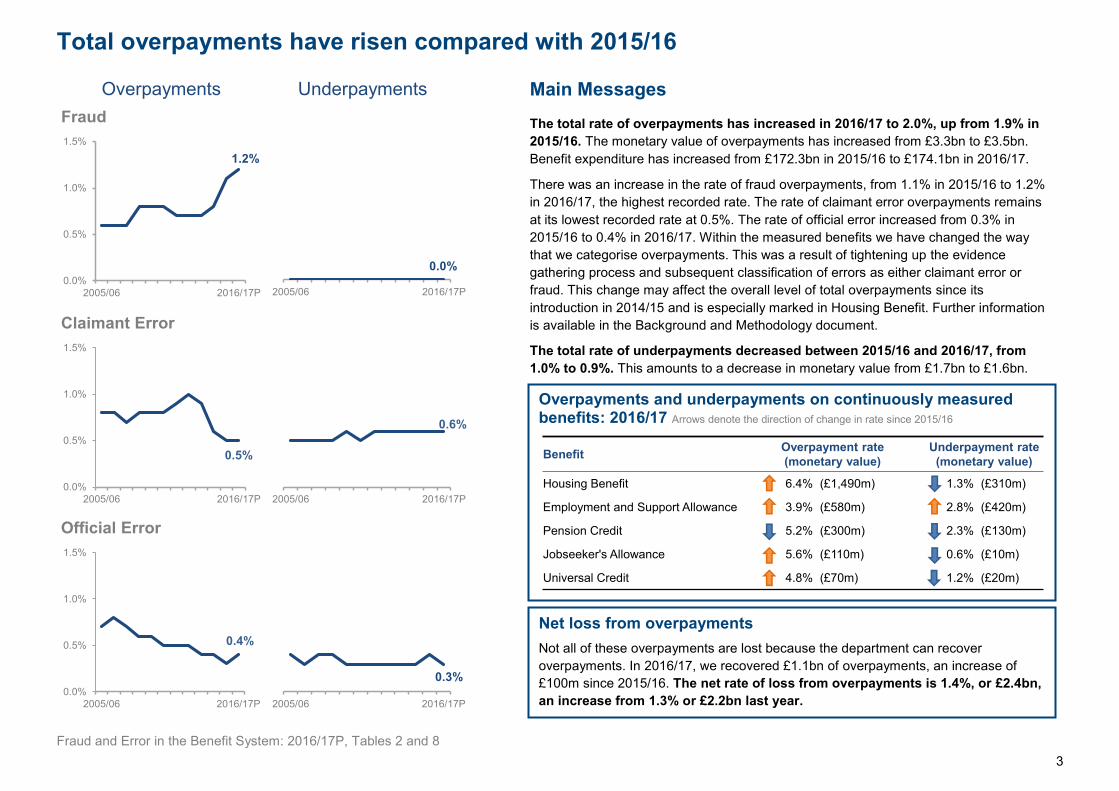
The total rate of overpayments has increased in 2016/17 to 2.0%, up from 1.9% in 2015/16. The monetary value of overpayments has increased from £3.3bn to £3.5bn. Benefit expenditure has increased from £172.3bn in 2015/16 to £174.1bn in 2016/17.
There was an increase in the rate of fraud overpayments, from 1.1% in 2015/16 to 1.2% in 2016/17, the highest recorded rate. The rate of claimant error overpayments remains at its lowest recorded rate at 0.5%. The rate of official error increased from 0.3% in 2015/16 to 0.4% in 2016/17. Within the measured benefits we have changed the way that we categorise overpayments. This was a result of tightening up the evidence gathering process and subsequent classification of errors as either claimant error or fraud. This change may affect the overall level of total overpayments since its introduction in 2014/15 and is especially marked in Housing Benefit. Further information is available in the Background and Methodology document.
The total rate of underpayments decreased between 2015/16 and 2016/17, from 1.0% to 0.9%. This amounts to a decrease in monetary value from £1.7bn to £1.6bn. The rate of claimant error underpayments has remained at 0.6%. The rate of official error underpayments decreased from 0.4% to 0.3%.Overpayments and underpayments on continuously measured
benefits: 2016/17 Arrows denote the direction of change in rate since 2015/16
Benefit Overpayment rate (monetary value)
Underpayment rate (monetary value)
Housing Benefit 6.4% (£1,490m) 1.3% (£310m)
Employment and Support Allowance 3.9% (£580m) 2.8% (£420m)
Pension Credit 5.2% (£300m) 2.3% (£130m)
Jobseeker's Allowance 5.6% (£110m) 0.6% (£10m)
Universal Credit 4.8% (£70m) 1.2% (£20m)
Net loss from overpayments Not all of these overpayments are lost because the department can recover overpayments. In 2016/17, we recovered £1.1bn of overpayments, an increase of £100m since 2015/16. The net rate of loss from overpayments is 1.4%, or £2.4bn, an increase from 1.3% or £2.2bn last year.
4
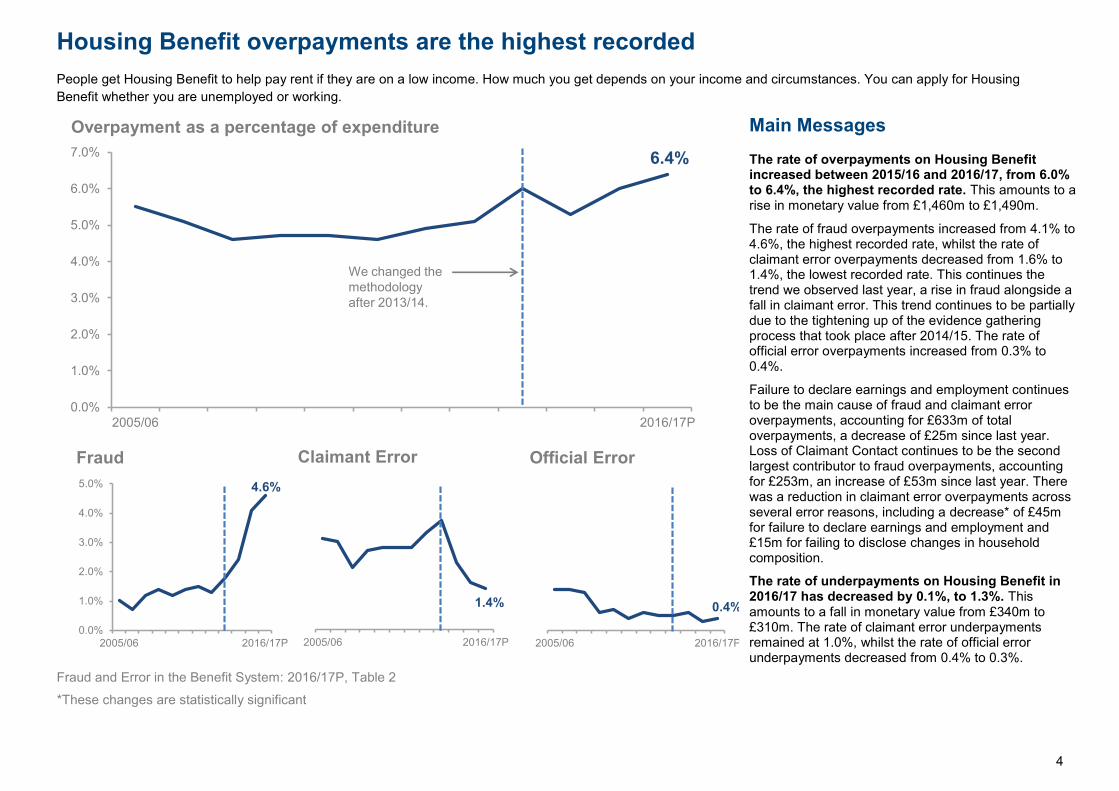
Housing Benefit overpayments are the highest recorded People get Housing Benefit to help pay rent if they are on a low income. How much you get depends on your income and circumstances. You can apply for Housing Benefit whether you are unemployed or working.
Fraud and Error in the Benefit System: 2016/17P, Table 2
6.4%
0.0%
1.0%
2.0%
3.0%
4.0%
5.0%
6.0%
7.0%
2005/06 2016/17P
Overpayment as a percentage of expenditure
4.6%
0.0%
1.0%
2.0%
3.0%
4.0%
5.0%
2005/06 2016/17P
Fraud
1.4%
2005/06 2016/17P
Claimant Error
0.4%
2005/06 2016/17P
Official Error
We changed the methodology after 2013/14.
Main Messages The rate of overpayments on Housing Benefit increased between 2015/16 and 2016/17, from 6.0% to 6.4%, the highest recorded rate. This amounts to a rise in monetary value from £1,460m to £1,490m.
The rate of fraud overpayments increased from 4.1% to 4.6%, the highest recorded rate, whilst the rate of claimant error overpayments decreased from 1.6% to 1.4%, the lowest recorded rate. This continues the trend we observed last year, a rise in fraud alongside a fall in claimant error. This trend continues to be partially due to the tightening up of the evidence gathering process that took place after 2014/15. The rate of official error overpayments increased from 0.3% to 0.4%.
Failure to declare earnings and employment continues to be the main cause of fraud and claimant error overpayments, accounting for £633m of total overpayments, a decrease of £25m since last year. Loss of Claimant Contact continues to be the second largest contributor to fraud overpayments, accounting for £253m, an increase of £53m since last year. There was a reduction in claimant error overpayments across several error reasons, including a decrease* of £45m for failure to declare earnings and employment and £15m for failing to disclose changes in household composition.
The rate of underpayments on Housing Benefit in 2016/17 has decreased by 0.1%, to 1.3%. This amounts to a fall in monetary value from £340m to £310m. The rate of claimant error underpayments remained at 1.0%, whilst the rate of official error underpayments decreased from 0.4% to 0.3%.
*These changes are statistically significant

5
Employment and Support Allowance overpayments are the highest recorded If you’re ill or disabled, Employment and Support Allowance offers you financial support if you’re unable to work, or personalised help so that you can work if you’re able to.
Fraud and Error in the Benefit System: 2016/17P, Table 2
3.9%
0.0%
0.5%
1.0%
1.5%
2.0%
2.5%
3.0%
3.5%
4.0%
2013/14 2016/17P
Overpayment as a percentage of expenditure
2.2%
0.0%
0.5%
1.0%
1.5%
2.0%
2.5%
2013/14 2016/17P
Fraud
0.6%
2013/14 2016/17P
Claimant Error
1.2%
2013/14 2016/17P
Official Error
Main MessagesThe rate of overpayments on Employment and Support Allowance increased between 2015/16 and 2016/17, from 3.1% to 3.9%.
Expenditure on Employment and Support Allowance increased from £14.5bn to £14.9bn. The monetary value of overpayments also increased, from £450m to £580m.
The rate of fraud and claimant error overpayments both increased, to 2.2% and 0.6% respectively. The rate of official error overpayments increased *significantly from 0.7% to 1.2%. The change in fraud was partially driven by an increase in Earnings and Employment and also Loss of Claimant Contact, both increasing by £25m. Loss of Claimant Contact is the main cause of fraud overpayments, accounting for £90m. Incorrectly reporting the amount of capital remains the main cause of claimant error overpayments, accounting for £26m. The rise in official error can be attributed to a significant increase* of 0.1% in Income – Occupational and Personal Pensions, and an increase in the Other category, which includes an increase in Appeals.
The rate of underpayments on Employment and Support Allowance increased between 2015/16 and 2016/17, from 2.4% to 2.8%. This amounts to an increase in monetary value from £350m to £420m. The rate of claimant error underpayments increased to 1.6% and official error underpayments increased to 1.2%. The largest increase* in claimant error underpayments was associated with income from other benefits; it increased from £93m to £154m or 0.6% to 1.0%.
*These changes are statistically significant

6
Pension Credit overpayments have decreased Pension Credit provides support to people older than the female state pension age. The Guarantee Credit element guarantees an income at a set level and people aged 65 or over (and couples where one member is 65 or over) may also be entitled to Savings Credit if they have modest income from savings, investments or a second pension.
Fraud and Error in the Benefit System: 2016/17P, Table 2
5.2%
0.0%
1.0%
2.0%
3.0%
4.0%
5.0%
6.0%
7.0%
2005/06 2016/17P
Overpayment as a percentage of expenditure
2.3%
0.0%
1.0%
2.0%
3.0%
2005/06 2016/17P
Fraud
1.6%
2005/06 2016/17P
Claimant Error
1.3%
2005/06 2016/17P
Official Error
Main Messages The rate of overpayments on Pension Credit decreased between 2015/16 and 2016/17, from 5.3% to 5.2%. Expenditure on Pension Credit decreased from £6.2bn to £5.8bn and the monetary value of overpayments decreased from £330m to £300m.
The rate of fraud overpayments decreased, from 2.6% to 2.3%. Abroad fraud continues to be the main cause of fraud overpayments, which accounts for £50m, a decrease of £20m since last year. Abroad fraud occurs when claimants that are normally resident in the UK fail to notify the department before leaving the country, and are abroad for a period longer than the allowable absence limit.
The rate of claimant error overpayments increased to 1.6%, whilst official error overpayments remained at 1.3%, the lowest recorded rate. The increase in claimant error was mainly due to an increase in overpayments associated with Income - Other, from £5m to £15m.
The rate of underpayments on Pension Credit decreased from 2.5% in 2015/16 to 2.3% in 2016/17. This amounts to a decrease in monetary value from £150m to £130m. Claimant error remained at 0.8% while official error decreased from 1.7% in 2015/16 to 1.5% in 2016/17. Underpayments associated with Premiums continue to be the main cause of official error at £63m, a decrease from £67m in 2015/16.

7
The rate of Jobseeker’s Allowance overpayments has increased Jobseeker’s Allowance is paid to people under state pension age who are available for and actively seeking work. The composition of the JSA sample has changed within this publication so that we no longer have a separate sample for newer cases. We have changed the grossing for JSA which now grosses on a National level rather than Local. Further information can be found within the Background and Methodology document.
Fraud and Error in the Benefit System: 2016/17P, Table 2
*These changes are statistically significant
Main messages The rate of overpayments on Jobseeker’s Allowance increased between 2015/16 and 2016/17, from 4.3% to 5.6%. Expenditure has decreased from £2.3bn to £1.9bn, reflected in a small increase in the monetary value of overpayments, from £100m to £110m.
The rate of fraud has increased from 2.9% in 2015/16 to 4.7% in 2016/17, the highest recorded rate. Claimant error has also increased from 0.1% to 0.2% in 2016/17, whilst official error has *significantly decreased from 1.3% in 2015/16 to 0.6% in 2016/17, the lowest recorded rate.
The increase in Fraud was driven by increases in Earnings and Employment (+£25m), Living Together (+£5m) and Capital (+£3m).
The decrease in official error was mainly due to a decrease in Labour Market Issues from 0.6% to 0.1% and Conditions of Entitlement which decreased* from 0.4% to 0.1%.
The overall rate of underpayments on Jobseeker’s Allowance decreased from 0.7% in 2015/16 to 0.6% in 2016/17. The rate of claimant error increased* significantly from 0.0% to 0.2% whilst official error underpayments decreased from 0.6% to 0.4%. The main decrease in official error was Earnings and Employment, down from £9m to £1m.

8
Universal Credit overpayments have increased mainly due to a rise in official error As Universal Credit (UC) continues to rollout (see Appendix 4 for further details on UC and rollout), the number of claims and complexity of these claims is increasing. The number of benefit units on UC has increased from an average level of 130,000 in 2015/16 to an average of 379,000 in 2016/17. Similarly expenditure has increased from £490m to £1,600m respectively. For this reason, the monetary levels of fraud and error have not been directly compared year on year within the text.
Fraud and Error in the Benefit System: 2016/17P, Table 2
*These changes are statistically significant
Main messages Overpayments on Universal Credit for 2016/17 are estimated to be 4.8% of expenditure or £70m. This rate is lower than Jobseeker’s Allowance (JSA) at 5.6% and is an increase from the UC rate in 2015/16 of 4.0%.
The rate of fraud overpayments on UC is 2.5% (£40m), a decrease from 2.7% in 2015/16. This is significantly* lower than fraud overpayments in JSA which are estimated to be 4.7%.
The largest cause of fraud on UC is Earnings and Employment (1.0%) that arises when claimants have failed to report or verify self employed or self reported earnings. This is also the largest cause of fraud within JSA (2.6%).
The above has been offset by a decrease in fraud due to Living Together which has decreased* from 1.4% to 0.2% between 2015/16 and 2016/17.
UC official error is 2.0% (£30m), an increase of 0.8% from 2015/16. This is significantly* higher than JSA official error which is 0.6%.
The largest rises in official error for UC are Housing Costs at 0.7%, (up from 0.3%); and Household Composition at 0.6%, (which has increased from 0.2%). These increases are the result of notified changes not being actioned or actioned late, resulting in an incorrect housing cost element being paid.
It is estimated that 43% of the UC caseload have a housing cost element, making these cases more complex to administer. This may partially help to explain why official error is higher within UC than JSA, since housing cost errors for JSA would be captured within the estimates for Housing Benefit.
Claimant error is estimated at 0.2%, which is a slight increase from the 0.1% level estimated in 2015/16.

9
Universal Credit underpayments have decreased due to a reduction in official error
.
Fraud and Error in the Benefit System: 2016/17P, Table 8
*These changes are statistically significant
Main messages
The total rate of underpayments on Universal Credit in 2016/17 is estimated to be 1.2% (£20m). This is lower than the 2015/16 estimate of 1.5%. Jobseeker’s Allowance (JSA) underpayments are significantly* lower at 0.6% in 2016/17.
Two thirds of underpayments on UC are official error underpayments with a monetary value of £10m. The rate of official error underpayments is 0.8%, a decrease from 1.2% in 2015/16.
The rate of claimant error underpayments on UC is 0.4% (£10m). This rate has increased from 0.2% in 2015/16.
Both official error and claimant error for JSA are lower at 0.4% and 0.2% respectively in 2016/17.
The main cause of underpayments on UC is Housing Costs; these consist of 0.4% official error and 0.1% of claimant error. Housing Cost errors leading to underpayments have fallen from 0.9% in 2015/16.

10
Appendix 1: Overpayment rates and monetary values by benefit
Expenditure Total Fraud Claimant Error Official Error
Last measuredRate Value Rate Value Rate Value Rate Value
Continuously reviewedHousing Benefit £23.5bn 6.4% £1490m 4.6% £1090m 1.4% £320m 0.4% £80m Oct 15 - Sep 16 Pension Credit £5.8bn 5.2% £300m 2.3% £130m 1.6% £90m 1.3% £70m Oct 15 - Sep 16 Employment and Support Allowance £15.0bn 3.9% £590m 2.2% £320m 0.6% £90m 1.2% £180m Oct 15 - Sep 16 Jobseeker's Allowance £1.9bn 5.6% £110m 4.7% £90m 0.2% £0m 0.6% £10m Oct 15 - Sep 16 Universal Credit1 £1.6bn 4.8% £70m 2.5% £40m 0.2% £0m 2.0% £30m Oct 15 - Sep 16
Occasionally reviewedIncome Support £2.4bn 3.9% £90m 2.4% £60m 1.0% £30m 0.4% £10m Apr 14 - Mar 15 Incapacity Benefit
2£0.0bn 2.4% £0m 0.3% £0m 0.9% £0m 1.2% £0m Oct 09 - Sep 10
Disability Living Allowance3
£11.5bn 1.9% £220m 0.5% £60m 0.6% £70m 0.8% £90m Apr 04 - Mar 05 State Pension
4£91.6bn 0.1% £90m 0.0% £0m 0.1% £80m 0.0% £10m Apr 05 - Mar 06
Carer's Allowance £2.7bn 5.5% £150m 3.9% £100m 1.0% £30m 0.6% £20m Apr 96 - Mar 97 Interdependencies £30m £10m £10m £10m Oct 15 - Sep 16
Unreviewed £18.0bn 1.8% £320m 0.7% £130m 0.5% £90m 0.6% £100mTotal
5£174.1bn 2.0% £3.5bn 1.2% £2.0bn 0.5% £0.8bn 0.4% £0.6bn
Range6
(1.7,2.4) (3.0,4.1) (0.9,1.5) (1.6,2.6) (0.4,0.7) (0.6,1.2) (0.3,0.5) (0.5,0.9)
Notes: 1. The sample for Universal Credit is split into Reviewed and Cannot Review cases. The latter cases are included in the final statistics but calculated using
assumptions as opposed to measured data.2. Monetary values associated with Incapacity Benefit are displaying zeros due to rounding.3. The 2004/05 Disability Living Allowance (DLA) National Benefit Review identified cases where the change in customers' needs had been so gradual that it would
be unreasonable to expect them to know at which point their entitlement to DLA might have changed. These cases do not result in a recoverable overpayment aswe cannot identify when the change occurred. Because legislation requires the Secretary of State to prove that entitlement to DLA is incorrect, rather thanrequiring the customer to inform us that their needs have changed, cases in this sub-category are legally correct. The difference between what customers inthese cases are receiving in DLA and related premiums in other benefits and what they would receive if their benefit was reassessed was estimated to be around£0.6 billion (+/-£0.2 billion) in 2005/06. Based on 2016/17 DLA expenditure this figure is now estimated to be around £0.8 billion (+/- £0.2 billion). This componentis not included in the total above.
4. Official error estimates for State Pension (SP) are derived from a continuous measurement exercise which covered the period October 2015 to September 2016.SP fraud and customer error estimates have been produced based on a National Benefit Review exercise carried out in 2005/06. The latest 2016/17 expenditurehas then been applied to these estimates to provide the most up to date monetary values for SP fraud and error.
5. Rows and columns may not sum to totals due to rounding.6. Approximate 95% confidence intervals are given. These allow for non-sample error in occasionally reviewed benefits and the additional uncertainty that comes
from the use of older measurement periods.

11
Appendix 2: Underpayment rates and monetary values by benefit
Expenditure Total Fraud Claimant Error Official Error
Last measuredRate Value Rate Value Rate Value Rate Value
Continuously reviewedHousing Benefit £23.5bn 1.3% £310m 0.0% £0m 1.0% £220m 0.3% £80m Oct 15 - Sep 16 Pension Credit £5.8bn 2.3% £130m 0.0% £0m 0.8% £50m 1.5% £90m Oct 15 - Sep 16 Employment and Support Allowance £15.0bn 2.8% £420m 0.0% £0m 1.6% £240m 1.2% £190m Oct 15 - Sep 16 Jobseeker's Allowance £1.9bn 0.6% £10m 0.0% £0m 0.2% £0m 0.4% £10m Oct 15 - Sep 16 Universal Credit1 £1.6bn 1.2% £20m 0.0% £0m 0.4% £10m 0.8% £10m Oct 15 - Sep 16
Occasionally reviewedIncome Support £2.4bn 0.8% £20m 0.1% £0m 0.4% £10m 0.3% £10m Apr 14 - Mar 15 Incapacity Benefit
2£0.0bn 0.7% £0m 0.0% £0m 0.0% £0m 0.7% £0m Oct 09 - Sep 10
Disability Living Allowance £11.5bn 2.5% £290m 0.0% £0m 2.4% £280m 0.1% £10m Apr 04 - Mar 05 State Pension
3£91.6bn 0.1% £60m 0.0% £0m 0.0% £0m 0.1% £60m Apr 05 - Mar 06
Carer's Allowance £2.7bn 0.1% £0m 0.0% £0m 0.1% £0m 0.0% £0m Apr 96 - Mar 97
Unreviewed £18.0bn 1.8% £330m 0.0% £0m 1.7% £300m 0.2% £30mTotal
4£174.1bn 0.9% £1.6bn 0.0% £0.0bn 0.6% £1.1bn 0.3% £0.5bn
Range5
(0.7,1.2) (1.2,2.1) (0.0,0.0) (0.0,0.0) (0.4,0.9) (0.7,1.6) (0.2,0.4) (0.4,0.6)
Notes: 1. The sample for Universal Credit is split into Reviewed and Cannot Review cases. The latter cases are included in the final statistics but calculated using
assumptions as opposed to measured data.2. Monetary values associated with Incapacity Benefit are displaying zeros due to rounding3. Official error estimates for State Pension (SP) are derived from a continuous measurement exercise which covered the period October 2015 to September 2016.
SP fraud and customer error estimates have been produced based on a National Benefit Review exercise carried out in 2005/06. The latest 2016/17 expenditurehas then been applied to these estimates to provide the most up to date monetary values for SP fraud and error.
4. Rows and columns may not sum to totals due to rounding.5. Approximate 95% confidence intervals are given. These allow for non-sample error in occasionally reviewed benefits and the additional uncertainty that comes
from the use of older measurement periods.
12
Assumptions The assumptions below have been amended slightly from those used in the 2015/16 final estimates, specifically for official error. The impacts of this change are negligible. Details of the impacts can be found in the Background and Methodology document .
Cannot Review Sample with Mitigating Circumstances - Overpayments
Cases with mitigating circumstances are where information is available on DWP systems to indicate why the person may not have engaged. In most cases, this is where the person has moved into paid work following the Assessment Period under review. Given that a full review was never completed, it is assumed that these cases will have a similar level of fraud and error as Reviewed cases. In the preliminary estimates these cases were assumed to be totally benefit correct.
Cannot Review Sample without Mitigating Circumstances - Overpayments
Further investigations highlighted that 20% of these cases had some evidence to suggest potential fraud but without a thorough fraud investigation this cannot be verified. The remaining 80% were inconclusive as there was no evidence to indicate any fraud or fraudulent intent. However, this doesn’t mean there is definitely no fraud; it merely means that there is little or only inconclusive information available to the department to account for the loss of contact. It has therefore been assumed that 20% of these cases are fraud. In addition, it is assumed that these cases will have a similar level of claimant error and official error as the Reviewed cases.
Cannot Review Sample - Underpayments
Given that a full review was never completed, it is assumed that these cases will have a similar level of error as Reviewed cases. In the preliminary 2015/16 estimates these cases were assumed to be benefit correct.
Since measurement of UC started in October 2014 a proportion of the sample has not had an effective review, 7% for the 2016/17 estimates. An example of this is where the claimant receives notification of the review and does not engage in the review process or they contact the service centre and request to withdraw their claim. In many cases this was due to the claimant moving into employment and ceasing to co-operate with the review process. In the preliminary results we introduced ‘mitigating circumstances’ for this group so that they would not be counted as being wholly fraudulent. However, for a remaining group (around 4% in 2016/17) there was no evidence of moving into work and the claimant refused to engage.
Further investigation resulted in the methodology being revisited and as a result the sample is now split into ‘Reviewed’ and ‘Cannot Review’ cases. The Reviewed sample results are based on the completed measurement data in the same way as for other benefits. The fraud and error associated with the Cannot Review sample cases is based on a number of assumptions detailed below.
Appendix 3: Methodology changes in Universal Credit The preliminary estimates released in May 2016 estimated total overpayments to be 7.3% of expenditure, of which fraud was 5.4%. This level of fraud was being driven by Loss of Claimant Contact (LoCC) cases, where DWP were unable to complete a review of the case and these were categorised as Causal Link fraud.

13
The proportion of Cannot Review cases in the sample has reduced from 9% in 2015/16 to 7% for 2016/17, resulting in less of the final result being calculated based on assumptions. The most significant assumption made is fraud overpayments for Cannot Review cases without mitigating circumstances which is assumed to be 20%. This assumption is based on analysis detailed on the previous page; the assumption has not been updated for this publication. An update to this assumption will be explored for the final 2016/17 publication. The table below highlights the sensitivity of the fraud overpayment assumption to lower and higher fraud rates, illustrating the impact on the 2016/17 estimates.
Fraud 8% based on Lower Limit 95% CI
Fraud 20% Central Estimate
Fraud 37% based on Upper Limit 95% CI
Rate MVFE Rate MVFE Rate MVFE Claimant Fraud 2.1% £30m 2.5% £40m 3.1% £70m
Total 4.3% £70m 4.8% £70m 5.3% £80m
Appendix 3: Methodology changes in Universal Credit (continued)
Assumption Breakdown and MVFE
% Sample Fraud Claimant Error Official Error Total MVFE
Overpayments 100% 2.5% 0.2% 2.0% 4.8% £70m Reviewed 93% 1.9% 0.2% 2.0% 4.1% £60m Cannot Review with Mitigating Circs 3% 1.9% 0.2% 2.0% 4.1% £0m
Cannot Review without Mitigating Circs 4% 20.0% 0.2% 2.0% 22.2% £10m Underpayments 100% - 0.4% 0.8% 1.2% £20m Reviewed 93% - 0.4% 0.8% 1.2% £20m Cannot Review with Mitigating Circs 3% - 0.4% 0.8% 1.2% £0m
Cannot Review without Mitigating Circs 4% - 0.4% 0.8% 1.2% £0m

14
Universal Credit is a new benefit that reduces poverty by making work pay. It encourages claimants to take personal responsibility to actively seek work, increase earnings and take ownership for their account and the information they supply, while continuing to provide support for those who need it most.
Universal Credit will eventually replace the following benefits with a single monthly UC payment:
Income-based Jobseeker’s Allowance (JSA) Income-related Employment and Support Allowance (ESA) Income Support, Working Tax Credit (IS, WTC) Child Tax Credit (CTC) Housing Benefit (HB)
The main differences between Universal Credit and the current welfare system are:
Universal Credit is available to people who are in work and on a low income, as well as to those who are out of work
Most people will apply online and manage their claim through an online account Universal Credit will be responsive – as people on low incomes move in and out of
work, they’ll get on-going support Most claimants on low incomes will still be paid Universal Credit when they first start a
new job or increase their part-time hours Claimants will receive a single monthly household payment, paid into a bank account
in the same way as a monthly salary Support with housing costs will usually go direct to the claimant as part of their monthly
payment Whether an individual can claim UC depends on where they live and their personal
circumstances, but once a person starts to claim UC, they normally remain on UC unless they receive no benefit for 6 months or choose to terminate their claim.
Appendix 4: About Universal Credit Measurement of fraud and error in Universal Credit (UC) started in October 2014. As rollout of Universal Credit continues, the number of benefits units has increased from 17,000 at the start of measurement to 373,000 in September 2016. Expenditure has increased from £490m in 2015/16 to £1,600m in 2016/17.
Universal Credit Rollout
UC was initially introduced between April and July 2013 in four Pathfinder sites in the North West. Progressive roll out of UC began in October 2013 and by spring 2014 ten offices were delivering UC.
For new claims there was a set of conditions so that only certain types of new claims were eligible for UC in those geographical areas where UC had been introduced.
In Pathfinder areas, these conditions meant that new claims had to be single, not home-owners, without any children and unemployed (i.e. would otherwise have been making a new claim to Jobseeker’s Allowance (JSA)).
From July 2014 the conditions expanded to include couples, and at the same time the rollout for single claimants was extended.
From summer 2014 UC started to roll out across the North West of England and eligibility was extended further to include families with children from November 2014.
National expansion (for single unemployed claims only) began in February 2015 and was completed in April 2016.
The full Universal Credit service will be delivered nationally for all types of claimants from May 2016, completing in September 2018.
After the transition process has completed in September 2018 migration of all remaining existing benefit claimants to the full Universal Credit service will begin from July 2019, to complete by March 2022.

15
About these statistics All the information underlying the charts and figures featured in this document is included in accompanying Excel reference tables. Sources in this document that state a Table number refer to the reference Tables spreadsheet available on the gov.uk website: https://www.gov.uk/government/statistics/fraud-and-error-in-the-benefit-system-financial-year-201617-preliminary-estimates
The tables show the rates and monetary values of overpayments and underpayments for each benefit going back to 2005/06, split by fraud, claimant error and official error. The tables also show the net loss of overpayments measure with a time series and a breakdown by benefit. For the benefits we measure all the time, we can also show more detail about the cause of the error (for example, incomes, savings and who lives in the house) and the demographics of the claimants. We also estimate the percentage of cases that are incorrect, and the amount of money that is incorrectly paid. The figures presented in this report are estimates of fraud, claimant error and official error. Fraud – cases where the following three conditions apply: The basic conditions for receipt of benefit, or the rate of benefit in payment, are not being met The claimant can reasonably be expected to be aware of the effect on entitlement Benefit stops or reduces as a result of the review. Claimant Error – the claimant has provided inaccurate or incomplete information, or failed to report a change in their circumstances, but there is no fraudulent intent on the claimant’s part. Official Error – the benefit has been paid incorrectly due to inaction, delay or a mistaken assessment by the DWP, a Local Authority or Her Majesty’s Revenue and Customs. Our Background and Methodology information note provides further information on the how we calculate ‘Fraud and Error in the Benefit System’ statistics and gives a glossary of the causes of fraud and error used in this document and the reference tables: https://www.gov.uk/government/statistics/fraud-and-error-in-the-benefit-system-financial-year-201617-preliminary-estimates
Technical appendices give more detail about the data manipulation process: https://www.gov.uk/government/publications/fraud-and-error-in-the-benefit-system-supporting-documents-for-statistical-reports
Interactive information and charts to represent the fraud and error data: https://femavis.herokuapp.com
Fraud and error – rates and monetary values
For continuously measured benefits, the monetary value of fraud and error is calculated using the percentage of fraud and error found in our sample:
(Percentage of fraud and error) x (Benefit expenditure)
Even if the rate of fraud and error is increasing, if the benefit expenditure is decreasing, we could see a lower monetary value; and vice versa. For example:
The rate of overpayments on Employment and Support Allowance fell from 2.9% to 2.8% but expenditure rose from £12.8bn to £14.5bn.
2.9% of £12.8bn is £370m. 2.8% of £14.5bn is £410m. This is why it is better to compare rates of overpayments and underpayments rather than monetary values.

16
Other National and Official Statistics Details of other National and Official Statistics produced by the Department for Work and Pensions can be found on the DWP website via the following links: A list of DWP statistical summaries: https://www.gov.uk/government/collections/dwp-statistical-summaries; A schedule of statistical releases over the next 12 months and a list of the most recent releases:
https://www.gov.uk/government/organisations/department-for-work-pensions/about/statistics; In addition, users can find links to additional DWP statistical analyses that have not been included in our standard publications at https://www.gov.uk/government/organisations/department-for-work-pensions/series/ad-hoc-statistical-publications-list If you would like to receive occasional e-mails from DWP to directly inform you of documents seeking the views of users, please email [email protected] giving details of the DWP publications you use.


![[The “©” in the Reference column indicates a CARFRA standard] · Web view2. Recovery of disability benefit overpayments. ... treatment, or medical condition arising out of](https://img.dokumen.tips/doc/110x75/5bf920f709d3f2f4078c274a/the-in-the-reference-column-indicates-a-carfra-standard-web-view2.jpg)