Embed Size (px)
Citation preview

FRANKLIN INCOME FUND
A HISTORY OF INCOME AND GROWTH
since 1948
Y E A R S70+
This brochure must be preceded or accompanied by a Franklin Income Fund summary prospectus and/or prospectus.

Not FDIC Insured | May Lose Value | No Bank Guarantee

franklintempleton.com Franklin Income Fund 1
1. Dividends are not guaranteed, and will vary depending on the fund’s income. Past distributions are not indicative of future trends. 2. As of 3/31/21. Diversification does not guarantee a profit or protect against a loss.
WHY FRANKLIN INCOME FUND? WHY FRANKLIN INCOME FUND?
Whether you’re saving for retirement or need income now to supplement your current finances, Franklin Income Fund may be the investment solution to help you achieve your goals. The fund is well diversified across multiple asset classes, which has led to consistent income over the life of the fund and has provided investor accumulation potential for future retirement needs. Key benefits of the fund include:
Incomeover 70 years of uninterrupted dividend payouts1,2
Flexibleallocation in pursuit of best opportunities
Broadly Diversified across asset classes and sectors with over 140 issuers2
Seasoned management team with a combined 58 years of industry experience2

2 Franklin Income Fund franklintempleton.com
Since its inception in 1948, Franklin Income Fund has adhered to a disciplined approach to find attractive opportunities that meet the fund’s objective – to maximize income while maintaining prospects for capital appreciation. Outlined below are the key components of the fund’s time-tested investment strategy.
THE STRATEGY
Our Active Management
Approach
ManageFund managers actively manage portfolio
holdings in light of the market
environment and where they are finding
the most attractive opportunities across
asset classes.
EvaluateFund managers identify the most attractive
fixed income, equity and/or convertible
securities of a company based on an
assessment of future income and growth
potential, as well as relative risk and reward.
ResearchRigorous bottom-up company analysis is
combined with top-down macroeconomic
and asset class research to develop
investment ideas for income
and growth potential.
Broad Opportunity SetThe management team seeks investment opportunities across a range of asset classes and security types, including stocks, bonds and convertible securities.
Integrated ResearchMultiple sources of research guide investment decisions of the fund, from “top-down” asset class views to “bottom-up” fundamental security research.
Focus on Income and Growth PotentialFund managers looks across the capital structure for securities that offer attractive current income and long-term growth potential, focusing on investment opportunities where their views may differ from the market consensus.
1
2
3

franklintempleton.com Franklin Income Fund 3
Strategy in ActionThe fund managers take a selective approach when identifying potential investment opportunities for the portfolio, as illustrated in the example below.3
JPMorgan Chase & Co. (JPM) provides a wide range of financial services worldwide; it is the largest bank holding company in the US.
Opportunity: In early 2020, at the onset of the global pandemic, the accommodative monetary and fiscal policies sent interest rates to historic lows, which negatively impacted banks’ profitability. The fund managers felt the prevailing sell-off in the stock market was indiscriminate across the banking industry and that market participants were underestimating the resilience of large banks such as JPM.
Merits: The fund managers view JPM as best-in-class among large US banks. The size and scale of the company, as well as management team strength, have led to differentiated business offerings and strong results over time, in their view. In addition, industry-leading environmental, social and governance (ESG) factors supported managers’ favorable view of the company.
Decision: Heading into 2020, the fund held a combination of JPM debt, common stock and equity-linked notes. Combining the JPM investment thesis with expectations for a market recovery and interest rate normalization, the fund managers increased exposure to JPM common stock and decreased its debt positions.
The logo shown is used for illustrative purposes to identify J.P Morgan Chase & Co. and should not be construed as an endorsement of, or affiliation with, the Franklin Income Fund or Franklin Templeton.3. The preceding information is as of 3/31/21, may change without notice and is not a complete analysis of every material fact regarding any industry, security or investment. It should not be viewed as investment recommendations, but is intended to provide insight into the fund’s portfolio selection process. Past performance is not an indicator or a guarantee of future performance. The fund’s total position in JPM as of 3/31/21 was 2.42%.CFA® and Chartered Financial Analyst® are trademarks owned by CFA Institute.
“ Franklin Income Fund has delivered income and long-term growth to investors for over 70 years by following a time-tested investment strategy rooted in flexibility and diversification.”
EDWARD D. PERKS, CFA, Lead Portfolio Manager

4 Franklin Income Fund franklintempleton.com
Consistent Income GenerationFor over seven decades, Franklin Income Fund has been providing investors with income and capital appreciation. In fact, the fund’s Advisor Class shares have delivered uninterrupted dividends through bull and bear markets since the fund’s inception in 1948.
Performance data represents past performance, which does not guarantee future results. Current performance may differ from the figures shown. The fund’s investment return and principal value will change with market conditions, and you may have a gain or a loss when you sell your shares. Total returns assume the reinvestment of all distributions at net asset value and the deduction of all Fund expenses. Performance would have been lower if fees had not been waived in various periods. For the fund’s full total return performance and other important information, please see page 10.
Advisor Class shares are only offered to certain eligible investors as stated in the prospectus. They are offered without sales charges or Rule 12b-1 fees. The fund offers multiple share classes, which are subject to different fees and expenses that will affect their performance. Please see the prospectus for details.
4. To calculate the fund’s Distribution Rate, the most recent distribution is annualized and divided by the NAV of the fund at the time of the payment. NAV represents a fund’s per share market value. Figures shown for Advisor class as of 3/31/21. Past performance is not an indicator or a guarantee of future performance. Please see page 10 for details regarding the fund’s yield and distribution rates.5. The residual value would have been $11,179 assuming all capital gains were reinvested. Dividends will vary depending on the fund’s income, and past distributions are not indicative offuture trends. Figures shown for Advisor class as of 3/31/21.6. The 12-Month Yield at NAV reflects the sum of income distributions over the preceding 12-month period divided by the NAV at the end of the period. Figures shown for Advisor class. Source: © 2021 Morningstar, Inc. All Rights Reserved.7. The 30-day SEC yield, calculated pursuant to the standard SEC formula, is based on a Fund’s investments over an annualized trailing 30-day period, and not on the distributions paid by the Fund, which may differ.8. Source: Federal Reserve H.15 report. U.S. Treasuries are direct debt obligations issued by the U.S. government and backed by its “full faith and credit.” The U.S. government guarantees the principal and interest payments on U.S. Treasuries when the securities are held to maturity.
03/01 01/03 10/04 05/06 05/08 02/10 12/11 09/13 07/15 04/17 01/19 11/20
12%
10%
8%
6%
4%
2%
0%
Franklin Income Fund–Advisor Class 10-Year US Treasury Bond8 Morningstar Category
The fund’s 12-month yield has exceeded its Morningstar Category Average and 10-Year US Treasury Bond over the past 20 years.
AN ATTRACTIVE LEVEL OF INCOME OVER TIME 12-Month Yield at NAV6
20-Year Period Ended March 31, 2021
THE BENEFITS
1
On a hypothetical $10,000 investment made 20 years ago5
$12,926Total Dividend Payout
Current Distribution Rate at NAV (Net Asset Value)4
4.71%
Uninterrupted Dividends
70+ Years
30-Day Standardized Yield7
As of March 31, 2021
Without Waiver With Waiver
Advisor Class 2.66% 2.66%

franklintempleton.com Franklin Income Fund 5
Compelling Risk/Reward Profile Franklin Income Fund aims to provide investors with a competitive risk/return profile. That’s why the fund is diversified across many different asset classes, which can help to reduce overall portfolio volatility.
SEEKING COMPELLING RETURNS WITH AN EYE ON VOLATILITYRisk vs. Return20-Year Period Ended March 31, 20219
2
and with LOWER RISK than US Stocks..................10.7% versus 14.8%
The fund produced a competitive return versus US Stocks on an annualized return basis ................... 7.2% versus 8.5%while OUTPERFORMING bonds on an annualized return basis ....................................7.2% versus 4.5%
Diversification does not guarantee a profit or protect against a loss. 9. Source: © 2021 Morningstar, Inc. All Rights Reserved. Past performance is not an indicator or a guarantee of future performance. US Bonds are represented by the Bloomberg Barclays US Aggregate Bond Index, US Stocks are represented by the S&P 500 Index. Indexes are unmanaged, and one cannot invest directly in an index. They do not reflect any fees, expenses or sales charges.10. Risk is measured by the annualized standard deviation of monthly total returns. Standard deviation measures the risk or volatility of an investment’s return over a particular time period; the greater the number, the greater the risk.
0% 16%
9%
8%
7%
6%
5%
4%
Risk10
AnnualizedReturn
4% 8% 12%
US Stocks
Franklin Income Fund– Advisor Class
US Bonds
20-Year Period Ended March 31, 2021

6 Franklin Income Fund franklintempleton.com
Broad Diversification across Multiple Asset ClassesFranklin Income Fund provides a broad set of investments within a single fund. With investments in more than 160 issuers, the fund is well diversified, which can help reduce its overall volatility. In instances where the fund managers identify opportunity, the fund may hold multiple parts of an issuer’s capital structure through a combination of securities.
46.73%
Equity
Fixed Income (Investment Grade: 6.03%, High Yield: 18.63%)
Convertibles / Equity-Linked Notes
Cash
50.26%
23.76%
24.67%
1.32%
3
4
FRANKLIN INCOME FUNDAsset Allocation11
As of March 31, 2021 – Market Value
Flexible Approach Adjusts to Changing Market Conditions The fund’s allocation can shift between equity and fixed income without restriction at any given time based on where the fund managers are finding the most attractive investment opportunities.
FRANKLIN INCOME FUNDAsset Allocation11,12
10-Year Period Ended March 31, 2021 – Market Value
60%
80%
40%
20%
0%2011 2013 2015 2017 2019 2021
Fixed Income
Equity
Tactical shifts between EQUITY and FIXED INCOME reflect where we are finding the most attractive opportunities.
Top 10 Holdings (by issuer)13
As of March 31, 2021
Name Asset Class Weightings
Community Health Systems, Inc. Fixed Income – Equity 5.25%
JPMorgan Chase & Co. Fixed Income – Equity 2.42%
Chevron Corp. Equity 2.21%
Southern Co. Equity – Convertible / Equity-Linked Notes 2.09%
Bank of America Corp.Fixed Income – Equity – Convertible /Equity-Linked Notes
2.06%
CVS Health Corp.Fixed Income – Equity – Convertible /Equity-Linked Notes
2.02%
Metlife, Inc. Equity – Convertible / Equity-Linked Notes 2.00%
Exxon Mobil Corp. Equity 1.97%
Procter & Gamble Co. Equity 1.91%
Dominion Energy, Inc. Equity – Convertible / Equity-Linked Notes 1.84%
THE BENEFITS (cont’d.)
11. Information is historical and may not reflect current or future portfolio characteristics. Market value figures reflect the trading value of the investments. Portfolio breakdown percentages may not total 100% and may be negative due to rounding, use of any derivatives, unsettled trades or other factors. All portfolio holdings are subject to change. 12. Equity calculation includes convertibles and equity-linked notes.13. The information provided is not a recommendation to purchase, sell, or hold any particular security. The securities identified do not represent the fund’s entire holdings and in the aggregate may represent only a small percentage of such holdings. There is no assurance that securities purchased will remain in the fund or that the securities sold will not be purchased. In addition, it should not be assumed that any securities transactions discussed were or will prove to be profitable. The portfolio manager for the fund reserves the right to withhold release of information with respect to holdings that would otherwise be included.

franklintempleton.com Franklin Income Fund 7
14. As of 3/31/21.
WHAT ARE THE RISKS?All investments involve risks, including possible loss of principal. The fund’s portfolio includes a substantial portion of higher-yielding, lower-rated corporate bonds and some floating rate loans, which are also higher-yielding and lower-rated. These investments have more credit risk than investment-grade securities and are subject to increased risk of default and potential loss of principal. The fund’s share price and yield will be affected by interest rate movements. Bond prices generally move in the opposite direction of interest rates. Thus, as the prices of bonds in the fund adjust to a rise in interest rates, the fund’s share price may decline. Changes in the financial strength of a bond issuer or in a bond’s credit rating may affect its value. Stock prices fluctuate, sometimes rapidly and dramatically, due to factors affecting individual companies, particular industries or sectors, or general market conditions. Foreign investing involves additional risks such as currency and market volatility, as well as political and social instability. These and other risk considerations are discussed in the fund’s prospectus.
5 Seasoned Management Team14 Our investment team, led by Edward D. Perks, lead portfolio manager since 2004, strives to meet investor needs for income and long-term capital appreciation. This seasoned team leverages the depth and breadth of Franklin Templeton’s global research teams to help identify the most compelling investments for the fund.
58 Yearsof Combined Investment Industry Experience
= + 28 Yearsof Industry Experience (28 years with the firm)
EDWARD D. PERKS, CFALead Portfolio Manager
20 Yearsof Industry Experience (20 years with the firm)
TODD BRIGHTON, CFAPortfolio Manager
10 Yearsof Industry Experience (6 years with the firm)
BRENDAN CIRCLE, CFAPortfolio Manager
+
Franklin Templeton Investment Solutions
Franklin Templeton Fixed Income
Franklin Equity Group
107Investment Professionals
144Investment Professionals
58Investment Professionals
Supported by a Deep Bench of Investment Professionals
8 Franklin Income Fund franklintempleton.com
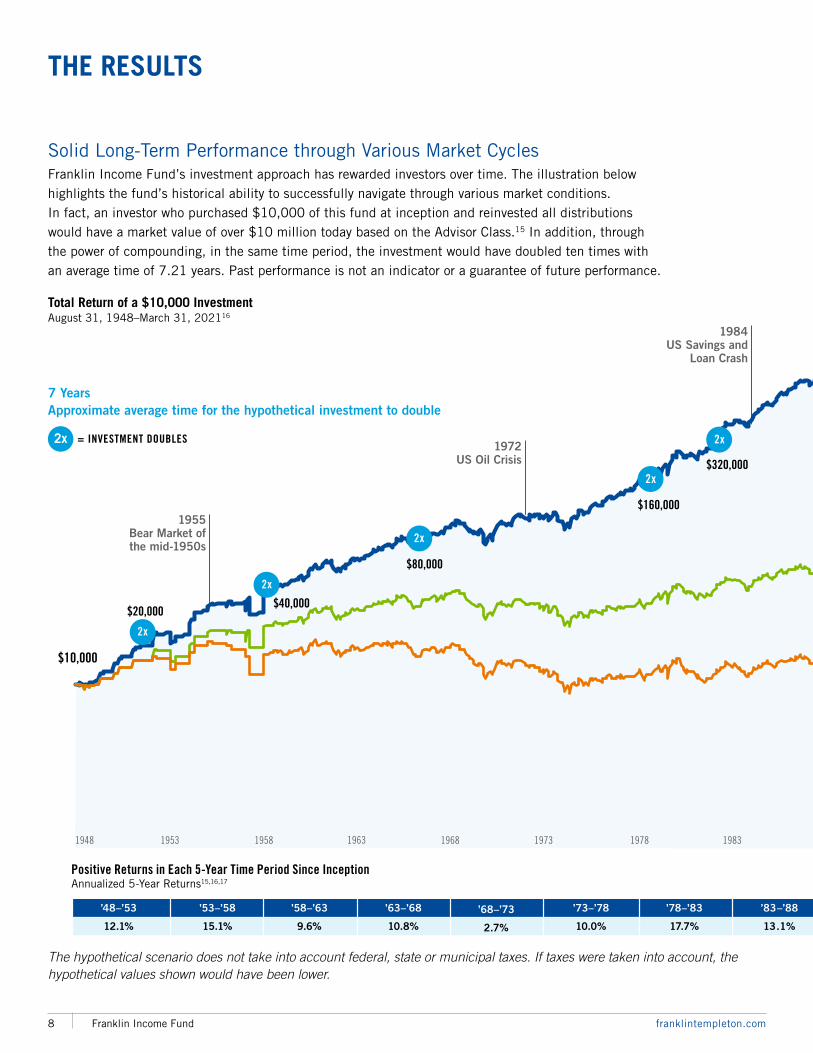
Solid Long-Term Performance through Various Market Cycles Franklin Income Fund’s investment approach has rewarded investors over time. The illustration below highlights the fund’s historical ability to successfully navigate through various market conditions. In fact, an investor who purchased $10,000 of this fund at inception and reinvested all distributions would have a market value of over $10 million today based on the Advisor Class.15 In addition, through the power of compounding, in the same time period, the investment would have doubled ten times with an average time of 7.21 years. Past performance is not an indicator or a guarantee of future performance.
Total Return of a $10,000 InvestmentAugust 31, 1948–March 31, 202116
The hypothetical scenario does not take into account federal, state or municipal taxes. If taxes were taken into account, the hypothetical values shown would have been lower.
THE RESULTS
7 YearsApproximate average time for the hypothetical investment to double
1955Bear Market ofthe mid-1950s
1997Asian
EconomicCrisis
2007SubprimeMortgageMeltdown
2008Credit Crunch
2010EuropeanDebt Crisis
1984US Savings and
Loan Crash
1994Bond Market Crash
1991Gulf War
2000Tech Market Crash
2001Attack on World Trade Center
1972US Oil Crisis
’48–’53
12.1%
’53–’58
15.1%
’58–’63
9.6%
’63–’68
10.8%
’68–’73
2.7%
’73–’78
10.0%
’78–’83
17.7%
’88–’93
14.7%
’93–’98
9.1%
’98–’03
8.2%
’03–’08
8.7%
’08–’13
7.9%
’13–’18
6.0%
’18–’21*
7.2%
’83–’88
13.1%
19531948 1958 1963 1968 1973 1978 1983 1988 1993 1998 2003 2008 2013 20212018
Positive Returns in Each 5-Year Time Period Since InceptionAnnualized 5-Year Returns15,16,17
$63,897Residual value with all capitalgains reinvested
$215,865Total dividends paid out
$15,031Residual value with all capital gains and dividends paid out
$68,969Total dividends paid out
$20,505Total capital gains paid out
Franklin Income Fund–Advisor Class
$10,663,539All Capital Gains &Dividends Reinvested
$160,000
2x$320,000
2x
$640,000
2x
$5,120,000
2x
$2,560,000
2x
2x
$40,000
2x
$80,000
2x
$1,280,000
$10,000
$20,000
2x
2x = INVESTMENT DOUBLES

franklintempleton.com Franklin Income Fund 9
*8/1/2018–3/31/202115. Five-year time periods beginning at fund inception 8/31/48.16. Source: © 2021 Morningstar, Inc. All Rights Reserved. Past performance is not an indicator or a guarantee of future performance.
1955Bear Market ofthe mid-1950s
1997Asian
EconomicCrisis
2007SubprimeMortgageMeltdown
2008Credit Crunch
2010EuropeanDebt Crisis
1984US Savings and
Loan Crash
1994Bond Market Crash
1991Gulf War
2000Tech Market Crash
2001Attack on World Trade Center
1972US Oil Crisis
’48–’53
12.1%
’53–’58
15.1%
’58–’63
9.6%
’63–’68
10.8%
’68–’73
2.7%
’73–’78
10.0%
’78–’83
17.7%
’88–’93
14.7%
’93–’98
9.1%
’98–’03
8.2%
’03–’08
8.7%
’08–’13
7.9%
’13–’18
6.0%
’18–’21*
7.2%
’83–’88
13.1%
19531948 1958 1963 1968 1973 1978 1983 1988 1993 1998 2003 2008 2013 20212018
Positive Returns in Each 5-Year Time Period Since InceptionAnnualized 5-Year Returns15,16,17
$63,897Residual value with all capitalgains reinvested
$215,865Total dividends paid out
$15,031Residual value with all capital gains and dividends paid out
$68,969Total dividends paid out
$20,505Total capital gains paid out
Franklin Income Fund–Advisor Class
$10,663,539All Capital Gains &Dividends Reinvested
$160,000
2x$320,000
2x
$640,000
2x
$5,120,000
2x
$2,560,000
2x
2x
$40,000
2x
$80,000
2x
$1,280,000
$10,000
$20,000
2x
Performance data represents past performance, which does not guarantee future results. Current performance may differ from the figures shown. The fund’s investment return and principal value will change with market conditions, and you may have a gain or a loss when you sell your shares. Total returns assume the reinvestment of all distributions at net asset value and the deduction of all Fund expenses. Performance would have been lower if fees had not been waived in various periods. For the fund’s full total return performance and other important information, please see page 10.

10 Franklin Income Fund franklintempleton.com
Our investment process has stood the test of time. Franklin Income Fund has established a solid historical record of performance and yield.
(Periods Ended March 31, 2021)
Average Annual Total Returns17
1-Year 5-Year 10-Year Since Inception (8/31/1948)
Advisor Class 33.51% 8.66% 6.66% 10.10%
Class AWith Sales Charges18 27.89% 7.68% 6.03% 9.94%
Without Sales Charges 32.87% 8.50% 6.43% 10.00%
Class C With Sales Charges 31.32% 7.97% 5.98% 7.20%
Without Sales Charges 32.32% 7.97% 5.98% 7.20%
Performance data represents past performance, which does not guarantee future results. Current performance may differ from the figures shown. The fund’s investment return and principal value will change with market conditions, and you may have a gain or a loss when you sell your shares. Total returns assume the reinvestment of all distributions at net asset value and the deduction of all Fund expenses. Performance would have been lower if fees had not been waived in various periods. Please call Franklin Templeton at (800) DIAL BEN/342-5236 or visit franklintempleton.com for most recent month-end performance.
17. Advisor Class: For periods prior to the fund’s Advisor Class inception date 12/31/96, a restated figure is used based on the fund’s oldest share class, Class A1 performance, excluding the effect of Class A1’s maximum initial sales charge but reflecting the effect of the Class A1 Rule 12b-1 fees; and for periods after the fund’s Advisor Class inception date, actual Advisor Class performance is used, reflecting all charges and fees applicable to that class. Class A: Effective 9/10/18 Class A shares closed to new investors, were renamed Class A1 shares, and a new Class A share with a different expense structure became available. Class A performance shown has been calculated as follows: (a) for periods prior to 9/10/18, a restated figure is used based on the fund’s Class A1 performance and including any Rule 12b-1 rate differential as exists between Class A1 and Class A; and (b) for periods after 9/10/18, actual Class A performance is used, reflecting all charges and fees applicable to that class. On 5/1/94, the fund implemented a Rule 12b-1 plan, which affects subsequent performance. Class C: Prior to 1/1/04, these shares were offered with an initial sales charge; thus actual returns would have differed. The fund offers other share classes, subject to different fees and expenses that will affect their performance. Please see the fund’s prospectus for more information about fees and expenses.18. Prior to 3/1/19, these shares were offered at a higher initial sales charge of 4.25%; thus actual returns would have differed. Total returns with sales charges have been restated to reflect the current maximum initial sales charge of 3.75%.19. The 30-day SEC yield, calculated pursuant to the standard SEC formula, is based on a Fund’s investments over an annualized trailing 30-day period, and not on the distributions paid by the Fund, which may differ. To calculate the fund’s Distribution Rate, the most recent distribution is annualized and divided by the NAV of the fund at the time of the payment. NAV represents a fund’s per share market value.20. The fund has a fee waiver associated with any investment it makes in a Franklin Templeton money fund and/or other Franklin Templeton fund, contractually guaranteed through January 31, 2022. Fund investment results reflect the fee waiver; without this waiver, the results would have been lower.21. Source: © 2021 Morningstar, Inc. All Rights Reserved. Past performance is not an indicator or a guarantee of future performance.
Yields & Distribution Rates19
30-Day Standardized Yield (Without Waiver)
30-Day Standardized Yield (With Waiver)
Distribution Rate
Advisor Class 2.66% 2.66% 4.71%
Class A 2.31% 2.31% 4.30%
Class C 2.02% 2.02% 4.02%
Sales Charges: Advisor Class: none; Class A: Maximum 3.75% initial sales charge; Class C: 1% contingent deferred sales charge (CDSC) in the first year only.
Total Annual Operating Expenses20: Without waiver: Advisor Class: 0.47%; Class A: 0.72%; Class C: 1.12%; With waiver: Advisor Class: 0.46%; Class A: 0.71%; Class C: 1.11%.
Fund Overview Assets $71.0 Billion
Inception Date 8/31/48
Dividends Monthly, by the 2nd business day
Fund Measures (Advisor Class)
Beta (3 Years; vs. S&P 500 Index) 0.62
Standard Deviation (3 Years) 12.17
0.0 0.5 1.0 1.5 2.0Franklin Income FundMorningstar Category Average (US OE Allocation – 30% to 50% Equity)21
Class A
Class C
Advisor Class0.46%
0.71%
1.11%
1.10%
1.81%
0.85%
Total Annual Operating Expenses (Net)
FRANKLIN INCOME FUND
franklintempleton.com Franklin Income Fund 11
22. Source: Morningstar via Advanced Hypo Tool, 12/31/20. All calculations include reinvestment of dividends and capital gains. Past performance is not an indicator or a guarantee of future performance. Please note that this hypothetical investment does not take into account federal, state or municipal taxes. If taxes were taken into account, the hypothetical values shown would have been lower.
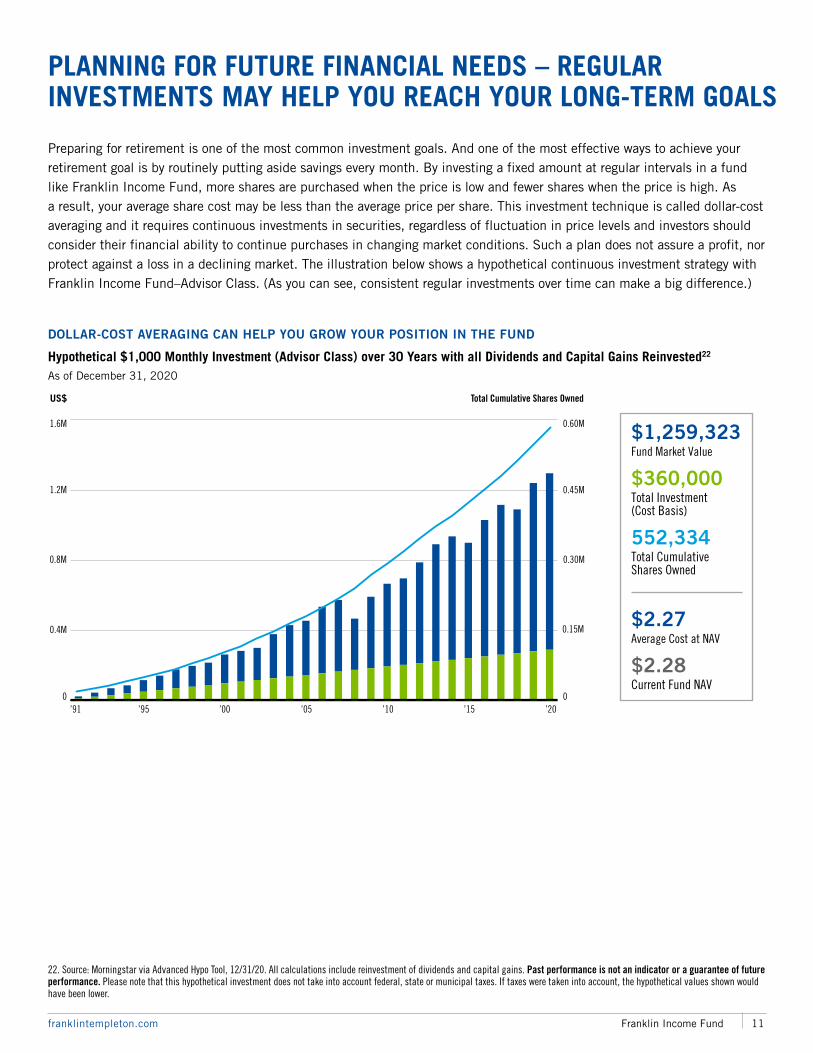
DOLLAR-COST AVERAGING CAN HELP YOU GROW YOUR POSITION IN THE FUND
Hypothetical $1,000 Monthly Investment (Advisor Class) over 30 Years with all Dividends and Capital Gains Reinvested22
As of December 31, 2020
500000.01
1000000.02
2000000.04
0
0.4M
0.8M
1.2M
1.6M
0
0.15M
0.30M
0.60M
0.45M
’91 ’95 ’00 ’05 ’10 ’15 ’20
$1,259,323Fund Market Value
$360,000Total Investment (Cost Basis)
552,334Total Cumulative Shares Owned
$2.27Average Cost at NAV
$2.28Current Fund NAV
Total Cumulative Shares OwnedUS$
PLANNING FOR FUTURE FINANCIAL NEEDS – REGULAR INVESTMENTS MAY HELP YOU REACH YOUR LONG-TERM GOALS
Preparing for retirement is one of the most common investment goals. And one of the most effective ways to achieve your retirement goal is by routinely putting aside savings every month. By investing a fixed amount at regular intervals in a fund like Franklin Income Fund, more shares are purchased when the price is low and fewer shares when the price is high. As a result, your average share cost may be less than the average price per share. This investment technique is called dollar-cost averaging and it requires continuous investments in securities, regardless of fluctuation in price levels and investors should consider their financial ability to continue purchases in changing market conditions. Such a plan does not assure a profit, nor protect against a loss in a declining market. The illustration below shows a hypothetical continuous investment strategy with Franklin Income Fund–Advisor Class. (As you can see, consistent regular investments over time can make a big difference.)

12 Franklin Income Fund franklintempleton.com
An investor should not begin a systematic withdrawal program until at least six months following the initial investment, which most likely has not yet appreciated sufficiently to offset the sales charge incurred.23. It is important to note that the amounts withdrawn do not represent dividends or income, but rather the proceeds from the sale of shares. Sufficient shares are sold from the shareholder’s account at the time of each withdrawal to provide for such payments.24. Source: Morningstar via Advanced Hypo Tool, 12/31/20. All calculations include reinvestment of dividends and capital gains. See page 10 of this brochure for the fund’s standardized performance figures. Past performance is not an indicator or a guarantee of future performance.
After a lifetime of savings, what’s next? A systematic withdrawal plan allows you to sell accumulated shares on a regular basis (such as monthly) and receive the redemption proceeds. For example, if you started taking a 6% withdrawal (with a 3% annual increase) 30 years ago, your total withdrawn amount would have been more than your initial total investment. In addition to the income withdrawn, the ending portfolio value would have grown to over $432,000. Below is an illustration of how a Systematic Withdrawal Plan, with Franklin Income Fund, can help provide you with a steady income and grow your investment.
A SYSTEMATIC WITHDRAWAL PLAN CAN HELP PROVIDE A MONTHLY INCOME AND CONTINUE TO GROW YOUR INVESTMENT $100,000 Initial Investment (Advisor Class), $6,000 First Year Withdrawal Amount (6% of Initial Investment), 3% Annual Increase in Withdrawal Amount, Reinvest Dividends and Capital Gains23, 24
An investor participating in a systematic withdrawal plan should review, every year, the results being obtained and the value of remaining shares. Based on this annual review, the individual can increase or decrease the amount of the monthly withdrawals if that seems appropriate. The results of such a program vary substantially depending on the fund’s investment performance during the period the program is in effect. The rate or amount chosen for withdrawal determines the value remaining at the end of the period. In a period of declining market values, continued withdrawals could eventually exhaust the principal.
The hypothetical scenario does not take into account federal, state or municipal taxes. If taxes were taken into account, the hypothetical values shown would have been lower.
TURN YOUR NEST EGG INTO INCOME – THROUGH A SYSTEMATIC WITHDRAWAL PLAN
Total funds withdrawn from a $100K initial investment
Number of remaining shares after withdrawal
Ending portfolio value
$285,455 191,356 $432,465
Year Ended Dec. 31
Annual Withdrawals
Value at End of Period
1991 $6,000 $132,882
1992 $6,180 $146,240
1993 $6,365 $170,234
1994 $6,556 $153,305
1995 $6,753 $177,855
1996 $6,956 $187,362
1997 $7,164 $212,874
1998 $7,379 $207,695
1999 $7,601 $198,821
2000 $7,829 $229,750
Year Ended Dec. 31
Annual Withdrawals
Value at End of Period
2001 $8,063 $223,492
2002 $8,305 $213,296
2003 $8,555 $268,942
2004 $8,811 $292,512
2005 $9,076 $288,957
2006 $9,348 $334,145
2007 $9,628 $341,093
2008 $9,917 $230,805
2009 $10,215 $298,512
2010 $10,521 $325,817
Year Ended Dec. 31
Annual Withdrawals
Value at End of Period
2011 $10,837 $323,211
2012 $11,162 $357,613
2013 $11,497 $396,698
2014 $11,842 $399,625
2015 $12,197 $357,301
2016 $12,563 $401,476
2017 $12,940 $422,194
2018 $13,328 $387,770
2019 $13,728 $434,894
2020 $14,139 $432,465

• Autonomous investment teams where entrepreneurial, independent
professionals practice true
specialization
• ~1,300 research and investment professionals, giving us
differentiated insights and an “ear
to the ground” in 20+ countries
• At-scale capabilities in analytics,
data and servicing combined
with empowered teams makes us
uniquely agile
Nimble where it matters
• Strategy- and vehicle-agnostic approach to solving client needs
• Tailored support through
a global distribution platform,
technological tools and value-added
services, provides more than just
investment returns
• Multi-asset capabilities that advance
portfolio construction and provide
true solutions
Unparalleled in our ability to customize
• Closely-held public firm with a strong balance sheet, allowing us
to invest with a long-term horizon
• Track record of product and technological innovations fueled
by our Silicon Valley roots
• Values-based culture, we do
the right thing for our clients and
our people
Guided by long-term value creation
Our story
From large institutions to individual investors, each of our clients wants the same thing. To
achieve their financial goals. And for more than 70 years, we’ve helped them do exactly that.
Everything we do at Franklin Templeton is focused on delivering our clients better outcomes.
And that’s why millions of clients in more than 160 countries have entrusted us with their
investments, making us one of the world’s largest asset managers with $1.5 trillion in assets
under management.*
FRANKLIN TEMPLETON
*As of 3/31/21. Assets under management represent combined assets of Franklin Templeton, Legg Mason, and subsidiary investment management groups. Franklin Templeton acquired Legg Mason on 7/31/20.

Franklin Templeton Distributors, Inc.One Franklin ParkwaySan Mateo, CA 94403-1906(800) DIAL BEN® / 342-5236franklintempleton.com
Franklin Income Fund Symbols:Advisor: FRIAX Class A: FKIQXClass C: FCISXClass R: FISRXClass R6: FNCFX
© 2021 Franklin Templeton. All rights reserved. UPD 05/21 609 XINV 04/21
This brochure must be preceded or accompanied by a Franklin Income Fund summary prospectus and/or prospectus. Please read a prospectus carefully before you invest or send money. Investors should carefully consider a fund’s investment goals, risks, charges and expenses before investing. The fund’s performance will be updated each quarter with standardized figures and ranking information, if quoted.