Embed Size (px)
Citation preview

Francesca RomanaContrafatto
Vulnerability assessmentof monumental masonrystructures includinguncertainty
Vul
nera
bilit
y as
sess
men
t of m
onum
enta
l mas
onry
stru
ctur
es in
clud
ing
unce
rtai
nty
Fran
cesc
a R
oman
aC
ontra
fatto
Bar
celo
na I
201
7
Università degli Studidi Padova

Francesca RomanaContrafatto
Vulnerability assessmentof monumental masonrystructures includinguncertainty
Barcelona I 2017

Vulnerability assessment of monumental masonry structures considering uncertainty
Erasmus Mundus Programme
ADVANCED MASTERS IN STRUCTURAL ANALYSIS OF MONUMENTS AND HISTORICAL CONSTRUCTIONS i
DECLARATION
Name: Francesca Romana Contrafatto
Email: [email protected]
Title of the
Msc Dissertation:
Vulnerability assessment of monumental masonry structures considering
uncertainty
Supervisor(s): Luca Pelà, Savvas Saloustros
Year: 2017
I hereby declare that all information in this document has been obtained and presented in accordance
with academic rules and ethical conduct. I also declare that, as required by these rules and conduct, I
have fully cited and referenced all material and results that are not original to this work.
I hereby declare that the MSc Consortium responsible for the Advanced Masters in Structural Analysis
of Monuments and Historical Constructions is allowed to store and make available electronically the
present MSc Dissertation.
University: Technical University of Catalonia (UPC)
Date: 20th July 2017
Signature:
___________________________

Title of the thesis
Erasmus Mundus Programme
ii ADVANCED MASTERS IN STRUCTURAL ANALYSIS OF MONUMENTS AND HISTORICAL CONSTRUCTIONS

Vulnerability assessment of monumental masonry structures considering uncertainty
Erasmus Mundus Programme
ADVANCED MASTERS IN STRUCTURAL ANALYSIS OF MONUMENTS AND HISTORICAL CONSTRUCTIONS iii
To my grandparents

Title of the thesis
Erasmus Mundus Programme
iv ADVANCED MASTERS IN STRUCTURAL ANALYSIS OF MONUMENTS AND HISTORICAL CONSTRUCTIONS

Vulnerability assessment of monumental masonry structures considering uncertainty
Erasmus Mundus Programme
ADVANCED MASTERS IN STRUCTURAL ANALYSIS OF MONUMENTS AND HISTORICAL CONSTRUCTIONS v
ACKNOWLEDGEMENTS
I would like to thank my supervisors, Luca Pelà and Savvas Saloustros for having the opportunity to
work with them, for their suggestions and their help in developing this work.
I would like to express my gratitude to the Msc Consortium for the scholarship that I received.
Thank you to my family which always support me and to Giovanni for sharing with me all of my
experiences
Thank you to all the friends that I met with me this year, for all the moments we share

Title of the thesis
Erasmus Mundus Programme
vi ADVANCED MASTERS IN STRUCTURAL ANALYSIS OF MONUMENTS AND HISTORICAL CONSTRUCTIONS
This page is left blank on purpose.

Vulnerability assessment of monumental masonry structures considering uncertainty
Erasmus Mundus Programme
ADVANCED MASTERS IN STRUCTURAL ANALYSIS OF MONUMENTS AND HISTORICAL CONSTRUCTIONS vii
ABSTRACT
Unreinforced masonry buildings represent a significant amount of the built heritage in the earthquake-
prone regions. They were designed most of the times considering only gravity loads and they often
present low ductility and lack of connections between structural elements. Therefore, they are highly
susceptible to damage from earthquakes, even of low intensity. This fact has been dramatically
stressed by the recent seismic events (Central Italy 2016, Nepal 2015, Northern Italy, 2012) with
catastrophic losses in terms both of number of collapsed buildings and of human lives. Therefore, it
emerges the urgent need for assessing the seismic performance of these structures.
The evaluation of the seismic vulnerability of existing masonry buildings result a demanding task since
their knowledge is limited regarding material characterization, actual geometry and role of the different
components within the structure. In the last decade, the engineering community demonstrates an
increasing attention to the topic and most of the current research is involved in developing an
assessment methodology, able to include the aforementioned uncertainties in the structural
assessment of masonry buildings. However, very few case studies are available on the seismic
vulnerability assessment of complex structural typologies in historical constructions.
This work aims to investigate the vulnerability assessment of large monumental structures with a
complex geometry, including the uncertainty related to the material mechanical parameters. The
church of Santa Maria del Mar of Barcelona has been considered as a case study. The vulnerability of
a macro-element, representative for a typical transversal bay of the church, has been studied under
transversal seismic loads. The capacity of the structure has been evaluated through a non-linear static
analysis performed with a two-dimensional (2D) Finite Element (FE) Model of the selected macro-
element. A Monte Carlo simulation has been utilized to estimate the effect of the uncertainties
regarding the material mechanical properties. The vulnerability of the structure is presented in terms of
fragility curves, which express the probability of the damage on the structure for different seismic
scenarios.

Title of the thesis
Erasmus Mundus Programme
viii ADVANCED MASTERS IN STRUCTURAL ANALYSIS OF MONUMENTS AND HISTORICAL CONSTRUCTIONS
This page is left blank on purpose.

Vulnerability assessment of monumental masonry structures considering uncertainty
Erasmus Mundus Programme
ADVANCED MASTERS IN STRUCTURAL ANALYSIS OF MONUMENTS AND HISTORICAL CONSTRUCTIONS ix
RESUMEN
Los edificios de obra de fábrica no reforzada representan una cantidad significativa del patrimonio
construido en las regiones propensas a terremotos. Fueron diseñados la mayoría de las veces
considerando solo cargas gravitacionales y a menudo presentan baja ductilidad y falta de conexiones
entre elementos estructurales. Por lo tanto, son muy susceptibles a daños causados por terremotos,
incluso de baja intensidad. Este hecho ha sido dramáticamente demonstrado por los recientes
eventos sísmicos (Italia Central 2016, Nepal 2015, Norte de Italia, 2012) con pérdidas catastróficas
tanto en edificios como en vidas humanas. Por lo tanto, surge la necesidad urgente de evaluar el
comportamiento sísmico de estas estructuras.
La evaluación de la vulnerabilidad sísmica de edificios existentes en obra de fábrica resulta una tarea
exigente ya que su conocimiento es limitado en cuanto a la caracterización material, la geometría real
y el papel de los diferentes componentes dentro de la estructura. En la última década, la comunidad
de ingenieros ha demostrado una creciente atención al tema y la mayor parte de la investigación
actual está involucrada en el desarrollo de una metodología de evaluación capaz de incluir las
incertidumbres antes mencionadas en la evaluación estructural de los edificios de mampostería. Sin
embargo, muy pocos casos de estudio están disponibles sobre la evaluación de la vulnerabilidad
sísmica de tipologías estructurales complejas en construcciones históricas.
Este trabajo tiene como objetivo investigar la evaluación de la vulnerabilidad de grandes estructuras
monumentales de geometría compleja, incluyendo la incertidumbre relacionada con los parámetros
mecánicos del material. La iglesia de Santa María del Mar de Barcelona ha sido considerada como
caso de estudio. La vulnerabilidad de un macro-elemento, representativo de una típica crujía
transversal de la iglesia, ha sido estudiada bajo cargas sísmicas en dirección transveral. La capacidad
de la estructura se ha evaluado a través de un análisis estático no lineal realizado con un modelo
bidimensional (2D) de Elementos Finitos (FE) del macroelemento seleccionado. Se ha utilizado una
simulación de Monte Carlo para estimar el efecto de las incertidumbres con respecto a las
propiedades mecánicas del material. La vulnerabilidad de la estructura se presenta en términos de
curvas de fragilidad, que expresan la probabilidad del daño en la estructura para diferentes
escenarios sísmicos.

Title of the thesis
Erasmus Mundus Programme
x ADVANCED MASTERS IN STRUCTURAL ANALYSIS OF MONUMENTS AND HISTORICAL CONSTRUCTIONS
This page is left blank on purpose.

Vulnerability assessment of monumental masonry structures considering uncertainty
Erasmus Mundus Programme
ADVANCED MASTERS IN STRUCTURAL ANALYSIS OF MONUMENTS AND HISTORICAL CONSTRUCTIONS xi
RESUMÉ
Gli edifice in muratura non rinforzata rappresentamo la maggior parte del patrimonio edilizio nelle aree
soggette ad eventi sismici. Tali edifici sono spesso progettati per resistere ai soli carichi gravitazionali
e spesso presentano una ridotta duttilità e mancanza di collegamenti tra diversi elementi strutturali.
Sono dunque altamente soggetti a danneggiamento a causa di eventi sismici, anche di bassa
intensità. Ciò è stato drammaticamente dimostrato dai recenti eventi sismici (Centro Italia 2016, Nepal
2015, Nord Italia 2012) con catastrofiche perdite in termini sia di edifici e di vite umane. Emerge
dunque un urgente bisogno di valutare la sicurezza sismica di queste strutture.
La valutazione della vulnerabilità sismica di edifici esistenti in murature risulta complessa poiché la
conoscenza di questi edifici risulta limitata riguardo caratterizzazione di materiali, geometria reale e
ruolo dei differenti componenti strutturali. Nell’ultima decade la comunità ingegneristica sta
dimostrando una crescente attenzione al tema e gran parte della ricerca attuale è coinvolta nello
sviluppo di una metodologia di valutazione capace di includere le sopracitate incertezze nella
valutazione strutturale degli edifici in muratura. Nonostante ciò, esistono pochi casi studio riguardanti
la valutazione della sicurezza sismica di tipologie strutturali complesse nell’ambito delle costruzioni
storiche.
Questo lavoro ha lo scopo di esaminare il problema della valutazione della vulnerabilità strutturale di
grandi strutture monumentali con una geometria complessa, includendo le incertezze relative alle
proprietà meccaniche dei materiali. La chiesa di Santa Maria del Mar a Barcellona è considerata come
caso studio. La vulnerabilità di un macro-elemento rappresentativo di una campata trasversale della
chiesa è stata studiata considerando un sismico in direzione trasversale. La capacità della struttura è
stata valutata mediante analisi statica non lineare di un modello agli elementi finiti bidimensionale del
macro-elemento selezionato. Una simulazione stocastica tramite metodo di Monte Carlo è stata
utilizzata per stimare l’effetto delle incertezze riguardanti le proprietà meccaniche dei materiali. La
vulnerabilità della struttura è presentata mediante curve di fragilità, le quali rappresentano la
probabilità di danno strutturale per diversi scenari sismici.

Title of the thesis
Erasmus Mundus Programme
xii ADVANCED MASTERS IN STRUCTURAL ANALYSIS OF MONUMENTS AND HISTORICAL CONSTRUCTIONS
This page is left blank on purpose.
Vulnerability assessment of monumental masonry structures considering uncertainty
Erasmus Mundus Programme
ADVANCED MASTERS IN STRUCTURAL ANALYSIS OF MONUMENTS AND HISTORICAL CONSTRUCTIONS xiii
TABLE OF CONTENTS
1. INTRODUCTION ............................................................................................................ 1
1.1 Motivation of the thesis ............................................................................................ 1
1.2 Objectives of the research ....................................................................................... 2
1.3 Methodology of the research ................................................................................... 2
1.4 Outline of the document ........................................................................................... 3
2. STATE OF THE ART ...................................................................................................... 5
2.1 Seismic risk and vulnerability assessment of masonry structures ............................ 5
2.2 Aleatoric and epistemic uncertainties ....................................................................... 6
2.3 Code-based approach ............................................................................................. 7
2.4 Probabilistic approach: references and previous studies .......................................... 7
2.5 General methodology proposed for a seismic fragility assessment ........................ 10
2.6 Probabilistic models for uncertainties on material properties .................................. 12
3. CASE STUDY: SANTA MARIA DEL MAR CHURCH .................................................... 13
3.1 Geometrical description of the building .................................................................. 13
3.2 Structural system and material............................................................................... 15
3.3 Previous studies .................................................................................................... 17
4. NUMERICAL MODEL ................................................................................................... 19
4.1 Geometry and material properties .......................................................................... 19
4.2 Finite element model ............................................................................................. 21
4.3 Calibration of the 2D model: self-weight analysis and linear static analysis ........... 22
4.4 Non-linear static analysis and damage pattern ...................................................... 26
5. UNCERTAINTY EVALUATION ..................................................................................... 33
5.1 Uncertain input parameters .................................................................................... 33
5.2 Uncertainty probabilistic modelling ......................................................................... 34
5.3 Stochastic simulation of structural models ............................................................. 36
5.4 Reference structural model .................................................................................... 39
6. PROBABILISTIC SEISMIC ASSESSMENT .................................................................. 41
6.1 Methodology .......................................................................................................... 41
6.2 Capacity curves ..................................................................................................... 42
6.3 Identification of damage grades ............................................................................. 47
6.4 Use of the N2 method to evaluate the seismic demand for each limit state ............ 50
6.5 Fragility function and seismic fragility for each limit state ....................................... 52

Title of the thesis
Erasmus Mundus Programme
xiv ADVANCED MASTERS IN STRUCTURAL ANALYSIS OF MONUMENTS AND HISTORICAL CONSTRUCTIONS
7. CONCLUSIONS ........................................................................................................... 57
7.1 Summary ............................................................................................................... 57
7.2 Conclusions of the research ................................................................................... 57
7.3 Suggestions for future work ................................................................................... 58
REFERENCES .................................................................................................................... 59

Vulnerability assessment of monumental masonry structures considering uncertainty
Erasmus Mundus Programme
ADVANCED MASTERS IN STRUCTURAL ANALYSIS OF MONUMENTS AND HISTORICAL CONSTRUCTIONS xv
TABLE OF FIGURES
Figure 2. 1 – Fragility curves (a) and damage state distribution (b) [Lagomarsino et al., 2014] .............................................................................................................................................. 8 Figure 2. 2 – Empirical fragility curves in terms of macroseismic intensity (left) and analytical fragility curves in terms of PGA (right) [Lagomarsino et al., 2014] .......................................... 9 Figure 2. 3 – Capacity curves (right) and output variables distributions (left) obtained by applied the N2 method [Petromichelakis et al, 2014]............................................................ 11
Figure 3. 1 - Esternal view of the church from the Eastern side .......................................... 13 Figure 3. 2 – Roof level above the chapels .......................................................................... 14 Figure 3. 3 – Roof level above the lateral naves .................................................................. 14 Figure 3. 4 – Roof level above the central nave ................................................................... 14 Figure 3. 5 – View of the interior of the church ..................................................................... 15 Figure 3. 6 – Square cross vault at the central nave ............................................................ 15 Figure 3. 7 – Rectangular cross vault at the lateral nave ...................................................... 15 Figure 3. 8 – External wall ................................................................................................... 16 Figure 3. 9 – Pier base ......................................................................................................... 16 Figure 3. 10 – Pottery filling over the central vault ................................................................ 16
Figure 4. 1 – Representative macro-element for a typical transversal bay of the church ...... 19
Figure 4. 2 – Distribution of different materials in the 2D numerical model ........................... 20
Figure 4. 3 - Finite element mesh......................................................................................... 21
Figure 4. 4 – Comparison between two-dimensional and three-dimensional model. Linear
static analysis under self-weight. Total displacements ......................................................... 23
Figure 4. 5 - Comparison between two-dimensional and three-dimensional model. Linear
static analysis under self-weight and lateral equivalent acceleration (1 g). Total
displacements. ..................................................................................................................... 24
Figure 4. 6 - Comparison of 2D and 3D model. Natural shapes for the fundamental mode of
vibration (X direction) ........................................................................................................... 25
Figure 4. 8 - Constitutive models assumed for tension (a) and compression (b) .................. 26
Figure 4. 8 – Tensile damage distribution. Crack width. Load factor = 1 .............................. 27
Figure 4. 9 – Principle positive strains in the vertical direction. Crack width. Lod factor = 1 .. 27
Figure 4. 10 - Tensile damage distribution. Crack width. Load factor = 3 ............................. 28
Figure 4. 11 - Capacity curve in terms of base shear and displacement at the central vault
key ....................................................................................................................................... 29
Figure 4. 12 - Capacity curve in terms of equivalent acceleration and displacement at the
central vault key ................................................................................................................... 29
Figure 4. 13 – Mechanism of damage. Crack width.............................................................. 30
Figure 4. 14 - Positive principle strains ................................................................................ 31

Title of the thesis
Erasmus Mundus Programme
xvi ADVANCED MASTERS IN STRUCTURAL ANALYSIS OF MONUMENTS AND HISTORICAL CONSTRUCTIONS
Figure 4. 15 - Comparison between two-dimensional and three-dimensional model. Non-
linear static analysis. Damage pattern. ................................................................................. 31
Figure 5. 1 – Equivalent structural members between 3D (left) and 2D (right) structural
models ................................................................................................................................. 22
Figure 5. 2 – Distribution of random variables for the reference material .............................. 38
Figure 5. 3 - Capacity curve for the reference model and the previous model ...................... 39
Figure 5. 4 - Crack widths (reference model). Damage mechanism ..................................... 40
Figure 6. 1 – Schematic view of the adopted methodology [Petromichelakis et al., 2014] .... 42
Figure 6. 2 – Capacity curves............................................................................................... 42
Figure 6. 3 – Representative models.................................................................................... 43
Figure 6. 4 – Comparison of the tensile strength for a global (case A) and local (case B)
mechanism of damage ......................................................................................................... 44
Figure 6. 5 – Crack widths (model A002). Mechanism G1: Global mechanism of damage
(case G) ............................................................................................................................... 45
Figure 6. 6 - Crack widths (model A094). Mechanism G3: Global mechanism of damage
(case G) – ductile failure. ..................................................................................................... 46
Figure 6. 7 - Crack widths (model A015). Local mechanism of damage (case L) ................. 47
Figure 6. 8 – Bilinearization of the capacity curve ................................................................ 50
Figure 6. 9 –Damage grades ............................................................................................... 50
Figure 6. 10 – Fragility curves for different limit states in terms of PGA ................................ 53
Figure 6. 11 – Damage grades associated to the model A002 – damage mechanism G1 .... 54
Figure 6. 12 – Damage grades associated to the model A015 – damage mechanism L....... 54
Figure 6. 14 – Correspondence between damage grade and probability of occurrence. Model
A002 – global mechanism (G) .............................................................................................. 55
Figure 6. 15 - Correspondence between damage grade and probability of occurrence. Model
A015 – local mechanism (L) ................................................................................................. 56

Vulnerability assessment of monumental masonry structures considering uncertainty
Erasmus Mundus Programme
ADVANCED MASTERS IN STRUCTURAL ANALYSIS OF MONUMENTS AND HISTORICAL CONSTRUCTIONS xvii
TABLE OF TABLES
Table 4. 1 - Mechanical properties of materials according to [Murcia, 2008] ........................ 21
Table 4. 2 - Geometrical thickness for different structural elements adopted in the final 2D
model ................................................................................................................................... 24
Table 4. 3 – Fundamental mode of vibration of the typical bay (X direction) ......................... 25
Table 4. 4 - 4th mode of vibration of the typical bay (X direction) ......................................... 25
Table 4. 5 – Type of modelling used for the non-linear static analysis .................................. 26
Table 4. 6 - Details on the incremental iterative procedure used for the non-linear static
analysis................................................................................................................................ 28
Table 5. 1 – Materials considered for the stochastic analysis ............................................... 33
Table 5. 2 – Uncertain parameters ....................................................................................... 34
Table 5. 3 – Ranges of variation for the compressive strength ............................................. 35
Table 5. 4 – Ranges of variation for the elastic modulus and the tensile strength ................ 35
Table 5. 5 – Range of variation of the percentage coefficients ............................................. 36
Table 5. 6 – Ranges of variation of the mechanical properties ............................................. 36
Table 5. 7 – Probability distributions and parameters for random variables. ......................... 37
Table 6. 1 – Damage mechanisms ....................................................................................... 43
Table 6. 2 – Mechanical properties for each representative model per damage mechanism 44
Table 6. 3 – Damage grades ................................................................................................ 47
Table 6. 4 – Correspondence between the damage state thresholds for mechanical and
macroseismic methods ........................................................................................................ 48
Table 6. 5 – Values of parameters describing the elastic response spectra according to the
Eurocode 6 for groud type D ................................................................................................ 51

Vulnerability assessment of monumental masonry structures including uncertainty
Erasmus Mundus Programme
ADVANCED MASTERS IN STRUCTURAL ANALYSIS OF MONUMENTS AND HISTORICAL CONSTRUCTIONS 1
1. INTRODUCTION
1.1 Motivation of the thesis
The evaluation of the seismic vulnerability of existing buildings has become a relevant issue in the last
decades due to the frequent occurrence of earthquakes, with an important number of losses in terms
of buildings and consequently, human lives. Unreinforced masonry buildings represent a significant
amount of the infrastructures in the earthquake-prone regions. On the other hand, they were designed
most of the time considering only gravity loads and they often present low ductility and lack of
connections between structural elements. Therefore, they are highly susceptible to damage from
earthquakes, even of low intensity. Within masonry structures, ancient monumental buildings
experienced the highest level of damage during the recent seismic events (Central Italy 2016, Nepal
2015, Northern Italy, 2012), which demonstrates the singular level of vulnerability of these structural
typologies. On the other hand, these buildings conserve a single value for social, historical and
architectonical reasons. Therefore, it emerges the urgent need for evaluating the seismic safety of
these structures.
The vulnerability assessment of existing buildings is a very complex task since their knowledge is
limited mainly regarding the material characterization, the actual geometry and the role of the different
components within the structure. This is true especially for ancient masonry buildings, which present a
relevant variety of typologies, and often experienced many transformations during their life. Therefore,
a big amount of uncertainties on their structural characteristics and material mechanical properties
exists. The reduction of these uncertainties can be achieved through in-situ and laboratory
investigations, which however may be limited, especially in the case of historical constructions.
Consequently, the evaluation of the seismic vulnerability requires a proper methodology able to take
into account the variability of the inherent uncertain parameters, which affect the seismic response of
the structure. Most of the current research demonstrates an increasing attention to the topic and
several European project [SYNER-G, 2009-2012], [PERPETUATE, 2010-2012] aim to develop an
efficient methodology, able to include the inherent probabilistic nature of the assessment procedure.
Several case studies have been elaborated in the last years aiming to assess the vulnerability of
ordinary masonry buildings, through the derivation of fragility functions. However, very few case
studies are available on the seismic vulnerability assessment of complex structural typologies in
historical constructions.
Vulnerability assessment of monumental masonry structures including uncertainty
Erasmus Mundus Programme
2 ADVANCED MASTERS IN STRUCTURAL ANALYSIS OF MONUMENTS AND HISTORICAL CONSTRUCTIONS
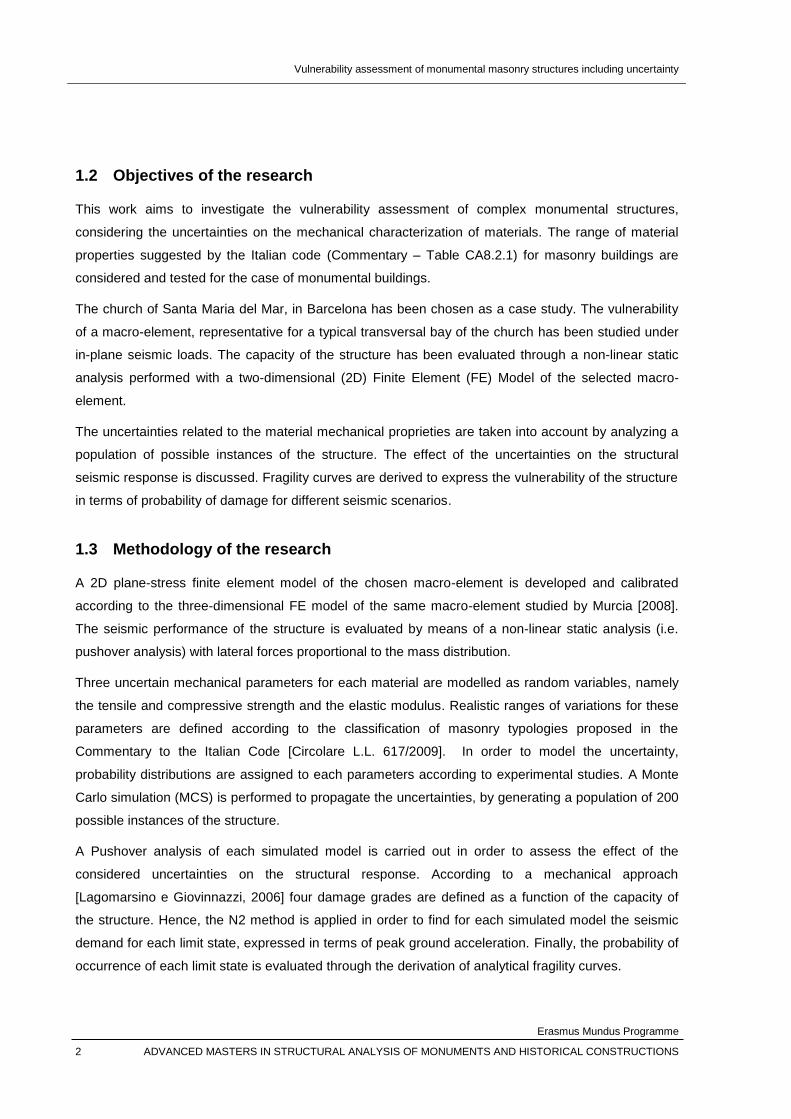
1.2 Objectives of the research
This work aims to investigate the vulnerability assessment of complex monumental structures,
considering the uncertainties on the mechanical characterization of materials. The range of material
properties suggested by the Italian code (Commentary – Table CA8.2.1) for masonry buildings are
considered and tested for the case of monumental buildings.
The church of Santa Maria del Mar, in Barcelona has been chosen as a case study. The vulnerability
of a macro-element, representative for a typical transversal bay of the church has been studied under
in-plane seismic loads. The capacity of the structure has been evaluated through a non-linear static
analysis performed with a two-dimensional (2D) Finite Element (FE) Model of the selected macro-
element.
The uncertainties related to the material mechanical proprieties are taken into account by analyzing a
population of possible instances of the structure. The effect of the uncertainties on the structural
seismic response is discussed. Fragility curves are derived to express the vulnerability of the structure
in terms of probability of damage for different seismic scenarios.
1.3 Methodology of the research
A 2D plane-stress finite element model of the chosen macro-element is developed and calibrated
according to the three-dimensional FE model of the same macro-element studied by Murcia [2008].
The seismic performance of the structure is evaluated by means of a non-linear static analysis (i.e.
pushover analysis) with lateral forces proportional to the mass distribution.
Three uncertain mechanical parameters for each material are modelled as random variables, namely
the tensile and compressive strength and the elastic modulus. Realistic ranges of variations for these
parameters are defined according to the classification of masonry typologies proposed in the
Commentary to the Italian Code [Circolare L.L. 617/2009]. In order to model the uncertainty,
probability distributions are assigned to each parameters according to experimental studies. A Monte
Carlo simulation (MCS) is performed to propagate the uncertainties, by generating a population of 200
possible instances of the structure.
A Pushover analysis of each simulated model is carried out in order to assess the effect of the
considered uncertainties on the structural response. According to a mechanical approach
[Lagomarsino e Giovinnazzi, 2006] four damage grades are defined as a function of the capacity of
the structure. Hence, the N2 method is applied in order to find for each simulated model the seismic
demand for each limit state, expressed in terms of peak ground acceleration. Finally, the probability of
occurrence of each limit state is evaluated through the derivation of analytical fragility curves.

Vulnerability assessment of monumental masonry structures including uncertainty
Erasmus Mundus Programme
ADVANCED MASTERS IN STRUCTURAL ANALYSIS OF MONUMENTS AND HISTORICAL CONSTRUCTIONS 3
1.4 Outline of the document
An overview of the state of knowledge and research on the seismic vulnerability assessment of
existing buildings is presented in chapter 2. First, the issue of the seismic risk and vulnerability
assessment is presented (sect. 2.1). Then, different typologies of uncertainties are listed (sect. 2.2).
The current code-based approach and the novel probabilistic approach based on fragility functions are
discussed respectively in sect. 2.3 and sect. 2.4. Hence, the general methodology proposed to
perform a seismic fragility assessment of the structure is presented, with specific reference to the
derivation of analytical fragility functions (sect.2.5). Finally, some considerations about the possible
probabilistic distribution to model material uncertainties are presented in sect. 2.6.
A brief description of the selected case study, i.e. Santa Maria del Mar church (Barcelona), is
presented in chapter 3. First, the geometry of the building is described (sect. 3.1). Second, structural
system and materials are presented (sect.3.2). Finally, some reference to previous case studies of the
building are listed in sect. 3.3.
In chapter 4, the numerical model of the structure is presented. First, the geometrical and material
properties of the model are described (sect. 4.1) and the finite element model is presented (sect. 4.2).
Then, the calibration of the 2D model basing on the 3D model, studied by Murcia [2008] is discussed
(sect.4.3). Finally, the results of the non-linear static analysis performed on the calibrated model are
presented (sect. 4.4).
The choices regarding the modelling of the uncertain parameters are presented in chapter 5. First, the
parameters modelled as uncertain variable are presented in section 5.1. Second, the ranges of
variation and the distribution assigned to the parameters are discussed in section 5.2. The stochastic
method applied to generate the population of numerical models is described in section 5.3. Finally the
numerical results for the reference model considering the mean of the selected parameters are
presented in section 5.4.
In chapter 6, the results of the probabilistic seismic assessment of the structure are presented and
discussed. First, the considered methodology is presented (section 6.1). Second, the results of the
non-linear static analysis are discussed (sections 6.2). Hence, the choice of the reference limit state is
explained and the N2 method is applied (sections 6.3-6.4). Finally, the derivation of fragility curves for
the structure is presented (section 6.5).
The conclusion of the research work are presented in chapter 7. First, a summary of the work is
proposed in sect. 7.1, hence the conclusions of the research work are discussed in sect. 7.2. Finally,
some proposals for further research works on the topic are presented (sect.7.3).

Vulnerability assessment of monumental masonry structures including uncertainty
Erasmus Mundus Programme
4 ADVANCED MASTERS IN STRUCTURAL ANALYSIS OF MONUMENTS AND HISTORICAL CONSTRUCTIONS

Vulnerability assessment of monumental masonry structures including uncertainty
Erasmus Mundus Programme
ADVANCED MASTERS IN STRUCTURAL ANALYSIS OF MONUMENTS AND HISTORICAL CONSTRUCTIONS 5
2. STATE OF THE ART
An overview of the state of knowledge on the seismic vulnerability assessment of existing buildings is
presented in this chapter. First, the issue of the seismic risk and vulnerability assessment is presented
(sect. 2.1). Then, different typologies of uncertainties are listed (sect. 2.2). The current code-based
approach and the novel probabilistic approach based on fragility functions are discussed respectively
in sect. 2.3 and sect. 2.4. Hence, the general methodology proposed to perform a seismic fragility
assessment of the structure is presented, with specific reference to the derivation of analytical fragility
functions (sect.2.5). Finally, some considerations about the possible probabilistic distribution to model
material uncertainties are presented in sect. 2.6.
2.1 Seismic risk and vulnerability assessment of masonry structures
The seismic risk is a probabilistic measure defined as the product of three factors: seismic hazard of
the site, seismic vulnerability of the existing structures and seismic exposition of the site. All of these
parameters are probabilistic measures. The seismic hazard is defined as the probability that in a
certain time t a seismic phenomenon with an intensity equal or higher to a certain value Sk occurs.
Hence, this parameter is a measure of the destructive potential of the seismic events, occurring in a
certain site. The second factor of risk refers to the existing building(s). It represent the probability of
occurrence of a certain damage grade for a given level of seismic intensity. Thus, this factor is strictly
dependent on the performance of the structure and on its state of maintenance. The last factor refers
to the potential social, economic and artistic loss expected for a given damage grade. Therefore, the
latter is related to the destination of use at the scale of the single building, to the density of the existing
buildings at the territorial scale and in any case to their historical and architectonical worth.
Since the seismic risk is defined as the product of the above-mentioned three factors, if one of those
factors is negligible, the risk assumes a very low value. On the other hand, if all the factors are
significant, the seismic risk is high. It is worth noticing that since it is not possible acting on the existing
hazard and exposition, a proper approach to assess and reduce the vulnerability of the existing
heritage is essential to reduce the seismic risk.
The evaluation of the vulnerability is an urgent problem for masonry buildings, which provide a very
low capacity against seismic loads, as shown by recent seismic events. However, this is a demanding
task due to the high number of uncertain parameters involved, regarding both structural characteristics
and material properties. This is true especially for masonry buildings, which present a significant
variety of construction typologies and composite materials. Moreover, the quality of masonry, thus the
seismic response, is related not only to the material itself, but also to the constructive details such as
dimension of the blocks, interlocking of the external leaves, and transversal connection through the
thickness. Many of these information result often unknown, thus a significant number of inherent

Vulnerability assessment of monumental masonry structures including uncertainty
Erasmus Mundus Programme
6 ADVANCED MASTERS IN STRUCTURAL ANALYSIS OF MONUMENTS AND HISTORICAL CONSTRUCTIONS
uncertainty is expected. Moreover, a better level of knowledge is very difficult to achieve because it
requires in-situ and laboratory investigations which are limited because of economic and preservation
reasons, especially in case of monumental structures.
2.2 Aleatoric and epistemic uncertainties
The recent Italian guidelines [CNR-DT 212/2013] distinguish two classes of uncertainties relevant in
case of existing buildings:
aleatoric uncertainties, due to the intrinsic variability of the structural parameters
(randomness).
epistemic uncertainties, due to incomplete knowledge of the structure
It is worth noticing that in the first case uncertainties cannot be reduced. Whereas, epistemic
uncertainties are in principle reducible if a better knowledge is achieved.
Looking at the problem of the seismic risk assessment, two relevant main factors are affected by
aleatoric uncertainty, namely the material proprieties, affecting the vulnerability of the structure and the
seismic intensity, related to the hazard assessment. The main source of aleatoric uncertainty is the
randomness of material properties. It is worth noticing that the variability of materials is an inherent
characteristic of both new and existing structures. Although each structural element is indeed
designed to guarantee a certain resistance, in fact a punctual variation of the actual properties occurs
within the structure. Therefore, a deterministic characterization of materials is never achievable in
practice. Similarly, both the seismic intensity level and the time history for a given seismic intensity are
affected by aleatoric uncertainty because of their dependence on random phenomena.
In case of existing buildings, an additional source of uncertainty is due to the impossibility to achieve a
complete knowledge of the building regarding both geometry and materials (epistemic uncertainty).
This is true especially for ancient constructions, which present various typologies, differing for both
materials and constructive details. Due to these uncertainties, the definition of a realistic structural
model results very difficult so that in the common practice several assumption are made, affecting the
objectivity of the evaluation.
Moreover, even with the same amount of information about the structure, different modelling choices
and a different analytical method can be adopted to predict the seismic response. These choices are
strictly depending on professional experience, knowledge and sensitivity. Thus, they represent
subjective factors that induce additional epistemic uncertainties. Within these choices, it can be
considered the definition of limit states thresholds, because of the possibility to choose the reference
thresholds between different available methods.
Vulnerability assessment of monumental masonry structures including uncertainty
Erasmus Mundus Programme
ADVANCED MASTERS IN STRUCTURAL ANALYSIS OF MONUMENTS AND HISTORICAL CONSTRUCTIONS 7
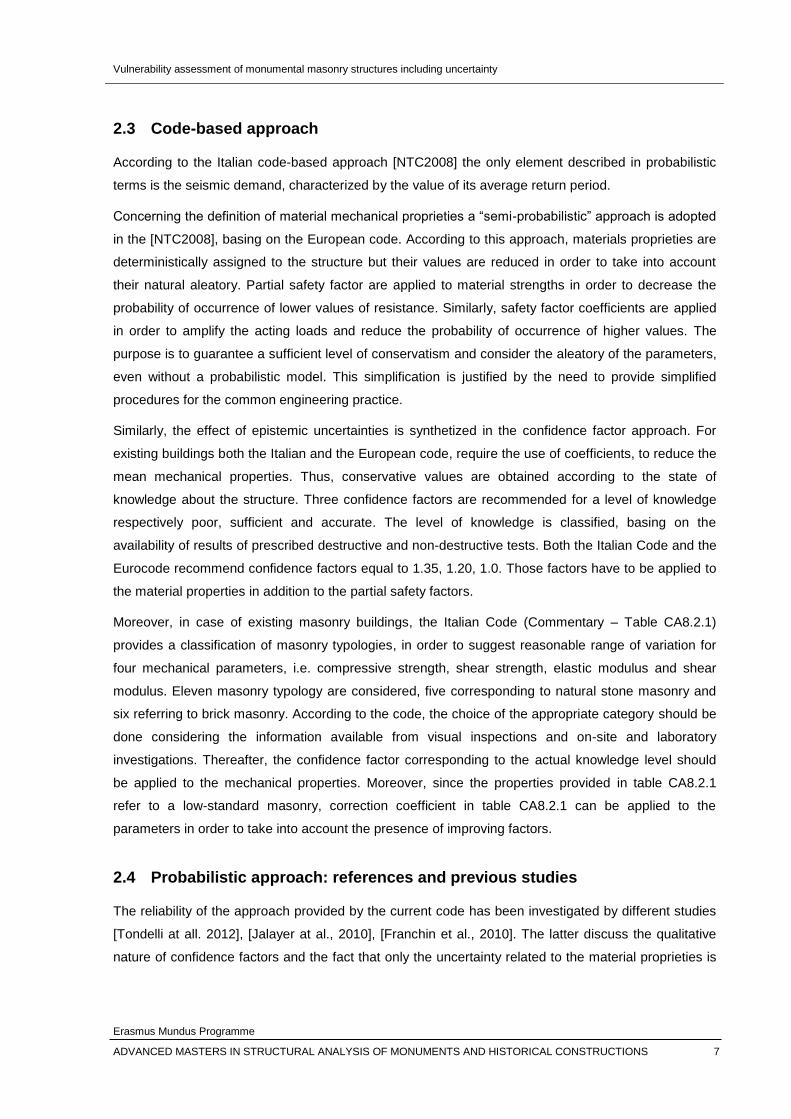
2.3 Code-based approach
According to the Italian code-based approach [NTC2008] the only element described in probabilistic
terms is the seismic demand, characterized by the value of its average return period.
Concerning the definition of material mechanical proprieties a “semi-probabilistic” approach is adopted
in the [NTC2008], basing on the European code. According to this approach, materials proprieties are
deterministically assigned to the structure but their values are reduced in order to take into account
their natural aleatory. Partial safety factor are applied to material strengths in order to decrease the
probability of occurrence of lower values of resistance. Similarly, safety factor coefficients are applied
in order to amplify the acting loads and reduce the probability of occurrence of higher values. The
purpose is to guarantee a sufficient level of conservatism and consider the aleatory of the parameters,
even without a probabilistic model. This simplification is justified by the need to provide simplified
procedures for the common engineering practice.
Similarly, the effect of epistemic uncertainties is synthetized in the confidence factor approach. For
existing buildings both the Italian and the European code, require the use of coefficients, to reduce the
mean mechanical properties. Thus, conservative values are obtained according to the state of
knowledge about the structure. Three confidence factors are recommended for a level of knowledge
respectively poor, sufficient and accurate. The level of knowledge is classified, basing on the
availability of results of prescribed destructive and non-destructive tests. Both the Italian Code and the
Eurocode recommend confidence factors equal to 1.35, 1.20, 1.0. Those factors have to be applied to
the material properties in addition to the partial safety factors.
Moreover, in case of existing masonry buildings, the Italian Code (Commentary – Table CA8.2.1)
provides a classification of masonry typologies, in order to suggest reasonable range of variation for
four mechanical parameters, i.e. compressive strength, shear strength, elastic modulus and shear
modulus. Eleven masonry typology are considered, five corresponding to natural stone masonry and
six referring to brick masonry. According to the code, the choice of the appropriate category should be
done considering the information available from visual inspections and on-site and laboratory
investigations. Thereafter, the confidence factor corresponding to the actual knowledge level should
be applied to the mechanical properties. Moreover, since the properties provided in table CA8.2.1
refer to a low-standard masonry, correction coefficient in table CA8.2.1 can be applied to the
parameters in order to take into account the presence of improving factors.
2.4 Probabilistic approach: references and previous studies
The reliability of the approach provided by the current code has been investigated by different studies
[Tondelli at all. 2012], [Jalayer at al., 2010], [Franchin et al., 2010]. The latter discuss the qualitative
nature of confidence factors and the fact that only the uncertainty related to the material proprieties is

Vulnerability assessment of monumental masonry structures including uncertainty
Erasmus Mundus Programme
8 ADVANCED MASTERS IN STRUCTURAL ANALYSIS OF MONUMENTS AND HISTORICAL CONSTRUCTIONS
considered, neglecting the other sources of uncertainties, able to affect the response of the structure
(sect 2.2).
Moving from the evidence of a severe damage experienced by masonry buildings during past and
recent earthquakes, several European projects [RISK-UE, 2001-2004], [SYNER-G, 2009-2012],
[PERPETUATE, 2010-2012], demonstrate an increasing attention to the problem of the risk evaluation
both at the territorial scale and at the building scale. A common concern is the development of an
assessment methodology able to take properly into account the probabilistic nature of the involved
parameters. To this purpose several approaches have been proposed, which differ both for
methodology and for the analytical procedure which is adopted.
According to the developing probabilistic approach, the seismic performance of the structure is
assessed by means of fragility functions. Moving from the probabilistic definition of risk, they express
the probability of occurrence of a certain damage grade for each level of seismic intensity (Figure 2.
1).
Figure 2. 1 – Fragility curves (a) and damage state distribution (b) [Lagomarsino et al., 2014]
In [SYNER-G] several method are presented to derive fragility functions. They can be grouped into
four general categories: empirical, expert elicitation, analytical and hybrid (combination of different
types).
Empirical fragility functions (Figure 2. 2 – left) are derived considering the damage observed in
buildings during post-earthquake surveys, while expert elicitation fragility curves are based on expert
opinion. Both these approach provide fragility models based on real observed data, directly correlated
with the actual seismic behavior of the building. Therefore, they result useful to calibrate fragility
curves derived by analytical models [Cattari, 2014] as well as to assess the vulnerability at a territorial
scale. However, the use of existing fragility curves has to be made carefully, since their formulation is
strictly related to the observed typology of buildings. Moreover, in case of the expert judgment
functions, they depend considerably on knowledge and engineering experience.
Conversely, analytical fragility curves (Figure 2. 2 - right) are derived by evaluating the damage
distribution through analytical simulation of the seismic response of the structure. In this case,

Vulnerability assessment of monumental masonry structures including uncertainty
Erasmus Mundus Programme
ADVANCED MASTERS IN STRUCTURAL ANALYSIS OF MONUMENTS AND HISTORICAL CONSTRUCTIONS 9
numerical models are needed. The advantage of this method is that it keeps explicitly into account the
parameters that define the structural response of the structure, thus it allows a better control of the
associated uncertainties. For this reason, several studies propose the use of analytical fragility
function, especially at the scale of the single building, applying both simplified [Pagnini et al., 2011]
and complex [Rota et al., 2010] analytical models. Recent European projects [PERPETUATE 2010-
2012], [SYNER-G 2009-2012], [PERPETUATE 2010-2012] propose the performance point based
approach in the form of Capacity Spectrum Method [Freeman, 1998] or N2 method [Fajfar, 2000] to
develop analytical fragility curves for historical masonry structures.
Figure 2. 2 – Empirical fragility curves in terms of macroseismic intensity (left) and analytical fragility curves in terms of PGA (right) [Lagomarsino et al., 2014]
Two distinct approaches have been proposed in framework of RISK-UE project for the vulnerability
assessment of existing buildings, namely macroseismic method and mechanical method. The
macroseismic method is an expert elicitation method, which propose a vulnerability function related to
the building typology and the seismic input intensity. The latter is defined in terms of macroseismic
intensity, according to the macroseismic scale EMS-98 [Grunthal, 1998]. Conversely, the mechanical
method is an analytical method. Analytical fragility functions are derived, computing the probability of
exceeding each damage threshold, using a lognormal cumulative probability function as proposed in
[HAZUS, 1999].
The recent Italian guidelines CNR-DT 212/2013 present an organic methodology for the probabilistic
vulnerability assessment of existing concrete and masonry buildings, basing on all the scientific
studies developed in the last decades. To this aim the seismic risk evaluation is achieved by the
computation of the mean annual frequency of exceeding given limit states. The latter is a scalar
quantity, obtained by the probabilistic convolution of the three factors of risk, i.e. hazard, vulnerability
and exposure as discussed in [Jaladyer at al, 2007]. The document suggests the derivation of
analytical fragility curves in function of mean and dispersion of the considered uncertain parameters.
Three analytical method are proposed, with a different computational cost, namely dynamic analysis,
incremental dynamic analysis and Capacity Spectrum Method. The latter is suggested for masonry
ordinary buildings. The general methodology for the seismic fragility assessment presented in sect.

Vulnerability assessment of monumental masonry structures including uncertainty
Erasmus Mundus Programme
10 ADVANCED MASTERS IN STRUCTURAL ANALYSIS OF MONUMENTS AND HISTORICAL CONSTRUCTIONS
2.5, on the base of the available studies, is in agreement with the procedure suggested by [CNR-DT
212/2013].
2.5 General methodology proposed for a seismic fragility assessment
As already mentioned, analytical fragility curves are useful to express the vulnerability at the scale of a
single building. Different case studies use an analytical approach taking into account several sources
of uncertainties. The effect of the variation of material mechanical properties has been assessed in
[Petromichelakis et al, 2014] and [Rota et al, 2010], while uncertainties related both to the material
parameters, seismic demand and error in the capacity models are considered in [Pagnini, 2011].
Basing on the available studies, a summary of the procedure for an analytical derivation of fragility
curves is proposed, considering the uncertainties regarding the definition of material properties are
considered. The basic step can be summarized as follows:
Analysis of available data and definition of uncertain parameters
Modelling of the uncertain parameters using probabilistic distributions
Simulation of possible instances of the structure
Evaluation of the structural capacity
Statistical analysis of results for each limit state
Derivation of analytical fragility curves for each limit state
First, an analysis of the available data about the structure is needed. In order to reduce the number of
variables, the uncertain factors should be chosen by means of a sensitivity analysis, useful to select
the geometrical and mechanical parameters that mostly affect the seismic response of the building.
Hence, realistic range of variation are defined for each factor on the base of available experimental
data regarding the considered structural typology.
Uncertainties related to material mechanical properties can be modelled as random variables, using a
continuous probabilistic density function (PDF), which is assigned to each variable on the base of
experimental results and information provided by the literature. Some consideration regarding the
choice of the probabilistic distribution, which can be adopted for masonry are presented in sect.2.6
The effect of the uncertainties on the seismic response of the structure can be evaluated by means of
a stochastic simulation, performed in order to generate N model representative of possible instances
of the same structure. To this purpose different methods are available. Monte Carlo Simulation (MCS)
is the most popular method, which proposed in several case studies [Singhal et al.,1996], [Dymiotis et
al., 1999], [Rota et al., 2010] as well as suggested in [CNR-DT 212/2013]. MCS can be employ in
order to generate N random combination of the input variables, varying according to selected range of
variation and probability distribution.

Vulnerability assessment of monumental masonry structures including uncertainty
Erasmus Mundus Programme
ADVANCED MASTERS IN STRUCTURAL ANALYSIS OF MONUMENTS AND HISTORICAL CONSTRUCTIONS 11
An analytical simulation of each model is performed in order to assess the effect of the considered
uncertainties on the structural capacity. To this aim several analytical approaches are suggested,
varying both for accuracy and computational cost. In [SYNER-G] and [CNR-DT 212/2013] three
analytical method are proposed, namely the capacity spectrum Method, The Dynamic Analysis and
the novel Incremental Dynamic Analysis (IDA). As an output of the analysis, the parameters
representative of the structural demand and capacity are obtained for selected levels of damage. For
each parameter N values are found, one for each simulated model.
Figure 2. 3 – Capacity curves (right) and output variables distributions (left) obtained by applied the N2 method [Petromichelakis et al, 2014]
Finally, fragility analytical function can be evaluated as a function of each output variable of capacity or
demand. Generally, it is accepted the fragility of the structure can be considered using a lognormal
cumulative density function, expressed by the equation (1)
i
ii
ZZFZLSiP
/ln)(]|[ (1)
Fi(Z) is the conditional probability that the structure will reach the considered limit state LS i. Z
represent the demand parameter, i.e. the seismic intensity, while Φ expresses the standard normal
(Gaussian) probability distribution function.
Equation (1) expresses the probability of occurrence of assigned grade of damage Lsi for each
seismic intensity level (Z). It is worth to note that according to the selected analytical method,
analytical fragility curves can be plotted both in function of an intensity measure, e.g. PGA, Sa(T)
(direct approach), and in function of a structural response parameters, e.g. the spectral displacement
(indirect approach).
Vulnerability assessment of monumental masonry structures including uncertainty
Erasmus Mundus Programme
12 ADVANCED MASTERS IN STRUCTURAL ANALYSIS OF MONUMENTS AND HISTORICAL CONSTRUCTIONS
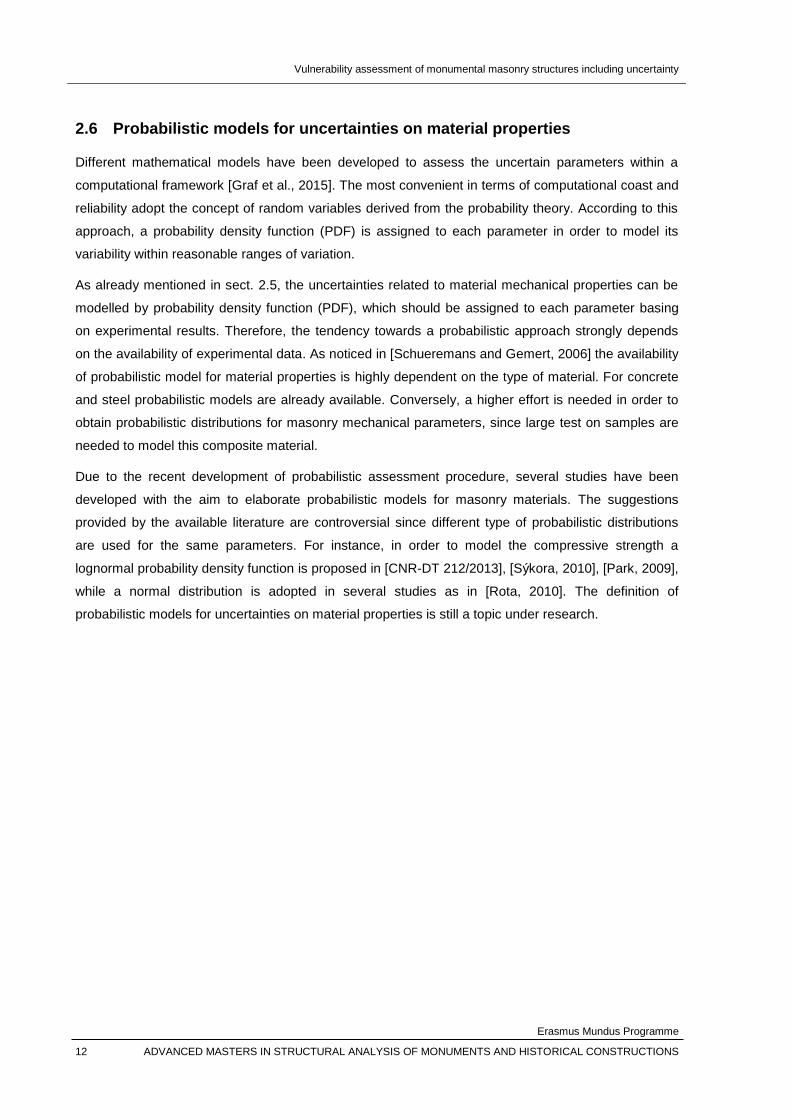
2.6 Probabilistic models for uncertainties on material properties
Different mathematical models have been developed to assess the uncertain parameters within a
computational framework [Graf et al., 2015]. The most convenient in terms of computational coast and
reliability adopt the concept of random variables derived from the probability theory. According to this
approach, a probability density function (PDF) is assigned to each parameter in order to model its
variability within reasonable ranges of variation.
As already mentioned in sect. 2.5, the uncertainties related to material mechanical properties can be
modelled by probability density function (PDF), which should be assigned to each parameter basing
on experimental results. Therefore, the tendency towards a probabilistic approach strongly depends
on the availability of experimental data. As noticed in [Schueremans and Gemert, 2006] the availability
of probabilistic model for material properties is highly dependent on the type of material. For concrete
and steel probabilistic models are already available. Conversely, a higher effort is needed in order to
obtain probabilistic distributions for masonry mechanical parameters, since large test on samples are
needed to model this composite material.
Due to the recent development of probabilistic assessment procedure, several studies have been
developed with the aim to elaborate probabilistic models for masonry materials. The suggestions
provided by the available literature are controversial since different type of probabilistic distributions
are used for the same parameters. For instance, in order to model the compressive strength a
lognormal probability density function is proposed in [CNR-DT 212/2013], [Sýkora, 2010], [Park, 2009],
while a normal distribution is adopted in several studies as in [Rota, 2010]. The definition of
probabilistic models for uncertainties on material properties is still a topic under research.

Vulnerability assessment of monumental masonry structures including uncertainty
Erasmus Mundus Programme
ADVANCED MASTERS IN STRUCTURAL ANALYSIS OF MONUMENTS AND HISTORICAL CONSTRUCTIONS 13
3. CASE STUDY: SANTA MARIA DEL MAR CHURCH
The case study of Santa Maria del Mar in Barcelona has been considered. Many information are
available regarding the structural system and materials. [Vendrell et al., 2007] carried out a detailed
study on the morphology of the structure, by means of bibliographical research, inspections, non-
destructive techniques and coring. Through the study, it has been possible to gain detailed information
about structural elements and materials. In this chapter a brief description of the case study is
presented. First, the geometry of the building is described (sect. 3.1). Second, structural system and
materials are presented (sect.3.2). Finally, some reference to previous case studies of the building are
listed in sect. 3.3.
3.1 Geometrical description of the building
Santa Maria del Mar church stands in Barcelona, in the Ribera district. The construction of the church
began in 1329 and it was built during a period of only 53 years.
The building is almost 85 meters long and 35.30 meters wide, presenting a maximum height of 34
meters. The structure present a symmetrical plan with respect with the longitudinal axis, oriented along
the south-north direction. The body of the church is composed of three longitudinal naves, covered by
cross vaults, and a semicircular apse, placed in the Northern part of the building. The church present
four entrances, one for each side and the main one located in correspondence with the southern
façade. The latter present one bell tower for each side. Above the big portal, 12 meters height, a rose
window with a diameter of 9 meters is placed.
Figure 3. 1 - Esternal view of the church from the Eastern side
The external walls extend in three main levels. The first level corresponds with the height of the lateral
small chapels equal to 16 meters. The roof above the lateral chapels (Figure 3. 2) was designed as a
terrace that can be used for the circulation of people. The second level extends for the whole lateral
naves height. The roof above the lateral naves (Figure 3. 3) is composed of tiles and its slope allows
the water drainage. Triangular walls aligned with the buttress, having both a structural and drainage
function, interrupt the roof. The third and last level of the external wall (Figure 3. 4) reaches the top of

Vulnerability assessment of monumental masonry structures including uncertainty
Erasmus Mundus Programme
14 ADVANCED MASTERS IN STRUCTURAL ANALYSIS OF MONUMENTS AND HISTORICAL CONSTRUCTIONS
the building. At this level, the roof covers the central nave and it is inclined to four sides, assuming
slopes that follow the cross vaults shapes.
Figure 3. 2 – Roof level above the chapels
Figure 3. 3 – Roof level above the lateral naves
Figure 3. 4 – Roof level above the central nave
Inside the church, octagonal slender columns 26 meters high, sustain cross vaults. Four vaults,
spanning 13.5 m in both direction, cover the central nave, dividing the body of the church in four
transversal sections. The central cross vaults (Figure 3. 6) are surrounded by diaphragmatic arches,
which consists in vertical walls of load - bearing masonry, reaching the top of the building. This system
was used in the past to support the provisional roof of the church. The transversal diaphragmatic
arches ensure also a structural function, being aligned with the lateral buttresses. Smaller rectangular
cross vaults (Figure 3. 7), having half span of the central ones in the transversal direction, cover the
symmetric lateral naves of the church. Their height is almost equal to that of the central vaults, i.e. 32
meters, being designed in order to receive the lateral thrust of the central vaults and transfer it

Vulnerability assessment of monumental masonry structures including uncertainty
Erasmus Mundus Programme
ADVANCED MASTERS IN STRUCTURAL ANALYSIS OF MONUMENTS AND HISTORICAL CONSTRUCTIONS 15
properly to the lateral buttresses so that flying arches are not needed. Finally, the semicircular apse is
covered with a different vault, presenting a palm shape.
Figure 3. 5 – View of the interior of the church
Figure 3. 6 – Square cross vault at the central nave
Figure 3. 7 – Rectangular cross vault at the lateral nave
3.2 Structural system and material
Information regarding the constructive system of the church have been acquired through a detailed
test campaign performed on site by Vendrell et all. [2007].
The vertical bearing elements in the structure are walls and columns. Walls and buttresses are three-
leaf elements as it is possible to see from the holes made by bombing during the 1714 and 1936 wars
(Figure 3. 8). Their external leaves are made of ashlar masonry and the infill made of irregular rubble
masonry, coming from the Montjϋic quarries. The joints are made by lime mortar. Performing the
seismic tomography test [Vendrell et al., 2007], it has been possible to identify the section of the
slender octagonal columns, having a diameter of 1.6 meters (Figure 3. 9). Due to the big dimensions
of the stones, the thin layers of mortar and the massif condition of the pier, they are supposed to have
a higher stiffness and strength than the rest of masonry elements of the structure.

Vulnerability assessment of monumental masonry structures including uncertainty
Erasmus Mundus Programme
16 ADVANCED MASTERS IN STRUCTURAL ANALYSIS OF MONUMENTS AND HISTORICAL CONSTRUCTIONS
Figure 3. 8 – External wall
Figure 3. 9 – Pier base
The vaults are made of blocks around 20cm thick. The lateral vaults present a supplementary layer of
load-carrying material made by rubble masonry linked with lime mortar (creating a medieval concrete).
Whereas, the central vault presents a light infill made by ceramic pieces, which is 0.7 to 1m thick
(Figure 3. 10). The different morphology of central and lateral vaults is due to structural reasons. The
light infill in the central vault reduces the vertical load carried by the piers and the thrust that the
buttresses need to counteract. On the other hand, the later vaults present load-carrying infill since they
transfer the thrust of the central vault to the buttress, assuming a structural function is similar to a
flying arch. This is also the reason of the significant height of the lateral vaults, which is almost equal
to that of the central vault.
Figure 3. 10 – Pottery filling over the central vault

Vulnerability assessment of monumental masonry structures including uncertainty
Erasmus Mundus Programme
ADVANCED MASTERS IN STRUCTURAL ANALYSIS OF MONUMENTS AND HISTORICAL CONSTRUCTIONS 17
3.3 Previous studies
Several previous studies investigate the seismic performance of Santa Maria del Mar. Within the
RISK-UE project, Irizarry [2004] studied a transversal section of the church, evaluating the structural
capacity with two different approaches: Equilibrium Limit Analysis and Finite Elements Analysis (FEA).
In the framework of an inter-disciplinary study done to assess the structural condition of the church,
Roca [2007] carries out a similar analysis, studying in addition the seismic performance of other
macro-elements of the church (façade, tower). [Murcia, 2008] investigated the seismic performance of
a macro-element representing a transversal bay of the church. A Finite Elements 3D model of the
macro-element was studied by performing a non-linear static analysis and applying the Capacity
Spectrum Method to evaluate the expected damage of the structure.

Vulnerability assessment of monumental masonry structures including uncertainty
Erasmus Mundus Programme
18 ADVANCED MASTERS IN STRUCTURAL ANALYSIS OF MONUMENTS AND HISTORICAL CONSTRUCTIONS

Vulnerability assessment of monumental masonry structures including uncertainty
Erasmus Mundus Programme
ADVANCED MASTERS IN STRUCTURAL ANALYSIS OF MONUMENTS AND HISTORICAL CONSTRUCTIONS 19
4. NUMERICAL MODEL
In this chapter, the two-dimensional numerical model is described and the calibration of the model is
presented. A macro-element representative for the seismic behavior of the building in the transversal
direction has been considered. The analysis has been carried out on a 2D plane-stress finite elements
model (FEM). It has been calibrated according to the three-dimensional FE model of the same macro-
element studied by Murcia [2008], by ensuring the same weight for all the structural members and
equal deformed shapes after linear-static analysis. The seismic performance of the macro-element
has been evaluated by means of a non-linear static analysis (i.e. pushover analysis) with lateral forces
proportional to the mass distribution. First, the characteristics of the two-dimensional model are
presented (Section 4.1 and 4.2). Second, the calibration of the model is described, presenting the
comparison between the results of the linear static analysis for the two models (Section 4.3). Finally,
the results of the non-linear static analysis for the 2D-model are presented and discussed (Section
4.4). The FEA of the model has been performed using the software DIANA FEA v.10.1.
4.1 Geometry and material properties
A representative macro-element has been considered, namely a typical transversal bay of the church
(Figure 4. 1) in order to study the behavior of the structure in its transversal direction, under in plane
loads. Indeed the uniform design of the church causes a uniform response of the structure in the
transversal direction as the experimental modal analysis [Roca, 2007] also proves. Therefore, a typical
transversal section can be considered representative to study the in-plane response of the structure in
the transversal direction.
Figure 4. 1 – Representative macro-element for a typical transversal bay of the church
The two-dimensional numerical model of the selected macro-element has been analyzed using the
software DIANA FEA v.10.1. The geometry of the model has been created according to the existing
geometrical survey [Vendrell et al., 2007]. First, one quarter of the bay has been considered, defining
the proper boundary conditions in order to take into account the symmetric part. Then, the whole bay
has been modelled in order to assess its lateral capacity.
The material properties for each structural and non-structural element have been defined according to
[Murcia, 2008], where available data from previous studies on the church [Vendrell et al, 2007] have

Vulnerability assessment of monumental masonry structures including uncertainty
Erasmus Mundus Programme
20 ADVANCED MASTERS IN STRUCTURAL ANALYSIS OF MONUMENTS AND HISTORICAL CONSTRUCTIONS
been considered. Figure 4. 2 presents the material distribution of the two-dimensional model. Six
distinct materials have been modelled. A common material has been defined for the external leaf of
the three-leaf walls and for the diaphragmatic arches supporting the vaults. In order to simulate the
three-dimensional three-leaf walls a new material has been defined, with homogenized mechanical
properties between the external wall-leaves and the rubble masonry wall - infill of the wall. This choice
has been done in order to have a more realistic representation of the buttress in the 2D model.
Regarding the vaults, a common material has been defined for the ribs, with the same mechanical
properties of the external leaf of the walls. Two distinct infill have been defined for the central vault; a
heavy infill and a light infill, presenting the same strength and elastic modulus but different densities.
Whereas, a heavy type of infill has been considered for lateral vaults and chapels. Better material
properties have been assigned to the columns, considering the monolithic character and the high
quality of the used stones, detected by means of seismic tomography [Murcia, 2008]. The value of
both tensile and compressive fracture energy have been assumed according to [Murcia, 2008].
The tile roof has been included in the model as a distributed loading on the top of the central and the
lateral vaults. Dead loads of 228 kN, 25 kN and 105 kN have been evaluated respectively for the roof
above the central vault, the lateral vault and the lateral chapel. Therefore, an equivalent distributed
load of 5070 N/m2, 623 N/m2 and 5835 N/m2 has been applied respectively in each case.
Material
1 Vaults
2 Columns
3 One leaf walls
4 Three leaf-walls
5 Heavy infill of the vaults
6 Light infill of the vaults
Figure 4. 2 – Distribution of different materials in the 2D numerical model

Vulnerability assessment of monumental masonry structures including uncertainty
Erasmus Mundus Programme
ADVANCED MASTERS IN STRUCTURAL ANALYSIS OF MONUMENTS AND HISTORICAL CONSTRUCTIONS 21
Table 4. 1 - Mechanical properties of materials according to [Murcia, 2008]
Material ρ (kg/m3) E (MPa) ν ft fc
1 Vaults 2200 8000 0.3 0.4 8.0
2 Columns 2200 4000 0.3 0.6 8.0
3 One leaf walls 2200 12000 0.3 0.4 4.0
4 Three leaves walls 2200 6000 0.3 0.3 6.0
5 Heavy infill of the vaults 2200 4000 0.3 0.2 4.0
6 Light infill of the vaults 200 1000 0.3 0.2 4.0
4.2 Finite element model
Once the geometry and the properties of the reference 2D – model are defined, the finite element
mesh has been generated for the structure. Regular plane-stress elements have been chosen in order
to be able to modify their thickness to calibrate the two-dimensional model basing on the response of
the three-dimensional finite element model.
Figure 4. 1 presents the finite element mesh for the model. An average element - size of 0.20 m has
been chosen, refined to 0.10 m in correspondence with lateral and central vaults and to 0.05 m for the
vault of the lateral chapels in order to ensure at least three elements for the rib thickness. Moreover,
the element size is refined near curvatures, in the areas of union of different structural elements.
Figure 4. 3 - Finite element mesh
The mesh is composed by 37780 triangular 3-nodes elements (element type T6MEM) and 17749
nodes. The thickness of the mesh elements has been set by calibrating the two-dimensional model on

Vulnerability assessment of monumental masonry structures including uncertainty
Erasmus Mundus Programme
22 ADVANCED MASTERS IN STRUCTURAL ANALYSIS OF MONUMENTS AND HISTORICAL CONSTRUCTIONS
the three-dimensional one [Murcia, 2008]. The description of the calibration method is presented in the
following section 4.3.
4.3 Calibration of the 2D model: self-weight analysis and linear static analysis
The calibration of the two-dimensional model has been done following the approach used in
[Clemente, 2007].In order to ensure a realistic response of the 2D model, it has been calibrated to
present the same stiffness of the corresponding three-dimensional model [Murcia, 2008]. To this aim,
the thickness of the mesh elements has been defined, following two criteria:
Equal weight for different structural members
Equivalent deformed shapes after liner static analysis, performed both under the only self-
weight and under self-weight and lateral loads proportional to the mass, i.e. equivalent
seismic acceleration equal to 1g.
In order to ensure a constant weight, the two-dimensional geometrical model has been subdivided in
structural elements according to the three-dimensional geometry. The self-weight of each three-
dimensional member has been computed and assigned to the corresponding in the two-dimensional
model. Hence the thickness of each element has been properly modified in order to maintain constant
the weight of each single members, and thus of the total structure. The number of elements having a
different thickness has been calibrated in order to reduce the computational cost. Finally, eleven
different equivalent structural members has been considered. Figure 5. 1 presents the
correspondence between the equivalent elements for the two models.
Figure 5. 1 – Equivalent structural members between 3D (left) and 2D (right) structural models
After a first calibration based on the comparison of the self-weight, a linear static analysis of the
provisional 2D model has been performed. Because of the symmetry, one fourth of the original macro-
element has been considered under self-weight. The results in terms of total displacements have been

Vulnerability assessment of monumental masonry structures including uncertainty
Erasmus Mundus Programme
ADVANCED MASTERS IN STRUCTURAL ANALYSIS OF MONUMENTS AND HISTORICAL CONSTRUCTIONS 23
compared with the corresponding for the 3D model in order to test the equivalence of the two models
in terms of deformed shapes under self-weight. Hence, the thickness of some elements has been
calibrated in order to ensure equal deformed shapes between the two models as well as minimize the
differences in the total displacements. In this case, the density of the corresponding material has been
modified as well, in order to maintain constant the original weight of the element. Figure 4. 4 presents
the deformed shape obtained for the 2D – model, compared to the corresponding for the three-
dimensional model in terms of total displacements [m].
2D model
3D model (Murcia,2008)
Figure 4. 4 – Comparison between two-dimensional and three-dimensional model. Linear static analysis under self-weight. Total displacements
Thereafter, in order to ensure the same lateral stiffness with the original three-dimensional model an
additional calibration criterion has been decided requiring the comparison of the deformed shapes
under lateral forces representative for a seismic load proportional to the mass, i.e. equal to 1 [g]. In
order to determine the response to the lateral load the entire transversal macro-element has been
considered. Hence, the geometrical thickness has been adjusted in order to ensure the equivalence of
lateral displacements in addition to the previous requirements. The comparison between the two
models is presented in Figure 4. 5 in terms of total displacements.
The calibration process results in an iterative modification of the geometrical thickness for the 11
members identified as well as a modification of their density, in order to maintain a constant weight.
Table 4. 2 summarizes the equivalent thickness obtained for each structural member, at the end of the
calibration procedure.

Vulnerability assessment of monumental masonry structures including uncertainty
Erasmus Mundus Programme
24 ADVANCED MASTERS IN STRUCTURAL ANALYSIS OF MONUMENTS AND HISTORICAL CONSTRUCTIONS
2D model
3D model (Murcia,2008)
Figure 4. 5 - Comparison between two-dimensional and three-dimensional model. Linear static analysis under self-weight and lateral equivalent acceleration (1 g). Total displacements.
Table 4. 2 - Geometrical thickness for different structural elements adopted in the final 2D model
id. element thickness
(m)
1 Lateral wall 3.70
2 Buttress 0.35
3 Lateral chapel - vault 4.93
4 Lateral chapel – transversal wall 1.45
5 Lateral chapel – external wall 3.80
6 Triangular buttress 0.30
7 Lateral vault 3.80
8 Clerestory 3.40
9 Central vault 2.10
10 Column/clerestory 0.65
11 Column 0.61

Vulnerability assessment of monumental masonry structures including uncertainty
Erasmus Mundus Programme
ADVANCED MASTERS IN STRUCTURAL ANALYSIS OF MONUMENTS AND HISTORICAL CONSTRUCTIONS 25
Moreover, a modal analysis has been carried out on the calibrated model. The principle modes of
vibration in the X in-plane direction have been considered and compared with the corresponding
obtained for the 3D model (Table 4. 3 and Table 4. 4). As in the case of the three-dimensional model,
the fundamental mode of vibration results in the X in-plane direction (Table 4. 3).
It is worth noticing that the obtained results in terms of eigen-frequencies and participation masses are
in good agreement with those obtained for the 3D model by Murcia [2008] as well as to the available
experimental results[Roca, 2007]. An eigen-frequency of 1.39 Hz has been found for the 1st mode,
which presents a significant contribution in terms of participation mass, equal to 71%. The comparison
between the two models is presented in Figure 4. 6 in terms of modal shapes (1st mode of vibration).
Table 4. 3 – Fundamental mode of vibration of the typical bay (X direction)
Mode 1
(X direction)
2Dmodel 3Dmodel Experimental
Eigen-frequency 1.39 1.43 1.45
Part. Mass X 70.8% 73.5%
Table 4. 4 - 4th mode of vibration of the typical bay (X direction)
Mode 4
(X direction)
2Dmodel 3Dmodel
Eigen-frequency 7.08 6.7
Part. Mass X 9.7% 9.6%
2D model
3D model
Figure 4. 6 - Comparison of 2D and 3D model. Natural shapes for the fundamental mode of vibration (X direction)

Vulnerability assessment of monumental masonry structures including uncertainty
Erasmus Mundus Programme
26 ADVANCED MASTERS IN STRUCTURAL ANALYSIS OF MONUMENTS AND HISTORICAL CONSTRUCTIONS
4.4 Non-linear static analysis and damage pattern
Once the model has been calibrated, a non-linear static analysis of the representative bay under in-
plane lateral loads has been performed. A total strain based smeared cracking model has been
chosen to simulate the non-linear behavior of masonry [Rots, 1985]. The latter bases on a smearing
cracking approach, with a distinct representation of damage in tension and compression. The
hypothesis of a crack orientation that rotates with the axis of principal strain has been considered.
Therefore, the stress-strain relations are evaluated in the principle direction of the strain vector. For
tension, an exponential softening model has been used, while a parabolic constitutive model has been
considered to simulate the non-linear behavior in compression (Figure 4. 7 ). Both constitutive models
are based on fracture energy.
Table 4. 5 – Type of modelling used for the non-linear static analysis
Type of model Smeared cracking model - Total strain based crack model
Crack orientation Rotating
Constitutive law Tension Exponential
Compression Parabolic
In order to compare the results of the non-linear analysis with those obtained for the three-dimensional
model, the non-linear properties have been assumed equal to those considered in [Murcia, 2008]
(Table 4. 1). Both physical and geometrical non-linearity has been considered, using for the latter a
Total Lagrange description, available in the software DIANA FEA.
Figure 4. 7 - Constitutive models assumed for tension (a) and compression (b)
First, a non-linear analysis under gravitational loads has been performed. As shown in Figure 4. 8,
tensile damage is expected already under gravitational loads at the corner of the triangular buttress,
above the lateral vaults in agreement with the tensile strain concentration (Figure 4. 9).
To have an idea of the safety margin existing for gravitational load, a maximum load factor of 3.17 has
been found. Thus, the structure is expected to collapse for almost 3 times of its self-weight. The
tensile damage distribution obtained for a load factor equal to 3.17 is plotted in Figure 4. 10. As in the
case of the linear static analysis, a good match with the results obtained for the three-dimensional
model [Murcia, 2008] is found.

Vulnerability assessment of monumental masonry structures including uncertainty
Erasmus Mundus Programme
ADVANCED MASTERS IN STRUCTURAL ANALYSIS OF MONUMENTS AND HISTORICAL CONSTRUCTIONS 27
Figure 4. 8 – Tensile damage distribution. Crack width. Load factor = 1
Figure 4. 9 – Principle positive strains in the vertical direction. Crack width. Lod factor = 1

Vulnerability assessment of monumental masonry structures including uncertainty
Erasmus Mundus Programme
28 ADVANCED MASTERS IN STRUCTURAL ANALYSIS OF MONUMENTS AND HISTORICAL CONSTRUCTIONS
Figure 4. 10 - Tensile damage distribution. Crack width. Load factor = 3
A non-linear static analysis has been carried out under lateral loads proportional to the mass
distribution. It has been performed in two phases:
First, the self-weight has been applied to the structure in ten steps, since damage is expected
to appear already under gravity loads;
Second, an incremental lateral load proportional to the mass distribution has been applied to
the structure, until the collapse is reached.
The analysis consists in an incremental – iterative procedure. A load control incremental procedure
has been used until the collapse of the structure. Arc length method has been applied in order to
capture the post-peak behavior of the structure and define its capacity until the collapse point.
Updated normal arc length has been imposed. The procedure has been applied controlling the
displacement of the top point of the central vault, which ensure a better convergence for high
displacements, since numerical problems are given by the local mechanism develop in the lateral
aisles.
Different iteration methods and convergence criteria have been implemented in order to calibrate the
results. Regular Newton-Raphson iteration method has been found to ensure the most stable results.
Convergence is achieved whenever one of the residual force or displacement increment have an error
below the chosen tolerance of 1% and convergence is checked at each iteration.
Table 4. 6 - Details on the incremental iterative procedure used for the non-linear static analysis
Incremental procedure Load control
Updated normal arch length
Iterative method Regular Newton - Raphson
Convergence criteria Force and displacement

Vulnerability assessment of monumental masonry structures including uncertainty
Erasmus Mundus Programme
ADVANCED MASTERS IN STRUCTURAL ANALYSIS OF MONUMENTS AND HISTORICAL CONSTRUCTIONS 29
The capacity curve obtained for the two dimensional model is plotted in Figure 4. 11 in terms of shear-
displacement at the central vault key and in Figure 4. 12 in terms of equivalent acceleration and
displacement. The maximum load capacity is found to be around 1330 kN. Information about the post-
peak behavior are obtained through the implementation of the arch length method. The obtained
capacity curve presents a post-peak softening with a decrease of around 20% of the load capacity and
a maximum displacement capacity of about 14 cm. A maximum equivalent acceleration of 0.095 g is
reached.
Figure 4. 11 - Capacity curve in terms of base shear and displacement at the central vault key
Figure 4. 12 - Capacity curve in terms of equivalent acceleration and displacement at the central vault key

Vulnerability assessment of monumental masonry structures including uncertainty
Erasmus Mundus Programme
30 ADVANCED MASTERS IN STRUCTURAL ANALYSIS OF MONUMENTS AND HISTORICAL CONSTRUCTIONS
The evolution of the damage pattern obtained is presented in Figure 4. 13. Damage appears under
self-weight, for a load factor around 0.40. Cracks form above the lateral vaults, close to the corners of
the triangular buttresses. This damage spreads gradually towards the key of the lateral vaults, where
the most severe damage is expected. For an equivalent acceleration around 0.50 g a hinge appears at
the base of the right buttress, followed by hinges at the central vault key, the base of the right pier and
at the union between the latter and the right lateral vault. In correspondence with the maximum load
capacity, another hinge appears at the base of the left buttress and further damage occurs at the key
of the central vault.
Positive principle strains are plotted in Figure 4. 14. Strain concentration results in agreement with the
damage distribution observed.
Figure 4. 13 – Mechanism of damage. Crack width.
100% self-weight
ag = 0.05 g
Maximum load capacity
ag= 0.094 g
Ultimate displacement capacity
ag= 0.091 g – d=0.14 m
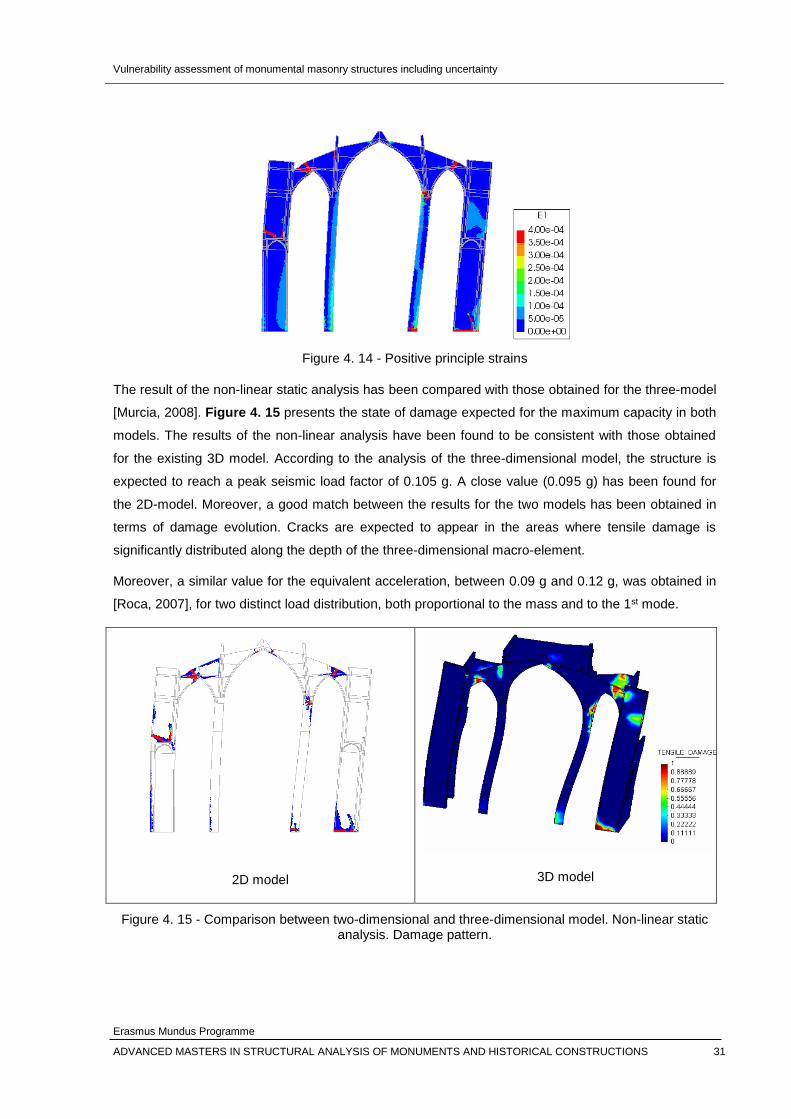
Vulnerability assessment of monumental masonry structures including uncertainty
Erasmus Mundus Programme
ADVANCED MASTERS IN STRUCTURAL ANALYSIS OF MONUMENTS AND HISTORICAL CONSTRUCTIONS 31
Figure 4. 14 - Positive principle strains
The result of the non-linear static analysis has been compared with those obtained for the three-model
[Murcia, 2008]. Figure 4. 15 presents the state of damage expected for the maximum capacity in both
models. The results of the non-linear analysis have been found to be consistent with those obtained
for the existing 3D model. According to the analysis of the three-dimensional model, the structure is
expected to reach a peak seismic load factor of 0.105 g. A close value (0.095 g) has been found for
the 2D-model. Moreover, a good match between the results for the two models has been obtained in
terms of damage evolution. Cracks are expected to appear in the areas where tensile damage is
significantly distributed along the depth of the three-dimensional macro-element.
Moreover, a similar value for the equivalent acceleration, between 0.09 g and 0.12 g, was obtained in
[Roca, 2007], for two distinct load distribution, both proportional to the mass and to the 1st mode.
2D model
3D model
Figure 4. 15 - Comparison between two-dimensional and three-dimensional model. Non-linear static analysis. Damage pattern.

Vulnerability assessment of monumental masonry structures including uncertainty
Erasmus Mundus Programme
32 ADVANCED MASTERS IN STRUCTURAL ANALYSIS OF MONUMENTS AND HISTORICAL CONSTRUCTIONS

Vulnerability assessment of monumental masonry structures including uncertainty
Erasmus Mundus Programme
ADVANCED MASTERS IN STRUCTURAL ANALYSIS OF MONUMENTS AND HISTORICAL CONSTRUCTIONS 33
5. UNCERTAINTY EVALUATION
Uncertainties related to the mechanical properties of materials have been simulated by modelling
these properties as random variables. A probability density function has been assigned to each
variable, basing on experimental results (section 2.6). Realistic ranges of variation for each parameter
have been chosen basing to the values proposed in the Commentary to the NTC2008. A population of
numerical models has been generated by means of a stochastic simulation. Monte Carlo method has
been chosen, in agreement with similar studies [Petromichelakis et al, 2014],[Rota et al, 2010] and
with the Italian Guidelines [CNR-DT 212/2013]. In this chapter, the choices about the uncertainties
modelling are discussed. First, the parameters modelled as uncertain variable are presented in section
5.1. Second, the ranges of variation and the distribution assigned to the parameters are discussed in
section 5.2. The stochastic method applied to generate the population of numerical models is
described in section 5.3. Finally the numerical results for the reference model considering the mean of
the selected parameters are presented in section 5.4.
5.1 Uncertain input parameters
The effect of uncertainties related to three material mechanical properties, namely the tensile strength,
the compressive strength and the elastic modulus has been analyzed. Therefore, three input variables
have been considered for each material. In order to achieve a good simplification, structural members
which present material with equal mechanical properties, have been grouped. Thus, four material
categories have been considered (Table 5. 1). Especially the heavy infill of the vaults presents good
mechanical properties since it has to transfer the thrust from the central load to the buttress so that its
properties has been grouped with those of the three leaf walls.
The first material category refers to the vaults and one-leaf walls and has been chosen as reference.
The mechanical parameters for the other materials have been derived as a percentage of the
reference material properties.
Table 5. 1 – Materials considered for the stochastic analysis
1 Vaults and one leaf walls (reference material)
2 Columns
3 Three leaves walls and heavy infill of the vaults
4 Light infill of the vaults
According to the previous consideration, six uncertain parameters have been taken into account
(Table 5. 2). Three refer to the properties of the reference material (vaults and one-leaf walls), i.e. the
compressive strength fc, the tensile strength ft and the Young’s modulus E, and three are the
coefficients, according to which the mechanical properties of the other four material categories have

Vulnerability assessment of monumental masonry structures including uncertainty
Erasmus Mundus Programme
34 ADVANCED MASTERS IN STRUCTURAL ANALYSIS OF MONUMENTS AND HISTORICAL CONSTRUCTIONS
been defined. It is worth noticing that the density of masonry is not included among the uncertain
parameters, since it has been calibrated for each element according to the three dimensional model.
Table 5. 2 – Uncertain parameters
fc Compressive strength
ft Tensile strength
E Elastic Modulus
Ccoeff Coefficient material 2
Wcoeff Coefficient material 3
Icoeff Coefficient material 4
Both for the tensile and compressive fracture energy deterministic values have been considered. Both
values have been related to the compressive strength. The tensile fracture energy has been defined
according to the equation (1) provided by the [Model Code, 1990] as in [Drougkas, 2015]. A maximum
aggregate size of 8 mm has been considered.
G If = 0.025* (fcm / fcmo)0.7 [N/mm] (2)
while the compressive fracture energy has been calculated referring to the ductility index (2) as
suggested in [Lourenço,2009] and assuming for it the value of 1.6 mm, corresponding to the minimum
value suggested by the Model Code 90.
d= G cf / fc [mm] (3)
5.2 Uncertainty probabilistic modelling
Ranges of variation for the selected mechanical parameters have been defined according to the
reference values provided by the Commentary to NTC, 2008 [Circolare L.L. 617/2009]. This choice
results in agreement with the procedure proposed in [CNR-DT 212/2012], [Rota et al., 2010] and
[Tondelli et al., 2012].
The range of variation for the compressive strength has been chosen according to Table C8A.2.1 of
the Appendix C8A (NTC2008), which provides reference ranges of values for different types of
masonry typologies that can be found in the Italian territory. These values have been adjusted
considering the coefficients from Table C8A.2.2 in order to take into account the presence of
penalizing or improving factors.
Considering the available information about the existing materials (section 3.2), the range of variation
for the reference material (vaults and one-leaf walls) refers to that suggested for the category of ashlar
masonry, with a minimum value equal to 6.0 MPa and a maximum value of 8.0 MPa. The same

Vulnerability assessment of monumental masonry structures including uncertainty
Erasmus Mundus Programme
ADVANCED MASTERS IN STRUCTURAL ANALYSIS OF MONUMENTS AND HISTORICAL CONSTRUCTIONS 35
category has been considered for the column. However, a correction factor of 1.2 has been applied in
order to take into account the good connection of the masonry blocks, according to the result of the
tomography test [Vendrell et al., 2007].. The regular and massive nature of the ashlar masonry blocks
provide a relevant increase in the strength and stiffness of the columns that has been taken into
account.
The second category of masonry (“muratura a conci sbozzati, con paramento di limitato spessore e
nucleo interno”, i.e. rough ashlar masonry with thin external leaves and infill) has been considered for
the three-leaf masonry wall and the heavy infill of the wall (material 2 of the Table 5. 1). In this case,
two coefficients have been applied to the compressive strength since both a good transversal
connection and a good quality of the mortar have been considered, considering the results of
previous studies [Roca, 2007], [Vendrell, 2007], [Murcia, 2008]. Finally, the range of parameters
chosen for the light infill of the vaults refers to the second masonry category provided by the
Commentary. A significant low value of compressive strength has been considered in this case,
according to the poor quality of this material (ceramic pottery).
Table 5. 3 – Ranges of variation for the compressive strength
Material fc (MPa)
min max
1 Vaults and one leaf walls (reference material) 6.0 8.0
2 Columns 7.2 9.6
3 Three leaves walls and heavy infill of the vaults 4.2 6.3
4 Light infill of the vaults 1.0 1.8
For all materials, tensile strength and Young’s Modulus have been defined as a function of the
compressive strength. The value of the tensile strength has been assumed to vary between 2% of the
minimum compressive strength and 5% of the maximum compressive strength. Whereas, a mean ratio
of 400 has been assumed between the Young’s Modulus and the compressive strength, according to
the average value suggested in table C8A.2.2 (NTC2008). Thus, a range of variation from 300xfc to
500xfc has been considered. Due to this choice, a change in stiffness is expected with respect to the
calibrated model since the elastic modulus was previously defined as 1000 fc as in [CEN, 2005],
according to the three-dimensional model [Murcia, 2008].
Table 5. 4 – Ranges of variation for the elastic modulus and the tensile strength
Material E ft
All 300 fc – 500 fc 2% fc – 5% fc

Vulnerability assessment of monumental masonry structures including uncertainty
Erasmus Mundus Programme
36 ADVANCED MASTERS IN STRUCTURAL ANALYSIS OF MONUMENTS AND HISTORICAL CONSTRUCTIONS
As already mentioned, the properties of vaults and one-leaf walls (material 1) have been considered
as reference, while the properties of the other materials have been obtained as a percentage of the
reference material properties. To this purpose, a variable percentage coefficient has been defined for
each material (Table 5. 5). Each coefficient has been defined so that the boundary values are
according to the ranges of variation previously assumed for the compressive strength (Table 5. 3). In
the case of columns, a wider range has been adopted for the corresponding coefficient and lower
values of strength has been included in the realistic range in order to consider a realistic decrease in
the mechanical properties due to the fire occurred in 1936. A summary of the ranges of variation
chosen for each uncertain parameter is presented in Table 5. 6.
Table 5. 5 – Range of variation of the percentage coefficients
Material Percentage coefficient
Three leaves walls and heavy infill of the vaults Wcoeff 0.7 – 0.8
Columns Ccoeff 1.1 – 1.3
Light infill of the vaults Icoeff 0.17 – 0.23
Table 5. 6 – Ranges of variation of the mechanical properties
Material fc (MPa) ft (MPa) E (MPa)
min max mean min max mean min max mean
1 Vaults and one leaf walls
(reference material)
6.0 8.0 7.0 0.12 0.40 0.26 1800 4000 2900
2 Columns 6.6 10.4 5.3 0.08 0.32 0.20 1260 3200 2230
3 Three leaves walls and
heavy infill of the vaults 4.2 6.4 8.5 0.13 0.52 0.33 1980 5200 3590
4 Light infill of the vaults 1.0 1.8 1.4 0.02 0.09 0.06 306 920 613
5.3 Stochastic simulation of structural models
In order to simulate the effect of the uncertainties, the uncertain mechanical parameters (Table 5. 2)
have been modelled as random variables. The mechanical parameters fc, ft, and E present aleatoric
and epistemic uncertainties simultaneously, since their variation depends both on their natural
variability and on the lack of a complete knowledge. A probability density function has been assigned
to each random variable, imposing the ranges of variation already defined. Whereas, the parameters
Ccoeff, Wcoeff and Icoeff possess only epistemic uncertainties, due to impreciseness of information.
According to the experimental data presented in section 2.6, a log-normal distribution has been
assigned to the mechanical parameters fc, ft, E, while a uniform probability distribution has been
assigned to the coefficients Ccoeff, Wcoeff and Icoeff, similarly to [Petromichelakis et al. 2014]. The
latter cannot indeed be considered as continuous variables and only hypothesis about their range of
variation can be done.

Vulnerability assessment of monumental masonry structures including uncertainty
Erasmus Mundus Programme
ADVANCED MASTERS IN STRUCTURAL ANALYSIS OF MONUMENTS AND HISTORICAL CONSTRUCTIONS 37
Characteristic parameters for each lognormal distribution has been considered, as proposed by the
Italian guidelines [CNR-DT 212/2013] as well as in [Park et al, 2009], [Sýkora et al, 2010] namely the
mean and the deviation of the underlying normal distribution, since the logarithm of this values is
assumed normally distributed. The logarithmic mean and standard deviation can be obtained by the
corresponding mean and standard deviation for the normal distribution using the relationship (4) and
(5). In this case, the (4) has been employed in order to convert the known mean value for each range
of variation to the lognormal mean value. For what concern the logarithmic standard deviation σln the
reference value given for each masonry typology in CNR-DT 212/2013 (Table 3.1) has been
considered and slightly adjusted in order to obtain an interval of values consistent with the range
selected (Table 5. 6). The lower and the upper boundary of the corresponding interval of variation are
the characteristic parameters of the uniform distributions for the Ccoeff, Wcoeff. and Icoeff.
All the distributions and their characteristic parameters for each random variable are presented in
Table 5. 7. The probability distributions obtained for each random variable are plotted in Figure 5. 2
(reference material)
2
lnln2
1ln
(4)
)1ln( 2
2
ln
(5)
Table 5. 7 – Probability distributions and parameters for random variables.
Random variable Unit distribution μln σln
fc MPa lognormal 1.94 0.05
ft MPa lognormal -1.37 0.22
E MPa lognormal 7.96 0.13
min max
Ccoeff - uniform 0.7 0.8
Wcoeff - uniform 1.1 1.3
Icoeff - uniform 0.17 0.23
In order to model the uncertainty related to the random variables, a population of numerical models
has been generate. Different stochastic method are available for sampling random values according to
a certain probability distribution and combine them randomly. Among them, Monte Carlo Simulation

Vulnerability assessment of monumental masonry structures including uncertainty
Erasmus Mundus Programme
38 ADVANCED MASTERS IN STRUCTURAL ANALYSIS OF MONUMENTS AND HISTORICAL CONSTRUCTIONS
(MCS) can be considered a reliable and efficient method, adopted in similar studies [Petromichelakis
et al, 2014], [Rota et al, 2010] as well as suggested in [CNR-DT 212/2013], [Singhal et al.,1996],
[Dymiotis et al., 1999], [Rota et al., 2010]
According to the “central limit theorem”, a large number of samples (N→∞) is needed in order to
ensure the reliability of a stochastic method. Therefore, a number N of samples sufficiently large has
to be generated. In the present case study a number of N=200 samples have been selected, expected
to produce statistical reliable results, in agreement with [Petromichelakis et al., 2014], [Vamvastsikos
at al., 2010], [Jalayer et al., 2010]. N=200 independent and identically distributed random samples
have been generated, with the use of a Python script, which represent N simulated numerical models
of the structure. Each model represents a possible instance of the structure, which is going to be
analyzed. The results of the analysis performed on the 200 simulated models are presented in chapter
6.
Figure 5. 2 – Distribution of random variables for the reference material

Vulnerability assessment of monumental masonry structures including uncertainty
Erasmus Mundus Programme
ADVANCED MASTERS IN STRUCTURAL ANALYSIS OF MONUMENTS AND HISTORICAL CONSTRUCTIONS 39
5.4 Reference structural model
According to the interval of variation assumed for the uncertain input parameters (5.2), the model
corresponding to the mean values of the uncertain parameters has been considered as reference
model. Due to the already mentioned difference in the Elastic Modulus with respect to the calibrated
model, a difference in stiffness is expected between the two models.
Moreover, according to the same ranges, lower value have been considered for the compressive and
tensile strength of the light infill (material 4 of Table 5. 1) present in the central vault. As already
mentioned, this decision is in agreement with the poor quality of the material, i.e. pieces, of ceramic
pottery. Therefore, the response of the model is expected to be affected by the reduction of these
properties.
A non-linear static analysis of the new model has been performed in order to evaluate the reference
capacity of the structure and the corresponding damage mechanism, meaningful for a further
comparison with the response of the 200 simulated models. Lateral incremental loads proportional to
the mass distribution have been used and the same method has been chosen for the incremental-
iterative procedure. The capacity curve obtained for the reference model is presented in Figure 5. 3 ,
and it is compared to the result obtained for the previous model. Looking at the graph, it stands out a
significant change in terms of stiffness and a lower load capacity, although the two models shows a
similar global ductility.
Figure 5. 3 - Capacity curve for the reference model and the previous model
The evolution of the damage pattern is presented in Figure 5. 4. Comparing the damage pattern with
the previous model (Figure 4. 13), more severe damage is obtained since a low value of the seismic

Vulnerability assessment of monumental masonry structures including uncertainty
Erasmus Mundus Programme
40 ADVANCED MASTERS IN STRUCTURAL ANALYSIS OF MONUMENTS AND HISTORICAL CONSTRUCTIONS
load factor. Looking at the damage pattern for 0.05 g plastic hinges are already present at the base of
the right buttress and at the key of the central vault.
Moreover, a big difference between the two mechanisms consists in the presence of plastic hinges at
the two side of the key of the central vault. Once they form, the load capacity of the structure starts to
decrease. Therefore, the capacity of the structure result significantly affected by this damage, which is
reasonably due to the poor quality of the light infill.
Figure 5. 4 - Crack widths (reference model). Damage mechanism
100% self-weight
ag = 0.05 g
Maximum load capacity
ag= 0.067 g
Ultimate displacement capacity
ag= 0.064 g – d=0.12 m
Vulnerability assessment of monumental masonry structures including uncertainty
Erasmus Mundus Programme
ADVANCED MASTERS IN STRUCTURAL ANALYSIS OF MONUMENTS AND HISTORICAL CONSTRUCTIONS 41
6. PROBABILISTIC SEISMIC ASSESSMENT
The effect of the uncertainties on the structural response has been evaluated by performing a non-
linear static analysis of the N=200. Damage grades have been defined as a function of the capacity of
the structure, according to the mechanical approach proposed in [Lagomarsino, 2006]. Hence, the N2
method has been applied in order to find for each simulated model the seismic demand for each limit
state, expressed in terms of peak ground acceleration. Thereafter, a statistical analysis of the N=200
values of peak ground acceleration obtained has been performed for each limit state. Hence, the
vulnerability of the structure has been represented in terms of fragility curves, derived for each limit
state. In this chapter, the results of the probabilistic seismic assessment are presented. First, the
considered methodology is presented (section 6.1). Second, the results of the non-linear static
analysis are discussed (sections 6.2). Hence, the choice of the reference limit state is explained and
the N2 method is applied (sections 6.3-6.4). Finally, the derivation of fragility curves for the structure is
presented (section 6.5).
6.1 Methodology
The methodology of the study is based on the procedure implemented in [Petromichelakis, 2014]
(Figure 6. 1), and is in agreement with the method proposed in several previous studies (2.4) as well
as with the “method C” suggested by [CNT-DT 212/2013].
N=200 random samples, generated through a Monte Carlo Simulation represent N possible instances
of the structure, with reference to the uncertainties in the selected input mechanical parameters. The
latter assumes random values in the space Rn, with n=6 equal to the number of the assumed input
random variables.
In order to assess the probabilistic response of the structure, the capacity of each simulated model
has been evaluated by performinging a non-linear static analysis. Hence, according to the mechanical
approach [Lagomarsino, 2006], four reference limit states have been defined in function of yielding
and ultimate displacement of each idealized elasto-plastic equivalent system. Thereafter, the N2
method suggested both in [NTC2008] and in [Eurocode 6] has been applied in order to compare the
spectral demand with the model capacity.
Each of the N=200 performed analysis can be represented as a mapping model in the space Rm,
where m is the number of output parameters for each model. In this case, since the N2 method has
been applied, three output random variables have been found for each limit state, namely the spectral
displacement (Sd) and acceleration (Sa) and the peak ground acceleration (ag). Thus, m=12 output
random parameters have been obtained. For each output variable, a given probabilistic distribution
has been obtained.

Vulnerability assessment of monumental masonry structures including uncertainty
Erasmus Mundus Programme
42 ADVANCED MASTERS IN STRUCTURAL ANALYSIS OF MONUMENTS AND HISTORICAL CONSTRUCTIONS
Finally, the mean and dispersion of each output variable have been used to determine the fragility
function of the structure, representing the probability to exceed a certain limit state for each level of
intensity.
Figure 6. 1 – Schematic view of the adopted methodology [Petromichelakis et al., 2014]
6.2 Capacity curves
200 Pushover analysis have been performed, one for each simulated model. The capacity curves
obtained for each model are presented in Figure 6. 2 in terms of base shear and displacement at the
key of the central vault.
Figure 6. 2 – Capacity curves
It is visible a macro-distinction between two families of capacity curves, which differ significantly for
load and displacement capacity. Indeed, a significant variation in the capacity of the structure has
been obtained, by varying the values of mechanical properties inside the selected ranges.

Vulnerability assessment of monumental masonry structures including uncertainty
Erasmus Mundus Programme
ADVANCED MASTERS IN STRUCTURAL ANALYSIS OF MONUMENTS AND HISTORICAL CONSTRUCTIONS 43
As will be show later, each family of capacity curves correspond to different damage mechanisms
developing in the structure. Table 6. 1 summarize the damage mechanisms which have been found
for the structure.
Table 6. 1 – Damage mechanisms
Type of damage
mechanism Load capacity Displacement capacity Mechanism
G Global Hight Ductile failure G1
G2
L
Local
Failure of the right
buttress
Low Ductile failure L
The result can be explained by looking at the random mechanical properties. In Figure 6. 4 three
representative models for each type of mechanism are presented in terms of tensile strength.
Generally, a global damage mechanism (case G in Table 6. 1) develops when the tensile strength lies
in the medium-upper part of its range of variation. Conversely, a local damage mechanism (case L in
Table 6. 1) occurs for those models, which present a significantly low value of tensile strength, under
0.16 Mpa. Looking at the models A038 and A154 they result similar in terms of tensile strength.
However, model A038 present significant higher elastic modulus (Figure 6. 4-right), which can be
possibly the reason for the different response of the two models.
Figure 6. 3 – Representative models

Vulnerability assessment of monumental masonry structures including uncertainty
Erasmus Mundus Programme
44 ADVANCED MASTERS IN STRUCTURAL ANALYSIS OF MONUMENTS AND HISTORICAL CONSTRUCTIONS
Figure 6. 4 – Comparison of the tensile strength for a global (case A) and local (case B) mechanism of damage
Three different mechanism have been found (Table 6. 1). Each of them is illustrated below for a
representative model. The mechanical properties for each representative model are listed in Table 6.
2.
Table 6. 2 – Mechanical properties for each representative model per damage mechanism
Mechanism Reference model fc
(Mpa)
ft
(Mpa)
E
(Mpa)
Gt
(N/m)
Gc
(N/m)
G1 A002 5.58 0.18 2326 16.6 8934
G2 A094 5.70 0.40 2167 16.8 9072
L A015 5.59 0.10 2519 16.6 8941
Figure 6. 5 illustrates some crucial steps for the damage global mechanism G1. A similar behavior to
that shown for the reference model is observed.
Hinges form in the triangular buttresses already under gravitational loading and they spread towards
the key of the lateral vaults. Afterwards, new cracks open in correspondence with the key of the
central vaults and shortly after, the lower part of the right buttress is damaged. The occurrence of
hinges in the upper part of the central vault, crossing the lighter infill of the vault, corresponds to the
maximum load capacity, which is reached by the structure. Afterwards, cracks develop through the
whole height of the infill and numerical convergence cannot be reached. Moreover, the overturning of
the buttress seems to occur at the end of the analysis.
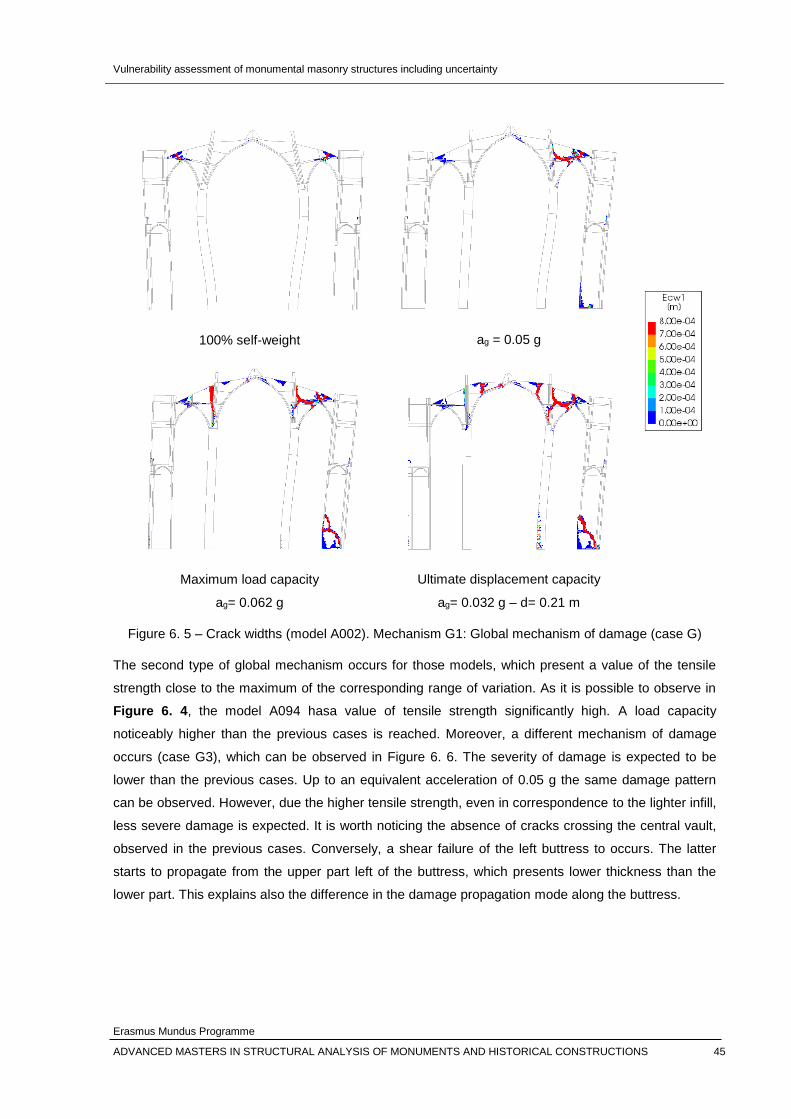
Vulnerability assessment of monumental masonry structures including uncertainty
Erasmus Mundus Programme
ADVANCED MASTERS IN STRUCTURAL ANALYSIS OF MONUMENTS AND HISTORICAL CONSTRUCTIONS 45
Figure 6. 5 – Crack widths (model A002). Mechanism G1: Global mechanism of damage (case G)
The second type of global mechanism occurs for those models, which present a value of the tensile
strength close to the maximum of the corresponding range of variation. As it is possible to observe in
Figure 6. 4, the model A094 hasa value of tensile strength significantly high. A load capacity
noticeably higher than the previous cases is reached. Moreover, a different mechanism of damage
occurs (case G3), which can be observed in Figure 6. 6. The severity of damage is expected to be
lower than the previous cases. Up to an equivalent acceleration of 0.05 g the same damage pattern
can be observed. However, due the higher tensile strength, even in correspondence to the lighter infill,
less severe damage is expected. It is worth noticing the absence of cracks crossing the central vault,
observed in the previous cases. Conversely, a shear failure of the left buttress to occurs. The latter
starts to propagate from the upper part left of the buttress, which presents lower thickness than the
lower part. This explains also the difference in the damage propagation mode along the buttress.
100% self-weight
ag = 0.05 g
Maximum load capacity
ag= 0.062 g
Ultimate displacement capacity
ag= 0.032 g – d= 0.21 m

Vulnerability assessment of monumental masonry structures including uncertainty
Erasmus Mundus Programme
46 ADVANCED MASTERS IN STRUCTURAL ANALYSIS OF MONUMENTS AND HISTORICAL CONSTRUCTIONS
Figure 6. 6 - Crack widths (model A094). Mechanism G3: Global mechanism of damage (case G) – ductile failure.
A local mechanism of damage (type L) is obtained in case of a significantly low tensile strength. The
result obtained for a representative model (A015), is presented in Figure 6. 7. In this case, an early
collapse of the structure occurs because of the local failure of the right buttress. Moreover, the
majority of structural elements experience damage already under self-weight. Vertical cracks forms in
the upper part of the right buttress, causing a mechanism similar to the overturning of a portion of the
buttress. A similar mechanism can be explained due to the difference in stiffness of the two portions,
resulted from the calibration of the model (Table 4. 2). Due to the presence of a wall, orthogonal to the
bay, between the buttress and the lateral vaults (element 1 of Table 4. 2), this part is stiffer than the
rest of the buttress. For this reason, a vertical crack develops between the two portions, causing the
overturning of the weakest part. On the other hand, the lower half of the buttress is much stiffer
because of the presence of lateral chapels and it fails in shear. It is worth noticing that the results are
in agreement with the calibration of the thickness of each members (4.3), which allows to take into
account the smaller thickness of the upper part of the buttress compared with the lower part and thus
the difference in stiffness in the two-dimensional model.
100% self-weight
ag = 0.05 g
Maximum load capacity
ag= 0.075 g
Ultimate displacement capacity
ag= 0.058 g – d= 0.27 m

Vulnerability assessment of monumental masonry structures including uncertainty
Erasmus Mundus Programme
ADVANCED MASTERS IN STRUCTURAL ANALYSIS OF MONUMENTS AND HISTORICAL CONSTRUCTIONS 47
Figure 6. 7 - Crack widths (model A015). Local mechanism of damage (case L)
6.3 Identification of damage grades
The reference damage states have been defined adopting a mechanical approach [Lagomarsino,
2006], [Lagomarsino, 2015]. Four damage grades have been identified on the capacity curve as a
function of the yielding displacement (dy) and the ultimate displacements (du) of the idealized capacity
curve. The damage grades and the corresponding limits have been assumed according to those
suggested in [Lagomarsino, 2006]. Those limits are presented in Table 6. 3.
Sd,1 0.7 dy
Sd,2 1.5 dy
Sd,3 0.5 (dy+du)
Sd,4 du
Table 6. 3 – Damage grades
100% self-weight
ag = 0.28 g
Maximum load capacity
ag= 0.037 g
Ultimate displacement capacity
ag= 0.058 g – d= 0.14 m

Vulnerability assessment of monumental masonry structures including uncertainty
Erasmus Mundus Programme
48 ADVANCED MASTERS IN STRUCTURAL ANALYSIS OF MONUMENTS AND HISTORICAL CONSTRUCTIONS
The same limits were proposed within the mechanical method which was elaborated in the framework
of the Risk-UE project (1999), basing on EMS-98 macroseismic scale [Grunthal, 1998]. According to
the increasing severity of the expected damage, the four damage level are identified as “slight”,
“moderate”, “extensive” and “complete”. They can be related to the five damage thresholds proposed
within the macroseismic approach according to [Lagomarsino, 2006] (Table 6. 4).
Dsk (mechanical approach) Dk (macroseismic approach) Structural (SD) and non-
structural (N-SD) damage
Slight (DS1) Slight (D1) No SD slight N-SD
Moderate (DS2) Moderate (D2) Slight SD moderate N-SD
Extensive (DS3) Heavy (D3) Moderate SD heavy N-SD
Complete (DS4) Very heavy (D4) Heavy SD very heavy N-SD
Desctruction (D5) Very heavy SD
Table 6. 4 – Correspondence between the damage state thresholds for mechanical and macroseismic methods
The assumed limit states have been identified on the idealized capacity curve, i.e. the elasto-plastic
bilinear curve, which describe the capacity of a non-linear SDOF system, equivalent to the MDOF
structure. In this case study, the equivalent SDOF system has been defined according to the approach
of the current [NTC2008]. In order to take into account the post-peak behavior, the ultimate
displacement has been identified in correspondence to a decrease of the 15% of the maximum load
capacity of the structure. The equivalent initial stiffness of the system has been defined using the
secant stiffness criterion according to the procedure explained below [NTC2008 – Commentary
C.7.3.4].
First, each capacity curve has been scaled in order to obtain the corresponding capacity for the
equivalent SDOF system, using the equations (6) and (7)
Γ=*
bV
F (6)
Γ=*
DD (7)
where Vb and D are the base shear and the top displacement of the MDOF system and Γ is the modal
participation factor, given by the relationship (8). The participation factor has been defined for the
reference model.

Vulnerability assessment of monumental masonry structures including uncertainty
Erasmus Mundus Programme
ADVANCED MASTERS IN STRUCTURAL ANALYSIS OF MONUMENTS AND HISTORICAL CONSTRUCTIONS 49
∑
2=Γ
kk
kk
φm
φm
(8)
The mass mk has been defined for each node of the structure and multiplied for the corresponding
modal displacement Φk, found for the first mode of vibration. The modal displacements have been
normalized in order to have a unitary displacement at the top point of the structure, i.e. at the key of
the central vault.
The equivalent initial stiffness, i.e. the stiffness of the elastic part of the bilinear, has been defined as
the secant stiffness to the pushover curve in the point where 60% of the maximum lateral load
capacity is reached. Hence, an equivalent energy dissipation in the two systems has been imposed for
a maximum displacement du corresponding to a decrease of 15% of the maximum lateral strength
(Figure 6. 8). The elastic period of the equivalent elasto-plastic system is given by the equation (9)
bilk
mπT
*
2= (9)
where kbil is the stiffness of the elastic part and m* is the equivalent mass of the SDOF system
computed as
kkφmm ∑=*
(10)
It is worth noticing as in case of masonry structures the capacity curve follow the response of the
structure up to a significant deterioration of the maximum strength. Fixing the ultimate displacement
with a certain decrease of the maximum load capacity according to the procedure suggested by the
Italian code, it is possible to take into account the post-peak behavior of the structure [Costa et al.,
2011].
For each of the 200 capacity curves, the equivalent bilinear has been found in function of three
parameters: yielding strength (fy) and displacement (dy) and ultimate displacement du. Following that,
four limit states have been defined according to Table 6. 3. The considered damage grades are
represented in Figure 6. 9 for a reference case. As underlined in [Lagomarsino, 2006], it should be
noted that the non-linear behavior is reached by the structure before the yielding strength in the
corresponding ideal bilinear curve. For this reason, the first limit state is defined as 70% of the yielding
strength. The second limit state is instead supposed to correspond to the maximum load capacity
achieved by the structure.

Vulnerability assessment of monumental masonry structures including uncertainty
Erasmus Mundus Programme
50 ADVANCED MASTERS IN STRUCTURAL ANALYSIS OF MONUMENTS AND HISTORICAL CONSTRUCTIONS
Figure 6. 8 – Bilinearization of the capacity curve
Figure 6. 9 –Damage grades
6.4 Use of the N2 method to evaluate the seismic demand for each limit state
Once the N=200 idealized systems are obtained, the N2 method [Fajfar,2000] suggested by both
[NTC2008] and [Eurocode 6] has been adopted in order to define the maximum value of acceleration
that the structure can withstand for each limit state. The method allows to define the seismic demand
corresponding to a given damage grade, expressed in terms of inelastic spectra.
The elastic response spectrum for the site has been defined according to Eurocode 6 (3.2.2.2). The
ground type has been considered basing on the available information regarding the morphology of the

Vulnerability assessment of monumental masonry structures including uncertainty
Erasmus Mundus Programme
ADVANCED MASTERS IN STRUCTURAL ANALYSIS OF MONUMENTS AND HISTORICAL CONSTRUCTIONS 51
foundation and the soil of the church. According to a geotechnical study [PATRIMONI-UB, 2007], the
church is founded on a high quality sand. However, between the foundation and the sand soil a layer
of rubble material is present, having a depth of 1 meter. According to the type of sand a soil type “C”
could be defined. However, the rubble layer, even if thin, affects the quality of the soil. Therefore, a
ground type “D” has been assumed. It is worth noticing that the conservative choice of a soil type D is
strictly related to the presence of the rubble layer just below the foundation of the structure.
The spectral parameters corresponding to the selected ground type (D) are summarized in Table 6. 5.
Table 6. 5 – Values of parameters describing the elastic response spectra according to the Eurocode 6 for groud type D
Ground type S TB (s) TC (s) TD (s)
D 1.35 0.20 0.8 2.0
The displacement response spectrum has been obtained from the corresponding response spectrum
in terms of acceleration by using the equation (11)
2]
2[•)(=)(
π
TTSTS eDe
(11)
Hence, both the elastic spectrum and the capacity curve have been expressed in terms of Spectral
acceleration and Spectral displacement (ADRS format) in order to apply the N2 method.
The performance point for each limit state, i.e. the spectral displacement corresponding to each
threshold has been found as a function of demand (elastic response spectra) and capacity curve
according to the equations (12), (13) and (14)
(12)
(13)
(14)
where Tc is the spectrum corner period, separating the constant acceleration range and the constant
velocity range.
According to the N2 procedure, the period of the equivalent SDOF system (T*) has been compared
with the period Tc, characterizing the elastic response spectrum. For a medium and long period range
(T*≥Tc), the response of the anelastic system is assumed equal to that of the corresponding elastic
system with equal period according to the equation (12). Whereas, for a low period range (T*≤Tc) the
response of the anelastic structure is assumed equal to the corresponding elastic system (13) if the
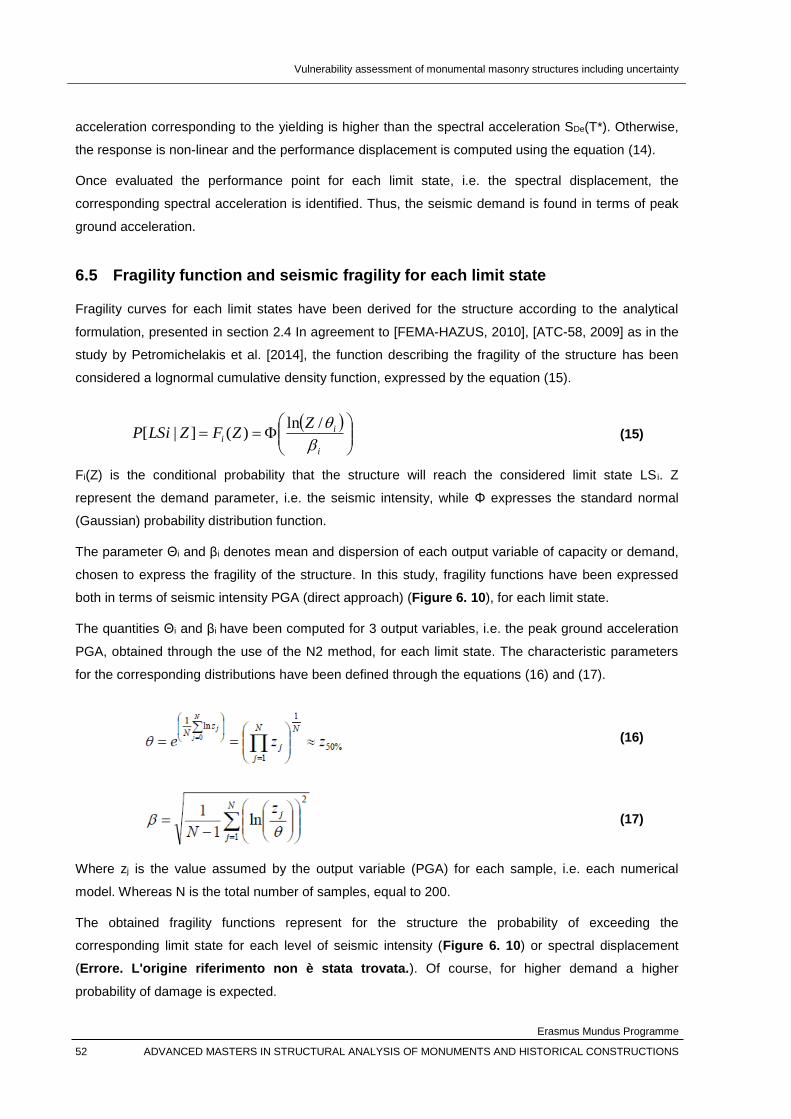
Vulnerability assessment of monumental masonry structures including uncertainty
Erasmus Mundus Programme
52 ADVANCED MASTERS IN STRUCTURAL ANALYSIS OF MONUMENTS AND HISTORICAL CONSTRUCTIONS
acceleration corresponding to the yielding is higher than the spectral acceleration SDe(T*). Otherwise,
the response is non-linear and the performance displacement is computed using the equation (14).
Once evaluated the performance point for each limit state, i.e. the spectral displacement, the
corresponding spectral acceleration is identified. Thus, the seismic demand is found in terms of peak
ground acceleration.
6.5 Fragility function and seismic fragility for each limit state
Fragility curves for each limit states have been derived for the structure according to the analytical
formulation, presented in section 2.4 In agreement to [FEMA-HAZUS, 2010], [ATC-58, 2009] as in the
study by Petromichelakis et al. [2014], the function describing the fragility of the structure has been
considered a lognormal cumulative density function, expressed by the equation (15).
i
ii
ZZFZLSiP
/ln)(]|[ (15)
Fi(Z) is the conditional probability that the structure will reach the considered limit state LS i. Z
represent the demand parameter, i.e. the seismic intensity, while Φ expresses the standard normal
(Gaussian) probability distribution function.
The parameter Θi and βi denotes mean and dispersion of each output variable of capacity or demand,
chosen to express the fragility of the structure. In this study, fragility functions have been expressed
both in terms of seismic intensity PGA (direct approach) (Figure 6. 10), for each limit state.
The quantities Θi and βi have been computed for 3 output variables, i.e. the peak ground acceleration
PGA, obtained through the use of the N2 method, for each limit state. The characteristic parameters
for the corresponding distributions have been defined through the equations (16) and (17).
(16)
(17)
Where zj is the value assumed by the output variable (PGA) for each sample, i.e. each numerical
model. Whereas N is the total number of samples, equal to 200.
The obtained fragility functions represent for the structure the probability of exceeding the
corresponding limit state for each level of seismic intensity (Figure 6. 10) or spectral displacement
(Errore. L'origine riferimento non è stata trovata.). Of course, for higher demand a higher
probability of damage is expected.

Vulnerability assessment of monumental masonry structures including uncertainty
Erasmus Mundus Programme
ADVANCED MASTERS IN STRUCTURAL ANALYSIS OF MONUMENTS AND HISTORICAL CONSTRUCTIONS 53
In Figure 6. 10 the vertical line for 0.04 g represent the peak ground acceleration corresponding to the
seismic demand expected in the municipality of Barcelona according to the Spanish code. The
expected demand results sufficient to reach the first grade of damage (Ds1), since a probability of
occurrence equal to 100% is reached. Whereas, the probability to exceed the moderate limit state
(Ds2) results equal to 50%. A significant low cumulative probability is reached for the third and the
fourth limit states, equal respectively to 12% and 5%. Thus, a low probability to have the collapse of
the structure is found for the actual earthquake demand.
Figure 6. 10 – Fragility curves for different limit states in terms of PGA
A further comparison has been done between the expected probability of occurrence of each limit
state and the corresponding grade of damage of the structure. Two capacity curves have been
considered, respectively for a damage mechanism of type G and L (sect. 6.2). The respective capacity
curve and bilinear are shown in Figure 6. 11 and Figure 6. 12. Four damage levels have been
identified on the bilinear curve, according to (sect. 6.3)

Vulnerability assessment of monumental masonry structures including uncertainty
Erasmus Mundus Programme
54 ADVANCED MASTERS IN STRUCTURAL ANALYSIS OF MONUMENTS AND HISTORICAL CONSTRUCTIONS
Figure 6. 11 – Damage grades associated to the model A002 – damage mechanism G1
Figure 6. 12 – Damage grades associated to the model A015 – damage mechanism L
In Figure 6. 13 the correspondence between each damage grade and its probability of occurrence is
shown for the model A002, representative of a global type of mechanism (type G). As already
mentioned, the probability of occurrence is referred to the actual seismic demand of Barcelona, equal
to 0.04 g. Interestingly, this demand results sufficient to produce the cracking in the triangular
buttresses, above the lateral vaults as well as the crack at the base of the right buttress, since the
corresponding probability of occurrence is equal to 100%. It can be noted how for the earthquake
demand of the area, the probability that severe damage occur in the central vault and at the base of
the right buttress is significantly low (lower than 12%).

Vulnerability assessment of monumental masonry structures including uncertainty
Erasmus Mundus Programme
ADVANCED MASTERS IN STRUCTURAL ANALYSIS OF MONUMENTS AND HISTORICAL CONSTRUCTIONS 55
Figure 6. 13 – Correspondence between damage grade and probability of occurrence. Model A002 – global mechanism (G)
Figure 6. 14 presents the correspondence between each damage grade and the corresponding
probability of occurrence for the model A015. In this case, as shown in sect.6.2, the collapse of the
structure is caused because of the local failure of the right buttress. For this model, the existing
earthquake demand is sufficient to produce a more severe grade of damage both in the lateral vaults
and in the buttresses. It is worth noticing that with a relevant probability of occurrence (50%) vertical
cracks develop in the right buttress. However, a comparatively low probability (5%) corresponds to the
local failure of the right buttress.
Ds1
P(%)=100%
Ds2
P(%)=50%
Ds3
P(%)=12%
Ds4
P(%)=5%

Vulnerability assessment of monumental masonry structures including uncertainty
Erasmus Mundus Programme
56 ADVANCED MASTERS IN STRUCTURAL ANALYSIS OF MONUMENTS AND HISTORICAL CONSTRUCTIONS
Figure 6. 14 - Correspondence between damage grade and probability of occurrence. Model A015 – local mechanism (L)
Ds1
P(%)=100%
Ds2
P(%)=50%
Ds3
P(%)=12%
Ds4
P(%)=5%

Vulnerability assessment of monumental masonry structures including uncertainty
Erasmus Mundus Programme
ADVANCED MASTERS IN STRUCTURAL ANALYSIS OF MONUMENTS AND HISTORICAL CONSTRUCTIONS 57
7. CONCLUSIONS
7.1 Summary
This work has studied the vulnerability of a monumental historical construction, the church of Santa
Maria Del Mar including the uncertainty related to the material mechanical parameters. A 2D model of
a representative macro-element of the church has been developed and calibrated on the previous 3D
model of the same macro-element studied by Murcia [2008]. Its seismic response has been studied by
means of a Pushover analysis.
The effect of the uncertainty regarding material properties has been investigated. More specifically for
each material, both aleatoric and epistemic uncertainties related to three parameters have been
considered, namely the tensile strength, compressive strength and the Young Modulus. These
uncertain proprieties have been modelled as random variables. A Monte Carlo simulation has been
used to propagate the effect of uncertainties, generated a population of N=200 random models, which
represent N possible instances of the structure.
A non – linear static analysis of each model has been performed in order to evaluate the variability of
the structural response. Four limit states has been defined, in function of the structural capacity and
the N2 method has been applied in order to evaluate the seismic demand associated to each limit
state. The variability of the structure’s resistance against seismic actions has been expressed in terms
of analytical lognormal fragility curves for different limit states. For the actual earthquake demand, the
probability of occurrence of each grade of damage has been found.
7.2 Conclusions of the research
A significant variation of the structural capacity has been found by varying the material mechanical
properties within selected ranges. Three distinct type of damage mechanism have been obtained for
different instances of the same structure, two distinct global mechanisms of damage (type G) and a
local mechanism (type L), due to the failure of the right buttress. According to the result, the structural
capacity of the structure is noticeably sensitive to the variation of material mechanical properties.
Therefore, the analysis of one numerical model may be unreliable in order to assess the actual
structural response.
Analytical fragility faction have been employed to express the vulnerability of the structure in terms of
probability of occurrence of selected damage grades. For both type of mechanism (G and L), the
seismic fragility assessment shows that the earthquake demand of the area is sufficient to damage the
triangular buttress, the upper part of lateral vaults and at the base of the right buttress, since this
damage grade is reached with a probability of 100%. Moreover, in case of a local mechanism (type L),
this demand is sufficient to induce additional damage in the upper half of the right buttress. Therefore,

Vulnerability assessment of monumental masonry structures including uncertainty
Erasmus Mundus Programme
58 ADVANCED MASTERS IN STRUCTURAL ANALYSIS OF MONUMENTS AND HISTORICAL CONSTRUCTIONS
for the expected earthquake demand the structure would present a significant level of damage.
However, the collapse of the structure (Ds4) corresponds to a very low probability of occurrence (5%).
7.3 Suggestions for future work
The current study shows the sensitivity of the structural response to the variation of material
mechanical properties. As already mentioned very different results have been found if the uncertainty
related to tensile strength, compressive strength and elastic modulus is modelled. However, more in
depth research is possible on the effect of each single parameter on the capacity and the collapse
mechanism.
Moreover, in the present case study, a population of N=200 simulated models have been analyzed,
which is expected to produce statistical reliable results, in agreement with [Petromichelakis et al.,
2014], [Vamvastsikos at al., 2010], [Jalayer et al., 2010]. Further studies could investigate on the
definition of the optimal number N of samples, able to guarantee a stable dispersion of the results.
Furthermore, in this work only the structural uncertainty related to the material parameters has been
considered, while the geometry of the structure is treated deterministically. However, the uncertainties
related to the geometry of the structure result relevant especially for the columns, damaged by the fire
occurred in 1936. Additional uncertainty related to the variability due to the possible geometrical
configurations of the columns could be taken into account in further studies.
Finally, as implied in the N2 method, the control point has been chosen at the top of the structure,
from the hypothesis that this is usually the point with the higher displacement. However, as already
discussed in [Petromichelakis et al., 2014], [Pelà, 2009] in case of masonry buildings this may not be
true, since a higher displacements can be found for a different point of the structure. Thus, the choice
of the control node affects significantly the estimation of the structural performance. Moving by this
evidence, further research could focus on the development of a more adequate methodology for the
determination of the target displacement for masonry structures.

Vulnerability assessment of monumental masonry structures including uncertainty
Erasmus Mundus Programme
ADVANCED MASTERS IN STRUCTURAL ANALYSIS OF MONUMENTS AND HISTORICAL CONSTRUCTIONS 59
REFERENCES
ATC-58, Guidelines for Seismic Performance Assessment of Buildings, Applied Technology Council,
Redwood City, California, 2009.
Cattari, Serena, Sergio Lagomarsino, and Daria Ottonelli. Fragility curves for masonry buildings from
empirical and analytical models. Proceedings of the 2nd Conference on Earthquake Engineering and
Seismology, Istanbul August. 2014.
Cattari, S., et al. Vulnerability assessment of Hassan Bey’s mansion in rhodes. Bulletin of Earthquake
Engineering 13.1 (2015): 347-368.
Circolare, L. L. febbraio 2009, n. 617 Istruzioni per l’applicazione delle «Nuove norme tecniche per le
costruzioni» di cui al decreto ministeriale 14 gennaio 2008. (2): 447.
Clemente, R. Análisis estructural de edificios históricos mediante modelos localizados de fisuración.
Centro Internacional de Métodos Numéricos en Ingeniería, 2007.
CNR-DT 212/2013. Istruzioni per la Valutazione Affidabilistica di Edifici Esistenti. Consiglio Nazionale
delle Ricerche, Roma, 14 maggio 2014.
Contrafatto F. R. Valutazione affidabilistica della sicurezza sismica di edifici esistenti. Master Thesis.
Università degli studi di Catania, 2015
Costa, Alexandre A., Andrea Penna, and Guido Magenes. Seismic performance of autoclaved aerated
concrete (AAC) masonry: from experimental testing of the in-plane capacity of walls to building
response simulation. Journal of Earthquake Engineering 15.1 (2011): 1-31.
Drougkas, Anastasios, Pere Roca, and Climent Molins. Numerical prediction of the behavior, strength
and elasticity of masonry in compression. Engineering Structures 90 (2015): 15-28.
Dymiotis, Christiana, Andreas J. Kappos, and Marios K. Chryssanthopoulos. "Seismic reliability of RC
frames with uncertain drift and member capacity." Journal of Structural Engineering 125.9 (1999):
1038-1047.
Fajfar, P. Capacity Spectrum Method based on inelastic demand spectra. Earthquake Engineering
and Structural Dynamics, 28. (1999)
Federal Emergency Management Agency, HAZUS-MH MR4: Technical Manual, Vol. Earthquake
Model, Washington DC, 2010.
Freeman, Sigmund A. The capacity spectrum method. Proceedings of the 11th European conference
on earthquake engineering, Paris. 1998.
Graf, W., M. Götz, and M. Kaliske. Analysis of dynamical processes under consideration of
polymorphic uncertainty. Structural Safety 52 (2015): 194-201.

Vulnerability assessment of monumental masonry structures including uncertainty
Erasmus Mundus Programme
60 ADVANCED MASTERS IN STRUCTURAL ANALYSIS OF MONUMENTS AND HISTORICAL CONSTRUCTIONS
GRUNTHAL, Gottfried. European macroseismic scale 1998. Cahiers du centre Européen de
Géodynamique et de Séismologie 15 (1998): 1-99.
Irizarry, J. (2004). An advanced approach to seismic risk assessment. Application to the cultural
heritage and the urban system of Barcelona. PhD. Thesis. Civil Engineering School of Barcelona,
Technical University of Catalonia.
Jalayer, F., P. Franchin, and P. E. Pinto. A scalar damage measure for seismic reliability analysis of
RC frames. Earthquake Engineering & Structural Dynamics 36.13 (2007): 2059-2079.
Lagomarsino, Sergio, and Sonia Giovinazzi. Macroseismic and mechanical models for the vulnerability
and damage assessment of current buildings. Bulletin of Earthquake Engineering 4.4 (2006): 415-443.
Lagomarsino, Sergio, and Serena Cattari. Fragility functions of masonry buildings. SYNER-G:
Typology definition and fragility functions for physical elements at seismic risk. Springer Netherlands,
2014. 111-156.
Lagomarsino, Sergio, and Serena Cattari. "PERPETUATE guidelines for seismic performance-based
assessment of cultural heritage masonry structures." Bulletin of Earthquake Engineering 13.1 (2015):
13-47.
Lourenço, Paulo B. Recent advances in masonry modelling: micromodelling and homogenisation.
Multiscale Model. Solid Mech. Comput. Approaches 3 (2009): 251-294.
Ministero Infrastrutture, D.M.14/1/2008 “Norme Tecniche per le Costruzioni”,2008. (integrate text con
la Circolare n°617/C.S.LL.PP. del 2/2/2009)
Murcia Delso, Juan. Seismic analysis of Santa Maria del Mar church in Barcelona, MS thesis,
Universitat Politècnica de Catalunya, 2008.
Pagnini, L. C., Vicente, R., Lagomarsino, S., & Varum, H. A mechanical model for the seismic
vulnerability assessment of old masonry buildings. Earthquakes and structures, 2011, 2(1), 25-42.
Park, Joonam, et al. Seismic fragility analysis of low-rise unreinforced masonry structures. Engineering
Structures 31.1 (2009): 125-137.
PATRIMONI-UB, Estudi geotècnic en primera fase per a la diagnosi de pathologies afectant
determinants sectors de la basilica de Santa Maria del Mar, a Barcelona, 2007
Pelà, Luca, Alessandra Aprile, and Andrea Benedetti. Seismic assessment of masonry arch
bridges. Engineering Structures 31.8 (2009): 1777-1788.
Petromichelakis Y., Saloustros S., Pelà L., Seismic assessment of historical masonry construction
including uncertainty. Proceedings of the 9th International Conference on Structural Dynamics,
EURODYN 2014, 297-304.
Roca,P, Basílica de Santa Maria del Mar: estudi de l’estructura, Universitat Politècnica de Catalunya,
2007.

Vulnerability assessment of monumental masonry structures including uncertainty
Erasmus Mundus Programme
ADVANCED MASTERS IN STRUCTURAL ANALYSIS OF MONUMENTS AND HISTORICAL CONSTRUCTIONS 61
Rota, M., A. Penna, and G. Magenes. A methodology for deriving analytical fragility curves for
masonry buildings based on stochastic nonlinear analyses, Engineering Structures (2010), 32.5:
1312-1323.
Singhal, Ajay, and Anne S. Kiremidjian. Method for probabilistic evaluation of seismic structural
damage. Journal of Structural Engineering 122.12 (1996): 1459-1467.
Sýkora, Miroslav, and Milan Holický. Probabilistic model for masonry strength of existing
structures. Engineering Mechanics 17.1 (2010): 61-70.
Tondelli, M., Rota, M., Penna, A., & Magenes, G. Evaluation of uncertainties in the seismic
assessment of existing masonry buildings. Journal of Earthquake Engineering 2012, 16(sup1), 36-64.
Vendrell, M., Giràldez, P., Caballé, F., González, R., Roca, P. Estudi històrico constructiu, materials
de construcció i estabilitat estructural de Santa Maria del Mar. Departament de Cultura i Mitjans de
Comunicació, Generalitat de Catalunya. (2007)