Embed Size (px)
Citation preview

2nd Reading
July 4, 2012 13:56 WSPC/S0219-5259 169-ACS 1250065
Advances in Complex SystemsVol. 15, No. 6 (2012) 1250065 (13 pages)c© World Scientific Publishing CompanyDOI: 10.1142/S0219525912500658
FRACTAL MARKETS HYPOTHESIS AND THEGLOBAL FINANCIAL CRISIS: SCALING, INVESTMENT
HORIZONS AND LIQUIDITY
LADISLAV KRISTOUFEK
Institute of Economic Studies, Faculty of Social Sciences,Charles University, Opletalova 26, 110 00, Prague, Czech Republic
and
Institute of Information Theory and Automation,Academy of Sciences of the Czech Republic,
Pod Vodarenskou vezi 4, 182 08, Prague, Czech Republic
Received 30 January 2012Revised 6 May 2012Accepted 8 May 2012Published 6 July 2012
We investigate whether the fractal markets hypothesis and its focus on liquidity andinvestment horizons give reasonable predictions about the dynamics of the financialmarkets during turbulences such as the Global Financial Crisis of late 2000s. Comparedto the mainstream efficient markets hypothesis, the fractal markets hypothesis considersthe financial markets as complex systems consisting of many heterogenous agents, whichare distinguishable mainly with respect to their investment horizon. In the paper, sev-eral novel measures of trading activity at different investment horizons are introducedthrough the scaling of variance of the underlying processes. On the three most liquid USindices — DJI, NASDAQ and S&P500 — we show that the predictions of the fractalmarkets hypothesis actually fit the observed behavior adequately.
Keywords: Fractal markets hypothesis; scaling; fractality; investment horizons; efficientmarkets hypothesis.
1. Introduction
The efficient markets hypothesis (EMH) has been a hot topic since its introductionin 1960s [11, 12, 30]. For its simplicity and intuitive logical structure, EMH hasbeen widely accepted as a cornerstone of the modern financial economics. Sincethe very beginning, EMH has been criticized on several fronts, mainly theoreti-cal — that it is only a set of practically meaningless tautologies [20] — and empir-ical — that it is frequently violated and financial markets are at least partiallypredictable [21].
In his pioneering paper, Fama [12] describes the efficient market as the onewhere all available information are already reflected in the asset prices. In hislater work [13], he defined the efficient market through the language of mainstream
1250065-1
Adv
s. C
ompl
ex S
yst.
Dow
nloa
ded
from
ww
w.w
orld
scie
ntif
ic.c
omby
WSP
C o
n 07
/24/
12. F
or p
erso
nal u
se o
nly.

2nd Reading
July 4, 2012 13:56 WSPC/S0219-5259 169-ACS 1250065
L. Kristoufek
economics as the one where prices reflect available information to the point wherea marginal gain from using the information equals a marginal cost of obtaining it.Based on this assertion, the efficient market is defined as a random walk [11], con-trary to Samuelson’s formulation through a martingale [30]. Either way, the efficientmarket leads to a Brownian motion of the asset prices, i.e., a process with inde-pendent and identically normally distributed increments. Apart from an uncorre-latedness of increments (autocorrelations have been shown to vanish for lags higherthan units of minutes [33]), the implications of EMH have been widely rejected inempirical studies [3]. However, the most severe shortcoming of EMH is its igno-rance to extreme (and sometimes devastating) events on the capital markets, whichtheoretically should have never happened [32].
EMH has far-reaching implications, which are discussed in majority of finan-cial economics textbooks [10] — investors are rational and homogeneous, financialreturns are normally distributed, standard deviation is a meaningful measure of risk,there is a tradeoff between risk and return, and future returns are unpredictable.To some extent, all of these implications can be easily attacked with empirical anal-ysis. For our purposes, the first implication of homogeneous investors is crucial. Itimplies that all the investors use the available information in the same way andthus they operate on the same investment horizon (or theoretically the same set ofinvestment horizons). However, it is known that capital markets comprise of vari-ous investors with very different investment horizons — from algorithmically-basedmarket makers with the investment horizon of fractions of a second, through noisetraders with the horizon of several minutes, technical traders with the horizons ofdays and weeks, and fundamental analysts with the monthly horizons to pensionfunds with the horizons of several years. For each of these groups, the informationhas different value and is treated variously. Moreover, each group has its own trad-ing rules and strategies, while for one group the information can mean severe losses,for the other, it can be taken as a profitable opportunity. This environment createsa very complex system, which can be hardly described by oversimplified EMH.
On contrary, the fractal markets hypothesis (FMH) [28] has been constructedbased on the most general characteristics of the markets. In its core, it is basedon a notion completely omitted in EMH — liquidity. According to FMH, liquid-ity provides smooth pricing process in the market, making it stable. If liquidityceases, the market becomes unstable and extreme movements occur. In the litera-ture, FMH is usually connected with detection of fractality or multifractality of theprice processes of the financial assets [28, 23, 24]. However, it has not been put totest with respect to its predictions about causes and implications of critical eventsin the financial markets. In this paper, we analyze whether these predictions fitthe observed behavior in the stock markets before and during the current GlobalFinancial Crisis (2007/2008 onwards). Mainly, we are interested in the behavior ofinvestors at various investment horizons as well as in scaling of the market returns.To do so, we utilize a sliding window estimation of the generalized Hurst exponent
1250065-2
Adv
s. C
ompl
ex S
yst.
Dow
nloa
ded
from
ww
w.w
orld
scie
ntif
ic.c
omby
WSP
C o
n 07
/24/
12. F
or p
erso
nal u
se o
nly.

2nd Reading
July 4, 2012 13:56 WSPC/S0219-5259 169-ACS 1250065
Fractal Markets Hypothesis and the Global Financial Crisis
H(q) with q = 2 (usually called local or time-dependent Hurst exponent). More-over, we introduce several new measures of trading activity at different investmenthorizons based on a decomposition of Hurst exponent and variance scaling.
The local Hurst exponent approach has been repeatedly used to analyze poten-tial turning and critical points in the stock market behavior. Grech and Mazur [14]studied the crashes of 1929 and 1987 focusing on the behavior of Dow Jones Indus-trial Index and showed that the local Hurst exponent analysis can provide importantsignals about coming extreme events. In the series of papers, Czarnecki, Grech andPamula [15, 5] studied the critical events of the Polish main stock index WIG20 andagain presented the local Hurst exponent as a useful tool for a detection of com-ing crashes (together with the log-periodic model of Sornette and co-authors [31]).Domino [8, 9] further studied the connection between the local Hurst exponentbehavior and the critical events of WIG20 index. Kristoufek [18] applied the simi-lar technique to detect coming critical points of PX50 index of the Czech Republicstock market and uncovered that the functioning is very similar. Morales and co-authors [22] broadened the application of the time-dependent Hurst exponent on awide portfolio of the US stocks and showed that the values of Hurst exponent canbe connected to different phases of the market.
In this paper, we show that behavior of the time-dependent Hurst exponentis connected to various phases of the market. Moreover, we uncover that thereare some common patterns before the critical points occur. Most importantly, theGlobal Financial Crisis is detected to be connected with an unstable trading andan unbalanced activity at different investment horizons which is asserted by FMH.The paper is organized as follows. In Sec. 2, we give basic definitions of the fractalmarkets hypothesis. Section 3 describes multifractal detrended fluctuation analysis,which we use for the generalized Hurst exponent estimation, and introduces newmeasures of trading activity at specific investment horizons. In Sec. 4, we testwhether the assertions of FMH are actually observed in the real markets. All threeanalyzed indices — DJI, NASDAQ and S&P500 — share several interesting patternsbefore and during the current financial crisis, which are in hand with FMH.
2. Fractal Markets Hypothesis
The fractal markets hypothesis (FMH) was proposed by Peters [28] as a follow-upto his earlier criticism of EMH [27]. The cornerstone of FMH is a focus on hetero-geneity of investors mainly with respect to their investment horizons. The marketconsists of the investors with investment horizons from several seconds and minutes(market makers, noise-traders) up to several years (pension funds). Investors withdifferent investment horizons treat the inflowing information differently and theirreaction is correspondingly distinct (market participants with the short investmenthorizon focus on the technical information and crowd behavior of other market par-ticipants, whereas investors with the long investment horizon base their decisionson the fundamental information and care little about the crowd behavior). Specific
1250065-3
Adv
s. C
ompl
ex S
yst.
Dow
nloa
ded
from
ww
w.w
orld
scie
ntif
ic.c
omby
WSP
C o
n 07
/24/
12. F
or p
erso
nal u
se o
nly.

2nd Reading
July 4, 2012 13:56 WSPC/S0219-5259 169-ACS 1250065
L. Kristoufek
information can be a selling signal for the short-term investor but an opportunityto buy for the long-term investor, and vice versa. An existence of the investors withdifferent horizons assures a stable functioning of the market. When one horizon (ora group of horizons) becomes dominant, selling or buying orders of the investorsat this horizon will not be met with a reverse order of the remaining horizons andprices might collapse. Therefore, the existence and activity of the investors with awide range of investment horizons is essential for a smooth and stable functioningof the market [29, 34].
Fractal markets hypothesis thus suggests that during the stable phases of themarket, all investment horizons are equally represented so that the supply anddemand on the market are smoothly cleared. Reversely, the unstable periods suchas “crises” occur when the investment horizons are dominated by only several ofthem so that the supply and demand of the different groups of investors are notefficiently cleared. These two implications give us characteristic features to look forin the market behavior.
FMH is tightly connected to a notion of multifractality and long-range depen-dence in the underlying series. Process Xt is considered multifractal if it has sta-tionary increments which scale as
〈|Xt+τ − Xt|q〉 ∝ τqH(q)
for integer τ > 0 and for all q [2]. H(q) is called the generalized Hurst exponentand its dependence on q separates the processes into two categories — monofractal(or unifractal) for constant H(q) and multifractal when H(q) is a function of q. Forq = 2, we consider the long-range dependence of the increments of the process Xt.As this case is the most important for us as it characterizes the scaling of variance(and we treat variance as a sign of a trading activity), we label H ≡ H(2) further inthe text. Hurst exponent H is connected to asymptotically hyperbolically decayingautocorrelation function ρ(k), i.e., ρ(k) ∝ k2H−2 for k → ∞. For H = 0.5, we havea serially uncorrelated process; for H > 0.5, we have a persistent process; and forH < 0.5, we an anti-persistent process. Persistent processes are visually (locally)trending yet still remain stationary, whereas anti-persistent processes switch theirsign more frequently than random processes do.
3. Scaling of Stock Returns
In this section, we present the method we use for the estimation of the generalizedHurst exponent — multifractal detrended fluctuation analysis (MF-DFA) — andseveral novel measures connected to the trading activity at various trading horizons.MF-DFA is applied here because it is standardly used in the local Hurst exponentliterature [14, 15, 5, 18] and compared to other methods, such as generalized Hurstexponent approach [7, 6, 1, 19], it provides a wider range of scales to analyze. Aswe want to compare as many investment horizons as possible, such a distinctionleads to MF-DFA.
1250065-4
Adv
s. C
ompl
ex S
yst.
Dow
nloa
ded
from
ww
w.w
orld
scie
ntif
ic.c
omby
WSP
C o
n 07
/24/
12. F
or p
erso
nal u
se o
nly.
2nd Reading
July 4, 2012 13:56 WSPC/S0219-5259 169-ACS 1250065
Fractal Markets Hypothesis and the Global Financial Crisis
3.1. Multifractal detrended fluctuation analysis
Multifractal detrended fluctuation analysis (MF-DFA) is a generalization ofdetrended fluctuation analysis (DFA) of Peng and his colleagues [25, 26]. Kan-telhardt and colleagues [17] proposed MF-DFA to analyze scaling of all possiblemoments q, not only the second one (q = 2) as for DFA. One of the advantages ofMF-DFA and DFA over other techniques is that it can be applied on series withH > 1, i.e., a higher order of integration.
In the procedure, one splits the series of length T into segments of length s. Foreach segment, a polynomial fit X̂s,l of order l is constructed for the original segmentXs. In our analysis, we apply a linear fit so that l = 1 and we will omit the labelonwards. Note that the filtering procedure can be chosen not only from polynomialfits but also from various moving averages, Fourier transforms and others [16]. Adetrended signal is constructed for each segment as Ys = Xs − X̂s. A fluctuationF 2
DFA,q (j, s) is defined for each sub-period j of the length s as
F 2DFA,q(j, s) =
[T/s]∑
i=1
Y 2i,s/s
12
.
As T/s is not necessarily an integer, we calculate the fluctuations in the segmentsstarting from the beginning as well as from the end of the series not to omit anyobservation. By doing so, we obtain 2[T/s] fluctuations F 2
DFA,q (j, s). The fluctua-tions are then averaged over all segments with the length s to obtain an averagefluctuation
FDFA,q(s) =
2[T/s]∑
j=1
F 2DFA,q (j, s)/2[T/s]
1q
.
The average fluctuations scale as FDFA,q (s) = csH(q) where H(q) is the generalizedHurst exponent and c is a constant. For q = 2, we obtain the standard DFA forthe long-range dependence analysis. Hurst exponent is usually estimated only for arange of scales s between smin and smax. The minimum scale is set so that the fitin each segment can be efficiently calculated and the maximum scale is set so thatthe average fluctuation for this scale is based on enough observations.
3.2. Scaling-based liquidity measures
The estimation of Hurst exponent compresses all the information from the dynamicsof the process into a single value. However, the procedure can be also decompressedback to give some additional information. From the economic point of view, thesegment’s length s can be taken as a length of the investment horizon. The fluctu-ation corresponding to the horizon s can be then taken as a proxy for the activityof traders with the horizon of s. From our previous discussion about situations ofmarket instabilities in FMH framework, we propose several new measures.
1250065-5
Adv
s. C
ompl
ex S
yst.
Dow
nloa
ded
from
ww
w.w
orld
scie
ntif
ic.c
omby
WSP
C o
n 07
/24/
12. F
or p
erso
nal u
se o
nly.

2nd Reading
July 4, 2012 13:56 WSPC/S0219-5259 169-ACS 1250065
L. Kristoufek
The trading activity of investors with very short investment horizons can beapproximated with F̂ (0) = ebc, which is an estimate of the fluctuation at the hori-zon s → 0. In the unstable market, it is assumed that the investors at the veryshort horizons will be the most active ones. Also, some long-term investors mightshorten their horizons [28]. Therefore, we assume that close to and during the mar-ket turmoils, F̂ (0) will increase compared to the stable periods.
In the stable market, all investment horizons are represented uniformly (or atleast approximately uniformly). During the critical points, the long-term investorseither restrict or even stop their trading activities and the short-term investorsbecome dominant. Trading activity and thus fluctuations F 2 at the shorter tradinghorizons will be higher than the rescaled trading activity at the longer horizons.Therefore, Hurst exponent H would be decreasing shortly before and during theturbulent times at the market. This is in hand with the definition of an irregularmarket of Corazza and Malliaris [4].
In the regular market, the scaling of variance should be stable, i.e., the fluc-tuations F 2 for different horizons s should lay on a straight line. If any of theinvestment horizons becomes dominant, the scaling would be less precise. To mea-sure such a dispersion of the trading activity at different investment horizons, weintroduce Fσ, which is a standard deviation of the rescaled fluctuations, and FR,which is a range of the rescaled fluctuations:
Fσ =
√√√√∑smaxs=smin
(F 2(s)/s2 bH − ∑smax
s=sminF 2(s)/s2 bH(smax − smin + 1)
)2
smax − smin;
FR = maxsmin≤s≤smax
(F 2(s)/s2 bH
)− min
smin≤s≤smax
(F 2(s)/s2 bH
).
During the turbulent times, both Fσ and FR are expected to increase. In a similarmanner, we also define a ratio Fr between the rescaled fluctuations of the horizonswith the maximal and minimal rescaled fluctuation. In an ideal market with uni-formly represented investment horizons, we would have Fr = 1. The further Fr isfrom 1, the less stable the scaling is and thus also the less stable the market is.
4. Application to the Global Financial Crisis
4.1. Data and methodology
To check whether the implications of FMH hold, we apply the proposed method-ology to the daily series of three US indices — Dow Jones Industrial AverageIndex (DJI), NASDAQ Composite Index (NASDAQ) and S&P500 Index (SPX) —between the beginning of 2000 and the end of 2011. As it is widely believed thatthe crisis started in the USA and spilled over to the other parts of the world, wechoose the US indices because they should signify the coming and continuing crisisthe best. If the predictions of FMH hold, we expect the local Hurst exponent tobe decreasing before the critical point and remaining below H = 0.5 during the
1250065-6
Adv
s. C
ompl
ex S
yst.
Dow
nloa
ded
from
ww
w.w
orld
scie
ntif
ic.c
omby
WSP
C o
n 07
/24/
12. F
or p
erso
nal u
se o
nly.
2nd Reading
July 4, 2012 13:56 WSPC/S0219-5259 169-ACS 1250065
Fractal Markets Hypothesis and the Global Financial Crisis
crisis. In a similar way, the trading activity at the short horizons F̂ (0) should beincreasing before the crisis and remain high during the crisis compared to the morestable periods. The very same expectations hold for Fσ and FR. For Fr, we expectthe values to be further from one before and during the crisis times.
We use the moving (sliding) window procedure with a window length T = 500trading days (approximately two trading years) and a step of one day. For MF-DFA,we set smin = 10 and smax = T/10 = 50. This way, we can estimate H , F̂ (0), Fσ,FR and Fr and comment on their evolution in time and during various phases ofthe market behavior.
To meet stationarity condition, which is essential for correct Hurst exponentestimation, we filter the raw series with GARCH(1,1). Therefore, the analysis ismade on the filtered series defined as frt = rt/
√ht, where frt is a filtered return
at time t, rt is a raw return at time t, defined as rt = log(St/St−1) with St beinga stock index closing value at time t, and ht is a conditional variance obtainedfrom GARCH(1,1) at time t. The GARCH-filtering is a crucial addition to themethodology because without comparable volatility in the different time windows,we would not be able to say whether e.g., an increase in F̂ (0) is caused by a changingstructure of the investors activity or just an increase of variance across all scales(investment horizons).
4.2. Results
Results for all three analyzed indices are summarized in Figs. 1–3. All the indicesreached their post-DotCom bubble maxima in the latter half of 2007, which werefollowed by a progressively decreasing trend culminating at the turn of 2008. Simi-larly to the indices all over the world, the US indices lost around half of their valueduring that approximately 1.5 year — the loss accounted for 53.78%, 61.22% and56.77% for DJI, NASDAQ and S&P500, respectively. However, all three indiceshave been strongly increasing since the bottoms in the beginning of 2009 and havealmost recovered all the losses by the end of 2011.
For all three indices, we observe very similar patterns in the behavior of all thevariables of interest. Starting with the behavior of the local Hurst exponent, we cansee that for all indices, H followed a strong decreasing trend from the break of 2005and 2006 till the beginning of 2007. For NASDAQ, the trend followed even to thesecond half of 2007. Such a behavior can be attributed to a changing structure ofinvestors’ activity — increasingly more trading activity was taking place at the shortinvestment horizons. The end of these strong downward trends of H is connectedto the end of soaring gains of all the analyzed indices. For NASDAQ, the end of thelocal Hurst exponent trend can be even connected to attaining the maximal valuesin the of 2007. Afterwards, the local Hurst exponent follows a slow increasing trendfor all three indices. However, H remains below the value of 0.5, which is associatedwith a random behavior, for a rather long period. The lengths of these periods varyacross the analyzed indices — the longest for S&P500, which is the index with the
1250065-7
Adv
s. C
ompl
ex S
yst.
Dow
nloa
ded
from
ww
w.w
orld
scie
ntif
ic.c
omby
WSP
C o
n 07
/24/
12. F
or p
erso
nal u
se o
nly.

2nd Reading
July 4, 2012 13:56 WSPC/S0219-5259 169-ACS 1250065
L. Kristoufek
Fig. 1. Results for DJI index.
lowest gains after the crisis. These two phenomena might be connected because forNASDAQ, which has been the most increasing market of the three after the crisis,we observe the values of H even above 0.5 in 2010 and 2011. Note that the valuesof H > 0.5 indicate a dominance of the long-term traders (a higher trading activityat the long investment horizons) and thus a belief in good prospects of the marketsituation.
When we look at the short horizons trading activity F̂ (0), we observe that it wasincreasing in a very similar period as Hurst exponent was decreasing in the previousparagraph. The measure increased from the values of approximately 0.04 up to over0.12 for all three analyzed indices. After reaching its peak, the trading activity atthe short horizons was slowly decreasing back to the original levels of the beginningof 2006. Again, we observe differences in the duration of this downward trend.For NASDAQ, the pre-crisis levels of the short-term trading activity were reachedaround the beginning of 2009 and since then, the activity has remained relativelystable. On contrary, DJI has not reached the pre-crisis levels yet and S&P500 got
1250065-8
Adv
s. C
ompl
ex S
yst.
Dow
nloa
ded
from
ww
w.w
orld
scie
ntif
ic.c
omby
WSP
C o
n 07
/24/
12. F
or p
erso
nal u
se o
nly.

2nd Reading
July 4, 2012 13:56 WSPC/S0219-5259 169-ACS 1250065
Fractal Markets Hypothesis and the Global Financial Crisis
Fig. 2. Results for NASDAQ index.
back to the pre-crisis levels during 2010. Even though the durations and magnitudesof the short-term trading activity vary between the analyzed markets, we observethat the most critical points of the crisis were connected to the increased tradingactivity of the short-term investors.
The other two measures — the standard deviation of the rescaled fluctuations Fσ
and the range of the rescaled fluctuations FR — tell a very similar story. Since bothare the measures of instability of the variance scaling across the different invest-ment horizons, this is not surprising. The results are actually very similar to thedynamics of the estimated fluctuations at the very short investment horizons dis-cussed in the previous paragraph — a very rapid increase starting in the 2005/2006turning which followed to the first half of 2007 (and again longer for NASDAQ).According to FMH, the unevenly represented investment horizons imply a com-plicated matching between supply and demand at the financial market. Therefore,the increasing instability of the trading activity at the different investment hori-zons indicates growing problems of this supply–demand matching. After the strong
1250065-9
Adv
s. C
ompl
ex S
yst.
Dow
nloa
ded
from
ww
w.w
orld
scie
ntif
ic.c
omby
WSP
C o
n 07
/24/
12. F
or p
erso
nal u
se o
nly.
2nd Reading
July 4, 2012 13:56 WSPC/S0219-5259 169-ACS 1250065
L. Kristoufek
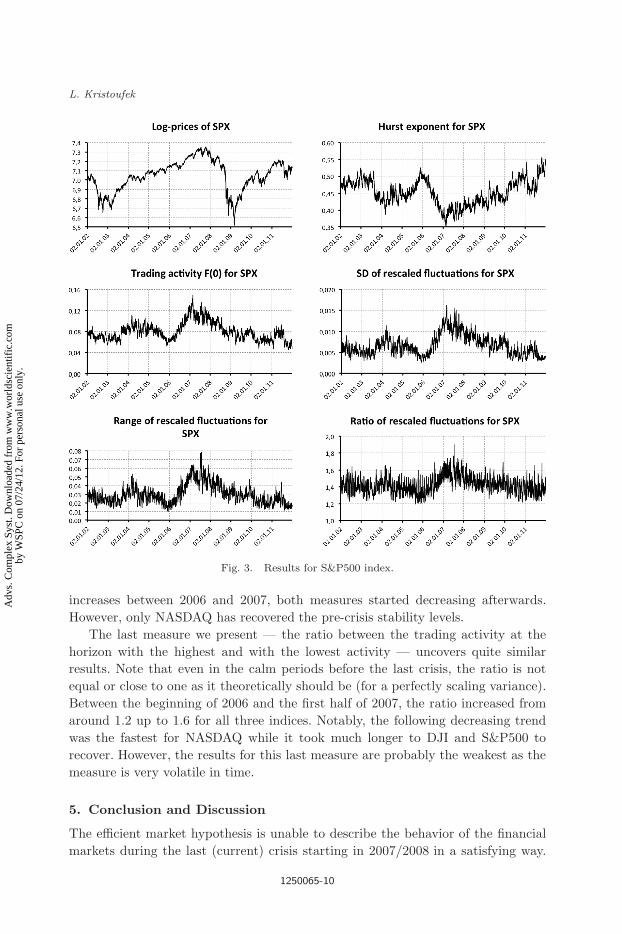
Fig. 3. Results for S&P500 index.
increases between 2006 and 2007, both measures started decreasing afterwards.However, only NASDAQ has recovered the pre-crisis stability levels.
The last measure we present — the ratio between the trading activity at thehorizon with the highest and with the lowest activity — uncovers quite similarresults. Note that even in the calm periods before the last crisis, the ratio is notequal or close to one as it theoretically should be (for a perfectly scaling variance).Between the beginning of 2006 and the first half of 2007, the ratio increased fromaround 1.2 up to 1.6 for all three indices. Notably, the following decreasing trendwas the fastest for NASDAQ while it took much longer to DJI and S&P500 torecover. However, the results for this last measure are probably the weakest as themeasure is very volatile in time.
5. Conclusion and Discussion
The efficient market hypothesis is unable to describe the behavior of the financialmarkets during the last (current) crisis starting in 2007/2008 in a satisfying way.
1250065-10
Adv
s. C
ompl
ex S
yst.
Dow
nloa
ded
from
ww
w.w
orld
scie
ntif
ic.c
omby
WSP
C o
n 07
/24/
12. F
or p
erso
nal u
se o
nly.

2nd Reading
July 4, 2012 13:56 WSPC/S0219-5259 169-ACS 1250065
Fractal Markets Hypothesis and the Global Financial Crisis
We analyze whether an alternative approach — the fractal markets hypothesis —gives more reasonable predictions. The cornerstone of FMH is liquidity connected tothe trading activity at different investment horizons. If the investors with differenthorizons are uniformly distributed across scales, supply and demand for the financialassets work efficiently. However, when a specific investment horizon (or a groupof horizons) starts to dominate the situation in the market, the supply–demandmatching ceases to work and a critical point emerges. To test whether this crucialassertion of FMH holds for the current crisis, we used the local Hurst exponentapproach as well as the introduced set of new measures of the trading activitybased on the Hurst exponent decomposition.
We found that the behavior at various investment horizons is quite well describedby FMH before and during the current Global Financial Crisis. Analyzing threestock indices of the USA — DJI, NASDAQ and S&P500 — we showed that thelocal Hurst exponent decreased rapidly before the turning of the trend, which isin hand with previously published results [14, 15, 5, 18]. Moreover, with the useof new measures of the trading activity, we uncovered that the investors’ trad-ing activity indeed changes before and during the crisis period compared to thepreceding stable periods. Before the crisis, the structure of the trading activity atdifferent investment horizons changed remarkably with a rapidly increasing activityat the shortest horizons, i.e., the short-term investors started to dominate and thelong-term investors showed little faith in a continuing growth. Also, the stabilityof investment horizons representation changed before the current turbulent times.The uniformity of investment horizons representation started to cease before theoutburst of the crisis. During and after the most severe losses, the indicators startedto stably return to the pre-crisis levels. However, they have fully recovered only forNASDAQ index while DJI and S&P500 are just attaining the former stability. Notethat NASDAQ, which is the index with the fastest recovering investment horizonsmeasures, is also the index which returned to the pre-crisis values the fastest.
Summarizing, we have showed that the fractal markets hypothesis gives rea-sonable predictions of the market dynamics in the turbulent times. The tradingactivity at various investment horizons ensuring the efficient clearing of supply anddemand in the market, which guarantees high liquidity, turns out to be a crucialattribute of a well-functioning and stable market.
Acknowledgments
The support from the Grant Agency of Charles University (GAUK) under project118310, Grant Agency of the Czech Republic (GACR) under projects 402/09/0965and P402/11/0948, and project SVV 265 504 are gratefully acknowledged.
References
[1] Barunik, J. and Kristoufek, L., On Hurst exponent estimation under heavy-taileddistributions, Physica A 389(18) (2010) 3844–3855.
1250065-11
Adv
s. C
ompl
ex S
yst.
Dow
nloa
ded
from
ww
w.w
orld
scie
ntif
ic.c
omby
WSP
C o
n 07
/24/
12. F
or p
erso
nal u
se o
nly.

2nd Reading
July 4, 2012 13:56 WSPC/S0219-5259 169-ACS 1250065
L. Kristoufek
[2] Calvet, L. and Fisher, A., Multifractal Volatility: Theory, Forecasting, and Pricing(Academic Press, 2008).
[3] Cont, R., Empirical properties of asset returns: stylized facts and statistical issues,Quant. Finance 1 (2001) 223–236.
[4] Corazza, M. and Malliaris, A. G., Multifractality in foreign currency markets, Multi-national Finance J. 6 (2002) 387–401.
[5] Czarnecki, L., Grech, D. and Pamula, G., Comparison study of global and localapproaches describing critical phenomena on the polish stock exchange market,Physica A 387 (2008).
[6] Di Matteo, T., Multi-scaling in finance, Quant. Finance 7(1) (2007) 21–36.[7] Di Matteo, T., Aste, T. and Dacorogna, M., Long-term memories of developed and
emerging markets: Using the scaling analysis to characterize their stage of develop-ment, J. Bank. Finance 29 (2005) 827–851.
[8] Domino, K., The use of the Hurst exponent to predict changes in trends on theWarsaw Stock Exchange, Physica A 390 (2011) 98–109.
[9] Domino, K., The use of the Hurst exponent to investigate the global maximum ofthe Warsaw Stock Exchange WIG20 index, Physica A 391 (2012) 156–169.
[10] Elton, E., Gruber, M., Brown, S. and Gotzmann, W., Modern Portfolio Theory andInvestment Analysis (John Wiley & Sons, Inc., New York, 2003).
[11] Fama, E., Random walks in stock market prices, Financ. Anal. J. 21(5) (1965) 55–59.[12] Fama, E., Efficient Capital Markets: A Review of Theory and Empirical Work, J.
Finance 25 (1970) 383–417.[13] Fama, E., Efficient Capital Markets: II, J. Finance 46(5) (1991) 1575–1617.[14] Grech, D. and Mazur, Z., Can one make any crash prediction in finance using the
local hurst exponent idea? Physica A 336 (2004).[15] Grech, D. and Pamula, G., The local hurst exponent of the financial time series in
the vicinity of crashes on the polish stock exchange market, Physica A 387 (2008).[16] Kantelhardt, J., Encyclopedia of Complexity and Systems Science, Chapter Fractal
and Multifractal Time Series (Springer, 2009).[17] Kantelhardt, J., Zschiegner, S., Koscielny-Bunde, E., Bunde, A., Havlin, S. and
Stanley, E., Multifractal Detrended Fluctuation Analysis of Nonstationary TimeSeries, Physica A 316(1–4) (2002) 87–114.
[18] Kristoufek, L., Local scaling properties and market turning points at prague stockexchange, Acta Phys. Pol. B 41(6) (2010) 1223–1336.
[19] Kristoufek, L., Multifractal height cross-correlation analysis: A new method for ana-lyzing long-range cross-correlations, EPL 95 (2011) 68001.
[20] LeRoy, S., Efficient capital markets: Comment, J. Finance 31 (1976).[21] Malkiel, B., The efficient market hypothesis and its critics, J. Econ. Perspect. 17(1)
(2003) 5982.[22] Morales, R., Di Matteo, T., Gramatica, R. and Aste, T., Dynamical generalized Hurst
exponent as a tool to monitor unstable periods in financial time series, Physica A391(11) (2012) 3180–3189.
[23] Onali, E. and Goddard, J., Unifractality and multifractality in the Italian stockmarket, Int. Rev. Financ. Anal. 18 (2009) 154–16.
[24] Onali, E. and Goddard, J., Are European equity markets efficient? new evidence fromfractal analysis, Int. Rev. Financ. Anal. 20 (2011) 59–67.
[25] Peng, C., Buldyrev, S., Goldberger, A., Havlin, S., Simons, M. and Stanley, H., Finite-size effects on long-range correlations: Implications for analyzing DNA sequences,Phys. Rev. E 47(5) (1993) 3730–3733.
1250065-12
Adv
s. C
ompl
ex S
yst.
Dow
nloa
ded
from
ww
w.w
orld
scie
ntif
ic.c
omby
WSP
C o
n 07
/24/
12. F
or p
erso
nal u
se o
nly.

2nd Reading
July 4, 2012 13:56 WSPC/S0219-5259 169-ACS 1250065
Fractal Markets Hypothesis and the Global Financial Crisis
[26] Peng, C., Buldyrev, S., Havlin, S., Simons, M., Stanley, H. and Goldberger, A., Mosaicorganization of DNA nucleotides, Phys. Rev. E 49 (1994) 1685–1689.
[27] Peters, E., Chaos and Order in the Capital Markets — A New View of Cycles, Prices,and Market Volatility (John Wiley & Sons, Inc., 1991).
[28] Peters, E., Fractal Market Analysis — Applying Chaos Theory to Investment andAnalysis (John Wiley & Sons, Inc., New York, 1994).
[29] Rachev, S. and Weron, A., CED model for asset returns and fractal market hypoth-esis, Math. Comput. Model. 29 (1999) 23–36.
[30] Samuelson, P., Proof that properly anticipated prices fluctuate randomly, Ind. Man-age. Rev. 6(2) (1965) 41–49.
[31] Sornette, D., Johansen, A. and Bouchaud, J., Stock market crashes, precursors andreplicas, J. de Physique I France 6(1) (1996) 167–175.
[32] Stanley, H., Statistical physics and economic fluctuations: Do outliers exist? PhysicaA 318 (2003) 279–292.
[33] Stanley, H. E., Amaral, L., Canning, D., Gopikrishnan, P., Lee, Y. and Liu, Y.,Econophysics: Can physicists contribute to the science of economics? Physica A 269(1999) 156–169.
[34] Weron, A. and Weron, R., Fractal market hypothesis and two power-laws, ChaosSolitons Fractals 11 (2000) 289–296.
1250065-13
Adv
s. C
ompl
ex S
yst.
Dow
nloa
ded
from
ww
w.w
orld
scie
ntif
ic.c
omby
WSP
C o
n 07
/24/
12. F
or p
erso
nal u
se o
nly.