Embed Size (px)
Citation preview

1
Preparing for tough times?
Kelvin Sam, CFA
DnB NOR Asian Investor Conference
September 12, 2011
FPSO outlook

Copyright © 2011 IHS Inc. All Rights Reserved.
ODS-Petrodata tracks 198 FPSOs and 130 potential awards
in FPSbase
2

Copyright © 2011 IHS Inc. All Rights Reserved.
Agenda
1. Overview
2. Lessons from past downturns
3. Capacity
4. Demand
5. Conclusion
3

Copyright © 2011 IHS Inc. All Rights Reserved.
What is an FPSO?
• FPSO (Floating, Production, Storage,
Offloading)
• Ship-shaped structure which receive,
process and stores oil
• Widely used in the Asia-Pacific, Brazil,
Africa and Europe
• 60 per cent of the global fleet is leased
while 40 per cent is owned by oil
companies
4

Copyright © 2011 IHS Inc. All Rights Reserved.
Introduction
5
FPSO contract awards
Newbuilds
Normally owned
USD 0.8 – 2 billion capex
3-4 years construction
Conversions
Normally leased
USD 250 –800 million
capex
2-3 years construction
Redeployments
Normally leased
At least USD 15 million
capex
3-12 months upgrade

Copyright © 2011 IHS Inc. All Rights Reserved.
New leasers arriving with 16 leasers actively bidding globally
6
Asia-Pacific Leasers
• Petrofac
• Ramunia
• Aker FP
• Berlian Laju Tanker
• Bluewater
• Bumi Armada
• BW Offshore
• EOC
• M3nergy
• Maersk FPSO
• MISC
• Mitra Rajasa
• MODEC
• Premuda
• Rubicon/Sea Prod.
• SBM
• Tanker Pacific
Brazil Leasers
• BW Offshore
• Maersk FPSO
• MODEC
• OSX
• Petroserv
• Saipem
• SBM
• Sevan Marine
• Teekay Petrojarl
Africa Leasers
• Bumi Armada
• BW Offshore
• Fred Olsen
• MODEC
• Saipem
• SBM
Europe Leasers
• Bluewater
• BW Offshore
• Maersk FPSO
• Saipem
• Sevan Marine
• Teekay Petrojarl
Expect more consolidation involving smaller players (< 6 units each)

Copyright © 2011 IHS Inc. All Rights Reserved.
0
1
2
3
4
5
6
7
8
9
10
Hyu
nd
ai H
I
Sa
msu
ng
HI
En
ge
vix
DS
ME
Da
lia
n
sh
ipya
rd
Sh
an
gh
ai
Wa
iga
oq
iao
Fe
ne
Sh
ipya
rd IHI
Qin
gd
ao
Be
ha
i
Hu
lls
FPSO hull newbuilds
2003-2011
Delivered
Under construction
Protected by Copyright (c) 1986-2011 ODS-Petrodata Ltd
Market share for hull yards is less fragmented
• Only a few yards are capable of hull construction globally
• COSCO Dalian emerging as a popular choice for owners with its lower cost
structure and improving capabilities
7
0
5
10
15
20
25
30
35
Ke
pp
el O
&M
Se
mb
co
rp M
ari
ne
Dry
do
cks W
orl
d
CO
SC
O D
alia
n
MM
HE
Ya
nta
i Ra
ffle
s
ST
Ma
rin
e
CO
OE
C
Oth
ers
Hu
lls
FPSO hull conversions
2003-2011
Delivered
Under construction
Protected by Copyright (c) 1986-2011 ODS-Petrodata Ltd Sevan 300 hulls counted as conversions

Copyright © 2011 IHS Inc. All Rights Reserved.
FPSO awards staying high in 2011
8
• Both redeployments and new orders contributing to high activity in 2010/2011.
• OGX emerging as a major buyer after ordering four FPSOs in 2011.
• Expect at least 15 awards for 2011.
0
5
10
15
20
25
2003 2004 2005 2006 2007 2008 2009 2010 2011 YTD
Aw
ard
s
FPSO contract awards
8 Petrobras newbuilds
Redeployments
New orders
Protected by Copyright (c) 1986-2011 ODS-Petrodata Ltd Source:ODS-Petrodata

Copyright © 2011 IHS Inc. All Rights Reserved.
FPSOs ordered for many regions since Jan 2010
9
9
Tiro/Sidon
OSX-1
OSX-2
OSX-3
OSX-4
OSX-5
Guara Norte
Kitan
Balnaves
Athena
Huntington
Quad 204
Ardmore
Cendor
TSB
Pagerungan
Berentai
D-1CLOV
Sangos
Goliat
Knarr
• 2010 awards
• 2011 awards
P-66
P-67
P68
P-69
P-70
P-71
P-72
P-73
Guara Pilot
Lula Nordeste
P-58
P-62

Copyright © 2011 IHS Inc. All Rights Reserved.
Growing risks of a global economic slowdown – “Vortex”
10
• IHS uses three oil price scenarios
• “Global Redesign” is our base case scenario where oil prices stay high
• Growing risks of a global recession
• “Vortex arrives earlier” shows the impact of an earlier than expected recession
58
69 75
8997
121
115
5544
5968
75 76 78
77
86
105117
141153 151153 154156 155 157
160162
128134135136138
139130
107
95
117
108109 109 111 113116 115
120
9586 82
7565
55 52 48 45
55
0
20
40
60
80
100
120
140
160
180
Qu
art
erl
y a
ve
rag
e (
US
D/b
arr
el)
Brent oil price scenarios
Historical
Meta (morphosis)
Vortex
Global Redesign
Vortex arrives earlier
Source: IHS CERA and Platts (historical)
Vortex arrives earlier

Copyright © 2011 IHS Inc. All Rights Reserved.
Agenda
1. Overview
2. Lessons from past downturns
3. Capacity
4. Demand
5. Conclusion
11

Copyright © 2011 IHS Inc. All Rights Reserved.
#1 FPSO awards vulnerable in a recession
12
0
5
10
15
20
25
2000 2001 2002 2003 2004 2005 2006 2007 2008 2009 2010
FP
SO
s
FPSO contract awards
Protected by Copyright (c) 1986-2011 ODS-Petrodata Ltd Source:ODS-Petrodata
FPSO awards are cyclical

Copyright © 2011 IHS Inc. All Rights Reserved.
#2: Big projects still go ahead in a downturn
13
• Medium to large projects (at least 50,000 b/d) still sanctioned in a recession:
• Longer field life
• Operators of bigger fields tend to have stronger balance sheets.
• Major leasers with strong balance sheets should still grow in a recession.
0
20
40
60
80
100
120
0
5
10
15
20
25
2000 2001 2002 2003 2004 2005 2006 2007 2008 2009 2010 2011 YTD
Avera
ge o
il p
rice (
Bre
nt)
Aw
ard
s
FPSO contract awards by oil processing capacity
>100,000 b/d
50-100,000 b/d
<50,000 b/d
Avg Brent oil price
Protected by Copyright (c) 1986-2011 ODS-Petrodata Ltd Source:ODS-Petrodata

Copyright © 2011 IHS Inc. All Rights Reserved.
#2 …while smaller projects are cancelled
14
• Marginal developments at greatest risk in a recession
• Shorter field life
• Usually operated by smaller independents so higher funding risk
Cancelled FPSO contract
Oil
Processing
(b/d) Leaser
Year
cancelled Operator
Contract duration
(years)
East Orovinyare 60,000 Fred Olsen Prod. 2006 BowLeven 5
Bilabri 40,000 BW Offshore 2007 Peak Petroleum 3
Basker-Manta-Gummy 28,000 BW Offshore 2008 Roc Oil 5
Camago Malampaya N/A Nexus FP 2009 BGEC 7
Puffin Southwest 32,500 MODEC 2009 AED Oil 3
Puffin Northeast 40,000 Sea Production 2009 AED Oil 3
Source: ODS-Petrodata

Copyright © 2011 IHS Inc. All Rights Reserved.
#3 FPSOs are sold and not bought
15
• FPSO = a pair of spectacles?
• Difficult to raise cash from selling FPSOs
• FPSOs normally sold below cost
• Main exception was Montara Venture which was sold to the field operator
FPSO Year sold Seller Buyer Sale Price (USD m) Cost (USD m)
Crystal Sea 2007 Seadrill BW Offshore 80 N/A
Nexus 1 2009 Nexus FP OSX 400 700
Montara Venture 2011 Tanker Pacific PTTEP 445 320
DeeP Producer 1 2011 Drydocks World Ramunia 83 335
Jasmine Venture 2011 MODECPetrofac 70
N/A
Cossack Pioneer 2011 NWS JV N/A
Source: ODS-Petrodata

Copyright © 2011 IHS Inc. All Rights Reserved.
Agenda
1. Overview
2. Lessons from past downturns
3. Capacity
4. Demand
5. Conclusion
16

Copyright © 2011 IHS Inc. All Rights Reserved.
Equipment lead times increasing again
17
• Lead times increasing from 2010 lows
• Some turret suppliers eg. SBM Offshore busy (five FPSOs and two complex
turrets)
0
5
10
15
20
25
2006 Jan 2007 Jan 2008 Jan 2009 Jan 2010 Jan 2011 Jan 2011 Sep
Mo
nth
s
Gas Compressor
Gas Turbine
Heat Exchanger
Turret and swivel
Proteced by Copyright (c) 1986-2011 ODS-Petrodata Ltd.
Estimated lead times: Selected FPSO equipment
Source: ODS-Petrodata

Copyright © 2011 IHS Inc. All Rights Reserved.
FPSO costs approaching last peak
18
• Cost model refers to a newbuild FPSO (180,000 b/d)
• Expect costs to increase by 13.6 per cent in 2011
• Salaries increasing by 7-8 per cent in 2011
0
50
100
150
200
250
300
-30%
-20%
-10%
0%
10%
20%
30%
2003 2004 2005 2006 2007 2008 2009 2010 2011f 2012f 2013f 2014f 2015f
No
min
al In
de
x (2
00
3 =
10
0)
Ye
ar o
n Y
ea
r C
ha
ng
e
Cost Model - FPSO
Y-O-Y Change [USD based]
Cost Index (2003=100) [USD based]
Source: ODS-Petrodata, Date: August 15, 2011Protected by Copyright (c) 1986-2011 ODS-Petrodata Ltd.

Copyright © 2011 IHS Inc. All Rights Reserved.
FPSO orders exceeding deliveries
19
• FPSO backlog is a good indicator of capacity bottlenecks
• Units under construction at the highest level in three years even after
excluding the Petrobras newbuilds
0
5
10
15
20
25
30
35
40
45
50
Dec 2
003
Dec 2
004
Dec 2
005
Dec 2
006
Dec 2
007
Dec 2
008
Dec 2
009
Dec 2
010
Sep 2
011
FP
SO
s
FPSOs under construction
Petrobras newbuilds
Conversion
Newbuild
Protected by Copyright (c) 1986-2011 ODS-Petrodata LtdFPSO construction requires 2-4 years
Source:ODS-Petrodata

Copyright © 2011 IHS Inc. All Rights Reserved.
Rig orders leading to higher backlogs and tighter capacity
20
• Backlog includes non-FPS work such as rigbuilding and shipbuilding
• South Korean yards such as Hyundai HI have record backlogs
• “Window of opportunity” to secure capacity is gone?
-
50
100
150
200
250
300
1Q06 3Q06 1Q07 3Q07 1Q08 3Q08 1Q09 3Q09 1Q10 3Q10 1Q11
Ind
ex 1
Q0
6 =
10
0
Shipyard total backlogs in local currencies
Samsung HI DSME Hyundai HI Keppel O&M Sembcorp Marine
Protected by Copyright (c) 1986-2011 ODS-Petrodata Ltd Source: company reports

Copyright © 2011 IHS Inc. All Rights Reserved.
Agenda
1. Overview
2. Lessons from past downturns
3. Capacity
4. Demand
5. Conclusion
21
Copyright © 2011 IHS Inc. All Rights Reserved.
Recent leasing contracts are less risky
22
0
2
4
6
8
10
12
14
16
18
2003 2004 2005 2006 2007 2008 2009 2010 2011 YTD
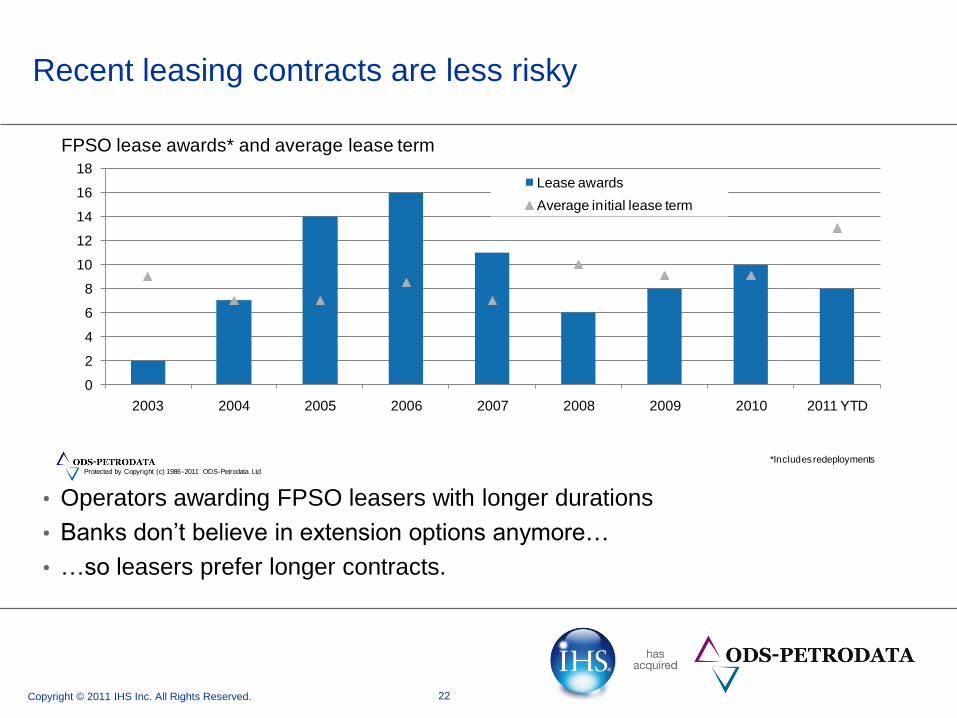
FPSO lease awards* and average lease term
Lease awards
Average initial lease term
Protected by Copyright (c) 1986-2011 ODS-Petrodata Ltd
*Includes redeployments
• Operators awarding FPSO leasers with longer durations
• Banks don’t believe in extension options anymore…
• …so leasers prefer longer contracts.

Copyright © 2011 IHS Inc. All Rights Reserved.
0
2
4
6
8
10
12
14
16
18
Bra
zil
Asia
-Pa
cif
ic
Afr
ica
Eu
rop
e
Me
d. &
Mid
dle
E
ast
FP
SO
Visible 2012 FPSO demand
Redeployment
Newbuild
Conversion
Protected by Copyright (c) 1986-20101ODS-Petrodata Ltd
We expect 10-15 FPSO awards in 2012
23
Forecast 2012 FPSO awards by operator
Field Region Operator Ownership
Palas Africa BP Own
Gehem Asia-Pacific Chevron Own
Gendalo Asia-Pacific Chevron Own
Chissonga Africa Maersk Oil Lease
OSX FPSO Brazil OGX Lease
OSX FPSO Brazil OGX Lease
Aruana Brazil Petrobras Lease
Transfer of Rights Brazil Petrobras Own
Transfer of Rights Brazil Petrobras Own
Transfer of Rights Brazil Petrobras Own
Franco EWT Brazil Petrobras Lease
Maromba Brazil Petrobras Lease
Bukit Tua Asia-Pacific PETRONAS Lease
Egina Africa Total Own
Tweneboa Africa Tullow Oil Lease
Source: ODS-Petrodata
• Normally expect at least 15 awards
• Less optimistic in 2012
• Recession risk, high costs and tight capacity

Copyright © 2011 IHS Inc. All Rights Reserved.
Expect more redeployment awards in 2012
24
• Several idle FPSOs
• 3-4 FPSOs with no extension options coming off charter annually
• Many FPSOs potentially available in Asia-Pacific and Africa.
0
2
4
6
8
10
12
Idle 2011 2012 2013 2014 2015
FP
SO
Idle/Available FPSOs by region
South America
Europe
Africa
Asia-Pacif ic
Protected by Copyright (c) 1986-2011 ODS-Petrodata LtdSource: ODS-Petrodata

Copyright © 2011 IHS Inc. All Rights Reserved.
More FPSO deliveries if oil prices unchanged
25
We forecast deliveries to peak again by 2014/2015
Asia-Pacific to be the second largest source of demand
Yards in this region should benefit from growing FPSO demand.
0
5
10
15
20
25
30
35
40
2003 2004 2005 2006 2007 2008 2009 2010 2011 2012 2013 2014 2015 2016
De
plo
ym
en
ts
Visible/Forecast FPSO Deployments
South America
North America
Med. & Middle East
Europe
Central America
Asia-Pacific
Africa
Forecast
Protected by Copyright (c) 1986-2011 ODS-Petrodata Ltd. Source:ODS-Petrodata

Copyright © 2011 IHS Inc. All Rights Reserved.
There is enough capacity for newbuilds…
26
Newbuild demand to increase by 2015, absorbing spare capacity in Korea.
Buyers have few choices besides the three South Korea yards.
0
1
2
3
4
5
6
7
8
2003 2004 2005 2006 2007 2008 2009 2010 2011 2012 2013 2014 2015 2016
Hu
ll d
elive
rie
s
Yard capacity* and demand for FPSO newbuild hullsWorld demand (ex Brazil) South Korean yard capacity** World yard capacity (ex Brazil)
Protected by Copyright (c) 1986-2011 ODS-Petrodata Ltd
*South Korean yard capacity falls in 2012-2013 since the yards are busy with rig orders**Includes only Hyundai HI, DSME and Samsung HI
Source: ODS-Petrodata

Copyright © 2011 IHS Inc. All Rights Reserved.
… and conversions
27
Singapore capacity highlighted due to market leadership in conversions.
Excess capacity for conversions.
Capacity to increase due to facilities expansion by incumbents and
growing capabilities of Chinese yards.
0
5
10
15
20
25
30
2003 2004 2005 2006 2007 2008 2009 2010 2011 2012 2013 2014 2015 2016
Hu
ll d
elive
rie
s
Yard capacity and demand for FPSO conversion hullsWorld demand Singapore yard capacity* World yard capacity
Protected by Copyright (c) 1986-2011 ODS-Petrodata Ltd*Includes only KeppeI O&M and Sembcorp Marine
Source: ODS-Petrodata

Copyright © 2011 IHS Inc. All Rights Reserved.
Conclusion – FPSO outlook for 2012
28
Robust demand( no Vortex). More redeployment awards More leaser consolidation
Some risk of cost overruns as... ...lead times and costs increasing… ...while yards are busier now.
Copyright © 2011 IHS Inc. All Rights Reserved.
Contact us
29
Should you have any questions or need additional information,
please contact us at one of our regional offices or visit us online:
DUBAIHOUSTON
3200 Wilcrest Dr.
Suite 170
Houston, Texas 77042
USA
T +1 832 463 3000
ABERDEEN
2nd Floor
The Exchange No. 1
Market Street
Aberdeen AB11 5PJ
Scotland
T +44 1224 597800
OSLO
Tjuvholmen allé 3, 6th Floor
NO-0252 Oslo
Norway
T +47 21 05 90 00
Crown Plaza 19th Floor
Sheikh Zayed Road
Dubai
United Arab Emirates
T +971 4 3117118
SINGAPORE
04-29 Nordic European Centre
3 International Business Park
Singapore 609927
T +65 6890 1616
www.ods-petrodata.com

Copyright © 2011 IHS Inc. All Rights Reserved.
Oil price scenarios
Global Redesign - Shared interest among major powers to expand trade and
encourage strong economic growth.
Meta – accelerated move towards a lower carbon energy economy. High oil prices
spark reactions that slow down the pace of GHG emissions
Vortex – Volatile economic growth returns. Recession hits Asia, North America
and Europe. Global cooperation suffers
30


![[Unchanged] FPSO: Current status & outlook · Petrobras placed 45 FPSO orders between 2003 and 2014, with the last order placed in Dec 2014 when it awarded Modec a 20-year lease for](https://img.dokumen.tips/doc/110x75/5c4d969b93f3c3245e294604/unchanged-fpso-current-status-outlook-petrobras-placed-45-fpso-orders-between.jpg)