Embed Size (px)
Citation preview

FOURTH
REPORT OF THE
NATIONAL TRANSPLANT REGISTRY
2007
EditorsHooi LS
Lela Yasmin Mansor
With contributions by:
Alan Teh KH, Chan LL, Shamala R, Choong YY, Michael Law SH, Chandramalar S, Mohamed Ezani, David Chew SP, Ashari Yunus, Ganesalingam K, Goh BL, Suzina Sheikh
July 2009 National Transplant Registry, Malaysia
Published by:
National Transplant Registry 1st Floor MMA House 124, Jalan Pahang 53000 Kuala Lumpur Malaysia
Tel : (603) 4045 5948
Fax : (603) 4044 0613
e-mail : [email protected]
Website: http://www.mst.org.my
This report is copyrighted. However it may be freely reproduced without the
permission of the National Transplant Registry. Acknowledgement would be
appreciated. Suggested citation is: Hooi LS, Lela Yasmin Mansor (Eds). Fourth Report
of the National Transplant Registry Malaysia 2007. Kuala Lumpur 2009.
ISSN
i
FOREWORD
Organ transplantation has made a slow but steady progress in Malaysia despite the various constraints. The awareness on organ donation and transplantation is certainly much better than it was about a decade ago. The organisational framework and various infrastructure facilities to enhance the development of transplantation have evolved with the setting up of a transplant unit in the Medical Development Division of the Ministry of Health Malaysia. It is thus vital to monitor this progress and development of transplantation in the country objectively through a database of the various activities linked to it.
The National Transplant Registry serves as a national database of the transplantation activity in the country. It was established in 2003 to document the experiences and outcomes of solid organ and tissue transplantation in Malaysia. Collection and analysis of data on the various organ and tissue transplants performed in Malaysia, in a continuing fashion is extremely useful to enhance progress and promote safety in transplantation. The National Transplant Registry is a member of the Association of Clinical Registries, Malaysia (ACRM), which was established in 2005.
The Malaysian Society of Transplantation is pleased to present this 4th Annual Report (2007) containing data from all the transplant programs in Malaysia since 2003. The 4th
National Transplant Registry Report represents data of the transplantation activity for the year 2007. This report contains the updated statistics and information on the full range of transplant activity, from organ donation to transplantation and post-transplant outcomes such as graft and patient survival. This data is useful for monitoring the trends, progress and outcomes of transplantation in Malaysia.
The information contained in these reports is evidence based and hence highly useful to help develop and enhance the transplant programs in Malaysia. The annual registry reports can be used to formulate policies to address deficiencies and shortfalls in the delivery process so as to allow transplantation to be carried out more efficiently and effectively with improved graft survival and improved quality of life for the recipients. This wealth of information and data can serve to inspire further research on issues of importance to the development of transplantation in the country. The data from the previous registry reports has been referenced in various scientific publications both local and international. It is hoped that the data from the present report will also serve such needs of the scientific community.
The National Transplant Registry is administered and supported by the Malaysian Society of Transplantation since 2005 with professional and technical support from National Clinical Research Centre and the Ministry of Health Malaysia. This year’s report as in the past has been prepared by Dr Hooi Lai Seong & Datin Dr Lela Yasmin Mansor with contributions from the various expert panels. I would like to express my gratitude to them for their valuable contributions in preparing, editing & proof reading this report.
I wish to thank all source data producers from the public and private hospitals and university medical centres for collaborating and contributing data to the National Transplant Registry over the years. We look forward to their continued participation,along with that of all centres and organisations active in transplantation in Malaysia.

ii
Special thanks to the members of the expert panels, the Transplant Registry Unit and the Governance Board for their tremendous contributions to the success of this registry.
It is hoped that this registry will evolve with time into a useful warehouse of information and data of the transplantation activity in Malaysia.
Datuk (Mr) Harjit Singh President Malaysian Society of Transplantation
iii
ACKNOWLEDGEMENTS
The National Transplant Registry would like to record its appreciation to everyone who have helped made this report possible.
We would especially like to thank the following:
Our source data providers that are the transplant surgeons, physicians and staff of all organ and tissue transplant centres and transplant follow up centres from the government, universities and private sectors, without whose commitment, hard work and timely data submission, there will be no report National Renal Registry for sharing the renal transplant data Clinical Research Centre, Hospital Kuala Lumpur Ministry of Health, Malaysia The members of the various expert panels for their expertise and for devoting their valuable time and effort in preparing and writing the various chapters And Roche (M) Sdn. Bhd. for their financial contribution to the registry yearly.

iv
PARTICIPATING CENTRES
Discipline: Blood and Marrow Transplant
1. Ampang Puteri Specialist Hospital 2. Division of Haematology, Department of Medicine, University of Malaya Medical Centre 3. Haematology Department, Hospital Ampang 4. Haematology Department, Sime Darby Medical Centre Subang Jaya 5. Haemapoietic Stem Cell Transplant Unit, Hospital Universiti Sains Malaysia 6. Maybank BMT Centre, Hospital Universiti Kebangsaan Malaysia 7. Oncology-Haematology Department, Gleneagles Medical Centre, Penang 8. Oncology-Haematology Department, Lam Wah Ee Hospital 9. Paediatric BMT Unit, Department of Paediatrics, University of Malaya Medical Centre 10. Paediatric BMT Unit, Institute of Paediatrics, Hospital Kuala Lumpur 11. Paediatric BMT Unit, Sime Darby Medical Centre Subang Jaya
Discipline: Bone and Tissue Transplant
1. Bone Bank, Hospital Kuala Lumpur 2. Bone Bank, University of Malaya Medical Centre 3. Department of Orthopaedic & Traumatology, Hospital Kangar 4. Department of Orthopaedic Surgery, Hospital Sultanah Bahiyah 5. Department of Orthopaedic Surgery, Hospital Taiping 6. Department of Orthopaedic Surgery, University of Malaya Medical Centre 7. Department of Orthopaedics, Hospital Ipoh 8. Department of Orthopaedics, Hospital Kajang 9. Department of Orthopaedics, Hospital Kuantan 10. Department of Orthopaedics, Hospital Pulau Pinang 11. Department of Orthopaedics, Hospital Raja Perempuan Zainab II 12. Department of Orthopaedics, Hospital Seberang Jaya 13. Department of Orthopaedics, Hospital Sultanah Aminah 14. Department of Orthopaedics, Hospital Sultanah Nur Zahirah 15. Department of Orthopaedics, Hospital Tengku Ampuan Rahimah 16. Department of Orthopaedics, Hospital Universiti Sains Malaysia 17. Department of Orthopaedics, Sarawak General Hospital 18. Department of Orthopaedics, Sultanah Fatimah Specialist Hospital 19. Department of Orthopaedics, Traumatology and Rehabilitation, International Islamic
University Malaysia 20. Department of Surgery, Hospital Raja Perempuan Zainab II 21. Hospital Fatimah, Ipoh 22. Institute of Orthopaedic & Traumatology, Hospital Kuala Lumpur 23. Island Hospital, Penang 24. Kota Bharu Medical Centre 25. Malaysian Nuclear Agency 26. National Tissue Bank, Universiti Sains Malaysia 27. Normah Medical Specialist Centre, Kuching 28. Ophthalmology Department, Hospital Kuala Lumpur 29. Ophthalmology Department, Hospital Sultanah Bahiyah 30. Ophthalmology Department, Hospital Sungai Buloh 31. Ophthalmology Department, Hospital Teluk Intan

v
Discipline: Bone and Tissue Transplant
32. Ophthalmology Department, Hospital Tengku Ampuan Afzan 33. Ophthalmology Department, Hospital Tengku Ampuan Rahimah 34. Ophthalmology Department, Hospital Universiti Sains Malaysia 35. Ophthalmology Department, Sri Kota Medical Centre 36. Timberland Medical Centre, Kuching 37. Wan Orthopaedic, Trauma & Sports Injury Centre, Seremban Specialist Hospital
Discipline: Cornea Transplant
1. Eye Clinic, Mahkota Medical Centre 2. Hope Eye Centre, Gleneagles Intan Medical Centre, Kuala Lumpur 3. International Specialist Eye Centre, Kuala Lumpur 4. K.C. Yeo Eye Specialist Centre, Melaka 5. Ophthalmology Department, 94 Hospital Angkatan Tentera Kem Terendak 6. Ophthalmology Department, Gleneagles Medical Centre, Penang 7. Ophthalmology Department, Hospital Batu Pahat 8. Ophthalmology Department, Hospital Bukit Mertajam 9. Ophthalmology Department, Hospital Duchess of Kent 10. Ophthalmology Department, Hospital Ipoh 11. Ophthalmology Department, Hospital Kangar 12. Ophthalmology Department, Hospital Kuala Lipis 13. Ophthalmology Department, Hospital Kuala Lumpur 14. Ophthalmology Department, Hospital Kuala Pilah 15. Ophthalmology Department, Hospital Melaka 16. Ophthalmology Department, Hospital Mentakab 17. Ophthalmology Department, Hospital Miri 18. Ophthalmology Department, Hospital Pakar Sultanah Fatimah 19. Ophthalmology Department, Hospital Pantai Indah 20. Ophthalmology Department, Hospital Pulau Pinang 21. Ophthalmology Department, Hospital Putrajaya 22. Ophthalmology Department, Hospital Queen Elizabeth, Kota Kinabalu 23. Ophthalmology Department, Hospital Raja Perempuan Zainab II 24. Ophthalmology Department, Hospital Selayang 25. Ophthalmology Department, Hospital Sibu 26. Ophthalmology Department, Hospital Sultan Ismail Pandan 27. Ophthalmology Department, Hospital Sultanah Aminah 28. Ophthalmology Department, Hospital Sultanah Bahiyah 29. Ophthalmology Department, Hospital Sultanah Nur Zahirah 30. Ophthalmology Department, Hospital Sungai Buloh 31. Ophthalmology Department, Hospital Sungai Petani 32. Ophthalmology Department, Hospital Taiping 33. Ophthalmology Department, Hospital Tawau 34. Ophthalmology Department, Hospital Teluk Intan 35. Ophthalmology Department, Hospital Tengku Ampuan Afzan 36. Ophthalmology Department, Hospital Tengku Ampuan Rahimah 37. Ophthalmology Department, Hospital Tuanku Ja’afar 38. Ophthalmology Department, Hospital Umum Sarawak 39. Ophthalmology Department, Hospital Universiti Kebangsaan Malaysia 40. Ophthalmology Department, Hospital Universiti Sains Malaysia

vi
Discipline: Cornea Transplant
41. Ophthalmology Department, Sri Kota Medical Centre 42. Ophthalmology Department, University of Malaya Medical Centre 43. Pusat Pakar Mata Centre For Sight, PJ 44. Puteri Specialist Hospital, Johor Bahru 45. Sunway Medical Centre 46. Tan Eye Specialist Centre, Sunway Medical Centre 47. Tun Hussein Onn National Eye Hospital
Discipline: Heart and Lung Transplant
1. Cardiothoracic Department, Institut Jantung Negara 2. Institut Perubatan Respiratori, Hospital Kuala Lumpur
Discipline: Heart Valve Transplant
1. Cardiovascular Tissue Bank, Department of Cardiothoracic Surgery, Institut Jantung Negara
Discipline: Liver Transplant
1. Department of Paediatrics, University of Malaya Medical Centre 2. Hepatobiliary Department, Hospital Selayang 3. Paediatric Hepatology Unit, Hospital Selayang 4. Institute of Paediatrics, Hospital Kuala Lumpur 5. Sime Darby Medical Centre Subang Jaya
Discipline: Renal Transplant
1. 96 Hospital Angkatan Tentera Kem Lumut 2. C. S. Loo Kidney & Medical Specialist Centre 3. Fan Medical Renal Clinic 4. Nephrology Department, Hospital Batu Pahat 5. Nephrology Department, Hospital Bintulu 6. Nephrology Department, Hospital Duchess of Kent 7. Nephrology Department, Hospital Ipoh 8. Nephrology Department, Hospital Kangar 9. Nephrology Department, Hospital Kemaman 10. Nephrology Department, Hospital Kluang 11. Nephrology Department, Hospital Kuala Lumpur 12. Nephrology Department, Hospital Labuan 13. Nephrology Department, Hospital Melaka 14. Nephrology Department, Hospital Miri 15. Nephrology Department, Hospital Pakar Sultanah Fatimah 16. Nephrology Department, Hospital Pontian 17. Nephrology Department, Hospital Pulau Pinang 18. Nephrology Department, Hospital Queen Elizabeth

vii
Discipline: Renal Transplant
19. Nephrology Department, Hospital Raja Perempuan Zainab II 20. Nephrology Department, Hospital Segamat 21. Nephrology Department, Hospital Selayang 22. Nephrology Department, Hospital Serdang 23. Nephrology Department, Hospital Sibu 24. Nephrology Department, Hospital Sultan Ismail Pandan 25. Nephrology Department, Hospital Sultanah Aminah 26. Nephrology Department, Hospital Sultanah Bahiyah 27. Nephrology Department, Hospital Sultanah Nur Zahirah 28. Nephrology Department, Hospital Taiping 29. Nephrology Department, Hospital Tawau 30. Nephrology Department, Hospital Tengku Ampuan Afzan 31. Nephrology Department, Hospital Tengku Ampuan Rahimah 32. Nephrology Department, Hospital Tuanku Ja’afar 33. Nephrology Department, Sarawak General Hospital 34. Nephrology Department, UKM Hospital 35. Nephrology Department, University Malaya Medical Centre36. Nephrology Department, USM Hospital 37. Nephrology Unit, Ampang Puteri Specialist Hospital 38. Nephrology Unit, Sime Darby Medical Centre Subang Jaya 39. Nephrology Unit, Sunway Medical Centre 40. Paediatric Renal Transplant Clinic, Hospital Kuala Lumpur 41. Paediatric Ward, Hospital Sultan Ismail Pandan 42. Renal Transplant Clinic, Sabah Medical Centre 43. Renal Transplant Clinic, Selangor Medical Centre 44. Renal Transplant Clinic, Sri Kota Medical Centre 45. Renal Transplant Unit, Hospital Pantai Mutiara 46. Simon Wong Medical & Kidney Clinic, Timberland Medical Centre 47. Tan Medical Renal Clinic 48. Wee Kidney & Medical Specialist Clinic

viii
ABOUT THE NATIONAL TRANSPLANT REGISTRY
The National Transplant Registry (NTR) is a Ministry of Health (MOH) supported registry whose aim is to collect information about organ and tissue transplantations in Malaysia. The information allows us to estimate the magnitude of transplant activity in the country. Such information besides being useful to transplantation practitioners, can be used in assisting the MOH, non-governmental organisations, private providers and industry in program planning and evaluation of transplantation services.
The objectives of NTR are to: 1. Determine the frequency and distribution of all types of transplantation activity in
Malaysia. 2. Determine the outcomes of transplantation. 3. Determine the factors influencing outcomes of transplantation. 4. Evaluate transplantation services in the country. 5. Stimulate and facilitate research on transplantation and its management.
The NTR receives data on organ / tissue transplantation from 3 main sources: 1. The individual doctors who provide transplantation services, who voluntarily report
data to the NTR. Data collection will be from seven main types of transplantation services:
Blood and Marrow Transplant Cornea Transplant Heart and Lung Transplant Liver Transplant Renal Transplant Heart Valve Transplant Bone and Tissue Transplant
2. The National Vital Registration system (Jabatan Pendaftaran Negara). Their data is useful for determining or verifying mortality outcomes of transplant patients.
3. Information Documentation Unit of the MOH, which operates the Health Management Information System (HMIS).
NTR SPONSORS
Medical Development Division, MOH National Transplant Coordinating Committee Malaysian Society Of Transplantation Clinical Research Centre, Hospital Kuala Lumpur

ix
GOVERNANCE BOARD
The Governance Board is established by NTR sponsors to govern the NTR. Current members of the Governance Board are as follows:
Name Representation
Tan Sri Dato’ Dr Yahya Awang Chairperson
Cardiothoracic Consultant, Damansara Specialist Hospital NTR Expert Panel Chairman of Heart / Lung Transplant
Dato’ Dr Zaki Morad Mohd Zaher Co-chair
Head, Department of Nephrology, Hospital Kuala Lumpur NTR Expert Panel Chairman of Renal Transplant
Datin Dr Fadhilah Zowyah Lela Yasmin Mansor Co-chair
Chairperson, Registry Subcommittee National Transplant Coordinating Committee Ministry Of Health
Dr Teng Seng Chong Medical Development Division, Ministry of Health
Dr Tan Chwee Choon Malaysian Society of Transplantation
Dr Lim Teck Onn Clinical Research Centre (CRC), Hospital Kuala Lumpur
Dr Jamaiyah Haniff Clinical Research Centre (CRC), Hospital Kuala Lumpur
Mr Rohan Malek Malaysian Urological Association
Dr Hooi Lai Seong Malaysian Society of Nephrology
Dr Aizai Azan Abdul Rahim National Heart Association of Malaysia
Dr Suzina Sheikh Ab. Hamid Malaysian National Tissue Bank
Dr Wong Jun Shyan Ophthalmological Society Of MMA
Tan Sri Datuk Dr Mohd. Ismail Merican
Malaysian Liver Foundation
Dr Hamidah Shaban Malaysian Thoracic Society
Dr Wan Faisham Malaysian Orthopaedic Association Dr Gill Satwant Singh National Kidney Foundation of Malaysia Dr Chang Kian Meng Malaysian Society of Haematology Dr Kelvin Lim Lye Hock Malaysian Association of Oral & Maxillofacial Surgeons Dr R T Arasu Malaysian Dental Association Dr Alan Teh Kee Hean NTR Expert Panel
Co-chair of Blood and Marrow Transplant (Adult) Prof Dr Chan Lee Lee NTR Expert Panel
Co-chair of Blood and Marrow Transplant (Paediatric) Dato’ Dr Zakaria Zahari NTR Expert Panel
Chairman of Liver Transplant Dr Shamala Retnasabapathy NTR Expert Panel
Chairperson of Cornea Transplant Dr Goh Bak Leong NTR Expert Panel
Co-chair of Renal Transplant Mr Mohamed Ezani Hj Md. Taib NTR Expert Panel
Co-chair of Heart / Lung / Heart Valve Transplant Prof Zulmi Wan NTR Expert Panel
Chairman of Bone and Tissue Transplant

x
EXPERT PANEL
NTR has established seven groups of Expert Panel comprising members of the medical profession and allied health with expert knowledge in these various disciplines:
Blood and Marrow Transplant Cornea Transplant Heart and Lung Transplant Liver Transplant Renal Transplant Heart Valve Transplant Bone and Tissue Transplant
The role of the Expert Panel is:
1. To undertake quality control of the clinical registry form and the data dictionary.
2. To undertake quality control of the reported data.3. To undertake literature review in the relevant area.4. To interpret the results generated by NTR’s statisticians.5. To write the section of the NTR report relevant to the panel expertise.6. To specify the data reporting procedure.7. To facilitate access to source documents for Transplant Registry Unit (TRU)
staff to do data verification.
List of Expert Panel members for each respective discipline:
Discipline: Blood and Marrow Transplant
Co-chair (Adult) Dr Alan Teh Kee Hean Co-chair (Paeds) Prof Dr Chan Lee Lee Members Prof Dr Cheong Soon Keng
Dr Chang Kian Meng Dr Gan Gin Gin @ Gan Shiaw Sze Dr Hishamshah Mohd Ibrahim Dr Jameela Sathar Prof Dr Lin Hai Peng Dr Mahfuzah Mohamed Dr Ng Soo Chin Dr S Visalachy Purushothaman Dr Vijaya Sangkar
Discipline: Cornea Transplant
Chairperson Dr Shamala Retnasabapathy Co-chair Dr Choong Yean Yaw Members Dato’ Dr Veera Ramani
Dr Jonathan Choon Siew Cheong Dr Chuah Kay Leong Dr Michael Law Sie Haur Dr Mariam Ismail

xi
Assoc Prof Dr SC Reddy Dr Sahimi Sulaiman Dr U Thiageswari Dr Chandramalar Santhirathelagan
Discipline: Heart and Lung Transplant
Chairman Tan Sri Dato’ Dr Yahya Awang Co-chair Mr Mohamed Ezani Hj Md. Taib
Members Datin Dr Aziah Ahmad Mahayiddin Dr Ashari Yunus Dr Aizai Azan Abdul Rahim Dato’ Dr David Chew Soon Ping Dr Hamidah Shaban
Discipline: Liver Transplant
Chairman Dato’ Dr Zakaria Zahari Members Dr Ganesalingam A/L Kanagasabai
Dr Goon Hong Kooi Dr Lim Chooi Bee Prof Dr Lee Way Seah Dr Sushila Sivasubramaniam Dr Tan Soek Siam Dr S Thavaranjitham
Discipline: Renal Transplant
Chairman Dato’ Dr Zaki Morad Mohd Zaher Co-chair Dr Goh Bak Leong
Members Dr Fan Kin Sing Dr Lily Mushahar
Mr Rohan Malek Dr S Prasad Menon Prof Dr Tan Si Yen
Discipline: Heart Valve Transplant
Chairman Mr Mohamed Ezani Hj Md.Taib
Discipline: Bone and Tissue Transplant
Chairman Prof Dr Zulmi Wan Members Dr Suzina Sheikh Ab Hamid
Dr Badrul Shah Badaruddin Dato’ Dr Hasim Mohamad Dr Norimah Yusof Dr Robert Penafort

xii
NTR STAFF
Clinical Registry Coordinator Ms Leong Wei Chee
Clinical Research Assistant Mr Ahmad Fairuz Putra Bin Ahmad Zulkifli
SUPPORTING STAFF FROM THE CLINICAL RESEARCH CENTRE
The Clinical Research Centre (CRC) of the Ministry of Health provides technical support for the National Transplant Registry. The clinical epidemiologists provide methodological and epidemiological input while the database is supported on CRC’s IT infrastructure.
Clinical Epidemiologist Dr Jamaiyah Haniff
Information & Communication Ms Celine Tsai Pao Chien Technology (ICT) Manager
Network Administrator Mr Kevin Ng Hong Heng
Assistant Network Administrator Mr Adlan Ab. Rahman
Database Administrator Ms Lim Jie Ying
Desktop publisher Ms Azizah Alimat
BIOSTATISTICAL CONSULTANTS
Consultant Biostatistician Dr Hoo Ling Ping

xiii
CONTENTS
Foreword i
Acknowledgements iii
Participating Centres vi
About the National Transplant Registry viii
NTR Sponsors viii
Governance Board ix
Expert Panel x
NTR Staff xii
Supporting Staff from the Clinical Research Centre xii
Contents xiii
Report Summary 1
Chapter 1: Blood and Marrow Transplantation 5
Chapter 2: Corneal Transplantation 41
Chapter 3: Heart and Lung Transplantation 67
Chapter 4: Liver Transplantation 82
Chapter 5: Renal Transplantation 97
Chapter 6: Heart Valve Transplantation 141
Chapter 7: Bone and Tissue Transplantation 152
Chapter 8: Cadaveric Organ and Tissue Donation 166
Appendix A: Data Management 188
Appendix B: Analysis Sets and Statistical Methods 192
Appendix C: Glossary 193
Appendix D: Directory of Participating Centres 196

1
REPORT SUMMARY
1. BLOOD AND MARROW TRANSPLANTATION
There were a total of 1312 haematopoietic stem cell transplantations performed by 11 centres between 1987 and 2007; 908 were functioning by the end of 2007.
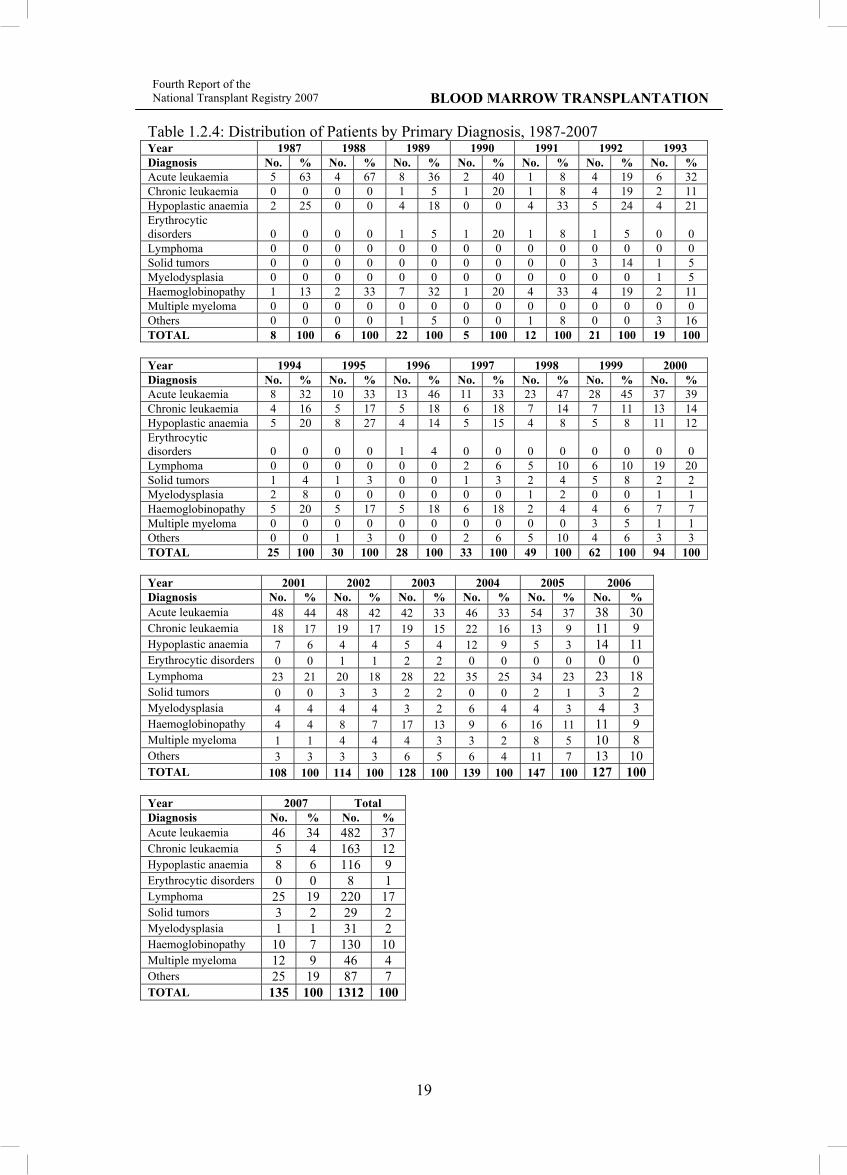
The majority of all transplants (71%) were for malignant disorders and most of these are haematological malignancies like leukaemia and lymphoma. The main non-malignant disorders transplanted were thalassaemia and aplastic anaemia.
There were 135 new transplantations done in Malaysia in 2007 with 11 follow-up centres for transplant recipients.
Mean age of new transplant patients in 2007 was 29 + 21 years; 64% were male, 39% Malay, 41% Chinese, 10% Indian and 10% others. Autologous transplants accounted for 50%. Seventy-nine percent of the transplant source was from peripheral blood stem cells and 91% were from Human Leukocyte Antigen (HLA) identical donors.
In 2007, 24 of prevalent transplant recipients died. Underlying disease and infection were the commonest causes of death accounting for 42% and 21% respectively.
2. CORNEAL TRANSPLANTATION
There were 46 centres which provided corneal transplantation data.
One hundred and eighty-nine new corneal transplantations were reported in Malaysia in 2007. Mean age of new transplant recipients in 2007 was 47 + 21 years. Of these, 66% were male. Thirty-three percent of recipients were Malay, 35% were Chinese, 19% were Indian and 13% were other races.
The primary diagnoses for corneal transplantation recipients in 2007 were pseudophakic bullous keratopathy (17%), cornea perforation (16%), keratoconus (15%), cornea scars (13%), failed previous cornea grafts (12%), microbial keratitis (7%) and corneal dystrophy (7%).
Fifty-eight percent of recipients were legally blind before their transplant surgery.
In 2007, 57% of donated corneas were from the USA, 27% from Sri Lanka and 16% from local sources. The mean age of the donors was 57 + 14 years.
The commonest corneal transplantation surgery performed was penetrating keratoplasty (88%) i.e. transplantation of a full thickness cornea tissue. Graft survival at 1 year was 80%, 65% at 3 years.

2
3. HEART AND LUNG TRANSPLANTATION
There were a total of 18 patients with heart transplantations reported to the Registry between 1997 and 2007; eight grafts were functioning at the end of 2007 and all were followed up in Institut Jantung Negara.
In 2007 there were 2 heart transplants carried out on the same recipient whose first heart transplant failed; there was a second compatible donor organ within 24 hours and the second heart transplant succeeded.
Two thirds of the heart transplant recipients were males and 56% were Indians. The mean age of recipients was 35 + 16 years. Ischaemic cardiomyopathy was the commonest primary diagnosis (9/18) followed by dilated cardiomyopathy (6/18).
Six recipients died in hospital following heart transplantation; four patients succumbed to late deaths after their heart transplant.
The transplant patient survival rate was 63% and 44% at 1 year and 3 years respectively.
A double lung transplant and a heart-lung transplant were performed in 2007. The latter patient died of rejection and pneumonia after 2 weeks. At the end of 2007 there were 2 patients with lung transplants surviving with functioning graft.
4. LIVER TRANSPLANTATION
There were a total of 95 liver transplantations reported to the Registry between 1993 and 2007; 56 grafts were functioning by the end of 2007.
There were 7 new liver transplantations done in Malaysia in 2007.
There were 5 follow-up centres for liver transplant recipients in 2007.
Mean age of all transplant patients was 8 + 13 years (range 3 months to 74 years); 53% were male, 48% Chinese, 37% Malay, 8% Indian, 69% were for biliary atresia. Majority were living donor liver transplantations (78%).
At the time of transplantation the main immunosuppressive drugs used were tacrolimus (78%) and steroids (62%).
Transplant patient survival rate for the cohort 1993 to 1998 was 71% at 1 year; survival rate for the cohort 1999 to 2006 was 69% at 1 year.

3
5. RENAL TRANSPLANTATION
There were 48 follow-up centres for renal transplant recipients in 2007. There were 86 new renal transplants in 2007, 3 per million population per year.
The number of functioning renal transplants in 2007 was 1726. The transplant prevalence rate was 64 per million population.
In 2007, the mean age for new transplant recipients was 35+15 years, 62% were male, 12% had diabetes, 11 were anti-HCV positive at the time of transplantation.
Ninety-seven percent of prevalent renal transplant recipients were on prednisolone, 72% on cyclosporine, 21% on tacrolimus, 54% mycophenolate mofetil and 29% on azathioprine.
In 2007, 34 (2%) of prevalent transplant recipients died and 34 (2%) lost their grafts. Infection and cardiovascular disease were the commonest causes of death accounting for 33% and 18% respectively. Death at home was the third commonest cause at 10%. Renal allograft rejection accounted for 69% of graft loss.
The overall transplant patient survival rate from 1994 to 2007 was 95%, 91%, 88% and 81% at 1 year, 3 years, 5 years and 10 years respectively, while the overall graft survival rate for these years was 92%, 85%, 79% and 64% respectively.
6. HEART VALVE TRANSPLANTATION
There were a total of 172 heart valve homografts reported to the Registry between 1996 and 2007; 153 grafts were functioning at the end of 2007. Eighty-five were aortic and 87 were pulmonary valves.
Mean age of all heart valve transplant patients was 11 + 10 years (range 3 months to 70 years); 51% were male, 61% Malay.
7. BONE AND TISSUE TRANSPLANTATION
In 2006, 90 bone allografts and 175 amniotic membranes were supplied by USM Tissue Bank.
Twenty hospitals used the bone grafts and 18 centres used the amniotic membranes. Characteristics were reported for only 36 of the recipients.
8. CADAVERIC ORGAN AND TISSUE DONATION
There were 25 donors in 2007 of which 15 were brain dead multi-organ and tissue donors and 10 were post cardiac death tissue donors. The donation rate was 0.99 donations per million population (pmp).

4
The mean age of the donors was 29.6 + 18.75 years. The youngest was a 14.5 months old kidney donor while the oldest was a 68 year-old eye donor. Eighty percent were male, 56% were Chinese, 20% Malay, 12% Indian.
Six donors carried the donor pledge card. Sixteen of the donors died from accidents, 8 died from medical causes and one was a homicide. Eighty-four percent of donations took place in MOH hospitals, 8% in private hospitals and 8% from University hospitals.

CHAPTER 1
BLOOD AND MARROW TRANSPLANTATION
Editors: Dr Alan Teh Kee Hean Prof Dr Chan Lee Lee
Expert Panel Dr Alan Teh Kee Hean (Chair - Adult)
Prof Dr Chan Lee Lee (Chair - Paediatric) Prof Dr Cheong Soon Keng
Dr Chang Kian Meng Dr Gan Gin Gin
Dr Hishamshah Mohd Ibrahim Dr Jameela Sathar
Prof Dr Lin Hai Peng Dr Mahfuzah Mohamed
Dr Ng Soo Chin Dr Visalachy Purushothaman
Dr Vijaya Sangkar
Contents
1.0 Introduction
1.1 Stock and Flow of Blood and Marrow Transplantation
Stock and Flow Transplant Rates
Places of Transplant
1.2 Recipients’ Characteristics Demographics
Primary Diagnosis
1.3 Transplant Practices Graft Number
Type of Transplant Source of Stem Cells and HLA Match
1.4 Transplant Outcomes
Patient Survival
1.5 Disease-free Survival
1.6 Conclusion

6
BLOOD MARROW TRANSPLANTATION Fourth Report of the
National Transplant Registry 2007
List of Tables Table 1.1.1: Stock and Flow of Blood and Marrow Transplantation, 1987-2007 ........... 9 Table 1.1.2: New Transplant Rate per million population (pmp), 1987-2007 ................10 Table 1.1.3: Distribution of Patients by Centre, 1987-2007 .......................................... 11 Table 1.2.1: Distribution of Patients by Gender, 1987-2007 ......................................... 14 Table 1.2.2: Distribution of Patients by Ethnic Group, 1987-2007 ............................... 15 Table 1.2.3: Distribution of Patients by Age Group, 1987-2007 ................................... 17 Table 1.2.4: Distribution of Patients by Primary Diagnosis, 1987-2007………………19 Table 1.3.1: Distribution of Patients by Graft Number, 1987-2007 .............................. 21 Table 1.3.2: Distribution of Patients by Transplantation Type, 1987-2007 .................. 23 Table 1.3.3: Type of Transplant by Centre, 1987-2007 ................................................. 24 Table 1.3.4: Source of Stem Cells, 1987-2007 .............................................................. 25 Table 1.3.5: Distribution of Patients by HLA Match, 1987-2007 ................................. 27 Table 1.3.6: Distribution of Patients by Allogeneic Donor Relationship, 1987-2007 ... 28 Table 1.4.1: Distribution of Patients by Cause of Death, 1987-2007 ............................ 29 List of Figures Figure 1.1.1: Stock and Flow of Blood and Marrow Transplantation, 1987-2007 .......... 9 Figure 1.1.2: New Transplant Rate per million population (pmp), 1987-2007 ............. 10 Figure 1.1.3: Distribution of Patients by Centre, 1987-2007 ......................................... 13 Figure 1.2.1: Distribution of Patients by Gender, 1987-2007 ........................................ 14 Figure 1.2.2: Distribution of Patients by Ethnic Group, 1987-2007 .............................. 16 Figure 1.2.3: Distribution of Patients by Age Group, 1987-2007 .................................. 18 Figure 1.3.1: Distribution of Patients by Graft Number, 1987-2007 ............................. 22 Figure 1.3.2: Distribution of Patients by Transplantation Type, 1987-2007 ................. 23 Figure 1.3.3: Type of Transplant by Centre, 1987-2007................................................ 24 Figure 1.3.4: Source of Stem Cells, 1987-2007 ............................................................. 26 Figure 1.4.1: Patient Survival by Year of Transplant, 1987-2007 ................................. 30 Figure 1.4.2: Patient Survival by Gender, 1987-2007 ................................................... 31 Figure 1.4.3: Patient Survival by Age Group, 1987-2007 ............................................. 31 Figure 1.4.4: Patient Survival by Type of Transplant, 1987-2007................................. 32 Figure 1.5.1: Disease-free Survival for Acute Myeloid Leukaemia, 1987-2007
(Allogeneic vs. Autologous) ..................................................................... 33 Figure 1.5.2: Disease-free Survival for Acute Lymphoblastic Leukaemia, 1987-2007
(Allogeneic) .............................................................................................. 34 Figure 1.5.3: Disease-free Survival for Thalassaemia, 1987-2007 (Allogeneic) ........... 34 Figure 1.5.4: Disease-free Survival for Non-Hodgkin’s Lymphoma, 1987-2007
(Allogeneic vs. Autologous) ..................................................................... 35 Figure 1.5.5: Disease-free Survival for Hodgkin’s Disease, 1987-2007 (Autologous). 35 Figure 1.5.6: Disease-free Survival for Chronic Myeloid Leukaemia, 1987-2007
(Allogeneic) .............................................................................................. 36 Figure 1.5.7: Disease-free Survival for Aplastic Anaemia, 1987-2007 (Allogeneic) .... 36 Figure 1.5.8: Disease-free Survival by Age Group for Acute Myeloid Leukaemia, 1987-
2007 ........................................................................................................... 37 Figure 1.5.9: Disease-free Survival by Age Group for Acute Lymphoblastic
Leukaemia, 1987-2007 .............................................................................. 37 Figure 1.5.10: Disease-free Survival by Age Group for Thalassaemia, 1987-2007 ...... 38

7
BLOOD MARROW TRANSPLANTATION Fourth Report of the National Transplant Registry 2007
Figure 1.5.11: Disease-free Survival by Age Group for Non-Hodgkin’s Lymphoma, 1987-2007 ................................................................................................. 38
Figure 1.5.12: Disease-free Survival by Age Group for Hodgkin’s Disease, 1987-2007 ................................................................................................................... 39
Figure 1.5.13: Disease-free Survival by Age Group for Chronic Myeloid Leukaemia, 1987-2007 ................................................................................................. 39
Figure 1.5.14: Disease-free Survival by Age Group for Aplastic Anaemia, 1987-2007 .................................................................................................................. .40
8
BLOOD MARROW TRANSPLANTATION Fourth Report of the
National Transplant Registry 2007
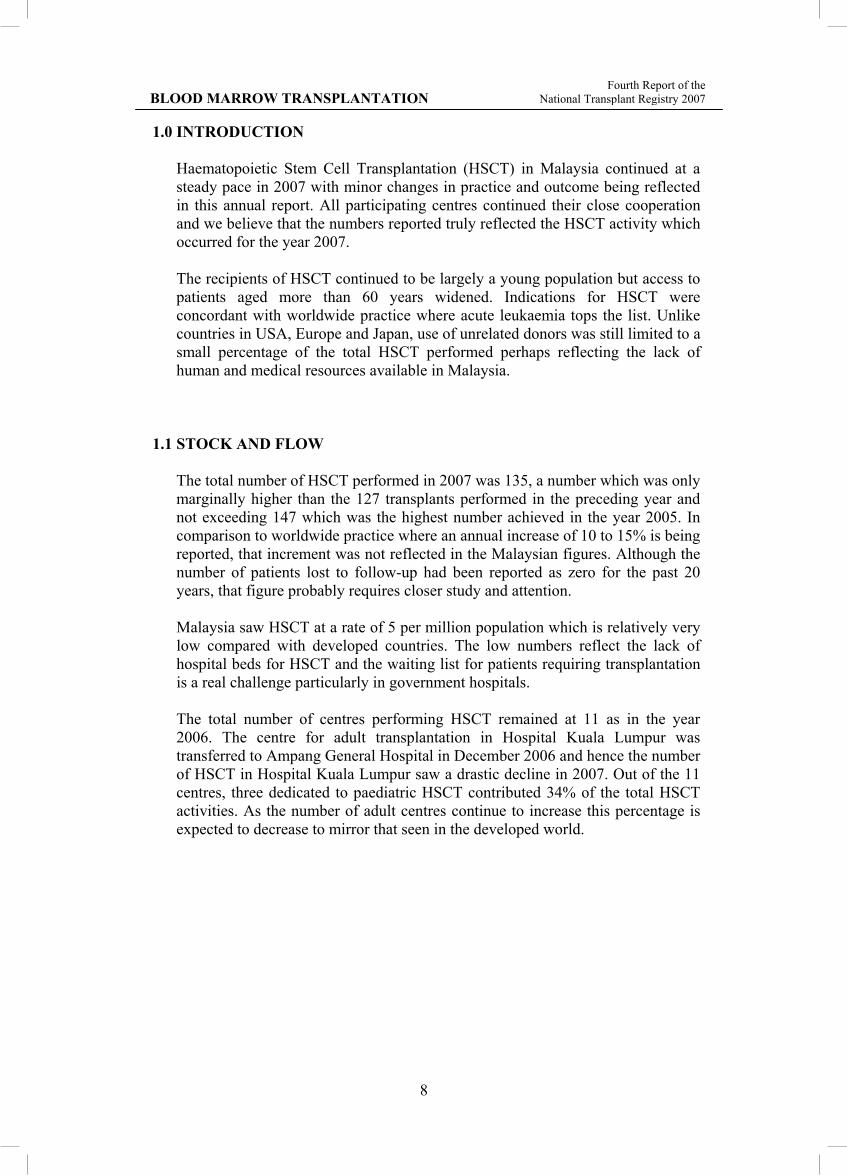
1.0 INTRODUCTION Haematopoietic Stem Cell Transplantation (HSCT) in Malaysia continued at a steady pace in 2007 with minor changes in practice and outcome being reflected in this annual report. All participating centres continued their close cooperation and we believe that the numbers reported truly reflected the HSCT activity which occurred for the year 2007. The recipients of HSCT continued to be largely a young population but access to patients aged more than 60 years widened. Indications for HSCT were concordant with worldwide practice where acute leukaemia tops the list. Unlike countries in USA, Europe and Japan, use of unrelated donors was still limited to a small percentage of the total HSCT performed perhaps reflecting the lack of human and medical resources available in Malaysia.
1.1 STOCK AND FLOW
The total number of HSCT performed in 2007 was 135, a number which was only marginally higher than the 127 transplants performed in the preceding year and not exceeding 147 which was the highest number achieved in the year 2005. In comparison to worldwide practice where an annual increase of 10 to 15% is being reported, that increment was not reflected in the Malaysian figures. Although the number of patients lost to follow-up had been reported as zero for the past 20 years, that figure probably requires closer study and attention. Malaysia saw HSCT at a rate of 5 per million population which is relatively very low compared with developed countries. The low numbers reflect the lack of hospital beds for HSCT and the waiting list for patients requiring transplantation is a real challenge particularly in government hospitals. The total number of centres performing HSCT remained at 11 as in the year 2006. The centre for adult transplantation in Hospital Kuala Lumpur was transferred to Ampang General Hospital in December 2006 and hence the number of HSCT in Hospital Kuala Lumpur saw a drastic decline in 2007. Out of the 11 centres, three dedicated to paediatric HSCT contributed 34% of the total HSCT activities. As the number of adult centres continue to increase this percentage is expected to decrease to mirror that seen in the developed world.

9
BLOOD MARROW TRANSPLANTATION Fourth Report of the National Transplant Registry 2007
Table 1.1.1: Stock and Flow of Blood and Marrow Transplantation, 1987-2007 Year 87 88 89 90 91 92 93 94 95 96 New transplant patients 8 6 22 5 12 21 19 25 30 28 Deaths 1 1 6 6 1 2 9 5 17 11 Lost to follow- up 0 0 0 0 0 0 0 0 0 0 Alive at 31st December 7 12 28 27 38 57 67 87 100 117 Year 97 98 99 00 01* 02 03 04 05 06 07 New transplant patients 33 49 62 94 108 114 128 139 147 127 135 Deaths 15 16 15 31 47 30 51 45 40 25 24 Lost to follow- up 0 0 0 0 0 0 0 0 0 0 0 Alive at 31st December 135 168 215 278 338 422 499 592 698 800 908 *1 patient in year transplant 2001 with no death date **Out of 1312 patients who underwent transplantation, there were 50 patients with early death before day 30 of transplant Figure 1.1.1: Stock and Flow of Blood and Marrow Transplantation, 1987-2007
Num
ber o
f pat
ient
s (n)
Year
0
100
200
300
400
500
600
700
800
900
1000 New Alive at 31st
87 88 89 90 91 92 93 94 95 96 97 98 99 00 01 02 03 04 05 06 07

10
BLOOD MARROW TRANSPLANTATION Fourth Report of the
National Transplant Registry 2007
Table 1.1.2: New Transplant Rate per million population (pmp), 1987-2007 Year 1987 1988 1989 1990 1991 1992 1993 1994 1995 1996 New transplant patients 8 6 22 5 12 21 19 25 30 28 New transplant rate pmp 0 0 1 0 1 1 1 1 1 1 Year 1997 1998 1999 2000 2001 2002 2003 2004 2005 2006 2007 New transplant patients 33 49 62 94 108 114 128 139 147 127 135
New transplant rate pmp 2 2 3 4 4 5 5 5 6 5 5
Figure 1.1.2: New Transplant Rate per million population (pmp), 1987-2007
New
tran
spla
nt ra
te p
mp
Year
0
1
2
3
4
5
6 Rate, pmp
87 88 89 90 91 92 93 94 95 96 97 98 99 00 01 02 03 04 05 06 07

11
BLOOD MARROW TRANSPLANTATION Fourth Report of the National Transplant Registry 2007
Table 1.1.3: Distribution of Patients by Centre, 1987-2007 Year 1987 1988 1989 1990 1991 1992 1993 No. % No. % No. % No. % No. % No. % No. % KLA 0 0 0 0 0 0 0 0 0 0 0 0 0 0 KLP 0 0 0 0 0 0 0 0 0 0 0 0 0 0 UKM 0 0 0 0 0 0 0 0 0 0 0 0 0 0 SJA 0 0 0 0 1 5 0 0 0 0 0 0 0 0 UMA 0 0 0 0 0 0 0 0 0 0 0 0 1 5 UMP 8 100 6 100 21 95 5 100 12 100 21 100 18 95 GMC 0 0 0 0 0 0 0 0 0 0 0 0 0 0 LWE 0 0 0 0 0 0 0 0 0 0 0 0 0 0 SJP 0 0 0 0 0 0 0 0 0 0 0 0 0 0 ASH 0 0 0 0 0 0 0 0 0 0 0 0 0 0 Hospital Ampang 0 0 0 0 0 0 0 0 0 0 0 0 0 0 Others* 0 0 0 0 0 0 0 0 0 0 0 0 0 0 TOTAL 8 100 6 100 22 100 5 100 12 100 21 100 19 100 Year 1994 1995 1996 1997 1998 1999 2000 No. % No. % No. % No. % No. % No. % No. % KLA 0 0 0 0 0 0 0 0 0 0 6 10 15 16 KLP 4 16 10 33 10 36 9 27 16 33 19 31 16 17 UKM 0 0 0 0 0 0 0 0 0 0 2 3 9 10 SJA 0 0 0 0 0 0 0 0 0 0 5 8 19 20 UMA 4 16 7 23 6 21 9 27 15 31 11 18 13 14 UMP 17 68 13 43 11 39 15 45 18 37 19 31 22 23 GMC 0 0 0 0 0 0 0 0 0 0 0 0 0 0 LWE 0 0 0 0 0 0 0 0 0 0 0 0 0 0 SJP 0 0 0 0 1 4 0 0 0 0 0 0 0 0 ASH 0 0 0 0 0 0 0 0 0 0 0 0 0 0 Hospital Ampang 0 0 0 0 0 0 0 0 0 0 0 0 0 0 Others* 0 0 0 0 0 0 0 0 0 0 0 0 0 0 TOTAL 25 100 30 100 28 100 33 100 49 100 62 100 94 100
Year 2001 2002 2003 2004 2005 2006 No. % No. % No. % No. % No. % No. %
KLA 20 19 28 25 35 27 41 29 44 30 20 16 KLP 18 17 20 18 19 15 22 16 21 14 27 21 UKM 12 11 9 8 11 9 14 10 17 12 9 7 SJA 17 16 20 18 23 18 21 15 23 16 22 17 UMA 20 19 16 14 11 9 10 7 14 10 11 9 UMP 21 19 20 18 20 16 16 12 13 9 18 14 GMC 0 0 0 0 0 0 2 1 2 1 4 3 LWE 0 0 0 0 0 0 6 4 1 1 2 2 SJP 0 0 1 1 9 7 6 4 12 8 6 5 ASH 0 0 0 0 0 0 0 0 0 0 1 1 Hospital Ampang 0 0 0 0 0 0 0 0 0 0 7 6 Others* 0 0 0 0 0 0 1 1 0 0 0 0 TOTAL 108 100 114 100 128 100 139 100 147 100 127 100

12
BLOOD MARROW TRANSPLANTATION Fourth Report of the
National Transplant Registry 2007
*Others include Royal Perth Hospital KLA Hospital Kuala Lumpur, (Adult) KLP Hospital Kuala Lumpur, Institute Paediatrics (Paed) UKM Hospital Universiti Kebangsaan Malaysia SJA Sime Darby Medical Centre (Adult) UMA University of Malaya Medical Centre (Adult) UMP University of Malaya Medical Centre (Paed) GMC Gleneagles Medical Centre, Penang LWE Lam Wah Ee Hospital, Penang SJP Sime Darby Medical Centre (Paed) ASH Ampang Puteri Specialist Hospital
Year 2007 Total No. % No. %
KLA 2 1 211 16 KLP 23 17 234 18 UKM 21 16 104 8 SJA 21 16 172 13 UMA 8 6 156 12 UMP 18 13 332 25 GMC 1 1 9 1 LWE 1 1 10 1 SJP 5 4 40 3 ASH 1 1 2 0 Hospital Ampang 34 25 41 3 Others* 0 0 1 0 TOTAL 135 100 1312 100

13
BLOOD MARROW TRANSPLANTATION Fourth Report of the National Transplant Registry 2007
Figure 1.1.3: Distribution of Patients by Centre, 1987-2007
Num
ber o
f pat
ient
s (n)
Year
0 10
20
30 40
50
60
70 80
90
100
KLA KLP UKMSJA UMA UMP
87 88 89 90 91 92 93 94 95 96 97 98 99 00 01 02 03 04 05 06 07
Num
ber o
f pat
ient
s (n)
Year
0
10
20
30
40
50
60
70
80
90
100
GMC LWE SJP Hospital Ampang ASH Others
87 88 89 90 91 92 93 94 95 96 97 98 99 00 01 02 03 04 05 06 07

14
BLOOD MARROW TRANSPLANTATION Fourth Report of the
National Transplant Registry 2007
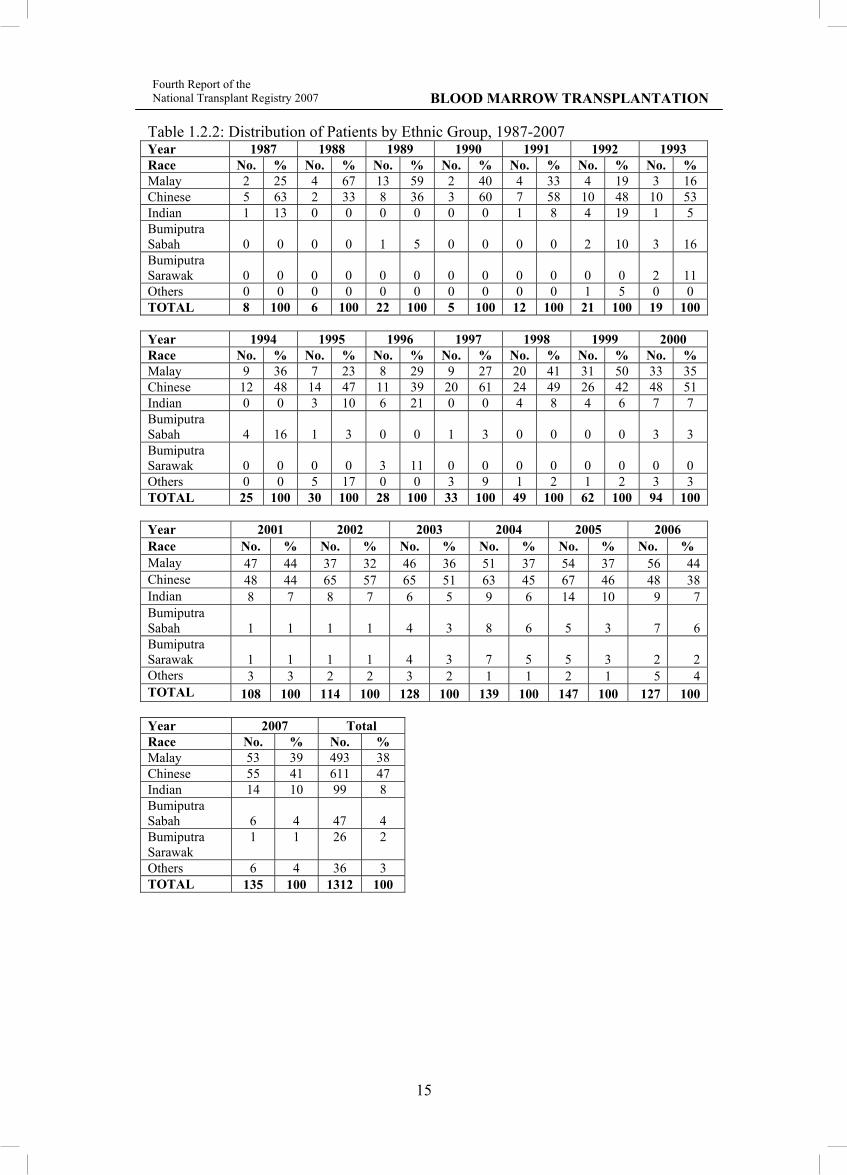
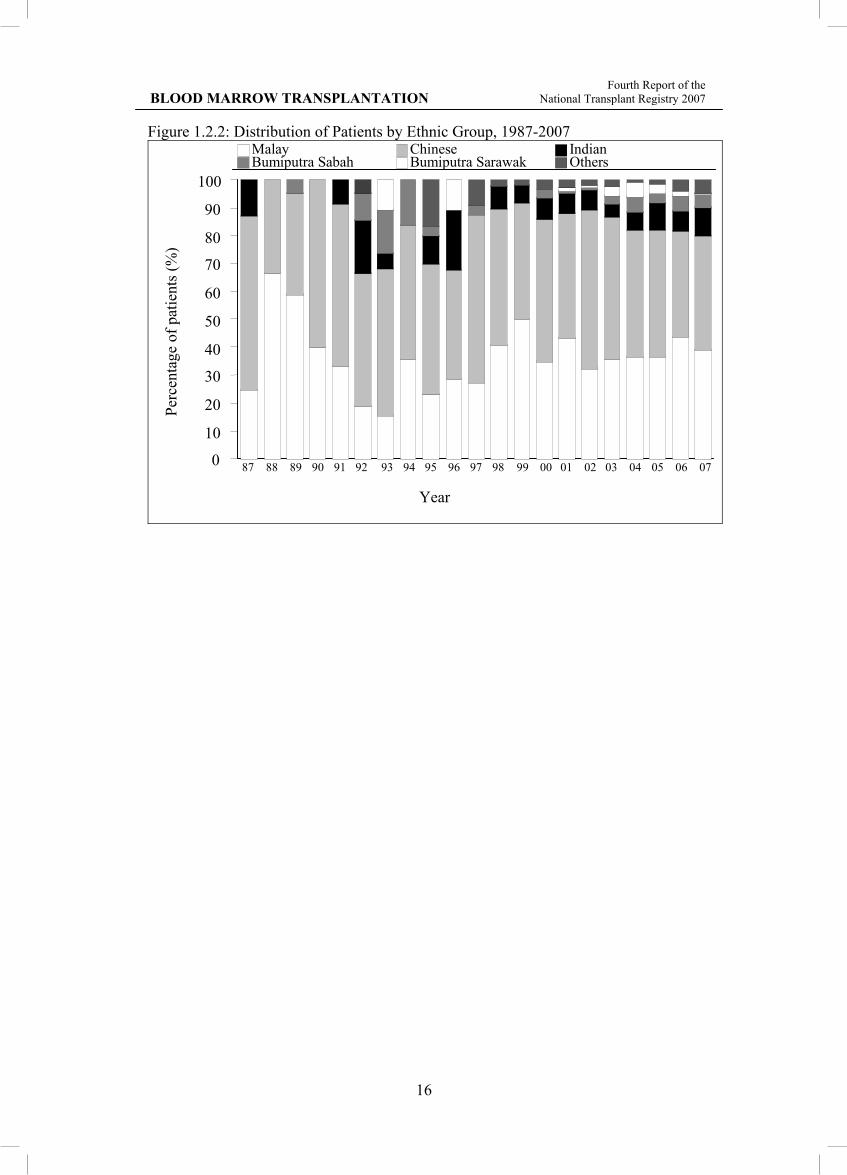
1.2 RECIPIENTS’ CHARACTERISTICS In 2007, 64% of recipients were male. The ethnic breakdown was 41%, 39% and 10% for Chinese, Malay and Indian patients respectively. Since 2000 when patients aged >60 years were offered HSCT, the number of patients in this age group steadily increased over the ensuing years and reached an all time high of 8% in 2007. The median age of recipients was 16 years with a range of 1 month to 70 years. Indications for HSCT were 69% for malignant disorders with the commonest diseases being acute leukaemia followed by lymphoma and multiple myeloma.
Table 1.2.1: Distribution of Patients by Gender, 1987-2007 Year 1987 1988 1989 1990 1991 1992 1993 1994 Gender No. % No. % No. % No. % No. % No. % No. % No. % Male 7 88 4 67 12 55 3 60 7 58 13 62 13 68 16 64 Female 1 13 2 33 10 45 2 40 5 42 8 38 6 32 9 36 TOTAL 8 100 6 100 22 100 5 100 12 100 21 100 19 100 25 100 Year 1995 1996 1997 1998 1999 2000 2001 2002 Gender No. % No. % No. % No. % No. % No. % No. % No. % Male 11 37 15 54 18 55 33 67 36 58 54 57 66 61 62 54 Female 19 63 13 46 15 45 16 33 26 42 40 43 42 39 52 46 TOTAL 30 100 28 100 33 100 49 100 62 100 94 100 108 100 114 100 Year 2003 2004 2005 2006 2007 Total Gender No. % No. % No. % No. % No. % No. % Male 71 55 83 60 69 47 75 59 87 64 755 58 Female 57 45 56 40 78 53 52 41 48 36 557 42 TOTAL 128 100 139 100 147 100 127 100 135 100 1312 100 Figure 1.2.1: Distribution of Patients by Gender, 1987-2007
Perc
enta
ge o
f pat
ient
s (%
)
Year
0
20
40
60
80
100 Male Female
87 88 89 90 91 92 93 94 95 96 97 98 99 00 01 02 03 04 05 06 07
15
BLOOD MARROW TRANSPLANTATION Fourth Report of the National Transplant Registry 2007
Table 1.2.2: Distribution of Patients by Ethnic Group, 1987-2007 Year 1987 1988 1989 1990 1991 1992 1993 Race No. % No. % No. % No. % No. % No. % No. % Malay 2 25 4 67 13 59 2 40 4 33 4 19 3 16 Chinese 5 63 2 33 8 36 3 60 7 58 10 48 10 53 Indian 1 13 0 0 0 0 0 0 1 8 4 19 1 5 Bumiputra Sabah 0 0 0 0 1 5 0 0 0 0 2 10 3 16 Bumiputra Sarawak 0 0 0 0 0 0 0 0 0 0 0 0 2 11 Others 0 0 0 0 0 0 0 0 0 0 1 5 0 0 TOTAL 8 100 6 100 22 100 5 100 12 100 21 100 19 100
Year 1994 1995 1996 1997 1998 1999 2000 Race No. % No. % No. % No. % No. % No. % No. % Malay 9 36 7 23 8 29 9 27 20 41 31 50 33 35 Chinese 12 48 14 47 11 39 20 61 24 49 26 42 48 51 Indian 0 0 3 10 6 21 0 0 4 8 4 6 7 7 Bumiputra Sabah 4 16 1 3 0 0 1 3 0 0 0 0 3 3 Bumiputra Sarawak 0 0 0 0 3 11 0 0 0 0 0 0 0 0 Others 0 0 5 17 0 0 3 9 1 2 1 2 3 3 TOTAL 25 100 30 100 28 100 33 100 49 100 62 100 94 100 Year 2001 2002 2003 2004 2005 2006 Race No. % No. % No. % No. % No. % No. % Malay 47 44 37 32 46 36 51 37 54 37 56 44 Chinese 48 44 65 57 65 51 63 45 67 46 48 38 Indian 8 7 8 7 6 5 9 6 14 10 9 7 Bumiputra Sabah 1 1 1 1 4 3 8 6 5 3 7 6 Bumiputra Sarawak 1 1 1 1 4 3 7 5 5 3 2 2 Others 3 3 2 2 3 2 1 1 2 1 5 4 TOTAL 108 100 114 100 128 100 139 100 147 100 127 100 Year 2007 Total Race No. % No. % Malay 53 39 493 38 Chinese 55 41 611 47 Indian 14 10 99 8 Bumiputra Sabah 6 4 47 4 Bumiputra Sarawak
1 1 26 2
Others 6 4 36 3 TOTAL 135 100 1312 100
16
BLOOD MARROW TRANSPLANTATION Fourth Report of the
National Transplant Registry 2007
Figure 1.2.2: Distribution of Patients by Ethnic Group, 1987-2007
Perc
enta
ge o
f pat
ient
s (%
)
Year
0
10
20
30
40
50
60
70
80
90
100
Malay Chinese Indian Bumiputra Sabah Bumiputra Sarawak Others
87 88 89 90 91 92 93 94 95 96 97 98 99 00 01 02 03 04 05 06 07

17
BLOOD MARROW TRANSPLANTATION Fourth Report of the National Transplant Registry 2007
Table 1.2.3: Distribution of Patients by Age Group, 1987-2007 Year 1987 1988 1989 1990 1991 1992 1993 Age group No. % No. % No. % No. % No. % No. % No. % 0-9 4 50 4 67 17 77 5 100 10 83 15 71 9 47 10-19 4 50 2 33 5 23 0 0 2 17 6 29 10 53 20-39 0 0 0 0 0 0 0 0 0 0 0 0 0 0 40-59 0 0 0 0 0 0 0 0 0 0 0 0 0 0 ≥60 0 0 0 0 0 0 0 0 0 0 0 0 0 0 TOTAL 8 100 6 100 22 100 5 100 12 100 21 100 19 100 Mean 9 7 8 6 6 7 9 SD 4 3 3 3 4 4 5 Median 9 8 8 6 6 6 10 Minimum 2 2 1 2 1 1 1 Maximum 15 10 13 9 13 14 17 Year 1994 1995 1996 1997 1998 1999 2000 Age group No. % No. %. No. % No. % No. % No. % No. % 0-9 11 44 12 40 13 46 19 58 21 43 28 45 27 29 10-19 11 44 13 43 12 43 8 24 16 33 15 24 27 29 20-39 3 12 4 13 3 11 5 15 12 24 12 19 19 20 40-59 0 0 1 3 0 0 1 3 0 0 7 11 20 21 ≥60 0 0 0 0 0 0 0 0 0 0 0 0 1 1 TOTAL 25 100 30 100 28 100 33 100 49 100 62 100 94 100 Mean 11 13 11 12 13 17 23 SD 7 9 9 12 10 15 17 Median 11 11 11 6 10 11 18 Minimum 1 3 1 1 5 months 1 1 Maximum 29 41 37 45 39 57 61 Year 2001 2002 2003 2004 2005 2006 Age group No. % No. % No. % No. % No. % No. % 0-9 23 21 30 26 42 33 26 19 29 20 40 31 10-19 28 26 25 22 18 14 41 29 31 21 26 20 20-39 40 37 36 32 47 37 52 37 51 35 31 24 40-59 16 15 23 20 21 16 18 13 35 24 25 20 ≥60 1 1 0 0 0 0 2 1 1 1 5 4 TOTAL 108 100 114 100 128 100 139 100 147 100 127 100 Mean 23 23 22 23 26 24 SD 16 16 15 15 16 19 Median 22 22 23 20 25 18 Minimum 1 month 1 5 months 1 1 1 Maximum 64 55 52 70 66 69 Year 2007 Total Age group No. % No. % 0-9 38 28 423 32 10-19 22 16 322 25 20-39 25 19 340 26 40-59 39 29 206 16 ≥60 11 8 21 2 TOTAL 135 100 1312 100 Mean 29 21 SD 21 17 Median 27 16 Minimum 1 1 month Maximum 68 70 Age=date of transplant – date of birth

18
BLOOD MARROW TRANSPLANTATION Fourth Report of the
National Transplant Registry 2007
Figure 1.2.3: Distribution of Patients by Age Group, 1987-2007
Perc
enta
ge o
f pat
ient
s (%
)
Year
0 10
20
30 40
50
60
70 80
90
100
0-9 years 10-19 years 20-39 years 40-59 years
87 88 89 90 91 92 93 94 95 96 97 98 99 00 01 02 03 04 05 06 07
≥60 years
19
BLOOD MARROW TRANSPLANTATION Fourth Report of the National Transplant Registry 2007
Table 1.2.4: Distribution of Patients by Primary Diagnosis, 1987-2007 Year 1987 1988 1989 1990 1991 1992 1993 Diagnosis No. % No. % No. % No. % No. % No. % No. % Acute leukaemia 5 63 4 67 8 36 2 40 1 8 4 19 6 32 Chronic leukaemia 0 0 0 0 1 5 1 20 1 8 4 19 2 11 Hypoplastic anaemia 2 25 0 0 4 18 0 0 4 33 5 24 4 21 Erythrocytic disorders 0 0 0 0 1 5 1 20 1 8 1 5 0 0 Lymphoma 0 0 0 0 0 0 0 0 0 0 0 0 0 0 Solid tumors 0 0 0 0 0 0 0 0 0 0 3 14 1 5 Myelodysplasia 0 0 0 0 0 0 0 0 0 0 0 0 1 5 Haemoglobinopathy 1 13 2 33 7 32 1 20 4 33 4 19 2 11 Multiple myeloma 0 0 0 0 0 0 0 0 0 0 0 0 0 0 Others 0 0 0 0 1 5 0 0 1 8 0 0 3 16 TOTAL 8 100 6 100 22 100 5 100 12 100 21 100 19 100 Year 1994 1995 1996 1997 1998 1999 2000 Diagnosis No. % No. % No. % No. % No. % No. % No. % Acute leukaemia 8 32 10 33 13 46 11 33 23 47 28 45 37 39 Chronic leukaemia 4 16 5 17 5 18 6 18 7 14 7 11 13 14 Hypoplastic anaemia 5 20 8 27 4 14 5 15 4 8 5 8 11 12 Erythrocytic disorders 0 0 0 0 1 4 0 0 0 0 0 0 0 0 Lymphoma 0 0 0 0 0 0 2 6 5 10 6 10 19 20 Solid tumors 1 4 1 3 0 0 1 3 2 4 5 8 2 2 Myelodysplasia 2 8 0 0 0 0 0 0 1 2 0 0 1 1 Haemoglobinopathy 5 20 5 17 5 18 6 18 2 4 4 6 7 7 Multiple myeloma 0 0 0 0 0 0 0 0 0 0 3 5 1 1 Others 0 0 1 3 0 0 2 6 5 10 4 6 3 3 TOTAL 25 100 30 100 28 100 33 100 49 100 62 100 94 100 Year 2001 2002 2003 2004 2005 2006 Diagnosis No. % No. % No. % No. % No. % No. % Acute leukaemia 48 44 48 42 42 33 46 33 54 37 38 30 Chronic leukaemia 18 17 19 17 19 15 22 16 13 9 11 9 Hypoplastic anaemia 7 6 4 4 5 4 12 9 5 3 14 11 Erythrocytic disorders 0 0 1 1 2 2 0 0 0 0 0 0 Lymphoma 23 21 20 18 28 22 35 25 34 23 23 18 Solid tumors 0 0 3 3 2 2 0 0 2 1 3 2 Myelodysplasia 4 4 4 4 3 2 6 4 4 3 4 3 Haemoglobinopathy 4 4 8 7 17 13 9 6 16 11 11 9 Multiple myeloma 1 1 4 4 4 3 3 2 8 5 10 8 Others 3 3 3 3 6 5 6 4 11 7 13 10 TOTAL 108 100 114 100 128 100 139 100 147 100 127 100 Year 2007 Total Diagnosis No. % No. % Acute leukaemia 46 34 482 37 Chronic leukaemia 5 4 163 12 Hypoplastic anaemia 8 6 116 9 Erythrocytic disorders 0 0 8 1 Lymphoma 25 19 220 17 Solid tumors 3 2 29 2 Myelodysplasia 1 1 31 2 Haemoglobinopathy 10 7 130 10 Multiple myeloma 12 9 46 4 Others 25 19 87 7 TOTAL 135 100 1312 100

20
BLOOD MARROW TRANSPLANTATION Fourth Report of the
National Transplant Registry 2007
# Diagnosis Categorisation 1 Acute leukaemia, unclassified
Acute leukaemia
2 Acute undifferentiated leukaemia 3 Acute Lymphocytic Leukaemia (ALL) 4 Acute Myelogenous Leukaemia (AML) denovo 5 AML post-chemotherapy 6 AML post-MDS 7 Chronic lymphocytic leukaemia Chronic leukaemia 8 Chronic myeloid leukaemia 9 Aplastic anaemia Hypoplastic anaemia 10 Fanconi's anaemia 11 Diamond-Blackfan anaemia Erythrocytic Disorders 12 Congenital Dyserythropoeitic Anaemia (CDA) 13 Hodgkin's lymphoma
Lymphoma 14 Non-Hodgkin's lymphoma, Aggressive 15 Non-Hodgkin's lymphoma, Indolent 16 Carcinoma, breast
Solid tumors
17 Carcinoma, ovary 18 Germ Cell Tumour (GCT)-testicular 19 GCT-primary non-testis 20 Ewing's sarcoma 21 Glioma 22 Hepatoblastoma 23 Neuroblastoma 24 Rhabdomyosarcoma 25 Soft tissue sarcoma (non-RMS) 26 Wilms tumour 27 Primitive Neuroectodermal Tumour (NET) 28 Juvenile Myelomonocytic leukaemia
Myelodysplasia 29 Myelodyplastic syndrome (MDS) 30 Myelofibrosis 31 Thalassaemia major Haemoglobinopathy 32 Sickle Cell Anaemia 33 Multiple myeloma Multiple myeloma 34 Haemophagocytic Lymphohistiocytosis Syndrome
Others 35 Congenital Immunodeficiencies 36 Osteopetrosis 37 Others

21
BLOOD MARROW TRANSPLANTATION Fourth Report of the National Transplant Registry 2007
1.3 TRANSPLANT PRACTICES For the first time in 20 years, the number of allogeneic and autologous HSCT were equivalent whereas allogeneic transplants had previously dominated. Most of the autologous HSCT were for adult recipients. The predominance of peripheral blood as the stem cell source was again seen in 79% of the total HSCT, a preference which had been shown since the year 2000. The HLA matching for the 67 allogeneic transplants were 91%, 4%, 3% and 1% respectively for 0, 1, 2 and 3 antigen mismatches. Sibling donors were seen in 58 HSCT while the remaining 9 were from unrelated donors with cord blood donors predominating. Table 1.3.1: Distribution of Patients by Graft Number, 1987-2007 Year 1987 1988 1989 1990 1991 1992 1993 Graft number
No. % No. % No. % No. % No. % No. % No. %
1 8 100 6 100 19 86 4 80 9 75 19 90 18 95 2 0 0 0 0 2 9 1 20 3 25 2 10 1 5 3 0 0 0 0 1 5 0 0 0 0 0 0 0 0 TOTAL 8 100 6 100 22 100 5 100 12 100 21 100 19 100
Year 1994 1995 1996 1997 1998 1999 2000 Graft number
No. % No. % No. % No. % No. % No. % No. %
1 24 96 29 97 28 100 31 94 47 96 61 98 91 97 2 1 4 1 3 0 0 1 3 1 2 1 2 3 3 3 0 0 0 0 0 0 1 3 1 2 0 0 0 0 TOTAL 25 100 30 100 28 100 33 100 49 100 62 100 94 100 Year 2001 2002 2003 2004 2005 2006 Graft number
No. % No. % No. % No. % No. % No. %
1 103 95 113 99 125 98 134 98 121 98 114 97 2 5 5 1 1 3 2 3 2 2 2 2 2 3 0 0 0 0 0 0 0 0 0 0 1 1 TOTAL 108 100 114 100 128 100 137 100 123 100 117 100
Year 2007 Total Graft number
No. % No. %
1 107 98 1211 97 2 2 2 35 3 3 0 0 4 0 TOTAL 109 100 1250 100

22
BLOOD MARROW TRANSPLANTATION Fourth Report of the
National Transplant Registry 2007
Figure 1.3.1: Distribution of Patients by Graft Number, 1987-2007
Perc
enta
ge o
f pat
ient
s (%
)
Year
0
20
40
60
80
100
Graft number 1 Graft number 2 Graft number 3
87 88 89 90 91 92 93 94 95 96 97 98 99 00 01 02 03 04 05 06 07

23
BLOOD MARROW TRANSPLANTATION Fourth Report of the National Transplant Registry 2007
Table 1.3.2: Distribution of Patients by Transplantation Type, 1987-2007 Year 1987 1988 1989 1990 1991 1992 1993 Type of transplant No. % No. % No. % No. % No. % No. % No. %
Allogeneic + Syngeneic 8 100 6 100 21 95 5 100 12 100 20 95 18 95 Autologous 0 0 0 0 1 5 0 0 0 0 1 5 1 5 TOTAL 8 100 6 100 22 100 5 100 12 100 21 100 19 100
Year 1994 1995 1996 1997 1998 1999 2000 Type of transplant No. % No. % No. % No. % No. % No. % No. %
Allogeneic + Syngeneic 24 96 29 97 26 93 27 82 32 65 44 71 56 60 Autologous 1 4 1 3 2 7 6 18 17 35 18 29 38 40 TOTAL 25 100 30 100 28 100 33 100 49 100 62 100 94 100 Year 2001 2002 2003 2004 2005 2006 Type of transplant No. % No. % No. % No. % No. % No. %
Allogeneic + Syngeneic 75 69 75 66 84 66 90 65 90 61 84 66 Autologous 33 31 39 34 44 34 49 35 57 39 43 34 TOTAL 108 100 114 100 128 100 139 100 147 100 127 100 Year 2007 TOTAL Type of transplant No. % No. %
Allogeneic + Syngeneic 67 50 893 68 Autologous 68 50 419 32 TOTAL 135 100 1312 100 Figure 1.3.2: Distribution of Patients by Transplantation Type, 1987-2007
Num
ber o
f pat
ient
s (n)
Year
0
20
40
60
80
100
120
140
160 Allogeneic + Syngeneic Autologous
87 88 89 90 91 92 93 94 95 96 97 98 99 00 01 02 03 04 05 06 07

24
BLOOD MARROW TRANSPLANTATION Fourth Report of the
National Transplant Registry 2007
Table 1.3.3: Type of Transplant by Centre, 1987-2007 Type of transplant Allogeneic + Syngeneic Autologous TOTAL Centre No. % No. % No. % KLA 109 12 102 24 211 16 KLP 205 23 29 7 234 18 UKM 56 6 48 11 104 8 SJA 63 7 109 26 172 13 UMA 103 12 53 13 156 12 UMP 294 33 38 9 332 25 GMC 4 0 5 1 9 1 LWE 9 1 1 0 10 1 SJP 35 4 5 1 40 3 ASH 1 0 1 0 2 0 Hospital Ampang 13 1 28 7 41 3 Others* 1 0 0 0 1 0 TOTAL 893 100 419 100 1312 100 * Others include Royal Perth Hospital Figure 1.3.3: Type of Transplant by Centre, 1987-2007
Num
ber o
f pat
ient
s (n)
Centre
0 20 40 60 80
100 120 140 160 180 200 220 240 260 280 300 320
Allogeneic + Syngeneic Autologous
KLA KLP UKM SJA UMA UMP GMC LW E SJP ASH Hospital Ampang
Others

25
BLOOD MARROW TRANSPLANTATION Fourth Report of the National Transplant Registry 2007
Table 1.3.4: Source of Stem Cells, 1987-2007 Year 1987 1988 1989 1990 1991 Transplant source No. % No. % No. % No. % No. % Marrow 8 100 6 100 22 100 5 100 12 100 PBSC / Marrow + PBSC 0 0 0 0 0 0 0 0 0 0 Cord blood / Marrow + cord 0 0 0 0 0 0 0 0 0 0 TOTAL 8 100 6 100 22 100 5 100 12 100
Year 1992 1993 1994 1995 1996 Transplant source No. % No. % No. % No. % No. % Marrow 21 100 19 100 25 100 30 100 28 100 PBSC / Marrow + PBSC 0 0 0 0 0 0 0 0 0 0 Cord blood / Marrow + cord 0 0 0 0 0 0 0 0 0 0 TOTAL 21 100 19 100 25 100 30 100 28 100 Year 1997 1998 1999 2000 2001 Transplant source No. % No. % No. % No. % No. % Marrow 24 73 25 51 37 60 31 33 30 28 PBSC / Marrow + PBSC 7 21 23 47 23 37 57 61 74 69 Cord blood / Marrow + cord 2 6 1 2 2 3 6 6 4 4 TOTAL 33 100 49 100 62 100 94 100 108 100 Year 2002 2003 2004 2005 2006 Transplant source No. % No. % No. % No. % No. % Marrow 31 27 44 34 30 22 24 16 17 13 PBSC / Marrow + PBSC 79 69 79 62 100 72 116 79 100 79 Cord blood / Marrow + cord 4 4 5 4 9 6 7 5 10 8 TOTAL 114 100 128 100 139 100 147 100 127 100 Year 2007 Total Transplant source No. % No. % Marrow 23 17 492 38 PBSC / Marrow + PBSC 106 79 764 58 Cord blood / Marrow + cord 6 4 56 4 TOTAL 135 100 1312 100

26
BLOOD MARROW TRANSPLANTATION Fourth Report of the
National Transplant Registry 2007
Figure 1.3.4: Source of Stem Cells, 1987-2007
Num
ber o
f pat
ient
s (n)
0
20
40
60
80
100
120
140
160
Marrow PBSC/ Marrow+ PBSC Cord blood/ Marrow + cord
87 88 89 90 91 92 93 94 95 96 97 98 99 00 01 02 03 04 05 06 07
Year

27
BLOOD MARROW TRANSPLANTATION Fourth Report of the National Transplant Registry 2007
Table 1.3.5: Distribution of Patients by HLA Match, 1987-2007 Year 1987 1988 1989 1990 1991 HLA Match No. % No. % No. % No. % No. % Identical 8 100 6 100 21 100 5 100 12 100 1 AG 0 0 0 0 0 0 0 0 0 0 2 AG 0 0 0 0 0 0 0 0 0 0 ≥3 AG Disparate 0 0 0 0 0 0 0 0 0 0 TOTAL 8 100 6 100 21 100 5 100 12 100
Year 1992 1993 1994 1995 1996 HLA Match No. % No. % No. % No. % No. % Identical 20 100 18 100 23 96 29 100 26 100 1 AG 0 0 0 0 1 4 0 0 0 0 2 AG 0 0 0 0 0 0 0 0 0 0 ≥3 AG Disparate 0 0 0 0 0 0 0 0 0 0 TOTAL 20 100 18 100 24 100 29 100 26 100 Year 1997 1998 1999 2000 2001 HLA Match No. % No. % No. % No. % No. % Identical 25 93 31 97 40 91 52 93 69 92 1 AG 2 7 0 0 3 7 0 0 4 5 2 AG 0 0 1 3 1 2 4 7 1 1 ≥3 AG Disparate 0 0 0 0 0 0 0 0 1 1 TOTAL 27 100 32 100 44 100 56 100 75 100 Year 2002 2003 2004 2005 2006 HLA Match No. % No. % No. % No. % No. % Identical 70 93 79 94 83 92 85 94 78 93 1 AG 3 4 3 4 3 3 4 4 4 5 2 AG 2 3 2 2 4 4 1 1 2 2 ≥3 AG Disparate 0 0 0 0 0 0 0 0 0 0 TOTAL 75 100 84 100 90 100 90 100 84 100 Year 2007 TOTAL HLA Match No. % No. % Identical 61 91 841 94 1 AG 3 4 30 3 2 AG 2 3 20 2 ≥3 AG Disparate 1 1 2 0 TOTAL 67 100 893 100

28
BLOOD MARROW TRANSPLANTATION Fourth Report of the
National Transplant Registry 2007
Table 1.3.6: Distribution of Patients by Allogeneic Donor Relationship, 1987-2007 Year 1987 1988 1989 1990 1991 Allogeneic Donor Relationship No. % No. % No. % No. % No. % Sibling 8 100 6 100 21 100 5 100 11 92 Unrelated 0 0 0 0 0 0 0 0 0 0
Marrow 0 0 0 0 0 0 0 0 0 0 PBSC / Marrow + PBSC 0 0 0 0 0 0 0 0 0 0 Cord blood / Marrow + cord 0 0 0 0 0 0 0 0 0 0
Others 0 0 0 0 0 0 0 0 1 8 TOTAL 8 100 6 100 21 100 5 100 12 100
Year 1992 1993 1994 1995 1996 Allogeneic Donor Relationship No. % No. % No. % No. % No. % Sibling 20 100 18 100 22 92 29 100 26 100 Unrelated 0 0 0 0 0 0 0 0 0 0
Marrow 0 0 0 0 0 0 0 0 0 0 PBSC / Marrow + PBSC 0 0 0 0 0 0 0 0 0 0 Cord blood / Marrow + cord 0 0 0 0 0 0 0 0 0 0
Others 0 0 0 0 2 8 0 0 0 0 TOTAL 20 100 18 100 24 100 29 100 26 100 Year 1997 1998 1999 2000 2001 Allogeneic Donor Relationship No. % No. % No. % No. % No. % Sibling 26 96 32 100 44 100 55 98 72 96 Unrelated 1 4 0 0 0 0 1 2 3 4
Marrow 0 0 0 0 0 0 0 0 0 0 PBSC / Marrow + PBSC 0 0 0 0 0 0 0 0 0 0 Cord blood / Marrow + cord 1 100 0 0 0 0 1 100 3 100
Others 0 0 0 0 0 0 0 0 0 0 TOTAL 27 100 32 100 44 100 56 100 75 100 Year 2002 2003 2004 2005 2006 Allogeneic Donor Relationship No. % No. % No. % No. % No. % Sibling 71 95 81 96 81 90 82 91 73 87 Unrelated 4 5 3 4 9 10 8 9 11 13
Marrow 0 0 0 0 1 11 2 25 2 18 PBSC / Marrow + PBSC 0 0 0 0 2 22 1 13 1 9 Cord blood / Marrow + cord 4 100 3 100 6 67 5 63 8 73
Others 0 0 0 0 0 0 0 0 0 0 TOTAL 75 100 84 100 90 100 90 100 84 100 Year 2007 TOTAL Allogeneic Donor Relationship No. % No. % Sibling 58 87 841 94 Unrelated 9 13 49 5
Marrow 1 11 6 12 PBSC / Marrow + PBSC 2 22 6 12 Cord blood / Marrow + cord 6 67 37 76
Others 0 0 3 0 TOTAL 67 100 893 100 *excluding autologous, including syngeneic

29
BLOOD MARROW TRANSPLANTATION Fourth Report of the National Transplant Registry 2007
1.4 TRANSPLANT OUTCOMES Mortality for the 135 HSCT was reported at 17.7%. The commonest causes of death were underlying disease, sepsis and graft-versus-host disease which accounted for 42%, 21% and 4% of all deaths respectively. These causes were similar to the results seen in the CIBMTR (Center for International Blood and Marrow Transplant Research) but the percentage of 21% for sepsis was disproportionately high. In fact the relatively high percentage of septic deaths over the past 5 years should alert transplant centres to audit their clinical practice and policies. Table 1.4.1: Distribution of Patients by Cause of Death, 1987-2007 Year 1987 1988 1989 1990 1991 Cause of death No. % No. % No. % No. % No. % Sepsis 1 100 0 0 0 0 0 0 1 100 GVHD 0 0 0 0 0 0 1 17 0 0 Underlying disease 0 0 0 0 6 100 5 83 0 0 Haemorrhage 0 0 1 100 0 0 0 0 0 0 VOD 0 0 0 0 0 0 0 0 0 0 Organ Failure 0 0 0 0 0 0 0 0 0 0 Interstitial pneumonitis 0 0 0 0 0 0 0 0 0 0 Secondary malignancy 0 0 0 0 0 0 0 0 0 0 Others 0 0 0 0 0 0 0 0 0 0 Unknown 0 0 0 0 0 0 0 0 0 0 TOTAL 1 100 1 100 6 100 6 100 1 100 Year 1992 1993 1994 1995 1996 Cause of death No. % No. % No. % No. % No. % Sepsis 1 50 2 22 1 20 4 23 6 55 GVHD 0 0 0 0 0 0 4 23 0 0 Underlying disease 0 0 6 67 3 60 3 18 3 27 Haemorrhage 0 0 1 11 0 0 2 12 1 9 VOD 0 0 0 0 0 0 1 6 1 9 Organ Failure 1 50 0 0 1 20 2 12 0 0 Interstitial pneumonitis 0 0 0 0 0 0 0 0 0 0 Secondary malignancy 0 0 0 0 0 0 1 6 0 0 Others 0 0 0 0 0 0 0 0 0 0 Unknown 0 0 0 0 0 0 0 0 0 0 TOTAL 2 100 9 100 5 100 17 100 11 100
Year 1997 1998 1999 2000 2001 Cause of death No. % No. % No. % No. % No. % Sepsis 5 33 1 6 6 40 2 6 4 9 GVHD 0 0 2 13 1 7 2 6 4 9 Underlying disease 9 60 11 69 7 46 22 72 33 70 Haemorrhage 0 0 1 6 0 0 3 10 2 4 VOD 0 0 0 0 0 0 1 3 2 4 Organ Failure 1 7 0 0 1 7 0 0 0 0 Interstitial pneumonitis 0 0 1 6 0 0 1 3 2 4 Secondary malignancy 0 0 0 0 0 0 0 0 0 0 Others 0 0 0 0 0 0 0 0 0 0 Unknown 0 0 0 0 0 0 0 0 0 0 TOTAL 15 100 16 100 15 100 31 100 47 100

30
BLOOD MARROW TRANSPLANTATION Fourth Report of the
National Transplant Registry 2007
Year 2002 2003 2004 2005 2006 Cause of death No. % No. % No. % No. % No. % Sepsis 4 13 14 27 10 22 9 23 8 32 GVHD 3 10 5 10 9 20 7 18 2 8 Underlying disease 19 64 28 55 23 51 16 40 11 44 Haemorrhage 0 0 0 0 2 5 2 5 1 4 VOD 0 0 0 0 0 0 0 0 3 12 Organ Failure 3 10 2 4 0 0 1 2 0 0 Interstitial pneumonitis 0 0 1 2 0 0 2 5 0 0 Secondary malignancy 0 0 0 0 0 0 0 0 0 0 Others 0 0 0 0 0 0 2 5 0 0 Unknown 1 3 1 2 1 2 1 2 0 0 TOTAL 30 100 51 100 45 100 40 100 25 100 Year 2007 Total Cause of death No. % No. % Sepsis 5 21 84 21 GVHD 1 4 41 10 Underlying disease 10 42 215 54 Haemorrhage 0 0 16 4 VOD 0 0 8 2 Organ Failure 0 0 12 3 Interstitial pneumonitis 0 0 7 2 Secondary malignancy 0 0 1 0 Others 8 33 10 3 Unknown 0 0 4 1 TOTAL 24 100 398 100 Figure 1.4.1: Patient Survival by Year of Transplant, 1987-2007
0.00
0.
25
0.50
0.
75
1.00
Cum
ulat
ive
surv
ival
0 1 2 3 4 5 6 7 8 9 10 11 12 13 14 15 16 17 18 19 20 Duration in years
Year 1987-1992 Year 1993-1998 Year 1999-2007

31
BLOOD MARROW TRANSPLANTATION Fourth Report of the National Transplant Registry 2007
Figure 1.4.2: Patient Survival by Gender, 1987-2007
0.00
0.
25
0.50
0.
75
1.00
Cum
ulat
ive
surv
ival
0 1 2 3 4 5 6 7 8 9 10 11 12 13 14 15 16 17 18 19 20 Duration in years
Male Female
Figure 1.4.3: Patient Survival by Age Group, 1987-2007
0.00
0.25
0.50
0.75
1.
00
0 1 2 3 4 5 6 7 8 9 10 11 12 13 14 15 16 17 18 19 20
Duration in years0-9 years 10-19 years20-39 years 40 years ≥

32
BLOOD MARROW TRANSPLANTATION Fourth Report of the
National Transplant Registry 2007
Figure 1.4.4: Patient Survival by Type of Transplant, 1987-2007
0.00
0.
25
0.50
0.
75
1.00
Cum
ulat
ive
surv
ival
0 1 2 3 4 5 6 7 8 9 10 11 12 13 14 15 16 17 18 19 20 Duration in years
Allogeneic + Syngeneic Autologous

33
BLOOD MARROW TRANSPLANTATION Fourth Report of the National Transplant Registry 2007
1.5 DISEASE-FREE SURVIVAL Figures 1.5.1 to 1.5.7 depict the disease-free survival for individual diseases while figures 1.5.8 to 1.5.14 show the DFS between paediatric and adult patients. Superior DFS rates were seen in paediatric patients for all diseases except acute lymphoblastic leukaemia and aplastic anaemia. The reasons for the poorer outcome for paediatric recipients with these two disorders were not apparent but may be explained by the remission state at transplant and would merit further analysis in future reports. Figure 1.5.1: Disease-free Survival for Acute Myeloid Leukaemia, 1987-2007 (Allogeneic vs. Autologous)
0.00
0.
25
0.50
0.
75
1.00
Cum
ulat
ive
surv
ival
0 1 2 3 4 5 6 7 8 9 10 11 12 13 14 15 16 17 18 19 20
Duration in years
Allogeneic Autologous

34
BLOOD MARROW TRANSPLANTATION Fourth Report of the
National Transplant Registry 2007
Figure 1.5.2: Disease-free Survival for Acute Lymphoblastic Leukaemia, 1987-2007 (Allogeneic)
0.00
0.
25
0.50
0.
75
1.00
C
umul
ativ
e su
rviv
al
0 1 2 3 4 5 6 7 8 9 10 11 12 13 14 15 16 17 18 19 20 Duration in years
Allogeneic
Figure 1.5.3: Disease-free Survival for Thalassaemia, 1987-2007 (Allogeneic)
0.00
0.25
0.50
0.75
1.00
Cum
ulat
ive
surv
ival
0 1 2 3 4 5 6 7 8 9 10 11 12 13 14 15 16 17 18 19 20Duration in years
Allogeneic

35
BLOOD MARROW TRANSPLANTATION Fourth Report of the National Transplant Registry 2007
Figure 1.5.4: Disease-free Survival for Non-Hodgkin’s Lymphoma, 1987-2007 (Allogeneic vs. Autologous)
0.00
0.
25
0.50
0.
75
1.00
Cum
ulat
ive
surv
ival
0 1 2 3 4 5 6 7 8 9 10 11 12 13 14 15 16 17 18 19 20 Duration in years
Allogeneic Autologous
Figure 1.5.5: Disease-free Survival for Hodgkin’s Disease, 1987-2007 (Autologous)
0.00
0.
25
0.50
0.
75
1.00
C
umul
ativ
e su
rviv
al
0 1 2 3 4 5 6 7 8 9 10 11 12 13 14 15 16 17 18 19 20 Duration in years
Autologous

36
BLOOD MARROW TRANSPLANTATION Fourth Report of the
National Transplant Registry 2007
Figure 1.5.6: Disease-free Survival for Chronic Myeloid Leukaemia, 1987-2007 (Allogeneic)
0.00
0.
25
0.50
0.
75
1.00
Cum
ulat
ive
surv
ival
0 1 2 3 4 5 6 7 8 9 10 11 12 13 14 15 16 17 18 19 20 Duration in years
Allogeneic
Figure 1.5.7: Disease-free Survival for Aplastic Anaemia, 1987-2007 (Allogeneic)
0.00
0.
25
0.50
0.
75
1.00
C
umul
ativ
e su
rviv
al
0 1 2 3 4 5 6 7 8 9 10 11 12 13 14 15 16 17 18 19 20 Duration in years
Allogeneic

37
BLOOD MARROW TRANSPLANTATION Fourth Report of the National Transplant Registry 2007
Figure 1.5.8: Disease-free Survival by Age Group for Acute Myeloid Leukaemia, 1987-2007
0.00
0.
25
0.50
0.
75
1.00
C
umul
ativ
e su
rviv
al
0 1 2 3 4 5 6 7 8 9 10 11 12 13 14 15 16 17 18 19 20 Duration in years
Paediatric Adult
Paediatric is defined as age 18 years and adult age >18 years Figure 1.5.9: Disease-free Survival by Age Group for Acute Lymphoblastic Leukaemia, 1987-2007
0.00
0.
25
0.50
0.
75
1.00
C
umul
ativ
e su
rviv
al
0 1 2 3 4 5 6 7 8 9 10 11 12 13 14 15 16 17 18 19 20 Duration in yearsPaediatric Adult
Paediatric is defined as age 18 years and adult age >18 years

38
BLOOD MARROW TRANSPLANTATION Fourth Report of the
National Transplant Registry 2007
Figure 1.5.10: Disease-free Survival by Age Group for Thalassaemia, 1987-2007
0.00
0.
25
0.50
0.
75
1.00
C
umul
ativ
e su
rviv
al
0 1 2 3 4 5 6 7 8 9 10 11 12 13 14 15 16 17 18 19 20 Duration in years
Paediatric
No adult cases reported for Thalassaemia Paediatric is defined as age 18 years and adult age >18 years Figure 1.5.11: Disease-free Survival by Age Group for Non-Hodgkin’s Lymphoma, 1987-2007
0.00
0.
25
0.50
0.
75
1.00
Cum
ulat
ive
surv
ival
0 1 2 3 4 5 6 7 8 9 10 11 12 13 14 15 16 17 18 19 20 Duration in years
Paediatric Adult
Paediatric is defined as age 18 years and adult age >18 years

39
BLOOD MARROW TRANSPLANTATION Fourth Report of the National Transplant Registry 2007
Figure 1.5.12: Disease-free Survival by Age Group for Hodgkin’s Disease, 1987-2007
0.00
0.
25
0.50
0.
75
1.00
Cum
ulat
ive
surv
ival
0 1 2 3 4 5 6 7 8 9 10 11 12 13 14 15 16 17 18 19 20 Duration in years
Paediatric Adult
Paediatric is defined as age 18 years and adult age >18 years Figure 1.5.13: Disease-free Survival by Age Group for Chronic Myeloid Leukaemia, 1987-2007
0.00
0.
25
0.50
0.
75
1.00
Cum
ulat
ive
surv
ival
0 1 2 3 4 5 6 7 8 9 10 11 12 13 14 15 16 17 18 19 20 Duration in years Paediatric Adult

40
BLOOD MARROW TRANSPLANTATION Fourth Report of the
National Transplant Registry 2007
Figure 1.5.14: Disease-free Survival by Age Group for Aplastic Anaemia, 1987-2007
0.00
0.
25
0.50
0.
75
1.00
C
umul
ativ
e su
rviv
al
0 1 2 3 4 5 6 7 8 9 10 11 12 13 14 15 16 17 18 19 20 Duration in years
Paediatric Adult
Paediatric is defined as age 18 years and adult age >18 years 1.6 Conclusion Most of the DFS outcomes reported were comparable to centres in the developed world. Our data did not show greater breakdown in terms of remission status for malignant diseases and we look forward to more detailed analysis in future reports. All participating centres should be congratulated for their efforts in maintaining good data for this registry. Some of the data have been used for presentations at international conferences and also contribute to the Asia-Pacific Bone Marrow Transplant Registry. A small number of transplant units in Malaysia report individually to the European BMT Registry or the CIBMTR (Center for International Blood and Marrow Transplant Research). The challenges which we faced in meeting the needs of patients who require HSCT in 2007 included a lack of HSCT beds resulting in a significant waiting list even for patients who have matched sibling donors identified. Some patients lacked financial resources to pursue the option of unrelated donor transplantations and hence were deprived of a potential chance of cure. Hopefully these challenges will spur the HSCT community in Malaysia to greater efforts to meet the needs of patients.

CHAPTER 2
CORNEAL TRANSPLANTATION
Editors: Dr Shamala Retnasabapathy
Dr Choong Yean Yaw Dr Michael Law Sie Haur
Dr Chandramalar Santhirathelagan
Expert Panel:Dr Shamala Retnasabapathy (Chairperson)
Dr Choong Yean Yaw (Co-chairperson) Dr Jonathan Choon Siew Cheong
Dr Chuah Kay Leong Dr Michael Law Sie Haur
Dr Mariam Ismail Assoc Prof. S C Reddy Dato’ Dr Veera Ramani
Dr Sahimi Sulaiman Dr U Thiageswari
Dr Chandramalar Santhirathelagan
Contents
2.0 Introduction
2.1 Corneal Transplant Activities and Trends 1998-2007 Transplant Rates
Type of Transplant
2.2 Recipients’ Characteristics 1998-2007 Demographics
Primary Diagnosis
2.3 Transplant Practices 2004 - 2007 Recipient Details
Donor Details Transplant Practices
2.4 Corneal Transplant Outcome 2004-2007
Outcome - Graft Survival Outome – Vision
2.5 Post Corneal Transplant Complications 2004-2007

42
CORNEAL TRANSPLANTATION Fourth Report of the
National Transplant Registry 2007
List of Tables Table 2.1.1: Number of Corneal Transplantation and Transplant Rate per million population
(pmp), 1998-2007 ............................................................................................... 45 Table 2.1.2: Types of Corneal Transplant, 1998-2007.............................................................46 Table 2.2.1: Gender Distribution, 1998-2007 ......................................................................... 47 Table 2.2.2: Ethnic Distribution, 1998-2007 .......................................................................... 48 Table 2.2.3: Age Distribution of Cornea Transplant Recipient Patients, 1998-2007 ............. 48 Table 2.2.4: Primary Diagnosis, 1998-2007 ............................................................................49 Table 2.2.5: Indications of Corneal Transplant, 2004-2007 ................................................... 50 Table 2.3.1.1: No of Previous Grafts in Grafted Eye, 2004-2007 .......................................... 51 Table 2.3.1.2: Ocular Co-morbidity, 2004-2007 .................................................................... 51 Table 2.3.1.3: Pre-operative Vision, 2004-2007 ..................................................................... 52 Table 2.3.2.1: Source of Donor Cornea Tissue, 2004-2007 ................................................... 53 Table 2.3.2.2: Donor Age Distribution, 2004-2007 ................................................................ 54 Table 2.3.2.3: Preservation Media, 2004-2007 ....................................................................... 54 Table 2.3.2.4: Cause of Death in Corneal Donors, 2004-2007 ............................................... 55 Table 2.3.3.1: Types of Surgeries, 2004-2007 ........................................................................ 56 Table 2.3.3.2: Types of Combined Surgeries, 2004-2007 ...................................................... 56 Table 2.3.3.3: Recipient Cornea Trephine Size, 2005-2007 ................................................... 57 Table 2.3.3.4: Difference in Trephined Sizes of Recipient and Donor Corneas, 2004-2007 . 57 Table 2.3.3.5: Suture Technique, 2004-2007 .......................................................................... 57 Table 2.4.1: Stock and Flow - Graft Status (whole database)………………………………..58 Table 2.4.2.1: Graft Survival, 2004-2007* ............................................................................. 59 Table 2.4.2.2: Graft Survival by Optical and Non-optical Indication, 2004-2007 ................. 60 Table 2.4.2.3 Graft Success by Gender, 2004-2007 ............................................................... 61 Table 2.4.2.4 Graft Survival by Age, 2004-2007 .................................................................... 62 Table 2.4.2.5: Causes of Graft Failure .................................................................................... 63 Table 2.4.3.1: Availability of Data on Post Corneal Transplant Unaided Vision ................... 64 Table 2.4.3.2: Unaided Visual Outcome After Cornea Transplant Surgery ........................... 64 Table 2.4.3.3 Unaided Vision for Optical and Non Optical Cases…………………………..65 Table 2.5.1: Post Transplant Complications…………………………………………………66 Table 2.5.2: Post Transplant Graft Rejection Types ............................................................... 66 List of Figures Figure 2.3.2.1: Source of Donor Corneal Tissue, 2004-2007 ................................................. 53 Figure 2.3.2.3: Preservation Media, 2004-2007 ...................................................................... 54 Figure 2.4.2.1: Graft Survival, 2004-2007………………………………………………….. 59 Figure 2.4.2.2: Graft Survival by Optical and Non Optical Indication, 2004-2007………… 60 Figure 2.4.2.3: Graft Success by Gender, 2004-2007……...…………………………….… 61 Figure 2.4.2.4: Graft Survival by Age, 2004-2007………………..……………………...… 62 Figure 2.4.3.2: Unaided Visual Outcome After Corneal Transplant Surgery …..……..…… 64 Figure 2.4.3.3: Cumulative Probability for Unaided Vision in Grafts.……………….……. 65

43
CORNEAL TRANSPLANTATION Fourth Report of the National Transplant Registry 2007
2.0 INTRODUCTION Corneal transplantation surgery allows restoration of vision in patients with corneal blindness. Corneal transplantation in Malaysia dates back to the 1970’s. Today it is widely performed by ophthalmologists throughout the country both in the government and private sectors with each centre maintaining its own data. The National Transplant Registry (NTR) was established in December 2003. The corneal transplant section of the NTR is a systematic centralised data collection of all corneal transplantation performed in the country. A total of 46 centres registered and agreed to provide information on retrospective and prospective corneal transplant activities. A total of 46 contributing surgeons participated in the NTR – Corneal Transplant section. Participation was on a voluntary basis. Retrospective data (from 1998 to 2003) on corneal transplant activities were collected to identify the trend of corneal transplant surgery in the recent past. Prospective data (from the year 2004) on corneal transplant activities involved gathering information on all cornea transplants performed in Malaysia on two forms. The first form is the i) Corneal Transplant Notification Form (Form N-cds) which is completed at the time of surgery and gathers information on the recipient, operative procedure and the donor. The second form is the ii) Corneal Transplant Outcome Form (Form O-cds) which is completed at the end of 12 months and annually thereafter. Follow-up only ceases upon failure of graft, death or loss to follow-up of the patient.

44
CORNEAL TRANSPLANTATION Fourth Report of the
National Transplant Registry 2007
The Corneal section of the NTR will be discussed under 5 sections. Section 2.1 and Section 2.2 covers notification data on corneal transplantation over 10 years from 1998 to 2007. Effort was made to ensure that all cases of corneal transplantation were reported. To the best of our knowledge, this report provides information on all corneal transplants performed in the country. Section 2.3 covers prospective notification data on corneal transplantation performed (from2004 onwards). Section 2.4 covers prospective outcome data on corneal transplantation performed (from 2004 onwards). Section 2.5 covers prospective outcome data on corneal transplantation complications (from 2004 onwards).

45
CORNEAL TRANSPLANTATION Fourth Report of the National Transplant Registry 2007
2.1 CORNEAL TRANSPLANT ACTIVITIES AND TRENDS (1998 – 2007) The number of corneal transplants performed between the years 1998 to 2007 varied annually, 1998 had the least number of cases (119 cases) and 2001 had the highest number of cases (221 cases). (Table 2.1.1) Penetrating keratoplasty was the most frequent type of corneal transplant surgery and was performed in 92% of cases (Table 2.1.2). Table 2.1.1: Number of Corneal Transplantation and Transplant Rate per million population (pmp), 1998-2007
Year 1998 1999 2000 2001 2002 2003 2004 2005 2006 2007
No. of new transplants 119 122 126 221 203 165 184 192 177 189 New transplant rate pmp 5 5 5 9 8 7 7 7 7 7

46
CORNEAL TRANSPLANTATION Fourth Report of the
National Transplant Registry 2007

47
CORNEAL TRANSPLANTATION Fourth Report of the National Transplant Registry 2007

48
CORNEAL TRANSPLANTATION Fourth Report of the
National Transplant Registry 2007

49
CORNEAL TRANSPLANTATION Fourth Report of the National Transplant Registry 2007

50
CORNEAL TRANSPLANTATION Fourth Report of the
National Transplant Registry 2007
Table 2.2.5: Indications of Corneal Transplant, 2004-2007 Indication of transplant 2004
(N=184) 2005
(N=192) 2006
(N=177) 2007
(N=189) TOTAL(N=742)
No. % No. % No. % No. % No. % Optical 120 65 135 70 124 70 132 69 511 69 Tectonic 26 14 23 12 20 11 17 9 86 12 Therapeutic 27 14 19 10 17 9 24 13 87 12 Tectonic + Therapeutic 9 5 9 5 4 2 8 4 30 4 Optical + Tectonic 1 1 1 1 1 1 0 0 3 0 Optical + Tectonic + Therapeutic 0 0 1 1 0 0 1 1 2 0 Optical + Therapeutic 0 0 0 0 5 3 6 3 11 2 Optical + Others 0 0 0 0 1 1 0 0 1 0 Others 1 1 4 2 4 2 1 1 10 1 No data 0 0 0 0 1 1 0 0 1 0

51
CORNEAL TRANSPLANTATION Fourth Report of the National Transplant Registry 2007
2.3 TRANSPLANT DATA, 2004-2007
2.3.1 Recipient data
Re-grafts were performed in 12% of cases (Table 2.3.1.1). Corneal vascularisation was the most frequently encountered pre-operative ocular co-morbidity, followed by ocular inflammation and glaucoma (raised intraocular pressure) (Table 2.3.1.2) Sixty four percent of cases were legally blind (vision 3/60 or worse) prior to corneal transplantation (Table 2.3.1.3). Table 2.3.1.1: No of Previous Grafts in Grafted Eye, 2004-2007 Graft Number 2004 *
(N=138) 2005
(N=192) 2006
(N=177) 2007
(N=189) Total
(N=696) No. % No. % No. % No. % No. % 0 123 89 171 89 160 90 156 83 610 88 1 11 8 15 8 15 8 28 15 69 10 2 3 2 2 1 1 1 4 2 10 1 3 0 0 4 2 1 1 0 0 5 1 4 1 1 0 0 0 0 1 0 2 0 * In the year 2004 there were a total of 184 corneal transplants performed but complete data set was only received for 138 patients. Table 2.3.1.2: Ocular Co-morbidity, 2004-2007 2004
(N=138) 2005
(N=192) 2006
(N=177) 2007
(N=189) Total
(N=696) Ocular co-morbidity No. % No. % No. % No. % No. % Any ocular co-morbidity (a to d below) 88 64 103 54 81 46 83 44 355 51 a) Superficial corneal vascularisation 44 57 48 61 43 73 49 74 184 65 b) Deep corneal vascularisation 42 55 39 49 22 37 26 39 129 46 c) History of glaucoma 29 33 36 35 35 43 36 43 136 38 d) Current ocular inflammation 41 47 50 49 41 51 39 47 171 48 *Patient might have multiple ocular co-morbidities.

52
CORNEAL TRANSPLANTATION Fourth Report of the
National Transplant Registry 2007
Table 2.3.1.3: Pre-operative Vision, 2004-2007 2004
(N=138) 2005
(N=192) 2006
(N=177) 2007
(N=189) Total
(N=696) Unaided VA No. % No. % No. % No. % No. % 6/6 3 2 0 0 1 1 1 1 5 1 6/9 1 1 1 1 1 1 2 1 5 1 6/12 0 0 2 1 3 2 0 0 5 1 6/18 0 0 1 1 0 0 2 1 3 0 6/24 3 2 5 3 4 2 2 1 14 2 6/36 4 3 6 3 5 3 3 1 18 3 6/60 7 5 16 8 17 9 11 6 51 8 5/60 1 1 0 0 0 0 0 0 1 0 4/60 3 2 1 1 2 1 2 1 8 1 3/60 2 1 1 1 2 1 3 1 8 1 2/60 1 1 2 1 4 2 1 1 8 1 1/60 4 3 9 5 7 4 1 1 21 3 CF 47 34 47 24 44 25 42 22 180 26 HM 47 34 46 24 37 21 46 24 176 25 PL 13 9 15 8 12 7 16 8 56 8 NPL 2 1 1 1 0 0 0 0 3 0 Others 0 0 1 1 0 0 1 1 2 0 No data 0 0 38 20 38 21 56 30 132 19

53
CORNEAL TRANSPLANTATION Fourth Report of the National Transplant Registry 2007
2.3.2: Donor details
The most frequent of source of the cornea tissues were from Eye Banks in the United States of America. (Table 2.3.2.1). The majority of donors were elderly patients with a median age of 58 years (Table 2.3.2.2). Optisol GS was the commonest corneal tissue storage medium used at 74% (Table 2.3.2.3). The major cause of death of the donors were related to the cardiac or circulatory system (33%) followed by malignancy (14%) (Table 2.3.2.4)
Table 2.3.2.1: Source of Donor Cornea Tissue, 2004-2007 2004*
(N=138) 2005
(N=192) 2006
(N=177) 2007
(N=189) Total
(N=696) Source of donor No. % No. % No. % No. % No. % Local 20 14 19 10 36 20 31 16 106 15 USA 95 69 133 69 98 56 107 57 433 62 Sri Lanka 22 16 38 20 41 23 51 27 152 22 Others 0 0 0 0 2 1 0 0 2 0 No data 1 1 2 1 0 0 0 0 3 1 If Local, ethnic group:
Malay 0 0 4 21 1 3 5 16 10 9 Chinese 14 70 8 42 12 33 18 58 52 49 Indian 5 25 7 37 23 64 4 13 39 37 Others 0 0 0 0 0 0 4 13 4 4 No data 1 5 0 0 0 0 0 0 1 1
* In the year 2004 there were a total of 184 corneal transplants performed but complete data set was only received for 138 patients. Figure 2.3.2.1: Source of Donor Corneal Tissue, 2004-2007
Perc
enta
ge (%
)
Year
0
10
20
30
40
50
60
70
Local USA Sri Lanka
2004 2005 2006 2007

54
CORNEAL TRANSPLANTATION Fourth Report of the
National Transplant Registry 2007
Table 2.3.2.2: Donor Age Distribution, 2004-2007 2004
(N=138) 2005
(N=192) 2006
(N=174) 2007
(N=189) Total
(N=696) Age, years No. % No. % No. No. % No. % No. 0-9 2 1 3 2 2 1 2 1 9 1 10-19 6 4 4 2 9 5 5 3 24 4 20-39 11 8 7 4 11 6 13 7 42 6 40-59 52 38 89 46 81 46 79 41 301 43 ≥60 67 49 89 46 74 42 90 48 320 46 Mean 56 58 56 57 57 SD 15 14 16 14 15 Median 59 58 56 59 58 Minimum 8 3 6 4 3 Maximum 78 79 78 78 79 Table 2.3.2.3: Preservation Media, 2004-2007 2004
(N=138) 2005
(N=192) 2006
(N=177) 2007
(N=189) Total
(N=696) Preservation media No. % No. % No. % No. % No. % Optisol GS 110 80 147 77 129 73 127 67 513 74 MK Medium 22 16 37 19 40 23 51 27 150 21 Moist Chamber 4 3 3 2 7 4 8 4 22 3 Others* 0 0 1* 0 0 0 3 2 4 1 No data 2 1 4 2 1 0 0 0 7 1 *Others : Eusol-C Figure 2.3.2.3: Preservation Media, 2004-2007
Perc
enta
ge (%
)
Year
0
10
20
30
40
50
60
70
80
Optisol MK Medium Moist Chamber
2004 2005 2006 2007

55
CORNEAL TRANSPLANTATION Fourth Report of the National Transplant Registry 2007
Table 2.3.2.4: Cause of Death in Corneal Donors, 2004-2007 2004
(N=138) 2005
(N=192) 2006
(N=177) 2007
(N=189) Total
(N=696) Cause of death No. % No. % No. % No. % No. % Cardiac / Circulatory System 47 34 49 26 59 33 74 39 229 33 Cerebrovascular System 17 12 25 13 11 6 23 12 76 11 Malignancy 19 14 31 16 25 14 23 12 98 14 Trauma / Accident 20 14 13 7 19 11 24 13 76 11 Respiratory System 15 11 8 4 8 5 13 7 44 6 Others 17 12 21 11 27 15 31 16 96 14 No data 3 2 45 23 28 16 1 1 77 11

56
CORNEAL TRANSPLANTATION Fourth Report of the
National Transplant Registry 2007
2.3.3: Transplant Practices Penetrating Keratoplasty (PK) was the commonest type of surgery performed (88%)* (Table2.3.3.1). Cornea transplantation was performed in combination with other surgical procedures in 19% of cases. Cataract extraction with or without intraocular lens implantation were the commonest combined procedures performed with corneal transplant surgery. (Table 2.3.3.2). The recipient graft size ranged from 2 mm to 10 mm, with the median recipient cornea graft size being 7.5 mm.(Table 2.3.3.3). The majority of cases had the donor tissue over-sized by 0.5 mm (Table 2.3.3.4). The commonest suture technique was interrupted suturing. (Table 2.3.3.5). Table 2.3.3.1: Types of Surgeries, 2004-2007 2004
(N=138) 2005
(N=192) 2006
(N=177) 2007
(N=189) Total
(N=696) Type of surgery No. % No. % No. % No. % No. % Penetrating Keratoplasty 120 88 173 90 153 86 168 89 614 88 Lamellar Keratoplasty 10 7 13 7 16 9 5 2 44 6 Patch graft for corneal 2 1 3 2 5 3 10 5 20 3 Patch graft for scleral 0 0 1 0 1 1 3 2 5 1 Cornea Scleral Lamellar Keratoplasty 6 4 2 1 2 1 3 2 13 2 * In the year 2004 there were a total of 184 corneal transplants performed but complete data set was only received for 138 patients. Table 2.3.3.2: Types of Combined Surgeries, 2004-2007
2004 (N=138)
2005 (N=192)
2006 (N=177)
2007 (N=189)
Total (N=696)
Combined surgeries No. % No. % No. % No. % No. % No. of patients with corneal transplant surgery combined with another surgical procedure 31 22 27 14 42 24 33 17 133 19 (a) Glaucoma surgery 2 6 3 11 2 5 0 0 7 5 (b) Cataract Extraction 16 52 13 48 22 52 13 39 64 48 (c ) IOL 14 45 10 37 24 57 17 52 65 49 (d) Cataract extraction and IOL 10 32 8 30 16 38 10 30 44 33 (e) Retinal Surgery + Internal Tamponade 1 3 1 4 2 5 4 12 8 6 (f) Anterior vitrectomy 9 29 3 11 5 12 10 30 27 20 (g) Others 5 16 8 30 8 19 16 48 37 28 *Patients may have more than one combined surgery.
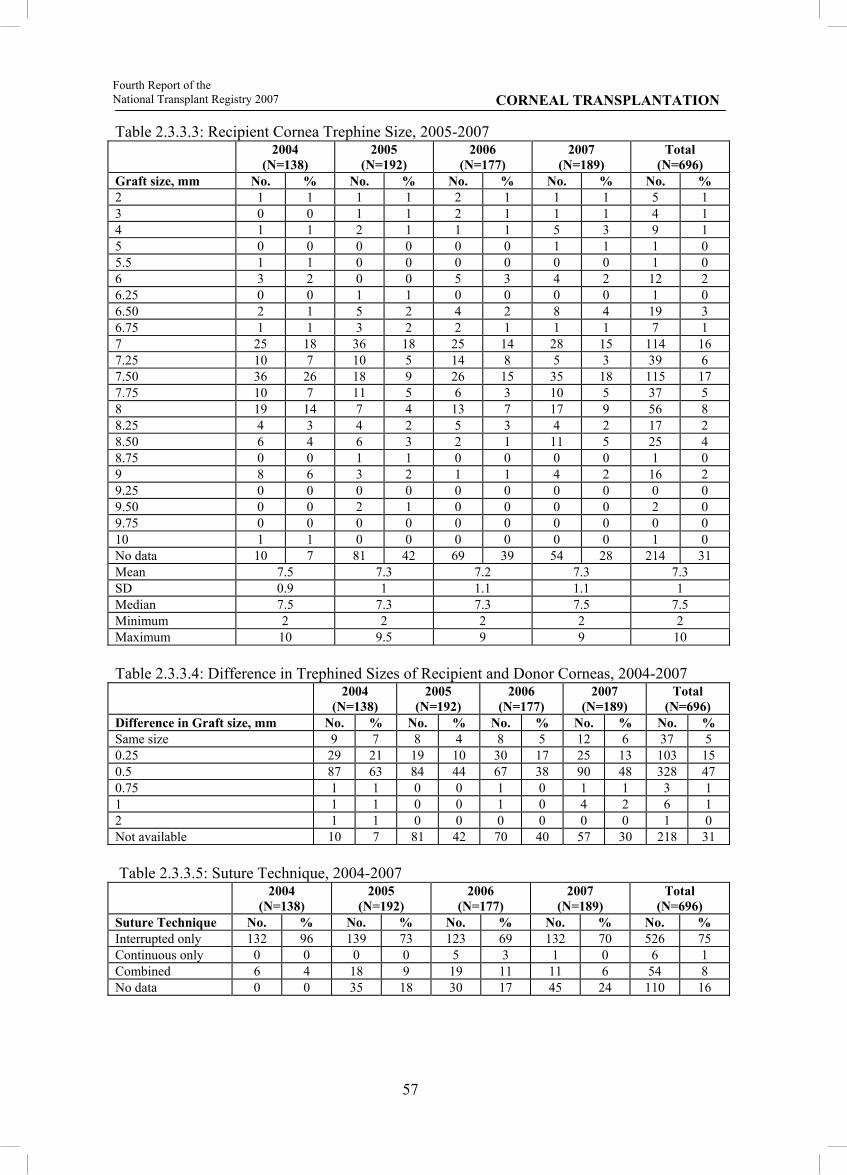
57
CORNEAL TRANSPLANTATION Fourth Report of the National Transplant Registry 2007
Table 2.3.3.3: Recipient Cornea Trephine Size, 2005-2007 2004
(N=138) 2005
(N=192) 2006
(N=177) 2007
(N=189) Total
(N=696) Graft size, mm No. % No. % No. % No. % No. % 2 1 1 1 1 2 1 1 1 5 1 3 0 0 1 1 2 1 1 1 4 1 4 1 1 2 1 1 1 5 3 9 1 5 0 0 0 0 0 0 1 1 1 0 5.5 1 1 0 0 0 0 0 0 1 0 6 3 2 0 0 5 3 4 2 12 2 6.25 0 0 1 1 0 0 0 0 1 0 6.50 2 1 5 2 4 2 8 4 19 3 6.75 1 1 3 2 2 1 1 1 7 1 7 25 18 36 18 25 14 28 15 114 16 7.25 10 7 10 5 14 8 5 3 39 6 7.50 36 26 18 9 26 15 35 18 115 17 7.75 10 7 11 5 6 3 10 5 37 5 8 19 14 7 4 13 7 17 9 56 8 8.25 4 3 4 2 5 3 4 2 17 2 8.50 6 4 6 3 2 1 11 5 25 4 8.75 0 0 1 1 0 0 0 0 1 0 9 8 6 3 2 1 1 4 2 16 2 9.25 0 0 0 0 0 0 0 0 0 0 9.50 0 0 2 1 0 0 0 0 2 0 9.75 0 0 0 0 0 0 0 0 0 0 10 1 1 0 0 0 0 0 0 1 0 No data 10 7 81 42 69 39 54 28 214 31 Mean 7.5 7.3 7.2 7.3 7.3 SD 0.9 1 1.1 1.1 1 Median 7.5 7.3 7.3 7.5 7.5 Minimum 2 2 2 2 2 Maximum 10 9.5 9 9 10 Table 2.3.3.4: Difference in Trephined Sizes of Recipient and Donor Corneas, 2004-2007 2004
(N=138) 2005
(N=192) 2006
(N=177) 2007
(N=189) Total
(N=696) Difference in Graft size, mm No. % No. % No. % No. % No. % Same size 9 7 8 4 8 5 12 6 37 5 0.25 29 21 19 10 30 17 25 13 103 15 0.5 87 63 84 44 67 38 90 48 328 47 0.75 1 1 0 0 1 0 1 1 3 1 1 1 1 0 0 1 0 4 2 6 1 2 1 1 0 0 0 0 0 0 1 0 Not available 10 7 81 42 70 40 57 30 218 31 Table 2.3.3.5: Suture Technique, 2004-2007
2004 (N=138)
2005 (N=192)
2006 (N=177)
2007 (N=189)
Total (N=696)
Suture Technique No. % No. % No. % No. % No. % Interrupted only 132 96 139 73 123 69 132 70 526 75 Continuous only 0 0 0 0 5 3 1 0 6 1 Combined 6 4 18 9 19 11 11 6 54 8 No data 0 0 35 18 30 17 45 24 110 16

58
CORNEAL TRANSPLANTATION Fourth Report of the
National Transplant Registry 2007
2.4 CORNEAL TRANSPLANT OUTCOME 2004-2007 Table 2.4.1: Stock and Flow - Graft status (whole database) Optical Non optical Total No. % No. % No. % Number registered 528 71 214 29 742 100 Number followed Total 258 120 378 1 year 174 67 101 84 275 73 2 year 58 23 14 12 72 19 3 year 23 9 3 2 26 7 4 year 3 1 2 2 5 1 Graft status Total 258 120 378 -Surviving graft 215 83 69 58 284 75 -Failed graft 43 17 51 42 94 25 Recipient status Total 528 214 742 -Recipient with complete follow up 70 13 56 26 126 17 -Recipient deaths 3 1 1 1 4 1 -Recipient loss – followed 185 35 63 29 248 33 -Recipient loss – not followed 145 27 47 22 192 26 -Graft not yet followed (Transplant duration less than 1 year) 125 24 47 22 172 23
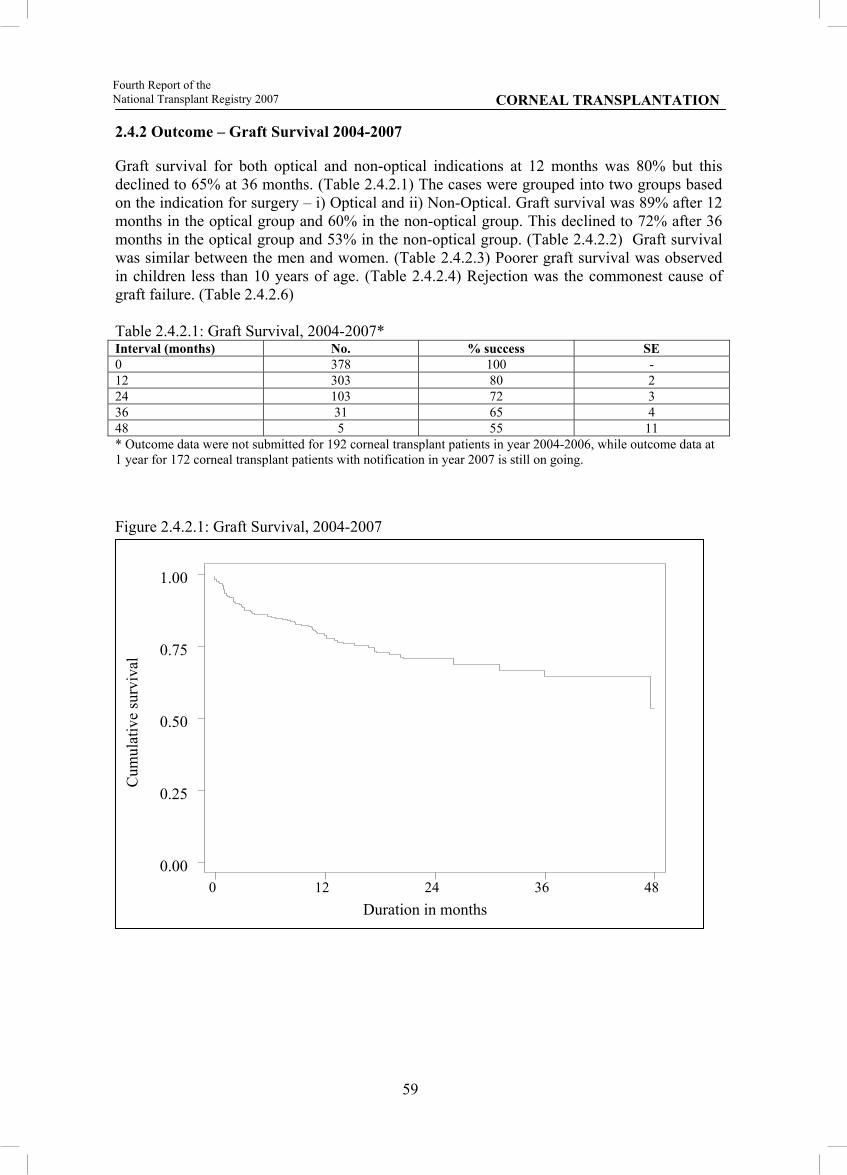
59
CORNEAL TRANSPLANTATION Fourth Report of the National Transplant Registry 2007
2.4.2 Outcome – Graft Survival 2004-2007
Graft survival for both optical and non-optical indications at 12 months was 80% but this declined to 65% at 36 months. (Table 2.4.2.1) The cases were grouped into two groups based on the indication for surgery – i) Optical and ii) Non-Optical. Graft survival was 89% after 12 months in the optical group and 60% in the non-optical group. This declined to 72% after 36 months in the optical group and 53% in the non-optical group. (Table 2.4.2.2) Graft survival was similar between the men and women. (Table 2.4.2.3) Poorer graft survival was observed in children less than 10 years of age. (Table 2.4.2.4) Rejection was the commonest cause of graft failure. (Table 2.4.2.6) Table 2.4.2.1: Graft Survival, 2004-2007* Interval (months) No. % success SE 0 378 100 - 12 303 80 2 24 103 72 3 36 31 65 4 48 5 55 11 * Outcome data were not submitted for 192 corneal transplant patients in year 2004-2006, while outcome data at 1 year for 172 corneal transplant patients with notification in year 2007 is still on going.
Figure 2.4.2.1: Graft Survival, 2004-2007
Cum
ulat
ive
surv
ival
Duration in months0 12 24 36 48
0.00
0.25
0.50
0.75
1.00
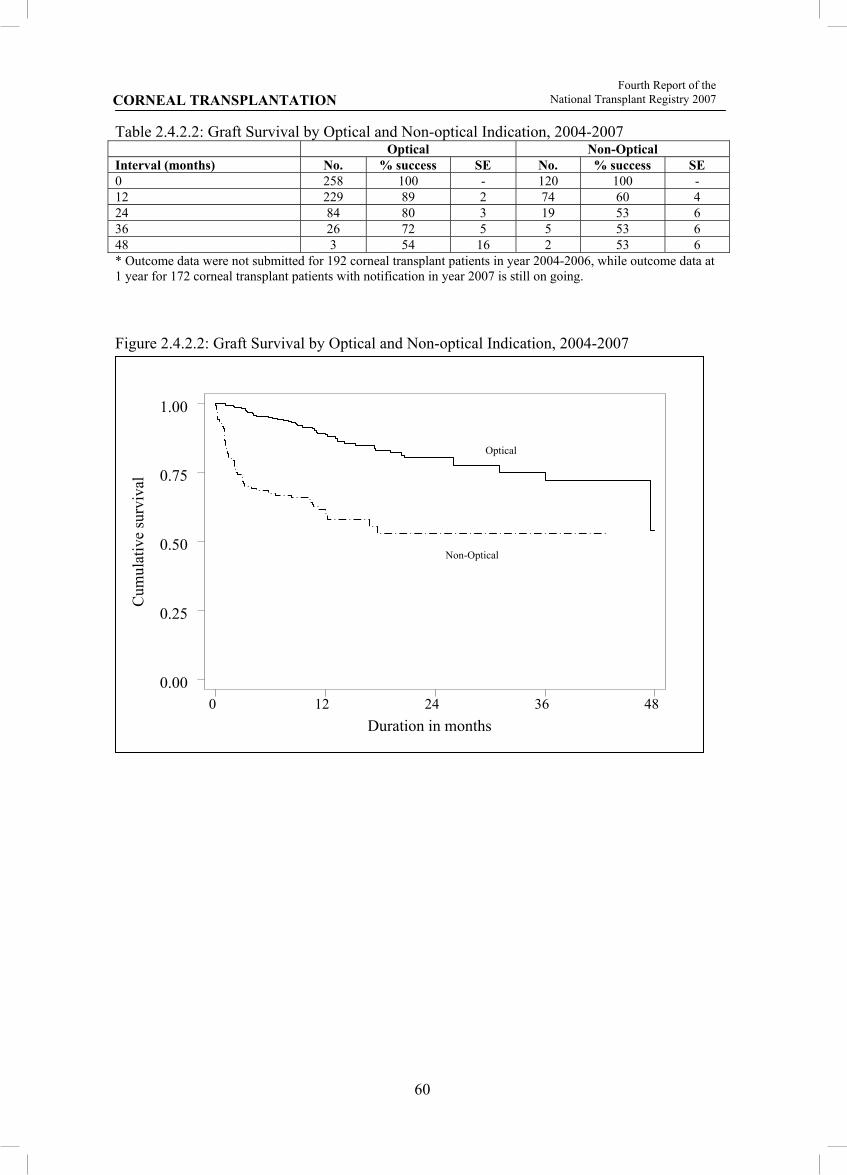
60
CORNEAL TRANSPLANTATION Fourth Report of the
National Transplant Registry 2007
Table 2.4.2.2: Graft Survival by Optical and Non-optical Indication, 2004-2007 Optical Non-Optical Interval (months) No. % success SE No. % success SE 0 258 100 - 120 100 - 12 229 89 2 74 60 4 24 84 80 3 19 53 6 36 26 72 5 5 53 6 48 3 54 16 2 53 6 * Outcome data were not submitted for 192 corneal transplant patients in year 2004-2006, while outcome data at 1 year for 172 corneal transplant patients with notification in year 2007 is still on going.
Figure 2.4.2.2: Graft Survival by Optical and Non-optical Indication, 2004-2007
Cum
ulat
ive
surv
ival
Duration in months0 12 24 36 48
0.00
0.25
0.50
0.75
1.00
Optical
Non-Optical

61
CORNEAL TRANSPLANTATION Fourth Report of the National Transplant Registry 2007
Table 2.4.2.3 Graft Success by Gender, 2004-2007 Male Female Interval (months) No. % success SE No. % success SE 0 237 100 - 141 100 - 12 189 79 3 114 80 3 24 56 71 4 47 73 4 36 20 65 5 11 66 7 48 5 65 5 - -. - * Outcome data were not submitted for 192 corneal transplant patients in year 2004-2006, while outcome data at 1 year for 172 corneal transplant patients with notification in year 2007 is still on going.
Figure 2.4.2.3 Graft Success by Gender, 2004-2007
Cum
ulat
ive
surv
ival
Duration in months
0 12 24 36 480.00
0.25
0.50
0.75
1.00
Male
Female
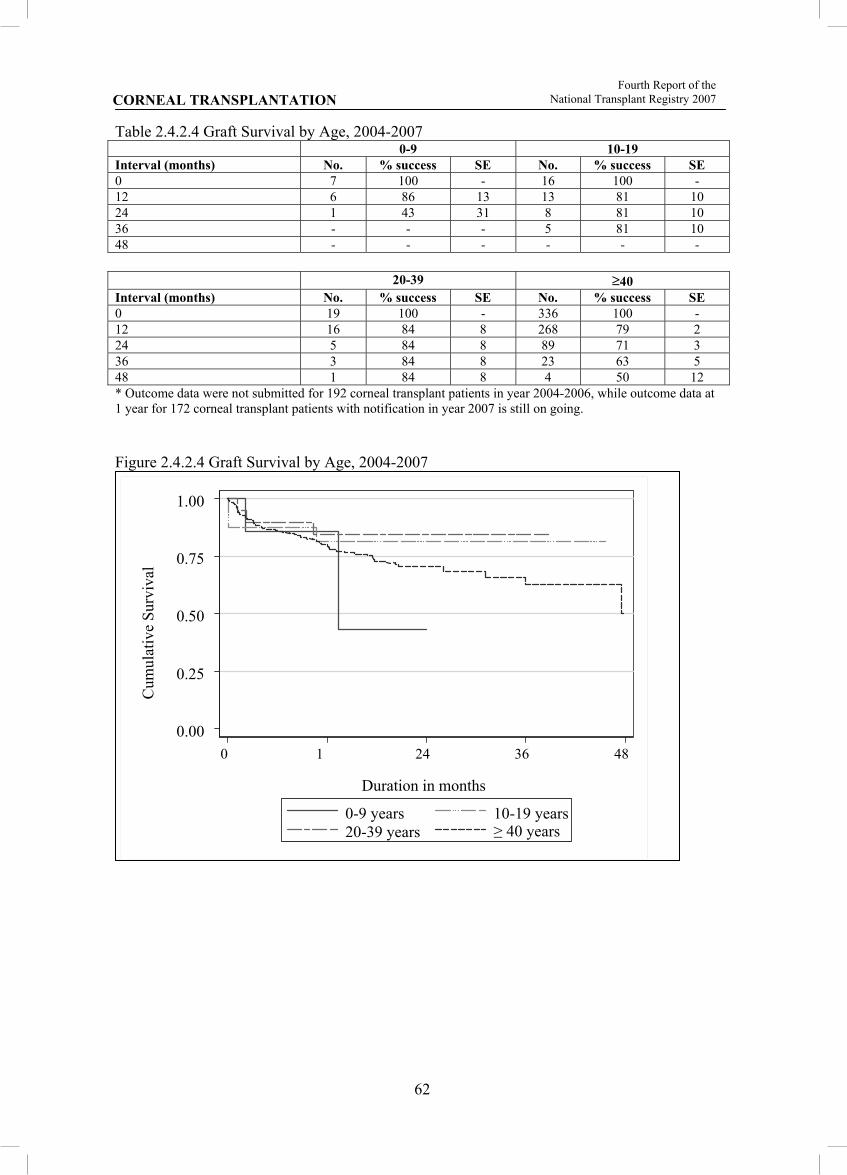
62
CORNEAL TRANSPLANTATION Fourth Report of the
National Transplant Registry 2007
Table 2.4.2.4 Graft Survival by Age, 2004-2007 0-9 10-19 Interval (months) No. % success SE No. % success SE 0 7 100 - 16 100 - 12 6 86 13 13 81 10 24 1 43 31 8 81 10 36 - - - 5 81 10 48 - - - - - - 20-39 ≥40 Interval (months) No. % success SE No. % success SE 0 19 100 - 336 100 - 12 16 84 8 268 79 2 24 5 84 8 89 71 3 36 3 84 8 23 63 5 48 1 84 8 4 50 12 * Outcome data were not submitted for 192 corneal transplant patients in year 2004-2006, while outcome data at 1 year for 172 corneal transplant patients with notification in year 2007 is still on going.
Figure 2.4.2.4 Graft Survival by Age, 2004-2007
0.00
0.25
0.50
0.75
1.00
0 1 24 36 48
Duration in months
0-9 years 10-19 years20-39 years
Cum
ulat
ive
Surv
ival
≥ 40 years

63
CORNEAL TRANSPLANTATION Fourth Report of the National Transplant Registry 2007
Table 2.4.2.5: Causes of Graft Failure Total
(N=94) No. %
Graft Failure 94 25 Cause of Failure
Primary graft failure or Primary Endothelial decompensation 16 17 Recurrence of primary disease 6 6 Late Endothelial decompensation 19 20 Glaucoma 13 14 Infection 18 19 Graft rejection 22 23 Others 25 27 No data 8 9
*Each Patient may have more than one cause of graft failure. 56 patients have 1 cause 28 patients have 2 causes 1 patient has 3 causes 1 patient has 4 causes

64
CORNEAL TRANSPLANTATION Fourth Report of the
National Transplant Registry 2007
2.4.3 Visual Outcome Visual outcome of corneal transplants was analysed in cases where post cornea transplant unaided vision was available as data on post corneal transplant best corrected vision was only available in a limited number of the cases. (Table 2.4.3.1) Forty seven percent of both optical and non-optical cases had improved unaided vision after surgery. (Table 2.4.3.2) Majority of surviving optical grafts had an unaided vision of 6/24-6/60, whereas the majority in the non optical group had an unaided vision of less than 6/60. (Table2.4.3.3) (Figure 2.4.3.3) Table 2.4.3.1: Availability of Data on Post Corneal Transplant Unaided Vision
Unaided Vision (N =742)
No. % Data available 326 44 Lost to follow up 306 41 No data 110 15
Table 2.4.3.2 Unaided Visual Outcome After Cornea Transplant Surgery
Reason for graft Optical (228)
Non-optical (98)
No. % No. % Vision better 107 47 46 47
Vision same 40 17 25 26
Vision worse 27 12 20 20 Not known* 54 24 7 7 * Either pre op vision and/or post op vision is not available
Figure 2.4.3.2 Unaided Visual Outcome After Corneal Transplant Surgery
Perc
enta
ge (%
)
Vision
0
10
20
30
40
50
60 Optical Non-optical
Vision Better Vision same Vision worse Not known

65
CORNEAL TRANSPLANTATION Fourth Report of the National Transplant Registry 2007
Table 2.4.3.3 Unaided Vision for Optical and Non Optical Cases Optical Non Optical
Vision Graft Survival (192)
Graft Failure (36)
Graft Survival (58)
Graft Failure (40)
n % n % n % n % 6/18 or Better 52 27 0 0 9 15 1 3 6/24 – 6/60 79 41 0 0 21 36 1 3
Less than 6/60 59 31 36 100 27 47 38 94 Data not available 2 1 0 0 1 2 0 0
Figure 2.4.3.3 Cumulative Probability for Unaided Vision in Grafts
0.2
0.4
0.6
0.8
1
Cum
ulat
ive
Prob
abili
ty
6/6 6/9
6/12 6/18
6/24 6/36
6/60 5/60
4/60 3/60
2/60 1/60
CF HM
PL NPL
Unaided Visionoptical non optical

66
CORNEAL TRANSPLANTATION Fourth Report of the
National Transplant Registry 2007
2.5 POST CORNEA TRANSPLANT COMPLICATIONS The commonest complications observed at one year were post-keratoplasty glaucoma, graft vascularisation, epithelial problems and graft rejection. Rejection was seen in 15%. (Table 2.5.1) Endothelial rejection is the commonest graft rejection. (Table 2.5.2) Table 2.5.1: Post Transplant Complications
One year outcome (N=275)
2nd year outcome (N=72)
3rd year outcome (N=26)
4th year outcome
(N=5)
Total (N=378)
No. % No. % No. % No. % No. % Any complications 157 54 24 8 243
Complication
Epithelial Problem 28 18 4 7 2 8 1 13 35 14 Wound Dehiscence 2 1 0 0 0 0 0 0 2 1 Suture infiltration / abscess 15 10 3 6 2 8 0 0 20 8 Endophthalmitis 1 1 1 2 0 0 0 0 2 1 Microbial keratitis 17 11 2 4 0 0 0 0 19 8 Vascularisation 28 18 4 7 0 0 0 0 32 13 Post-keratoplasty glaucoma 28 18 9 17 3 13 1 13 41 17 Graft Rejection 26 17 5 9 0 0 0 0 31 13 No data 62 39 32 59 17 71 6 75 117 48
* Each patient may have more than one complication Table 2.5.2: Post Transplant Graft Rejection Types
One year outcome (N=275)
2nd year outcome (N=72)
3rd year outcome (N=26)
4th year outcome
(N=5)
Total (N = 378)
No. % No. % No. % No. % No. % Graft Rejection 26 5 0 0 31
Types
Epithelial 10 38 2 40 0 0 0 0 12 39 Stromal 6 23 0 0 0 0 0 0 6 19 Endothelial 11 42 3 60 0 0 0 0 14 45 No data 4 15 0 0 0 0 0 0 4 13
* Each patient may have more than one type of rejection

CHAPTER 3
HEART AND LUNG TRANSPLANTATION
Editors: Mr Mohamed Ezani Md. Taib
Dato’ Dr David Chew Soon Ping Dr Ashari Yunus
Expert Panel: Tan Sri Dato’ Dr Yahya Awang (Chair) Mr Mohamed Ezani Md. Taib (Co-chair)
Datin Dr Aziah Ahmad Mahayuddin Dr Aizai Azan Abdul Rahim
Dr Ashari Yunus Dato’ Dr David Chew Soon Ping
Dr Hamidah Shaban
Contents
3.0 Introduction
3.1 Stock and Flow
3.2 Recipients’ Characteristics Demographics and Clinical Status
Primary Diagnosis
3.3 Transplant Practices Type of Transplant
Immunosuppressive Therapy and Other Medications Duration of Waiting Time on the Waiting List
3.4 Transplant Outcomes
Post Transplant Complications Patient Survival Causes of Death

68
HEART AND LUNG TRANSPLANTATION Fourth Report of the
National Transplant Registry 2007
List of Tables Table 3.1.1a: Stock and Flow of Heart Transplantation, 1997-2007 ............................. 70 Table 3.2.1a: Distribution of Patients by Gender, 1997-2007 ....................................... 71 Table 3.2.2a: Distribution of Patients by Ethnic Group, 1997-2007 ............................. 71 Table 3.2.3a: Distribution of Patients by Age, 1997-2007 ............................................ 71 Table 3.2.4a: Distribution of Patients by Primary Diagnosis, 1997-2007 ..................... 71 Table 3.3.1a: Distribution of Patients by Heart Procedure, 1997-2007 ......................... 72 Table 3.3.2: Distribution of Patients by Immunosuppressive Used, 1997-2007 ........... 72 Table 3.3.3a: Immunosuppressive Used at Time of Last Follow-up up to 2007 ........... 72 Table 3.3.4: Duration of Waiting Time on Waiting List, 1997-2007 ............................ 73 Table 3.4.1: Post Transplant Events at Last Follow-up up to 2007 ............................... 74 Table 3.4.2: Post Transplant Malignancies at Follow-up up to 2007 ............................ 74 Table 3.4.3: Non-compliance at Follow-up up to 2007 ................................................. 75 Table 3.4.4: Patient Treated for Rejection at Follow-up up to 2007 ............................. 75 Table 3.4.5a: Distribution of Patients by Time of Death, 1997-2007 ............................ 75 Table 3.4.6: Patient Survival, 1997-2007....................................................................... 76 Table 3.4.7: Cause of Death at Discharge, 1997-2007 .................................................. 77 Table 3.4.8: Cause of Death at Follow-up, 1997-2007 .................................................. 77 Table 3.1.1b: Stock and Flow of Lung Transplantation, 2005-2007………..………....78 Table 3.2.1b : Distribution of Patients by Gender, 2005-2007 .…...…………………..79 Table 3.2.2b : Distribution of Patients by Ethnic Group, 2005-2007…...…………….79 Table 3.2.3b : Distribution of Patients by Age, 2005-2007………….………………...79 Table 3.2.4b: Distribution of Patients by Primary Diagnosis, 2005 -2007………….....79 Table 3.3.1b: Distribution of Patients by Lung Procedure, 2005-2007………………..80 Table 3.3.3b : Immunosuppressive Used at Time Follow-up to 2007….……………...80 Table 3.4.5b: Distribution of patients by time of deaths, 2005-2007………………….81
List of Figures Figure 3.1.1a: Stock and Flow of Heart Transplantation, 1997-2007 ............................ 70 Figure 3.4.6: Patient Survival, 1997-2007…………………………………………. …76 Figure 3.1.1b: Stock and Flow of Lung Transplantation, 2005-2007………………….78

69
Fourth Report of the National Transplant Registry 2007 HEART AND LUNG TRANSPLANTATION
3.0 INTRODUCTION The first heart transplant in Malaysia was carried out at Institut Jantung Negara (IJN) Kuala Lumpur in December 1997. The first lung transplant was carried out in December 2005 at IJN in collaboration with Institut Perubatan Respiratori (IPR) of the Ministry of Health. The main limitation to the performance of heart and lung transplants has been the lack of success in obtaining viable donor organs. As a result of the infrequent performance of transplant, the results of transplant would not be expected to improve. In 2007, the first heart lung transplant was carried out in November 2007. There were 2 heart transplants carried out on the same recipient whose 1st heart transplant failed, but fortunately, there was a second compatible donor organ within 24 hours and the 2nd heart transplant succeeded. 1 double lung transplant was carried out as well. The rest of the report that follows will review the results of heart and lung transplantation in Malaysia till end of 2007.

70
HEART AND LUNG TRANSPLANTATION Fourth Report of the
National Transplant Registry 2007
HEART TRANSPLANTATION 3.1 STOCK AND FLOW Table 3.1.1a: Stock and Flow of Heart Transplantation, 1997-2007 Year 1997 1998 1999 2000 2001 2002 2003 2004 2005 2006 2007 New transplant patients 1 3 2 3 4 0 2 0 1 1 1 Deaths 0 1 0 3 1 3 1 0 0 1 0 Retransplanted 0 0 0 0 0 0 0 0 0 0 1 Lost to follow up 0 0 0 0 0 0 0 0 0 0 0 Alive at 31st December 1 3 5 5 8 5 6 6 7 7 8 Note: The same patient was re-transplanted in the year 2007, thus only counted as one. Figure 3.1.1a: Stock and Flow of Heart Transplantation, 1997-2007
Num
ber o
f pat
ient
s
Year
0
1
2
3
4
5
6
7
8 New transplant patients Alive at 31st December
1997 1998 1999 2000 2001 2002 2003 2004 2005 2006 2007

71
Fourth Report of the National Transplant Registry 2007 HEART AND LUNG TRANSPLANTATION
3.2 RECIPIENTS’ CHARACTERISTICS Table 3.2.1a: Distribution of Patients by Gender, 1997-2007 Year 1997 1998 1999 2000 2001 2002 2003 2004 2005 2006 2007 TOTAL Gender No. No. No. No. No. No. No. No. No. No. No. No. Male 1 3 0 2 2 0 2 0 1 1 0 12 Female 0 0 2 1 2 0 0 0 0 0 1 6 TOTAL 1 3 2 3 4 0 2 0 1 1 1 18 Note: The same patient was re-transplanted in the year 2007, thus only counted as one. Table 3.2.2a: Distribution of Patients by Ethnic Group, 1997-2007 Year 1997 1998 1999 2000 2001 2002 2003 2004 2005 2006 2007 TOTAL Ethnicgroup
No. No. No. No. No. No. No. No. No. No. No. No.
Malay 0 0 1 1 2 0 0 0 1 0 0 5 Chinese 0 0 0 1 0 0 1 0 0 0 1 3 Indian 1 3 1 1 2 0 1 0 0 1 0 10 TOTAL 1 3 2 3 4 0 2 0 1 1 1 18 Note: The same patient was re-transplanted in the year 2007, thus only counted as one. Table 3.2.3a: Distribution of Patients by Age, 1997-2007 Year 1997 1998 1999 2000 2001 2002 2003 2004 2005 2006 2007 TOTAL Age, years
No. No. No. No. No. No. No. No. No. No. No. No.
0-19 0 0 2 1 1 0 0 0 1 0 1 6 20-39 0 2 0 0 0 0 0 0 0 0 0 2 40-59 1 1 0 2 3 0 2 0 0 1 0 10 ≥60 0 0 0 0 0 0 0 0 0 0 0 0 TOTAL 1 3 2 3 4 0 2 0 1 1 1 18 Mean 51 40 16 37 38 - 46 - 15 44 15 35 SD - 9 1 22 17 - 8 - - - 0 16 Median 51 37 16 44 43 - 46 - 15 44 15 40 Minimum 51 33 15 13 14 - 40 - 15 44 15 13 Maximum 51 50 16 55 54 - 52 - 15 44 15 55 Age=date of transplant-date of birth Note: The same patient was re-transplanted in the year 2007, thus only counted as one. Age for 2007 patient was same for 1st and 2nd transplant Table 3.2.4a: Distribution of Patients by Primary Diagnosis, 1997-2007 Year 97 98 99 00 01 02 03 04 05 06 07 TOTAL Primary diagnosis No. No. No. No. No. No. No. No. No. No. No. No. Ischaemic Cardiomyopathy 1 3 0 1 1 0 2 0 0 1 0 9 Idiopathic Dilated Cardiomyopathy 0 0 2 1 2 0 0 0 1 0 0 6 Restrictive Cardiomyopathy 0 0 0 0 0 0 0 0 0 0 0 0 End Stage Valvular Heart Disease 0 0 0 0 1 0 0 0 0 0 0 1 Hypertrophic Cardiomyopathy 0 0 0 1 0 0 0 0 0 0 0 1 Others 0 0 0 0 0 0 0 0 0 0 1 1 TOTAL 1 3 2 3 4 0 2 0 1 1 1 18 Note: The same patient was re-transplanted in the year 2007, thus only counted as one.
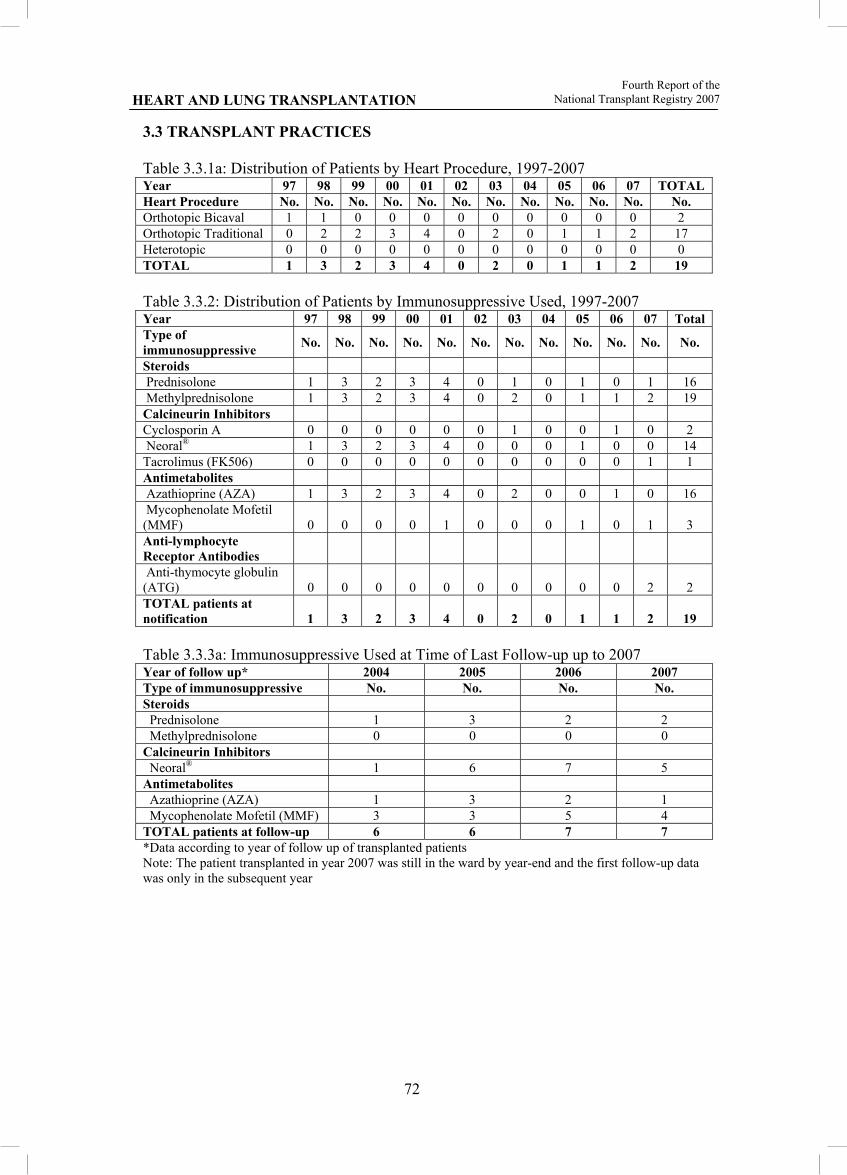
72
HEART AND LUNG TRANSPLANTATION Fourth Report of the
National Transplant Registry 2007
3.3 TRANSPLANT PRACTICES Table 3.3.1a: Distribution of Patients by Heart Procedure, 1997-2007 Year 97 98 99 00 01 02 03 04 05 06 07 TOTAL Heart Procedure No. No. No. No. No. No. No. No. No. No. No. No. Orthotopic Bicaval 1 1 0 0 0 0 0 0 0 0 0 2 Orthotopic Traditional 0 2 2 3 4 0 2 0 1 1 2 17 Heterotopic 0 0 0 0 0 0 0 0 0 0 0 0 TOTAL 1 3 2 3 4 0 2 0 1 1 2 19 Table 3.3.2: Distribution of Patients by Immunosuppressive Used, 1997-2007 Year 97 98 99 00 01 02 03 04 05 06 07 Total Type of immunosuppressive No. No. No. No. No. No. No. No. No. No. No. No.
Steroids Prednisolone 1 3 2 3 4 0 1 0 1 0 1 16 Methylprednisolone 1 3 2 3 4 0 2 0 1 1 2 19 Calcineurin Inhibitors Cyclosporin A 0 0 0 0 0 0 1 0 0 1 0 2 Neoral® 1 3 2 3 4 0 0 0 1 0 0 14 Tacrolimus (FK506) 0 0 0 0 0 0 0 0 0 0 1 1 Antimetabolites Azathioprine (AZA) 1 3 2 3 4 0 2 0 0 1 0 16 Mycophenolate Mofetil (MMF) 0 0 0 0 1 0 0 0 1 0 1 3 Anti-lymphocyte Receptor Antibodies Anti-thymocyte globulin (ATG) 0 0 0 0 0 0 0 0 0 0 2 2 TOTAL patients at notification 1 3 2 3 4 0 2 0 1 1 2 19 Table 3.3.3a: Immunosuppressive Used at Time of Last Follow-up up to 2007 Year of follow up* 2004 2005 2006 2007 Type of immunosuppressive No. No. No. No. Steroids Prednisolone 1 3 2 2 Methylprednisolone 0 0 0 0 Calcineurin Inhibitors Neoral® 1 6 7 5 Antimetabolites Azathioprine (AZA) 1 3 2 1 Mycophenolate Mofetil (MMF) 3 3 5 4 TOTAL patients at follow-up 6 6 7 7 *Data according to year of follow up of transplanted patients Note: The patient transplanted in year 2007 was still in the ward by year-end and the first follow-up data was only in the subsequent year
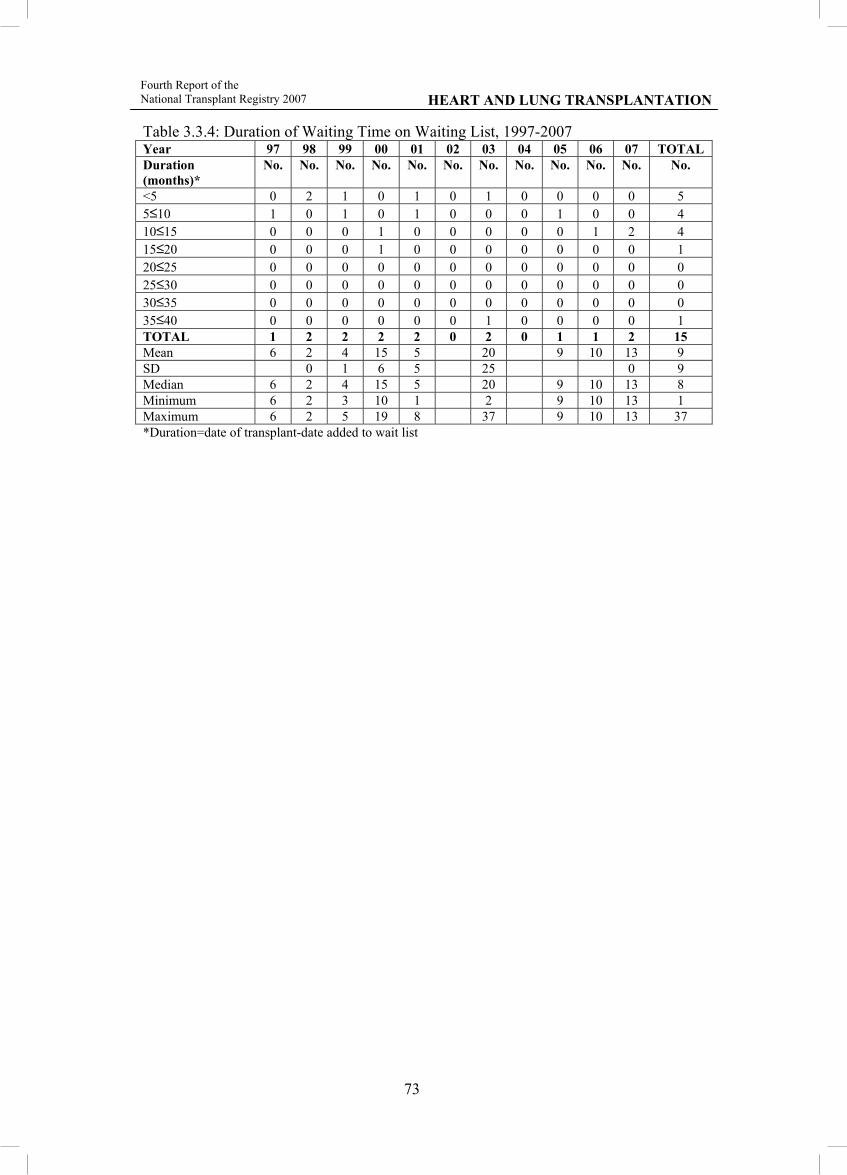
73
Fourth Report of the National Transplant Registry 2007 HEART AND LUNG TRANSPLANTATION
Table 3.3.4: Duration of Waiting Time on Waiting List, 1997-2007 Year 97 98 99 00 01 02 03 04 05 06 07 TOTAL Duration (months)*
No. No. No. No. No. No. No. No. No. No. No. No.
<5 0 2 1 0 1 0 1 0 0 0 0 5 5≤10 1 0 1 0 1 0 0 0 1 0 0 4 10≤15 0 0 0 1 0 0 0 0 0 1 2 4 15≤20 0 0 0 1 0 0 0 0 0 0 0 1 20≤25 0 0 0 0 0 0 0 0 0 0 0 0 25≤30 0 0 0 0 0 0 0 0 0 0 0 0 30≤35 0 0 0 0 0 0 0 0 0 0 0 0 35≤40 0 0 0 0 0 0 1 0 0 0 0 1 TOTAL 1 2 2 2 2 0 2 0 1 1 2 15 Mean 6 2 4 15 5 20 9 10 13 9 SD 0 1 6 5 25 0 9 Median 6 2 4 15 5 20 9 10 13 8 Minimum 6 2 3 10 1 2 9 10 13 1 Maximum 6 2 5 19 8 37 9 10 13 37 *Duration=date of transplant-date added to wait list

74
HEART AND LUNG TRANSPLANTATION Fourth Report of the
National Transplant Registry 2007
3.4 TRANSPLANT OUTCOMES Table 3.4.1: Post Transplant Events at Last Follow-up up to 2007 Year of transplant* 97 98 99 00 01 02 03 04 05 06 07 TOTAL Type of post transplant events
No. No. No. No. No. No. No. No. No. No. No. No.
Drug Treated Hypertension 1 2 2 1 3 0 1 0 0 0 0 10 Bone Disease (Symptomatic) 1 0 0 0 1 0 0 0 0 0 0 2 Chronic Liver Disease 0 0 0 0 0 0 0 0 0 0 0 0 Cataracts 0 0 0 0 0 0 0 0 0 0 0 0 Diabetes 1 2 0 0 0 0 1 0 0 0 0 4 Renal Dysfunction 1 1 0 0 1 0 0 0 0 0 0 3 Stroke 0 0 0 0 0 0 0 0 0 0 0 0 Drug-Treated Hyperlipidaemia 1 2 2 1 3 0 1 0 1 0 0 11 TOTAL patients at follow-up 1 2 2 1 3 0 1 0 1 0 0 11 *Data according to year of transplant of patient Table 3.4.2: Post Transplant Malignancies at Follow-up up to 2007 Year of transplant* 97 98 99 00 01 02 03 04 05 06 07 TOTAL Type of post transplant malignancies
No. No. No. No. No. No. No. No. No. No. No. No.
Recurrence of pre-transplant tumour 0 0 0 0 0 0 0 0 0 0 0 0 De Novo solid tumour 1 0 0 0 0 0 0 0 0 0 0 1 De Novo lymphoproliferative disorder 0 0 0 0 0 0 0 0 0 0 0 0 Skin 0 0 0 0 0 0 0 0 0 0 0 0 TOTAL patients at follow-up 1 2 2 1 3 0 1 0 1 0 0 11 *Data according to year of transplant of patient

75
Fourth Report of the National Transplant Registry 2007 HEART AND LUNG TRANSPLANTATION
Table 3.4.3: Non-compliance at Follow-up up to 2007 Year of transplant* 97 98 99 00 01 02 03 04 05 06 07 TOTAL Non-compliance during follow-up
No. No. No. No. No. No. No. No. No. No. No. No.
Yes 0 0 2 0 0 0 1 0 0 0 0 3 No 1 2 0 1 3 0 0 0 1 0 0 8
TOTAL patients at follow-up 1 2 2 1 3 0 1 0 1 0 0 11 Areas of non-compliance:
Immunosuppression medication 0 0 1 0 0 0 1 0 0 0 0 2 Patient unable to afford immunosuppression medications 0 0 0 0 0 0 0 0 0 0 0 0 Other medication 0 0 0 0 0 0 0 0 0 0 0 0 Other therapeutic regimen 0 0 1 0 0 0 0 0 0 0 0 1
TOTAL patients with noncompliance 0 0 2 0 0 0 1 0 0 0 0 3 *Data according to year of transplant of patient Table 3.4.4: Patient Treated for Rejection at Follow-up up to 2007 Year of transplant* 97 98 99 00 01 02 03 04 05 06 07 TOTAL Patient treated for rejection
No. No. No. No. No. No. No. No. No. No. No. No.
Yes 0 2 1 0 1 0 0 0 0 0 0 4 No 1 0 1 1 2 0 1 0 1 0 0 7
TOTAL patients at follow-up 1 2 2 1 3 0 1 0 1 0 0 11 Number of rejection events
1 0 1 0 0 1 0 0 0 0 0 0 2 2 0 1 0 0 0 0 0 0 0 0 0 1 3 0 0 1 0 0 0 0 0 0 0 0 1
TOTAL patients with rejection 0 2 1 0 1 0 0 0 0 0 0 4 *Data according to year of transplant of patient Table 3.4.5a: Distribution of Patients by Time of Death, 1997-2007 Year of discharge 97 98 99 00 01 02 03 04 05 06 07 TOTAL Time of deaths* No. No. No. No. No. No. No. No. No. No. No. No. <3 months (at discharge) 0 1 0 2 0 1 1 0 0 1 0 6 3-<6 months 0 0 0 0 0 0 0 0 0 0 0 06 months-1 year 0 0 0 0 0 1 0 0 0 0 0 1 >1 year 0 0 0 1 1 1 0 0 0 0 0 3 TOTAL patients who died 0 1 0 3 1 3 1 0 0 1 0 10
*Time=Date of death–date of transplant

76
HEART AND LUNG TRANSPLANTATION Fourth Report of the
National Transplant Registry 2007
Table 3.4.6: Patient Survival, 1997-2007 Year of Transplant 1997-2007 Interval % Survival SE 6 months 68 11 1 year 63 11 2 year 50 12 3 year 44 12 4 year 44 125 year 44 126 year 44 127 year 44 128 year 44 129 year 44 1210 year 44 12SE=standard error Duration = date follow up-date transplant, if alive at discharge = date of discharge-date of transplant, if alive but lost to follow up = date of discharge-date of transplant, if dead at discharge Figure 3.4.6: Patient Survival, 1997-2007
Cum
ulat
ive
surv
ival
Duration in years 0 .5 1 2 3 4 5 6 7 8 9 10
0.00
0.25
0.50
0.75
1.00

77
Fourth Report of the National Transplant Registry 2007 HEART AND LUNG TRANSPLANTATION
Table 3.4.7: Cause of Death at Discharge, 1997-2007 Year 97 98 99 00 01 02 03 04 05 06 07 TOTAL Cause of death No. No. No. No. No. No. No. No. No. No. No. No. Hyperacute rejection 0 0 0 0 0 0 1 0 0 0 0 1 Multi organ failure 0 0 0 1 0 0 0 0 0 0 0 1 Respiratory failure secondary to septicaemia
0 0 0 0 0 1 0 0 0 0 0 1
Respiratory failure, renal function and liver failure, ARDS, septicaemia
0 0 0 1 0 0 0 0 0 0 0 1
Septicaemia, multiorgan failure 0 1 0 0 0 0 0 0 0 0 0 1
Graft failure 0 0 0 0 0 0 0 0 0 1 0 1 TOTAL patients who died at discharge 0 1 0 2 0 1 1 0 0 0 0 6
Table 3.4.8: Cause of Death at Follow-up, 1997-2007 Year 97 98 99 00 01 02 03 04 05 06 07 TOTAL Cause of death No. No. No. No. No. No. No. No. No. No. No. No. Severe bleeding 0 0 0 0 0 1 0 0 0 0 0 1 Lung cancer, small cell type, septicaemia, bronchopneumonia
0 0 0 1 0 0 0 0 0 0 0 1
Rejection due to non-compliance 0 0 0 0 1 0 0 0 0 0 0 1
Unknown 0 0 0 0 0 1 0 0 0 0 0 1 TOTAL patients who died at follow-up 0 0 0 1 1 2 0 0 0 0 0 4

78
HEART AND LUNG TRANSPLANTATION Fourth Report of the
National Transplant Registry 2007
LUNG TRANSPLANTATION & HEART-LUNG TRANSPLANTATION 3.1 STOCK AND FLOW Table 3.1.1b: Stock and Flow of Lung Transplantation, 2005-2007 Year 2005 2006 2007 New transplant patients 1 1 2 Deaths 0 1 1 Retransplanted 0 0 0 Lost to follow up 0 0 0 Alive at 31st December 1 1 2 Figure 3.1.1b: Stock and Flow of Lung Transplant and Heart Lung Transplant

79
Fourth Report of the National Transplant Registry 2007 HEART AND LUNG TRANSPLANTATION
3.2 RECIPIENTS’ CHARACTERISTICS Table3.2.1b: Distribution of Patients by Gender, 2005-2007 Year 2005 2006 2007 Gender No. No. No. Male 1 1 1 Female 0 0 1 TOTAL 1 1 2 Table3.2.2b: Distribution of Patients by Ethnic Group, 2005-2007 Year 2005 2006 2007 Race No. No. No. Malay 0 0 1 Chinese 0 0 0 Indian 1 1 0 Iban 0 0 1 TOTAL 1 1 2 Table 3.2.3b: Distribution of Patients by Age, 2005-2007 Year 2005 2006 2007 Age (years) No. No. No. 0-19 0 0 1 20-39 0 1 1 40-59 1 0 0 ≥ 60 0 0 0 TOTAL 1 1 2 Table 3.2.4b: Distribution of Patients by Primary Diagnosis, 2005 -2007 Year 2005 2006 2007 Diagnosis No. No. No. Idiopathic pulmonary fibrosis 1 1 1 Idiopathic pulmonary arterial hypertension 0 0 1 Chronic obstructive pulmonary disease 0 0 0 TOTAL 1 1 2

80
HEART AND LUNG TRANSPLANTATION Fourth Report of the
National Transplant Registry 2007
3.3 TRANSPLANT PRACTICES Table 3.3.1b: Distribution of Patients by Lung Procedure, 2005-2007 Year 2005 2006 2007 Procedure No. No. No. Single Lung Transplant 1 0 0 Double Lung Transplant 0 1 1 Heart – Lung Transplant 0 0 1 TOTAL 1 1 2 Table 3.3.3b: Immunosuppressive Used at Time Follow-up to 2007 Year 2005 2006 2007 Type of immunosuppressive No. No. No. Steroids Prednisolone Methylprednisolone
1 1
2 1
2 2
Neoral 1 2 3 Antimetabolites Azathioprine (AZA) Mycophenolate (MMF)
0 1
2
0 3
Tacrolimus 0 0 0 TOTAL patients at follow -up 1 2 3

81
Fourth Report of the National Transplant Registry 2007 HEART AND LUNG TRANSPLANTATION
3.4 TRANSPLANT OUTCOMES On follow up complications such as hypertension, renal dysfunction, malignancy, non-compliance was not noted in patients with lung transplants. Table 3.4.5b: Distribution of patients by time of deaths, 2005-2007 Year of Transplant 2005 2006 2007 Time of death No. No. No. < 3 months 0 1 1 3 - < 6 months 0 0 0 6 – 12 months 0 0 0 > 12 months 0 0 0 TOTAL 0 1 1 In 2007 two of a total of 4 patients are alive. The first patient transplanted on 16/5/2005 is alive and so is the third patient who was transplanted in 2007. The second patient (transplanted in 2006) died of pneumonia with septicaemia and CMV infection at day 39. The fourth patient with the heart-lung transplant died of pneumonia and graft rejection at day 16 in 2007.

CHAPTER 4
LIVER TRANSPLANTATION
Editor: Dr Ganesalingam A/L Kanagasabai
Expert panel:
Dato’ Dr Zakaria Zahari (Chairman) Dr Ganesalingam A/L Kanagasabai
Dr Goon Hong Kooi Professor Dr Lee Way Seah
Dr Lim Chooi Bee Dr Sushila Siva Subramaniam
Dr Tan Soek Siam Dr Thavaranjitham
Contents
4.0 Introduction
4.1 Stock and Flow of Liver Transplantation
4.2 Recipients’ Characteristics Demographics
Primary Diagnosis
4.3 Transplant Practices Type of Transplant
Immunosuppressive Therapy
4.4 Transplant Outcomes Patient Survival Causes of Death

Fourth Report of the LIVER TRANSPLANTATION National Transplant Registry 2007
83
List of Tables Table 4.1.1: Stock and Flow of Liver Transplantation, 1993-2007 .................................. 85 Table 4.1.2: Distribution of Patients by Place of Transplant, 1993-2007 ......................... 86 Table 4.1.3: Distribution of Patients by Centres for Liver Transplantation, 1993-2007 .. 86 Table 4.1.4: Distribution of Transplant Recipients by Follow-up Centres, 2007 ............. 86 Table 4.2.1: Distribution of Patients by Gender, 1993-2007 ............................................ 87 Table 4.2.2: Distribution of Patients by Ethnic Group, 1993-2007 .................................. 88 Table 4.2.3: Distribution of Patients by Age, 1993-2007 ................................................. 89 Table 4.2.4: Primary Diagnosis, 1993-2007 (N=95)……………………………………..90 Table 4.2.5: Indication for Transplantation, 1993-2007 (N=95)…………………………90 Table 4.2.6: Recipient Blood Group, 1993-2007 (N=95) ................................................. 91 Table 4.3.1: Distribution of Patients by Type of Donors, 1993-2007 (N=95)…………...92 Table 4.3.2: Immunosuppressive Drug Treatment at Transplantation, 1993-2007(N=95)92 Table 4.4.1: Patient Survival by Year of Transplant, 1993-2007 (N=95)......................... 93 Table 4.4.2: Patient Survival by Gender, 1993-2007 (N=95) ........................................... 94 Table 4.4.3: Patient Survival by Age Group, 1993-2007 (N=95) ..................................... 95 Table 4.4.4: Distribution of Patients by Cause of Death, 1993-2007 (N=95) .................. 96 List of Figures Figure 4.1.1: Stock and Flow of Liver Transplantation, 1993-2007 ................................. 85 Figure 4.2.1: Distribution of Patients by Gender, 1993-2007 ........................................... 87 Figure 4.2.2: Distribution of Patients by Ethnic Group, 1993-2007 ................................. 88 Figure 4.4.1: Patient Survival by Year of Transplant, 1993-2007 .................................... 93 Figure 4.4.2: Patient Survival by Gender, 1993-2007 ...................................................... 94 Figure 4.4.3: Patient Survival by Age Group, 1993-2007 ................................................ 95

Fourth Report of the National Transplant Registry 2007 LIVER TRANSPLANTATION
84
4.0 INTRODUCTION Liver transplantation represents a great conquest of medical science, and certainly gives hope to those suffering serious, and often grave, liver diseases. Unfortunately, the problem of the lack of available cadaveric organs is a considerable and practical one; one can see this in the long waiting list of those whose only hope for survival is linked to the small number of organ donations. Malaysia continues to struggle with its liver transplantation program simply because of a lack of cadaveric donors. It is necessary to overcome prejudices and misunderstanding, dispel suspicions and fears and substitute them with certainties and guarantees, so as to create in all Malaysians an awareness, ever more widespread, of the great gift of life.

Fourth Report of the LIVER TRANSPLANTATION National Transplant Registry 2007
85
4.1 STOCK AND FLOW The number of liver transplants performed from 1993 to 2007 is ninety five. Eighty one (85%) were performed locally and fourteen (15%) were performed at overseas centres. Seven new liver transplants were done in 2007 and they were all done locally at Selayang Hospital. Table 4.1.1: Stock and Flow of Liver Transplantation, 1993-2007 Year 93 94 95 96 *97 98 99 00 01 02 **03 04 05 06 07New transplant patients 1 1 8 13 3 2 8 3 5 10 5 16 5 8 7 Deaths 0 0 3 4 1 0 4 1 2 5 1 4 4 3 1 Re-transplant 0 0 0 0 0 0 0 0 0 0 0 0 0 0 0 Lost to follow up 0 0 0 0 0 0 0 1 0 1 0 1 1 0 0 Functioning graft at 31st December 1 2 7 16 17 19 23 24 27 31 34 45 45 50 56 * 1 patient who was alive until 05/12/1997 is recorded died with missing date of death ** 1 patient transplanted in 2003 is recorded as death with missing date of death Figure 4.1.1: Stock and Flow of Liver Transplantation, 1993-2007
Num
ber o
f pat
ient
s (n)
Year
0
5
10 15
20
25
30 35
40 45
50
55 New patients Alive at 31st Dec
93 94 95 96 97 98 99 00 01 02 03 04 05 06 07

Fourth Report of the National Transplant Registry 2007 LIVER TRANSPLANTATION
86
Table 4.1.2: Distribution of Patients by Place of Transplant, 1993-2007 Year 93 94 95 96 97 98 99 00 01 02 03 04 05 06 07 TOTAL No. No. No. No. No. No. No. No. No. No. No. No. No. No. No. No. Local 0 0 8 10 1 1 8 3 5 9 2 14 5 8 7 81 Overseas 1 1 0 3 2 1 0 0 0 1 3 2 0 0 0 14 TOTAL 1 1 8 13 3 2 8 3 5 10 5 16 5 8 7 95 Table 4.1.3: Distribution of Patients by Centres for Liver Transplantation, 1993-2007 Year 93 94 95 96 97 98 99 00 01 02 03 04 05 06 07 TOTAL Centre No. No. No. No. No. No. No. No. No. No. No. No. No. No. No. No. Sime Darby Medical Centre 0 0 8 10 1 1 8 3 5 6 2 7 0 0 0 51 Hospital Selayang 0 0 0 0 0 0 0 0 0 3 0 7 5 8 7 30 Australia 1 0 0 3 1 0 0 0 0 0 0 0 0 0 0 5 National University Hospital, Singapore 0 0 0 0 1 1 0 0 0 0 0 0 0 0 0 2 Kings College Hospital, UK 0 1 0 0 0 0 0 0 0 0 0 0 0 0 0 1 Tianjin, China 0 0 0 0 0 0 0 0 0 0 1 1 0 0 0 2 Asian Centre for Liver Disease, Singapore 0 0 0 0 0 0 0 0 0 1 2 1 0* 0* 0* 4 TOTAL 1 1 8 13 3 2 8 3 5 10 5 16 5 8 7 95 Table 4.1.4: Distribution of Transplant Recipients by Follow-up Centres, 2007 Centre No. % Number of patient with functioning graft at 31st December 2007 56 100 Kuala Lumpur Hospital 2 4 Sime Darby Medical Centre 27 48 Selayang Hospital 23 41 Singapore 1 2 Univeristy of Malaya Medical Centre 3 5
* Data was not reported

Fourth Report of the LIVER TRANSPLANTATION National Transplant Registry 2007
87
4.2 RECIPIENTS’ CHARACTERISTICS Fifty three (56%) were males and 42 (44%) were females. The ethnic distribution of the liver transplant recipients are as follows: Chinese 48 (50%), Malays 37 (39%), Indians 8 (9%), Others 2 (2%). Eighty (84%) of the transplant recipients were between 1 and 9 years of age at the time of transplantation. Biliary atresia was the primary liver disease in 69 (73%) of the recipients. The commonest indication for liver transplantation was failure to thrive with growth retardation and poor liver function. The commonest blood group amongst the liver transplant recipients was group O. (38%) Table 4.2.1: Distribution of Patients by Gender, 1993-2007 Year 93 94 95 96 97 98 99 00 01 02 03 04 05 06 07 TOTAL Gender No. No. No. No. No. No. No. No. No. No. No. No. No. No. No. No. Male 0 0 6 5 2 1 3 1 2 7 5 10 2 6 3 53 Female 1 1 2 8 1 1 5 2 3 3 0 6 3 2 4 42 TOTAL 1 1 8 13 3 2 8 3 5 10 5 16 5 8 7 95 Figure 4.2.1: Distribution of Patients by Gender, 1993-2007
Num
ber o
f pat
ient
s (n)
Year
0
2
4
6
8
10 Male Female
93 94 95 96 97 98 99 00 01 02 03 04 05 06 07

Fourth Report of the National Transplant Registry 2007 LIVER TRANSPLANTATION
88
Table 4.2.2: Distribution of Patients by Ethnic Group, 1993-2007 Year 93 94 95 96 97 98 99 00 01 02 03 04 05 06 07 TOTAL Ethnic group
No. No. No. No. No. No. No. No. No. No. No. No. No. No. No. No.
Malay 0 1 2 3 1 0 4 1 2 3 1 11 3 3 2 37 Chinese 1 0 6 8 2 1 2 2 3 6 4 5 1 3 4 48 Indian 0 0 0 2 0 1 1 0 0 0 0 0 1 2 1 8 Others 0 0 0 0 0 0 1 0 0 1 0 0 0 0 0 2 TOTAL 1 1 8 13 3 2 8 3 5 10 5 16 5 8 7 95
Figure 4.2.2: Distribution of Patients by Ethnic Group, 1993-2007
Num
ber o
f pat
ient
s (n)
Year
0
2
4
6
8
10
12
Malay Chinese Indian Others
93 94 95 96 97 98 99 00 01 02 03 04 05 06 07

Fourth Report of the LIVER TRANSPLANTATION National Transplant Registry 2007
89
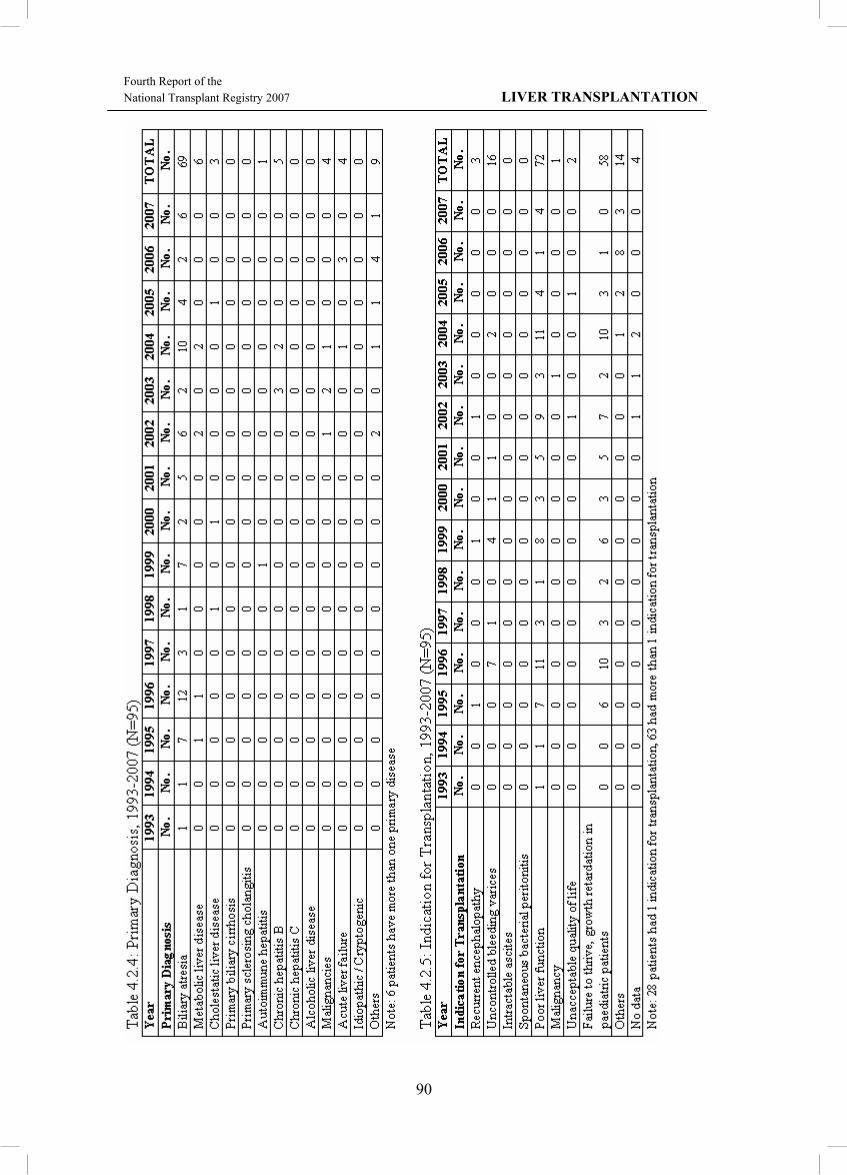
Fourth Report of the National Transplant Registry 2007 LIVER TRANSPLANTATION
90

91
Table 4.2.6: Recipient Blood Group, 1993-2007 (N=95) Year 1993 1994 1995 1996 1997 1998 1999 2000 Blood group No. No. No. No. No. No. No. No. A 0 1 2 0 0 0 3 0 B 0 0 1 2 0 1 2 0 AB 0 0 0 1 0 1 0 0 O 0 0 2 5 1 0 3 3 No data 1 0 3 5 2 0 0 0 TOTAL 1 1 8 13 3 2 8 3 Year 2001 2002 2003 2004 2005 2006 2007 TOTAL Blood group No. No. No. No. No. No. No. No. A 1 3 1 4 1 4 2 22 B 1 1 0 1 1 3 3 16 AB 0 0 0 1 1 0 0 4 O 3 5 1 8 2 1 2 36 No data 0 1 3 2 0 0 0 17 TOTAL 5 10 5 16 5 8 7 95
Fourth Report of the LIVER TRANSPLANTATION National Transplant Registry 2007

Fourth Report of the National Transplant Registry 2007 LIVER TRANSPLANTATION
92

Fourth Report of the LIVER TRANSPLANTATION National Transplant Registry 2007
93
4.3 TRANSPLANT OUTCOMES The 1 year survival rate for the period 1993 - 1998 and 1999 - 2006 was 71% and 69% respectively. The most common cause of death was sepsis. Table 4.4.1: Patient Survival by Year of Transplant, 1993-2007 (N=95)
Year of Transplant 1993 - 1998 1999 - 2007 Interval (months) % Survival SE % Survival SE 1 82 7 82 5 6 71 9 69 6 12 71 9 69 6
SE=standard error
Figure 4.4.1: Patient Survival by Year of Transplant, 1993-2007
0.00
0.
25
0.50
0.
75
1.00
Cum
ulat
ive
surv
ival
0 2 4 6 8 10 12 Duration in months
Year 1993-1998 Year 1999-2007
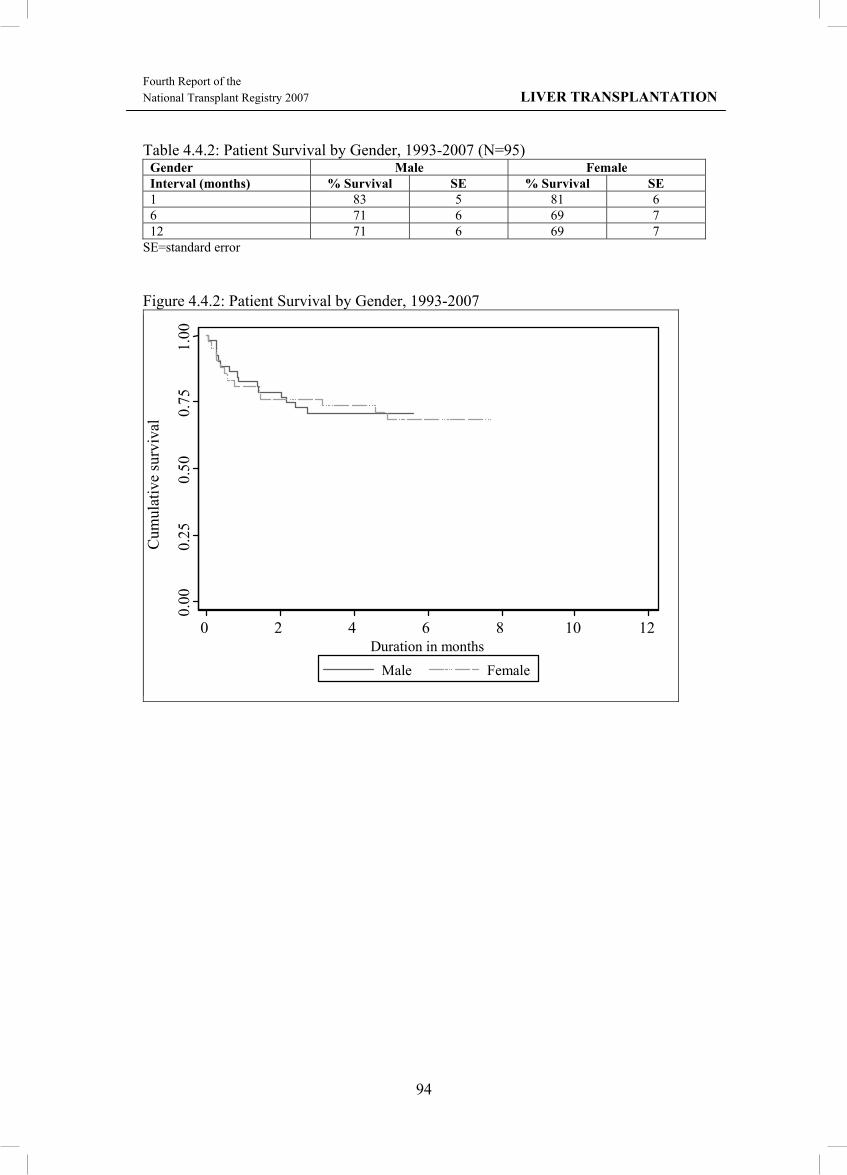
Fourth Report of the National Transplant Registry 2007 LIVER TRANSPLANTATION
94
Table 4.4.2: Patient Survival by Gender, 1993-2007 (N=95)
Gender Male Female Interval (months) % Survival SE % Survival SE 1 83 5 81 6 6 71 6 69 7 12 71 6 69 7
SE=standard error Figure 4.4.2: Patient Survival by Gender, 1993-2007
0.00
0.
25
0.50
0.
75
1.00
Cum
ulat
ive
surv
ival
0 2 4 6 8 10 12 Duration in months
Male Female
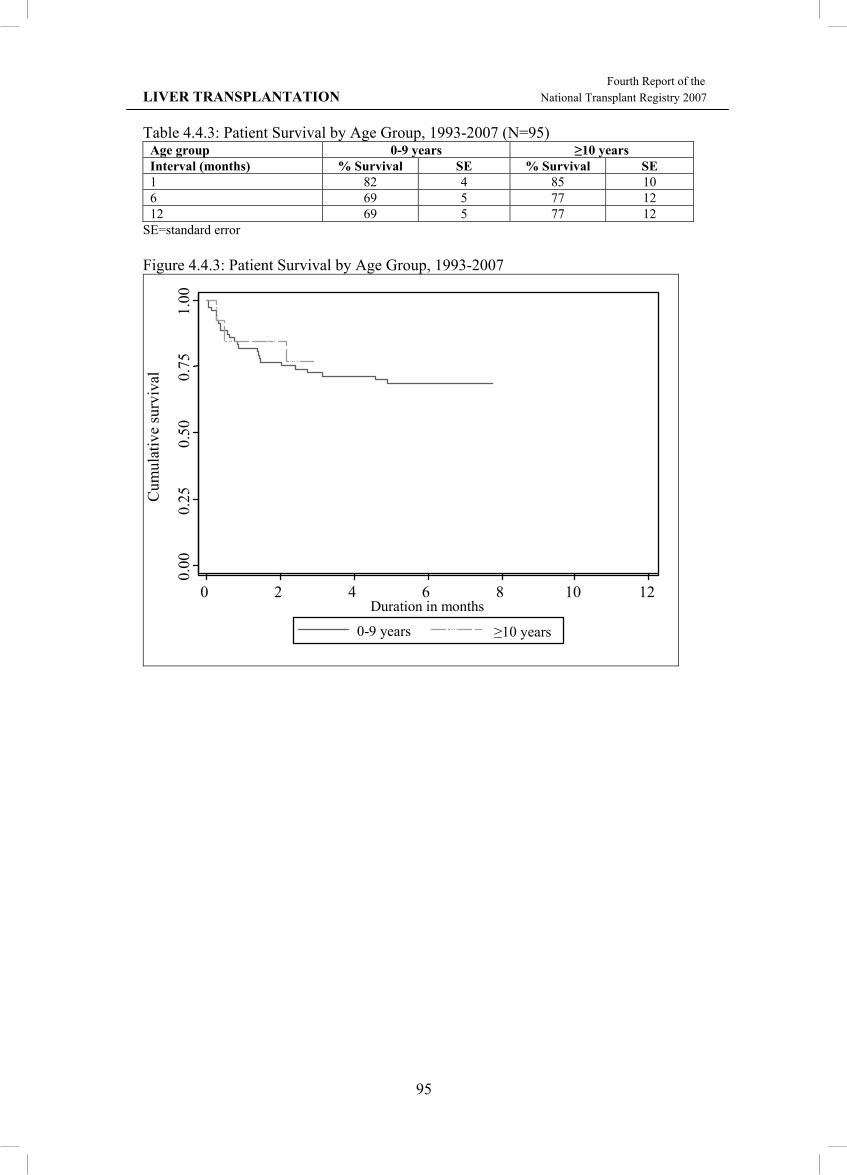
Fourth Report of the LIVER TRANSPLANTATION National Transplant Registry 2007
95
Table 4.4.3: Patient Survival by Age Group, 1993-2007 (N=95) Age group 0-9 years ≥10 years Interval (months) % Survival SE % Survival SE 1 82 4 85 10 6 69 5 77 12 12 69 5 77 12
SE=standard error Figure 4.4.3: Patient Survival by Age Group, 1993-2007
0.00
0.
25
0.50
0.
75
1.00
Cum
ulat
ive
surv
ival
0 2 4 6 8 10 12 Duration in months
0-9 years
≥10 years
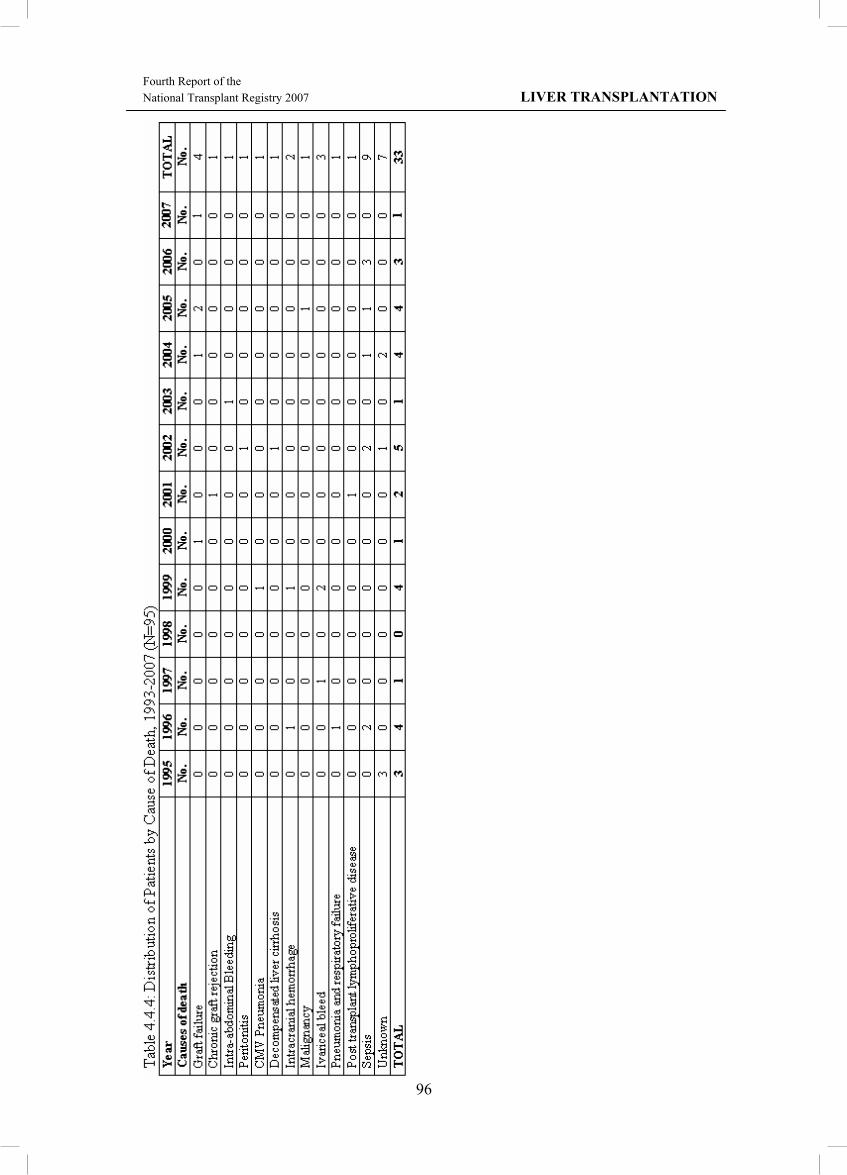
Fourth Report of the National Transplant Registry 2007 LIVER TRANSPLANTATION
96


CHAPTER 5
RENAL TRANSPLANTATION
Editor: Dr Goh Bak Leong
Expert Panel:
Dato’ Dr Zaki Morad (Chair) Dr Goh Bak Leong (Co-Chair)
Dr Fan Kin Sing Dr Lily Mushahar Mr Rohan Malek
Dr S Prasad Menon Prof Dr Tan Si Yen
Contents
5.1 Stock and Flow of Renal Transplantation Stock and Flow Transplant Rates
Places of Transplant
5.2 Recipients’ Characteristics Demographics, Clinical and Serology Status
Primary Causes of ESRF
5.3 Transplant Practices Type of Transplant
Immunosuppressive Therapy and Other Medications
5.4 Transplant Outcomes Post Transplantation Complications
Death and Graft Loss
5.5 Patient and Graft Survival
5.6 Cardiovascular Risk in Renal Transplant Recipients Risk Factors for Ischaemic Heart Disease
Blood Pressure Classification According to JNC VI Criteria, 2005, 2006 and 2007
5.7 QoL Index Score in Renal Transplant Recipients
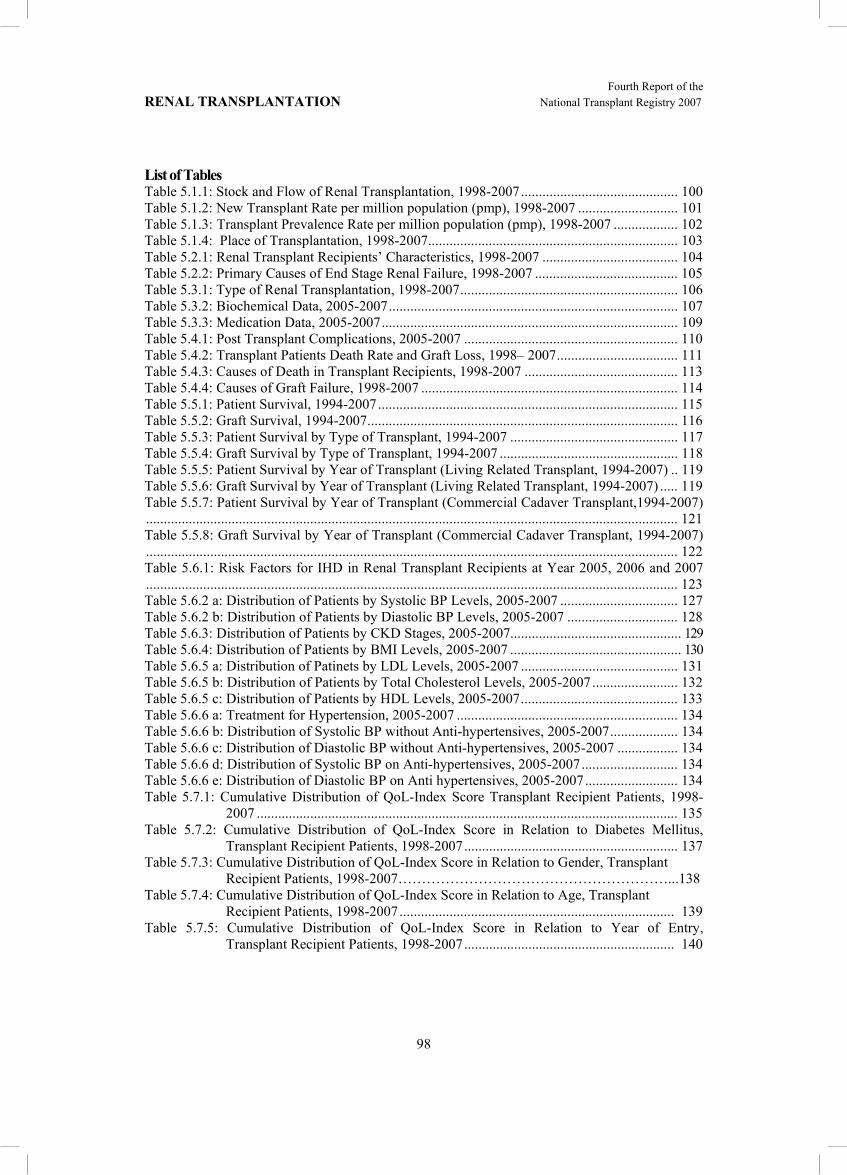
Fourth Report of the RENAL TRANSPLANTATION National Transplant Registry 2007
98
List of Tables Table 5.1.1: Stock and Flow of Renal Transplantation, 1998-2007 ............................................ 100 Table 5.1.2: New Transplant Rate per million population (pmp), 1998-2007 ............................ 101 Table 5.1.3: Transplant Prevalence Rate per million population (pmp), 1998-2007 .................. 102 Table 5.1.4: Place of Transplantation, 1998-2007 ...................................................................... 103 Table 5.2.1: Renal Transplant Recipients’ Characteristics, 1998-2007 ...................................... 104 Table 5.2.2: Primary Causes of End Stage Renal Failure, 1998-2007 ........................................ 105 Table 5.3.1: Type of Renal Transplantation, 1998-2007 ............................................................. 106 Table 5.3.2: Biochemical Data, 2005-2007 ................................................................................. 107 Table 5.3.3: Medication Data, 2005-2007 ................................................................................... 109 Table 5.4.1: Post Transplant Complications, 2005-2007 ............................................................ 110 Table 5.4.2: Transplant Patients Death Rate and Graft Loss, 1998– 2007 .................................. 111 Table 5.4.3: Causes of Death in Transplant Recipients, 1998-2007 ........................................... 113 Table 5.4.4: Causes of Graft Failure, 1998-2007 ........................................................................ 114 Table 5.5.1: Patient Survival, 1994-2007 .................................................................................... 115 Table 5.5.2: Graft Survival, 1994-2007 ....................................................................................... 116 Table 5.5.3: Patient Survival by Type of Transplant, 1994-2007 ............................................... 117 Table 5.5.4: Graft Survival by Type of Transplant, 1994-2007 .................................................. 118 Table 5.5.5: Patient Survival by Year of Transplant (Living Related Transplant, 1994-2007) .. 119 Table 5.5.6: Graft Survival by Year of Transplant (Living Related Transplant, 1994-2007) ..... 119 Table 5.5.7: Patient Survival by Year of Transplant (Commercial Cadaver Transplant,1994-2007) ..................................................................................................................................................... 121 Table 5.5.8: Graft Survival by Year of Transplant (Commercial Cadaver Transplant, 1994-2007) ..................................................................................................................................................... 122 Table 5.6.1: Risk Factors for IHD in Renal Transplant Recipients at Year 2005, 2006 and 2007 ..................................................................................................................................................... 123 Table 5.6.2 a: Distribution of Patients by Systolic BP Levels, 2005-2007 ................................. 127 Table 5.6.2 b: Distribution of Patients by Diastolic BP Levels, 2005-2007 ............................... 128 Table 5.6.3: Distribution of Patients by CKD Stages, 2005-2007................................................ 129 Table 5.6.4: Distribution of Patients by BMI Levels, 2005-2007 ................................................ 130 Table 5.6.5 a: Distribution of Patinets by LDL Levels, 2005-2007 ............................................ 131 Table 5.6.5 b: Distribution of Patients by Total Cholesterol Levels, 2005-2007 ........................ 132 Table 5.6.5 c: Distribution of Patients by HDL Levels, 2005-2007 ............................................ 133 Table 5.6.6 a: Treatment for Hypertension, 2005-2007 .............................................................. 134 Table 5.6.6 b: Distribution of Systolic BP without Anti-hypertensives, 2005-2007 ................... 134 Table 5.6.6 c: Distribution of Diastolic BP without Anti-hypertensives, 2005-2007 ................. 134 Table 5.6.6 d: Distribution of Systolic BP on Anti-hypertensives, 2005-2007 ........................... 134 Table 5.6.6 e: Distribution of Diastolic BP on Anti hypertensives, 2005-2007 .......................... 134 Table 5.7.1: Cumulative Distribution of QoL-Index Score Transplant Recipient Patients, 1998-
2007 ...................................................................................................................... 135 Table 5.7.2: Cumulative Distribution of QoL-Index Score in Relation to Diabetes Mellitus,
Transplant Recipient Patients, 1998-2007 ............................................................ 137 Table 5.7.3: Cumulative Distribution of QoL-Index Score in Relation to Gender, Transplant
Recipient Patients, 1998-2007…………………………………………………...138 Table 5.7.4: Cumulative Distribution of QoL-Index Score in Relation to Age, Transplant
Recipient Patients, 1998-2007 ............................................................................. 139 Table 5.7.5: Cumulative Distribution of QoL-Index Score in Relation to Year of Entry,
Transplant Recipient Patients, 1998-2007 ........................................................... 140

Fourth Report of the National Transplant Registry 2007 RENAL TRANSPLANTATION
99
List of Figures Figure 5.1.1: Stock and Flow of Renal Transplantation, 1975-2007 ........................................... 100 Figure 5.1.2: New Transplant Rate, 1975-2007 .......................................................................... 101 Figure 5.1.3: Transplant Prevalence Rate, 1975-2007 ................................................................ 102 Figure 5.4.2 (i): Transplant Recipient Death Rate, 1976-2007 ................................................... 112 Figure 5.4.2 (ii): Transplant Recipient Graft Loss Rate, 1976-2007 ........................................... 112 Figure 5.5.1: Patient Survival, 1994-2007 ................................................................................... 115 Figure 5.5.2: Graft Survival, 1994-2007 ..................................................................................... 116 Figure 5.5.3: Patient Survival by Type of Transplant, 1994-2007 .............................................. 117 Figure 5.5.4: Graft Survival by Type of Transplants, 1994-2007 ............................................... 118 Figure 5.5.5: Patient Survival by Year of Transplant (Living Related Transplant, 1994-2007) . 119 Figure 5.5.6: Graft Survival by Year of Transplant (Living Related Transplant, 1994-2007) .... 120 Figure 5.5.7: Patient Survival by Year of Transplant (Commercial Cadaver Transplant, 1994-
2007) ..................................................................................................................... 121 Figure 5.5.8: Graft Survival by Year of Transplant (Commercial Cadaver Transplant, 1994-2007)
.............................................................................................................................. 122 Figure 5.6.1 a: Venn Diagram for Pre and Post Transplant Complications (in %) at Year 2005 124 Figure 5.6.1 b: Venn Diagram for Pre and Post Transplant Complications (in %) at Year 2006 125 Figure 5.6.1 c: Venn Diagram for Pre and Post Transplant Complications (in %) at Year 2007 126 Figure 5.6.2 a: Distribution of Patients by Systolic BP Levels, 2005-2007 ................................ 127 Figure 5.6.2 b: Distribution of Patients by Diastolic BP Levels, 2005-2007 .............................. 128 Figure 5.6.3: Distribution of Patients by CKD Stages, 2005-2007 ............................................. 129 Figure 5.6.4: Distribution of Patients by BMI Levels, 2005-2007 .............................................. 130 Figure 5.6.5a: Distribution of Patients by LDL Levels, 2005-2007 ............................................ 131 Figure 5.6.5b: Distribution of Patinets by Total Cholesterol Levels, 2005-2007 ........................ 132 Figure 5.6.5c: Distribution of Patients by HDL Levels, 2005-2007 ........................................... 133 Figure 5.7.1: Cumulative Distribution of QoL-Index Score Transplant Recipient Patients, 1998-
2007 ...................................................................................................................... 136 Figure 5.7.2: Cumulative Distribution of QoL-Index Score in Relation to Diabetes Mellitus,
Transplant Recipient Patients, 1998-2007 ............................................................ 137 Figure 5.7.3: Cumulative Distribution of QoL-Index Score in Relation to Gender, Transplant
Recipient Patients, 1998-2007 .............................................................................. 138 Figure 5.7.4: Cumulative Distribution of QoL-Index Score in Relation to Age, Transplant
Recipient Patients, 1998-2007 .............................................................................. 139 Figure 5.7.5: Cumulative Distribution of QoL-Index Score in Relation to Year of Entry,
Transplant Recipient Patients, 1998-2007 ............................................................ 140

Fourth Report of the RENAL TRANSPLANTATION National Transplant Registry 2007
100
RENAL TRANSPLANTATION
SECTION 5.1 STOCK AND FLOW The number of new renal transplant patients shows an initial rise from 104 transplants per year in 1998 to a peak of 190 transplants in 2004. This is a rise of >80% but the number declined subsequently to only 86 in 2007 (Table 5.1.1). This is due to reduction in the number of transplantations done in China. As renal transplantation in the country is still dependant on the availability of commercial cadaveric transplantation done abroad this drop was foreseeable. The number of functioning renal transplants reported to the National Transplant Registry (NTR) had increased from 1112 in 1998 to 1726 in 2007 (Table 5.1.1). Table 5.1.1: Stock and Flow of Renal Transplantation, 1998-2007 Year 1998 1999 2000 2001 2002 2003 2004 2005 2006 2007 New transplant patients 104 127 143 162 169 160 190 163 138 86 Died 26 25 30 37 32 37 41 43 50 34 Graft failure 49 36 32 40 38 41 44 21 36 36 Lost to Follow up 1 1 9 4 5 4 14 11 11 12 Functioning graft at 31st December 1112 1177 1249 1330 1424 1502 1593 1681 1722 1726
Figure 5.1.1: Stock and Flow of Renal Transplantation, 1975-2007
Num
ber o
f pat
ient
s (n)
Year
0
200 400 600 800
1000 1200 1400 1600 1800
New patients Functioning graft at 31st Dec
75 79 81 83 85 87 89 91 93 95 97 99 01 05 07
03
77

Fourth Report of the National Transplant Registry 2007 RENAL TRANSPLANTATION
101
The incidence of renal transplantation stabilised at a modest rate of 5-7 per million population (Table 5.1.2) while transplant prevalence rate has grown slowly from 50 per million in 1998 to 64 per million population in 2007, an increase of 30% over the 1998 figures. However compared to growth in the prevalence rate of dialysis patients (which has increased by 300% from 205 in 1998 to 615 in 2007) our transplant prevalence rate has not kept up.
Table 5.1.2: New Transplant Rate per million population (pmp), 1998-2007 Year 1998 1999 2000 2001 2002 2003 2004 2005 2006 2007 New transplant patients 104 127 143 162 169 160 190 163 138 86 New transplant rate, pmp 5 6 6 7 7 6 7 6 5 3
Figure 5.1.2: New Transplant Rate, 1975-2007
New
Tra
nspl
ant R
ate,
pm
p
Year
0
1
2
3
4
5
6
7
8
9
10
75 77 79 81 83 85 87 89 91 93 95 97 99 01 03 05 07

Fourth Report of the RENAL TRANSPLANTATION National Transplant Registry 2007
102
Table 5.1.3: Transplant Prevalence Rate per million population (pmp), 1998-2007 Year 1998 1999 2000 2001 2002 2003 2004 2005 2006 2007Functioning graft at 31st Dec 1112 1177 1249 1330 1424 1502 1593 1681 1722 1726Transplant prevalence rate, pmp 50 52 53 55 58 60 62 64 65 64
Figure 5.1.3: Transplant Prevalence Rate, 1975-2007
Tran
spla
nt P
reva
lenc
e R
ate,
pm
p
Year
0 5
10 15 20 25 30 35 40 45 50 55 60 65 70
75 77 79 81 83 85 87 89 91 93 95 97 99 01 03 05 07

Fourth Report of the National Transplant Registry 2007 RENAL TRANSPLANTATION
103
In terms of place of transplantation, transplantation within local centres has grown slightly from 40 cases (39% of renal transplants) in 1998 to 52 cases (60% of renal transplants) in 2007. This translates to a net increase of 1 case per year over the 10 year period. This is disturbing data as it underscores our failure to improve transplantation rates within the country which is mainly due to the lack of both living as well as cadaver donors. Transplantation in China in 2007 only comprised 34% of all of renal transplant recipients with 29 patients. In fact this is the first time local transplantation out-performed China transplantation over the last decade. Table 5.1.4: Place of Transplantation, 1998-2007 Year 1998 1999 2000 2001 2002
No. % No. % No. % No. % No. % HKL 33 32 36 28 28 20 33 20 28 17 UMMC 7 7 16 13 19 13 23 14 14 8 Selayang Hospital 0 0 0 0 4 3 11 7 11 7 Other local 0 0 1 1 3 2 4 2 1 1 China 50 48 62 49 80 56 83 51 103 61 India 7 7 5 4 9 6 7 4 12 7 Other overseas 3 3 2 2 0 0 1 1 0 0 Unknown 4 4 5 4 0 0 0 0 0 0 TOTAL 104 100 127 100 143 100 162 100 169 100
Year 2003 2004 2005 2006 2007 TOTAL
No. % No. % No. % No. % No. % No. % HKL 26 16 20 11 32 20 35 25 35 41 306 21 UMMC 6 4 7 4 7 4 5 4 0 0 104 7 Selayang Hospital 11 7 11 6 5 3 8 6 14 16 75 5 Other local 1 1 2 1 5 3 2 1 3 3 22 2 China 111 69 137 72 108 66 79 57 29 34 842 58 India 4 3 11 6 5 3 7 5 1 1 68 5 Other overseas 1 1 2 1 1 1 2 1 4 5 16 1 Unknown 0 0 0 0 0 0 0 0 0 0 9 1 TOTAL 160 100 190 100 163 100 138 100 86 100 1442 100
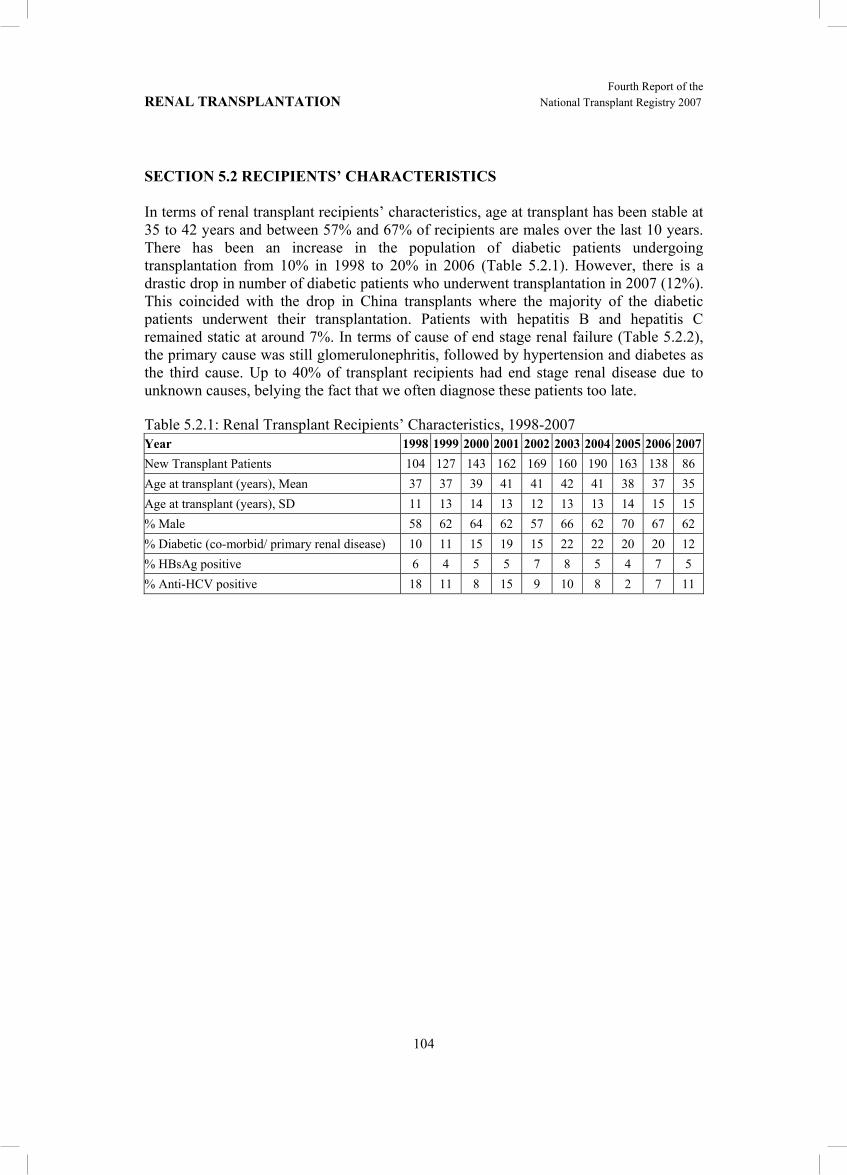
Fourth Report of the RENAL TRANSPLANTATION National Transplant Registry 2007
104
SECTION 5.2 RECIPIENTS’ CHARACTERISTICS
In terms of renal transplant recipients’ characteristics, age at transplant has been stable at 35 to 42 years and between 57% and 67% of recipients are males over the last 10 years. There has been an increase in the population of diabetic patients undergoing transplantation from 10% in 1998 to 20% in 2006 (Table 5.2.1). However, there is a drastic drop in number of diabetic patients who underwent transplantation in 2007 (12%). This coincided with the drop in China transplants where the majority of the diabetic patients underwent their transplantation. Patients with hepatitis B and hepatitis C remained static at around 7%. In terms of cause of end stage renal failure (Table 5.2.2), the primary cause was still glomerulonephritis, followed by hypertension and diabetes as the third cause. Up to 40% of transplant recipients had end stage renal disease due to unknown causes, belying the fact that we often diagnose these patients too late. Table 5.2.1: Renal Transplant Recipients’ Characteristics, 1998-2007 Year 1998 1999 2000 2001 2002 2003 2004 2005 2006 2007New Transplant Patients 104 127 143 162 169 160 190 163 138 86 Age at transplant (years), Mean 37 37 39 41 41 42 41 38 37 35 Age at transplant (years), SD 11 13 14 13 12 13 13 14 15 15 % Male 58 62 64 62 57 66 62 70 67 62 % Diabetic (co-morbid/ primary renal disease) 10 11 15 19 15 22 22 20 20 12 % HBsAg positive 6 4 5 5 7 8 5 4 7 5 % Anti-HCV positive 18 11 8 15 9 10 8 2 7 11

Fourth Report of the National Transplant Registry 2007 RENAL TRANSPLANTATION
105
Table 5.2.2: Primary Causes of End Stage Renal Failure, 1998-2007 Year 1998 1999 2000 2001 2002
No. % No. % No. % No. % No. % New transplant patients 104 100 127 100 143 100 162 100 169 100 Glomerulonephritis 28 27 41 32 49 34 43 27 53 31 Diabetes Mellitus 5 5 10 8 16 11 23 14 16 9 Hypertension 5 5 7 6 20 14 17 10 24 14 Obstructive uropathy 4 4 4 3 3 2 3 2 2 1 ADPKD 1 1 1 1 3 2 1 1 3 2 Drugs / toxic nephropathy 0 0 0 0 0 0 0 0 0 0 Hereditary nephritis 0 0 0 0 0 0 0 0 0 0 Unknown 54 52 62 49 54 38 61 38 68 40 Others 11 11 6 5 12 8 23 14 16 9 Year 2003 2004 2005 2006 2007
No. % No. % No. % No. % No. % New transplant patients 160 100 190 100 163 100 138 100 86 100 Glomerulonephritis 54 34 62 33 45 28 51 37 26 30 Diabetes Mellitus 26 16 32 17 29 18 21 15 6 7 Hypertension 25 16 51 27 38 23 29 21 20 23 Obstructive uropathy 2 1 4 2 3 2 4 3 1 1 ADPKD 5 3 5 3 3 2 1 1 0 0 Drugs / toxic nephropathy 2 1 2 1 0 0 1 1 0 0 Hereditary nephritis 0 0 1 1 0 0 0 0 0 0 Unknown 58 36 83 44 50 31 42 30 32 37 Others 12 8 27 14 17 10 16 12 12 14

Fourth Report of the RENAL TRANSPLANTATION National Transplant Registry 2007
106
In 2006, 62% of the renal transplant recipients received their grafts from commercial sources. Fifty-eight percent of these were from commercial cadavers. Live donor transplantation made up 21% of transplants (28 recipients) in the same year which was down from 29 cases (29%) in 1998 and 41 cases (25%) in 2005. Local cadaveric donation made up 18% of transplants (24 recipients) in 2006 although it had shown an initial promising rise to 37 recipients in 2001. 2007 marked the first time in 10 years there were more local transplantations (37%) compared to commercial transplantations in China (34%).
Table 5.3.1: Type of Renal Transplantation, 1998-2007 Year 1998 1999 2000 2001 2002
No. % No. % No. % No. % No. % Commercial cadaver 51 51 62 51 80 56 83 51 103 61 Commercial live donor 4 4 4 3 9 6 6 4 11 7 Live donor (genetically related) 28 28 40 33 21 15 32 20 30 18
Live donor (emotionally related) 2 2 5 4 6 4 4 2 3 2
Cadaver 15 15 10 8 27 19 37 23 22 13 Total 100 100 121 100 143 100 162 100 169 100 Year 2003 2004 2005 2006 2007
No. % No. % No. % No. % No. % Commercial cadaver 112 70 143 76 105 64 80 58 28 33 Commercial live donor 3 2 6 3 8 5 5 4 2 2 Live donor (genetically related) 25 16 21 11 38 23 24 17 20 24
Live donor (emotionally related) 5 3 2 1 3 2 4 3 11 13
Cadaver 15 9 17 9 9 6 25 18 24 28 Total 160 100 189 100 163 100 138 100 85 100 *Commercial Cadaver (China, India, other oversea) *Commercial live donor (living unrelated) *Cadaver (local)
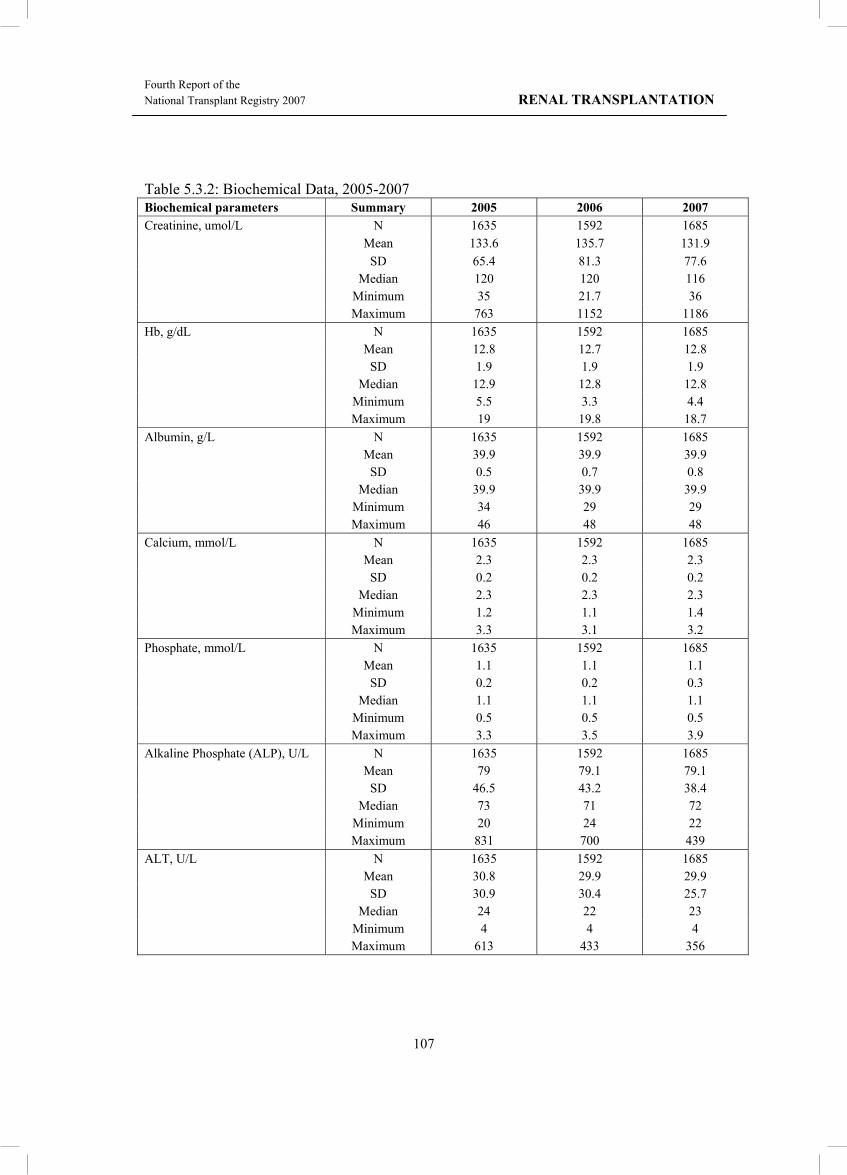
Fourth Report of the National Transplant Registry 2007 RENAL TRANSPLANTATION
107
Table 5.3.2: Biochemical Data, 2005-2007 Biochemical parameters Summary 2005 2006 2007 Creatinine, umol/L N 1635 1592 1685 Mean 133.6 135.7 131.9 SD 65.4 81.3 77.6 Median 120 120 116 Minimum 35 21.7 36 Maximum 763 1152 1186 Hb, g/dL N 1635 1592 1685 Mean 12.8 12.7 12.8 SD 1.9 1.9 1.9 Median 12.9 12.8 12.8 Minimum 5.5 3.3 4.4 Maximum 19 19.8 18.7 Albumin, g/L N 1635 1592 1685 Mean 39.9 39.9 39.9 SD 0.5 0.7 0.8 Median 39.9 39.9 39.9 Minimum 34 29 29 Maximum 46 48 48 Calcium, mmol/L N 1635 1592 1685 Mean 2.3 2.3 2.3 SD 0.2 0.2 0.2 Median 2.3 2.3 2.3 Minimum 1.2 1.1 1.4 Maximum 3.3 3.1 3.2 Phosphate, mmol/L N 1635 1592 1685 Mean 1.1 1.1 1.1 SD 0.2 0.2 0.3 Median 1.1 1.1 1.1 Minimum 0.5 0.5 0.5 Maximum 3.3 3.5 3.9 Alkaline Phosphate (ALP), U/L N 1635 1592 1685 Mean 79 79.1 79.1 SD 46.5 43.2 38.4 Median 73 71 72 Minimum 20 24 22 Maximum 831 700 439 ALT, U/L N 1635 1592 1685 Mean 30.8 29.9 29.9 SD 30.9 30.4 25.7 Median 24 22 23 Minimum 4 4 4 Maximum 613 433 356

Fourth Report of the RENAL TRANSPLANTATION National Transplant Registry 2007
108
Biochemical parameters Summary 2005 2006 2007 Total cholesterol, mmol/L N 1635 1592 1685 Mean 5.3 5.3 5.2 SD 1 1 1 Median 5.3 5.3 5.3 Minimum 1.7 1.5 1.7 Maximum 10.1 11.1 11.4 LDL cholesterol, mmol/L N 1635 1592 1685 Mean 3 3 3 SD 0.8 0.8 0.8 Median 3 3 3 Minimum 0.9 1 1 Maximum 9.2 11.1 8.9 HDL cholesterol, mmol/L N 1635 1592 1685 Mean 1.6 1.6 1.5 SD 0.5 0.5 0.4 Median 1.6 1.6 1.6 Minimum 0.4 0.4 0.4 Maximum 5.6 5.8 7.5 Systolic Blood Pressure, mmHg N 1635 1592 1685 Mean 133.3 130.8 131.7 SD 16.9 15.9 15.7 Median 130 130 130 Minimum 80 66 80 Maximum 220 210 210 Diastolic Blood Pressure, mmHg N 1635 1592 1685 Mean 80.5 78.9 78.8 SD 9.2 9.8 9.4 Median 80 80 80 Minimum 50 30 20 Maximum 127 120 116

Fourth Report of the National Transplant Registry 2007 RENAL TRANSPLANTATION
109
In 2007, Cyclosporine based regimes remained the mainstay of immunosuppressive therapy with 72% of patients receiving it. Tacrolimus based regimes accounted for 21%. There has been continuous increase in the use of Mycophenolate Mofetil as the second immunosuppressive agent in 54% of patients in 2007 compared to 37% of patients in 2004. During the same period, the use of Azathioprine declined from 43% in 2004 to 29% in 2007. Monotherapy of immunosuppresion is mostly not noted except in a small number of patients. Sirolimus was used in 2% of all transplant recipients in 2007. In terms of non immunosuppressive medications, only 36% of patients were on ACEI or AIIRBs or both and this trend has been relatively static since 2004. Calcium channel blockers appeared to be the mainstay of antihypertensive therapy in 65% of patients whilst beta blocker use was reported in 49% of patients. Other antihypertensives were reported in 8% of patients. The widespread use of calcium channel blockers either as monotherapy or combination may be due to the use of the dihydropyridine group to minimise the dose of Cyclosporine, which remains the main immunosuppressive drug.
Table 5.3.3: Medication Data, 2005-2007 Medication data Single drug treatment Combined drug treatment
2005 2006 2007 2005 2006 2007 N % N % N % N % N % N %
All 1563 100 1480 100 1661 100 1563 100 1480 100 1661 100
(i) Immunosuppressive drug(s) treatment
Prednisolone 12 1 8 1 9 1 1529 98 1442 97 1607 97 Azathioprine 1 0 0 0 0 0 605 39 496 34 478 29 Cyclosporin A 4 0 5 0 8 0 1221 78 1118 76 1188 72
Tacrolimus (FK506) 0 0 0 0 4 0 225 14 254 17 347 21
Mycophenolate Mofetil (MMF) 0 0 0 0 1 0 683 44 708 48 903 54
Rapamycin 0 0 0 0 0 0 8 1 6 0 33 2 Others 0 0 0 0 0 0 10 1 18 1 4 0
(ii) Non-Immunosuppressive drug(s) treatment
Beta blocker 105 7 77 5 90 5 667 43 597 40 735 44 Calcium channel blocker 195 12 199 13 183 11 822 53 787 53 903 54
ACE inhibitor 60 4 39 3 38 2 342 22 292 20 384 23 AIIRB 20 1 27 2 18 1 161 10 141 10 210 13 Anti-lipid 67 4 155 10 94 6 602 39 678 46 730 44 Other anti-hypertensive 5 0 11 1 6 0 158 10 159 11 140 8

Fourth Report of the RENAL TRANSPLANTATION National Transplant Registry 2007
110
SECTION 5.4: TRANSPLANT OUTCOMES 5.4.1 Post Transplant Complications
Sixty-three percent of patients were hypertensive prior to transplantation whereas 27% developed hypertension post transplantation. Fourteen percent of patients had diabetes mellitus prior to transplant whereas only 7% of patients developed post transplant diabetes mellitus. In terms of cardiovascular and cerebrovascular disease 4% had either or both prior to transplant whereas 3% developed these post transplantation. Table 5.4.1: Post Transplant Complications, 2005-2007 Post transplant complications
Complication developed before transplant (regardless of complication
after transplantation)
Complication developed only after transplantation
2005 2006 2007 2005 2006 2007 No. % No. % No. % No. % No. % No. %
All patients 1637 100 1592 100 1685 100 1637 100 1592 100 1685 100 Diabetes (either as Primary Renal Disease or co-morbid)
219 13 215 14 228 14 122 7 125 8 113 7
Cancer 2 0 2 0 3 0 19 1 20 1 21 1 Cardiovascular disease + cerebrovascular disorder 78 5 73 5 72 4 45 3 45 3 54 3
Hypertension 1049 64 1032 65 1059 63 438 27 355 22 453 27 *Hypertension: BP systolic>140 and BP diastolic >90 OR have either Beta blocker/ Calcium channel blocker / ACE inhibitor / AIIRB / Other anti-hypertensive

Fourth Report of the National Transplant Registry 2007 RENAL TRANSPLANTATION
111
5.4.2 Deaths and Graft Loss
In 2007, 34 transplant recipients died and 36 lost their grafts. The rates of transplant death and graft loss have remained static for the past 10 years (Table 5.4.2). The main known causes of death have been infection and cardiovascular disease with 33% and 18% respectively. Another 10% of patients died at home, which is usually presumed to be cardiovascular death as well. Cancer death rates have been significantly high since 2003 contributing to 15% of all deaths in 2003, 18% in 2004 and 15% in 2007. Death due to liver disease has remained relatively static at 5-9% from 2003 to 2006. In terms of graft loss, 69% were due to rejection with 3% apiece for vascular causes and infections in 2007 and these figures have remained relatively stable for the last 4 years. Table 5.4.2: Transplant Patients Death Rate and Graft Loss, 1998– 2007 Year 1998 1999 2000 2001 2002 2003 2004 2005 2006 2007 No. at risk 1097 1144 1212 1289 1376 1462 1547 1636 1701 1723 Transplant death 26 25 30 37 32 37 41 43 50 34 Transplant death rate % 2 2 2 3 2 3 3 3 3 2 Graft loss 49 36 32 40 38 41 44 21 36 36 Graft loss rate % 4 3 3 3 3 3 3 1 2 2 Acute rejection 0 0 0 0 0 3 19 14 18 10 Acute rejection rate % 0 0 0 0 0 0 1 1 1 1 All losses 75 61 62 77 70 78 85 64 86 70 All losses rate % 7 5 5 6 5 5 5 4 5 4 *Graft loss=graft failure *All losses=death / graft loss (acute rejection happens concurrently with graft failure / death)
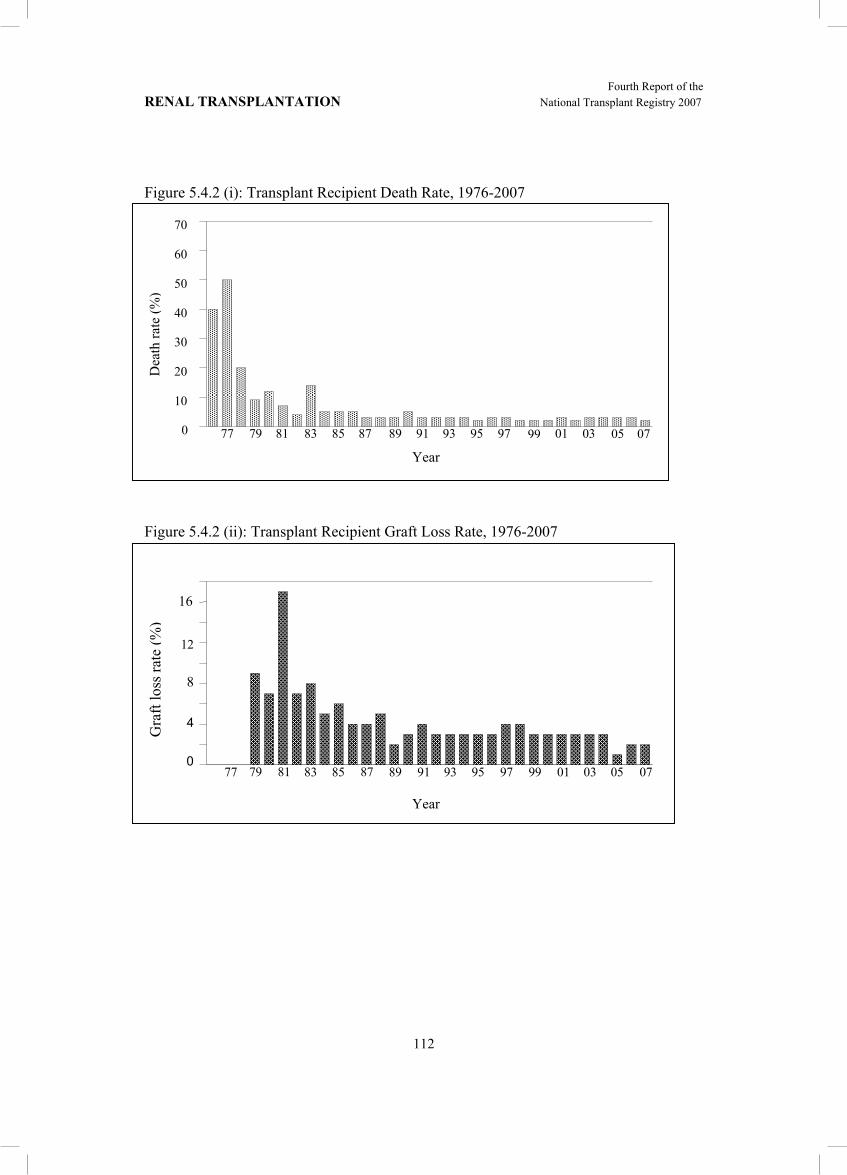
Fourth Report of the RENAL TRANSPLANTATION National Transplant Registry 2007
112
Figure 5.4.2 (i): Transplant Recipient Death Rate, 1976-2007
Figure 5.4.2 (ii): Transplant Recipient Graft Loss Rate, 1976-2007
Dea
th ra
te (%
)
Year
0
10
20
30
40
50
60
70
77 79 81 83 85 87 89 91 93 95 97 99 01 03 05 07
Gra
ft lo
ss ra
te (%
)
Year
0
4
8
12
16
77 79 81 83 85
87 89 91 93 95 97 99 01 03 05 07

Fourth Report of the National Transplant Registry 2007 RENAL TRANSPLANTATION
113
Table 5.4.3: Causes of Death in Transplant Recipients, 1998-2007 Year 1998 1999 2000 2001 2002 No. % No. % No. % No. % No. % Cardiovascular 3 11 4 13 10 29 7 16 5 16 Died at home 4 15 6 19 1 3 5 12 5 16 Infection 10 37 7 23 12 35 20 47 9 28 Graft failure 0 0 0 0 2 6 0 0 0 0 Cancer 3 11 3 10 2 6 6 14 4 13 Liver disease 2 7 3 10 1 3 1 2 3 9 Accidental death 0 0 1 3 1 3 1 2 1 3 Others 2 7 5 16 3 9 2 5 3 9 Unknown 3 11 2 6 2 6 1 2 2 6 TOTAL 27 100 31 100 34 100 43 100 32 100 Year 2003 2004 2005 2006 2007 No. % No. % No. % No. % No. % Cardiovascular 9 23 4 9 5 11 10 18 7 18 Died at home 5 12 6 13 5 11 7 13 4 10 Infection 11 28 11 24 22 50 22 40 13 33 Graft failure 0 0 2 4 0 0 0 0 3 8 Cancer 6 15 8 18 5 11 4 7 6 15 Liver disease 2 5 3 7 3 7 5 9 0 0 Accidental death 0 0 0 0 0 0 0 0 0 0 Others 5 12 10 22 3 7 4 7 2 5 Unknown 2 5 1 2 1 2 3 5 4 10 TOTAL 40 100 45 100 44 100 55 100 39 100

Fourth Report of the RENAL TRANSPLANTATION National Transplant Registry 2007
114
Table 5.4.4: Causes of Graft Failure, 1998-2007 Year 1998 1999 2000 2001 2002 No. % No. % No. % No. % No. % Rejection 28 53 23 64 19 59 25 61 22 55 Calcineurin toxicity 0 0 0 0 0 0 0 0 0 0 Other drug toxicity 0 0 0 0 0 0 0 0 0 0 Ureteric obstruction 0 0 0 0 0 0 0 0 0 0 Infection 1 2 0 0 1 3 2 5 0 0 Vascular causes 3 6 1 3 3 9 1 2 0 0 Recurrent / de novo renal disease 1 2 0 0 0 0 2 5 2 5
Others 5 9 0 0 2 6 0 0 4 10 Unknown 15 28 12 33 7 22 11 27 12 30 TOTAL 53 100 36 100 32 100 41 100 40 100 Year 2003 2004 2005 2006 2007 No. % No. % No. % No. % No. % Rejection 21 48 33 70 18 75 28 68 25 69 Calcineurin toxicity 0 0 0 0 0 0 1 2 0 0 Other drug toxicity 0 0 1 2 0 0 0 0 0 0 Ureteric obstruction 0 0 0 0 0 0 0 0 1 3 Infection 2 5 1 2 1 4 3 7 1 3 Vascular causes 3 7 4 9 2 8 3 7 1 3 Recurrent / de novo renal disease 2 5 1 2 0 0 1 2 0 0
Others 1 2 0 0 1 4 3 7 4 11 Unknown 15 34 7 15 2 8 2 5 4 11 TOTAL 44 100 47 100 24 100 41 100 36 100

Fourth Report of the National Transplant Registry 2007 RENAL TRANSPLANTATION
115
SECTION 5.5: PATIENT AND GRAFT SURVIVAL
Overall patient survival rates from 1994 to 2007 have been 95%, 91%, 88% and 81% at year 1, 3, 5 and 10 respectively. Overall graft survival rate has been 92%, 85%, 79% and 64% at year 1, 3, 5 and 10 respectively.
Table 5.5.1: Patient Survival, 1994-2007 Interval (years) No. % Survival SE 1 1777 95 1 3 1380 91 1 5 993 88 1 10 349 81 1 12 151 76 2 No.=Number at risk SE=standard error
Figure 5.5.1: Patient Survival, 1994-2007
Cum
ulat
ive
surv
ival
Duration in years 0 2 4 6 8 10 12
0.00
0.25
0.50
0.75
1.00

Fourth Report of the RENAL TRANSPLANTATION National Transplant Registry 2007
116
Table 5.5.2: Graft Survival, 1994-2007 Interval (years) No. % Survival SE 1 1777 92 1 3 1380 85 1 5 993 79 1 10 349 64 1 12 151 57 2 No.=Number at risk SE=standard error Figure 5.5.2: Graft Survival, 1994-2007 same intervals for live donor grafts.
Table 5.5.3: Patient Survival by Type of Transplant, 1994-2007
Cum
ulat
ive
surv
ival
Duration in years0 2 4 6 8 10 12
0.00
0.25
0.50
0.75
1.00

Fourth Report of the National Transplant Registry 2007 RENAL TRANSPLANTATION
117
Cum
ulat
ive
surv
ival
Duration in years 0 2 4 6 8 10 12
0.00
0.25
0.50
0.75
1.00
Commercial cadaver
Commercial live donor
Live donor
Cadaver
Outcomes of renal transplantation from the 4 donor groups are shown in respect to patient and graft survival in the Kaplan Meier survival graphs in Figures 5.5.3 and 5.5.4 respectively. In terms of patient survival, live donor grafts maintained the best survival rates with 97%, 95%, 94% and 90% at years 1, 3, 5 and 10 respectively. In terms of graft survival, commercial cadaver grafts performed similarly well with a survival of 94%, 89%, 82% and 70% at year 1, 3, 5 and 10 compared to 92%, 88%, 83% and 69% for the same intervals for live donor grafts. Table 5.5.3: Patient Survival by Type of Transplant, 1994-2007 Type of Transplant Commercial Cadaver Commercial Live
Donor Live Donor Cadaver
Interval (years) No. %
Survival SE No. %Survival SE No. %
Survival SE No. %Survival SE
1 997 96 1 212 96 1 395 96 1 146 84 3 3 770 92 1 174 90 2 312 95 1 104 79 3 5 500 88 1 144 87 2 254 94 1 80 75 3 10 161 82 2 86 70 4 91 91 2 7 70 4 12 34 77 3 70 65 4 45 87 3 2 - - No.=Number at risk SE=standard error
Figure 5.5.3: Patient Survival by Type of Transplant, 1994-2007
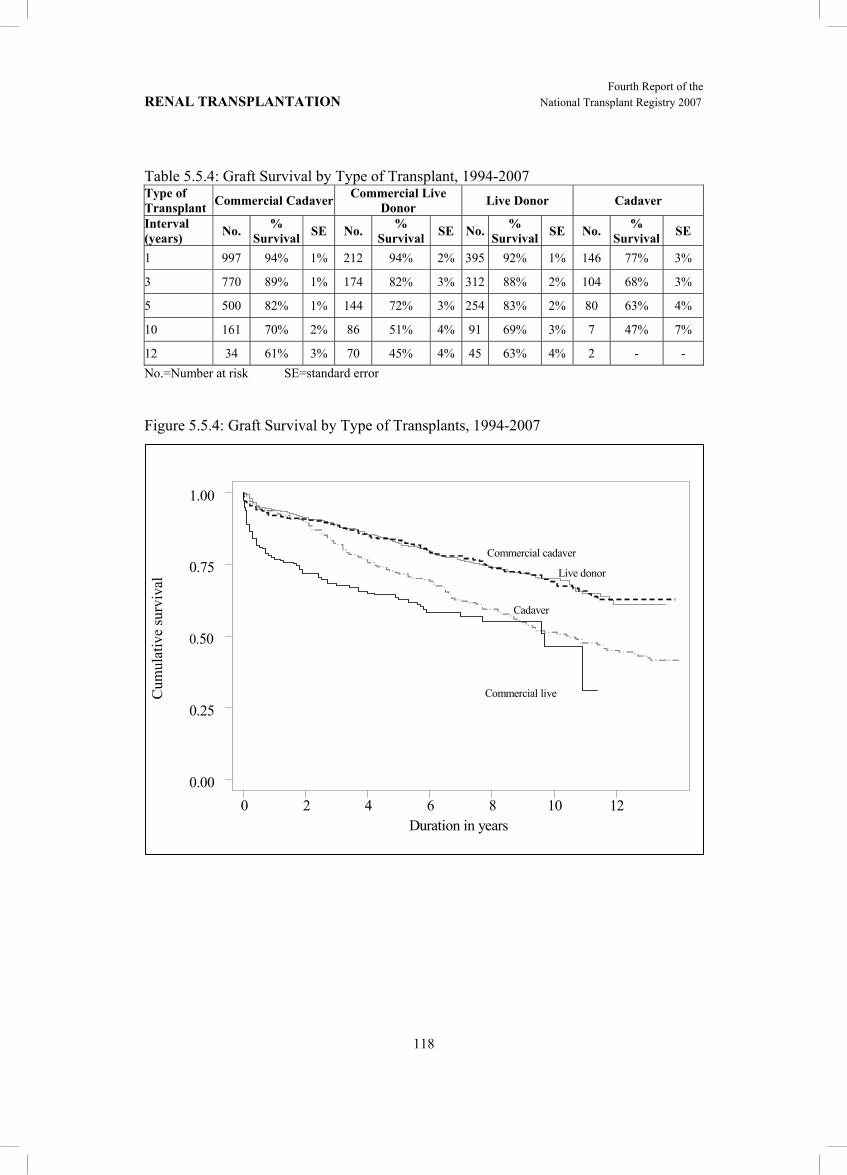
Fourth Report of the RENAL TRANSPLANTATION National Transplant Registry 2007
118
Table 5.5.4: Graft Survival by Type of Transplant, 1994-2007 Type of Transplant Commercial Cadaver Commercial Live
Donor Live Donor Cadaver
Interval (years) No. %
Survival SE No. %Survival SE No. %
Survival SE No. %Survival SE
1 997 94% 1% 212 94% 2% 395 92% 1% 146 77% 3%
3 770 89% 1% 174 82% 3% 312 88% 2% 104 68% 3%
5 500 82% 1% 144 72% 3% 254 83% 2% 80 63% 4%
10 161 70% 2% 86 51% 4% 91 69% 3% 7 47% 7%
12 34 61% 3% 70 45% 4% 45 63% 4% 2 - - No.=Number at risk SE=standard error Figure 5.5.4: Graft Survival by Type of Transplants, 1994-2007
Cum
ulat
ive
surv
ival
Duration in years 0 2 4 6 8 10 12
0.00
0.25
0.50
0.75
1.00
Commercial cadaver
Commercial live
Live donor
Cadaver
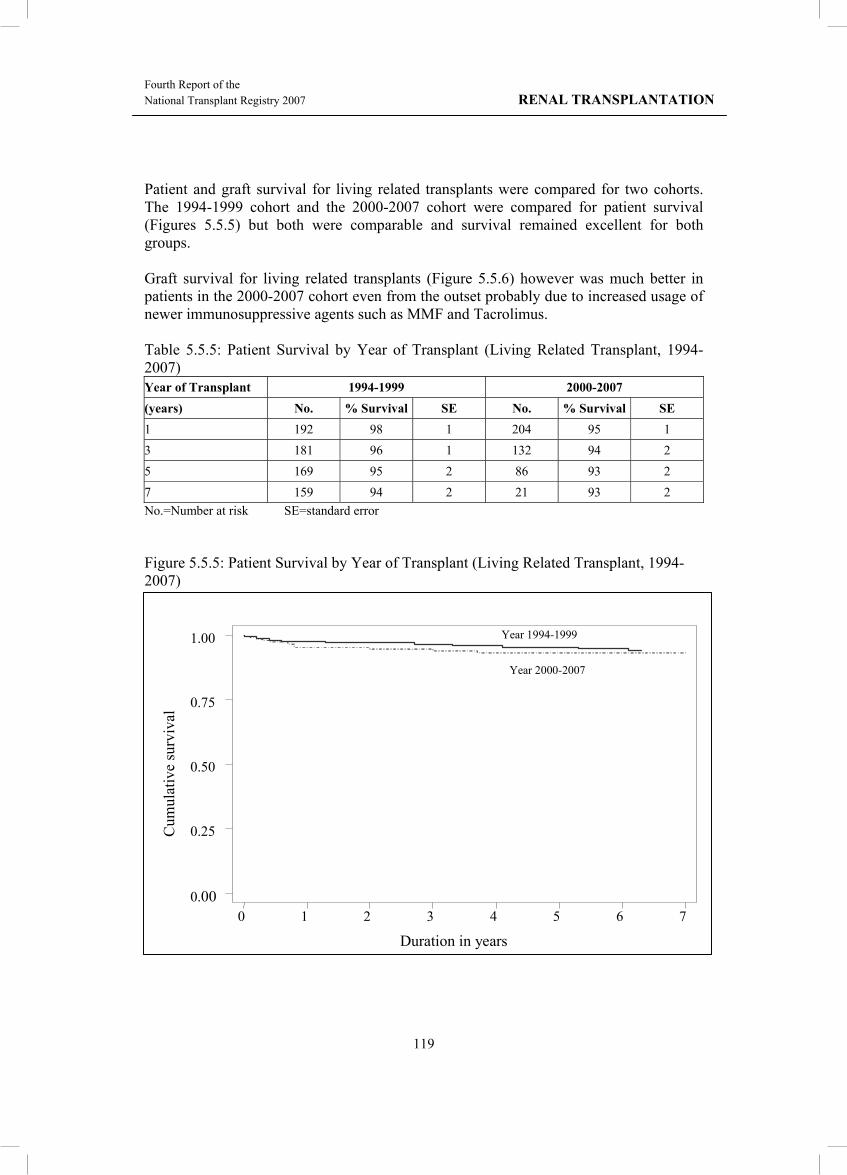
Fourth Report of the National Transplant Registry 2007 RENAL TRANSPLANTATION
119
Patient and graft survival for living related transplants were compared for two cohorts. The 1994-1999 cohort and the 2000-2007 cohort were compared for patient survival (Figures 5.5.5) but both were comparable and survival remained excellent for both groups. Graft survival for living related transplants (Figure 5.5.6) however was much better in patients in the 2000-2007 cohort even from the outset probably due to increased usage of newer immunosuppressive agents such as MMF and Tacrolimus. Table 5.5.5: Patient Survival by Year of Transplant (Living Related Transplant, 1994-2007) Year of Transplant 1994-1999 2000-2007 (years) No. % Survival SE No. % Survival SE 1 192 98 1 204 95 1 3 181 96 1 132 94 2 5 169 95 2 86 93 2 7 159 94 2 21 93 2 No.=Number at risk SE=standard error
Figure 5.5.5: Patient Survival by Year of Transplant (Living Related Transplant, 1994-2007)
Cum
ulat
ive
surv
ival
Duration in years 0 1 2 3 4 5 6 7
0.00
0.25
0.50
0.75
1.00 Year 1994-1999
Year 2000-2007

Fourth Report of the RENAL TRANSPLANTATION National Transplant Registry 2007
120
Table 5.5.6: Graft Survival by Year of Transplant (Living Related Transplant, 1994-2007) Year of Transplant 1994-1999 2000-2007 (years) No. % Survival SE No. % Survival SE 1 192 91 2 204 93 2 3 181 86 2 132 91 2 5 169 81 3 86 87 3 7 159 76 3 21 80 4 SE=standard error
Figure 5.5.6: Graft Survival by Year of Transplant (Living Related Transplant, 1994-2007)
Cum
ulat
ive
surv
ival
Duration in years
0 1 2 3 4 5 6 7 0.00
0.25
0.50
0.75
1.00
Year 1994-1999
Year 2000-2007

Fourth Report of the National Transplant Registry 2007 RENAL TRANSPLANTATION
121
In terms of commercial cadaveric transplantation, the comparison between the 1994-1999 cohort and 2000 – 2007 cohort was performed. Both patient and graft survival showed comparable results to living related transplants done within the country.
Table 5.5.7: Patient Survival by Year of Transplant (Commercial Cadaver Transplant,1994-2007)Year of Transplant 1994-1999 2000-2007 (years) No. % Survival SE No. % Survival SE 1 335 95 1 663 96 1 3 317 92 1 453 92 1 5 289 88 2 211 87 2 7 262 85 2 59 85 2 No.=Number at risk SE=standard error
Figure 5.5.7: Patient Survival by Year of Transplant (Commercial Cadaver Transplant, 1994-2007)
Cum
ulat
ive
surv
ival
Duration in years 0 1 2 3 4 5 6 7
0.00
0.25
0.50
0.75
1.00
Year 1994-1999
Year 2000-2007

Fourth Report of the RENAL TRANSPLANTATION National Transplant Registry 2007
122
Table 5.5.8: Graft Survival by Year of Transplant (Commercial Cadaver Transplant, 1994-2007) Year of Transplant 1994-1999 2000-2007 Interval (years) No. % Survival SE No. % Survival SE 1 335 93 1 663 94 1 3 317 89 2 453 89 1 5 289 81 2 211 83 2 7 262 74 2 59 78 3 No.=Number at risk SE=standard error
Figure 5.5.8: Graft Survival by Year of Transplant (Commercial Cadaver Transplant, 1994-2007)
Cum
ulat
ive
surv
ival
Duration in years 0 1 2 3 4 5 6 7
0.00
0.25
0.50
0.75
1.00
Year 1994-1999
Year 2000-2007

Fourth Report of the National Transplant Registry 2007 RENAL TRANSPLANTATION
123
SECTION 5.6 CARDIOVASCULAR RISK IN RENAL TRANSPLANT RECIPIENTS
5.6.1 Risk Factors for Ischaemic Heart Disease
In 2007, 89.7% of patients were hypertensive, 21.7% were diabetic and 49.8% had renal insufficiency fulfilling CKD III and above. Forty-five percent of patients had 2 cardiovascular risk factors while 8.3% had all 3 major risk factors.
Table 5.6.1: Risk Factors for IHD in Renal Transplant Recipients at Year 2005, 2006 and 2007 2005 2006 2007 Diabetes 19 (1.2) 21 (1.4) 25 (1.6) Hypertension** 511 (33.4) 456 (31.2) 590 (37.5) CKD 142 (9.3) 177 (12.1) 126 (8.0) Diabetes + Hypertension** 160 (10.4) 154 (10.5) 174 (11.1) Diabetes + CKD 20 (1.3) 18 (1.2) 11 (0.7) CKD + Hypertension** 538 (35.1) 490 (33.5) 517 (32.8) Diabetes + CKD + Hypertension** 142 (9.3) 147 (10.0) 131 (8.3) **Hypertension: BP systolic > 140 and BP diastolic > 90 OR have either Beta blocker / Calcium channel blocker / ACE inhibitor / AIIRB / Other anti-hypertensive drugs GFR (mL/min/1.73m2) = 1.2*(140-age(year))*weight(kg) / creatinine (μmol/L) if male GFR (mL/min/1.73m2) = 0.85*(1.2*(140-age(year))*weight(kg) / creatinine (μmol/L) if female CKD stage III-GFR, 30-60 CKD stage IV-GFR, 15-30 CKD stage V-GFR, <15
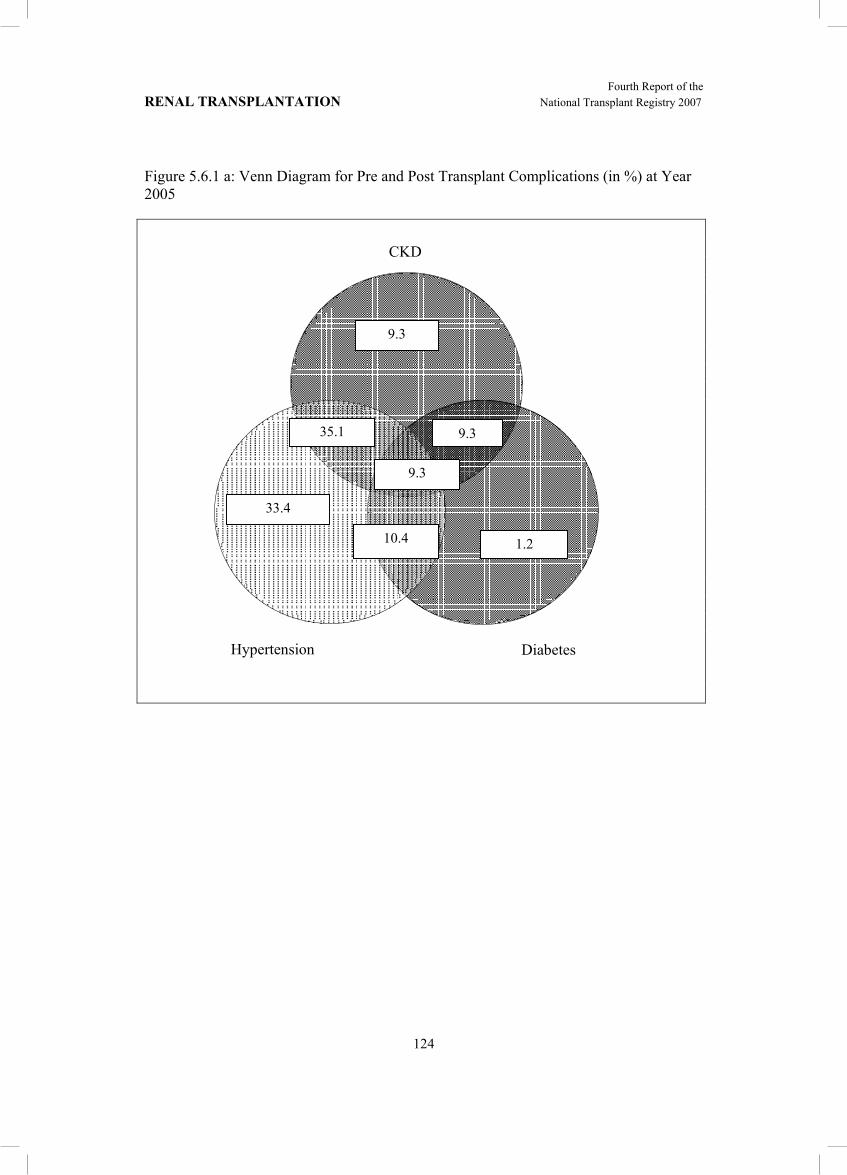
Fourth Report of the RENAL TRANSPLANTATION National Transplant Registry 2007
124
Figure 5.6.1 a: Venn Diagram for Pre and Post Transplant Complications (in %) at Year 2005
CKD
Diabetes
9.3
1.2
33.4
9.3 35.1
10.4
9.3
Hypertension

Fourth Report of the National Transplant Registry 2007 RENAL TRANSPLANTATION
125
Figure 5.6.1 b: Venn Diagram for Pre and Post Transplant Complications (in %) at Year 2006
CKD
12.1
31.2 1.4 10.5
33.5 1.2
10.0
Diabetes Hypertension

Fourth Report of the RENAL TRANSPLANTATION National Transplant Registry 2007
126
Figure 5.6.1 c: Venn Diagram for Pre and Post Transplant Complications (in %) at Year 2007
CKD
8.0
37.5 1.6 11.1
0.7 32.8
8.3
Hypertension Diabetes

Fourth Report of the National Transplant Registry 2007 RENAL TRANSPLANTATION
127
5.6.2 Blood Pressure classification according to JNC VI criteria, 2005, 2006, and 2007 In 2007, 24.3% of renal transplant recipients had stage I hypertension whereas 5.9% had stage II hypertension and 1% had stage III hypertension despite being on treatment. In terms of diastolic hypertension 15.5% had stage I hypertension, 2.3% of patients had stage II diastolic hypertension and 0.3% of patients had stage III diastolic hypertension despite being on treatment.
Table 5.6.2 a: Distribution of Patients by Systolic BP Levels, 2005-2007 2005 2006 2007
No. (%) No. (%) No. (%) Systolic BP<120 233 (14.25) 249 (15.64) 239 (14.18) Systolic BP <130 318 (19.45) 395 (24.81) 392 (23.26) Systolic BP 130-139 475 (29.05) 483 (30.34) 529 (31.39) Systolic BP 140-159 452 (27.65) 353 (22.17) 409 (24.27) Systolic BP 160-179 133 (8.13) 93 (5.84) 99 (5.88) Systolic BP >=180 24 (1.47) 19 (1.19) 17 (1.01) Figure 5.6.2 a: Distribution of Patients by Systolic BP Levels, 2005-2007
Perc
enta
ge o
f pat
ient
s (%
)
Year
0
10
20
30
40
50
60
70
80
90
100
Systolic BP <120 Systolic BP <130 Systolic BP 130-139 Systolic BP 140-159 Systolic BP 160-179 Systolic BP ≥180
2005 2006 2007

Fourth Report of the RENAL TRANSPLANTATION National Transplant Registry 2007
128
Table 5.6.2 b: Distribution of Patients by Diastolic BP Levels, 2005-2007 Year 2005 2006 2007
No. (%) No. (%) No. (%) Diastolic BP<80 522 (31.93) 624 (39.20) 697 (41.36) Diastolic BP <85 657 (40.18) 586 (36.81) 609 (36.14) Diastolic BP 85-89 73 (4.46) 73 (4.59) 74 (4.39) Diastolic BP 90-99 308 (18.84) 244 (15.33) 261 (15.49) Diastolic BP 100-109 65 (3.98) 61 (3.83) 39 (2.31) Diastolic BP ≥110 10 (0.61) 4 (0.25) 5 (0.30)
Figure 5.6.2 b: Distribution of Patients by Diastolic BP Levels, 2005-2007
Perc
enta
ge o
f pat
ient
s (%
)
Year0
10
20
30
40
50
60
70
80
90
100
Diastolic BP <80 Diastolic BP <85 Diastolic BP 85-89 Diastolic BP 90-99 Diastolic BP 100-109 Diastolic BP ≥110
2005 2006 2007

Fourth Report of the National Transplant Registry 2007 RENAL TRANSPLANTATION
129
Table 5.6.3 shows the CKD Stage classification by year and in 2007, 45.5% of renal transplant recipients had CKD Stage III whilst another 6.8% had CKD Stage IV. CKD Stage V (impending renal replacement therapy) was found in 1.4% of renal transplant recipients.
Table 5.6.3: Distribution of Patients by CKD Stages, 2005-2007 2005 2006 2007
No. (%) No. (%) No. (%)
CKD stage 1 118 (7.25) 116 (7.33) 180 (10.80)
CKD stage 2 579 (35.59) 534 (33.73) 593 (35.57)
CKD stage 3 799 (49.11) 804 (50.79) 758 (45.47)
CKD stage 4 112 (6.88) 107 (6.76) 113 (6.78)
CKD stage 5 19 (1.17) 22 (1.39) 23 (1.38)
Figure 5.6.3: Distribution of Patients by CKD Stages, 2005-2007
Perc
enta
ge o
f pat
ient
s (%
)
Year 0
10
20
30
40
50
60
70
80
90
100
CKD Stage 1 CKD Stage 2 CKD Stage 3 CKD Stage 4 CKD Stage 5
2005 2006 2007
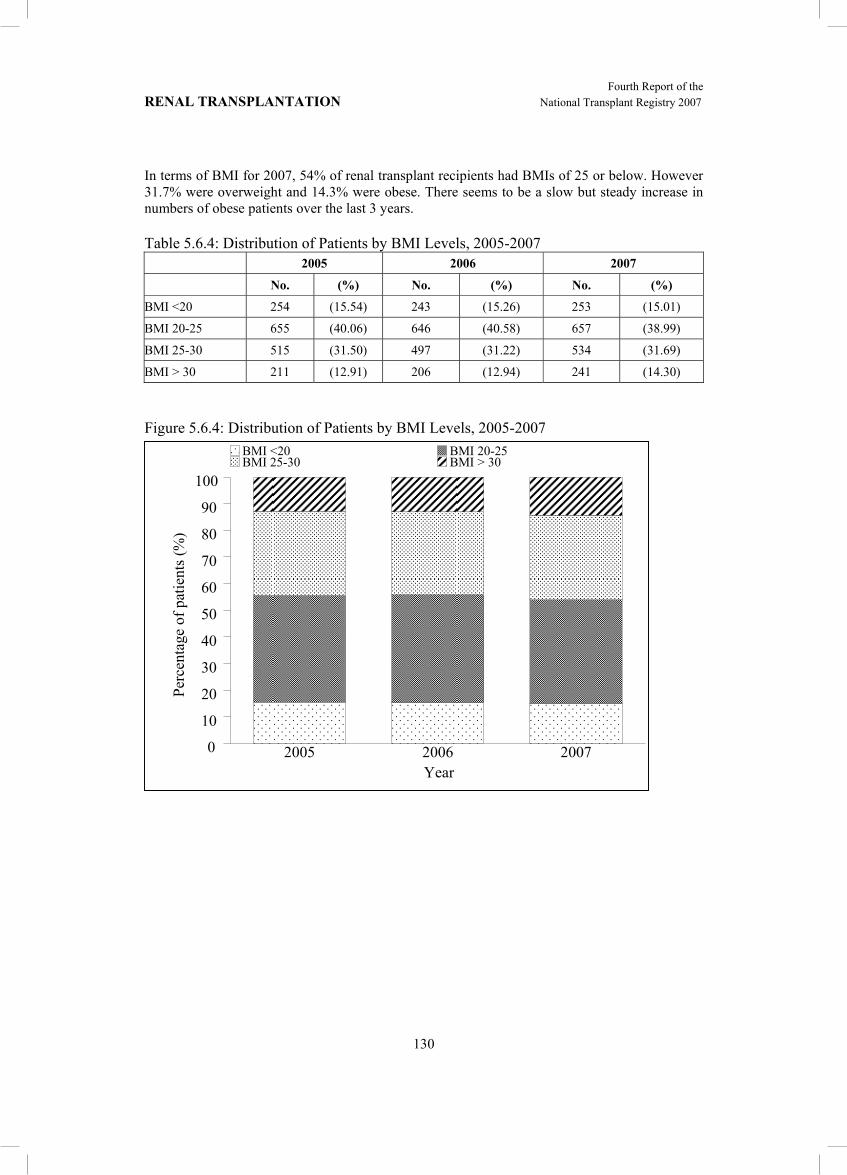
Fourth Report of the RENAL TRANSPLANTATION National Transplant Registry 2007
130
In terms of BMI for 2007, 54% of renal transplant recipients had BMIs of 25 or below. However 31.7% were overweight and 14.3% were obese. There seems to be a slow but steady increase in numbers of obese patients over the last 3 years. Table 5.6.4: Distribution of Patients by BMI Levels, 2005-2007 2005 2006 2007
No. (%) No. (%) No. (%)
BMI <20 254 (15.54) 243 (15.26) 253 (15.01)
BMI 20-25 655 (40.06) 646 (40.58) 657 (38.99)
BMI 25-30 515 (31.50) 497 (31.22) 534 (31.69)
BMI > 30 211 (12.91) 206 (12.94) 241 (14.30) Figure 5.6.4: Distribution of Patients by BMI Levels, 2005-2007
Perc
enta
ge o
f pat
ient
s (%
)
Year0
10
20
30
40
50
60
70
80
90
100
BMI <20 BMI 20-25 BMI 25-30 BMI > 30
2005 2006 2007

Fourth Report of the National Transplant Registry 2007 RENAL TRANSPLANTATION
131
LDL cholesterol has been identified as the primary lipid target for prevention of coronary heart disease by NCEP with a log linear relationship between risk of CHD and level of LDL cholesterol. In terms of renal transplant recipients in 2007 31% have LDL levels below 2.6 mol/l and this shows an increasing trend from 18.1% in 2004, possibly due to the more widespread use of statins. Whether or not this translates into less cardiovascular mortality in the transplant population is still questionable. Patients with serum LDL >3.4 remained fairly static during the study period at 22.6%.
Table 5.6.5 a: Distribution of Patinets by LDL Levels, 2005-2007 2005 2006 2007
No. (%) No. (%) No. (%) LDL < 2.6 418 (25.57) 492 (30.90) 527 (31.28) LDL 2.6-3.4 862 (52.72) 738 (46.36) 777 (46.11) LDL ≥ 3.4 355 (21.71) 362 (22.74) 381 (22.61)
Figure 5.6.5a: Distribution of Patients by LDL Levels, 2005-2007
Perc
enta
ge o
f pat
ient
s (%
)
Year
LDL <2.6 LDL 2.6-3.4 LDL ≥ 3.4
2005 2006 2007 0
10
20
30
40
50
60
70
80
90
100

Fourth Report of the RENAL TRANSPLANTATION National Transplant Registry 2007
132
In terms of other cholesterol parameters for 2007, 55.6% had total cholesterol levels more than 5.2 and 6.4% had HDL cholesterol levels <1.0.
Table 5.6.5 b: Distribution of Patients by Total Cholesterol Levels, 2005-2007 Year 2005 2006 2007
No. (%) No. (%) No. (%) Total Cholesterol <4.1 159 (9.72) 160 (10.05) 210 (12.46) Total Cholesterol 4.1-5.1 455 (27.83) 490 (30.78) 539 (31.99) Total Cholesterol 5.1-6.2 774 (47.34) 700 (43.97) 717 (42.55) Total Cholesterol 6.2- 7.2 173 (10.58) 173 (10.87) 159 (9.44) Total Cholesterol > 7.2 74 (4.53) 69 (4.33) 60 (3.56) Figure 5.6.5b: Distribution of Patients by Total Cholesterol Levels, 2005-2007
Perc
enta
ge o
f pat
ient
s (%
)
Year0
10
20
30
40
50
60
70
80
90
100
Total Cholesterol <4.1 Total Cholesterol 4.1-5.1 Total Cholesterol 5.1-6.2 Total Cholesterol 6.2-7.2 Total Cholesterol > 7.2
2005 2006 2007

Fourth Report of the National Transplant Registry 2007 RENAL TRANSPLANTATION
133
Table 5.6.5 c: Distribution of Patients by HDL Levels, 2005-2007 Year 2005 2006 2007
No. (%) No. (%) No. (%) HDL <1 118 7.22 104 6.53 108 6.41 HDL 1-1.3 308 18.84 302 18.96 350 20.77 HDL >1.3 1209 73.94 1186 74.50 1227 72.82 Figure 5.6.5c: Distribution of Patients by HDL Levels, 2005-2007
Perc
enta
ge o
f pat
ient
s (%
)
Year0
10
20
30
40
50
60
70
80
90
100
HDL <1 HDL 1-1.3 HDL > 1.3
2005 2006 2007
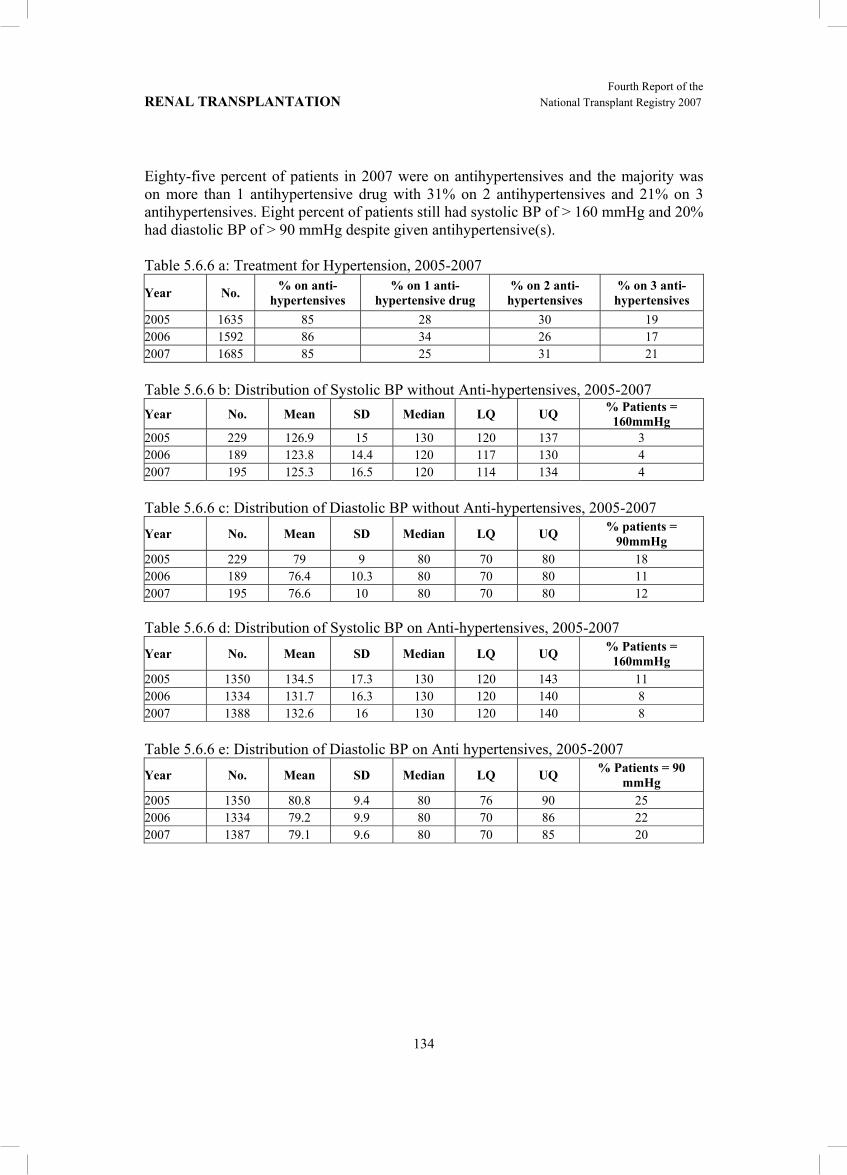
Fourth Report of the RENAL TRANSPLANTATION National Transplant Registry 2007
134
Eighty-five percent of patients in 2007 were on antihypertensives and the majority was on more than 1 antihypertensive drug with 31% on 2 antihypertensives and 21% on 3 antihypertensives. Eight percent of patients still had systolic BP of > 160 mmHg and 20% had diastolic BP of > 90 mmHg despite given antihypertensive(s). Table 5.6.6 a: Treatment for Hypertension, 2005-2007
Year No. % on anti-hypertensives
% on 1 anti-hypertensive drug
% on 2 anti-hypertensives
% on 3 anti-hypertensives
2005 1635 85 28 30 19 2006 1592 86 34 26 17 2007 1685 85 25 31 21 Table 5.6.6 b: Distribution of Systolic BP without Anti-hypertensives, 2005-2007 Year No. Mean SD Median LQ UQ % Patients =
160mmHg 2005 229 126.9 15 130 120 137 3 2006 189 123.8 14.4 120 117 130 4 2007 195 125.3 16.5 120 114 134 4 Table 5.6.6 c: Distribution of Diastolic BP without Anti-hypertensives, 2005-2007 Year No. Mean SD Median LQ UQ % patients =
90mmHg 2005 229 79 9 80 70 80 18 2006 189 76.4 10.3 80 70 80 11 2007 195 76.6 10 80 70 80 12 Table 5.6.6 d: Distribution of Systolic BP on Anti-hypertensives, 2005-2007 Year No. Mean SD Median LQ UQ % Patients =
160mmHg 2005 1350 134.5 17.3 130 120 143 11 2006 1334 131.7 16.3 130 120 140 8 2007 1388 132.6 16 130 120 140 8 Table 5.6.6 e: Distribution of Diastolic BP on Anti hypertensives, 2005-2007 Year No. Mean SD Median LQ UQ % Patients = 90
mmHg 2005 1350 80.8 9.4 80 76 90 25 2006 1334 79.2 9.9 80 70 86 22 2007 1387 79.1 9.6 80 70 85 20

Fourth Report of the National Transplant Registry 2007 RENAL TRANSPLANTATION
135
SECTION 5.7 QOL INDEX SCORE IN RENAL TRANSPLANT RECIPIENTS 1151 patients who were transplanted between 1998 and 2007 were analysed for QoL index score. They reported median QoL index score of 10 (Table 5.7.1 and Figure 5.7.1). It was interesting to note that for those who underwent renal transplantation between this period, diabetics and non-diabetics had the same median QoL index score of 10 (Table 5.7.2 and Figure 5.7.2), and this is in contrast to HD and CAPD patients where diabetics reported lower QoL index score than non-diabetics. There was also no difference seen between gender (Table 5.7.3 and Figure 5.7.3) and age (Table 5.7.4 and Figure 5.7.4). It is worthwhile to note that those above 60 years old also enjoyed the same QoL index score (10) as their younger counterparts (Table 5.7.4 and Figure 5.7.4). This trend of high QoL index score among renal transplant patients was maintained over the last 10 years (Table 5.7.5 and Figure 5.7.5). Table 5.7.1: Cumulative Distribution of QoL-Index Score Transplant Recipient Patients 1998 - 2007 Dialysis modality TX Number of patients 1151 Centile 0 0 0.05 9 0.1 10 0.25 (LQ) 10 0.5 (median) 10 0.75 (UQ) 10 0.9 10 0.95 10 1 10

Fourth Report of the RENAL TRANSPLANTATION National Transplant Registry 2007
136
Figure 5.7.1: Cumulative Distribution of QoL-Index Score Transplant Recipient Patients 1998 - 2007
0
.2
.4
.6
.8
10
Cum
ulat
ive
Dis
tribu
tion
0 2 4 6 8 10 QL-Index Score
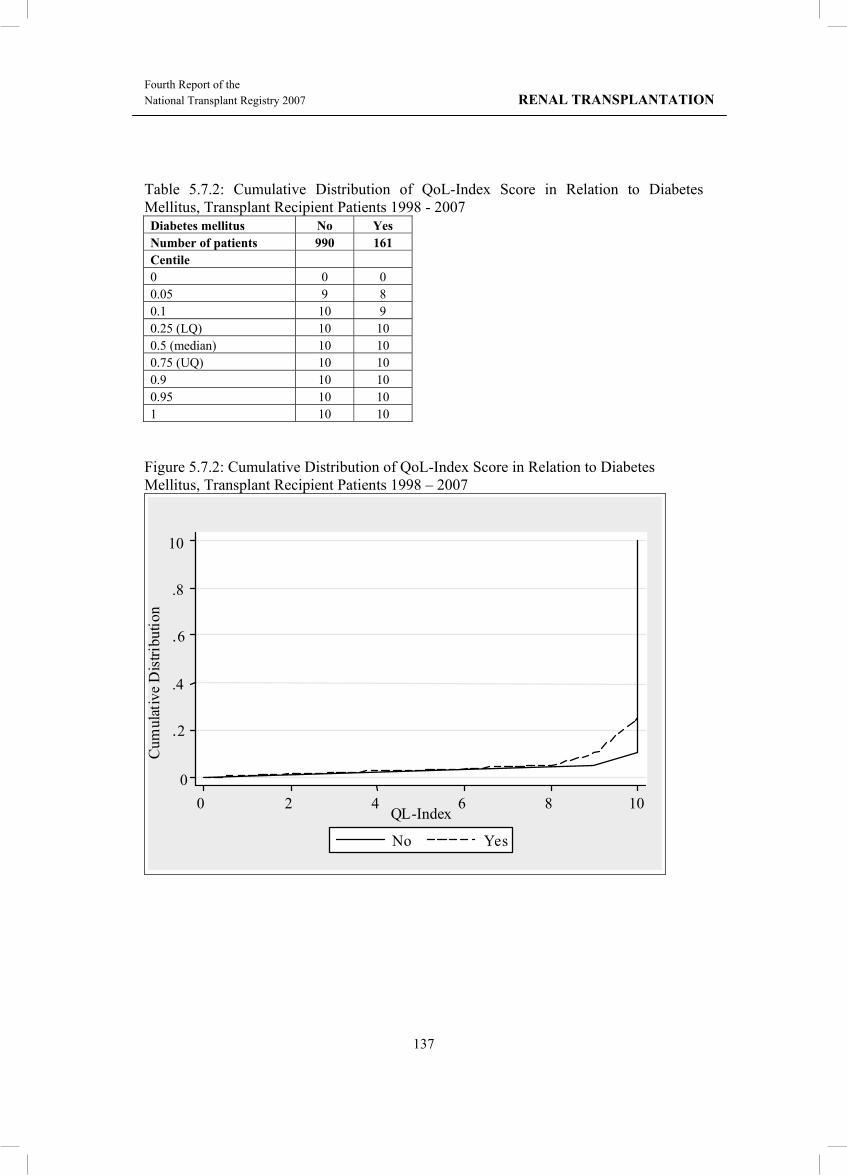
Fourth Report of the National Transplant Registry 2007 RENAL TRANSPLANTATION
137
Table 5.7.2: Cumulative Distribution of QoL-Index Score in Relation to Diabetes Mellitus, Transplant Recipient Patients 1998 - 2007 Diabetes mellitus No Yes Number of patients 990 161 Centile 0 0 0 0.05 9 8 0.1 10 9 0.25 (LQ) 10 10 0.5 (median) 10 10 0.75 (UQ) 10 10 0.9 10 10 0.95 10 10 1 10 10
Figure 5.7.2: Cumulative Distribution of QoL-Index Score in Relation to Diabetes Mellitus, Transplant Recipient Patients 1998 – 2007
0
.2
.4
.6
.8
10
Cum
ulat
ive
Dis
tribu
tion
0 2 4 6 8 10 QL-Index
No Yes

Fourth Report of the RENAL TRANSPLANTATION National Transplant Registry 2007
138
Table 5.7.3: Cumulative Distribution of QoL-Index Score in Relation to Gender, Transplant Recipient Patients 1998-2007 Gender Male Female Number of patients 722 429 Centile 0 0 0 0.05 9 9 0.1 10 9 0.25 (LQ) 10 10 0.5 (median) 10 10 0.75 (UQ) 10 10 0.9 10 10 0.95 10 10 1 10 10
Figure 5.7.3: Cumulative Distribution of QoL-Index Score in Relation to Gender, Transplant Recipient Patients 1998 – 2007
0
.2
.4
.6
.8
10
Cum
ulat
ive
Dis
tribu
tion
0 2 4 6 8 10 QL-Index
Male Female

Fourth Report of the National Transplant Registry 2007 RENAL TRANSPLANTATION
139
Table 5.7.4: Cumulative Distribution of QoL-Index Score in Relation to Age, Transplant Recipient Patients 1998 – 2007 Age group (years) <20 20-39 40-59 ≥60 Number of patients 99 464 516 72 Centile 0 0 0 0 0 0.05 9 9 9 7 0.1 10 10 9 8 0.25 (LQ) 10 10 10 9 0.5 (median) 10 10 10 10 0.75 (UQ) 10 10 10 10 0.9 10 10 10 10 0.95 10 10 10 10 1 10 10 10 10
Figure 5.7.4: Cumulative Distribution of QoL-Index Score in Relation to Age, Transplant Recipient Patients 1998 – 2007
0
.2
.4
.6
.8
10
Cum
ulat
ive
Dis
tribu
tion
0 2 4 6 8 10 QL-Index
Age <20 Age 20-39 Age 40-59
Age ≥60

Fourth Report of the RENAL TRANSPLANTATION National Transplant Registry 2007
140
Table 5.7.5: Cumulative Distribution of QoL-Index Score in Relation to Year of Entry, Transplant Recipient Patients 1998 – 2007 Year of Entry 1998 1999 2000 2001 2002 2003 2004 2005 2006 2007 Number of patients 72 101 110 125 143 136 167 137 123 37 Centile 0 0 0 0 0 0 0 0 0 0 0 0.05 10 9 8 9 9 8 9 9 9 6 0.1 10 10 10 10 10 9 10 10 10 6 0.25 (LQ) 10 10 10 10 10 10 10 10 10 10 0.5 (median) 10 10 10 10 10 10 10 10 10 10 0.75 (UQ) 10 10 10 10 10 10 10 10 10 10 0.9 10 10 10 10 10 10 10 10 10 10 0.95 10 10 10 10 10 10 10 10 10 10 1 10 10 10 10 10 10 10 10 10 10
Figure 5.7.5: Cumulative Distribution of QoL-Index score in Relation to Year of Entry, Transplant Recipient Patients 1998 – 2007
Cum
ulat
ive
Dis
tribu
tion
Year 1998
Year 2000
Year 2002
Year 2004
Year 2006
Year 1999
Year 2001
Year 2003
Year 2005
Year 2007
QL-Index Score
141
CHAPTER 6
HOMOGRAFT - HEART VALVE TRANSPLANTATION
Editor: Mr Mohamed Ezani Hj Md Taib
Contents
6.0 Introduction
6.1 Stock and Flow
6.2 Recipients’ Characteristics Demographics
6.3 Transplant Practices
Donor Details Type of Transplant
6.4 Transplant Outcomes
Patient Survival

142
HOMOGRAFT – HEART VALVE TRANSPLANTATION
Fourth Report of the National Transplant Registry 2007
List of Tables Table 6.1.1: Stock and Flow, 1996-2007 ..................................................................... 144 Table 6.2.1: Distribution of Patients by Gender, 1996-2007 ....................................... 145 Table 6.2.2: Distribution of Patients by Ethnic Group, 1996-2007 ............................. 146 Table 6.2.3: Distribution of Patients by Age, 1996-2007 ............................................ 147 Table 6.3.1: Number of Valves Harvested by Type of Homograft, 1996-2007 .......... 148 Table 6.3.2: Type of Transplant, 1996-2007 ............................................................... 148 Table 6.4.1: Patient Survival by Gender, 1996-2007 ................................................... 149 Table 6.4.2: Patient Survival by Age Group, 1996-2007 ............................................. 150 Table 6.4.3: Patient Survival by Type of Homograft, 1996-2007 ............................... 151 List of Figures Figure 6.1.1: Stock and Flow, 1996-2007 .................................................................... 144 Figure 6.2.1: Distribution of Patients by Gender, 1996-2007 ...................................... 145 Figure 6.2.2: Distribution of Patients by Ethnic Group, 1996-2007 ............................ 146 Figure 6.2.3: Distribution of Patients by Age, 1996-2007 ........................................... 147 Figure 6.3.2: Type of Transplant, 1996-2007 .............................................................. 148 Figure 6.4.1: Patient Survival by Gender, 1996-2007 ................................................. 149 Figure 6.4.2: Patient Survival by Age Group, 1996-2007 ........................................... 150 Figure 6.4.3: Patient Survival by Type of Homograft, 1996-2007 .............................. 151

143
Fourth Report of the National Transplant Registry 2007
HOMOGRAFT - HEART VALVE TRANSPLANTATION
6.0 INTRODUCTION The Homograft unit in Institut Jantung Negara (IJN) was established in 1995. This was in response to the rising need for homografts and also the rising cost of importing homografts from overseas. The team comprises of surgeons and medical technicians who are involved in retrieving, processing and cryopreserving the homografts for storage. They maintain a detailed record of each homograft obtained and utilised. Valvular homografts are used routinely in cardiac surgery especially for patients with congenital valvular heart disease. They are used as biological conduits to replace absent valves or to reconstruct outflow tracks in the heart. Homografts are superior to artificial valves due to their inherent traits such as superior perfusion parameters, durability, ease of handling and reduced risk of thrombo-embolic phenomenon. This removes the need for tight anticoagulation treatment post operatively and is extremely convenient for children and women of childbearing age in whom anticoagulation is contraindicated. Homografts have inherent resistance to infection and are preferred in an environment where sepsis is of concern. The continued efforts by the Ministry of Health in promoting organ and tissue donation have helped to improve the availability of homografts in the country. The efficient and better streamlining of organisation structure has improved networking between various hospitals and transplant units with better public and medical staff awareness.

144
HOMOGRAFT – HEART VALVE TRANSPLANTATION
Fourth Report of the National Transplant Registry 2007
6.1 STOCK AND FLOW Table 6.1.1: Stock and Flow, 1996-2007 Year 1996 1997 1998 1999 2000 2001 2002 2003 2004 2005 2006 2007 New transplant 4 32 22 17 13 20 22 21 9 3 4 5 Deaths* 1 0 4 3 0 3 3 2 3 0 0 0 Lost to follow up 0 0 0 0 0 0 0 0 0 0 0 0 Alive with functioning graft at 31st December 3 35 53 67 80 97 116 135 141 144 148 153 *based on year of death Figure 6.1.1: Stock and Flow, 1996-2007
Num
ber o
f pat
ient
s (n)
Year
0 10 20 30 40 50 60 70 80 90
100 110 120 130 140 150
New Alive at 31st Dec
1996 1997 1998 1999 2000 2001 2002 2003 2004 2005 2006 2007

145
Fourth Report of the National Transplant Registry 2007
HOMOGRAFT - HEART VALVE TRANSPLANTATION
6.2 RECIPIENTS’ CHARACTERISTICS Table 6.2.1: Distribution of Patients by Gender, 1996-2007 Year 1996 1997 1998 1999 2000 2001 2002 2003 2004 2005 2006 2007 TOTAL Gender No. No. No. No. No. No. No. No. No. No. No. No. No. Male 2 19 9 9 10 6 9 14 3 0 4 2 87 Female 2 13 13 8 3 14 13 7 6 3 0 3 85 TOTAL 4 32 22 17 13 20 22 21 9 3 4 5 172 Figure 6.2.1: Distribution of Patients by Gender, 1996-2007
Num
ber o
f pat
ient
s (n)
Year
0
2
4
6
8
10
12
14
16
18
20 Male Female
1996 1997 1998 1999 2000 2001 2002 2003 2004 2005 2006 2007

146
HOMOGRAFT – HEART VALVE TRANSPLANTATION
Fourth Report of the National Transplant Registry 2007
Table 6.2.2: Distribution of Patients by Ethnic Group, 1996-2007 Year 1996 1997 1998 1999 2000 2001 2002 2003 2004 2005 2006 2007 TOTAL Ethnic group No. No. No. No. No. No. No. No. No. No. No. No. No.
Malay 1 19 15 9 9 10 16 12 6 3 2 3 105 Chinese 3 11 4 3 2 9 4 6 1 0 1 0 44 Indian 0 2 2 2 0 1 2 2 1 0 1 0 13 Others 0 0 1 3 2 0 0 1 1 0 0 2 10 TOTAL 4 32 22 17 13 20 22 21 9 3 4 5 172 Figure 6.2.2: Distribution of Patients by Ethnic Group, 1996-2007
Num
ber o
f pat
ient
s (n)
Year
0
2
4
6
8
10
12
14
16
18
20
Malay Chinese Indian Others
1996 1997 1998 1999 2000 2001 2002 2003 2004 2005 2006 2007

147
Fourth Report of the National Transplant Registry 2007
HOMOGRAFT - HEART VALVE TRANSPLANTATION
Table 6.2.3: Distribution of Patients by Age, 1996-2007 Year 1996 1997 1998 1999 2000 2001 2002 2003 2004 2005 2006 2007 TOTAL Age group
No. No. No. No. No. No. No. No. No. No. No. No. No.
0-9 2 15 15 12 10 14 10 11 4 1 1 0 95 10-19 1 13 5 5 2 2 10 8 3 0 3 5 57 20-39 1 4 1 0 0 3 2 1 1 2 0 0 15 40-59 0 0 0 0 0 1 0 1 1 0 0 0 3 ≥60 0 0 1 0 1 0 0 0 0 0 0 0 2 TOTAL 4 32 22 17 13 20 22 21 9 3 4 5 172 Mean 12 11 11 7 12 11 10 12 15 15 10 11 11 SD 7 7 15 4 17 14 6 11 11 8 3 0 10 Median 11 10 8 7 8 5 10 9 10 20 11 11 10 Min
5 3
months 3
months 1 2 5
months 3 2 5 6 6 11 3
months Max 21 30 70 17 67 53 28 53 42 20 11 11 70 * Age=date of implantation – date birth
Figure 6.2.3: Distribution of Patients by Age, 1996-2007
Num
ber o
f pat
ient
s (n)
Year
0
2
4
6
8
10
12
14
16
0-9 years 10-19 years 20-39 years 40-59 years
1996 1997 1998 1999 2000 2001 2002 2003 2004 2005 2006 2007
≥60 years

148
HOMOGRAFT – HEART VALVE TRANSPLANTATION
Fourth Report of the National Transplant Registry 2007
6.3 TRANSPLANT PRACTICES 6.3.1 Donor Details Table 6.3.1: Number of Valves Harvested by Type of Homograft, 1996-2007 Year 1996 1997 1998 1999 2000 2001 2002 2003 2004 2005 2006 2007 TOTAL Type of homograft
No. No. No. No. No. No. No. No. No. No. No. No. No.
Aortic 8 17 10 8 11 14 10 8 7 4 15 9 121 Pulmonary 1 14 11 10 12 12 14 9 8 5 15 8 119 TOTAL 9 31 21 18 23 26 24 17 15 9 30 17 240 6.3.2 Transplant Details Table 6.3.2: Type of Transplant, 1996-2007 Year 1996 1997 1998 1999 2000 2001 2002 2003 2004 2005 2006 2007 TOTAL Type of transplant
No. No. No. No. No. No. No. No. No. No. No. No. No.
Aortic 4 19 11 7 7 9 10 10 4 1 1 2 85 Pulmonary 0 13 11 10 6 11 12 11 5 2 3 3 87 TOTAL 4 32 22 17 13 20 22 21 9 3 4 5 172 Figure 6.3.2: Type of Transplant, 1996-2007
Num
ber o
f pat
ient
s (n)
Year
0
2
4
6
8
10
12
14
16
18
20 Aortic Pulmonary
1996 1997 1998 1999 2000 2001 2002 2003 2004 2005 2006 2007
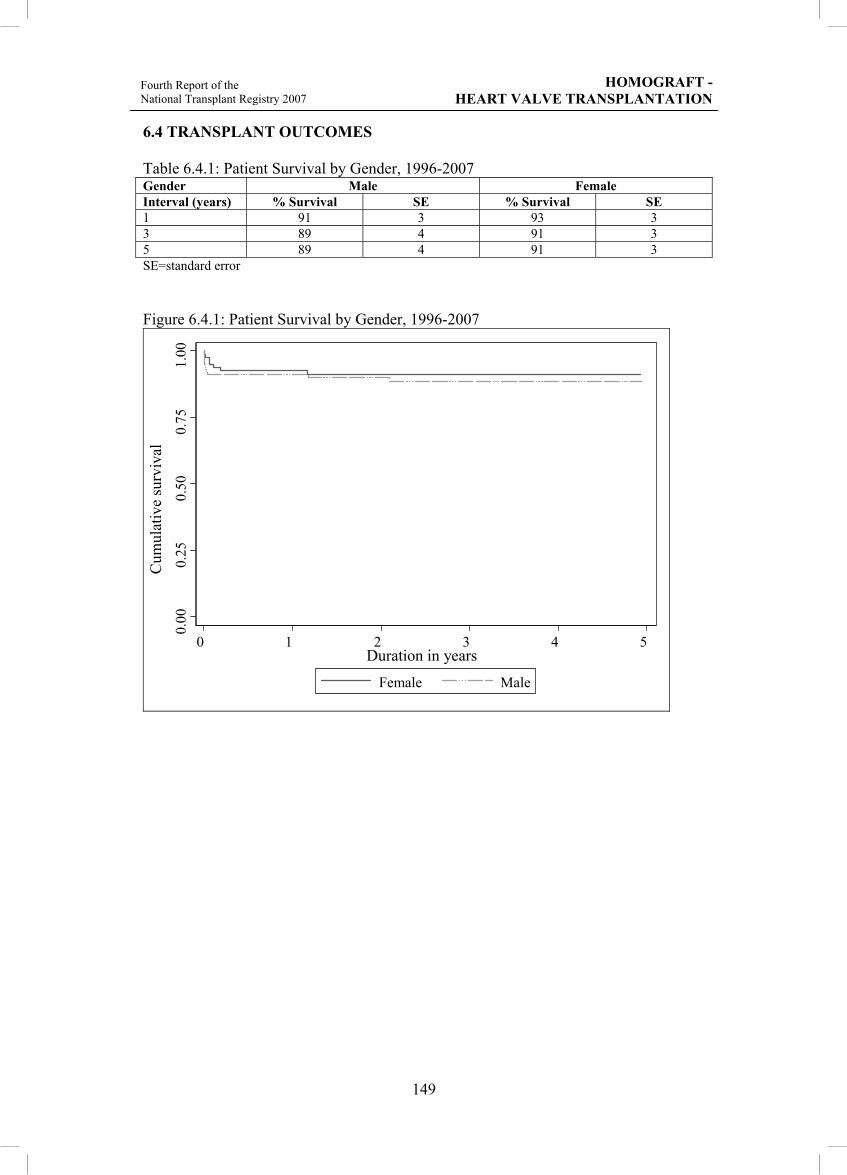
149
Fourth Report of the National Transplant Registry 2007
HOMOGRAFT - HEART VALVE TRANSPLANTATION
6.4 TRANSPLANT OUTCOMES Table 6.4.1: Patient Survival by Gender, 1996-2007 Gender Male Female Interval (years) % Survival SE % Survival SE 1 91 3 93 3 3 89 4 91 3 5 89 4 91 3 SE=standard error Figure 6.4.1: Patient Survival by Gender, 1996-2007
0.00
0.
25
0.50
0.
75
1.00
Cum
ulat
ive
surv
ival
0 1 2 3 4 5 Duration in years
Female Male
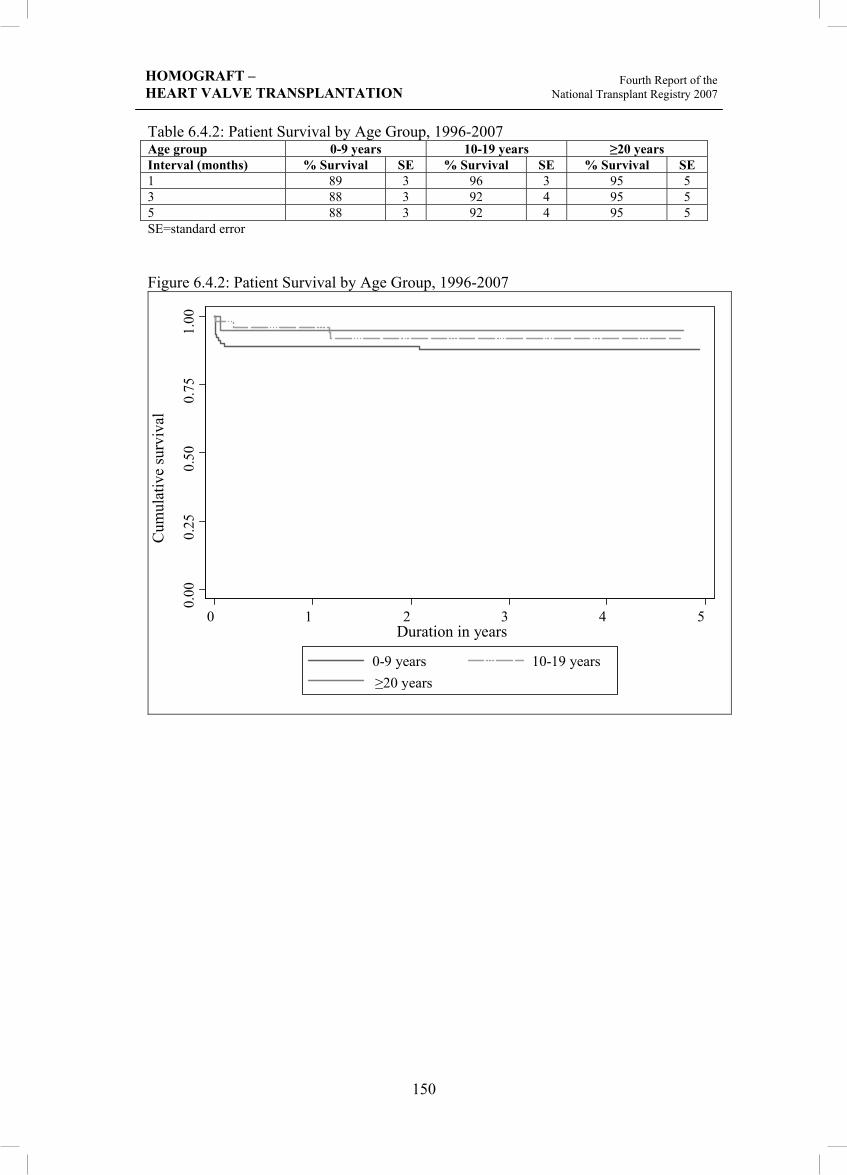
150
HOMOGRAFT – HEART VALVE TRANSPLANTATION
Fourth Report of the National Transplant Registry 2007
Table 6.4.2: Patient Survival by Age Group, 1996-2007 Age group 0-9 years 10-19 years ≥20 years Interval (months) % Survival SE % Survival SE % Survival SE 1 89 3 96 3 95 5 3 88 3 92 4 95 5 5 88 3 92 4 95 5 SE=standard error Figure 6.4.2: Patient Survival by Age Group, 1996-2007
0.00
0.
25
0.50
0.
75
1.00
Cum
ulat
ive
surv
ival
0 1 2 3 4 5Duration in years
0-9 years 10-19 years
≥20 years

151
Fourth Report of the National Transplant Registry 2007
HOMOGRAFT - HEART VALVE TRANSPLANTATION
Table 6.4.3: Patient Survival by Type of Homograft, 1996-2007 Type of homograft Aortic Pulmonary Interval (years) % Survival SE % Survival SE 1 93 3 91 3 3 89 4 91 3 5 89 4 91 3 SE=standard error Figure 6.4.3: Patient Survival by Type of Homograft, 1996-2007
0.00
0.
25
0.50
0.
75
1.00
C
umul
ativ
e su
rviv
al
0 1 2 3 4 5 Duration in years
Aortic Pulmonary


152
CHAPTER 7
BONE AND TISSUE TRANSPLANTATION
Editor: Dr Suzina Sheikh Ab Hamid
Expert Panel:
Prof Dr Zulmi Wan (Chairman) Dr Suzina Sheikh Ab Hamid Dr Badrul Shah Badaruddin Dato’ Dr Hasim Mohamad
Dr Norimah Yusof Dr Robert Penafort
Contents
7.0 Introduction
7.1 Stock of Bone, Amniotic Membrane and other Tissue Allografts and Hospitals Where Tissues are Utilised
7.2 Reporting Centres
7.3 Recipient Details
7.4 Pre Transplant Data
7.5 Transplant Surgery Data
153
BONE AND TISSUE TRANSPLANTATION Fourth Report of the
National Transplant Registry 2007
List of Tables Table 7.1.1: Types of Tissue Allografts Supplied by USM Tissue Bank in 2007 ....... 155 Table 7.1.2: Hospitals/Other Sectors Using Bone/Tendon Allografts in 2007 ............ 156 Table 7.1.3: Hospitals/Other Sectors Using Amniotic Membranes in 2007 ................ 157 Table 7.2.1: Distribution of Reporting Centre by Year ............................................... 158 Table 7.3.1: Distribution of Patients by Gender .......................................................... 159 Table 7.3.2: Distribution of Patients by Ethnic Group ................................................ 159 Table 7.3.3: Distribution of Patients by Age Group .................................................... 159 Table 7.3.4: Distribution of Patients by Diagnosis Warranting Tissue Graft
Transplantation ........................................................................................ 160 Table 7.4.1: Distribution of Patients According to Tissue Provider ............................ 161 Table 7.4.2: Distribution of Patients by Origin of Tissue Graft .................................. 161 Table 7.4.3: Distribution of Tissue Graft Used by Type ............................................. 161 Table 7.4.4: Distribution of Type of Sterilisation of the Graft .................................... 161 Table 7.4.5: Distribution of Mode of Transport Storage to Recipient Hospital during
Transportation ......................................................................................... 162 Table 7.4.6: Distribution of Temperature of Storage during Transportation ............... 162 Table 7.5.1: Distribution of Mode of Storage in Recipient Hospitals ......................... 163 Table 7.5.2: Distribution of Additional Tissue Usage (Composite Graft) ................... 163 Table 7.5.3: Distribution of Type of Additional Tissue Used (Composite Graft) ....... 163 Table 7.5.4: Distribution of Presence of Pre Operative Infection at Implant Site ....... 163 Table 7.5.5: Distribution of Pre Implant Graft Culture Swab ...................................... 164 Table 7.5.6: Distribution of Type of Infection of Pre Implant Graft ........................... 164 Table 7.5.7: Distribution of Grafts Soaked in Antibiotics Prior to Transplantation .... 164 Table 7.5.8: Distribution of Antibiotics Used to Soak the Grafts in Prior to
Transplantation ........................................................................................ 164 Table 7.5.9: Distribution of Patients by Systemic Antibiotics Given Prior to
Transplantation ........................................................................................ 164 Table 7.5.10: Distribution of Patients by Type of Systemic Antibiotics Given Prior to
Transplantation ........................................................................................ 165

154
BONE AND TISSUE TRANSPLANTATION Fourth Report of the National Transplant Registry 2007
7.0 INTRODUCTION This chapter presents data provided by centres that distributed tissue allografts, data about recipient centres and data provided on the Bone and Tissue Transplant Notification Form by surgeons. Only Universiti Sains Malaysia (USM) Tissue Bank provided information on tissue allografts that had been supplied and data on bone and other tissue allograft transplantation is still lacking. Thus, the report does not reflect the actual magnitude of transplant activity in the country. The limited data that were notified to NTR has restricted further analysis and definitive conclusions could not be made. Data relating to recipients pre and post transplantation depends on factors such as location of hospitals and surgeons’ expertise/experience and preference in tissue transplantation. However a continuous effort has to be made to ensure that all cases of bone and tissue allograft transplantation are reported as the data would be useful in assisting the Ministry of Health, non-governmental organisations, private providers and industry in planning and evaluation of the tissue transplant programme and service.

155
BONE AND TISSUE TRANSPLANTATION Fourth Report of the
National Transplant Registry 2007
7.1 STOCK OF BONE, AMNIOTIC MEMBRANE AND OTHER TISSUE ALLOGRAFTS AND HOSPITALS WHERE TISSUES ARE UTILISED IN 2007 In 2007 data was only provided by USM Tissue Bank, as a centre that supplied tissues. The main tissue allografts that were distributed were amniotic membranes and deep-frozen femoral heads (Table 7.1.1). Majority on the bone/tendon allografts were provided to private hospitals and other sectors and to the Ministry of Health hospitals (Table 7.1.2). The amniotic membranes were mainly used by surgeons in Ministry of Health hospitals (Table 7.1.3).
Table 7.1.1: Types of Tissue Allografts Supplied by USM Tissue Bank in 2007 Types of Tissue Allograft No. (pieces) DF Femur 2 DF Femoral head 65 DF Humerus 2 DF Tibia 4 DF Radius 0 DF Ulna 0 FD Cancellous 2 FD Cortical 0 FD Cortico-cancellous 0 Other FD Bones 8 Patella 2 Achilles 2 Other tendon / fascia / cartilage 3 Amniotic membranes 175 TOTAL 265 DF – Deep-frozen FD – Freeze-dried

156
Table 7.1.2: Hospitals/Other Sectors Using Bone/Tendon Allografts in 2007 USM Tissue Bank No. (pieces) Ministry of Health Hospitals Hospital Sultanah Aminah, Johor Bahru 1 Hospital Melaka 3 Hospital Pulau Pinang 10 Hospital Raja Permaisuri Bainun, Ipoh 3 Hospital Sultanah Bahiyah, Alor Setar 2 Hospital Umum Sarawak, Kuching 6 Queen Elizabeth Hospital, Kota Kinabalu 2 TOTAL 27 University Hospitals HUKM 5 HUSM 3 TOTAL 8 Private and other sectors Amin Dental Surgery, Johor Bahru 5 Chong Dental Surgery, Seri Kembangan Selangor 1 Hospital Fatimah, Ipoh 2 Hospital Sultan Ismail, Johor Bahru 2 Hospital Tawakal, Kuala Lumpur 3 Johnson & Johnson Medical 2 Kemajuan Abadi Sdn. Bhd. 2 Klinik Pergigian Chong, Tangkak, Johor 1 Normah Medical Center, Kuching 1 Stryker 12 Zimmer 21 TOTAL 52
BONE AND TISSUE TRANSPLANTATION
Fourth Report of the National Transplant Registry 2007
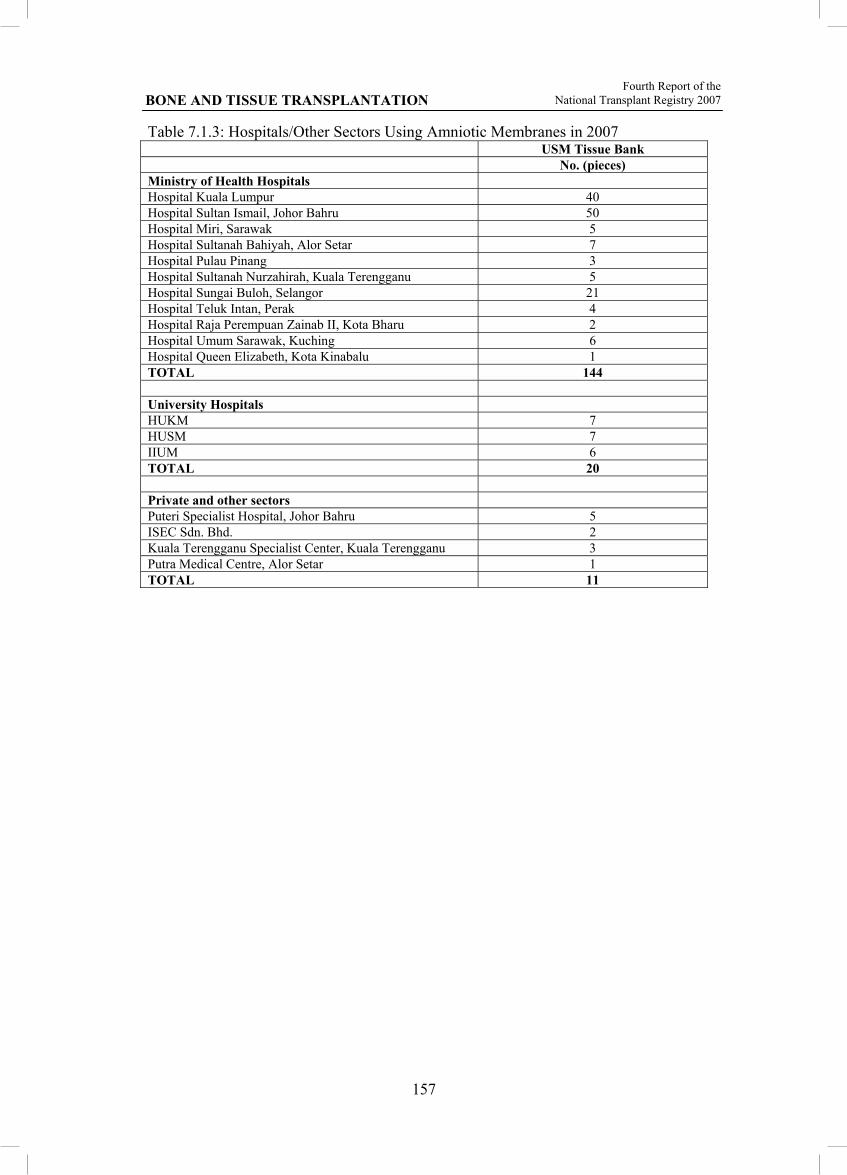
157
BONE AND TISSUE TRANSPLANTATION Fourth Report of the
National Transplant Registry 2007
Table 7.1.3: Hospitals/Other Sectors Using Amniotic Membranes in 2007 USM Tissue Bank No. (pieces) Ministry of Health Hospitals Hospital Kuala Lumpur 40 Hospital Sultan Ismail, Johor Bahru 50 Hospital Miri, Sarawak 5 Hospital Sultanah Bahiyah, Alor Setar 7 Hospital Pulau Pinang 3 Hospital Sultanah Nurzahirah, Kuala Terengganu 5 Hospital Sungai Buloh, Selangor 21 Hospital Teluk Intan, Perak 4 Hospital Raja Perempuan Zainab II, Kota Bharu 2 Hospital Umum Sarawak, Kuching 6 Hospital Queen Elizabeth, Kota Kinabalu 1 TOTAL 144 University Hospitals HUKM 7 HUSM 7 IIUM 6 TOTAL 20 Private and other sectors Puteri Specialist Hospital, Johor Bahru 5 ISEC Sdn. Bhd. 2 Kuala Terengganu Specialist Center, Kuala Terengganu 3 Putra Medical Centre, Alor Setar 1 TOTAL 11

158
7.2 REPORTING CENTRES
The recipient centres that reported to the National Transplant Registry using the Bone and Tissue Transplant Notification Form are shown on Table 7.2.1. Even though the number of reporting centres in 2007 has not decreased compared to previous years, some of the surgeons had submitted incomplete forms. Table 7.2.1: Distribution of Reporting Centre by Year
Centre2004 2005 2006 2007
TOTAL No. No. No. No.
Orthopaedics Department Department of Orthopaedics, HUSM 1 7 2 1 11 Department of Orthopaedic Surgery, UMMC 1 0 0 0 1 Institute of Orthopaedics & Traumatology, HKL 2 0 0 0 2 Department of Orthopaedics, Hospital Ipoh 0 1 0 0 1 Department of Orthopaedics, Hospital Kota Bharu 9 3 0 0 12 Department of Orthopaedics, Hospital Umum Sarawak 1 0 1 0 2 Department of Orthopaedics, Hospital Sultanah Aminah, Johor Bahru 0 1 0 0 1 Wan Orthopaedic, Trauma & Sports Injury Centre (WOTSIC), Seremban Specialist Hospital 0 0 2 0 2 Department of Orthopaedics, Hospital Island, Penang 0 1 0 0 1 Department of Orthopaedics, Hospital Fatimah, Ipoh 0 3 0 1 4 Department of Orthopaedics, Hospital Kuantan 0 0 0 1 1 Department of Orthopaedics, Kota Bharu Medical Centre 0 0 2 0 2 Department of Orthopaedics, Hospital Pulau Pinang 0 0 0 1 1 Normah Medical Specialist Centre, Kuching 0 1 0 0 1 Spine Unit, HUSM 0 0 1 0 1 Ophthalmology Department Department of Ophthalmology, Hospital Tengku Ampuan Rahimah, Klang 1 1 0 0 2 Department of Ophthalmology, Hospital Tengku Ampuan Afzan, Kuantan 1 1 0 0 2 Department of Ophthalmology, Hospital Teluk Intan 0 0 1 0 1 Department of Ophthalmology, HKL 0 0 23 20 43 Department of Ophthalmology, Hospital Alor Setar 0 0 1 0 1 Department of Ophthalmology, Hospital Sungai Buloh 0 0 0 9 9 Department of Ophthalmology, Sri Kota Medical Centre 0 1 0 0 1 Department of Ophthalmology, HUSM 0 0 1 2 3 Others Department Maxillofacial Surgery, HUSM 1 1 0 0 2 Timberland Medical Centre 0 1 0 0 1 Sri Kota Medical Centre, Klang 0 0 1 0 1 Pantai Medical Centre, Kuala Lumpur 0 0 0 1 1 TOTAL 17 22 35 36 110
BONE AND TISSUE TRANSPLANTATION
Fourth Report of the National Transplant Registry 2007
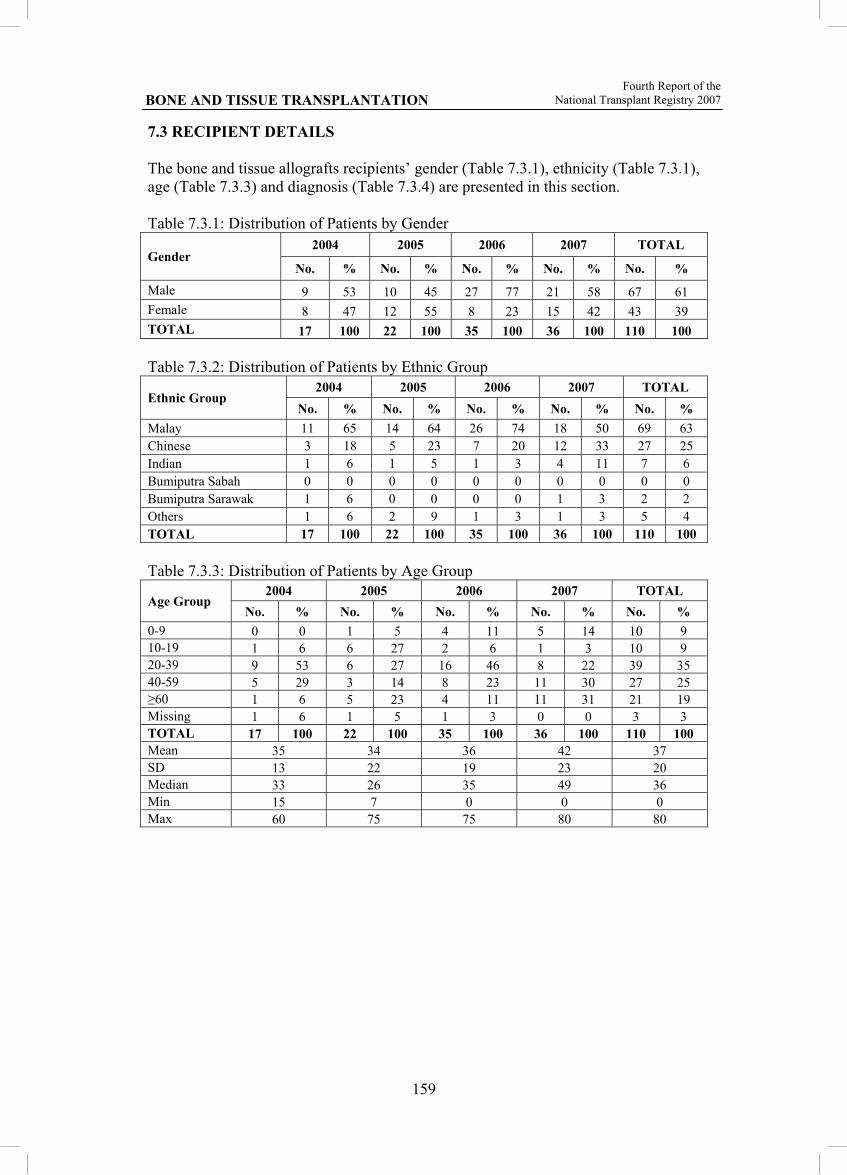
159
BONE AND TISSUE TRANSPLANTATION Fourth Report of the
National Transplant Registry 2007
7.3 RECIPIENT DETAILS The bone and tissue allografts recipients’ gender (Table 7.3.1), ethnicity (Table 7.3.1), age (Table 7.3.3) and diagnosis (Table 7.3.4) are presented in this section. Table 7.3.1: Distribution of Patients by Gender
Gender 2004 2005 2006 2007 TOTAL
No. % No. % No. % No. % No. % Male 9 53 10 45 27 77 21 58 67 61 Female 8 47 12 55 8 23 15 42 43 39 TOTAL 17 100 22 100 35 100 36 100 110 100
Table 7.3.2: Distribution of Patients by Ethnic Group
Ethnic Group 2004 2005 2006 2007 TOTAL
No. % No. % No. % No. % No. % Malay 11 65 14 64 26 74 18 50 69 63 Chinese 3 18 5 23 7 20 12 33 27 25 Indian 1 6 1 5 1 3 4 11 7 6 Bumiputra Sabah 0 0 0 0 0 0 0 0 0 0 Bumiputra Sarawak 1 6 0 0 0 0 1 3 2 2 Others 1 6 2 9 1 3 1 3 5 4 TOTAL 17 100 22 100 35 100 36 100 110 100
Table 7.3.3: Distribution of Patients by Age Group
Age Group 2004 2005 2006 2007 TOTAL
No. % No. % No. % No. % No. % 0-9 0 0 1 5 4 11 5 14 10 9 10-19 1 6 6 27 2 6 1 3 10 9 20-39 9 53 6 27 16 46 8 22 39 35 40-59 5 29 3 14 8 23 11 30 27 25 ≥60 1 6 5 23 4 11 11 31 21 19 Missing 1 6 1 5 1 3 0 0 3 3 TOTAL 17 100 22 100 35 100 36 100 110 100 Mean 35 34 36 42 37 SD 13 22 19 23 20 Median 33 26 35 49 36 Min 15 7 0 0 0 Max 60 75 75 80 80

160
Table 7.3.4: Distribution of Patients by Diagnosis Warranting Tissue Graft Transplantation
Diagnosis 2004 2005 2006 2007 TOTAL
No. % No. % No. % No. % No. % Congenital deformity 1 5 0 0 1 3 1 3 3 3 Infection 0 0 0 0 3 8 3 8 6 5 Trauma 5 28 1 5 6 16 1 3 13 12 Degenerative disease 1 5 2 10 0 0 1 3 4 4 Tumour-benign 5 28 4 20 1 3 1 3 11 10 Tumour-malignant 0 0 6 30 1 3 0 0 7 6 Burn 0 0 1 5 2 5 0 0 3 3 Scald 0 0 0 0 1 3 0 0 1 1 Sports injury 0 0 1 5 0 0 1 3 2 2 Failed primary surgery 1 5 2 10 1 3 2 5 6 5 Ophthalmological 0 0 0 0 16 42 7 19 23 20 Others 5 28 3 15 6 16 20 54 34 30 TOTAL 18 100 20 100 38 100 37 100 113 100 Note: 5 patients with 2 diagnosis and 2 missing diagnosis.
BONE AND TISSUE TRANSPLANTATION
Fourth Report of the National Transplant Registry 2007

161
BONE AND TISSUE TRANSPLANTATION Fourth Report of the
National Transplant Registry 2007
7.4 PRE TRANSPLANT DATA This section presents data on the tissue provider (Table 7.4.1), origin of tissue graft (Table 7.4.2), tissue graft type (Table 7.4.3), type of sterilisation of the graft (Table 7.4.4), mode of transport storage of tissue graft to recipient hospital (Table 7.4.5) and temperature of storage tissue graft during transportation (Table 7.4.6). Table 7.4.1: Distribution of Patients According to Tissue Provider
Name Tissue Bank 2004 2005 2006 2007 TOTAL
No. % No. % No. % No. % No. % USM Tissue Bank 13 76 18 82 31 89 34 94 96 87 Bone Bank, UMMC 1 6 0 0 0 0 0 0 1 1 Bone Bank, HKL 3 18 0 0 0 0 0 0 3 3 Eucara Pharmaceutical 0 0 0 0 2 6 0 0 2 2 Osteo Tech Inc 0 0 1 5 0 0 0 0 1 1 Missing 0 0 3 14 2 6 2 6 7 6 TOTAL 17 100 22 100 35 100 36 100 110 100 Table 7.4.2: Distribution of Patients by Origin of Tissue Graft
Origin of Tissue Graft 2004 2005 2006 2007 TOTAL
No. % No. % No. % No. % No. % Local 17 100 15 68 31 89 34 94 97 88 Imported 0 0 3 14 2 6 0 0 5 5 Missing 0 0 4 18 2 6 2 6 8 7 TOTAL 17 100 22 100 35 100 36 100 110 100 Table 7.4.3: Distribution of Tissue Graft Used by Type
Tissue Graft Type 2004 2005 2006 2007 TOTAL
No. % No. % No. % No. % No. % Deep-frozen tissues
Femur 3 25 3 10 0 0 0 0 6 5 Femoral Head 2 17 12 41 2 6 7 18 23 20 Humerus 0 0 1 4 3 10 0 0 4 4 Tibia 1 7 1 4 1 3 0 0 3 3 Radius 2 17 5 17 0 0 0 0 7 6
Freeze-dried/ Air-dried
Amniotic membranes 2 17 3 10 25 78 31 82 61 55
Not Available 2 17 2 7 0 0 0 0 4 4 Missing 0 0 2 7 1 3 0 0 3 3 TOTAL 12 100 29 100 32 100 38 100 111 100 Table 7.4.4: Distribution of Type of Sterilisation of the Graft
Type Graft Sterilisation 2004 2005 2006 2007 TOTAL
No. % No. % No. % No. % No. % Gamma Irradiation 16 94 15 68 30 86 27 75 88 80 Glycerol 0 0 0 0 2 6 0 0 2 2 Sterile Freeze Dried Bone 0 0 1 5 0 0 0 0 1 1 Missing 1 6 6 27 3 8 9 25 19 17 TOTAL 17 100 22 100 35 100 36 100 110 100

162
Table 7.4.5: Distribution of Mode of Transport Storage to Recipient Hospital during Transportation Mode of Transport Storage to recipient hospital
2004 2005 2006 2007 TOTAL No. % No. % No. % No. % No. %
By Flight 1 6 1 5 2 6 2 5 6 5 By Courier 2 12 3 14 24 69 23 64 52 47 By Hand 4 24 8 36 1 3 0 0 13 12 Dry Ice Box 5 29 4 18 0 0 0 0 9 8 Sterile package 0 0 0 0 2 6 0 0 2 2 Missing 5 29 6 27 6 17 11 31 28 26 TOTAL 17 100 22 100 35 100 36 100 110 100 Table 7.4.6: Distribution of Temperature of Storage during Transportation Temperature of storage during transportation (oC)
2004 2005 2006 2007 TOTAL
No. % No. % No. % No. % No. % -80 2 12 0 0 0 0 0 0 2 2 -40 0 0 1 5 0 0 0 0 1 1 -20 4 23 4 18 0 0 1 3 9 8 -10 0 0 6 27 2 6 1 3 9 8 0 2 12 0 0 0 0 0 0 2 2 37 0 0 0 0 2 6 0 0 2 2 Room Temperature 3 18 4 18 25 71 22 61 54 49 Missing 6 35 7 32 6 17 12 33 31 28 TOTAL 17 100 22 100 35 100 36 100 110 100
BONE AND TISSUE TRANSPLANTATION
Fourth Report of the National Transplant Registry 2007

163
BONE AND TISSUE TRANSPLANTATION Fourth Report of the
National Transplant Registry 2007
7.5 TRANSPLANT SURGERY DATA The data on mode of storage of tissues in recipient hospitals are presented in Table 7.5.1. This section also presents the data on the use of composite graft (Tables 7.5.2 and 7.5.3), presence of pre operative infection at implant site (Table 7.5.4), presence of infection of pre implanted grafts (Tables 7.5.5 and 7.5.6) and the usage of antibiotics (Tables 7.5.7, 7.5.8, 7.5.9, and 7.5.10).
Table 7.5.1: Distribution of Mode of Storage in Recipient Hospitals
Mode of storage in recipient hospital 2004 2005 2006 2007 TOTAL
No. % No. % No. % No. % No. % Refrigerator 0 0 1 5 25 71 28 78 54 49 Deep freezer-20 oC 0 0 3 14 2 6 3 8 8 7 Deep freezer-40 oC 1 6 2 9 0 0 0 0 3 3 Deep freezer-80 oC 3 18 4 18 1 3 1 3 9 8 Glycerol 0 0 1 5 3 9 4 11 8 7 Room temperature 0 0 1 5 1 3 0 0 2 2 Others 12 71 5 23 2 6 0 0 19 17 Not available 1 6 0 0 0 0 0 0 1 1 Missing 0 0 5 23 1 3 0 0 6 6 TOTAL 17 100 22 100 35 100 36 100 110 100 Table 7.5.2: Distribution of Additional Tissue Usage (Composite Graft) Additional tissue usage (composite graft)
2004 2005 2006 2007 TOTAL
No. % No. % No. % No. % No. % No 6 35 12 55 32 91 33 92 83 75 Yes 9 53 7 32 1 3 2 5 19 17 Not available 2 12 1 5 0 0 0 0 3 3 Missing 0 0 2 9 2 6 1 3 5 5 TOTAL 17 100 22 100 35 100 36 100 110 100 Table 7.5.3: Distribution of Type of Additional Tissue Used (Composite Graft) Type of additional tissue used (composite graft)
2004 2005 2006 2007 TOTAL No. % No. % No. % No. % No. %
Autografts 7 78 3 43 0 0 0 0 10 53 Allografts 1 11 2 29 1 100 2 100 6 32 Others 1 11 1 14 0 0 0 0 2 10 Missing 0 0 1 14 0 0 0 0 1 5 TOTAL 9 100 7 100 1 100 2 100 19 100 Table 7.5.4: Distribution of Presence of Pre Operative Infection at Implant Site
Presence of pre operative infection at implant site
2004 2005 2006 2007 TOTAL No. % No. % No. % No. % No. %
No 15 88 21 95 31 89 27 75 94 85 Yes 0 0 0 0 4 11 9 25 13 12 Not Available 2 12 0 0 0 0 0 0 2 2 Missing 0 0 1 5 0 0 0 0 1 1 TOTAL 17 100 22 100 35 100 36 100 110 100
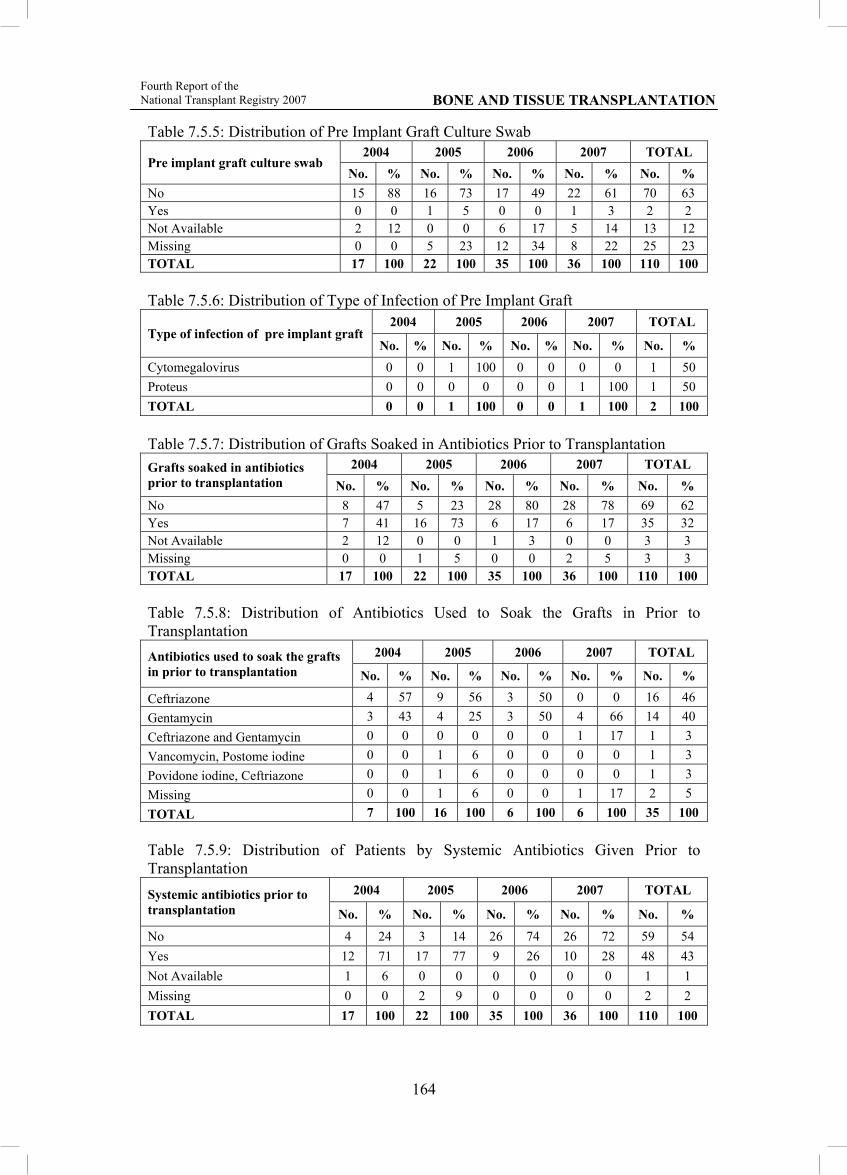
164
Table 7.5.5: Distribution of Pre Implant Graft Culture Swab
Pre implant graft culture swab 2004 2005 2006 2007 TOTAL
No. % No. % No. % No. % No. % No 15 88 16 73 17 49 22 61 70 63 Yes 0 0 1 5 0 0 1 3 2 2 Not Available 2 12 0 0 6 17 5 14 13 12 Missing 0 0 5 23 12 34 8 22 25 23 TOTAL 17 100 22 100 35 100 36 100 110 100 Table 7.5.6: Distribution of Type of Infection of Pre Implant Graft
Type of infection of pre implant graft 2004 2005 2006 2007 TOTAL
No. % No. % No. % No. % No. % Cytomegalovirus 0 0 1 100 0 0 0 0 1 50 Proteus 0 0 0 0 0 0 1 100 1 50 TOTAL 0 0 1 100 0 0 1 100 2 100 Table 7.5.7: Distribution of Grafts Soaked in Antibiotics Prior to Transplantation Grafts soaked in antibiotics prior to transplantation
2004 2005 2006 2007 TOTAL No. % No. % No. % No. % No. %
No 8 47 5 23 28 80 28 78 69 62 Yes 7 41 16 73 6 17 6 17 35 32 Not Available 2 12 0 0 1 3 0 0 3 3 Missing 0 0 1 5 0 0 2 5 3 3 TOTAL 17 100 22 100 35 100 36 100 110 100 Table 7.5.8: Distribution of Antibiotics Used to Soak the Grafts in Prior to Transplantation Antibiotics used to soak the grafts in prior to transplantation
2004 2005 2006 2007 TOTAL
No. % No. % No. % No. % No. %
Ceftriazone 4 57 9 56 3 50 0 0 16 46 Gentamycin 3 43 4 25 3 50 4 66 14 40 Ceftriazone and Gentamycin 0 0 0 0 0 0 1 17 1 3 Vancomycin, Postome iodine 0 0 1 6 0 0 0 0 1 3 Povidone iodine, Ceftriazone 0 0 1 6 0 0 0 0 1 3 Missing 0 0 1 6 0 0 1 17 2 5 TOTAL 7 100 16 100 6 100 6 100 35 100 Table 7.5.9: Distribution of Patients by Systemic Antibiotics Given Prior to Transplantation Systemic antibiotics prior to transplantation
2004 2005 2006 2007 TOTAL
No. % No. % No. % No. % No. % No 4 24 3 14 26 74 26 72 59 54 Yes 12 71 17 77 9 26 10 28 48 43 Not Available 1 6 0 0 0 0 0 0 1 1 Missing 0 0 2 9 0 0 0 0 2 2 TOTAL 17 100 22 100 35 100 36 100 110 100
BONE AND TISSUE TRANSPLANTATION
Fourth Report of the National Transplant Registry 2007

165
BONE AND TISSUE TRANSPLANTATION Fourth Report of the
National Transplant Registry 2007
Table 7.5.10: Distribution of Patients by Type of Systemic Antibiotics Given Prior to Transplantation Type of systemic antibiotics given to patient prior to transplantation
2004 2005 2006 2007 TOTAL
No. % No. % No. % No. % No. % Cefeperazone 2 17 2 12 0 0 0 0 4 9 Ceftriazone 0 0 0 0 1 11 0 0 1 2 Cefuroxine 7 58 7 40 4 45 2 25 20 44 Ciproflaxacin 0 0 2 12 0 0 2 25 4 9 Chloramphenicol 0 0 0 0 1 11 0 0 1 2 Metronidazole 1 8 1 6 0 0 0 0 2 4 Ceftazidine 0 0 0 0 1 11 0 0 1 2 Ceftriazone/Imipenam 2 17 2 12 2 22 2 25 8 18 Ampicillin/Sulbactam 0 0 0 0 0 0 1 12 1 2 T. Augmentin 0 0 0 0 0 0 1 12 1 2 T. Flurariazole 0 0 2 12 0 0 0 0 2 4 Missing 0 0 1 6 0 0 0 0 1 2 TOTAL 12 100 17 100 9 100 8 100 46 100

CHAPTER 8
CADAVERIC ORGAN AND TISSUE DONATION
Editor: Datin Dr Lela Yasmin Mansor

167
CADAVERIC ORGAN AND TISSUE DONATION Fourth Report of the
National Transplant Registry 2007
List of Tables Table 8.1: Number of Procurement by Year, 1997-2007…………………………...170Table 8.2: Potential Donor Referrals and Actual Donations by Month, 2007……...171Table 8.3: Distribution of Donors by Age, 1997-2007……………………………..172 Table 8.4: Distribution of Donors by Gender, 1997-2007………………………….174 Table 8.5: Distribution of Donors by Ethnic Group, 1997-2007…………………...175 Table 8.6: Distribution of Donors by Religion, 1997-2007………………………...176 Table 8.7: Distribution of Donors by Nationality, 1997-2007……………………...177 Table 8.8: Distribution of Donors by State, 1997-2007…………………………….178 Table 8.9: Donor’s Pledged Status, 1997-2007……………………………………..179 Table 8.10: Distribution of Donors by Type, 1997-2007…………………………...180 Table 8.11: Distribution of Donors by Cause of Death, 1997-2007…………………181Table 8.12: Distribution of Organ Donors by Blood Group, 1997-2007…………...183 Table 8.13a: Type of Hospital/Institution Where Donors Originated, 1997-2007.…185Table 8.13b: Location Where Donors Were Referred From, 1997-2007…………...186Table 8.13c: Location Where Procurement Was Carried Out, 1997-2007…………187
List of Figures Figure 8.1: Number of Procurement by Year, 1997-2007………………………….170 Figure 8.2: Potential Donor Referrals and Actual Donations by Month, 2007……..171 Figure 8.3: Distribution of Donors by Age, 1997-2007…………………………….173 Figure 8.4: Distribution of Donors by Gender, 1997-2007…………………………174 Figure 8.5: Distribution of Donors by Ethnic Group, 1997-2007…………………..175 Figure 8.6: Distribution of Donors by Religion, 1997-2007………………………..176 Figure 8.7: Distribution of Donors by Nationality, 1997-2007……………………..177 Figure 8.9: Donor’s Pledged Status, 1997-2007……………………………………179 Figure 8.10: Distribution of Donors by Type, 1997-2007………………………….180 Figure 8.12a: Distribution of Organ Donors by Blood Group, 1997-2007…………183 Figure 8.12b: Distribution of Organ Donors by Blood Group (pie chart), 1997-2007…………………………………………………………………………………184Figure 8.12c: Distribution of Organ Donors by Blood Group (pie chart), 2007……184 Figure 8.13a: Type of Hospital/Institution Where Donors Originated, 1997-2007....185Figure 8.13b: Location Where Donors Were Referred From, 1997-2007………..…186Figure 8.13c: Location Where Procurement Was Carried Out, 1997-2007…...........187
168
CADAVERIC ORGAN AND TISSUE DONATION Fourth Report of the National Transplant Registry 2007
CADAVERIC ORGAN AND TISSUE DONATION
There was a decline in the number of potential cadaveric donors referred to the National Transplant Procurement Unit (NTPMU) nationwide from 112 the previous year to 73 in 2007. However, the number of actual donors remained the same at 25 for the year, which translated to a conversion rate of 34% and a donation rate of 0.99 per million population (Table 8.1). Of these 15 (60%) were brain dead donors who donated organs and tissues which were procured in the operating theatre, while another 10 were tissue donations after cardiac death, two being eye donations in the ward and the others multi-tissue procurement in the mortuary (table 8.2). In total 83 organs and tissues were procured, comprising 32 corneas, 28 kidneys, 3 hearts, 2 lungs, 5 livers, 8 pairs of heart valves and 5 sets of long bones.
The pattern of distribution of the donations throughout the year showed an interesting trend (Figure 8.2). The month of March recorded the highest number of potential donors identified and referred to the NTPMU (14/75) as well as the highest number of actual donations (6/25), but majority (4/6) were tissue donations after cardiac death. These six donors together with another multi-tissue donor in early April and a brain dead organ donor in June were the only cases of successful donations in the first half of 2007.
The second half of the year saw an increasing number of brain dead multi-organ organ donations particularly from the month of September onwards. This was in response to the almost daily media blitz in the mainstream and vernacular newspapers and television focusing on the 13 year old Chinese girl who had been put on the Left Ventricular Assist Device (LVAD) while awaiting her heart transplant. As a result there were several referrals and donations occurring quite close together during that period, sometimes two to three cases in a day, and many of which were family initiated. The girl received her heart transplant on 4th October, and her donor was a 15 year old Malay boy, a Quranic scholar whose parents were religious teachers who also donated his lungs, liver, kidneys and corneas after receiving clearance from the state Mufti (religious leader). When that transplant failed as a result of hyperacute rejection, she received a second heart within 24 hours from another 21 year old deceased Chinese motor vehicle accident victim.
Because of the prominent write up about the heart transplant case and the Muslim boy’s donation in the Malay media and particularly after the public declaration of support by three state Muftis and the director general of JAKIM (Department of Islamic Development), there were subsequently four other Malay donors who donated multiple organs and tissues after brain death within a short space of time. With the age of these donors mainly in the teens, two of the donations were initiated by the parents. These 5 donors constitute the highest number of Malay (five-fold rise from the previous year) or Muslim donors (two and a half times increase) in a year and for the first time there were more Malay than Indian donors (20% vs 12%) (Table 8.5) although the Chinese still remained the most common ethnic group (56%) and Buddhist the most common religious group (52%) (Table 8.6).
There were more paediatric donors compared to previous years with three donors under the age of five years and another 6 donors in their mid-teens, which together constitute 36% of the total number of donors (Table 8.3). Another 24% (6/25) were in

169
CADAVERIC ORGAN AND TISSUE DONATION Fourth Report of the
National Transplant Registry 2007
their twenties which mean that 60% of the donors were under the age of thirty. The mean age was 29.6 years with the youngest being a 14 month old who donated kidneys and the eldest 68 years old Canadian lady who donated corneas. As previously, males exceed females four to one (Table 8.4).
Majority of the donors came from Selangor (24%) followed by Johor (20%) and Kuala Lumpur (12%) (Table 8.8). Most of the donations (84%) took place in Ministry of Health hospitals with a three-fold increase in donations from district hospitals with only 2 cases each occurring in private or university hospitals (Table 8.13a). Sixty-eight percent of the donors were found in the ICU, but there were also five direct referrals for tissue donation from the mortuary with one each from the ward and emergency department (“brought in dead” BID) (Table 8.13b). Six out of the 25 actual donors (24%) had pledged to donate before and carried the donor card (Table 8.9).
Road accident related injuries still remain the most common cause of death, accounting for 60% of the brain death and 40 % of the cardiac death. Another 40% of post-cardiac death tissue donors died from heart related diseases while there was one case of homicide who became a brain dead multi-organ and tissue donor (Table 8.11).
In 2007, the most common blood group among the 15 organ donors was group A rhesus positive (40%), followed by 0 positive (33%) and B positive (7%), and only 1 (7%) from group A negative and no AB group (Table 8.12). But when considered in totality since 1997, blood group O positive remained the most common group (41%) followed by B positive and A positive.
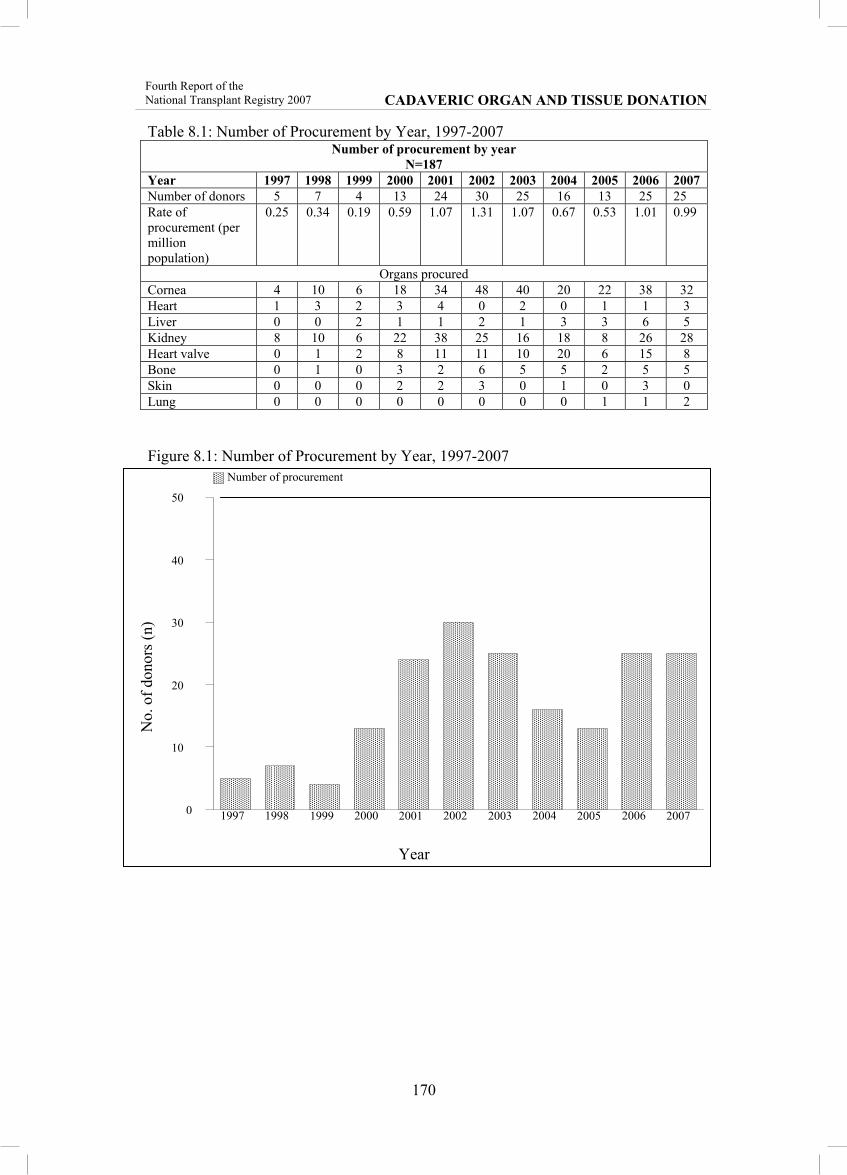
170
CADAVERIC ORGAN AND TISSUE DONATION Fourth Report of the National Transplant Registry 2007
Table 8.1: Number of Procurement by Year, 1997-2007 Number of procurement by year
N=187Year 1997 1998 1999 2000 2001 2002 2003 2004 2005 2006 2007 Number of donors 5 7 4 13 24 30 25 16 13 25 25 Rate of procurement (per million population)
0.25 0.34 0.19 0.59 1.07 1.31 1.07 0.67 0.53 1.01 0.99
Organs procured Cornea 4 10 6 18 34 48 40 20 22 38 32 Heart 1 3 2 3 4 0 2 0 1 1 3 Liver 0 0 2 1 1 2 1 3 3 6 5 Kidney 8 10 6 22 38 25 16 18 8 26 28 Heart valve 0 1 2 8 11 11 10 20 6 15 8 Bone 0 1 0 3 2 6 5 5 2 5 5 Skin 0 0 0 2 2 3 0 1 0 3 0 Lung 0 0 0 0 0 0 0 0 1 1 2
Figure 8.1: Number of Procurement by Year, 1997-2007
No.
of d
onor
s (n)
Year
0
10
20
30
40
50
Number of procurement
1997 1998 1999 2000 2001 2002 2003 2004 2005 2006 2007
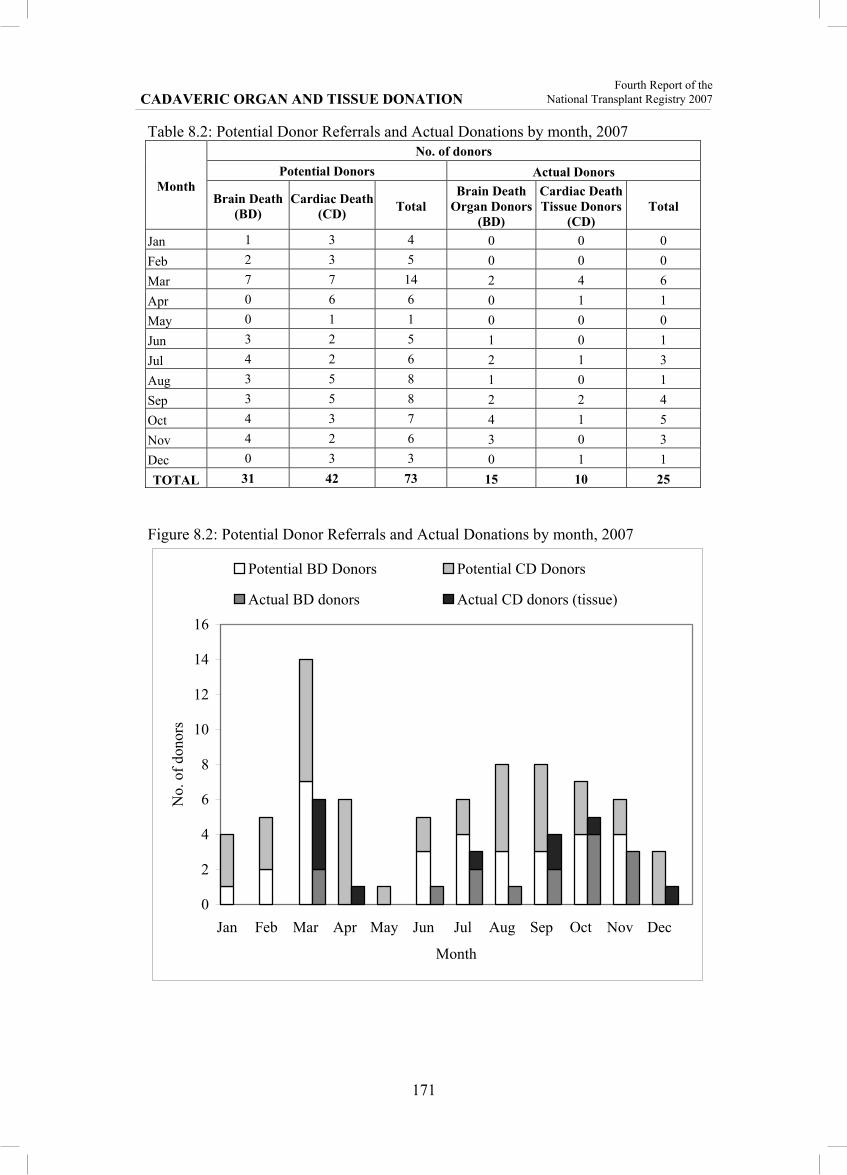
171
CADAVERIC ORGAN AND TISSUE DONATION Fourth Report of the
National Transplant Registry 2007
Table 8.2: Potential Donor Referrals and Actual Donations by month, 2007
Month
No. of donors Potential Donors Actual Donors
Brain Death (BD)
Cardiac Death (CD) Total
Brain Death Organ Donors
(BD)
Cardiac Death Tissue Donors
(CD) Total
Jan 1 3 4 0 0 0 Feb 2 3 5 0 0 0 Mar 7 7 14 2 4 6 Apr 0 6 6 0 1 1 May 0 1 1 0 0 0 Jun 3 2 5 1 0 1 Jul 4 2 6 2 1 3 Aug 3 5 8 1 0 1 Sep 3 5 8 2 2 4 Oct 4 3 7 4 1 5 Nov 4 2 6 3 0 3 Dec 0 3 3 0 1 1 TOTAL 31 42 73 15 10 25
Figure 8.2: Potential Donor Referrals and Actual Donations by month, 2007
0
2
4
6
8
10
12
14
16
Jan Feb Mar Apr May Jun Jul Aug Sep Oct Nov Dec
Month
No.
of d
onor
s
Potential BD Donors Potential CD Donors
Actual BD donors Actual CD donors (tissue)

172
CADAVERIC ORGAN AND TISSUE DONATION Fourth Report of the National Transplant Registry 2007


174
CADAVERIC ORGAN AND TISSUE DONATION Fourth Report of the National Transplant Registry 2007
Table 8.4: Distribution of Donors by Gender, 1997-2007 Donor’s gender 1997
N=5 1998 N=7
1999 N=4
2000 N=13
2001 N=24
2002 N=30
No. % No. % No. % No. % No. % No. % Male 3 60 7 100 3 75 11 85 20 83 27 90 Female 2 40 0 0 1 25 2 15 4 17 3 10
Donor’s gender 2003 N=25
2004 N=16
2005 N=13
2006 N=25
2007 N=25
Total N=187
No. % No. % No. % No. % No. % No. % Male 21 84 12 75 8 62 19 76 20 80 151 81 Female 4 16 4 25 5 38 6 24 5 20 36 19
Figure 8.4: Distribution of Donors by Gender, 1997-2007
0
5
10
15
20
25
30
35
1997 1998 1999 2000 2001 2002 2003 2004 2005 2006 2007
Year
No.
of d
onor
s
Male Female

175
CADAVERIC ORGAN AND TISSUE DONATION Fourth Report of the
National Transplant Registry 2007
Table 8.5: Distribution of Donors by Ethnic Group, 1997-2007 Donor’s ethnic group 1997
N=5 1998 N=7
1999 N=4
2000 N=13
2001 N=24
2002 N=30
No. % No. % No. % No. % No. % No. % Malay 1 20 0 0 0 0 2 15 1 4 0 0 Chinese 3 60 4 57 4 100 7 54 17 71 13 43 Indian 1 20 3 43 0 0 3 23 4 17 15 50 Others 0 0 0 0 0 0 1 8 2 8 2 7
Donor’s ethnic group 2003 N=25
2004 N=16
2005 N=13
2006 N=25
2007 N=25
Total N=187
No. % No. % No. % No. % No. % No. % Malay 0 0 1 6 1 8 1 4 5 20 12 6 Chinese 14 56 14 88 5 38 12 48 14 56 107 57 Indian 9 36 1 6 7 54 11 44 3 12 57 30 Others 2 8 0 0 0 0 1 4 3 12 11 7
Figure 8.5: Distribution of Donors by Ethnic Group, 1997-2007
0
5
10
15
20
25
30
35
1997 1998 1999 2000 2001 2002 2003 2004 2005 2006 2007
Year
No.
of d
onor
s
Malay Chinese Indian Others

176
CADAVERIC ORGAN AND TISSUE DONATION Fourth Report of the National Transplant Registry 2007
Table 8.6: Distribution of Donors by Religion, 1997-2007 Donor’s religion 1997
N=5 1998 N=7
1999 N=4
2000 N=13
2001 N=24
2002 N=30
No. % No. % No. % No. % No. % No. % Islam 1 20 0 0 0 0 2 15 1 4 0 0 Buddhism 3 60 3 43 0 0 0 0 1 4 5 17 Hinduism 1 20 3 43 0 0 3 23 3 13 13 43 Christianity 0 0 0 0 0 0 1 8 0 0 1 3 Others 0 0 0 0 0 0 0 0 0 0 0 0 Unknown 0 0 1 14 4 100 7 54 19 79 11 37
Donor’s religion 2003 N=25
2004 N=16
2005 N=13
2006 N=25
2007 N=25
Total N=187
No. % No. % No. % No. % No. % No. % Islam 1 4 2 13 1 8 2 8 5 20 15 8 Buddhism 15 60 14 88 5 38 12 48 13 52 71 38 Hinduism 8 32 0 0 5 38 10 40 2 8 48 26 Christianity 1 4 0 0 0 0 0 0 4 16 7 4 Others 0 0 0 0 2 15 0 0 1 4 3 2 Unknown 0 0 0 0 0 0 1 4 0 0 43 23
Figure 8.6: Distribution of Donors by Religion, 1997-2007
0
5
10
15
20
25
30
35
1997 1998 1999 2000 2001 2002 2003 2004 2005 2006 2007
Year
No.
of d
onor
s
Islam Buddhism HinduismChristianity Others Unknown

177
CADAVERIC ORGAN AND TISSUE DONATION Fourth Report of the
National Transplant Registry 2007
Table 8.7: Distribution of Donors by Nationality, 1997-2007 Donor’s nationality 1997
N=5 1998 N=7
1999 N=4
2000 N=13
2001 N=24
2002 N=30
No. % No. % No. % No. % No. % No. % Malaysian 5 100 7 100 4 100 13 100 21 88 29 97 Non-Malaysian 0 0 0 0 0 0 0 0 3 13 1 3
Donor’s nationality 2003 N=25
2004 N=16
2005 N=13
2006 N=25
2007 N=25
Total N=187
No. % No. % No. % No. % No. % No. % Malaysian 24 96 16 100 13 100 24 96 24 96 180 96 Non-Malaysian 1 4 0 0 0 0 1 4 1 4 7 4
Figure 8.7: Distribution of Donors by Nationality, 1997-2007
0
5
10
15
20
25
30
35
1997 1998 1999 2000 2001 2002 2003 2004 2005 2006 2007
Year
No.
of d
onor
s
Malaysian Non-Malaysian
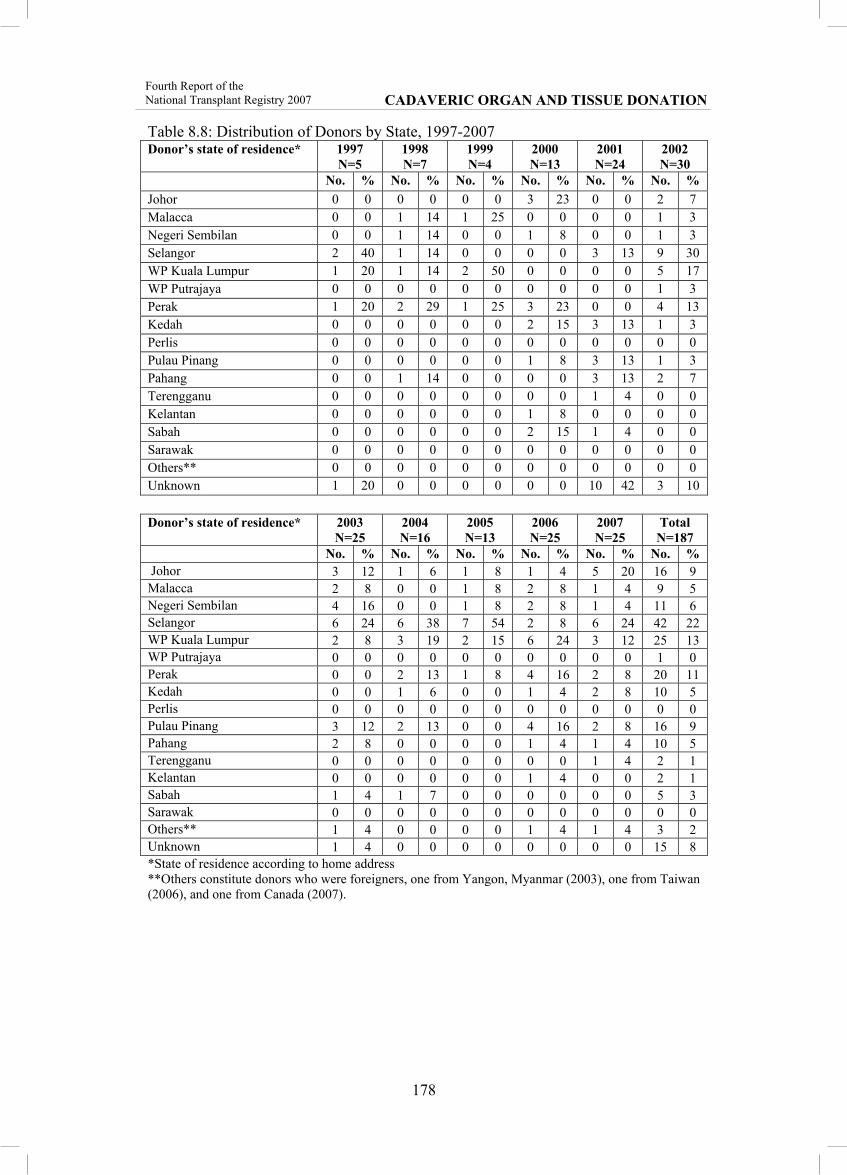
178
CADAVERIC ORGAN AND TISSUE DONATION Fourth Report of the National Transplant Registry 2007
Table 8.8: Distribution of Donors by State, 1997-2007Donor’s state of residence* 1997
N=5 1998 N=7
1999 N=4
2000 N=13
2001 N=24
2002 N=30
No. % No. % No. % No. % No. % No. % Johor 0 0 0 0 0 0 3 23 0 0 2 7 Malacca 0 0 1 14 1 25 0 0 0 0 1 3 Negeri Sembilan 0 0 1 14 0 0 1 8 0 0 1 3 Selangor 2 40 1 14 0 0 0 0 3 13 9 30 WP Kuala Lumpur 1 20 1 14 2 50 0 0 0 0 5 17 WP Putrajaya 0 0 0 0 0 0 0 0 0 0 1 3 Perak 1 20 2 29 1 25 3 23 0 0 4 13 Kedah 0 0 0 0 0 0 2 15 3 13 1 3 Perlis 0 0 0 0 0 0 0 0 0 0 0 0 Pulau Pinang 0 0 0 0 0 0 1 8 3 13 1 3 Pahang 0 0 1 14 0 0 0 0 3 13 2 7 Terengganu 0 0 0 0 0 0 0 0 1 4 0 0 Kelantan 0 0 0 0 0 0 1 8 0 0 0 0 Sabah 0 0 0 0 0 0 2 15 1 4 0 0 Sarawak 0 0 0 0 0 0 0 0 0 0 0 0 Others** 0 0 0 0 0 0 0 0 0 0 0 0 Unknown 1 20 0 0 0 0 0 0 10 42 3 10
Donor’s state of residence* 2003 N=25
2004 N=16
2005 N=13
2006 N=25
2007 N=25
Total N=187
No. % No. % No. % No. % No. % No. % Johor 3 12 1 6 1 8 1 4 5 20 16 9 Malacca 2 8 0 0 1 8 2 8 1 4 9 5 Negeri Sembilan 4 16 0 0 1 8 2 8 1 4 11 6 Selangor 6 24 6 38 7 54 2 8 6 24 42 22 WP Kuala Lumpur 2 8 3 19 2 15 6 24 3 12 25 13 WP Putrajaya 0 0 0 0 0 0 0 0 0 0 1 0 Perak 0 0 2 13 1 8 4 16 2 8 20 11 Kedah 0 0 1 6 0 0 1 4 2 8 10 5 Perlis 0 0 0 0 0 0 0 0 0 0 0 0 Pulau Pinang 3 12 2 13 0 0 4 16 2 8 16 9 Pahang 2 8 0 0 0 0 1 4 1 4 10 5 Terengganu 0 0 0 0 0 0 0 0 1 4 2 1 Kelantan 0 0 0 0 0 0 1 4 0 0 2 1 Sabah 1 4 1 7 0 0 0 0 0 0 5 3 Sarawak 0 0 0 0 0 0 0 0 0 0 0 0 Others** 1 4 0 0 0 0 1 4 1 4 3 2 Unknown 1 4 0 0 0 0 0 0 0 0 15 8 *State of residence according to home address **Others constitute donors who were foreigners, one from Yangon, Myanmar (2003), one from Taiwan (2006), and one from Canada (2007).

179
CADAVERIC ORGAN AND TISSUE DONATION Fourth Report of the
National Transplant Registry 2007
Table 8.9: Donor’s Pledged Status, 1997-2007 Donor’s pledged status 1997
N=5 1998 N=7
1999 N=4
2000 N=13
2001 N=24
2002 N=30
No. % No. % No. % No. % No. % No. % Pledged donors 0 0 0 0 0 0 0 0 0 0 5 17 Non-pledged donors 5 100 7 100 4 100 13 100 24 100 25 83
Donor’s pledged status 2003 N=25
2004 N=16
2005 N=13
2006 N=25
2007 N=25
Total N=187
No. % No. % No. % No. % No. % No. % Pledged donors 6 24 2 13 3 23 1 4 6 24 23 12 Non-pledged donors 19 76 14 88 10 77 24 96 19 76 164 88
Figure 8.9: Donor’s Pledged Status, 1997-2007
0
5
10
15
20
25
30
35
1997 1998 1999 2000 2001 2002 2003 2004 2005 2006 2007
Year
No.
of d
onor
s
Pledged donors Non-pledged donors

180
CADAVERIC ORGAN AND TISSUE DONATION Fourth Report of the National Transplant Registry 2007
Table 8.10: Distribution of Donors by Type, 1997-2007 Type of donors 1997
N=5 1998 N=7
1999 N=4
2000 N=13
2001 N=24
2002 N=30
No. % No. % No. % No. % No. % No. % BD (Brain Dead donors) 4 80 6 86 4 100 11 85 20 83 17 57 CD (Tissue Donors after Cardiac Death)* 1 20 1 14 0 0 2 15 4 17 13 43
Type of donors 2003 N=25
2004 N=16
2005 N=13
2006 N=25
2007 N=25
Total N=187
No. % No. % No. % No. % No. % No. % BD (Brain Dead donors) 8 32 10 63 5 38 14 56 15 60 114 61 CD (Tissue Donors after Cardiac Death) * 17 68 6 38 8 62 11 44 10 40 73 39
* CD involve tissue donations only
Figure 8.10: Distribution of Donors by Type, 1997-2007
0
5
10
15
20
25
30
35
1997 1998 1999 2000 2001 2002 2003 2004 2005 2006 2007
Year
No.
of d
onor
s
BD CD

181
CADAVERIC ORGAN AND TISSUE DONATION Fourth Report of the
National Transplant Registry 2007
Table 8.11: Distribution of Donors by Cause of Death, 1997-2007

182
CADAVERIC ORGAN AND TISSUE DONATION Fourth Report of the National Transplant Registry 2007

183
CADAVERIC ORGAN AND TISSUE DONATION Fourth Report of the
National Transplant Registry 2007
Table 8.12: Distribution of Organ Donors by Blood Group, 1997-2007
Blood groupNo. (%)
1997 N=4
1998 N=6
1999 N=4
2000 N=11
2001 N=20
2002 N=13
A positive 1(25) 1(17) 0(0) 1(9) 5(25) 3(23) B positive 0(0) 1(17) 1(25) 5(45) 4(20) 3(23) AB positive 1(25) 1(17) 0(0) 0(0) 1(5) 0(0) O positive 2(50) 3(50) 3(75) 5(45) 10(50) 7(54) A negative 0(0) 0(0) 0(0) 0(0) 0(0) 0(0)
Blood groupNo. (%)
2003 N=8
2004 N=10
2005 N=5
2006 N=14
2007 N=15
Total N=110
A positive 4(50) 2(20) 1(20) 4(29) 6 (40) 28 (25) B positive 3(38) 4(40) 2(40) 5(36) 3 (20) 31 (28) AB positive 0(0) 0(0) 0(0) 2(14) 0 (0) 5 (5) O positive 1(12) 4(40) 2(40) 3(21) 5 (33) 45 (41) A negative 0(0) 0(0) 0(0) 0(0) 1 (7) 1 (1) Blood group is only ascertained in brain dead donors and is not done for tissue donors post -cardiac death
Figure 8.12a: Distribution of Organ Donors by Blood Group, 1997-2007
0
5
10
15
20
25
1997 1998 1999 2000 2001 2002 2003 2004 2005 2006 2007
Year
No.
of d
onor
s
A positive B positive AB positive
O positive A negative

184
CADAVERIC ORGAN AND TISSUE DONATION Fourth Report of the National Transplant Registry 2007
Figure 8.12b: Distribution of Organ Donors by Blood Group (pie chart), 1997-2007
Distribution of Organ Donors by Blood Group, 1997-2007
A positive25%
B positive28%
AB positive5%
O positive41%
A negative1%
Figure 8.12c: Distribution of Organ Donors by Blood Group (pie chart), 2007
Distribution of Organ Donors by Blood Group, 2007
A positive40%
B positive20%
AB positive0%
O positive33%
A negative7%
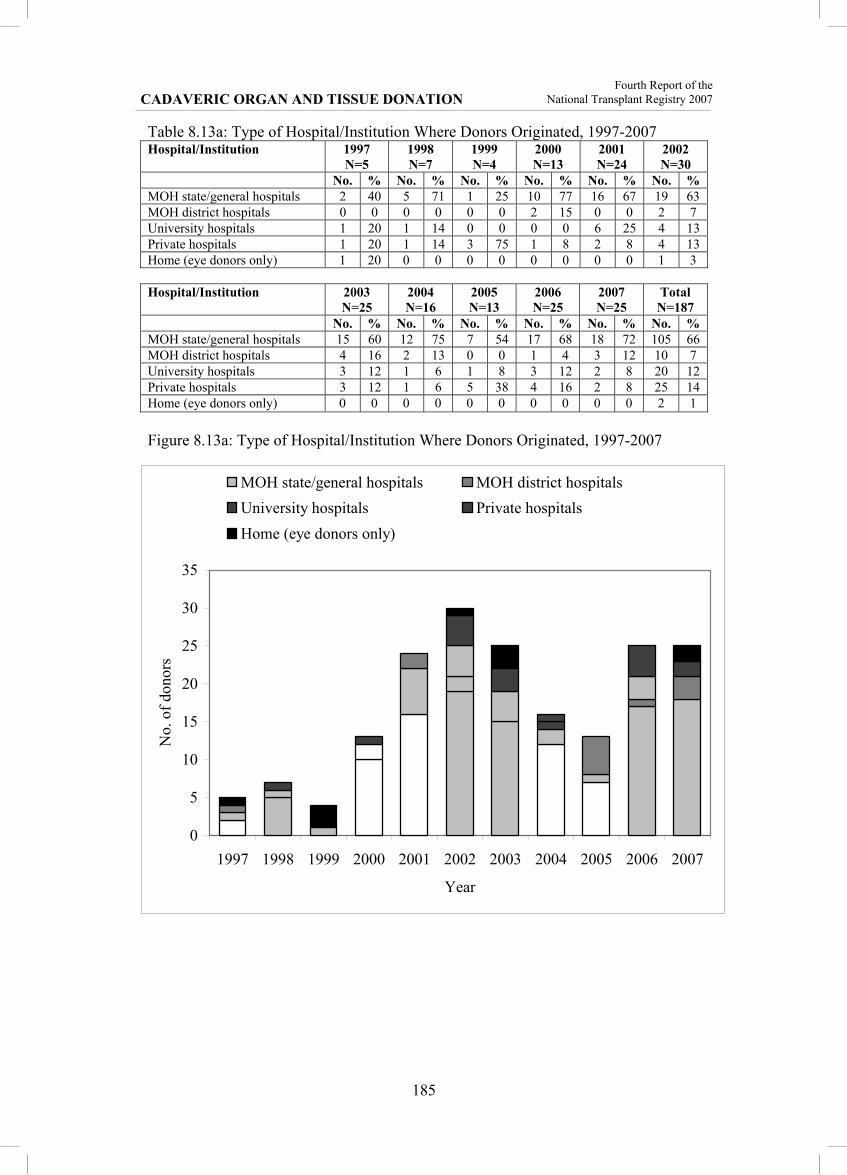
185
CADAVERIC ORGAN AND TISSUE DONATION Fourth Report of the
National Transplant Registry 2007
Table 8.13a: Type of Hospital/Institution Where Donors Originated, 1997-2007 Hospital/Institution 1997
N=5 1998 N=7
1999 N=4
2000 N=13
2001 N=24
2002 N=30
No. % No. % No. % No. % No. % No. % MOH state/general hospitals 2 40 5 71 1 25 10 77 16 67 19 63 MOH district hospitals 0 0 0 0 0 0 2 15 0 0 2 7 University hospitals 1 20 1 14 0 0 0 0 6 25 4 13 Private hospitals 1 20 1 14 3 75 1 8 2 8 4 13 Home (eye donors only) 1 20 0 0 0 0 0 0 0 0 1 3
Hospital/Institution 2003 N=25
2004 N=16
2005 N=13
2006 N=25
2007 N=25
Total N=187
No. % No. % No. % No. % No. % No. % MOH state/general hospitals 15 60 12 75 7 54 17 68 18 72 105 66 MOH district hospitals 4 16 2 13 0 0 1 4 3 12 10 7 University hospitals 3 12 1 6 1 8 3 12 2 8 20 12 Private hospitals 3 12 1 6 5 38 4 16 2 8 25 14 Home (eye donors only) 0 0 0 0 0 0 0 0 0 0 2 1
Figure 8.13a: Type of Hospital/Institution Where Donors Originated, 1997-2007
0
5
10
15
20
25
30
35
1997 1998 1999 2000 2001 2002 2003 2004 2005 2006 2007
Year
No.
of d
onor
s
MOH state/general hospitals MOH district hospitalsUniversity hospitals Private hospitalsHome (eye donors only)

186
CADAVERIC ORGAN AND TISSUE DONATION Fourth Report of the National Transplant Registry 2007
Table 8.13b: Location Where Donors Were Referred From, 1997-2007 Location 1997
N=5 1998 N=7
1999 N=4
2000 N=13
2001 N=24
2002 N=30
No. % No. % No. % No. % No. % No. % ICU 1 20 0 0 0 0 1 8 14 58 16 53 Ward 0 0 0 0 0 0 0 0 0 0 1 3 Emergency department 0 0 0 0 0 0 0 0 3 13 4 13 Mortuary 0 0 0 0 0 0 0 0 0 0 3 10 Home 0 0 0 0 0 0 0 0 0 0 1 3 Data not available 4 80 7 100 4 100 12 92 7 29 5 17
Location 2003 N=25
2004 N=16
2005 N=13
2006 N=25
2007 N=25
Total N=187
No. % No. % No. % No. % No. % No. % ICU 13 52 12 75 8 62 16 64 17 68 98 52 Ward 3 12 1 6 3 23 3 12 1 4 12 6 Emergency department 1 4 0 0 0 0 3 12 1 4 12 6 Mortuary 6 24 3 19 1 8 3 12 5 20 21 11 Home 0 0 0 0 0 0 0 0 0 0 1 1 Data not available 2 8 0 0 1 8 0 0 1 4 43 23
Figure 8.13b: Location Where Donors Were Referred From, 1997-2007
0
5
10
15
20
25
30
35
1997 1998 1999 2000 2001 2002 2003 2004 2005 2006 2007
Year
No.
of d
onor
s
ICU WardEmergency department MortuaryHome Data not available

187
CADAVERIC ORGAN AND TISSUE DONATION Fourth Report of the
National Transplant Registry 2007
Table 8.13c: Location Where Procurement Was Carried Out, 1997-2007 Donor Procurement Site 1997
N=5 1998 N=7
1999 N=4
2000 N=13
2001 N=24
2002 N=30
No. % No. % No. % No. % No. % No. % Operation theatre 4 80 6 86 4 100 11 85 20 83 14 47 Mortuary 0 0 1 14 0 0 2 15 3 13 14 47 Ward 0 0 0 0 0 0 0 0 1 4 1 3 Home 1 20 0 0 0 0 0 0 0 0 1 3 Data not available 0 0 0 0 0 0 0 0 0 0 0 0
Donor Procurement Site 2003 N=25
2004 N=16
2005 N=13
2006 N=25
2007 N=25
Total N=187
No. % No. % No. % No. % No. % No. % Operation theatre 8 32 9 56 5 38 14 56 16 64 111 59 Mortuary 14 56 7 44 5 38 10 40 7 28 63 34 Ward 3 12 0 0 2 15 1 4 2 8 10 5 Home 0 0 0 0 0 0 0 0 0 0 2 1 Data not available 0 0 0 0 1 8 0 0 0 0 1 1
Figure 8.13c: Location Where Procurement Was Carried Out, 1997-2007
0
5
10
15
20
25
30
35
1997 1998 1999 2000 2001 2002 2003 2004 2005 2006 2007
Year
No.
of d
onor
s
Operation theatre Mortuary Ward
Home Data not available

188
Fourth Report of the National Transplant Registry 2007 APPENDIX A
APPENDIX A
DATA MANAGEMENT
Data integrity of a register begins from the data source, data collection tools, data verification and data entry process. Registry data is never as perfect as the clinical trial data. Caution should be used when interpreting the result.
The data management personnel in the Register are trained based on the standard operating procedure (SOP). The data entry process is also designed to enhance data quality. Quality assurance procedures are in place at all stages to ensure the quality of data.
The NTR maintains different databases for each of the organs i.e. blood and marrow transplant, bone and tissue transplant, cornea transplant, heart and lung transplant, kidney transplant and liver transplant. Depending on the volume of data, each organ’s data were stored in either Microsoft Access or SQL Server 2000.
Registry ICT infrastructure and data centreThe operations of the NTR are supported by an extensive ICT infrastructure to ensure operational efficiency and effectiveness.
NTR subscribes to co-location service with a high availability and highly secured data centre at Cyberjaya and at Jalan Pahang, Kuala Lumpur. This is in order to provide NTR with quality assured internet hosting services and state-of-the-art physical and logical security features without having to invest in costly data centre setup internally. State-of-the-art physical security features implemented includes anti-static raised flooring, fire protection with smoke and heat alarm warning system, biometric security access, video camera surveillance system, uninterrupted power supply, environmental control.
Other managed security services include patch management of the servers, antivirus signature monitoring and update, firewall traffic monitoring and intrusion detection, security incidence response, data backup service done on a daily, weekly and monthly basis, data recovery simulation to verify that backup works which is done at least once yearly, network security scan and penetration test done on a half-yearly basis, security policy maintenance, maintenance and monitoring of audit trail. Managed system services are also provided such as usage and performance report, operating system maintenance and monitoring, bandwidth monitoring and systems health monitoring.
Data sourcesSDPs or Source Data Providers of the National Transplant Registry comprise of centres for various transplanted organs throughout Malaysia. Bone and tissue transplant, cornea transplant, kidney transplant and liver transplant SDPs submit Case Report Forms (CRFs) to NTR. Blood and marrow transplant (BMT) and heart and lung transplant (HLT) SDPs submit data via web applications NTR-BMT and NTR-HLT respectively.

189
APPENDIX A Fourth Report of the
National Transplant Registry 2007
For the purpose of verifying patient’s outcome regarding death and lost to follow-up, NTR uses data from the National Vital Registration System.
Data Flow ProcessThis section describes the data management flow process of the National Transplant Registry.
1) SDP
2) Data reporting by SDP & Tracking Submission.
4) Edit Checks Run
5) Data review and coding
6) Expert Panel Review
7) Final Query resolution / data cleaning(if any)
8) Database lock
9) Data analysis and report writing
10) Query
3) Visual review, Data Entry, Data Editing
SDP Data reporting and Submission tracking Data reporting by SDP is done via Case Report Forms or Web Applications e-Case Report Forms. Different types of forms are used for different organs/tissues.
For blood and marrow transplant, NTR collects data via Blood and Marrow Transplant Notification Form and Blood and Marrow Ad Hoc Event Notification Form through web application NTR-BMT. Data collected from NTR-BMT is synchronised daily to a master database in CRC to track data submission and generate queries to site. All retrospective data was mapped and transferred to the current system.
For bone and tissue transplant, NTR collects data via Bone and Tissue Transplant Notification Form.
For cornea transplant, NTR collects data via Cornea Transplant Notification Form and Cornea Transplant Outcome Form.
For heart and lung transplant, NTR collects data via Malaysian Heart and Lung Transplant Notification Form and Malaysian Heart and Lung Transplant Follow-Up Form through web application NTR-HLT. Data collected from NTR-HLT is synchronised daily to a master database in NTR to track data submission and generate queries to site.

190
Fourth Report of the National Transplant Registry 2007 APPENDIX A
For kidney transplant, NTR collects data via Renal Transplant Notification Form and Renal Transplant Outcome Form. For annual survey purposes, NTR also collects data via Renal Transplant Annual Return Form and Renal Transplant Annual Quality of Life and Rehabilitation Assessment Form. To further ensure timeliness of notification, any patient who has been notified to National Renal Registry as transplanted will be automatically flagged to NTR. Similarly, NTR also automatically flags to NRR if there’s a patient with graft failure.
For liver transplant, NTR collects data via Liver Transplant Notification Form.
Data submissions by SDPs of Bone and Tissue, Cornea, Kidney and Liver Transplant were tracked by NTR Computer System collectively.
Visual review will then be performed to check for completeness and obvious errors or problems. Data without obvious problems were entered into the relevant NTR organ’s system. Data entry will not be performed if a critical variable on the CRF is missing or ambiguous. The CRF is returned to the SDP for verification. Prior to registering patient, a verification process is done to ensure there are no duplicate patients and/or notifications. After verification, data is then entered into the relevant NTR organ system.
There are a few in-built functionalities at the data entry page that serve to improve data quality. One such function is auto calculation functionality to reduce error of human calculation. There is also inconsistency check functionality that disables certain fields if they are answered in a certain manner. When value entered is out of range, user is prompted for correct value.
Real time reports are also provided in the web application. The aggregated data reports are presented in the form of tables and graphs. The aggregated data reports are typically presented in two manners, one as centre’s own data aggregated data report and second as registry’s overall aggregated data report. Each participating site submitting data via the web application is therefore able to compare itself against the overall registry’s average.
Visual Review, Data Entry, Data Editing Data received by the NTR was logged in and manually reviewed to check for completeness and obvious errors or problems. Data without obvious problems was entered into the relevant NTR’s organ transplant system. Data with problems was sent to SDP as queries. As data for kidney transplant is inter-related with National Renal Registry’s patient data, an additional verification process is performed to ensure no duplicate patient and renal replacement therapy is reported.
Edit Check Run Edit checks were performed periodically to identify missing data, out of range values, inconsistent data, invalid values and error with duplication. Data cleaning is then performed based on the results of edit checks. Data discrepancies that were resolved were then entered into the system. Data update and data checking of the dataset is performed when there is a query of certain fields when necessary. It could be due to request by user, correction of data based on checking from data query or after

191
APPENDIX A Fourth Report of the
National Transplant Registry 2007
receiving results for preliminary data analysis. Any data discrepancy found is verified against the source CRF and resolved within the Register office where possible. Otherwise the specific data query report will be generated and forwarded to the SDP to clarify and resolve the data discrepancy. Data standardisation process is also done for missing data based on derivation from existing data.
Data Review and Coding Data coding of retrospective data and free text data was performed by registry manager and further verified by expert panel member. The expert panel comprising of members with expertise and knowledge in the relevant area provided the quality control on the assessment of coding by data manager. They ensure that complex medical data are reviewed and assessed to detect clinical nuances in the data.
Final Query Resolution / Data Cleaning / Database Lock A final edit check run was performed to ensure that data is clean. All queries were resolved before the database is locked to ensure data quality and integrity. Data is subsequently exported to the statistician for analysis.
Data Release Policy One of the primary objectives of the Registry is to make data available to the transplant community. The Registry would appreciate that users acknowledge the Registry for the use of the data. Any request for data that requires a computer run must be made in writing (by e-mail, fax, or registered mail) accompanied with a Data Release Application Form and signed Data Release Agreement Form. These requests need prior approval by the Advisory Board before data can be released.
Distribution of Report The MST has made a grant towards the cost of running the registry and report printing to allow distribution to all members of the association and the source data producers. The report will also be distributed to Health Authorities and international registries.
Further copies of the report can be made available with a donation of RM60.00 to offset the cost of printing.

Fourth Report of the National Transplant Registry 2007 APPENDIX B
192
APPENDIX B
STATISTICAL METHODS FOR NTR
The statistical methods described were used to summarise the data collected from the National Transplant Registry (NTR). These analyses were generated for different types of transplant, such as bone and marrow, bone and tissue, cornea, heart and lung, liver and kidney.
1. OverallThe stock and flow tables summarised transplant activity in Malaysia. Places and centres of transplant activities were also reported. Treatment rate was calculated by the ratio of the count of number of new patients or prevalent patients in a given year to the mid-year population of Malaysia in that year, and expressed in per million-population. Annual death rates are calculated by dividing the number of deaths in a year by the estimated mid-year patient population.
2. Recipient’s Characteristics The information on recipient’s characteristics was summarised in this section. These tables included the recipient’s age, gender, ethnic group, serology data, primary disease(s), indication for transplantation, current immunosuppressive drug(s) treatment, etc. For summarising continuous data, the mean, standard deviation, median, minimum and maximum were reported. On the other hand, both the count and percentages were reported for discrete data. Invariably, there are situations where there is missing data. For purposes of analysis, subjects with missing continuous data had their values imputed by using the mean from measures of other records. For discrete data, analysis was confined to available data and no imputation was done.
3. Transplant Activity These tables provided the information on transplant activity, such as the time of transplant, type of transplant, duration of surgery etc.
4. OutcomeThe outcome of a transplant activity was tabulated in this section. Kaplan Meier method was used to estimate the probability of survival at different durations.
Time trend analysis was used to assess the association between time (e.g. year) and response variables (e.g. outcome). Statistical tests such as Spearman correlation test and chi-square test may be used to test whether or not the linear trend is statistically significant. Unfortunately, this was not performed as the registry is in its third year of operation. As more data is accrued to its database over time, time trend analysis will be of interest in future.

193
APPENDIX C Fourth Report of the
National Transplant Registry 2007
APPENDIX C
GLOSSARY
AIIRB Angiotensin II Receptor Blocker ACE Angiotensin Converting Enzyme ACRM Association of Clinical Registries, Malaysia ADPKD Autosomal Dominant Polycystic Kidney Disease AG Antigen ALL Acute Lymphocytic Leukaemia ALP Alkaline Phosphatase ALT Alanine Transferase AML Acute Myelogenous Leukaemia ARDS Acute Respiratory Distress Syndrome ASH Ampang Puteri Specialist Hospital AVM Arterio-venous Malformation AZA Azathioprine BMI Body Mass Index BMT Blood and Marrow Transplantation BP Blood Pressure BD Brain Death BID brought in dead CAPD Continuous Ambulatory Peritoneal Dialysis CDA Congenital Dyserythropoeitic Anaemia CF Counting Fingers CHD Coronary Heart Disease CIBMTR Center For International Blood and Marrow Transplant Research CKD Chronic Kidney Disease CMV Cytomegalovirus CRC Clinical Research Centre CRF Case Report Form DCD Donations after Cardiac Death DF Deep Frozen DFS Disease-free Survival FD Freeze Dried FK506 Tacrolimus GCT Germ Cell Tumour GFR Glomerular Filtration Rate GMC Gleneagles Medical Centre GS Gentamicin and Streptomycin GVHD Graft Versus Host Disease Hb Haemoglobin HbsAg Hepatitis B surface Antigen HCV Hepatitis C Virus HD Haemodialysis HDL High Density Lipoprotein HKL Hospital Kuala Lumpur
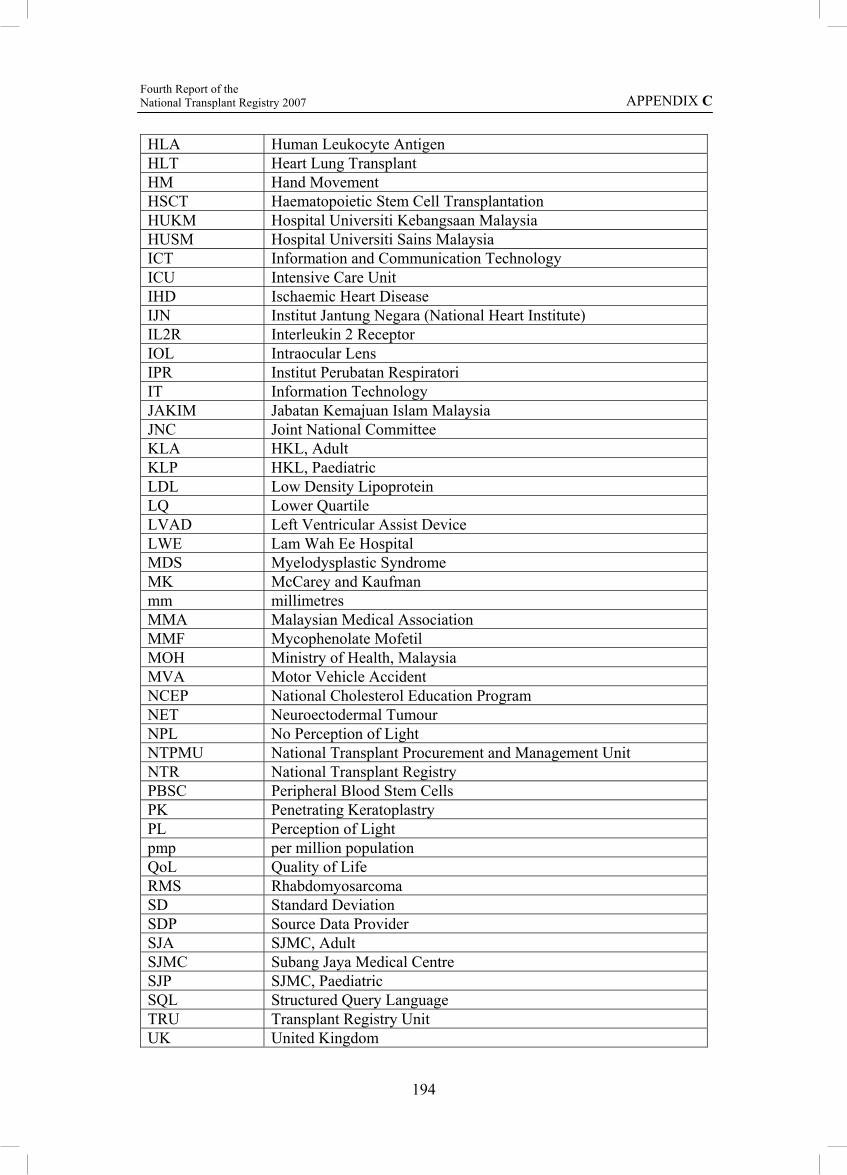
194
Fourth Report of the National Transplant Registry 2007 APPENDIX C
HLA Human Leukocyte Antigen HLT Heart Lung Transplant HM Hand Movement HSCT Haematopoietic Stem Cell Transplantation HUKM Hospital Universiti Kebangsaan Malaysia HUSM Hospital Universiti Sains Malaysia ICT Information and Communication Technology ICU Intensive Care Unit IHD Ischaemic Heart Disease IJN Institut Jantung Negara (National Heart Institute) IL2R Interleukin 2 Receptor IOL Intraocular Lens IPR Institut Perubatan Respiratori IT Information Technology JAKIM Jabatan Kemajuan Islam Malaysia JNC Joint National Committee KLA HKL, Adult KLP HKL, Paediatric LDL Low Density Lipoprotein LQ Lower Quartile LVAD Left Ventricular Assist Device LWE Lam Wah Ee Hospital MDS Myelodysplastic Syndrome MK McCarey and Kaufman mm millimetres MMA Malaysian Medical Association MMF Mycophenolate Mofetil MOH Ministry of Health, Malaysia MVA Motor Vehicle Accident NCEP National Cholesterol Education Program NET Neuroectodermal Tumour NPL No Perception of Light NTPMU National Transplant Procurement and Management Unit NTR National Transplant Registry PBSC Peripheral Blood Stem Cells PK Penetrating Keratoplastry PL Perception of Light pmp per million population QoL Quality of Life RMS Rhabdomyosarcoma SD Standard Deviation SDP Source Data Provider SJA SJMC, Adult SJMC Subang Jaya Medical Centre SJP SJMC, Paediatric SQL Structured Query Language TRU Transplant Registry Unit UK United Kingdom
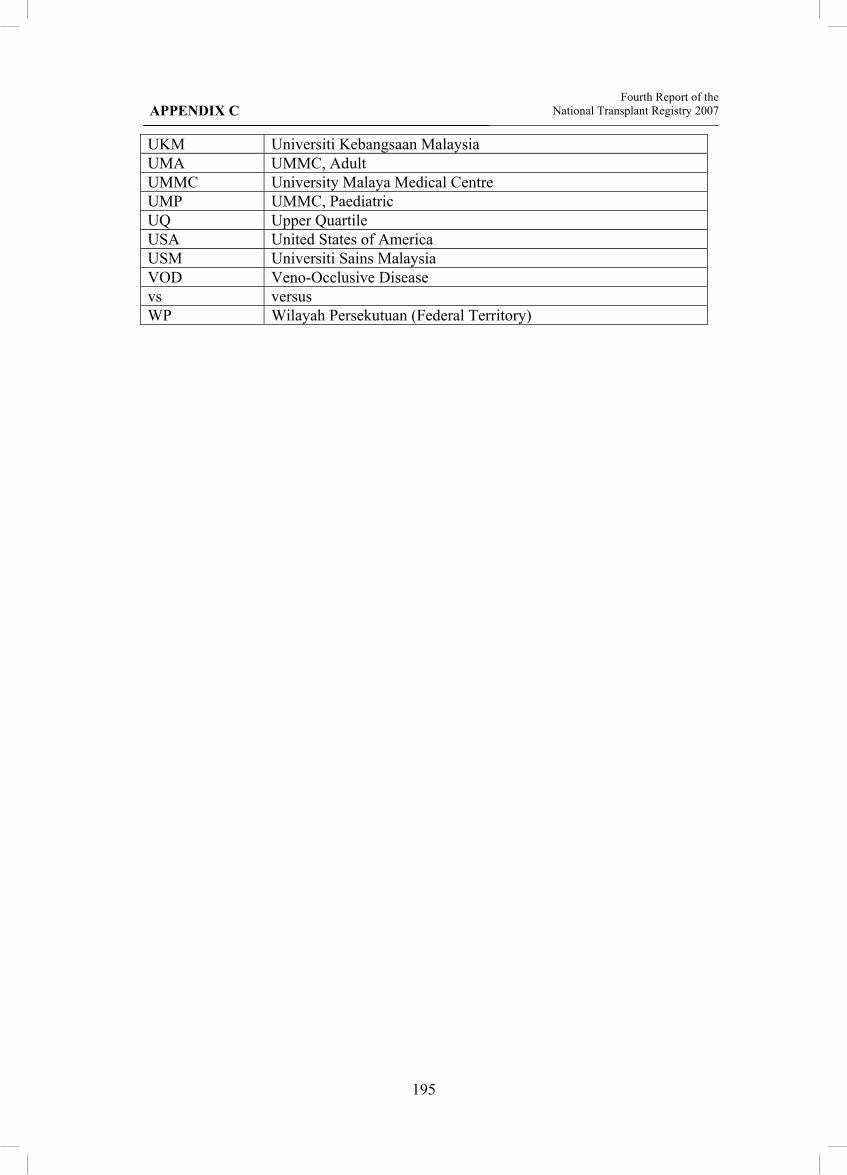
195
APPENDIX C Fourth Report of the
National Transplant Registry 2007
UKM Universiti Kebangsaan Malaysia UMA UMMC, Adult UMMC University Malaya Medical Centre UMP UMMC, Paediatric UQ Upper Quartile USA United States of America USM Universiti Sains Malaysia VOD Veno-Occlusive Disease vs versus WP Wilayah Persekutuan (Federal Territory)

196
Lam Wah Ee Hospital Oncology-Haematology Department Jalan Tan Sri Teh Ewe Lim 11600 Penang Tel : ( 04)6528836 Fax : ( 04)6570940
Sime Darby Medical Centre Subang Jaya Haematology Department 1, Jalan SS 12/1A 47500 Subang Jaya Selangor Darul Ehsan Tel : ( 03)56391212 Fax : ( 03)56391209
Sime Darby Medical Centre Subang Jaya Paediatrics BMT Unit 1, Jalan SS 12/1A 47500 Subang Jaya Selangor Darul Ehsan Tel : ( 03)56306361 Fax : ( 03)56306209
APPENDIX D
DIRECTORY OF PARTICIPATING CENTRES
Blood and Marrow Transplant Services
MOH
Hospital Ampang Jalan Mewah Utara Pandan Mewah 68000 Ampang Kuala Lumpur Tel : ( 03)42896000 Ext : 6381 Fax : ( 03)42970059
Hospital Kuala Lumpur Paediatrics BMT Unit Institute Paediatrics Jalan Pahang 50586 Kuala Lumpur Tel : ( 03)26155555 Ext : 6905 Fax : ( 03)26948187
PRIVATE
Ampang Puteri Specialist Hospital 1 Jalan Mamanda 9 68000 Ampang Selangor Darul Ehsan Tel : ( 03)42702500 Ext : 4478 Fax : ( 03)42702938
Gleneagles Medical Centre, Penang Oncology-Haematology Department 1, Jalan Pangkor 10050 Penang Tel : ( 04)2202189 Fax : ( 04)2262994
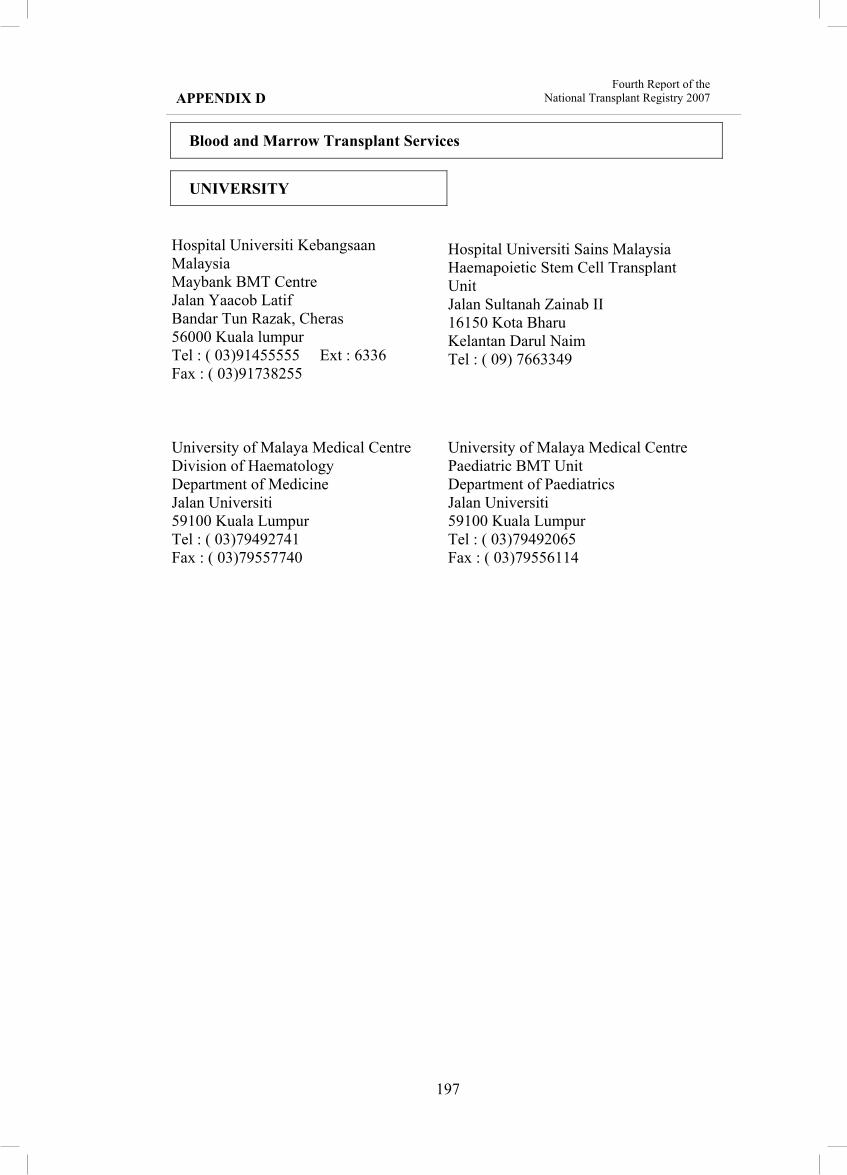
197
Blood and Marrow Transplant Services
UNIVERSITY
Hospital Universiti Kebangsaan Malaysia Maybank BMT Centre Jalan Yaacob Latif Bandar Tun Razak, Cheras 56000 Kuala lumpur Tel : ( 03)91455555 Ext : 6336 Fax : ( 03)91738255
Hospital Universiti Sains Malaysia Haemapoietic Stem Cell Transplant UnitJalan Sultanah Zainab II 16150 Kota Bharu Kelantan Darul Naim Tel : ( 09) 7663349
University of Malaya Medical Centre Division of Haematology Department of Medicine Jalan Universiti 59100 Kuala Lumpur Tel : ( 03)79492741 Fax : ( 03)79557740
University of Malaya Medical Centre Paediatric BMT Unit Department of Paediatrics Jalan Universiti 59100 Kuala Lumpur Tel : ( 03)79492065 Fax : ( 03)79556114

198
Bone and Tissue Transplant Services
MOH
Hospital Ipoh Department of Orthopaedics Jalan Hospital 30990 Ipoh Perak Darul Ridzuan Tel : ( 05)5222460 Fax : ( 05)2412826
Hospital Kajang Orthopaedics Department Jalan Semenyih 43000 Kajang Selangor Darul Ehsan Tel : ( 03)87363333
Hospital Kangar Jabatan Ortopedik & Traumatologi Jalan Kolam 01000 Kangar Perlis Indera Kayangan Tel : ( 04)9763333 Ext : 1184 Fax : ( 04)9767237
Hospital Kuala Lumpur Institute of Orthopaedic & Traumatology Jalan Pahang 50586 Kuala Lumpur Tel : ( 03)26155555 Ext : 5543/5534 Fax : ( 03)26927281
Hospital Kuala Lumpur Ophthalmology Department Jalan Pahang 50586 Kuala Lumpur Tel : ( 03)26155555 Ext : 6801 Fax : ( 03)26925276
Hospital Kuantan Department of Orthopaedics Jalan Tanah Puteh 25100 Kuantan Pahang Darul Makmur Tel : ( 09)5133333 Ext : 2903 Fax : ( 09)5142712
Hospital Pakar Sultanah Fatimah Orthopaedics Department Jalan Salleh 84000 Muar Johor Darul Takzim Tel : ( 06)9521901
Hospital Pulau Pinang Department of Orthopaedics Jalan Residensi 10990 Pulau Pinang Tel : ( 04)2225127 Fax : ( 04)2226127
Hospital Raja Perempuan Zainab II Department of Surgery Jalan Hospital 15590 Kota Bharu Kelantan Darul Naim Tel : ( 09)7452000 Ext : 2013/2237 Fax : ( 09) 7475418
Hospital Raja Perempuan Zainab II Department of Orthopaedics Jalan Hospital 15590 Kota Bharu Kelantan Darul Naim Tel : ( 09)7485533 Ext : 2374/2364 Fax : ( 09)7486951

199
Bone and Tissue Transplant Services
MOH
Hospital Seberang Jaya Orthopaedics Department Bandar Baru 13700 Seberang Jaya Pulau Pinang Tel : ( 04)3983333
Hospital Sultanah Aminah Orthopaedics Department 80100 Johor Bahru Johor Darul Takzim Tel : ( 07)2231666
Hospital Sultanah Bahiyah Ophthalmology Department 06550 Alor Setar Kedah Darul Aman Tel : ( 04)7002248Fax : ( 04)7323770
Hospital Sultanah Bahiyah Department of Orthopaedic Surgery 06550 Alor Setar Kedah Darul Aman Tel : ( 04)7303333 Ext : 179 Fax : ( 04)7323770
Hospital Sultanah Bahiyah Department of Orthopaedic Surgery 06550 Alor Setar Kedah Darul Aman Tel : ( 04)7303333 Ext : 179 Fax : ( 04)7323770
Hospital Sultanah Nur Zahirah Orthopaedic Department Jalan Sultan Mahmud 20400 Kuala Terengganu Terengganu Darul Iman Tel : ( 09)6212121
Hospital Sungai Buloh Ophthalmology Department 47000 Sungai Buloh Selangor Darul Ehsan Tel : ( 03)61561324
Hospital Taiping Department of Orthopaedic Surgery Jalan Taming Sari 34000 Taiping Perak Darul Ridzuan Tel : ( 05)8408037 Fax : ( 05)8073894
Hospital Teluk Intan Ophthalmology Department Jalan Changkat Jong 36000 Teluk Intan Perak Darul Ridzuan Tel :( 05)6213333 Ext : 1330 Fax : ( 05)6237343
Hospital Tengku Ampuan Afzan Ophthalmology Department 25100 Kuantan Pahang Darul Makmur Tel : ( 09)5133333 Ext : 2454 Fax : ( 09)5142712
Hospital Tengku Ampuan Rahimah Ophthalmology Department 41200 Klang Selangor Darul Ehsan Tel : ( 03)33723333 Ext : 1336 Fax : ( 03)33729089

200
Bone and Tissue Transplant Services
MOH
Hospital Tengku Ampuan Rahimah Orthopaedic Clinic 41200 Klang Selangor Darul Ehsan Tel : ( 03)33723333 Ext : 1225 Fax : ( 03)33729089
Hospital Umum Sarawak Orthopaedic Department 93586 Kuching SarawakTel : (082)276433 Fax : (082)419495
PRIVATE
Hospital Fatimah 1, Jalan Chew Peng Loon Ipoh Garden 31400 Ipoh Perak Darul Ridzuan Tel : ( 05)5455777 Fax : ( 05)5477050
Island Hospital 308, Macalister Road 10450 Penang Pulau Pinang Tel : ( 04)2205527 Fax : ( 04)2267989
Kota Bharu Medical Centre Lot 179-184, Section 24 Jalan Sultan Yahya Petra 15200 Lundang, Kota Bharu Kelantan Darul Naim Tel : ( 09)7433399 Fax : ( 09)7433800
Normah Medical Specialist Centre P.O Box 3298 93764 Kuching SarawakTel : (082)440055 Fax : (082)442600
Seremban Specialist Hospital Wan Orthopaedic, Trauma & Sports Injury Centre (WOTSIC) Suite 17, Seremban Specialist Hospital, Jalan Toman 1, Kemayan Square 70200 Seremban Negeri Sembilan Darul Khusus Tel : ( 06)7677800 Ext : 130 / 131 Fax : ( 06)7675900
Sri Kota Medical Centre Ophthalmology Department Jalan Mohet 41000 Klang Selangor Darul Ehsan Tel : ( 03)33733636 Fax : ( 03)33736888
Timberland Medical Centre Lorong 2, 2 1/2 miles Rock Road 93250 Kuching SarawakTel : (082)234466 Ext : 503 Fax : (082)232259

201
Bone and Tissue Transplant Services
UNIVERSITY
Hospital Universiti Sains Malaysia Ophthalmology Department 16150 Kubang Kerian Kelantan Darul Naim Tel : ( 09)7664370Fax : (09)7653370
Hospital Universiti Sains Malaysia Orthopaedics Department 16150 Kota Bharu Kelantan Darul Naim Tel : ( 09) 7664509 Fax : ( 09) 7653370
International Islamic University Malaysia Department of Orthopaedics, Traumatology and Rehabilitation Kulliyah of Medicine Jalan Hospital 25100 Kuantan Pahang Darul Makmur Tel : ( 09)5132797 Fax : ( 09)5151518
University of Malaya Medical Centre Department of Orthopaedics Surgery Jalan Universiti 59100 Kuala Lumpur Tel : ( 03)79492061 Fax : ( 03)79535642
TISSUE BANK
National Tissue Bank Universiti Sains Malaysia Health Campus 16150 Kota Bharu Kelantan Darul Naim Tel : ( 09)7664344 Fax : ( 09)7653307

202
Bone and Tissue Transplant Services
BONE BANK
Bone Bank, Hospital Kuala Lumpur Institute of Orthopaedic & Traumatology Jalan Pahang 50586 Kuala Lumpur Tel : ( 03)26155555 Ext : 5543/5534 Fax : ( 03)26927281
Bone Bank, University of Malaya Medical Centre Department of Orthopaedics Surgery Jalan Universiti 59100 Kuala Lumpur Tel : ( 03)79492061 Fax : ( 03)79535642
IRRADIATION CENTRE
Malaysian Nuclear Agency Research Tissue Bank Nuclear Agensi Malaysia Bangi43000 Kajang Selangor Darul Ehsan Tel : ( 03) 89250510 Ext : 1611 Fax : ( 03) 89282956

203
Cornea Transplant Services
MOH
Hospital Batu Pahat Ophthalmology Department 83000 Batu Pahat Johor Darul Takzim Tel : ( 07)4341999 Fax : ( 07)4322544
Hospital Bukit Mertajam Ophthalmology Department Jalan Kulim 14000 Bukit Mertajam Pulau Pinang Tel : ( 04)5383333 Ext : 256 / 259 Fax : ( 04)5388435
Hospital Duchess of Kent Ophthalmology Department KM 3.2 Jalan Utara 90000 Sandakan SabahTel : (089)212111 Fax : (089)213607
Hospital Ipoh Ophthalmology Department Jalan Hospital 30990 Ipoh Perak Darul Ridzuan Tel : ( 05)5222034 Fax : ( 05)2531541
Hospital Kangar Ophthalmology Department Jalan Kolam 01000 Kangar Perlis Indera Kayangan Tel : ( 04)9763333 Ext : 2031 Fax : ( 04)9767237
Hospital Kuala Lipis Ophthalmology Department 27200 Kuala Lipis Pahang Darul Makmur Tel : ( 09)3123333 Ext : 114 Fax : ( 09)3121787
Hospital Kuala Lumpur Ophthalmology Department Jalan Pahang 50586 Kuala Lumpur Tel : ( 03)26155555 Ext : 6801 Fax : ( 03)26925276
Hospital Kuala Pilah Ophthalmology Department 72000 Kuala Pilah Negeri Sembilan Darul Khusus Tel : ( 06)4818001 Ext : 170 / 175 Fax : ( 06)4818010
Hospital Melaka Ophthalmology Department Jalan Mufti Haji Khalil 75400 Melaka MelakaTel : ( 06)2707215 Fax : ( 06)2818488
Hospital Mentakab Ophthalmology Department Jalan Maran 28900 Temerloh Pahang Darul Makmur Tel : ( 09)2955333 Ext : 1570 Fax : ( 09)2972468

204
Cornea Transplant Services
MOH
Hospital Miri Ophthalmology Department Jalan Cahaya 98000 Miri SarawakTel : (085)420033 Ext : 148 Fax : (085)416514
Hospital Pakar Sultanah Fatimah Ophthalmology Department Jalan Salleh 84000 Muar Johor Darul Takzim Tel : ( 07)9521901 Ext : 147 / 227
Hospital Pulau Pinang Eye Clinic Jalan Residensi 10990 Georgetown Pulau Pinang Tel : ( 04)2002283 Fax : ( 04)2281737
Hospital Putrajaya Ophthalmology Department Pusat Pentadbiran Kerajaan Persekutuan Presint 7 62250 Putra Jaya Selangor Darul Ehsan Tel : ( 03)83124200 Ext : 4231/4279 Fax : ( 03)88880137
Hospital Queen Elizabeth Ophthalmology Department 88586 Kota Kinabalu SabahTel : (088)206153 Fax : (088)252827
Hospital Raja Perempuan Zainab II Ophthalmology Department Jalan Hospital 15586 Kota Bharu Kelantan Darul Naim Tel : ( 09)7485533 Ext : 2254 Fax : ( 09)7502236
Hospital Selayang Ophthalmology Department Lebuhraya Selayang-Kepong Batu Caves 68100 Bandar Baru Selayang Selangor Darul Ehsan Tel : ( 03)61367788 Ext : 4069/3254 Fax : ( 03)61207564
Hospital Sibu Ophthalmology Department Batu 5 1/2 Jalan Ulu Oya 96000 Sibu SarawakTel : (084)343333 Ext : 1008/1009 Fax : (084)337354
Hospital Sultan Ismail Ophthalmology Department Jalan Persiaran Mutiara Emas Utama 81100 Johor Bahru Johor Darul Takzim Tel : ( 07)3565000 Fax : ( 07)3565034
Hospital Sultanah Aminah Ophthalmology Department 80100 Johor Bahru Johor Darul Takzim Tel : ( 07)2231666 Ext : 2690 Fax : ( 07)2242694

205
Cornea Transplant Services
MOH
Hospital Sultanah Bahiyah Ophthalmology Department 05460 Alor Setar Kedah Darul Aman Tel : ( 04)7407873 Fax : ( 04)7406154
Hospital Sultanah Nur Zahirah Ophthalmology Department Jalan Sultan Mahmud 20400 Kuala Terengganu Terengganu Darul Iman Tel : ( 09)6212121 Ext : 2727/2024 Fax : ( 09)6317871
Hospital Sungai Buloh Ophthalmology Department Jalan Hospital 47000 Sungai Buloh Selangor Darul Ehsan Tel : ( 03)61561324 Fax : ( 03)61562470
Hospital Sungai Petani Ophthalmology Department 08000 Sungai Petani Kedah Darul Aman Tel : ( 04)4213333 Ext : 127 Fax : ( 04)4212403
Hospital Taiping Ophthalmology Department Jalan Taming Sari 34000 Taiping Perak Darul Ridzuan Tel : ( 05)8083333 Ext : 8050/8053 Fax : ( 05)8073894
Hospital Tawau Ophthalmology Department P.O. Box 67 91007 Tawau SabahTel : (089)773533 Ext : 179 Fax : (089)768626
Hospital Teluk Intan Ophthalmology Department Jalan Changkat Jong 36000 Teluk Intan Perak Darul Ridzuan Tel : ( 05)6213333 Ext : 1330 Fax : ( 05)6237343
Hospital Tengku Ampuan Afzan Ophthalmology Department 25100 Kuantan Pahang Darul Makmur Tel : ( 09)5133333 Ext : 2454 Fax : ( 09)5142712
Hospital Tengku Ampuan Rahimah Ophthalmology Department Jalan Langat 41200 Klang Selangor Darul Ehsan Tel : ( 03)33723333 Ext : 1336/1338 Fax : ( 03)33729089
Hospital Tuanku Ja'afar Ophthalmology Department Jalan Rasah 70300 Seremban Negeri Sembilan Darul Khusus Tel : ( 06)7623333 Ext : 5120 Fax : ( 06)7625771

206
Cornea Transplant Services
MOH
Hospital Umum Sarawak Opthalmology Department Jalan Tun Ahmad Zaidi Adruce 93586 Kuching SarawakTel : (082)276513 Fax : (082)419495
ARMED FORCES
94 Hospital Angkatan Tentera Kem TerendakOphthalmology Department 76200 Melaka MelakaTel : ( 06)3573201 Ext : 1134/1127 Fax : ( 06)3572108
PRIVATE
International Specialist Eye Centre Level 8, Centrepoint South,The Boulevard, Midvalley City Lingkaran Syed Putra 59200 Kuala Lumpur Tel : ( 03)22848989 Fax : ( 03)22844330
Gleneagles Intan Medical Centre Hope Eye Centre Suite 618 282, Jalan Ampang 50450 Kuala Lumpur Tel : ( 03)42578112 Fax : ( 03)42576112
Gleneagles Medical Centre Ophthalmology Department Pulau Pinang Clinic Sdn Bhd 1, Jalan Pangkor 10050 Pulau Pinang Tel : ( 04)2202147 Fax : ( 04)2272498
Hospital Pantai Indah Ophthalmology Department Jalan Perubatan 1 Pandan Indah 55100 Kuala Lumpur Tel : ( 03)42892947
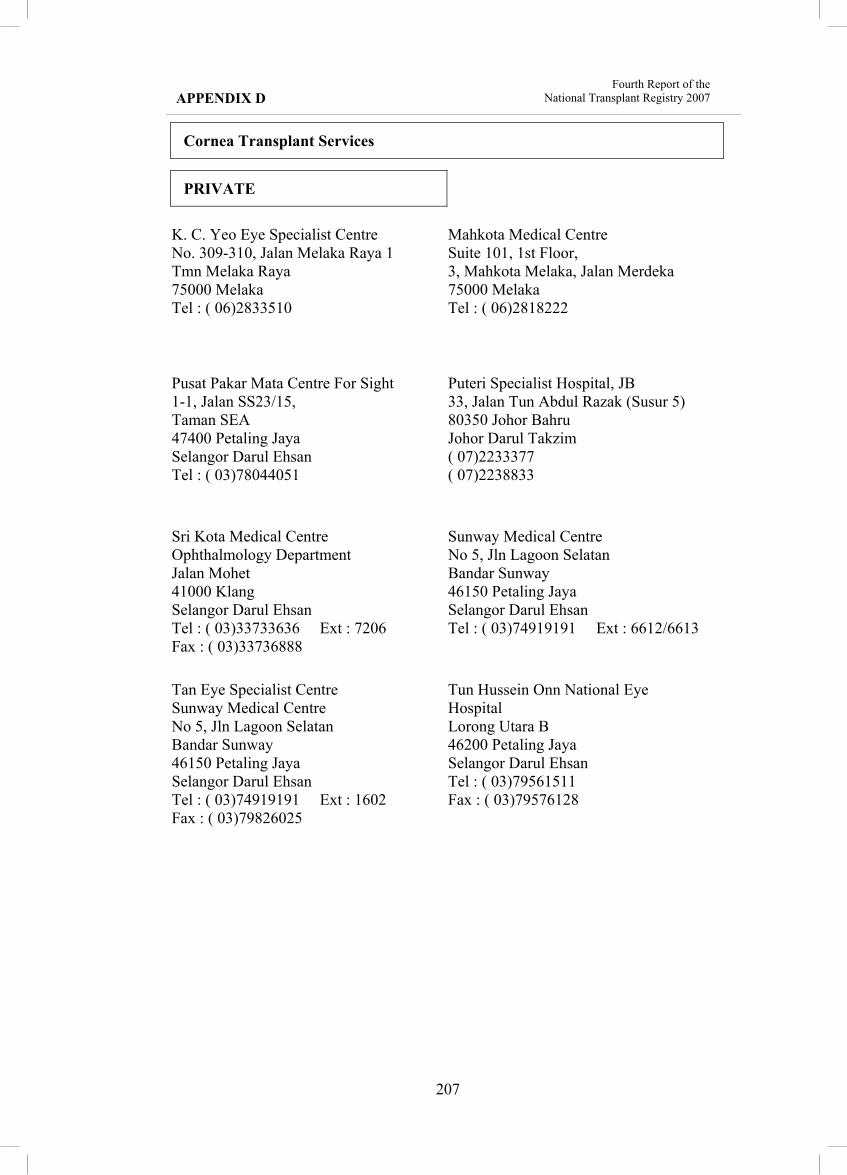
207
Cornea Transplant Services
PRIVATE
K. C. Yeo Eye Specialist Centre No. 309-310, Jalan Melaka Raya 1 Tmn Melaka Raya 75000 Melaka Tel : ( 06)2833510
Mahkota Medical Centre Suite 101, 1st Floor,3, Mahkota Melaka, Jalan Merdeka 75000 Melaka Tel : ( 06)2818222
Pusat Pakar Mata Centre For Sight 1-1, Jalan SS23/15, Taman SEA 47400 Petaling Jaya Selangor Darul Ehsan Tel : ( 03)78044051
Puteri Specialist Hospital, JB 33, Jalan Tun Abdul Razak (Susur 5) 80350 Johor Bahru Johor Darul Takzim ( 07)2233377 ( 07)2238833
Sri Kota Medical Centre Ophthalmology Department Jalan Mohet 41000 Klang Selangor Darul Ehsan Tel : ( 03)33733636 Ext : 7206 Fax : ( 03)33736888
Sunway Medical Centre No 5, Jln Lagoon Selatan Bandar Sunway 46150 Petaling Jaya Selangor Darul Ehsan Tel : ( 03)74919191 Ext : 6612/6613
Tan Eye Specialist Centre Sunway Medical Centre No 5, Jln Lagoon Selatan Bandar Sunway 46150 Petaling Jaya Selangor Darul Ehsan Tel : ( 03)74919191 Ext : 1602 Fax : ( 03)79826025
Tun Hussein Onn National Eye HospitalLorong Utara B 46200 Petaling Jaya Selangor Darul Ehsan Tel : ( 03)79561511 Fax : ( 03)79576128

208
Cornea Transplant Services
UNIVERSITY
Hospital Universiti Kebangsaan Malaysia Ophthalmology Department Faculty of Medicine Jalan Yaacob Latif Bandar Tun Razak, Cheras 56000 Kuala lumpur Tel : ( 03)91702497 Fax : ( 03)91737836
Hospital Universiti Sains Malaysia Ophthalmology Department 16150 Kubang Kerian Kelantan Darul Naim Tel : ( 09)7664370 Fax : ( 09)7653370
University of Malaya Medical Centre Ophthalmology Department Faculty of Medicine 59100 Kuala Lumpur Tel : ( 03) 79502060 Fax : ( 03) 79535635

209
Heart and Lung Transplant Services
MOH
Hospital Kuala Lumpur Institut Perubatan Respiratori Jalan Pahang 50586 Kuala Lumpur Tel : ( 03)40232966 Fax : ( 03)40218807
Institute Jantung Negara Cardiothoracic Department 145, Jalan Tun Razak 50400 Kuala Lumpur Tel : ( 03)26178200 Fax : ( 03)26928418
Heart Valve Transplant Services
MOH
Institute Jantung Negara Cardiovascular Tissue Bank Department Of Cardiothoracic Surgery 145, Jalan Tun Razak 50400 Kuala Lumpur Tel : ( 03)2617 8200 Fax : ( 03)2692 8418
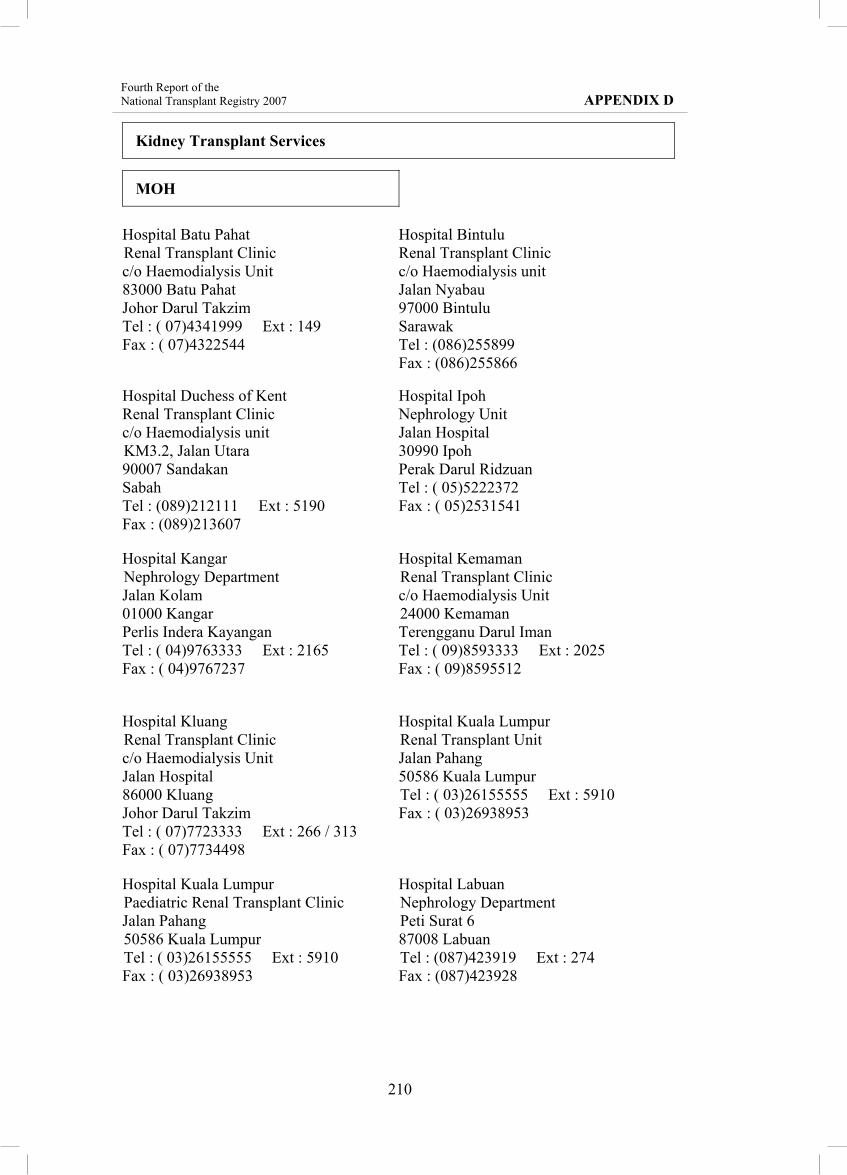
210
Kidney Transplant Services
MOH
Hospital Batu Pahat Renal Transplant Clinic c/o Haemodialysis Unit 83000 Batu Pahat Johor Darul TakzimTel : ( 07)4341999 Ext : 149 Fax : ( 07)4322544
Hospital Bintulu Renal Transplant Clinic c/o Haemodialysis unit Jalan Nyabau 97000 Bintulu SarawakTel : (086)255899 Fax : (086)255866
Hospital Duchess of Kent Renal Transplant Clinic c/o Haemodialysis unit KM3.2, Jalan Utara 90007 Sandakan SabahTel : (089)212111 Ext : 5190 Fax : (089)213607
Hospital Ipoh Nephrology Unit Jalan Hospital 30990 Ipoh Perak Darul Ridzuan Tel : ( 05)5222372 Fax : ( 05)2531541
Hospital KangarNephrology Department Jalan Kolam01000 Kangar Perlis Indera Kayangan Tel : ( 04)9763333 Ext : 2165 Fax : ( 04)9767237
Hospital Kemaman Renal Transplant Clinic c/o Haemodialysis Unit 24000 Kemaman Terengganu Darul Iman Tel : ( 09)8593333 Ext : 2025 Fax : ( 09)8595512
Hospital Kluang Renal Transplant Clinic c/o Haemodialysis Unit Jalan Hospital 86000 Kluang Johor Darul Takzim Tel : ( 07)7723333 Ext : 266 / 313 Fax : ( 07)7734498
Hospital Kuala LumpurRenal Transplant Unit Jalan Pahang 50586 Kuala Lumpur Tel : ( 03)26155555 Ext : 5910 Fax : ( 03)26938953
Hospital Kuala Lumpur Paediatric Renal Transplant Clinic Jalan Pahang 50586 Kuala Lumpur Tel : ( 03)26155555 Ext : 5910 Fax : ( 03)26938953
Hospital Labuan Nephrology Department Peti Surat 6 87008 Labuan Tel : (087)423919 Ext : 274 Fax : (087)423928

211
Kidney Transplant Services
MOH
Hospital Melaka Nephrology Clinicc/o Haemodialysis Unit Jalan Pringgit 70060 Melaka Tel : ( 06)2707648 Fax : ( 06)2813240
Hospital Miri Renal Transplant Clinic c/o Haemodialysis Unit 98000 Miri SarawakTel : (085)420033 Ext : 251 Fax : (085)416514
Hospital Pakar Sultanah Fatimah Renal Transplant Clinic c/o Haemodialysis Unit 84000 Muar Johor Darul TakzimTel : ( 06)9521901 Ext : 116 Fax : ( 06)9526003
Hospital Pontian Renal Transplant Clinic c/o Haemodialysis unit Jalan Alfagoff 82000 Pontian Johor Darul TakzimTel : ( 07)6873333 Ext : 154 Fax : ( 07)6876211
Hospital Pulau Pinang Renal Transplant Clinic c/o Haemodialysis Unit Jalan Residensi 10990 Georgetown Pulau Pinang Tel : ( 04)22253333 Ext : 2397 Fax : ( 04)2281737
Hospital Queen Elizabeth Renal Transplant Clinic c/o CADP Unit 88586 Kota Kinabalu SabahTel : (088)218166 Ext : 284 Fax : (088)211999
Hospital Raja Perempuan Zainab II Renal Transplant Clinic c/o Haemodialysis Unit 15590 Kota Bharu Kelantan Darul NaimTel : ( 09)7452000 Ext : 2234 Fax : ( 09)7452235
Hospital Segamat Renal Transplant Clinic c/o Haemodialysis Unit KM 6 Jalan Genuang 85000 Segamat Johor Darul TakzimTel : ( 07)9433333 Ext : 147 Fax : ( 07)9434641
Hospital Selayang Nephrology Department Lebuhraya Selayang-Kepong 68100 Batu Caves Selangor Darul Ehsan Tel : ( 03)61203233 Ext : 7011/7018 Fax : ( 03)61207564
Hospital Serdang Nephrology Department Jalan Puchong 43000 Kajang Selangor Darul Ehsan Tel : ( 03)89475555 Ext : 1256 Fax : ( 03)89475050

212
Kidney Transplant Services
MOH
Hospital Sibu Renal Transplant Clinic c/o Haemodialysis Unit 96000 Sibu SarawakTel : (084)343333 Ext : 2102 Fax : (084)337354
Hospital Sultan Ismail Pandan Renal Transplant Clinic c/o Haemodialysis Unit Jalan Persiaran Mutiara Emas Utama Taman Mount Austin 81100 Johor Bahru Johor Darul TakzimTel : ( 07)3565000 Ext : 3508 Fax : ( 07)3565034
Hospital Sultan Ismail Pandan Renal Transplant Clinic (Paeds) c/o Paediatrics WardJalan Persiaran Mutiara Emas Utama Taman Mount Austin 81100 Johor Bahru Johor Darul TakzimTel : ( 07)3565000Fax : ( 07)3565034
Hospital Sultanah Aminah Renal Transplant Clinic c/o Haemodialysis Unit Bangunan Bakawali 80590 Johor Bahru Johor Darul Takzim Tel : ( 07)2231666 Ext : 2055/2033 Fax : ( 07)2242694
Hospital Sultanah Bahiyah Renal Transplant Clinic c/o Haemodialysis Unit 06550 Alor Setar Kedah Darul Aman Tel : ( 04)7303333 Ext : 169 / 167 Fax : ( 04)7323770
Hospital Sultanah Nur Zahirah Nephrology Unit 20400 Kuala Terengganu Terengganu Darul Iman Tel : ( 09)6212121 Ext : 2054 Fax : ( 09)6221820
Hospital Taiping Renal Transplant Clinic c/o Haemodialysis unit Jalan Taming Sari 34000 Taiping Perak Darul Ridzuan Tel : ( 05)8083333 Ext : 8173 Fax : ( 05)8073894
Hospital Tawau Renal Transplant Clinic c/o Haemodialysis Unit 91007 Tawau SabahTel : (089)773183 Fax : (089)778626
Hospital Tengku Ampuan Afzan Renal Transplant Clinic c/o Haemodialysis Unit 25100 Kuantan Pahang Darul Makmur Tel : ( 09)5133333 Ext : 2340 Fax : ( 09)5164272
Hospital Tengku Ampuan Rahimah Renal Transplant Clinic c/o Haemodialysis Unit Jalan Langat 41200 Klang Selangor Darul Ehsan Tel : ( 03)33757000 Ext : 1411 Fax : ( 03)33710008

213
Kidney Transplant Services
MOH
Hospital Tuanku Ja'afar Renal Transplant Clinic c/o Haemodialysis Unit Jalan Rasah 70300 Seremban Negeri Sembilan Darul Khusus Tel : ( 06)7684743 Fax : ( 06)7625771
Hospital Umum Sarawak Renal Transplant Clinic c/o Haemodialysis Unit Jalan Tun Ahmad Zaidi Adruce 93586 Kuching SarawakTel : (082)276800 Ext : 5215/5216 Fax : (082)276734
ARMED FORCES
96 Hospital Angkatan TenteraKem Lumut Pengkalan TLDM 32100 Lumut Perak Darul Ridzuan ( 05)6819200 Ext : 9541/9448 ( 05)6819558
PRIVATE
Ampang Puteri Specialist Hospital Nephrology Unit Suite 1-7, First Floor Jalan Mamanda 9, Tmn Dato'Ahmad Razali68000 Ampang Selangor Darul Ehsan Tel : ( 03)42722500 Ext : 1250 Fax : ( 03)42702443
C. S. Loo Kidney & Medical Specialist CentrePerak Community Specialist Hospital 227, Jalan Kampar 30250 Ipoh Perak Darul Ridzuan Tel : ( 05)2458918 Ext : 118 Fax : ( 05)2429324
Fan Medical Renal Clinic Gleneagles Intan Medical Centre Suite 7.01, 7th Floor Medical Office Building 282, Jalan Ampang 50450 Kuala Lumpur Tel : ( 03)42578822 Fax : ( 03)42523823
Pantai Mutiara Hospital Renal Transplant Clinic No. 82, Jalan Tengah, Bayan Baru 11900 Bayan Lepas Pulau Pinang Tel : ( 04)6433888 Ext : 155 Fax : ( 04)6432888

214
Kidney Transplant Services
PRIVATE
Sabah Medical Centre Renal Transplant Clinic c/o Haemodialysis Unit P.O. Box 13393 88838 Kota Kinabalu SabahTel : (088)322159 Fax : (088)272817
Selangor Medical Centre Renal Transplant Clinic c/o Haemodislysis Unit Lot. 1, Jalan Singa 20/1, Seksyen 20 40300 Shah Alam Selangor Darul Ehsan Tel : ( 03)55431111 Ext : 4533/4464 Fax :( 03)55431722
Simon Wong Medical & Kidney Clinic Timberland Medical Centre Lot 5160, Ground Floor Lorong 2, 2 1/2 miles Rock Road 93250 Kuching SarawakTel : (082)241242 Fax : (082)254242
Sime Darby Medical Centre Subang Jaya Nephrology Unit 1, Jalan SS 12/1A 47500 Subang Jaya Selangor Darul Ehsan Tel : ( 03)56306194 Fax : ( 03)56335910
Sri Kota Medical Centre Renal Transplant Clinic c/o Haemodialysis Centre Jalan Mohet 41000 Klang Selangor Darul Ehsan Tel : ( 03)33733636 Ext : 7106 Fax : ( 03)33736888
Sunway Medical Centre Nephrology Unit Suite A1-28, First Floor No 5, Jln Lagoon Selatan Bandar Sunway 46150 Petaling Jaya Selangor Darul Ehsan Tel : ( 03)74919191 Ext : 7784 Fax : ( 03)74918181
Tan Medical Renal Clinic No. 41, Tingkat 1 Jalan 6/31 46300 Petaling Jaya Selangor Darul Ehsan Tel : ( 03)77836423 Fax : ( 03)77836422
Wee Kidney & Medical Specialist Clinic Suite 303A, 3rd Floor Mahkota Medical Centre No.3, Mahkota Melaka, Jalan Merdeka 75000 Melaka Tel : ( 06)2818222 Ext : 3309 Fax : ( 06)2810560

215
Kidney Transplant Services
UNIVERSITY
Hospital Universiti Kebangsaan Malaysia Renal Transplant Clinic c/o Haemodialysis Unit Jalan Yaacob Latif, Bandar Tun Razak, Cheras 56000 Kuala lumpur Tel : ( 03)91455555 Ext : 7606 Fax : ( 03)91735316
Hospital Universiti Sains Malaysia Renal Transplant Clinic c/o Haemodialysis Unit 16150 Kubang Kerian Kelantan Darul Naim Tel : ( 09)7663000 Ext : 4657/4660 Fax : ( 09)7652198
University of Malaya Medical Centre Nephrology Ward (Ward 8TE) 8th Floor, Haemodialysis Unit Jalan Universiti 59100 Kuala Lumpur Tel : ( 03)79492497 Fax : ( 03)79568822

216
Liver Transplant Services
MOH
Hospital Kuala Lumpur Institute Paediatric Jalan Pahang 50586 Kuala Lumpur Tel : ( 03)26906211 Fax : ( 03)26913815
Hospital Selayang Department of Hepatobiliary Lebuhraya Selayang-Kepong 68100 Batu Caves Selangor Darul Ehsan Tel : ( 03)61203233 Ext : 3314 Fax : ( 03)61207564
Hospital Selayang Paediatric Hepatology Unit Lebuhraya Selayang-Kepong 68100 Batu Caves Selangor Darul Ehsan Tel : ( 03)61203233Fax : ( 03)61207564
PRIVATE
Sime Darby Medical Centre Subang Jaya 1, Jalan SS 12/1A 47500 Subang Jaya Selangor Darul Ehsan Tel : ( 03)56306193 Fax : ( 03)56306209
UNIVERSITY
University of Malaya Medical Centre Department of Paediatrics Jalan Universiti 59100 Kuala Lumpur Tel : ( 03)79492065 Fax : ( 03)79556114