Embed Size (px)
Citation preview
Ericsson | Fourth Quarter and Full-Year Report 2018 1
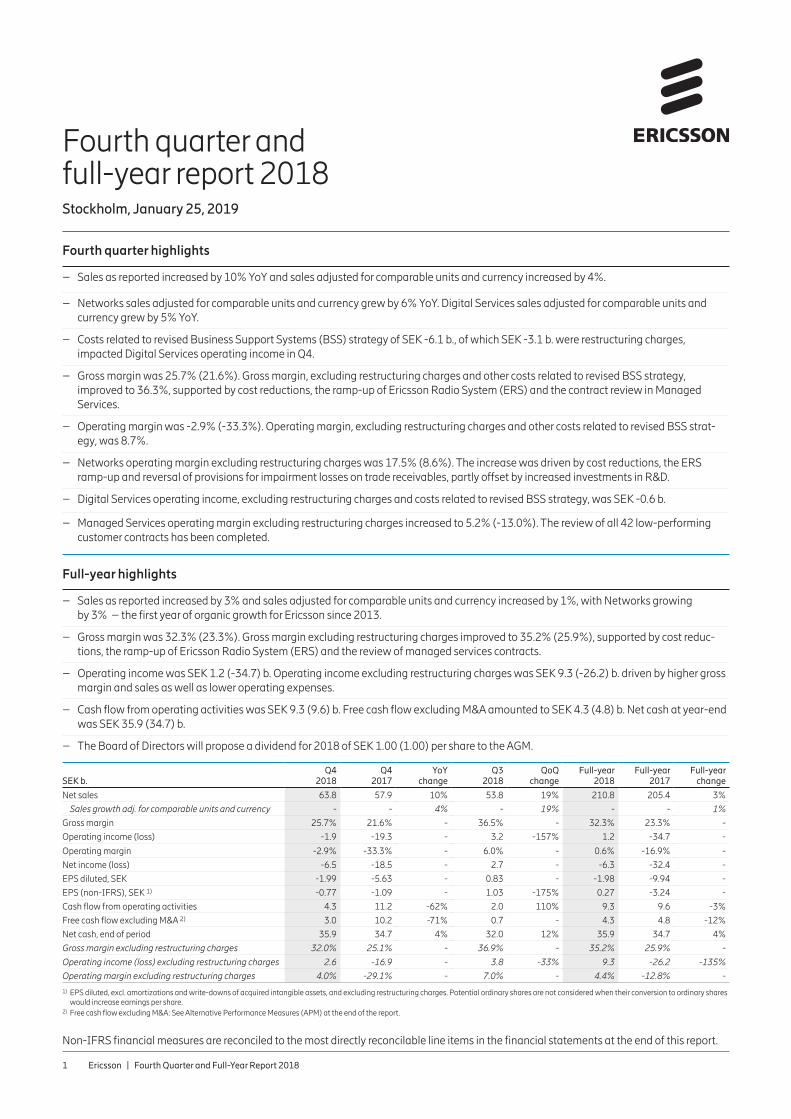
Fourth quarter and full-year report 2018Stockholm, January 25, 2019
Fourth quarter highlights
– Sales as reported increased by 10% YoY and sales adjusted for comparable units and currency increased by 4%.
– Networks sales adjusted for comparable units and currency grew by 6% YoY. Digital Services sales adjusted for comparable units and currency grew by 5% YoY.
– Costs related to revised Business Support Systems (BSS) strategy of SEK -6.1 b., of which SEK -3.1 b. were restructuring charges, impacted Digital Services operating income in Q4.
– Gross margin was 25.7% (21.6%). Gross margin, excluding restructuring charges and other costs related to revised BSS strategy, improved to 36.3%, supported by cost reductions, the ramp-up of Ericsson Radio System (ERS) and the contract review in Managed Services.
– Operating margin was -2.9% (-33.3%). Operating margin, excluding restructuring charges and other costs related to revised BSS strat-egy, was 8.7%.
– Networks operating margin excluding restructuring charges was 17.5% (8.6%). The increase was driven by cost reductions, the ERS ramp-up and reversal of provisions for impairment losses on trade receivables, partly offset by increased investments in R&D.
– Digital Services operating income, excluding restructuring charges and costs related to revised BSS strategy, was SEK -0.6 b.
– Managed Services operating margin excluding restructuring charges increased to 5.2% (-13.0%). The review of all 42 low-performing customer contracts has been completed.
Full-year highlights
– Sales as reported increased by 3% and sales adjusted for comparable units and currency increased by 1%, with Networks growing by 3% – the first year of organic growth for Ericsson since 2013.
– Gross margin was 32.3% (23.3%). Gross margin excluding restructuring charges improved to 35.2% (25.9%), supported by cost reduc-tions, the ramp-up of Ericsson Radio System (ERS) and the review of managed services contracts.
– Operating income was SEK 1.2 (-34.7) b. Operating income excluding restructuring charges was SEK 9.3 (-26.2) b. driven by higher gross margin and sales as well as lower operating expenses.
– Cash flow from operating activities was SEK 9.3 (9.6) b. Free cash flow excluding M&A amounted to SEK 4.3 (4.8) b. Net cash at year-end was SEK 35.9 (34.7) b.
– The Board of Directors will propose a dividend for 2018 of SEK 1.00 (1.00) per share to the AGM.
SEK b.
Q4 2018
Q4 2017
YoY change
Q3 2018
QoQ change
Full-year 2018
Full-year 2017
Full-year change
Net sales 63.8 57.9 10% 53.8 19% 210.8 205.4 3%
Sales growth adj. for comparable units and currency - - 4% - 19% - - 1%
Gross margin 25.7% 21.6% - 36.5% - 32.3% 23.3% -
Operating income (loss) -1.9 -19.3 - 3.2 -157% 1.2 -34.7 -
Operating margin -2.9% -33.3% - 6.0% - 0.6% -16.9% -
Net income (loss) -6.5 -18.5 - 2.7 - -6.3 -32.4 -
EPS diluted, SEK -1.99 -5.63 - 0.83 - -1.98 -9.94 -
EPS (non-IFRS), SEK 1) -0.77 -1.09 - 1.03 -175% 0.27 -3.24 -
Cash flow from operating activities 4.3 11.2 -62% 2.0 110% 9.3 9.6 -3%
Free cash flow excluding M&A 2) 3.0 10.2 -71% 0.7 - 4.3 4.8 -12%
Net cash, end of period 35.9 34.7 4% 32.0 12% 35.9 34.7 4%
Gross margin excluding restructuring charges 32.0% 25.1% - 36.9% - 35.2% 25.9% -
Operating income (loss) excluding restructuring charges 2.6 -16.9 - 3.8 -33% 9.3 -26.2 -135%
Operating margin excluding restructuring charges 4.0% -29.1% - 7.0% - 4.4% -12.8% -
1) EPS diluted, excl. amortizations and write-downs of acquired intangible assets, and excluding restructuring charges. Potential ordinary shares are not considered when their conversion to ordinary shares would increase earnings per share.
2) Free cash flow excluding M&A: See Alternative Performance Measures (APM) at the end of the report.
Non-IFRS financial measures are reconciled to the most directly reconcilable line items in the financial statements at the end of this report.

Ericsson | Fourth Quarter and Full-Year Report 2018 CEO comments2
CEO comments Our focused strategy has yielded clear results. Ericsson is today a stronger company. Increased investments in R&D for future growth, managed services contract reviews, combined with efficient cost control have proven to be successful, with improved competitiveness and profitabil-ity as a result. As the industry moves to 5G and IoT, we will now take the next step, focusing on profitable growth in a selective and disciplined way.
Sales have gradually improved during 2018, resulting in full-year organic sales growth1) for the first time since 2013. This is partly due to an improved market, but also driven by market share gains in Networks as a result of a more competitive radio product portfolio. In parallel, gross margins2) have improved across all segments, with full-year gross margin2) of 35% (26%) and operating margin2) of 4% (-13%).
Segment Networks had another strong quarter with high business activity across multiple regions. Networks organic sales1) increased by 6% YoY, positively impacted by a recovering RAN market as well as strong performance in the product portfolio. Growth was partly due to a higher than anticipated activity level in North America driven by increased 5G demand among the US operators. Networks gross margin2) improved to 41% (35%) YoY, mainly due to improved hardware margins driven by the successful shift to Ericsson Radio System (ERS). Strategic contracts and 5G field trials had a negative impact on operating margin in the quarter. R&D investments contin-ued to grow in the quarter, but are now expected to flatten out.
In Managed Services, gross margin2) improved to 12% (-5%) YoY, supported by efficiency gains and customer contract reviews. We have now addressed all 42 targeted contracts, resulting in an annu-alized profit improvement of SEK 0.9 b. During the year, we have increased our investments in automation, analytics and AI.
We continue to execute on our plan to turn the Digital Services business around. Focus has been on stabilizing top line, moderniz-ing the portfolio and taking costs out. In Digital Services there has been solid progress in most portfolio areas. Underlying operating expenses3) in 2018 were SEK 2.6 b. lower than in 2017. However, the Business Support Systems (BSS) area has not shown satisfac-tory progress and we are now in the process of reshaping the busi-ness. To speed up restructuring of the BSS business, additional measures were communicated on January 10, 2019. These mea-sures include provisions and restructuring charges of SEK -6.1 b.,
which were taken in Q4. The reshaped strategy will set Digital Ser-vices on a stronger path to achieve the 2020 financial targets. Organic sales1) in Digital Services grew by 5% YoY, driven by Cloud Core and OSS. Gross margin2), adjusted for above mentioned provi-sions, improved to 38%. Operating income, excluding restructuring charges and other costs related to revised BSS strategy, was SEK -0.6 b. in the quarter.
In segment Emerging Business and Other, we invest in initiatives that aim to scale and help create future business for Ericsson. We manage Emerging Business initiatives for growth case by case, based on positive net present value (NPV), within 2022 Group targets. Organic segment sales1) grew by 1% YoY and operating income2) was SEK -1.5 (-7.6) b. Sales growth and operating income2) in the segment, excluding the media business, was 60% and SEK -0.9 (-0.8) b. respectively.
Free cash flow excluding M&A in 2018 was lower than in 2017, primarily due to the return to growth and strong sales development at the end of the fourth quarter. In addition, sale of trade receivables was further reduced. The Board will propose a dividend of SEK 1.00 (1.00) per share to the AGM.
As previously disclosed, we are voluntarily cooperating with an investigation into Ericsson’s compliance with the U.S. Foreign Cor-rupt Practices Act (FCPA). The discussions with US authorities con-tinue and we will provide updates as appropriate.
Our R&D investments over the past two years have secured a highly competitive and industry-leading offering. We will continue to invest in 5G, automation and AI to create both customer and share-holder value. Even though costs related to strategic contracts and 5G field trials will impact margins short term, they will help reaching our targets for 2020 and 2022 as well as strengthen our business in the long term.
Börje EkholmPresident and CEO
1) Organic sales growth: Sales adjusted for comparable units and currency
2) Excluding restructuring charges
3) Excluding net impact from amortization and capitalization of development expenses, as well as of intangible assets,
risk provisions and write-downs.
Planning assumptions going forward
Market related – The Radio Access Network (RAN) equipment market is estimated to increase
by 2% for full-year 2019 with 2% CAGR for 2018-2023. (Source: Dell’Oro.)
Currency exposure
– Rule of thumb: A weakening by 10% of USD to SEK would have a negative
impact of approximately -5% on net sales and approximately -1 percentage
point on operating margin.
Ericsson related – 5-year average sales seasonality between Q4 and Q1 is -26%.
– The baseline for the current IPR licensing contract portfolio is approximately
SEK 8 b. on an annual basis.
– Strategic contracts in Networks, with initially lower margins, taken to
strengthen the market position, will continue to have a negative impact on
gross margin. The costs may vary between quarters, without jeopardizing
2020 financial targets.
– Costs for 5G field trials mainly in Networks will continue in 2019.
– R&D expenses are expected to flatten out, starting in Q1.
– Operating expenses typically decrease between Q4 and Q1 due to seasonality.
– Restructuring charges for full-year 2019 are estimated to be SEK -3 to -5 b.
– Cost reductions and efficiency improvements will continue in Digital Services
aiming to significantly reduce losses in 2019.
– The planned divestment of MediaKind is ongoing: 2018 financials Media
Solutions business (MediaKind incl. transaction-related costs etc): Net sales
2018: SEK 2.7 b. and Q4: SEK 0.7 b., operating income excl. restructuring
charges 2018: SEK -1.7 b. and Q4: SEK -0.5 b.
– The estimated net impact of amortization and capitalization of development
expenses and of recognition and deferral of hardware costs will be approxi-
mately SEK -1 b. for 2019, compared with SEK -2.6 b. in 2018.
Ericsson | Fourth Quarter and Full-Year Report 2018 Financial highlights3
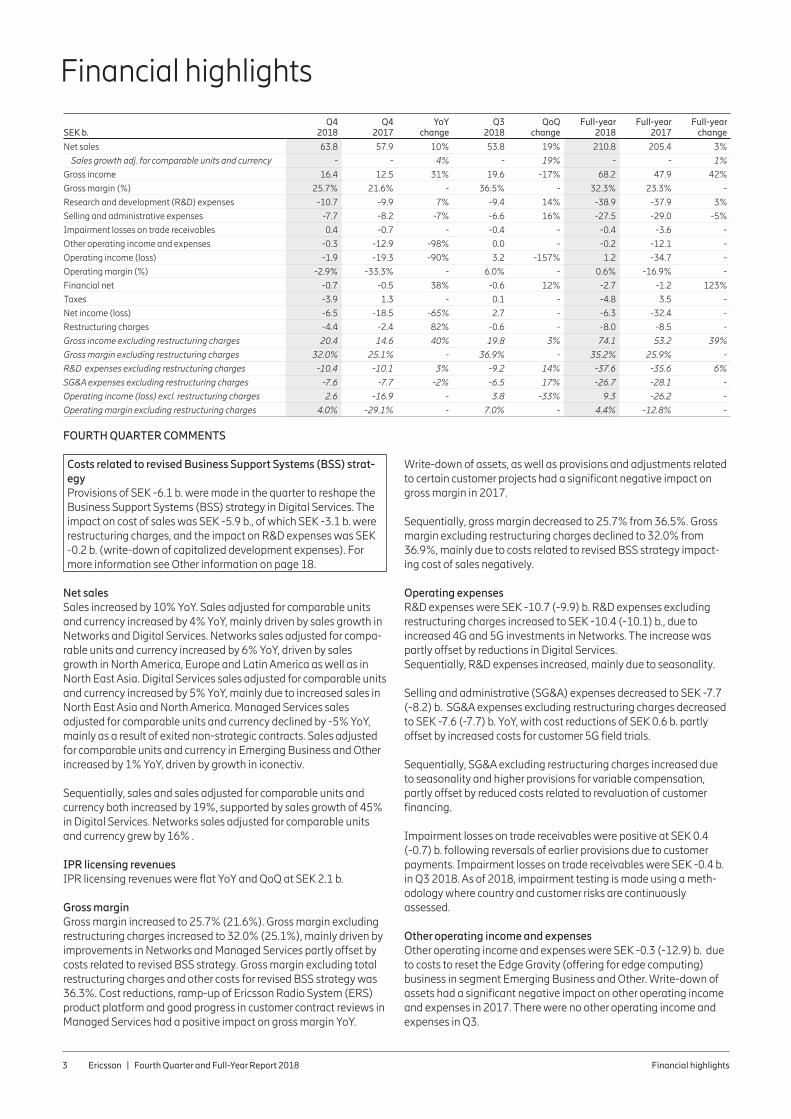
Financial highlights SEK b.
Q4 2018
Q4 2017
YoY change
Q3 2018
QoQ change
Full-year2018
Full-year2017
Full-year change
Net sales 63.8 57.9 10% 53.8 19% 210.8 205.4 3%
Sales growth adj. for comparable units and currency - - 4% - 19% - - 1%
Gross income 16.4 12.5 31% 19.6 -17% 68.2 47.9 42%
Gross margin (%) 25.7% 21.6% - 36.5% - 32.3% 23.3% -
Research and development (R&D) expenses -10.7 -9.9 7% -9.4 14% -38.9 -37.9 3%
Selling and administrative expenses -7.7 -8.2 -7% -6.6 16% -27.5 -29.0 -5%
Impairment losses on trade receivables 0.4 -0.7 - -0.4 - -0.4 -3.6 -
Other operating income and expenses -0.3 -12.9 -98% 0.0 - -0.2 -12.1 -
Operating income (loss) -1.9 -19.3 -90% 3.2 -157% 1.2 -34.7 -
Operating margin (%) -2.9% -33.3% - 6.0% - 0.6% -16.9% -
Financial net -0.7 -0.5 38% -0.6 12% -2.7 -1.2 123%
Taxes -3.9 1.3 - 0.1 - -4.8 3.5 -
Net income (loss) -6.5 -18.5 -65% 2.7 - -6.3 -32.4 -
Restructuring charges -4.4 -2.4 82% -0.6 - -8.0 -8.5 -
Gross income excluding restructuring charges 20.4 14.6 40% 19.8 3% 74.1 53.2 39%
Gross margin excluding restructuring charges 32.0% 25.1% - 36.9% - 35.2% 25.9% -
FOURTH QUARTER COMMENTS
Costs related to revised Business Support Systems (BSS) strat-egyProvisions of SEK -6.1 b. were made in the quarter to reshape the Business Support Systems (BSS) strategy in Digital Services. The impact on cost of sales was SEK -5.9 b., of which SEK -3.1 b. were restructuring charges, and the impact on R&D expenses was SEK -0.2 b. (write-down of capitalized development expenses). For more information see Other information on page 18.
Net sales Sales increased by 10% YoY. Sales adjusted for comparable units and currency increased by 4% YoY, mainly driven by sales growth in Networks and Digital Services. Networks sales adjusted for compa-rable units and currency increased by 6% YoY, driven by sales growth in North America, Europe and Latin America as well as in North East Asia. Digital Services sales adjusted for comparable units and currency increased by 5% YoY, mainly due to increased sales in North East Asia and North America. Managed Services sales adjusted for comparable units and currency declined by -5% YoY, mainly as a result of exited non-strategic contracts. Sales adjusted for comparable units and currency in Emerging Business and Other increased by 1% YoY, driven by growth in iconectiv.
Sequentially, sales and sales adjusted for comparable units and currency both increased by 19%, supported by sales growth of 45% in Digital Services. Networks sales adjusted for comparable units and currency grew by 16% .
IPR licensing revenuesIPR licensing revenues were flat YoY and QoQ at SEK 2.1 b.
Gross marginGross margin increased to 25.7% (21.6%). Gross margin excluding restructuring charges increased to 32.0% (25.1%), mainly driven by improvements in Networks and Managed Services partly offset by costs related to revised BSS strategy. Gross margin excluding total restructuring charges and other costs for revised BSS strategy was 36.3%. Cost reductions, ramp-up of Ericsson Radio System (ERS) product platform and good progress in customer contract reviews in Managed Services had a positive impact on gross margin YoY.
R&D expenses excluding restructuring charges -10.4 -10.1 3% -9.2 14% -37.6 -35.6 6%
SG&A expenses excluding restructuring charges -7.6 -7.7 -2% -6.5 17% -26.7 -28.1 -
Operating income (loss) excl. restructuring charges 2.6 -16.9 - 3.8 -33% 9.3 -26.2 -
Operating margin excluding restructuring charges 4.0% -29.1% - 7.0% - 4.4% -12.8% -
Write-down of assets, as well as provisions and adjustments related to certain customer projects had a significant negative impact on gross margin in 2017.
Sequentially, gross margin decreased to 25.7% from 36.5%. Gross margin excluding restructuring charges declined to 32.0% from 36.9%, mainly due to costs related to revised BSS strategy impact-ing cost of sales negatively.
Operating expensesR&D expenses were SEK -10.7 (-9.9) b. R&D expenses excluding restructuring charges increased to SEK -10.4 (-10.1) b., due to increased 4G and 5G investments in Networks. The increase was partly offset by reductions in Digital Services. Sequentially, R&D expenses increased, mainly due to seasonality.
Selling and administrative (SG&A) expenses decreased to SEK -7.7 (-8.2) b. SG&A expenses excluding restructuring charges decreased to SEK -7.6 (-7.7) b. YoY, with cost reductions of SEK 0.6 b. partly offset by increased costs for customer 5G field trials.
Sequentially, SG&A excluding restructuring charges increased due to seasonality and higher provisions for variable compensation, partly offset by reduced costs related to revaluation of customer financing.
Impairment losses on trade receivables were positive at SEK 0.4 (-0.7) b. following reversals of earlier provisions due to customer payments. Impairment losses on trade receivables were SEK -0.4 b. in Q3 2018. As of 2018, impairment testing is made using a meth-odology where country and customer risks are continuously assessed.
Other operating income and expensesOther operating income and expenses were SEK -0.3 (-12.9) b. due to costs to reset the Edge Gravity (offering for edge computing) business in segment Emerging Business and Other. Write-down of assets had a significant negative impact on other operating income and expenses in 2017. There were no other operating income and expenses in Q3.

Ericsson | Fourth Quarter and Full-Year Report 2018 Financial highlights4
Consequences of technology and portfolio shiftsDue to technology and portfolio shifts, the Company is reducing the capitalization of development expenses for product platforms and software releases as well as the deferral of hardware costs. As a consequence, higher amortization than capitalization of develop-ment expenses and higher recognition than deferral of hardware costs have a negative impact on operating income. The amounts related to capitalized software releases were fully amortized in 2017.
Net impact from amortization and capitalization of development expenses and from recognition and deferral of hardware costs
SEK b. Q4 2018 Q4 2017 Q3 2018 FY 2018 FY 2017
Cost of sales -0.2 -0.8 -0.2 -0.9 -2.6
R&D expenses -0.6 -0.6 -0.5 -1.7 -0.3
Total impact -0.7 -1.4 -0.7 -2.6 -2.9
Restructuring chargesRestructuring charges increased to SEK -4.4 (-2.4) b. YoY of which the main part, SEK -3.1 b., is costs related to revised BSS strategy. Restructuring charges in Q3 2018 were SEK -0.6 b.
Operating income and marginOperating income (loss) was reduced to SEK -1.9 (-19.3) b. YoY. Operating income excluding restructuring charges improved to SEK 2.6 (-16.9) b. Improved gross margin, increased net sales and rever-sal of provisions for impairment losses on trade receivables had a positive impact YoY. The net impact of amortization and capitaliza-tion of development expenses and of recognition and deferral of hardware costs was SEK -0.7(-1.4) b.
Write-down of assets as well as provisions and adjustments related to certain customer projects had a significant impact on the 2017 operating expenses.
Operating income and operating margin excluding restructuring charges and other costs for revised BSS strategy were SEK 5.5 b. and 8.7% respectively.
Operating income declined sequentially to SEK -1.9 b. from SEK 3.2 b. Operating income excluding restructuring charges declined to SEK 2.6 b. from SEK 3.8 b. Negative effects from costs related to revised BSS strategy and seasonally higher operating expenses were partly offset by higher sales and reversal of provi-sions for impairment losses on trade receivables.
Financial netFinancial net declined to SEK -0.7 (-0.5) b. mainly due to negative effects of interest rate revaluation. The revaluation and realization effects of foreign exchange forecast hedging were SEK -0.1 (-0.1) b. In Q3 2018 there were no such effects.
TaxesTaxes amounted to SEK -3.9 (1.3) b., negatively impacted by impairment of withholding tax assets and non-deductable expenses.
R&D expenses excluding restructuring charges, SEK b.
Selling and administrative expenses excl. restructuring charges, SEK b.
Net income (loss) and EPS Net income and EPS diluted increased YoY, as a consequence of the improved operating income. Sequentially, net income and EPS diluted decreased due to costs related to revised BSS strategy and increased tax costs.
Employees The number of employees on Dec 31, 2018, was 95,359, a net increase of 860 employees in the quarter. The employee increase in the quarter is mainly in R&D.
Focused strategy execution The following four measures are indicators of the progress of strat-egy execution.
Area Activity Status Q4 2018
Networks Transition to new Ericsson Radio Sys-tem
The transition is now successfully completed with 87% accumulated for full-year 2018 (2017: 61%) and 93% in Q4 2018 (ERS radio unit deliveries out of total radio unit deliveries).
Digital Services - Growth in sales of new product portfolio- Addressing critical customer contracts
- Net sales full-year 2018: +4%- Out of 45 contracts identified, in
total 23 have been addressed (4 in Q418 isolated)
Managed Services
Addressing low- performing customer contracts
The review of all 42 contracts identi-fied (2 in Q418 isolated) has been completed resulting in an annualized profit improvement of SEK 0.9 b. (Q3 2018: SEK 0.9 b.)
Ericsson | Fourth Quarter and Full-Year Report 2018 Financial highlights5
FULL-YEAR COMMENTSNet sales Sales increased by SEK 5.5 b. or 3% to SEK 210.8 (205.4) b. Net-works sales increased by SEK 6.3 b. (5%), Digital Services sales decreased by SEK -0.7 b. (-2%), Managed Services sales decreased by SEK -0.7 b. (-3%) and Emerging Business and Other sales increased by SEK 0.5 b. (7%). The sales increase in Networks was mainly driven by higher demand for radio access network (RAN) equipment. Networks sales growth adjusted for comparable units and currency was 3%.This should be compared with the Dell’Oro estimate that the RAN equipment mar-ket would increase by 2% for full-year 2018.
The sales decrease in segment Digital Services was due to lower sales in legacy products. The sales decline in Managed Services was mainly a result of exit of low-performing and non-strategic con-tracts. The sales increase in segment Emerging Business and Other was driven by growth in iconectiv business due to the multi-year number portability contract in the United States.
In the geographical dimension, sales grew in North America and in Europe and Latin America.
Sales adjusted for comparable units and currency increased by 1%. The sales mix by commodity was: software 21% (21%), hardware 37% (35%) and services 42% (44%).
IPR licensing revenuesIPR licensing revenues decreased to SEK 8.0 (8.3) b. The baseline for the current IPR licensing contract portfolio is approximately SEK 8 b. on an annual basis.
Gross marginGross margin increased to 32.3% (23.3%) with improved margins in hardware and services mainly driven by cost reductions, ramp-up of Ericsson Radio System product platform and good progress in the review of low-performing managed services contracts. A reduced share of services sales had a positive impact on gross margin. Restructuring charges included in the gross margin increased to SEK -5.9 (-5.2) b. Costs of SEK -5.9 b., of which SEK -3.1 b. were restruc-turing charges, impacted gross margin in Digital Services.
Due to technology and portfolio shifts, the company has since 2017 reduced the capitalization of development expenses and the defer-ral of hardware costs, which had a net impact on gross income of SEK -0.9 (-2.6) b. Write-down of assets, as well as provisions and adjustments related to certain customer projects had a significant negative impact on gross margin in 2017.
Operating expensesOperating expenses decreased to SEK -66.8 (-70.6) b. with SG&A expenses of SEK -27.5 (-29.0) b., R&D expenses of SEK -38.9 (-37.9) b. and impairment losses on trade receivables of SEK -0.4 (-3.6) b. Restructuring charges included in operating expenses were SEK -2.1 (-3.3) b.
R&D expenses increased due to increased investments in R&D for Networks. The increase was partly offset by R&D reductions in Digital Services. Higher amortized than capitalized development expenses had a negative effect on R&D expenses of SEK -1.7 (-0.3) b.
SG&A expenses were reduced as a result of cost reduction activities. The reduction was more than offset by higher provisions for variable compensation, increased costs related to revaluation of customer financing and increased costs for 5G trials.
Other operating income and expenses Other operating income and expenses was SEK -0.2 (-12.1) b. In 2017, write-down of intangible assets had a significant negative impact on other operating expenses.
Restructuring chargesRestructuring charges amounted to SEK -8.0 (-8.5) b., which was higher than the earlier estimate of SEK -5 to -7 b. The restructuring charges in 2018 mainly relate to the cost-reduction program announced in 2017 and costs related to revised BSS strategy. Total restructuring charges for 2019 are estimated to be SEK -3 to -5 b.
Operating income and marginOperating income improved to SEK 1.2 (-34.7) b. Higher gross mar-gin and sales and lower operating expenses had a positive impact. Higher amortization than capitalization of development expenses and higher recognition than deferral of hardware costs impacted operating income by SEK -2.6 (-2.9) b. Write-down of assets, as well as provisions and adjustments related to certain customer projects had a significant negative impact on operating income in 2017. Operating margin was 0.6% (-16.9%). Operating margin excluding restructuring charges of SEK -8.0 (-8.5 ) b. was 4.4% (-12.8%).
Financial netThe financial net decreased to SEK -2.7 (-1.2) b., mainly due to increased negative effects of foreign exchange revaluation, nega-tive currency hedge effects and reduced interest rates. The currency hedge effects, which derive from the hedge loan balance in USD, impacted financial net by SEK -0.5 (0.5) b. The SEK weakened against the USD between December 31, 2017 (SEK/USD rate 8.20) and December 31, 2018 (SEK/USD rate 8.94).
TaxesTaxes were SEK -4.8 (3.5) b., negatively impacted by impairment of withholding tax assets in Sweden mainly as a result of provisions related to revised BSS strategy. In addition, non-deductible expenses, withholding tax expenses outside of Sweden and revalu-ation of tax assets due to a change in Swedish corporate tax rate impacted tax costs negatively.
Net income and EPSNet income improved to SEK -6.3 (-32.4) b. driven by higher operat-ing income partly offset by a negative financial net and increased tax costs. EPS diluted was SEK -1.98 (-9.94) and EPS (non-IFRS) was SEK 0.27 (-3.24).
EmployeesThe number of employees on December 31, 2018 was 95,359, a reduction of 5,376 employees compared with Dec 31, 2017.
The employee reduction was mainly in services as a consequence of the cost-reduction program. The number of R&D employees has increased by more than 1,100 in 2018.

Ericsson | Fourth Quarter and Full-Year Report 2018 Market area sales6
Market area sales
FOURTH QUARTER COMMENTSSouth East Asia, Oceania and IndiaSales increased YoY, primarily in Managed Services where a new contract was won in 2018. Network sales increased slightly YoY, mainly in South East Asia. Digital Services sales declined YoY due to timing of project deliveries.
North East AsiaSales increased YoY. In Mainland China, Network sales increased with continued deployment of Narrowband IoT. Digital Services sales also increased with signing of a telecom core contract that had been delayed from previous quarters. Sales in Japan remained flat while operators plan for 5G. Large scale field trials for 5G continue in Mainland China and Japan.
North AmericaNetworks and Digital Services sales increased YoY, primarily driven by investments in 5G readiness and expansions across all major
customers. Managed Services sales grew YoY, driven by strong variable sales in large customer contracts.
Europe and Latin AmericaSales increased YoY, driven by growth in Latin America and parts of Europe. Managed Services sales declined YoY as a consequence of addressed non-strategic contracts.
Middle East and AfricaSales declined YoY. Networks sales declined due to timing of invest-ments and monetary restrictions in certain markets. Digital Services sales declined due to timing of project milestones. Managed ser-vices sales were stable YoY.
OtherSales increased slightly YoY, mainly driven by growth in iconectiv (part of segment Emerging Business and Other). IPR licensing revenues amounted to SEK 2.1 (2.1) b.
FULL-YEAR COMMENTSSouth East Asia, Oceania and IndiaSales declined, mainly due to timing of major projects in Vietnam and India. Managed services sales grew slightly mainly due to a new contract, while sales in Digital Services remained flat.
North East AsiaSales declined due to reduced operator investments in LTE whilst the operators plan for 5G.
North AmericaNetworks sales increased, primarily driven by investments in 5G readiness across all major customers. Digital Services sales increased as operators digitalize operations and improve customer experience to prepare for 5G. Managed Services sales grew, driven by higher variable sales in large customer contracts.
Europe and Latin AmericaThe strong growth in Networks sales in Latin America and parts of Europe was partly offset by lower sales in Managed Services due to exit of non-strategic contracts.
Middle East and AfricaSales declined slightly. Networks sales declined due to monetary restrictions in certain markets, Digital Services declined due to tim-ing of project milestones while Managed Services sales were flat.
OtherSales declined slightly. IPR licensing revenues amounted to SEK 8.0 (8.3) b.
Fourth quarter 2018 Change
SEK b. NetworksDigital
ServicesManaged
Services Emerging Busi-ness and Other Total YoY QoQ
South East Asia, Oceania and India 6.1 1.3 0.9 0.0 8.2 5% 3%
North East Asia 5.5 2.5 0.4 0.0 8.4 30% 45%
North America 14.0 2.8 1.2 0.0 18.0 23% 21%
Europe and Latin America 10.5 4.3 3.4 0.1 18.2 8% 23%
Middle East and Africa 3.6 1.8 1.0 0.0 6.5 -14% 14%
Other 1) 1.9 0.4 0.0 2.1 4.4 2% -3%
Total 41.6 13.0 6.9 2.3 63.8 10% 19%
1) Market Area “Other” includes primarily licensing revenues and the major part of segment Emerging Business and Other
Full-year 2018 Change
SEK b. NetworksDigital
ServicesManaged
Services Emerging Busi-ness and Other Total YoY
South East Asia, Oceania and India 21.3 4.8 3.4 0.0 29.6 -6%
North East Asia 15.9 4.8 1.5 0.1 22.3 -5%
North America 46.5 8.4 3.7 0.1 58.6 13%
Europe and Latin America 34.4 12.3 13.2 0.3 60.3 6%
Middle East and Africa 13.3 6.3 4.0 0.0 23.6 -5%
Other 1) 7.2 1.4 0.0 7.9 16.5 -1%
Total 138.6 38.1 25.8 8.4 210.8 3%
1) Market Area “Other” includes primarily licensing revenues and the major part of segment Emerging Business and Other

Ericsson | Fourth Quarter and Full-Year Report 2018 Segment results | Networks7
Segment results
Networks
SEK b.
Q4 2018
Q4 2017
YoY change
Q3 2018
QoQ change
Full-year 2018
Full-year 2017
Full-year change
Net sales 41.6 37.1 12% 35.9 16% 138.6 132.3 5%
Of which products 29.8 25.4 17% 25.3 18% 96.9 90.3 7%
Of which IPR licensing revenues 1.8 1.7 2% 1.8 0% 6.5 6.8 -4%
Of which services 11.8 11.7 1% 10.6 12% 41.6 42.0 -1%
Sales growth adjusted for comparable units and currency - - 6% - 16% - - 3%
Gross income 16.6 11.8 40% 14.8 12% 55.2 43.4 27%
Gross margin 39.9% 32.0% - 41.3% - 39.8% 32.8% -
Operating income 6.9 1.9 - 5.7 21% 19.4 10.5 86%
Operating margin 16.5% 5.2% - 15.7% - 14.0% 7.9% -
Restructuring charges -0.4 -1.3 - -0.1 - -1.8 -4.8 -
Gross income excl. restructuring charges 17.1 12.9 32% 14.9 15% 56.5 46.6 21%
Gross margin excl. restructuring charges 41.0% 34.8% - 41.5% - 40.8% 35.2% -
Operating income excl. restructuring charges 7.3 3.2 127% 5.8 26% 21.2 15.3 39%
Operating margin excl. restructuring charges 17.5% 8.6% - 16.1% - 15.3% 11.6% -
FOURTH QUARTER COMMENTSNet salesSales increased by 12% YoY and sales adjusted for comparable units and currency increased by 6%. The increase is mainly due to strong growth in North America, Europe and Latin America as well as in North East Asia, driven by investments in 5G readiness and LTE networks.
Sales increased by 16% QoQ and sales adjusted for comparable units and currency also increased by 16%. The sequential sales growth was slightly lower than normal seasonality mainly due to lower sales in India. Sales in North America were higher than antici-pated and driven by large hardware deliveries.
Gross marginGross margin increased to 39.9% (32.0%) YoY. Gross margin excluding restructuring charges increased to 41.0% (34.8%) due to improved margins in hardware and services as well as lower nega-tive impact of higher recognition than deferral of hardware cost. In addition, the share of hardware sales increased whereas the share of services sales decreased, which impacted gross margin positively YoY.
Provisions and adjustments related to certain customer projects had a negative impact on gross margin in 2017.
Gross margin decreased to 39.9% from 41.3% QoQ. Gross margin excluding restructuring charges decreased to 41.0% from 41.5% QoQ. The decrease was due to hardware sales with initially lower margins, related to new strategic contracts taken to strengthen the market position. A lower share of services sales had a positive impact on gross margin QoQ.
Operating income and marginOperating income increased to SEK 6.9 (1.9) b. YoY and operating margin improved to 16.5% (5.2%). Operating income excluding restructuring charges was SEK 7.3 (3.2) b. and the corresponding operating margin was 17.5% (8.6%). The improvement was mainly driven by higher gross margin and sales. Operating margin was positively impacted by reversal of provisions for impairment losses on trade receivables of SEK 0.3 (-0.6) b. in the quarter.
Operating income increased to SEK 6.9 b. from SEK 5.7 b. QoQ and operating margin increased to 16.5% from 15.7%. Operating income excluding restructuring charges increased to SEK 7.3 b. from SEK 5.8 b. and operating margin excluding restructuring charges increased to 17.5% from 16.1%. The improvement was driven by higher sales.
Provisions and adjustments related to certain customer projects as well as write-down of assets had a negative impact on operating income in 2017.
Net impact from amortization and capitalization of development expenses and from recognition and deferral of hardware costs
SEK b. Q4 2018 Q4 2017 Q3 2018 FY 2018 FY 2017
Cost of Sales -0.1 -0.5 -0.1 -0.7 -1.5
R&D expenses 0.1 -0.1 0.0 0.4 0.0
Total impact 0.0 -0.6 -0.1 -0.3 -1.5
FULL-YEAR COMMENTSNet salesSales increased by 5% YoY to SEK 138.6 (132.3) b. Sales adjusted for comparable units and currency increased by 3%. The sales increase was due to sales growth in North America and in Europe and Latin America, driven by telecom operator investments in 5G readiness and LTE networks. The Networks share of IPR licensing revenues was SEK 6.5 (6.8) b.
Gross marginGross income increased to SEK 55.2 (43.4) b. and gross margin increased to 39.8% (32.8%). Gross margin increased across all areas, mainly due to improved margins in hardware and a higher share of hardware sales at the expense of services sales. The impact on gross margin of higher recognition than deferral of hardware costs was SEK -0.7 (-1.5) b. In 2017 the gross margin was nega-tively impacted by provisions and customer project adjustments.

Ericsson | Fourth Quarter and Full-Year Report 2018 Segment results | Networks8
Operating income and marginOperating income increased to SEK 19.4 (10.5) b. due to lower restructuring charges as well as higher sales and gross margin. The increase was partly offset by increased operating expenses. Operat-ing expenses increased mainly due to higher investments in R&D to strengthened technology leadership. Net impact from amortization and capitalization of development expenses and from recognition and deferral of hardware costs was SEK -0.3 (-1.5) b. Restructuring charges were SEK -1.8 (-4.8) b. Operating margin increased to 14.0% (7.9%).
Strategy executionAs presented at the 2018 Capital Markets Day, the target for Net-works is to generate an operating margin between 15%-17% (excluding restructuring charges) by 2020.Four important ongoing strategic activities are to:–invest in R&D to safeguard a leading portfolio and cost leadership–fully transition the radio unit deliveries to Ericsson Radio System(ERS) for increased competitiveness–continue to make savings in service delivery–selectively gain market share based on technology and cost com-petitiveness.
The ERS, which was introduced to the market in 2015, has proven tobe competitive as well as creating a strong market position. TheERS is now fully transitioned and it accounted for 93% of total radio unit deliveries in the fourth quarter and 87% for full-year 2018.
By year-end 2018 Ericsson had announced 10 commercial 5G deals and had 42 ongoing 5G trials. The market share of Ericsson RAN equipment has increased to 29.4% for the first nine months of 2018 compared with 28.2% for the same period in 2017, according to Dell’Oro’s report from November 2018.
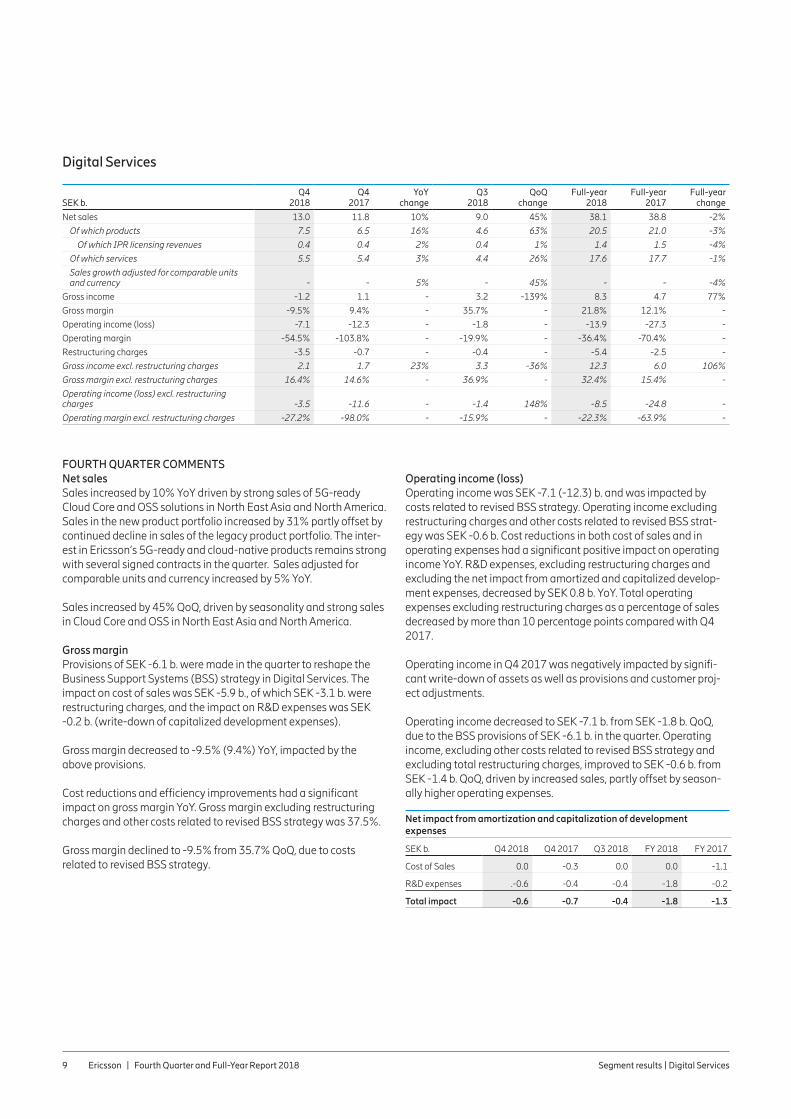
Ericsson | Fourth Quarter and Full-Year Report 2018 Segment results | Digital Services9
FOURTH QUARTER COMMENTSNet salesSales increased by 10% YoY driven by strong sales of 5G-ready Cloud Core and OSS solutions in North East Asia and North America. Sales in the new product portfolio increased by 31% partly offset by continued decline in sales of the legacy product portfolio. The inter-est in Ericsson’s 5G-ready and cloud-native products remains strong with several signed contracts in the quarter. Sales adjusted for comparable units and currency increased by 5% YoY.
Sales increased by 45% QoQ, driven by seasonality and strong sales in Cloud Core and OSS in North East Asia and North America.
Gross marginProvisions of SEK -6.1 b. were made in the quarter to reshape the Business Support Systems (BSS) strategy in Digital Services. The impact on cost of sales was SEK -5.9 b., of which SEK -3.1 b. were restructuring charges, and the impact on R&D expenses was SEK -0.2 b. (write-down of capitalized development expenses).
Gross margin decreased to -9.5% (9.4%) YoY, impacted by the above provisions.
Cost reductions and efficiency improvements had a significant impact on gross margin YoY. Gross margin excluding restructuring charges and other costs related to revised BSS strategy was 37.5%.
Gross margin declined to -9.5% from 35.7% QoQ, due to costs related to revised BSS strategy.
Operating income (loss)Operating income was SEK -7.1 (-12.3) b. and was impacted by costs related to revised BSS strategy. Operating income excluding restructuring charges and other costs related to revised BSS strat-egy was SEK -0.6 b. Cost reductions in both cost of sales and in operating expenses had a significant positive impact on operating income YoY. R&D expenses, excluding restructuring charges and excluding the net impact from amortized and capitalized develop-ment expenses, decreased by SEK 0.8 b. YoY. Total operating expenses excluding restructuring charges as a percentage of sales decreased by more than 10 percentage points compared with Q4 2017.
Operating income in Q4 2017 was negatively impacted by signifi-cant write-down of assets as well as provisions and customer proj-ect adjustments.
Operating income decreased to SEK -7.1 b. from SEK -1.8 b. QoQ, due to the BSS provisions of SEK -6.1 b. in the quarter. Operating income, excluding other costs related to revised BSS strategy and excluding total restructuring charges, improved to SEK -0.6 b. from SEK -1.4 b. QoQ, driven by increased sales, partly offset by season-ally higher operating expenses.
Net impact from amortization and capitalization of development expenses
SEK b. Q4 2018 Q4 2017 Q3 2018 FY 2018 FY 2017
Cost of Sales 0.0 -0.3 0.0 0.0 -1.1
R&D expenses .-0.6 -0.4 -0.4 -1.8 -0.2
Total impact -0.6 -0.7 -0.4 -1.8 -1.3
Digital Services
SEK b.
Q4 2018
Q4 2017
YoY change
Q3 2018
QoQ change
Full-year 2018
Full-year 2017
Full-year change
Net sales 13.0 11.8 10% 9.0 45% 38.1 38.8 -2%
Of which products 7.5 6.5 16% 4.6 63% 20.5 21.0 -3%
Of which IPR licensing revenues 0.4 0.4 2% 0.4 1% 1.4 1.5 -4%
Of which services 5.5 5.4 3% 4.4 26% 17.6 17.7 -1%
Sales growth adjusted for comparable units and currency - - 5% - 45% - - -4%
Gross income -1.2 1.1 - 3.2 -139% 8.3 4.7 77%
Gross margin -9.5% 9.4% - 35.7% - 21.8% 12.1% -
Operating income (loss) -7.1 -12.3 - -1.8 - -13.9 -27.3 -
Operating margin -54.5% -103.8% - -19.9% - -36.4% -70.4% -
Restructuring charges -3.5 -0.7 - -0.4 - -5.4 -2.5 -
Gross income excl. restructuring charges 2.1 1.7 23% 3.3 -36% 12.3 6.0 106%
Gross margin excl. restructuring charges 16.4% 14.6% - 36.9% - 32.4% 15.4% -
Operating income (loss) excl. restructuring charges -3.5 -11.6 - -1.4 148% -8.5 -24.8 -
Operating margin excl. restructuring charges -27.2% -98.0% - -15.9% - -22.3% -63.9% -
Ericsson | Fourth Quarter and Full-Year Report 2018 Segment results | Digital Services10
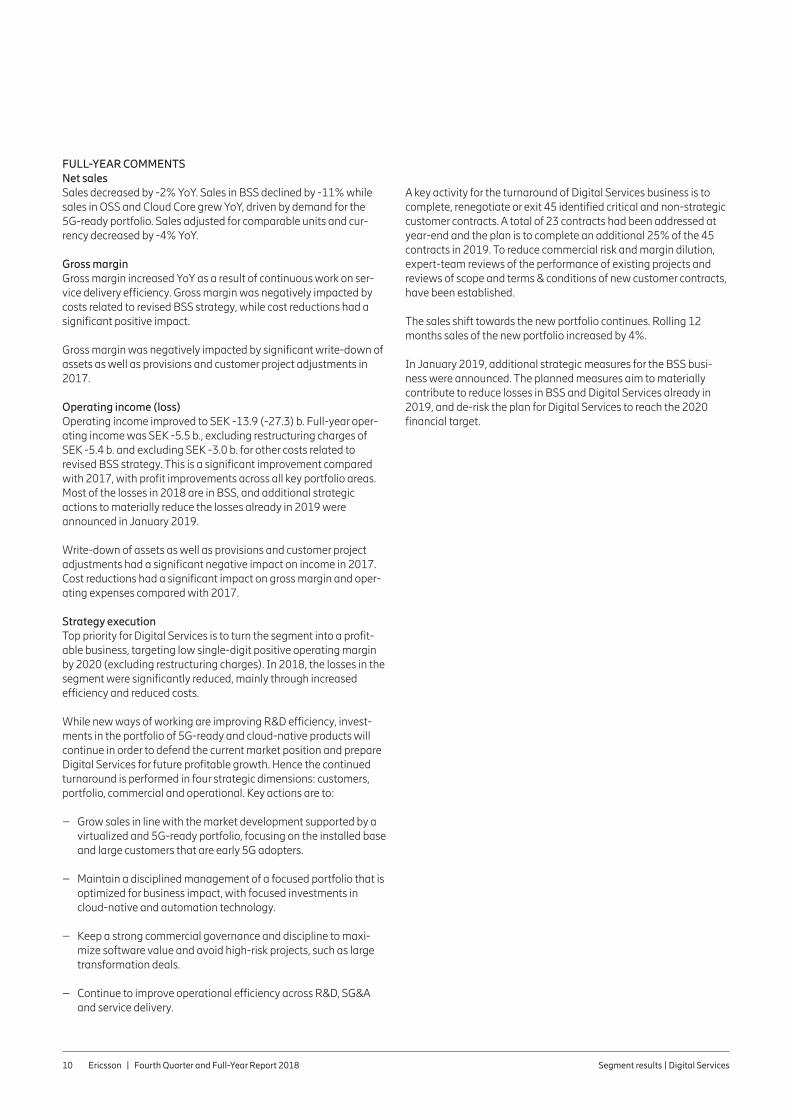
FULL-YEAR COMMENTSNet salesSales decreased by -2% YoY. Sales in BSS declined by -11% while sales in OSS and Cloud Core grew YoY, driven by demand for the 5G-ready portfolio. Sales adjusted for comparable units and cur-rency decreased by -4% YoY.
Gross marginGross margin increased YoY as a result of continuous work on ser-vice delivery efficiency. Gross margin was negatively impacted by costs related to revised BSS strategy, while cost reductions had a significant positive impact.
Gross margin was negatively impacted by significant write-down of assets as well as provisions and customer project adjustments in 2017.
Operating income (loss)Operating income improved to SEK -13.9 (-27.3) b. Full-year oper-ating income was SEK -5.5 b., excluding restructuring charges of SEK -5.4 b. and excluding SEK -3.0 b. for other costs related to revised BSS strategy. This is a significant improvement compared with 2017, with profit improvements across all key portfolio areas. Most of the losses in 2018 are in BSS, and additional strategic actions to materially reduce the losses already in 2019 were announced in January 2019.
Write-down of assets as well as provisions and customer project adjustments had a significant negative impact on income in 2017. Cost reductions had a significant impact on gross margin and oper-ating expenses compared with 2017.
Strategy execution Top priority for Digital Services is to turn the segment into a profit-able business, targeting low single-digit positive operating margin by 2020 (excluding restructuring charges). In 2018, the losses in the segment were significantly reduced, mainly through increased efficiency and reduced costs.
While new ways of working are improving R&D efficiency, invest-ments in the portfolio of 5G-ready and cloud-native products will continue in order to defend the current market position and prepare Digital Services for future profitable growth. Hence the continued turnaround is performed in four strategic dimensions: customers, portfolio, commercial and operational. Key actions are to:
– Grow sales in line with the market development supported by a virtualized and 5G-ready portfolio, focusing on the installed base and large customers that are early 5G adopters.
– Maintain a disciplined management of a focused portfolio that is optimized for business impact, with focused investments in cloud-native and automation technology.
– Keep a strong commercial governance and discipline to maxi-mize software value and avoid high-risk projects, such as large transformation deals.
– Continue to improve operational efficiency across R&D, SG&A and service delivery.
A key activity for the turnaround of Digital Services business is to complete, renegotiate or exit 45 identified critical and non-strategic customer contracts. A total of 23 contracts had been addressed at year-end and the plan is to complete an additional 25% of the 45 contracts in 2019. To reduce commercial risk and margin dilution, expert-team reviews of the performance of existing projects and reviews of scope and terms & conditions of new customer contracts, have been established.
The sales shift towards the new portfolio continues. Rolling 12 months sales of the new portfolio increased by 4%.
In January 2019, additional strategic measures for the BSS busi-ness were announced. The planned measures aim to materially contribute to reduce losses in BSS and Digital Services already in 2019, and de-risk the plan for Digital Services to reach the 2020 financial target.

Ericsson | Fourth Quarter and Full-Year Report 2018 Segment results | Managed Services11
FOURTH QUARTER COMMENTSNet salesSales were flat YoY. Sales adjusted for comparable units and cur-rency decreased by -5% YoY as a result of customer contract exits.
Sales increased by 6% QoQ. The increase was driven by growth across all service areas.
Sales adjusted for comparable units and currency increased by 7% QoQ.
Gross marginGross margin increased to 11.4% (-10.0%) YoY. Gross margin excluding restructuring charges increased to 12.4% (-5.3%) mainly as a results of customer contract reviews and efficiency measures.
Write-down of assets as well as provisions and customer project adjustments had a significant negative impact on gross margin in 2017.
Gross margin decreased to 11.4% from 12.5% QoQ. Gross margin excluding restructuring charges decreased to 12.4% from 12.9% QoQ.
Operating income and marginOperating income increased to SEK 0.3 (-1.3) b. YoY. Operating income excluding restructuring charges improved to SEK 0.4 (-0.9) b. due to higher gross margin.
Sequentially, operating margin excluding restructuring charges decreased to 5.2% from 6.8%. The decrease was driven by season-ally higher operating expenses.
FULL-YEAR COMMENTSNet salesSales decreased by -3% YoY. Sales adjusted for comparable units and currency decreased by -5% YoY, as a result of contract exits, partly offset by sales growth in Managed Services IT.
Gross marginGross margin increased YoY to 11.2% (-5.9%). Gross margin exclud-ing restructuring charges increased to 12.2% (-3.6%) mainly as a result of customer contract reviews and efficiency measures.
Write-down of assets as well as provisions and customer project adjustments had a significant negative impact on gross margin in 2017.
Operating incomeOperating income increased to SEK 1.1 (-4.1) b. YoY. Operating income excluding restructuring charges improved to SEK 1.4 (-3.4) b. due to higher gross margin.
Restructuring charges amounted to SEK -0.3 (-0.7) b.
Strategy executionManaged Services has introduced AI solutions which are patented and trialed in several customer engagements. The initial AI solu-tions already allow Ericsson to address network complexity and move network operations from being reactive to incidents, to becoming proactive – automatically identifying, proposing actions or even fixing the faults before they degrade network service qual-ity. Further investments will be made in automation, analytics and AI-driven offerings to support 5G, IoT and cloud.
As presented at the 2018 Capital Markets Day, the ambition for Managed Services is to improve operating margin to 5%-8% (excluding restructuring charges) in 2020. In order to focus the business and improve profitability, 42 managed services contracts have been identified for exit, renegotiation or transformation. At year-end 2018, all 42 contracts had been addressed, resulting in an annualized profit improvement of approximately SEK 0.9 b. Net sales reduction from contract exits is expected to be SEK 4b. at the end of 2019, compared to the 2016 base line.
Managed Services
SEK b.
Q4 2018
Q4 2017
YoY change
Q3 2018
QoQ change
Full-year 2018
Full-year 2017
Full-year change
Net sales 6.9 6.9 0% 6.5 6% 25.8 26.5 -3%
Sales growth adjusted for comparable units and currency - - -5% - 7% - - -5%
Gross income (loss) 0.8 -0.7 - 0.8 -3% 2.9 -1.6 -
Gross margin 11.4% -10.0% - 12.5% - 11.2% -5.9% -
Operating income (loss) 0.3 -1.3 - 0.4 -30% 1.1 -4.1 -
Operating margin 4.1% -18.5% - 6.3% - 4.2% -15.4% -
Restructuring charges -0.1 -0.4 - 0.0 - -0.3 -0.7 -
Gross income (loss) excl. restructuring charges 0.9 -0.4 - 0.8 2% 3.1 -1.0 -
Gross margin excl. restructuring charges 12.4% -5.3% - 12.9% - 12.2% -3.6% -
Operating income (loss) excl. restructuring charges 0.4 -0.9 - 0.4 -20% 1.4 -3.4 -
Operating margin excl. restructuring charges 5.2% -13.0% - 6.8% - 5.3% -12.9% -
Ericsson | Fourth Quarter and Full-Year Report 2018 Segment results | Emerging Business and Other12
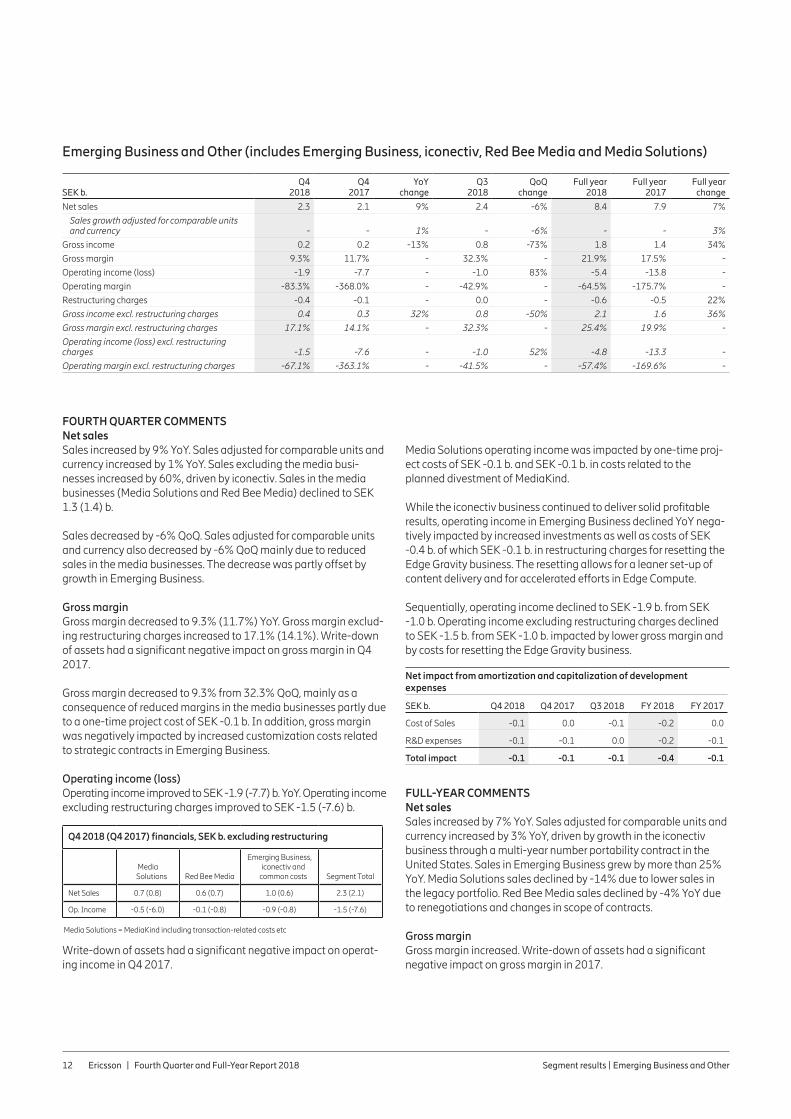
FOURTH QUARTER COMMENTSNet salesSales increased by 9% YoY. Sales adjusted for comparable units and currency increased by 1% YoY. Sales excluding the media busi-nesses increased by 60%, driven by iconectiv. Sales in the media businesses (Media Solutions and Red Bee Media) declined to SEK 1.3 (1.4) b.
Sales decreased by -6% QoQ. Sales adjusted for comparable units and currency also decreased by -6% QoQ mainly due to reduced sales in the media businesses. The decrease was partly offset by growth in Emerging Business.
Gross marginGross margin decreased to 9.3% (11.7%) YoY. Gross margin exclud-ing restructuring charges increased to 17.1% (14.1%). Write-down of assets had a significant negative impact on gross margin in Q4 2017.
Gross margin decreased to 9.3% from 32.3% QoQ, mainly as a consequence of reduced margins in the media businesses partly due to a one-time project cost of SEK -0.1 b. In addition, gross margin was negatively impacted by increased customization costs related to strategic contracts in Emerging Business.
Operating income (loss) Operating income improved to SEK -1.9 (-7.7) b. YoY. Operating income excluding restructuring charges improved to SEK -1.5 (-7.6) b.
Q4 2018 (Q4 2017) financials, SEK b. excluding restructuring
Media Solutions Red Bee Media
Emerging Business, iconectiv and
common costs Segment Total
Net Sales 0.7 (0.8) 0.6 (0.7) 1.0 (0.6) 2.3 (2.1)
Op. Income -0.5 (-6.0) -0.1 (-0.8) -0.9 (-0.8) -1.5 (-7.6)
Media Solutions = MediaKind including transaction-related costs etc
Write-down of assets had a significant negative impact on operat-ing income in Q4 2017.
Media Solutions operating income was impacted by one-time proj-ect costs of SEK -0.1 b. and SEK -0.1 b. in costs related to the planned divestment of MediaKind. While the iconectiv business continued to deliver solid profitable results, operating income in Emerging Business declined YoY nega-tively impacted by increased investments as well as costs of SEK -0.4 b. of which SEK -0.1 b. in restructuring charges for resetting the Edge Gravity business. The resetting allows for a leaner set-up of content delivery and for accelerated efforts in Edge Compute.
Sequentially, operating income declined to SEK -1.9 b. from SEK -1.0 b. Operating income excluding restructuring charges declined to SEK -1.5 b. from SEK -1.0 b. impacted by lower gross margin and by costs for resetting the Edge Gravity business.
Net impact from amortization and capitalization of development expenses
SEK b. Q4 2018 Q4 2017 Q3 2018 FY 2018 FY 2017
Cost of Sales -0.1 0.0 -0.1 -0.2 0.0
R&D expenses -0.1 -0.1 0.0 -0.2 -0.1
Total impact -0.1 -0.1 -0.1 -0.4 -0.1
FULL-YEAR COMMENTSNet salesSales increased by 7% YoY. Sales adjusted for comparable units and currency increased by 3% YoY, driven by growth in the iconectiv business through a multi-year number portability contract in the United States. Sales in Emerging Business grew by more than 25% YoY. Media Solutions sales declined by -14% due to lower sales in the legacy portfolio. Red Bee Media sales declined by -4% YoY due to renegotiations and changes in scope of contracts.
Gross marginGross margin increased. Write-down of assets had a significant negative impact on gross margin in 2017.
Emerging Business and Other (includes Emerging Business, iconectiv, Red Bee Media and Media Solutions)
SEK b.
Q4 2018
Q4 2017
YoY change
Q3 2018
QoQ change
Full year 2018
Full year 2017
Full year change
Net sales 2.3 2.1 9% 2.4 -6% 8.4 7.9 7%
Sales growth adjusted for comparable units and currency - - 1% - -6% - - 3%
Gross income 0.2 0.2 -13% 0.8 -73% 1.8 1.4 34%
Gross margin 9.3% 11.7% - 32.3% - 21.9% 17.5% -
Operating income (loss) -1.9 -7.7 - -1.0 83% -5.4 -13.8 -
Operating margin -83.3% -368.0% - -42.9% - -64.5% -175.7% -
Restructuring charges -0.4 -0.1 - 0.0 - -0.6 -0.5 22%
Gross income excl. restructuring charges 0.4 0.3 32% 0.8 -50% 2.1 1.6 36%
Gross margin excl. restructuring charges 17.1% 14.1% - 32.3% - 25.4% 19.9% -
Operating income (loss) excl. restructuring charges -1.5 -7.6 - -1.0 52% -4.8 -13.3 -
Operating margin excl. restructuring charges -67.1% -363.1% - -41.5% - -57.4% -169.6% -

Ericsson | Fourth Quarter and Full-Year Report 2018 Segment results | Emerging Business and Other13
Operating income (loss)
Full-year financials for 2018 (2017) , SEK b. excluding restructuring
Media Solutions Red Bee Media
Emerging Business, iconectiv and
common costs Segment Total
Net Sales 2.7 (3.2) 2.3 (2.4) 3.4 (2.3) 8.4 (7.9)
Op. Income -1.7 (-8.9) -0.3 (-1.8) -2.8 (-2.7) -4.8 (-13.3)
Cost reductions had a positive impact on Media Solutions operating income, partly offset by reduced sales and costs of SEK -0.3 b. related to the planned transaction with One Equity Partners. Write-down of assets had a significant negative impact on Media Solu-tions income in 2017.
Operational efficiencies and cost reductions had a positive impact on Red Bee Media income, while reduced sales impacted negatively. Write-down of assets had a significant negative impact on Red Bee Media income in 2017.
Losses increased due to costs of SEK -0.4 b., of which SEK -0.1 b. in restructuring charges, for resetting the Edge Gravity business and increased investments in new areas such as IoT and Emodo. The growth in iconectiv business had a positive impact on operating income.
Strategy executionThe target for Emerging Business and Other in 2020 is to reach a break-even operating income (excluding restructuring charges) with a net sales ambition of SEK 5-7 b., given the current portfolio and strategy for the areas.
Selective investments will continue in Emerging Business in order to build a position and grow sales in new areas. Parts of the portfolio are still in an early phase, with focus on generating sales and scale the business. Emerging business sales grew by more than 25% in 2018, but do not yet cover required investments, resulting in a nega-tive bottom line.
For Red Bee Media, the target remains to achieve a sustainable profitable business by continuing to develop and manage the busi-ness as an independent and focused media services entity within Ericsson.
The planned divestment of MediaKind is ongoing. The demand for MediaKind’s portfolio continues to be stable across the global cus-tomer base. Actions taken during 2018 are expected to result in improved sales and cost structures during second half 2019.
Ericsson | Fourth Quarter and Full-Year Report 2018 Cash flow14
Cash flow
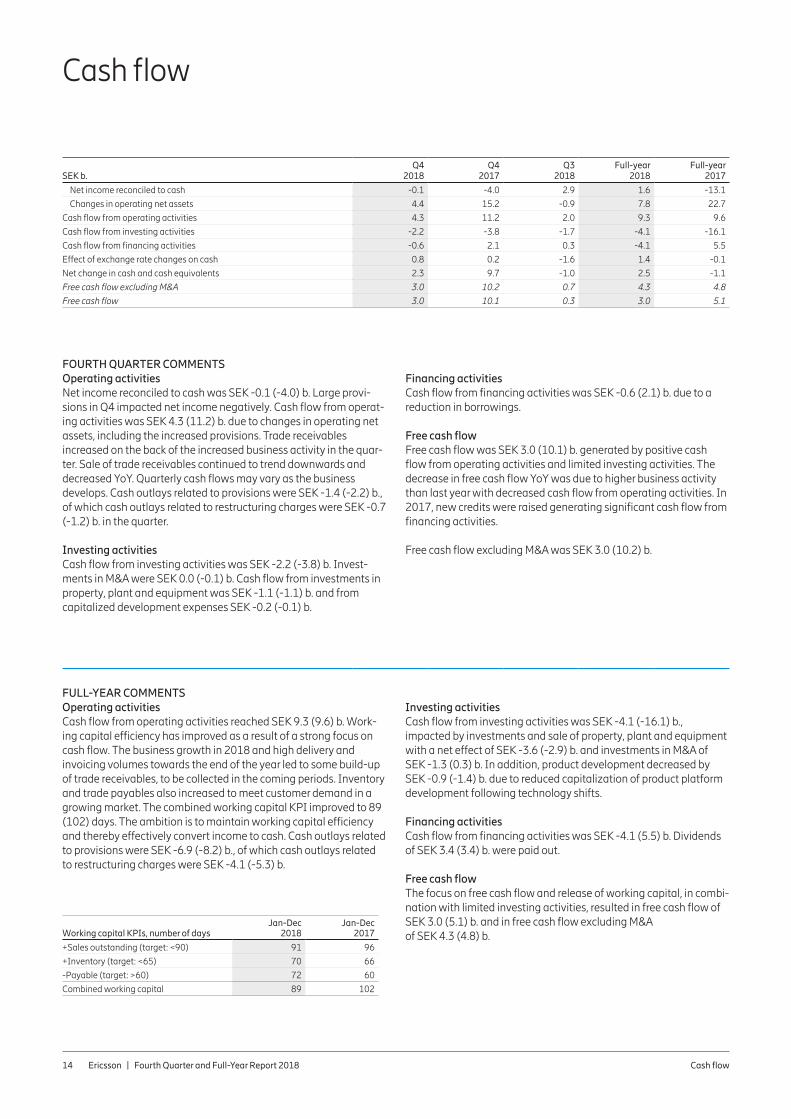
FOURTH QUARTER COMMENTSOperating activitiesNet income reconciled to cash was SEK -0.1 (-4.0) b. Large provi-sions in Q4 impacted net income negatively. Cash flow from operat-ing activities was SEK 4.3 (11.2) b. due to changes in operating net assets, including the increased provisions. Trade receivables increased on the back of the increased business activity in the quar-ter. Sale of trade receivables continued to trend downwards and decreased YoY. Quarterly cash flows may vary as the business develops. Cash outlays related to provisions were SEK -1.4 (-2.2) b., of which cash outlays related to restructuring charges were SEK -0.7 (-1.2) b. in the quarter.
Investing activitiesCash flow from investing activities was SEK -2.2 (-3.8) b. Invest-ments in M&A were SEK 0.0 (-0.1) b. Cash flow from investments in property, plant and equipment was SEK -1.1 (-1.1) b. and from capitalized development expenses SEK -0.2 (-0.1) b.
Financing activitiesCash flow from financing activities was SEK -0.6 (2.1) b. due to a reduction in borrowings.
Free cash flowFree cash flow was SEK 3.0 (10.1) b. generated by positive cash flow from operating activities and limited investing activities. The decrease in free cash flow YoY was due to higher business activity than last year with decreased cash flow from operating activities. In 2017, new credits were raised generating significant cash flow from financing activities.
Free cash flow excluding M&A was SEK 3.0 (10.2) b.
FULL-YEAR COMMENTSOperating activities Cash flow from operating activities reached SEK 9.3 (9.6) b. Work-ing capital efficiency has improved as a result of a strong focus on cash flow. The business growth in 2018 and high delivery and invoicing volumes towards the end of the year led to some build-up of trade receivables, to be collected in the coming periods. Inventory and trade payables also increased to meet customer demand in a growing market. The combined working capital KPI improved to 89 (102) days. The ambition is to maintain working capital efficiency and thereby effectively convert income to cash. Cash outlays related to provisions were SEK -6.9 (-8.2) b., of which cash outlays related to restructuring charges were SEK -4.1 (-5.3) b.
Investing activities Cash flow from investing activities was SEK -4.1 (-16.1) b., impacted by investments and sale of property, plant and equipment with a net effect of SEK -3.6 (-2.9) b. and investments in M&A of SEK -1.3 (0.3) b. In addition, product development decreased by SEK -0.9 (-1.4) b. due to reduced capitalization of product platform development following technology shifts.
Financing activitiesCash flow from financing activities was SEK -4.1 (5.5) b. Dividends of SEK 3.4 (3.4) b. were paid out.
Free cash flow The focus on free cash flow and release of working capital, in combi-nation with limited investing activities, resulted in free cash flow of SEK 3.0 (5.1) b. and in free cash flow excluding M&A of SEK 4.3 (4.8) b.
SEK b.Q4
2018Q4
2017Q3
2018Full-year
2018Full-year
2017
Net income reconciled to cash -0.1 -4.0 2.9 1.6 -13.1
Changes in operating net assets 4.4 15.2 -0.9 7.8 22.7
Cash flow from operating activities 4.3 11.2 2.0 9.3 9.6
Cash flow from investing activities -2.2 -3.8 -1.7 -4.1 -16.1
Cash flow from financing activities -0.6 2.1 0.3 -4.1 5.5
Effect of exchange rate changes on cash 0.8 0.2 -1.6 1.4 -0.1
Net change in cash and cash equivalents 2.3 9.7 -1.0 2.5 -1.1
Free cash flow excluding M&A 3.0 10.2 0.7 4.3 4.8
Free cash flow 3.0 10.1 0.3 3.0 5.1
Working capital KPIs, number of daysJan-Dec
2018Jan-Dec
2017
+Sales outstanding (target: <90) 91 96
+Inventory (target: <65) 70 66
-Payable (target: >60) 72 60
Combined working capital 89 102

Ericsson | Fourth Quarter and Full-Year Report 2018 Financial position15
Financial position
FOURTH QUARTER COMMENTS Gross cash increased by SEK 3.3 b. and net cash increased by SEK 3.9 b. in the quarter, as a result of the positive free cash flow. Gross cash was SEK 69.0 b. and net cash was SEK 35.9 b.
Liability for post-employments benefits increased in the quarter, to SEK 28.7 b. from SEK 25.5 b., due to lower interest rates in Sweden.
FULL-YEAR COMMENTS Gross cash increased to SEK 69.0 (67.7) b. and net cash increased to SEK 35.9 (34.7) b.
Liability for post-employments benefits increased by SEK 3.7 b.mainly due to decreased discount rates and normal service costs. The Swedish defined benefit obligation (DBO) has been calculated using a discount rate based on the yields of Swedish government bonds. If the discount rate had been based on Swedish covered mortgage bonds, the liability for post-employment benefits would have been approximately SEK 9.5 b. lower as of Dec 31, 2018.
The average maturity of long-term borrowings as of Dec 31,2018, was 3.4 years, a decrease from 4.4 years 12 months earlier.
Ericsson has an unutilized Revolving Credit Facility of USD 2.0 b.The facility will expire in 2022.
In 2018, Ericsson signed a credit facility agreement of EUR 250 million with the European Investment Bank (EIB). The credit facility is undrawn and will mature five years after disbursement.
Moody’s changed their outlook on Ericsson’s long-term rating from negative to stable. The rating of Ba2 was unchanged.
The capital efficiency improved during the year and the capital turnover reached 1.4 (1.2) times.
SEK b.Dec 31
2018Dec 31
2017Sep 30
2018
+ Cash and cash equivalents 38.4 35.9 36.1
+ Interest-bearing securities, current 6.6 6.7 6.6
+ Interest-bearing securities, non-current 24.0 25.1 23.0
Gross cash 69.0 67.7 65.7
– Borrowings, current 2.3 2.5 2.5
– Borrowings, non-current 30.9 30.5 31.2
Net cash 35.9 34.7 32.0
Equity 87.8 97.6 96.0
Total assets 268.8 259.9 264.8
Capital turnover (times) 1.4 1.2 1.3
Return on capital employed (%) 0.6% -20.6% 2.6%
Equity ratio (%) 32.7% 37.5% 36.2%
Return on equity (%) -7.1% -28.1% 0.0%
Debt maturity profile, Parent Company
SEK b.
Swedish Export Credit Corporation MTN Bond
Nordic Investment Bank
European Investment Bank
Notes and Bonds
Ericsson | Fourth Quarter and Full-Year Report 2018 Parent Company16
Parent Company
Income after financial items was SEK 5.8 (-2.0) b. Impairment of investments in subsidiaries has decreased to SEK 1.2 (9.0) b, which was the main contributor to the increase in Income after financial items.
At the end of the year, gross cash (cash, cash equivalents, short-term investments and interest-bearing securities non-current) amounted to SEK 58.1 (50.3) b.
The Parent Company has during the quarter recognized dividends from subsidiaries of SEK 3.2 (5.2) b.
There has been a decrease of intercompany lending of SEK 10.4 b.and intercompany borrowing of SEK 1.9 b. during the fourth quarter.
In accordance with the conditions of the long-term variable com-pensation program (LTV) for Ericsson employees, 3,346,918 shares from treasury stock were sold or distributed to employees during the fourth quarter. The holding of treasury stock on December 31, 2018, was 37,057,039 Class B shares.

Ericsson | Fourth Quarter and Full-Year Report 2018 Dividend, AGM and Annual Report17
Dividend, AGM and Annual Report
Dividend proposalThe Board of Directors will propose to the Annual General Meeting to resolve on a dividend of SEK 1.00 (1.00) per share, representing some SEK 3.3 (3.3) b., and March 29, 2019, as the record date for payment of dividend. The dividend reflects this year’s earnings and balance sheet structure, as well as coming years’ business plans and expected economic development.
Ericsson Annual General MeetingThe Annual General Meeting of shareholders will be held on March 27, 2019, 15.00 (CET) at Kistamässan, Kista/Stockholm, Sweden.
Annual ReportThe annual report will be made available on the Ericsson website www.ericsson.com and at the Ericsson headquarters, Torshamns-gatan 21, Kista, Stockholm, Sweden, in the last week of February.

Ericsson | Fourth Quarter and Full-Year Report 2018 Other information18
Other information
Ericsson Capital Markets Day 2018 On November 8, 2018, Ericsson held its Capital Markets Day giving an overview of its turnaround, strategy and plans for future growth as well as details about its business segments and the market trends. Further, the presentations included updated net sales ambi-tions for 2020 and financial targets for 2020 and 2022.
SEC and DOJ inquiriesAs previously disclosed, Ericsson has been voluntarily cooperating since 2013 with an investigation by the United States Securities and Exchange Commission (SEC) and, since 2015, with an investigation by the United States Department of Justice (DOJ) into Ericsson’s compliance with the U.S. Foreign Corrupt Practices Act (FCPA). The discussions with these authorities continue. While the length of these discussions cannot be determined, the company’s previous assessment, that the resolution of these matters will likely result in monetary and other measures, the magnitude of which at this time cannot be reliably estimated but may be material, remains. Ericsson continues its efforts to improve on its compliance program.
POST-CLOSING EVENTS
Provisions in fourth quarter related to reshaping BSS business On January 10, 2019, Ericsson announced that the focus on simpli-fying and stabilizing the business has resulted in stronger gross margins and a stabilizing topline. While there has been solid prog-ress in most portfolio areas, the Business Support Systems area in segment Digital Services is not showing satisfactory progress, jeop-ardizing the segment Digital Services overall profitability target for 2020.
The company’s past strategy has not been successful. It included pursuing large transformation projects based on pre-integrated solutions and development of a next-generation BSS platform. Con-sequently, at the Capital Markets Day on Nov. 8, 2018, Ericsson pre-sented a revised BSS strategy, with increased investments in the established platform and a refocus of the next-generation BSS plat-form to fulfilling existing customer commitments only.
The company has now decided to pursue additional measures to speed up the restructuring of the BSS business. Provisions for the cost of executing on these measures, together with necessary con-tract loss provisions, negatively impacted operating income by SEK 6.1 b. in Q4, 2018, mainly impacting gross margin. SEK 3.1 b. of this amount is treated as restructuring charges. Further restructuring charges, estimated to be SEK 1.5 b, are anticipated for 2019. The vast majority of the provision amount will impact cash flow, starting in 2019 and continuing over several years.
Ericsson announced changes to Executive TeamOn January 16, 2019, Ericsson announced that Helena Norrman, Senior Vice President, Chief Marketing and Communications Officer and Head of Marketing and Corporate Relations, has decided to leave Ericsson to pursue opportunities outside the company. Helena Norrman has been with the company since 1998 and has served on Ericsson’s Executive Team since 2010. Helena will leave her position effective no later than June 30, 2019.
Ericsson | Fourth Quarter and Full-Year Report 2018 Risk factors19
Risk factors
Ericsson’s operational and financial risk factors and uncertainties are described in our Annual Report 2017. Risk factors and uncer-tainties in focus short term for the Parent Company and the Ericsson Group include, but are not limited to:
– Potential negative effects on operators’ willingness to invest in network development due to uncertainty in the financial markets and a weak economic business environment, or reduced con-sumer telecom spending, or increased pressure on Ericsson to provide financing, or delayed auctions of spectrum
– Intense competition from existing competitors as well as new entrants, including IT companies entering the telecommunica-tions market, which could have a material adverse effect on the results
– Uncertainty regarding the financial stability of suppliers, for example due to lack of financing
– Effects on gross margins and/or working capital of the business mix in the Networks segment between capacity sales and new coverage build-outs
– Effects on gross margins of the business mix including new network build-outs and new managed services or digital trans-formation deals with initial transition costs
– Effects of the ongoing industry consolidation among our cus-tomers as well as between our largest competitors, e.g. with postponed investments and intensified price competition as a consequence
– New and ongoing partnerships which may not be successful and expose us to future costs
– Changes in foreign exchange rates, in particular USD – Political unrest and uncertainty and geopolitical uncertainty in
certain markets, including escalating trade disputes and sanc-tions and uncertainties relating to Brexit, with potential effects such as increased supply costs, limitations to the free movement of goods and services, professional staff and cross-border data
– Effects on production and sales from restrictions with respect to timely and adequate supply of materials, components and pro-duction capacity and other vital services on competitive terms
– No guarantees that strategy execution, specific restructuring or cost-savings initiatives, profitability restoring efforts and/or organizational changes will be sufficient, successful or executed in time to deliver any improvements in earnings
– Cybersecurity incidents, which may have a material negative impact
– Rapidly changing technologies and the ways these are brought to the market, which could be disruptive to the business
– Ericsson is subject to risks associated with the development and implementation of new solutions or technologies under existing customer contracts. The Company may not be successful or incur delays in developing or implementing such solutions or technolo-gies, which could result in damage claims and loss of customers which may have an adverse impact on liquidity and results of operations.
Ericsson monitors the compliance with all relevant trade regulations and trade embargoes applicable to dealings with customers operat-ing in countries where there are trade restrictions or trade restric-tions are discussed.
Ericsson strives to operate globally in accordance with Group poli-cies and directives for business ethics and conduct and has a dedi-cated ethics and compliance program. However, in some of the countries where the Company operates, corruption risks can be high and compliance failure could have a material adverse impact on our business, financial condition and brand.
Ericsson is voluntarily cooperating with investigations by the United States Securities and Exchange Commission and the United States Department of Justice regarding its compliance with the U.S. For-eign Corrupt Practices Act. The Company continues to cooperate with the SEC and DOJ and is engaged in discussions with them to find a resolution. While the length of these discussions cannot be determined, based on the facts that the Company has shared with the authorities, Ericsson believes that the resolution of these mat-ters will likely result in monetary and other measures, the magnitude of which cannot be estimated currently but may be material. Poten-tial future cash outflows are currently not capable of being reliably estimated. Accordingly, no provisions have been recorded for such potential exposure.
Stockholm, January 25, 2019
Telefonaktiebolaget LM Ericsson
Börje Ekholm, President and CEO
Org. no. 556016-0680
Date for next report: April 17, 2019

Ericsson | Fourth Quarter and Full-Year Report 2018 Auditors' Review Report20
Auditors’ Review Report
IntroductionWe have reviewed the condensed interim financial information(interim report) of Telefonaktiebolaget LM Ericsson (publ.) as ofDecember 31, 2018, and the twelve months period then ended.The board of directors and the CEO are responsible for thepreparation and presentation of the interim financial report inaccordance with IAS 34 and the Swedish Annual Accounts Act.Our responsibility is to express a conclusion on this interimreport based on our review.
Scope of reviewWe conducted our review in accordance with the InternationalStandard on Review Engagements ISRE 2410, Review of InterimReport Performed by the Independent Auditor of the Entity.
A review consists of making inquiries, primarily of personsresponsible for financial and accounting matters, and applyinganalytical and other review procedures. A review is substantiallyless in scope than an audit conducted in accordance with Interna-tional Standards on Auditing, ISA, and other generally accepted auditing standards in Sweden. The procedures performed in a review do not enable us to obtain assurance that we would become aware of all significant matters that might be identified in an audit. Accordingly, we do not express an audit opinion.
ConclusionBased on our review, nothing has come to our attention thatcauses us to believe that the interim report is not prepared, in allmaterial respects, in accordance with IAS 34 and the SwedishAnnual Accounts Act, regarding the Group, and with the SwedishAnnual Accounts Act, regarding the Parent Company.
Stockholm, January 25, 2019PricewaterhouseCoopers AB
Bo HjalmarssonAuthorized Public AccountantAuditor in Charge
Johan EngstamAuthorized Public Accountant

Ericsson | Fourth Quarter and Full-Year Report 2018 Editor’s note21
Editor’s note
Press briefing and live webcastEricsson invites media, investors and analysts to conferencecalls on January 25, 2019; one starting at 09.00 (CET) and theother at 14.00 (CET).
Live audio webcasts of the conference calls as well as supportingslides will be available at:www.ericsson.com/investors and www.ericsson.com/press Replay of the conference calls will be available approximatelyone hour after each call has ended and will remain available forseven days.
For further information, please contact:Carl Mellander Senior Vice President, Chief Financial OfficerPhone: +46 10 713 89 70E-mail: [email protected] or [email protected]
Helena Norrman, Senior Vice President, Chief Marketing and Communications OfficerPhone: +46 10 719 34 72E-mail: [email protected] or [email protected]
Telefonaktiebolaget LM EricssonOrg. number: 556016-0680Torshamnsgatan 21SE-164 83 StockholmPhone: +46 10 719 00 00www.ericsson.com
InvestorsPeter Nyquist, Vice President,Head of Investor RelationsPhone: +46 10 714 64 99, +46 70 575 29 06E-mail: [email protected]
Stefan Jelvin, Director,Investor RelationsPhone: +46 10 714 20 39, +46 70 986 02 27E-mail: [email protected]
Åsa Konnbjer, Director, Investor RelationsPhone: +46 10 713 39 28, +46 73 082 59 28E-mail: [email protected]
Rikard Tunedal, Director, Investor RelationsPhone: +46 10 714 54 00, +46 761 005 400E-mail: [email protected]
MediaOla Rembe, Vice President, Head of External CommunicationsPhone: +46 10 719 97 27, +46 73 024 48 73E-mail: [email protected]
Corporate CommunicationsPhone: +46 10 719 69 92E-mail: [email protected]
Ericsson | Fourth Quarter and Full-Year Report 2018 Forward-looking statements22
Forward-looking statements
This report includes forward-looking statements, including state-ments reflecting management’s current views relating to the growth of the market, future market conditions, future events, financial condition, and expected operational and financial performance, including, in particular the following:
– Our goals, strategies, planning assumptions and operational or financial performance expectations
– Industry trends, future characteristics and development of the markets in which we operate
– Our future liquidity, capital resources, capital expenditures, cost savings and profitability
– The expected demand for our existing and new products and services as well as plans to launch new products and services including research and development expenditures
– The ability to deliver on future plans and to realize potential for future growth
– The expected operational or financial performance of strategic cooperation activities and joint ventures
– The time until acquired entities and businesses will be integrated and accretive to income
– Technology and industry trends including the regulatory and standardization environment in which we operate, competition and our customer structure.
The words “believe,” “expect,” “foresee,” “anticipate,” “assume,” “intend,” “likely,” “projects,” “may,” “could,” “plan,” “estimate,” “fore-cast,” “will,” “should,” “would,” “predict,” “aim,” “ambition,” “seek,” “potential,” “target,” “might,” “continue,” or, in each case, their nega-tive or variations, and similar words or expressions are used to iden-tify forward-looking statements. Any statement that refers to expectations, projections or other characterizations of future events or circumstances, including any underlying assumptions, are for-ward-looking statements.
We caution investors that these statements are subject to risks and uncertainties many of which are difficult to predict and generally beyond our control that could cause actual results to differ materi-ally from those expressed in, or implied or projected by, the for-ward-looking information and statements.
Important factors that could affect whether and to what extent any of our forward-looking statements materialize include, but are not limited to, the factors described in the section “Risk Factors”, and in “Risk Factors” in the Annual Report 2017.
These forward-looking statements also represent our estimates and assumptions only as of the date that they were made. We expressly disclaim a duty to provide updates to these forward-looking statements, and the estimates and assumptions associated with them, after the date of this report, to reflect events or changes in circumstances or changes in expectations or the occurrence of anticipated events, whether as a result of new infor-mation, future events or otherwise, except as required by applicable law or stock exchange regulation.

Ericsson | Fourth Quarter and Full-Year Report 2018 Financial statements and other information23
Financial statements and other information
Contents
Financial statements 24 Consolidated income statement24 Statement of comprehensive income (loss)25 Consolidated balance sheet26 Consolidated statement of cash flows27 Consolidated statement of changes in equity27 Consolidated income statement – isolated quarters28 Consolidated statement of cash flows – isolated quarters29 Parent Company income statement29 Parent Company statement of comprehensive income (loss)30 Parent Company balance sheet
Additional information 31 Accounting policies34 Segment reporting 35 Net sales by segment by quarter36 Sales growth adjusted for comparable units and currency36 Gross income (loss) and gross margin by segment by quarter37 Operating income (loss) and operating margin by segment by quarter38 EBITA and EBITA margin by segment by quarter39 Net sales by market area by quarter40 Top 5 countries in sales40 Net sales by market area by segment41 IPR licensing revenues by segment by quarter41 Provisions42 Information on investments 43 Other information43 Number of employees
Items excluding restructuring charges 44 Restructuring charges by function44 Restructuring charges by segment45 Gross income (loss) and gross margin excluding restructuring
charges by segment46 Operating income (loss) and operating margin excluding
restructuring charges by segment
Alternative performance measures47 Sales growth adjusted for comparable units and currency48 Items excluding restructuring charges50 EBITA and EBITA margin50 Cash conversion50 Gross cash and net cash, end of period51 Capital employed51 Capital turnover52 Return on capital employed52 Equity ratio52 Return on equity53 Earnings (loss) per share (non-IFRS)53 Free cash flow and free cash flow excluding M&A

Ericsson | Fourth Quarter and Full-Year Report 2018 Financial statements24
Consolidated income statementOct-Dec Jan-Dec
SEK million 2018 2017 Change 2018 2017 Change
Net sales 63,809 57,881 10% 210,838 205,378 3%
Cost of sales –47,430 –45,365 5% –142,638 –157,451 –9%
Gross income 16,379 12,516 31% 68,200 47,927 42%
Gross margin (%) 25.7% 21.6% 32.3% 23.3%
Research and development expenses –10,665 –9,938 7% –38,909 –37,887 3%
Selling and administrative expenses –7,685 –8,245 –7% –27,519 –29,027 –5%
Impairment losses on trade receivables 1) 386 –680 –157% –420 –3,649 –88%
Operating expenses –17,964 –18,863 –5% –66,848 –70,563 –5%
Other operating income and expenses 1) –294 –12,926 –168 –12,131
Shares in earnings of JV and associated companies 27 –5 58 24
Operating income (loss) –1,852 –19,278 –90% 1,242 –34,743 –104%
Financial income –294 –124 –316 –372
Financial expenses –421 –394 –2,389 –843
Income after financial items –2,567 –19,796 –87% –1,463 –35,958 –96%
Taxes –3,930 1,303 –402% –4,813 3,525 –237%
Net income (loss) –6,497 –18,493 –65% –6,276 –32,433 –81%
Net income (loss) attributable to:
Stockholders of the Parent Company –6,553 –18,476 –6,530 –32,576
Non-controlling interests 56 –17 254 143
Other information
Average number of shares, basic (million) 3,296 3,283 3,291 3,277
Earnings (loss) per share, basic (S EK) 2) –1.99 –5.63 –1.98 –9.94
Earnings (loss) per share, diluted (SEK) 3) –1.99 –5.63 –1.98 –9.94
1) Impairment of trade receivables has been calculated according to IFRS 9 in 2018 and according to IAS 39 in 2017. Previously, these losses have been reported as selling and administrative expenses.2) Based on net income (loss) attributable to stockholders of the Parent Company.3) Potential ordinary shares are not considered when their conversion to ordinary shares would increase earnings per share.
Statement of comprehensive income (loss)Oct-Dec Jan-Dec
SEK million 2018 2017 2018 2017
Net income (loss) –6,497 –18,493 –6,276 –32,433
Other comprehensive income (loss)
Items that will not be reclassified to profit or loss
Remeasurements of defined benefits pension plans incl. asset ceiling –2,950 2,616 –2,453 970
Revaluation of borrowings due to change in credit risk 433 – 207 –
Tax on items that will not be reclassified to profit or loss 555 –764 285 –547
Items that may be reclassified to profit or loss
Available-for-sale financial assets
Gains/losses arising during the period – –10 – 68
Reclassification adjustments on gains/losses included in profit or loss – – – 5
Revaluation of other investments in shares and participations
Fair value remeasurement – 102 – 99
Changes in cumulative translation adjustments 243 1,145 2,047 –3,378
Share of other comprehensive income on JV and associated companies –1 7 14 –
Tax on items that may be reclassified to profit or loss – 1 – –16
Total other comprehensive income (loss), net of tax –1,720 3,097 100 –2,799
Total comprehensive income (loss) –8,217 –15,396 –6,176 –35,232
Total comprehensive income (loss) attributable to:
Stockholders of the Parent Company –8,277 –15,418 –6,470 –35,357
Non-controlling interest 60 22 294 125
Financial statements
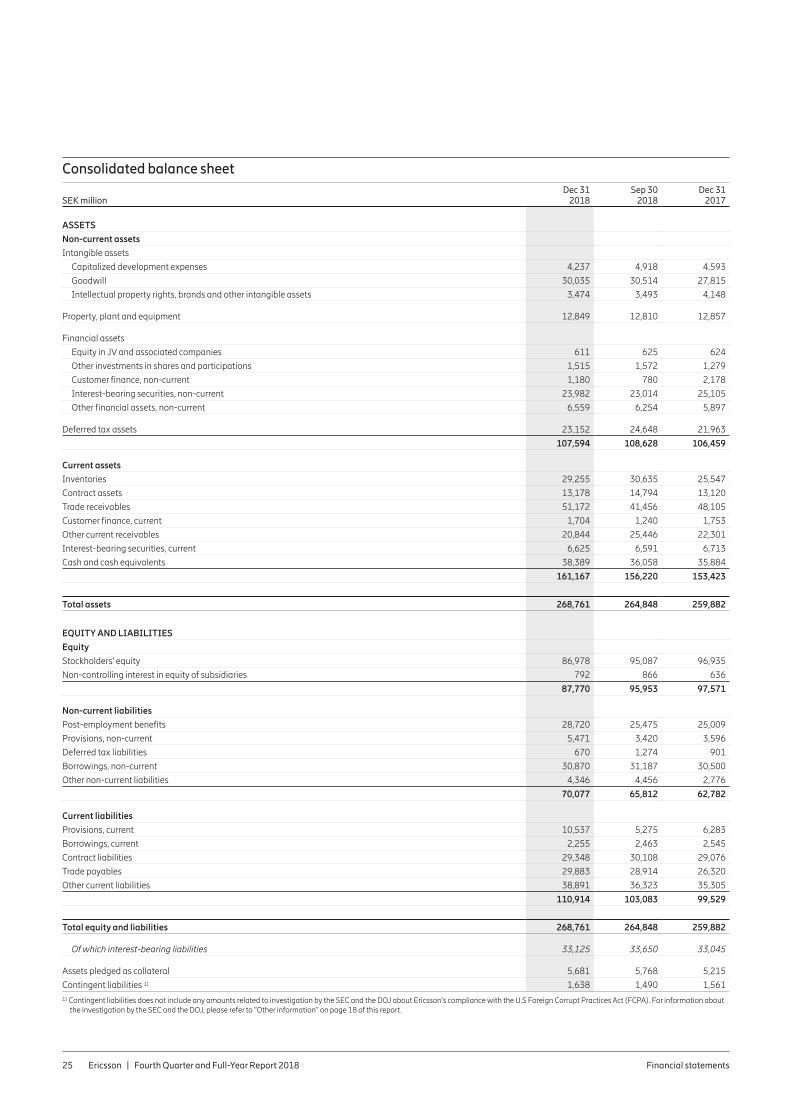
Ericsson | Fourth Quarter and Full-Year Report 2018 Financial statements25
Consolidated balance sheet
SEK millionDec 31
2018Sep 30
2018Dec 31
2017
ASSETS
Non-current assets
Intangible assets
Capitalized development expenses 4,237 4,918 4,593
Goodwill 30,035 30,514 27,815
Intellectual property rights, brands and other intangible assets 3,474 3,493 4,148
Property, plant and equipment 12,849 12,810 12,857
Financial assets
Equity in JV and associated companies 611 625 624
Other investments in shares and participations 1,515 1,572 1,279
Customer finance, non-current 1,180 780 2,178
Interest-bearing securities, non-current 23,982 23,014 25,105
Other financial assets, non-current 6,559 6,254 5,897
Deferred tax assets 23,152 24,648 21,963
107,594 108,628 106,459
Current assets
Inventories 29,255 30,635 25,547
Contract assets 13,178 14,794 13,120
Trade receivables 51,172 41,456 48,105
Customer finance, current 1,704 1,240 1,753
Other current receivables 20,844 25,446 22,301
Interest-bearing securities, current 6,625 6,591 6,713
Cash and cash equivalents 38,389 36,058 35,884
161,167 156,220 153,423
Total assets 268,761 264,848 259,882
EQUITY AND LIABILITIES
Equity
Stockholders' equity 86,978 95,087 96,935
Non-controlling interest in equity of subsidiaries 792 866 636
87,770 95,953 97,571
Non-current liabilities
Post-employment benefits 28,720 25,475 25,009
Provisions, non-current 5,471 3,420 3,596
Deferred tax liabilities 670 1,274 901
Borrowings, non-current 30,870 31,187 30,500
Other non-current liabilities 4,346 4,456 2,776
70,077 65,812 62,782
Current liabilities
Provisions, current 10,537 5,275 6,283
Borrowings, current 2,255 2,463 2,545
Contract liabilities 29,348 30,108 29,076
Trade payables 29,883 28,914 26,320
Other current liabilities 38,891 36,323 35,305
110,914 103,083 99,529
Total equity and liabilities 268,761 264,848 259,882
Of which interest-bearing liabilities 33,125 33,650 33,045
Assets pledged as collateral 5,681 5,768 5,215
Contingent liabilities 1) 1,638 1,490 1,5611) Contingent liabilities does not include any amounts related to investigation by the SEC and the DOJ about Ericsson’s compliance with the U.S Foreign Corrupt Practices Act (FCPA). For information about
the investigation by the SEC and the DOJ, please refer to “Other information” on page 18 of this report.
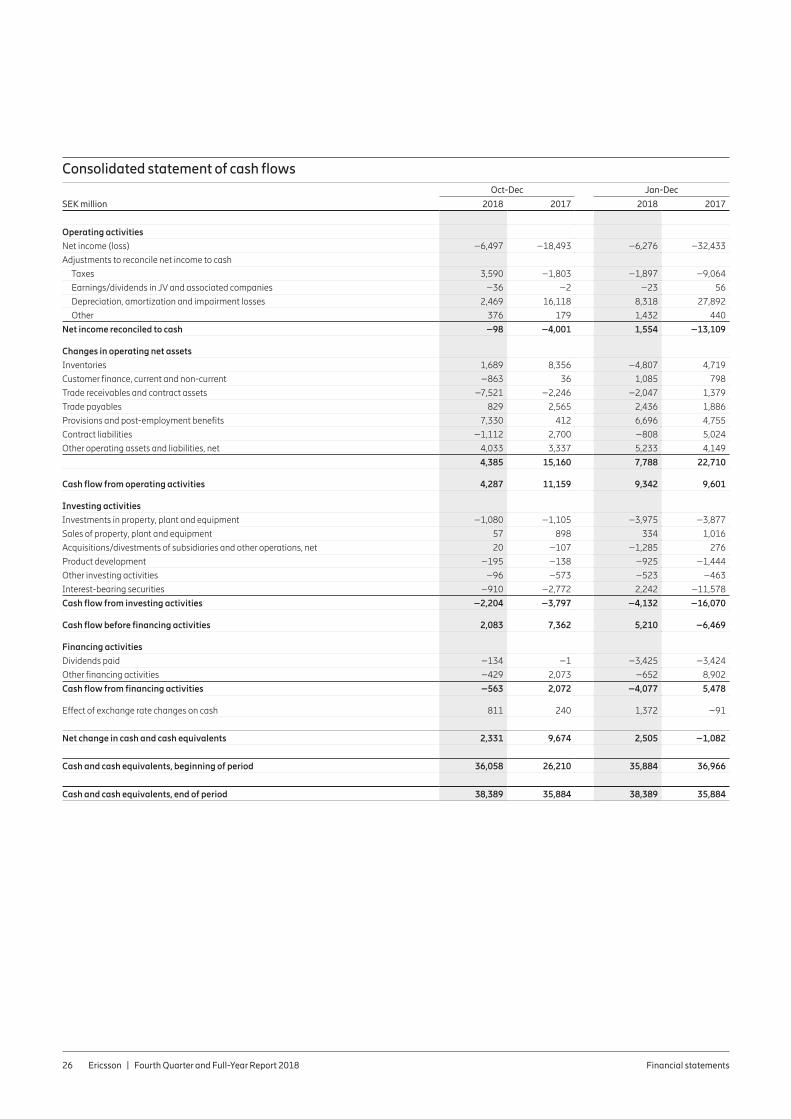
Ericsson | Fourth Quarter and Full-Year Report 2018 Financial statements26
Consolidated statement of cash flowsOct-Dec Jan-Dec
SEK million 2018 2017 2018 2017
Operating activities
Net income (loss) –6,497 –18,493 –6,276 –32,433
Adjustments to reconcile net income to cash
Taxes 3,590 –1,803 –1,897 –9,064
Earnings/dividends in JV and associated companies –36 –2 –23 56
Depreciation, amortization and impairment losses 2,469 16,118 8,318 27,892
Other 376 179 1,432 440
Net income reconciled to cash –98 –4,001 1,554 –13,109
Changes in operating net assets
Inventories 1,689 8,356 –4,807 4,719
Customer finance, current and non-current –863 36 1,085 798
Trade receivables and contract assets –7,521 –2,246 –2,047 1,379
Trade payables 829 2,565 2,436 1,886
Provisions and post-employment benefits 7,330 412 6,696 4,755
Contract liabilities –1,112 2,700 –808 5,024
Other operating assets and liabilities, net 4,033 3,337 5,233 4,149
4,385 15,160 7,788 22,710
Cash flow from operating activities 4,287 11,159 9,342 9,601
Investing activities
Investments in property, plant and equipment –1,080 –1,105 –3,975 –3,877
Sales of property, plant and equipment 57 898 334 1,016
Acquisitions/divestments of subsidiaries and other operations, net 20 –107 –1,285 276
Product development –195 –138 –925 –1,444
Other investing activities –96 –573 –523 –463
Interest-bearing securities –910 –2,772 2,242 –11,578
Cash flow from investing activities –2,204 –3,797 –4,132 –16,070
Cash flow before financing activities 2,083 7,362 5,210 –6,469
Financing activities
Dividends paid –134 –1 –3,425 –3,424
Other financing activities –429 2,073 –652 8,902
Cash flow from financing activities –563 2,072 –4,077 5,478
Effect of exchange rate changes on cash 811 240 1,372 –91
Net change in cash and cash equivalents 2,331 9,674 2,505 –1,082
Cash and cash equivalents, beginning of period 36,058 26,210 35,884 36,966
Cash and cash equivalents, end of period 38,389 35,884 38,389 35,884

Ericsson | Fourth Quarter and Full-Year Report 2018 Financial statements27
Consolidated statement of changes in equity
SEK million
Jan-Dec
2018 2017
Opening balance 1) 97,571 135,257
Opening balance adjustment due to IFRS 9 –983 –
Adjusted opening balance 96,588 135,257
Total comprehensive income (loss) –6,176 –35,232
Sale/repurchase of own shares 107 –5
Stock issue (net) – 15
Long-term variable compensation plans 677 885
Dividends paid –3,425 –3,424
Transactions with non-controlling interests –1 75
Closing balance 87,770 97,5711) The opening balance adjustment for IFRS 15 on initial application date (January 1, 2016) was SEK –4,353 million. Opening balances of 2017 and 2018 have been restated for IFRS 15.
Consolidated income statement – isolated quarters2018 2017
Isolated quarters, SEK million Q4 Q3 Q2 Q1 Q4 Q3 Q2 Q1
Net sales 63,809 53,810 49,808 43,411 57,881 49,413 50,281 47,803
Cost of sales –47,430 –34,180 –32,475 –28,553 –45,365 –36,132 –35,652 –40,302
Gross income 16,379 19,630 17,333 14,858 12,516 13,281 14,629 7,501
Gross margin (%) 25.7% 36.5% 34.8% 34.2% 21.6% 26.9% 29.1% 15.7%
Research and development expenses –10,665 –9,388 –9,783 –9,073 –9,938 –10,519 –8,364 –9,066
Selling and administrative expenses –7,685 –6,625 –7,053 –6,156 –8,245 –5,741 –6,818 –8,223
Impairment losses on trade receivables 1) 386 –409 –369 –28 –680 –1,094 –235 –1,640
Operating expenses –17,964 –16,422 –17,205 –15,257 –18,863 –17,354 –15,417 –18,929
Other operating income and expenses –294 31 11 84 –12,926 2) 415 239 141
Shares in earnings of JV and associated companies 27 2 26 3 –5 6 12 11
Operating income (loss) –1,852 3,241 165 –312 –19,278 –3,652 –537 –11,276
Financial income –294 –225 275 –72 –124 –139 –27 –82
Financial expenses –421 –414 –1,085 –469 –394 –182 83 –350
Income after financial items –2,567 2,602 –645 –853 –19,796 –3,973 –481 –11,708
Taxes –3,930 146 –1,157 128 1,303 516 24 1,682
Net income (loss) –6,497 2,748 –1,802 –725 –18,493 –3,457 –457 –10,026
Net income (loss) attributable to:
Stockholders of the Parent Company –6,553 2,745 –1,885 –837 –18,476 –3,561 –471 –10,068
Non-controlling interests 56 3 83 112 –17 104 14 42
Other information
Average number of shares, basic (million) 3,296 3,293 3,290 3,286 3,283 3,279 3,275 3,272
Earnings (loss) per share, basic (SEK) 3) –1.99 0.84 –0.58 –0.25 –5.63 –1.09 –0.14 –3.08
Earnings (loss) per share, diluted (SEK) 4) –1.99 0.83 –0.58 –0.25 –5.63 –1.09 –0.14 –3.081) Impairment of trade receivables has been calculated according to IFRS 9 in 2018 and according to IAS 39 in 2017. Previously, these losses have been reported as selling and administrative expenses. 2) Includes write-down of goodwill of SEK –13.0 billion. 3) Based on net income (loss) attributable to stockholders of the Parent Company.4) Potential ordinary shares are not considered when their conversion to ordinary shares would increase earnings per share.

Ericsson | Fourth Quarter and Full-Year Report 2018 Financial statements28
Consolidated statement of cash flows – isolated quarters2018 2017
Isolated quarters, SEK million Q4 Q3 Q2 Q1 Q4 Q3 Q2 Q1
Operating activities
Net income (loss) –6,497 2,748 –1,802 –725 –18,493 –3,457 –457 –10,026
Adjustments to reconcile net income to cash
Taxes 3,590 –2,101 –1,071 –2,315 –1,803 –1,323 –1,826 –4,112
Earnings/dividends in JV and associ-ated companies –36 28 –19 4 –2 73 –8 –7
Depreciation, amortization and impair-ment losses 2,469 1,893 2,065 1,891 16,118 4,146 2,197 5,431
Other 376 348 568 140 179 –218 –48 527
Net income reconciled to cash –98 2,916 –259 –1,005 –4,001 –779 –142 –8,187
Changes in operating net assets
Inventories 1,689 –1,773 –1,910 –2,813 8,356 1,061 –1,492 –3,206
Customer finance, current and non-cur-rent –863 1,001 547 400 36 456 1,140 –834
Trade receivables and contract assets –7,521 –3,503 1,661 7,316 –2,246 623 184 2,818
Trade payables 829 953 1,252 –598 2,565 –1,061 19 363
Provisions and post-employment benefits 7,330 –265 478 –847 412 –608 315 4,636
Contract liabilities –1,112 –220 –233 757 2,700 –1,910 –573 4,807
Other operating assets and liabilities, net 4,033 2,931 –94 –1,637 3,337 2,200 550 –1,938
4,385 –876 1,701 2,578 15,160 761 143 6,646
Cash flow from operating activities 4,287 2,040 1,442 1,573 11,159 –18 1 –1,541
Investing activities
Investments in property, plant and equip-ment –1,080 –1,088 –951 –856 –1,105 –739 –1,018 –1,015
Sales of property, plant and equipment 57 102 52 123 898 12 37 69
Acquisitions/divestments of subsidiaries and other operations, net 20 –425 –431 –449 –107 371 9 3
Product development –195 –151 –325 –254 –138 –126 –315 –865
Other investing activities –96 –190 –398 161 –573 42 –42 110
Interest-bearing securities –910 30 3,656 –534 –2,772 3,756 –676 –11,886
Cash flow from investing activities –2,204 –1,722 1,603 –1,809 –3,797 3,316 –2,005 –13,584
Cash flow before financing activities 2,083 318 3,045 –236 7,362 3,298 –2,004 –15,125
Financing activities
Dividends paid –134 –2 –3,289 – –1 –145 –3,274 –4
Other financing activities –429 254 –383 –94 2,073 1,563 –5,636 10,902
Cash flow from financing activities –563 252 –3,672 –94 2,072 1,418 –8,910 10,898
Effect of exchange rate changes on cash 811 –1,562 980 1,143 240 48 –594 215
Net change in cash and cash equiva-lents 2,331 –992 353 813 9,674 4,764 –11,508 –4,012
Cash and cash equivalents, beginning of period 36,058 37,050 36,697 35,884 26,210 21,446 32,954 36,966
Cash and cash equivalents, end of period 38,389 36,058 37,050 36,697 35,884 26,210 21,446 32,954

Ericsson | Fourth Quarter and Full-Year Report 2018 Financial statements29
Parent Company income statementOct-Dec Jan-Dec
SEK million 2018 2017 2018 2017
Net sales – – – –
Cost of sales – – – –
Gross income – – – –
Operating expenses –301 –434 –1,686 –1,294
Other operating income and expenses 958 –131 2,111 1,616
Operating income 657 –565 425 322
Financial net 1,853 –4,050 5,340 –2,297
Income after financial items 2,510 –4,615 5,765 –1,975
Transfers to (–) / from untaxed reserves –1,535 –120 –1,535 –120
Taxes 220 95 –36 –53
Net income (loss) 1,195 –4,640 4,194 –2,148
Parent company statement of comprehensive income (loss)Oct-Dec Jan-Dec
SEK million 2018 2017 2018 2017
Net income (loss) 1,195 –4,640 4,194 –2,148
Revaluation of borrowings due to change in credit risk –251 – 91 –
Tax on items that will not be reclassified to profit or loss 56 – –19 –
Available-for-sale financial assets
Gains/losses arising during the period – –10 – 68
Reclassification adjustments on gains/losses included in profit or loss – – – 5
Revaluation of other investments in shares and participations
Fair value remeasurement – 102 – 102
Tax on items that may be reclassified to profit or loss – 4 – –14
Total other comprehensive income, net of tax –195 96 72 161
Total comprehensive income (loss) 1,000 –4,544 4,266 –1,987

Ericsson | Fourth Quarter and Full-Year Report 2018 Financial statements30
Parent company balance sheet
SEK millionDec 31
2018Dec 31
2017
ASSETS
Fixed assets
Intangible assets 139 329
Tangible assets 259 346
Financial assets 1) 2) 109,177 119,896
109,575 120,571
Current assets
Inventories – 1
Receivables 2) 38,760 41,173
Short-term investments 6,268 6,446
Cash and cash equivalents 27,850 18,715
72,878 66,335
Total assets 182,453 186,906
STOCKHOLDERS' EQUITY, PROVISIONS AND LIABILITIES
Equity
Restricted equity 48,164 48,164
Non-restricted equity 2) 40,752 39,578
88,916 87,742
Provisions 86 602
Non-current liabilities 2) 62,581 60,623
Current liabilities 30,870 37,939
Total stockholders' equity, provisions and liabilities 182,453 186,906
1) Of which interest-bearing securities, non-current 23,982 25,105
2) The following 2018 opening balances have been adjusted due to IFRS 9: financial assets increased by SEK 8 million, receivables decreased by SEK –4 million, non-restricted equity decreased by SEK –28 million, and non-current liabilities increased by SEK 31 million.

Ericsson | Fourth Quarter and Full-Year Report 2018 Additional information31
Additional information
Accounting policies
The groupThis interim report is prepared in accordance with IAS 34. The term “IFRS” used in this document refers to the application of IAS and IFRS as well as interpretations of these standards as issued by IASB’s Standards Interpretation Committee (SIC) and IFRS Inter-pretations Committee (IFRIC). The accounting policies adopted are consistent with those of the annual report for the year ended December 31,2017 and should be read in conjunction with that annual report, with exception for the accounting policies described below.
New standards as from January 1, 2018Two new IFRS standards are effective as from January 1, 2018, IFRS 9 “Financial instruments” and IFRS 15 “Revenue from Cus-tomer Contracts”.
Presentation in the financial statementsFor IFRS 15 the Company has adopted the full retrospective method for transition, which mean that prior year comparatives have been restated and equity has been adjusted at the initial appli-cation date (January 1, 2016). The Company has applied IFRS 9 retrospectively on the required effective date, January 1, 2018. The 2018 opening balances have been adjusted, but the previous peri-ods have not been restated.
Based on the new requirements under IFRS 15, contract assets and contract liabilities have been added as new lines in the consoli-dated balance sheet and statement of cash flow. Previously, con-tract assets were reported as trade receivables and contract liabili-ties were reported as deferred revenue and as advances from cus-tomers within other current liabilities. Due to IFRS 9, impairment losses on trade receivables are reported on a separate line in the consolidated income statement. Previously, these losses have been reported as Selling and administrative expenses. In the statement of comprehensive income, a new line has been added for revalua-tion of borrowings due to changes in credit risk. A new line has been added to the consolidated statement of equity showing the adjust-ment to the opening balance.
The prior periods financial statements and key ratios presented in this quarterly report have been restated to reflect adoption of these new standards.
Accounting policy – IFRS 9 “Financial instruments”
Financial assetsThe Company classifies its financial assets in the following catego-ries: at amortized cost, at fair value through other comprehensive income (FVOCI), and at fair value through profit or loss (FVTPL). The classification depends on the characteristics of the asset and the business model in which it is held.
Financial assets at amortized costFinancial assets are classified as amortized cost if the contractual terms give rise to payments that are solely payments of principal and interest on the principal amount outstanding and the financial asset is held in a business model whose objective is to hold financial assets in order to collect contractual cash flows. These assets are subsequently measured at amortized cost using the effective inter-est method, minus impairment allowances.
Financial assets at fair value through other comprehensive income (FVOCI)Assets are classified as FVOCI if the contractual terms give rise to payments that are solely payments of principal and interest on the principal amount outstanding and the financial asset is held in a business model whose objective is achieved by both collecting contractual cash flows and selling financial assets. These assets are subsequently measured at fair value with changes in fair value recognized in other comprehensive income (OCI), except for effec-tive interest, impairment gains and losses and foreign exchange gains and losses recognized in the income statement. Upon derecognition, the cumulative gain or loss in OCI is reclassified to the income statement.
Financial assets at fair value through profit or loss (FVTPL)All financial assets that are not classified as either amortized cost or FVOCI are classified as FVTPL. A financial asset is classified as held for trading if it is acquired principally for the purpose of selling in the near term. Derivatives are classified as held for trading, unless they are designated as hedging instruments for the purpose of hedge accounting. Assets held for trading are classified as current assets. Debt instruments classified as FVTPL, but not held for trading, are classified on the balance sheet based on their maturity date (i.e. those with a maturity longer than one year are classified as non-cur-rent). Investments in shares and participations are classified as FVTPL and classified as non-current financial assets.
Gains or losses arising from changes in the fair values of the “Financial assets at fair value through profit or loss” category (excluding derivatives and customer financing) are presented in the income statement within Financial income in the period in which they arise. Gains and losses on derivatives are presented in the income statement either as Cost of sales, Other operating income, Financial income or Financial expense, depending on the intent with the transaction. Gains and losses on customer financing are presented in the income statement as Selling expenses.
Impairment in relation to financial assetsAt each balance sheet date, financial assets classified as either amortized cost or FVOCI and contract assets are assessed for impairment based on Expected Credit Losses (ECL). Allowances for trade receivables and contract assets are always equal to lifetime ECL. The loss is recognized in the income statement. When there is no reasonable expectation of collection, the asset is written off.
BorrowingsBorrowings by the Parent Company are designated FVTPL because they are managed and evaluated on a fair value basis. Changes in fair value are recognized in the income statement, except for changes in fair value due to change in credit risk which are recog-nized in Other comprehensive income.

Ericsson | Fourth Quarter and Full-Year Report 2018 Additional information32
Fair value hedging and fair value hedge accounting Fair value hedge accounting is no longer applied as of January 1, 2018.
Financial guaranteesFinancial guarantee contracts are initially recognized at fair value (i.e., usually the fee received). Subsequently, these contracts are measured at the higher of:– The expected credit losses.– The recognized contractual fee less cumulative amortization when amortized over the guarantee period, using the straight-line-method.
Accounting policy – IFRS 15 “Revenue from Contracts with Cus-tomers”IFRS 15, “Revenue from Contracts with Customers” establishes a new principle-based model of recognizing revenue from customer contracts. It introduces a five-step model that requires revenue to be recognized when control over goods and services are transferred to the customer.
The following paragraphs describes the types of contracts, when performance obligations are satisfied, and the timing of revenue recognition. They also describe the normal payment terms associ-ated with such contracts and the resulting impact on the balance sheet over the duration of the contracts. The vast majority of Ericsson’s business is for the sale of standard products and services.
Standard products and servicesProducts and services are classified as standard solutions if they do not require significant installation and integration services to be delivered. Installation and integration services are generally com-pleted within a short period of time, from the delivery of the related products. These products and services are viewed as separate dis-tinct performance obligations. This type of customer contract is usually signed as a frame agreement and the customer issues indi-vidual purchase orders to commit to purchases of products and services over the duration of the agreement.
Revenue for standard products shall be recognized when control over the equipment is transferred to the customer at a point in time. This assessment shall be viewed from a customer’s perspective considering indicators such as transfer of titles and risks, customer acceptance, physical possession, and billing rights. For hardware sales, transfer of control is usually deemed to occur when the equip-ment arrives at the customer site and for software sales, when the licenses are made available to the customer. Contractual terms may vary, therefore judgment will be applied when assessing the indica-tors of transfer of control. Revenue for installation and integration services is recognized upon completion of the service.
Transaction prices under these contracts are mostly billed upon delivery of the hardware or software, and completion of installation services, although a proportion may be billed upon formal accep-tance of the related installation services. This will result in a contract asset for the proportion of the transaction price that is not yet billed.
Revenue for recurring services such as customer support and managed services is recognized as the services are delivered, gener-ally pro-rata over time. Transaction prices under these contracts are billed over time, often on a quarterly basis. Contract liabilities or receivables may arise depending on whether the quarterly billing is in advance or in arrears.
Contract for standard products and services applies to business in all segments.
Customized solutionSome products and services are sold together as part of a custom-ized solution to the customer. This type of contract requires signifi-cant installation and integration services to be delivered within the solution, normally over a period of more than 1 year. These products and services are viewed together as a combined performance obli-gation. This type of contract is usually sold as a firm contract in which the scope of the solution and obligations of both parties are clearly defined for the duration of the contract.
Summary of changes to classification of financial assets and financial liabilities
Type of asset IAS 39 classification IFRS 9 classification Reason for IFRS 9 classification
Cash equivalents, interest-bearing securities, and derivatives (held for trading)
FVTPL FVTPL Held for trading portfolios are classified as FVTPL (no change).
Cash equivalents (not held for trading) Loans and receivables Amortized cost These assets are held to collect contrac-tual cash flows.
Interest-bearing securities (not held for trading)
Available-for-sale FVTPL These assets are not held for trading but are managed and evaluated on a fair value basis.
Trade receivables Loans and receivables FVOCI Trade receivables are managed in a business model whose objective is achieved through both collection of contractual cash flows and selling of assets.
Customer financing Loans and receivables FVTPL Customer finance assets are managed in a business model with the objective to realize cash flows through the sale of assets.
Investments in shares and participa-tions (equity instruments)
Available-for-sale FVTPL This is an accounting policy choice under IFRS 9.
Borrowings by parent company Amortized cost Designated FVTPL These borrowings are managed and evaluated on a fair value basis.

Ericsson | Fourth Quarter and Full-Year Report 2018 Additional information33
Revenue for the combined performance obligation shall be recognized over time if progress of completion can be reliably mea-sured and enforceable right to payment exists over the duration of the contract. The progress of completion is estimated by reference to the output delivered such as achievement of contract milestones and customer acceptance. This method is considered appropriate as it reflects the nature of the customized solution and how integration service is delivered in these projects. Formal acceptance term is considered a key indicator of transfer of control for a customized solution and shall therefore be obtained prior to recognizing reve-nue. If the criteria above are not met, then all revenue shall be rec-ognized upon the completion of the customized solution, when final acceptance is provided by the customer.
Transaction price under these contracts are represented by prog-ress payments or billing milestones as defined in the contracts. In most cases, revenue recognized is limited to the progress payments or unconditional billing milestones over the duration of the contract, therefore no contract asset or contract liability arises on these con-tracts. In some contracts, revenue may be recognized in advance of billing milestones if enforceable payment rights exist at all times over the contract duration. This will result in a contract asset bal-ance until billing milestones are reached.
Contract for customized solution applies to the Business Support Systems (BSS) business within the segment Digital Services and the Media Solutions business within the segment Emerging Business and Other.
Intellectual Property Rights (IPR)This type of contract relates to the patent and licensing business. The Company has assessed that the nature of its IPR contracts is such that they provide customers a license with the right to access Ericsson intellectual properties over time, therefore revenue shall be recognized over the duration of the contract. Royalty revenue based on sales or usage is recognized when the sales and usage occurs.
The transaction price on these contracts is usually structured as a royalty fee based on sales or usage over the period, measured on a quarterly basis. This results in a receivable balance if the billing is performed the following quarter after measurement. Some con-tracts include lump sum amounts, payable either up front at com-mencement or on an annual basis. This results in a contract liability balance if payment is in advance of revenue, as revenue is recog-nized over time.
As described in Note C3 “Segment Information” of the Annual Report 2017, revenue from IPR licensing contracts are allocated to the segments Networks and Digital Services.
Impact of IFRS 9 and IFRS 15 on balance sheet items
As reported at 31.12 2017
IFRS 15 restatement
Restated balance at
31.12.2017IFRS 9
adjustment
Adjusted balance at
1.1.2018
ASSETS
Non-current assets
Deferred tax assets 21,228 735 21,963 288 22,251
Current assets
Inventories 24,960 587 25,547 – 25,547
Contract assets – 13,120 13,120 – 13,120
Trade receivables 63,210 –15,105 48,105 –1,240 46,865
EQUITY AND LIABILITIES
Equity
Stockholder's equity 99,540 –2,605 96,935 –983 95,952
Non-current liabilities
Borrowings, non-current 30,500 – 30,500 31 30,531
Current liabilities
Provisions 6,350 –67 6,283 – 6,283
Contract liabilities – 29,076 29,076 – 29,076
Other current liabilities 62,370 –27,065 35,305 – 35,305
IFRS 16 – LeasesIn January 2016, IASB issued a new lease standard, IFRS 16, that will replace IAS 17 Leases and the related interpretations IFRIC 4, SIC-15 and SIC-27. The definition of a lease is amended which impacts the accounting both from a lessee and lessor perspective. The new standard includes more specific guidance on if and when leasing is embedded in a service contract.
Accounting for lesseesThe standard requires assets and liabilities arising from all leases, with some exceptions, to be recognized on the balance sheet. This model reflects that, at the start of a lease, the lessee always obtains the right to use an asset for a period of time and has an obligation to
pay for that right. The main types of assets leased by the Company are, in the order of materiality, real estate, IT-equipment and vehi-cles. Vehicles are mainly used under service contracts.
Accounting for lessorsThe accounting for lessors will be based on the same classification as of an operating or finance lease under IAS 17. This means that if the Company, as a lessor, substantially retains the ownership rights and obligations of the asset, then the lease is classified as an oper-ating lease. On the contrary, the lease is classified as a finance lease if the ownership rights and obligations of the asset are transferred to the lessee.

Ericsson | Fourth Quarter and Full-Year Report 2018 Additional information34
Impact at transitionThe standard is effective for annual periods beginning on or after January 1, 2019. The Company will apply the new standard as from January 1, 2019. At transition, the Company will apply the practical expedient under IFRS 16 to not reassess whether a contract is, or contains, a lease. Therefore, the Company will apply the standard to contracts previously identified as leases, or as containing a lease under IAS 17 and IFRIC 4.
The Company will elect to implement the standard using the cumulative catch-up method, with the cumulative effect being adjusted to the opening retained earnings balance at transition date. There will be no restated information presented for previous years.
At transition, the Company, as a lessee, will recognize lease liabilities for leases previously classified as operating leases. The weighted average incremental borrowing rate to be applied to lease liabilities recognized in the balance sheet at the transition date is estimated to 5.4%. Right-of-use assets will for most contracts be recognized based on the amount equal to the related lease liability. For some larger real estate contracts right-of-use assets are recog-nized as if IFRS 16 had been applied since the commencement date, however, using the incremental borrowing rate as per the effective date. The asset value for these contracts is estimated to be SEK 0.3 billion lower than the related liabilities. It is this difference that causes the reduction of equity as per transition date.
The Company will also apply the following practical expedients when applying IFRS 16 at transition date:zz The IAS 37 onerous lease contract measurement for the operat-
ing leases existing as per the effective date. This expedient will be applied as a substitute for the measurement of impairment for the related right-of-use as assets. Impairment testing will be applied going-forward.
zz Exclusion of initial direct costs from the measurement of the right-to-use asset at the date of initial recognition.
The Company does not expect material impact on lessor accounting at transition.
A new classification in the income statement will be made. Under IFRS 16, as a lessee, the finance cost is reported under finance costs while under operating leases they were embedded in the lease expenses, either as costs of sales or operating expenses.
The timing of the cash flows will not be impacted. The reported amortization of lease liabilities will, however, be reported as from effective date as financing cash flows and not operating cash flows as prior to 2019. The impact of this reclassification is in 2019 esti-mated to be SEK 2.0 billion.
Estimated opening balance sheet impact of IFRS 16 (discounted)
SEK billion IFRS 16 adjustment
Right of use assets 9.1
Impairment provision reclassification 0.8
Lease liabilities current –2.2
Lease liabilities non-current –8.3
Equity 0.3
Other reclassification of balance sheet accounts due to IFRS 16 0.3
The estimated increase of right-of-use assets is SEK 9.1 billion presented in PP&E. This will increase the total asset value by 3%.
The previous impairment provisions for real estate have been reclassified as right-of-use asset allowances. There is no impact on the income statement.
Segment reporting
Changes applied in Q1 2018As of Q1 2018, sales related to 3PP routing business are reported in Networks (earlier Digital Services). Comparative periods have been restated to reflect this change. In Q1 2018, these sales were SEK 151 (160) million.
Changes applied in Q2 2018As of Q2 2018, sales related to Application Development and Main-tenance (ADM) and certain sales related to Business Support Solu-tion (BSS) was moved between segments Managed Services and Digital Services, with increased sales in Managed Services and a corresponding sales decrease in Digital Services (net effect of SEK 1.9 b in 2017). The corresponding impact on 2017 gross income was SEK 0.2 b (positive for Managed Services, negative for Digital Services). Historical data has been restated to reflect the organiza-tional change.

Ericsson | Fourth Quarter and Full-Year Report 2018 Additional information35
Net sales by segment by quarter2018 2017
Isolated quarters, SEK million Q4 Q3 Q2 Q1 Q4 Q3 Q2 Q1
Networks 41,641 35,934 32,393 28,602 37,077 31,871 31,699 31,638
Of which Products 29,803 25,336 22,319 19,473 25,404 21,734 21,281 21,858
Of which Services 11,838 10,598 10,074 9,129 11,673 10,137 10,418 9,780
Digital Services 13,007 8,987 8,833 7,262 11,820 8,930 9,901 8,101
Of which Products 7,462 4,582 4,467 3,947 6,452 4,859 5,370 4,327
Of which Services 5,545 4,405 4,366 3,315 5,368 4,071 4,531 3,774
Managed Services 6,881 6,465 6,528 5,896 6,898 6,618 6,673 6,283
Emerging Business and Other 2,280 2,424 2,054 1,651 2,086 1,994 2,008 1,781
Total 63,809 53,810 49,808 43,411 57,881 49,413 50,281 47,803
2018 2017
Sequential change, percent Q4 Q3 Q2 Q1 Q4 Q3 Q2 Q1
Networks 16% 11% 13% –23% 16% 1% 0% –
Of which Products 18% 14% 15% –23% 17% 2% –3% –
Of which Services 12% 5% 10% –22% 15% –3% 7% –
Digital Services 45% 2% 22% –39% 32% –10% 22% –
Of which Products 63% 3% 13% –39% 33% –10% 24% –
Of which Services 26% 1% 32% –38% 32% –10% 20% –
Managed Services 6% –1% 11% –15% 4% –1% 6% –
Emerging Business and Other –6% 18% 24% –21% 5% –1% 13% –
Total 19% 8% 15% –25% 17% –2% 5% –
2018 2017
Year over year change, percent Q4 Q3 Q2 Q1 Q4 Q3 Q2 Q1
Networks 12% 13% 2% –10% – – – –
Of which Products 17% 17% 5% –11% – – – –
Of which Services 1% 5% –3% –7% – – – –
Digital Services 10% 1% –11% –10% – – – –
Of which Products 16% –6% –17% –9% – – – –
Of which Services 3% 8% –4% –12% – – – –
Managed Services 0% –2% –2% –6% – – – –
Emerging Business and Other 9% 22% 2% –7% – – – –
Total 10% 9% –1% –9% – – – –
2018 2017
Year to date, SEK million Jan-Dec Jan-Sep Jan-Jun Jan-Mar Jan-Dec Jan-Sep Jan-Jun Jan-Mar
Networks 138,570 96,929 60,995 28,602 132,285 95,208 63,337 31,638
Of which Products 96,931 67,128 41,792 19,473 90,277 64,873 43,139 21,858
Of which Services 41,639 29,801 19,203 9,129 42,008 30,335 20,198 9,780
Digital Services 38,089 25,082 16,095 7,262 38,752 26,932 18,002 8,101
Of which Products 20,458 12,996 8,414 3,947 21,008 14,556 9,697 4,327
Of which Services 17,631 12,086 7,681 3,315 17,744 12,376 8,305 3,774
Managed Services 25,770 18,889 12,424 5,896 26,472 19,574 12,956 6,283
Emerging Business and Other 8,409 6,129 3,705 1,651 7,869 5,783 3,789 1,781
Total 210,838 147,029 93,219 43,411 205,378 147,497 98,084 47,803
2018 2017
Year over year change, percent Jan-Dec Jan-Sep Jan-Jun Jan-Mar Jan-Dec Jan-Sep Jan-Jun Jan-Mar
Networks 5% 2% –4% –10% –6% – – –
Of which Products 7% 3% –3% –11% –4% – – –
Of which Services –1% –2% –5% –7% –8% – – –
Digital Services –2% –7% –11% –10% –9% – – –
Of which Products –3% –11% –13% –9% –10% – – –
Of which Services –1% –2% –8% –12% –8% – – –
Managed Services –3% –3% –4% –6% –8% – – –
Emerging Business and Other 7% 6% –2% –7% –9% – – –
Total 3% 0% –5% –9% –7% – – –

Ericsson | Fourth Quarter and Full-Year Report 2018 Additional information36
Sales growth adjusted for comparable units and currency*2018 2017
Sequential change, percent Q4 Q3 Q2 Q1 Q4 Q3 Q2 Q1
Networks 16% 9% 7% –22% – – – –
Digital Services 45% 0% 16% –38% – – – –
Managed Services 7% –1% 6% –11% – – – –
Emerging Business and Other –6% 15% 18% –20% – – – –
Total 19% 7% 9% –24% – – – –
Isolated quarter, year over year change, percent
2018 2017
Q4 Q3 Q2 Q1 Q4 Q3 Q2 Q1
Networks 6% 5% 2% –2% – – – –
Digital Services 5% –6% –12% –3% – – – –
Managed Services –5% –8% –3% –4% – – – –
Emerging Business and Other 1% 11% 1% –2% – – – –
Total 4% 1% –1% –2% – – – –
Year to date, year over year change, percent
2018 2017
Jan-Dec Jan-Sep Jan-Jun Jan-Mar Jan-Dec Jan-Sep Jan-Jun Jan-Mar
Networks 3% 2% 0% –2% – – – –
Digital Services –4% –7% –8% –3% – – – –
Managed Services –5% –5% –3% –4% – – – –
Emerging Business and Other 3% 3% –1% –2% – – – –
Total 1% –1% –2% –2% – – – –
* Sales growth adjusted for comparable units and currency has not been restated for 2017.
Gross income (loss) and gross margin by segment by quarter
Isolated quarters, SEK million
2018 2017
Q4 Q3 Q2 Q1 Q4 Q3 Q2 Q1
Networks 16,626 14,835 12,565 11,127 11,849 10,654 10,894 10,031
Digital Services –1,240 3,208 3,458 2,892 1,113 2,620 3,289 –2,324
Managed Services 781 805 809 491 –691 –360 19 –542
Emerging Business and Other 212 782 501 348 245 367 427 336
Total 16,379 19,630 17,333 14,858 12,516 13,281 14,629 7,501
Isolated quarters, As percentage of net sales
2018 2017
Q4 Q3 Q2 Q1 Q4 Q3 Q2 Q1
Networks 39.9% 41.3% 38.8% 38.9% 32.0% 33.4% 34.4% 31.7%
Digital Services –9.5% 35.7% 39.1% 39.8% 9.4% 29.3% 33.2% –28.7%
Managed Services 11.4% 12.5% 12.4% 8.3% –10.0% –5.4% 0.3% –8.6%
Emerging Business and Other 9.3% 32.3% 24.4% 21.1% 11.7% 18.4% 21.3% 18.9%
Total 25.7% 36.5% 34.8% 34.2% 21.6% 26.9% 29.1% 15.7%
Year to date, SEK million
2018 2017
Jan-Dec Jan-Sep Jan-Jun Jan-Mar Jan-Dec Jan-Sep Jan-Jun Jan-Mar
Networks 55,153 38,527 23,692 11,127 43,428 31,579 20,925 10,031
Digital Services 8,318 9,558 6,350 2,892 4,698 3,585 965 –2,324
Managed Services 2,886 2,105 1,300 491 –1,574 –883 –523 –542
Emerging Business and Other 1,843 1,631 849 348 1,375 1,130 763 336
Total 68,200 51,821 32,191 14,858 47,927 35,411 22,130 7,501
Year to date, As percentage of net sales
2018 2017
Jan-Dec Jan-Sep Jan-Jun Jan-Mar Jan-Dec Jan-Sep Jan-Jun Jan-Mar
Networks 39.8% 39.7% 38.8% 38.9% 32.8% 33.2% 33.0% 31.7%
Digital Services 21.8% 38.1% 39.5% 39.8% 12.1% 13.3% 5.4% –28.7%
Managed Services 11.2% 11.1% 10.5% 8.3% –5.9% –4.5% –4.0% –8.6%
Emerging Business and Other 21.9% 26.6% 22.9% 21.1% 17.5% 19.5% 20.1% 18.9%
Total 32.3% 35.2% 34.5% 34.2% 23.3% 24.0% 22.6% 15.7%
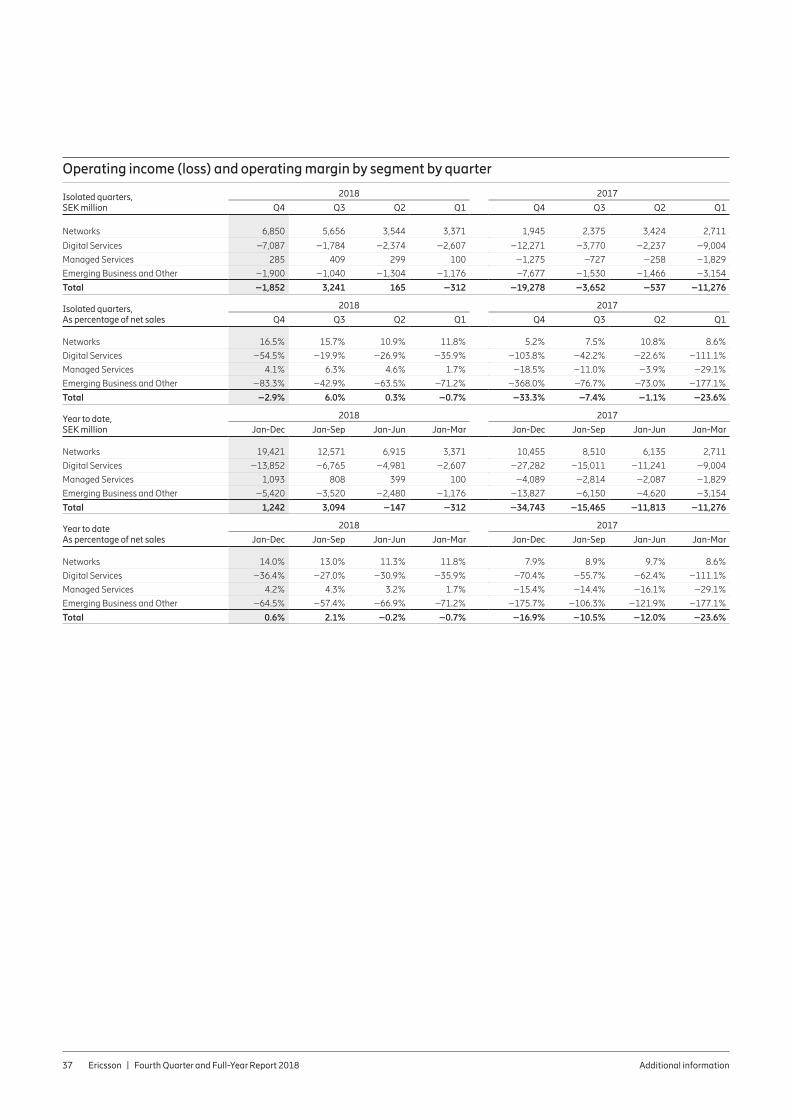
Ericsson | Fourth Quarter and Full-Year Report 2018 Additional information37
Operating income (loss) and operating margin by segment by quarter
Isolated quarters, SEK million
2018 2017
Q4 Q3 Q2 Q1 Q4 Q3 Q2 Q1
Networks 6,850 5,656 3,544 3,371 1,945 2,375 3,424 2,711
Digital Services –7,087 –1,784 –2,374 –2,607 –12,271 –3,770 –2,237 –9,004
Managed Services 285 409 299 100 –1,275 –727 –258 –1,829
Emerging Business and Other –1,900 –1,040 –1,304 –1,176 –7,677 –1,530 –1,466 –3,154
Total –1,852 3,241 165 –312 –19,278 –3,652 –537 –11,276
Isolated quarters, As percentage of net sales
2018 2017
Q4 Q3 Q2 Q1 Q4 Q3 Q2 Q1
Networks 16.5% 15.7% 10.9% 11.8% 5.2% 7.5% 10.8% 8.6%
Digital Services –54.5% –19.9% –26.9% –35.9% –103.8% –42.2% –22.6% –111.1%
Managed Services 4.1% 6.3% 4.6% 1.7% –18.5% –11.0% –3.9% –29.1%
Emerging Business and Other –83.3% –42.9% –63.5% –71.2% –368.0% –76.7% –73.0% –177.1%
Total –2.9% 6.0% 0.3% –0.7% –33.3% –7.4% –1.1% –23.6%
Year to date, SEK million
2018 2017
Jan-Dec Jan-Sep Jan-Jun Jan-Mar Jan-Dec Jan-Sep Jan-Jun Jan-Mar
Networks 19,421 12,571 6,915 3,371 10,455 8,510 6,135 2,711
Digital Services –13,852 –6,765 –4,981 –2,607 –27,282 –15,011 –11,241 –9,004
Managed Services 1,093 808 399 100 –4,089 –2,814 –2,087 –1,829
Emerging Business and Other –5,420 –3,520 –2,480 –1,176 –13,827 –6,150 –4,620 –3,154
Total 1,242 3,094 –147 –312 –34,743 –15,465 –11,813 –11,276
Year to date As percentage of net sales
2018 2017
Jan-Dec Jan-Sep Jan-Jun Jan-Mar Jan-Dec Jan-Sep Jan-Jun Jan-Mar
Networks 14.0% 13.0% 11.3% 11.8% 7.9% 8.9% 9.7% 8.6%
Digital Services –36.4% –27.0% –30.9% –35.9% –70.4% –55.7% –62.4% –111.1%
Managed Services 4.2% 4.3% 3.2% 1.7% –15.4% –14.4% –16.1% –29.1%
Emerging Business and Other –64.5% –57.4% –66.9% –71.2% –175.7% –106.3% –121.9% –177.1%
Total 0.6% 2.1% –0.2% –0.7% –16.9% –10.5% –12.0% –23.6%

Ericsson | Fourth Quarter and Full-Year Report 2018 Additional information38
EBITA and EBITA margin by segment by quarter
Isolated quarters, SEK million
2018 2017
Q4 Q3 Q2 Q1 Q4 Q3 Q2 Q1
Networks 6,916 5,722 3,618 3,461 2,032 2,460 3,509 2,892
Digital Services –6,911 –1,608 –2,204 –2,443 –4,890 –3,577 –2,034 –8,246
Managed Services 288 411 303 105 –1,268 –726 –259 –1,825
Emerging Business and Other –1,524 –940 –1,202 –1,088 –1,199 –1,430 –1,308 –2,222
Total –1,231 3,585 515 35 –5,325 –3,273 –92 –9,401
Isolated quarters As percentage of net sales
2018 2017
Q4 Q3 Q2 Q1 Q4 Q3 Q2 Q1
Networks 16.6% 15.9% 11.2% 12.1% 5.5% 7.7% 11.1% 9.1%
Digital Services –53.1% –17.9% –25.0% –33.6% –41.4% –40.1% –20.5% –101.8%
Managed Services 4.2% 6.4% 4.6% 1.8% –18.4% –11.0% –3.9% –29.0%
Emerging Business and Other –66.8% –38.8% –58.5% –65.9% –57.5% –71.7% –65.1% –124.8%
Total –1.9% 6.7% 1.0% 0.1% –9.2% –6.6% –0.2% –19.7%
Year to date, SEK million
2018 2017
Jan-Dec Jan-Sep Jan-Jun Jan-Mar Jan-Dec Jan-Sep Jan-Jun Jan-Mar
Networks 19,717 12,801 7,079 3,461 10,893 8,861 6,401 2,892
Digital Services –13,166 –6,255 –4,647 –2,443 –18,747 –13,857 –10,280 –8,246
Managed Services 1,107 819 408 105 –4,078 –2,810 –2,084 –1,825
Emerging Business and Other –4,754 –3,230 –2,290 –1,088 –6,159 –4,960 –3,530 –2,222
Total 2,904 4,135 550 35 –18,091 –12,766 –9,493 –9,401
Year to date As a percentage of net sales
2018 2017
Jan-Dec Jan-Sep Jan-Jun Jan-Mar Jan-Dec Jan-Sep Jan-Jun Jan-Mar
Networks 14.2% 13.2% 11.6% 12.1% 8.2% 9.3% 10.1% 9.1%
Digital Services –34.6% –24.9% –28.9% –33.6% –48.4% –51.5% –57.1% –101.8%
Managed Services 4.3% 4.3% 3.3% 1.8% –15.4% –14.4% –16.1% –29.0%
Emerging Business and Other –56.5% –52.7% –61.8% –65.9% –78.3% –85.8% –93.2% –124.8%
Total 1.4% 2.8% 0.6% 0.1% –8.8% –8.7% –9.7% –19.7%

Ericsson | Fourth Quarter and Full-Year Report 2018 Additional information39
Net sales by market area by quarter2018 2017
Isolated quarters, SEK million Q4 Q3 Q2 Q1 Q4 Q3 Q2 Q1
South East Asia, Oceania and India 8,244 7,985 6,981 6,379 7,844 7,858 7,234 8,410
North East Asia 8,387 5,773 4,764 3,385 6,465 5,653 5,901 5,564
North America 17,999 14,933 14,337 11,317 14,685 12,319 12,970 12,027
Europe and Latin America 1) 2) 18,221 14,816 14,174 13,061 16,939 13,430 14,231 12,201
Middle East and Africa 6,516 5,722 5,626 5,765 7,581 6,297 5,731 5,356
Other 1) 2) 4,442 4,581 3,926 3,504 4,367 3,856 4,214 4,245
Total 63,809 53,810 49,808 43,411 57,881 49,413 50,281 47,8031) Of which in Sweden 375 429 596 915 872 660 785 1,0172) Of which in EU 10,319 8,481 8,619 8,522 10,822 8,635 8,687 8,328
2018 2017
Sequential change, percent Q4 Q3 Q2 Q1 Q4 Q3 Q2 Q1
South East Asia, Oceania and India 3% 14% 9% –19% 0% 9% –14% –
North East Asia 45% 21% 41% –48% 14% –4% 6% –
North America 21% 4% 27% –23% 19% –5% 8% –
Europe and Latin America 1) 2) 23% 5% 9% –23% 26% –6% 17% –
Middle East and Africa 14% 2% –2% –24% 20% 10% 7% –
Other 1) 2) –3% 17% 12% –20% 13% –8% –1% –
Total 19% 8% 15% –25% 17% –2% 5% –1) Of which in Sweden –13% –28% –35% 5% 32% –16% –23% –2) Of which in EU 22% –2% 1% –21% 25% –1% 4% –
2018 2017
Year-over-year change, percent Q4 Q3 Q2 Q1 Q4 Q3 Q2 Q1
South East Asia, Oceania and India 5% 2% –3% –24% – – – –
North East Asia 30% 2% –19% –39% – – – –
North America 23% 21% 11% –6% – – – –
Europe and Latin America 1) 2) 8% 10% 0% 7% – – – –
Middle East and Africa –14% –9% –2% 8% – – – –
Other 1) 2) 2% 19% –7% –17% – – – –
Total 10% 9% –1% –9% – – – –1) Of which in Sweden –57% –35% –24% –10% – – – –2) Of which in EU –5% –2% –1% 2% – – – –
2018 2017
Year to date, SEK million Jan-Dec Jan-Sep Jan-Jun Jan-Mar Jan-Dec Jan-Sep Jan-Jun Jan-Mar
South East Asia, Oceania and India 29,589 21,345 13,360 6,379 31,346 23,502 15,644 8,410
North East Asia 22,309 13,922 8,149 3,385 23,583 17,118 11,465 5,564
North America 58,586 40,587 25,654 11,317 52,001 37,316 24,997 12,027
Europe and Latin America 1) 2) 60,272 42,051 27,235 13,061 56,801 39,862 26,432 12,201
Middle East and Africa 23,629 17,113 11,391 5,765 24,965 17,384 11,087 5,356
Other 1) 2) 16,453 12,011 7,430 3,504 16,682 12,315 8,459 4,245
Total 210,838 147,029 93,219 43,411 205,378 147,497 98,084 47,8031) Of which in Sweden 2,315 1,940 1,511 915 3,334 2,462 1,802 1,0172) Of which in EU 35,941 25,622 17,141 8,522 36,472 25,650 17,015 8,328
Year to date, year-over-year change, percent
2018 2017
Jan-Dec Jan-Sep Jan-Jun Jan-Mar Jan-Dec Jan-Sep Jan-Jun Jan-Mar
South East Asia, Oceania and India –6% –9% –15% –24% 0% – – –
North East Asia –5% –19% –29% –39% –13% – – –
North America 13% 9% 3% –6% 1% – – –
Europe and Latin America 1) 2) 6% 5% 3% 7% –9% – – –
Middle East and Africa –5% –2% 3% 8% –9% – – –
Other 1) 2) –1% –2% –12% –17% –18% – – –
Total 3% 0% –5% –9% –7% – – –1) Of which in Sweden –31% –21% –16% –10% –1% – – –2) Of which in EU –1% 0% 1% 2% –6% – – –

Ericsson | Fourth Quarter and Full-Year Report 2018 Additional information40
Top 5 countries in sales
Country Percentage of Net sales
Q4 Jan-Dec
2018 2017 2018 2017
United States 30% 26% 29% 27%
China 9% 7% 7% 7%
India 3% 4% 4% 5%
Australia 3% 3% 4% 3%
Japan 4% 4% 3% 4%
Net sales by market area by segmentQ4 2018 Jan-Dec 2018
SEK million NetworksDigital
ServicesManaged
Services
Emerging Business
and Other Total NetworksDigital
ServicesManaged
Services
Emerging Business
and Other Total
South East Asia, Oceania and India 6,097 1,250 870 27 8,244 21,337 4,824 3,388 40 29,589
North East Asia 5,495 2,491 383 18 8,387 15,915 4,849 1,465 80 22,309
North America 13,985 2,770 1,220 24 17,999 46,452 8,358 3,680 96 58,586
Europe and Latin America 10,486 4,280 3,362 93 18,221 34,413 12,339 13,207 313 60,272
Middle East and Africa 3,638 1,829 1,046 3 6,516 13,300 6,284 4,030 15 23,629
Other 1,940 387 – 2,115 4,442 7,153 1,435 – 7,865 16,453
Total 41,641 13,007 6,881 2,280 63,809 138,570 38,089 25,770 8,409 210,838
Share of total 65% 20% 11% 4% 100% 66% 18% 12% 4% 100%
Sequential change, percent
Q4 2018
NetworksDigital
ServicesManaged
Services
Emerging Business
and Other Total
South East Asia, Oceania and India 5% –2% –1% 800% 3%
North East Asia 20% 199% 17% –40% 45%
North America 19% 32% 17% 4% 21%
Europe and Latin America 20% 50% 6% 27% 23%
Middle East and Africa 16% 19% 0% – 14%
Other 2% 1% – –8% –3%
Total 16% 45% 6% –6% 19%
Q4 2018 Jan-Dec 2018
Year over year change, percent Networks
Digital Services
Managed Services
Emerging Business
and Other Total NetworksDigital
ServicesManaged
Services
Emerging Business
and Other Total
South East Asia, Oceania and India 3% –3% 35% 440% 5% –9% 1% 5% 400% –6%
North East Asia 28% 57% –33% 500% 30% –2% –11% –22% 471% –5%
North America 18% 33% 85% –35% 23% 14% 4% 15% –16% 13%
Europe and Latin America 18% 8% –15% 2% 8% 14% 2% –7% 12% 6%
Middle East and Africa –13% –22% 0% –86% –14% –6% –8% 0% –67% –5%
Other 2% –28% – 10% 2% –7% –8% – 6% –1%
Total 12% 10% 0% 9% 10% 5% –2% –3% 7% 3%

Ericsson | Fourth Quarter and Full-Year Report 2018 Additional information41
IPR licensing revenues by segment by quarter
Isolated quarters, SEK million
2018 2017
Q4 Q3 Q2 Q1 Q4 Q3 Q2 Q1
Networks 1,759 1,755 1,486 1,522 1,731 1,640 1,670 1,724
Digital Services 387 385 326 334 380 360 366 379
Total 2,146 2,140 1,812 1,856 2,111 2,000 2,036 2,103
Year to date, SEK million
2018 2017
Jan-Dec Jan-Sep Jan-Jun Jan-Mar Jan-Dec Jan-Sep Jan-Jun Jan-Mar
Networks 6,522 4,763 3,008 1,522 6,765 5,034 3,394 1,724
Digital Services 1,432 1,045 660 334 1,485 1,105 745 379
Total 7,954 5,808 3,668 1,856 8,250 6,139 4,139 2,103
Provisions2018 2017
Isolated quarters, SEK million Q4 Q3 Q2 Q1 Q4 Q3 Q2 Q1
Opening balance 8,695 9,534 9,030 9,879 9,514 10,357 10,514 6,320
Additions 8,930 1,491 1,974 1,315 2,769 1,942 1,403 6,365
Utilization/Cash out –1,436 –1,774 –1,486 –2,216 –2,186 –2,626 –1,324 –2,085
Of which restructuring –656 –1,236 –832 –1,424 –1,204 –1,461 –1,075 –1,586
Reversal of excess amounts –290 –127 –191 –117 –199 –32 –65 –66
Reclassification, translation difference and other 109 –429 207 169 –19 –127 –171 –20
Closing balance 16,008 8,695 9,534 9,030 9,879 9,514 10,357 10,514
Of which restructuring 6,438 2,960 4,029 3,524 4,043 3,458 4,003 4,059
2018 2017
Year to date, SEK million Jan-Dec Jan-Sep Jan-Jun Jan-Mar Jan-Dec Jan-Sep Jan-Jun Jan-Mar
Opening balance 9,879 9,879 9,879 9,879 6,320 6,320 6,320 6,320
Additions 13,710 4,780 3,289 1,315 12,479 9,710 7,768 6,365
Utilization/Cash out –6,912 –5,476 –3,702 –2,216 –8,221 –6,035 –3,409 –2,085
Of which restructuring –4,148 –3,492 –2,256 –1,424 –5,326 –4,122 –2,661 –1,586
Reversal of excess amounts –725 –435 –308 –117 –362 –163 –131 –66
Reclassification, translation difference and other 56 –53 376 169 –337 –318 –191 –20
Closing balance 16,008 8,695 9,534 9,030 9,879 9,514 10,357 10,514
Of which restructuring 6,438 2,960 4,029 3,524 4,043 3,458 4,003 4,059

Ericsson | Fourth Quarter and Full-Year Report 2018 Additional information42
Information on investments
Investments in assets subject to depreciation, amortization, impairment and write-downs
2018 2017
Isolated quarters, SEK million Q4 Q3 Q2 Q1 Q4 Q3 Q2 Q1
Additions
Property, plant and equipment 1,080 1,088 951 856 1,105 739 1,018 1,015
Capitalized development expenses 195 151 325 254 138 126 315 865
IPR, brands and other intangible assets 27 – 1 – 315 1 19 1
Total 1,302 1,239 1,277 1,100 1,558 866 1,352 1,881
Depreciation, amortization and impair-ment losses
Property, plant and equipment 965 870 1,080 928 1,284 2,894 1,061 1,075
Capitalized development expenses 884 678 635 616 881 874 690 2,481
Goodwill, IPR, brands and other intan-gible assets 620 345 350 347 13,953 378 446 1,875
Total 2,469 1,893 2,065 1,891 16,118 4,146 2,197 5,431
2018 2017
Year to date, SEK million Jan-Dec Jan-Sep Jan-Jun Jan-Mar Jan-Dec Jan-Sep Jan-Jun Jan-Mar
Additions
Property, plant and equipment 3,975 2,895 1,807 856 3,877 2,772 2,033 1,015
Capitalized development expenses 925 730 579 254 1,444 1,306 1,180 865
IPR, brands and other intangible assets 28 1 1 – 336 21 20 1
Total 4,928 3,626 2,387 1,110 5,657 4,099 3,233 1,881
Depreciation, amortization and impair-ment losses
Property, plant and equipment 3,843 2,878 2,008 928 6,314 5,030 2,136 1,075
Capitalized development expenses 2,813 1,929 1,251 616 4,926 4,045 3,171 2,481
Goodwill, IPR, brands and other intan-gible assets 1,662 1,042 697 347 16,652 2,699 2,321 1,875
Total 8,318 5,849 3,956 1,891 27,892 11,774 7,628 5,431

Ericsson | Fourth Quarter and Full-Year Report 2018 Additional information43
Other informationOct-Dec Jan-Dec
SEK million 2018 2017 2018 2017
Number of shares and earnings per share
Number of shares, end of period (million) 3,334 3,334 3,334 3,334
Of which class A-shares (million) 262 262 262 262
Of which class B-shares (million) 3,072 3,072 3,072 3,072
Number of treasury shares, end of period (million) 37 50 37 50
Number of shares outstanding, basic, end of period (million) 3,297 3,284 3,297 3,284
Numbers of shares outstanding, diluted, end of period (million) 3,323 3,324 3,323 3,324
Average number of treasury shares (million) 38 52 43 56
Average number of shares outstanding, basic (million) 3,296 3,283 3,291 3,277
Average number of shares outstanding, diluted (million) 1) 3,322 3,322 3,318 3,317
Earnings (loss) per share, basic (SEK) –1.99 –5.63 –1.98 –9.94
Earnings (loss) per share, diluted (SEK) 1) –1.99 –5.63 –1.98 –9.94
Earnings (loss) per share (Non-IFRS), diluted (SEK) 2) –0.77 –1.09 0.27 –3.24
Ratios
Days sales outstanding – – 91 96
Inventory turnover days 58 59 70 66
Payable days 57 50 72 60
Alternative Performance Measures (APMs)
Equity ratio (%) – – 32.7% 37.5%
Return on equity (%) –28.8% –70.7% –7.1% –28.1%
Return on capital employed (%) –5.6% –47.6% 0.6% –20.6%
Capital turnover (times) 1.7 1.4 1.4 1.2
Free cash flow 2,993 10,134 2,968 5,109
Cash conversion (%) –4,374.5% –278.9% 601.2% –73.2%
Exchange rates used in the consolidation
SEK/EUR– closing rate – – 10.25 9.83
SEK/USD– closing rate – – 8.94 8.20
Other
Market area inventory, end of period 16,505 14,480 16,505 14,480
Export sales from Sweden 38,974 24,166 109,969 87,463
1) Potential ordinary shares are not considered when their conversion to ordinary shares would increase earnings per share. 2) Excluding amortizations and write-downs of acquired intangibles and restructuring charges.
Number of employees2018 2017
End of period Dec 31 Sep 30 Jun 30 Mar 31 Dec 31 Sep 30 Jun 30 Mar 31
South East Asia, Oceania and India 23,959 23,607 23,516 23,623 24,495 26,396 26,748 27,221
North East Asia 12,788 12,495 12,303 12,321 12,456 12,945 12,972 12,962
North America 9,727 9,459 9,510 9,798 10,009 10,665 11,073 11,253
Europe and Latin America 1) 44,621 44,695 45,743 47,528 49,231 50,832 53,173 54,194
Middle East and Africa 4,264 4,243 4,188 4,311 4,544 5,014 5,161 5,268
Total 95,359 94,499 95,260 97,581 100,735 105,852 109,127 110,8981) Of which in Sweden 12,502 12,679 13,431 13,763 13,864 14,195 14,483 14,712
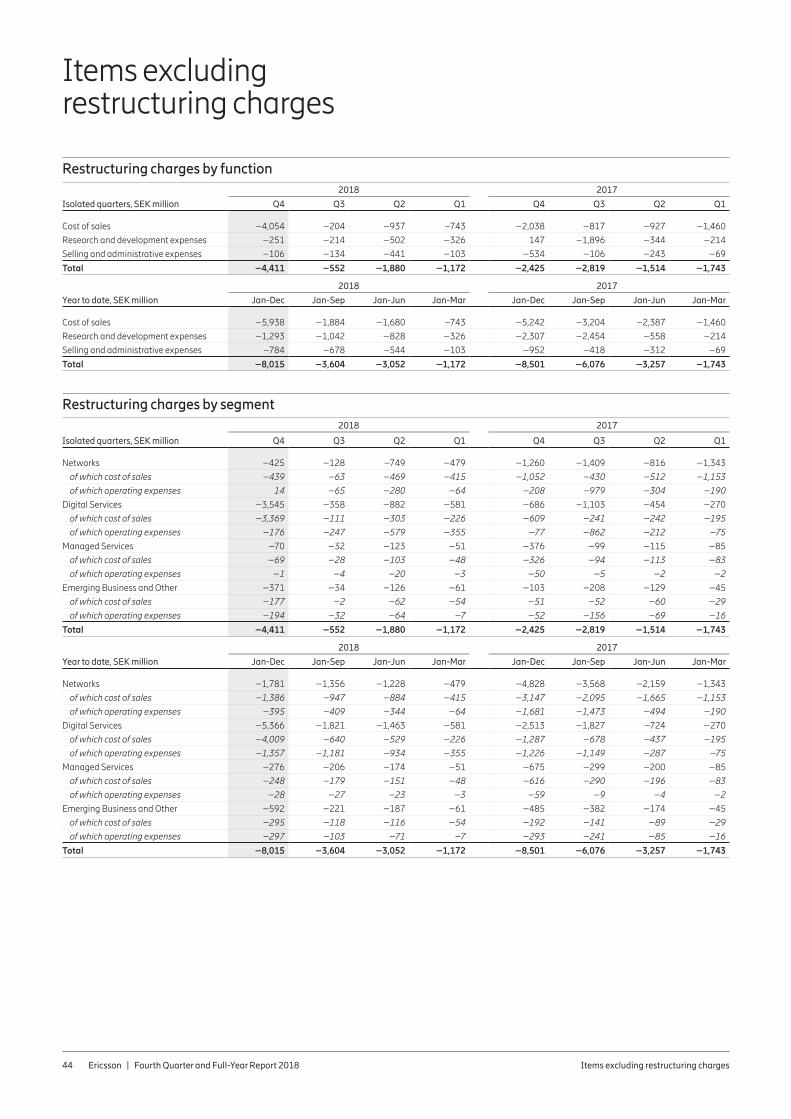
Ericsson | Fourth Quarter and Full-Year Report 2018 Items excluding restructuring charges 44
Items excluding restructuring charges
Restructuring charges by function
Isolated quarters, SEK million
2018 2017
Q4 Q3 Q2 Q1 Q4 Q3 Q2 Q1
Cost of sales –4,054 –204 –937 –743 –2,038 –817 –927 –1,460
Research and development expenses –251 –214 –502 –326 147 –1,896 –344 –214
Selling and administrative expenses –106 –134 –441 –103 –534 –106 –243 –69
Total –4,411 –552 –1,880 –1,172 –2,425 –2,819 –1,514 –1,743
Year to date, SEK million
2018 2017
Jan-Dec Jan-Sep Jan-Jun Jan-Mar Jan-Dec Jan-Sep Jan-Jun Jan-Mar
Cost of sales –5,938 –1,884 –1,680 –743 –5,242 –3,204 –2,387 –1,460
Research and development expenses –1,293 –1,042 –828 –326 –2,307 –2,454 –558 –214
Selling and administrative expenses –784 –678 –544 –103 –952 –418 –312 –69
Total –8,015 –3,604 –3,052 –1,172 –8,501 –6,076 –3,257 –1,743
Restructuring charges by segment2018 2017
Isolated quarters, SEK million Q4 Q3 Q2 Q1 Q4 Q3 Q2 Q1
Networks –425 –128 –749 –479 –1,260 –1,409 –816 –1,343
of which cost of sales –439 –63 –469 –415 –1,052 –430 –512 –1,153
of which operating expenses 14 –65 –280 –64 –208 –979 –304 –190
Digital Services –3,545 –358 –882 –581 –686 –1,103 –454 –270
of which cost of sales –3,369 –111 –303 –226 –609 –241 –242 –195
of which operating expenses –176 –247 –579 –355 –77 –862 –212 –75
Managed Services –70 –32 –123 –51 –376 –99 –115 –85
of which cost of sales –69 –28 –103 –48 –326 –94 –113 –83
of which operating expenses –1 –4 –20 –3 –50 –5 –2 –2
Emerging Business and Other –371 –34 –126 –61 –103 –208 –129 –45
of which cost of sales –177 –2 –62 –54 –51 –52 –60 –29
of which operating expenses –194 –32 –64 –7 –52 –156 –69 –16
Total –4,411 –552 –1,880 –1,172 –2,425 –2,819 –1,514 –1,743
2018 2017
Year to date, SEK million Jan-Dec Jan-Sep Jan-Jun Jan-Mar Jan-Dec Jan-Sep Jan-Jun Jan-Mar
Networks –1,781 –1,356 –1,228 –479 –4,828 –3,568 –2,159 –1,343
of which cost of sales –1,386 –947 –884 –415 –3,147 –2,095 –1,665 –1,153
of which operating expenses –395 –409 –344 –64 –1,681 –1,473 –494 –190
Digital Services –5,366 –1,821 –1,463 –581 –2,513 –1,827 –724 –270
of which cost of sales –4,009 –640 –529 –226 –1,287 –678 –437 –195
of which operating expenses –1,357 –1,181 –934 –355 –1,226 –1,149 –287 –75
Managed Services –276 –206 –174 –51 –675 –299 –200 –85
of which cost of sales –248 –179 –151 –48 –616 –290 –196 –83
of which operating expenses –28 –27 –23 –3 –59 –9 –4 –2
Emerging Business and Other –592 –221 –187 –61 –485 –382 –174 –45
of which cost of sales –295 –118 –116 –54 –192 –141 –89 –29
of which operating expenses –297 –103 –71 –7 –293 –241 –85 –16
Total –8,015 –3,604 –3,052 –1,172 –8,501 –6,076 –3,257 –1,743
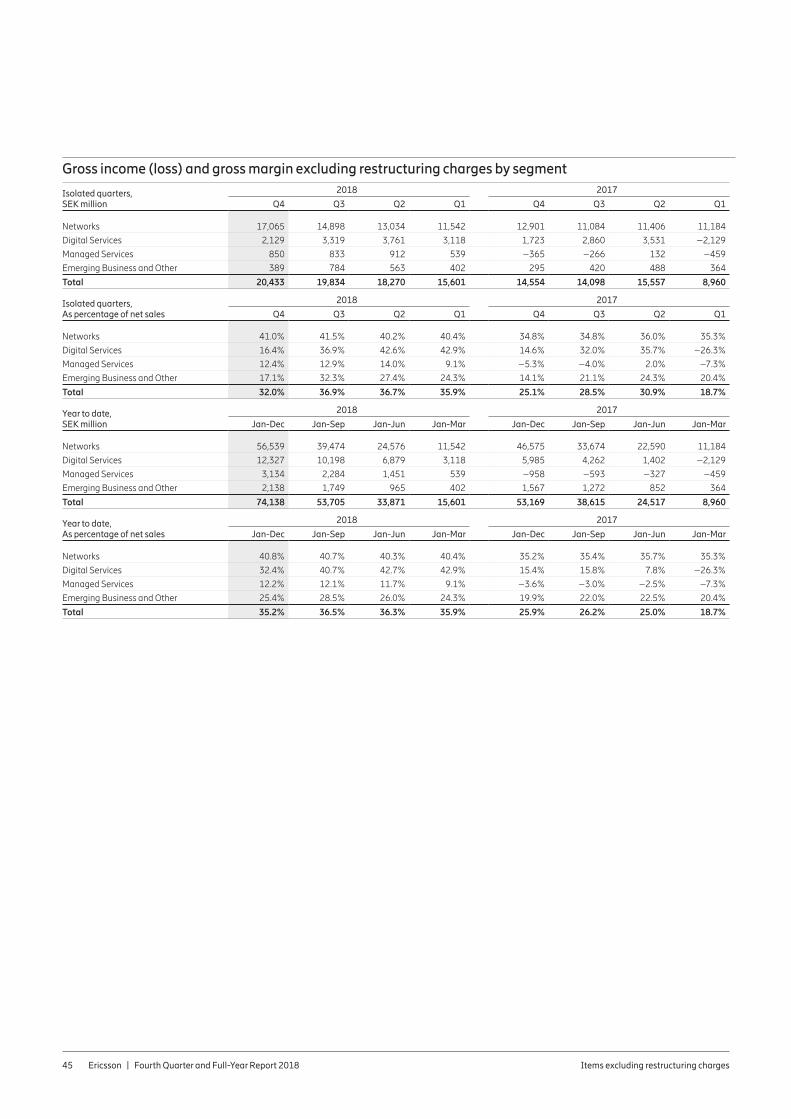
Ericsson | Fourth Quarter and Full-Year Report 2018 Items excluding restructuring charges 45
Gross income (loss) and gross margin excluding restructuring charges by segment
Isolated quarters, SEK million
2018 2017
Q4 Q3 Q2 Q1 Q4 Q3 Q2 Q1
Networks 17,065 14,898 13,034 11,542 12,901 11,084 11,406 11,184
Digital Services 2,129 3,319 3,761 3,118 1,723 2,860 3,531 –2,129
Managed Services 850 833 912 539 –365 –266 132 –459
Emerging Business and Other 389 784 563 402 295 420 488 364
Total 20,433 19,834 18,270 15,601 14,554 14,098 15,557 8,960
Isolated quarters, As percentage of net sales
2018 2017
Q4 Q3 Q2 Q1 Q4 Q3 Q2 Q1
Networks 41.0% 41.5% 40.2% 40.4% 34.8% 34.8% 36.0% 35.3%
Digital Services 16.4% 36.9% 42.6% 42.9% 14.6% 32.0% 35.7% –26.3%
Managed Services 12.4% 12.9% 14.0% 9.1% –5.3% –4.0% 2.0% –7.3%
Emerging Business and Other 17.1% 32.3% 27.4% 24.3% 14.1% 21.1% 24.3% 20.4%
Total 32.0% 36.9% 36.7% 35.9% 25.1% 28.5% 30.9% 18.7%
Year to date, SEK million
2018 2017
Jan-Dec Jan-Sep Jan-Jun Jan-Mar Jan-Dec Jan-Sep Jan-Jun Jan-Mar
Networks 56,539 39,474 24,576 11,542 46,575 33,674 22,590 11,184
Digital Services 12,327 10,198 6,879 3,118 5,985 4,262 1,402 –2,129
Managed Services 3,134 2,284 1,451 539 –958 –593 –327 –459
Emerging Business and Other 2,138 1,749 965 402 1,567 1,272 852 364
Total 74,138 53,705 33,871 15,601 53,169 38,615 24,517 8,960
Year to date, As percentage of net sales
2018 2017
Jan-Dec Jan-Sep Jan-Jun Jan-Mar Jan-Dec Jan-Sep Jan-Jun Jan-Mar
Networks 40.8% 40.7% 40.3% 40.4% 35.2% 35.4% 35.7% 35.3%
Digital Services 32.4% 40.7% 42.7% 42.9% 15.4% 15.8% 7.8% –26.3%
Managed Services 12.2% 12.1% 11.7% 9.1% –3.6% –3.0% –2.5% –7.3%
Emerging Business and Other 25.4% 28.5% 26.0% 24.3% 19.9% 22.0% 22.5% 20.4%
Total 35.2% 36.5% 36.3% 35.9% 25.9% 26.2% 25.0% 18.7%

Ericsson | Fourth Quarter and Full-Year Report 2018 Items excluding restructuring charges 46
Operating income (loss) and operating margin excluding restructuring charges by segment
Isolated quarters, SEK million
2018 2017
Q4 Q3 Q2 Q1 Q4 Q3 Q2 Q1
Networks 7,275 5,784 4,293 3,850 3,205 3,784 4,240 4,054
Digital Services –3,542 –1,426 –1,492 –2,026 –11,585 –2,668 –1,783 –8,734
Managed Services 355 441 422 151 –898 –628 –143 –1,744
Emerging Business and Other –1,529 –1,006 –1,178 –1,115 –7,575 –1,321 –1,337 –3,109
Total 2,559 3,793 2,045 860 –16,853 –833 977 –9,533
Isolated quarters, As percentage of net sales
2018 2017
Q4 Q3 Q2 Q1 Q4 Q3 Q2 Q1
Networks 17.5% 16.1% 13.3% 13.5% 8.6% 11.9% 13.4% 12.8%
Digital Services –27.2% –15.9% –16.9% –27.9% –98.0% –29.9% –18.0% –107.8%
Managed Services 5.2% 6.8% 6.5% 2.6% –13.0% –9.5% –2.1% –27.8%
Emerging Business and Other –67.1% –41.5% –57.4% –67.5% –363.1% –66.2% –66.6% –174.6%
Total 4.0% 7.0% 4.1% 2.0% –29.1% –1.7% 1.9% –19.9%
Year to date, SEK million
2018 2017
Jan-Dec Jan-Sep Jan-Jun Jan-Mar Jan-Dec Jan-Sep Jan-Jun Jan-Mar
Networks 21,202 13,927 8,143 3,850 15,283 12,078 8,294 4,054
Digital Services –8,486 –4,944 –3,518 –2,026 –24,770 –13,185 –10,517 –8,734
Managed Services 1,369 1,014 573 151 –3,413 –2,515 –1,887 –1,744
Emerging Business and Other –4,828 –3,299 –2,293 –1,115 –13,342 –5,767 –4,446 –3,109
Total 9,257 6,698 2,905 860 –26,242 –9,389 –8,556 –9,533
Year to date, As percentage of net sales
2018 2017
Jan-Dec Jan-Sep Jan-Jun Jan-Mar Jan-Dec Jan-Sep Jan-Jun Jan-Mar
Networks 15.3% 14.4% 13.4% 13.5% 11.6% 12.7% 13.1% 12.8%
Digital Services –22.3% –19.7% –21.9% –27.9% –63.9% –49.0% –58.4% –107.8%
Managed Services 5.3% 5.4% 4.6% 2.6% –12.9% –12.8% –14.6% –27.8%
Emerging Business and Other –57.4% –53.8% –61.9% –67.5% –169.6% –99.7% –117.3% –174.6%
Total 4.4% 4.6% 3.1% 2.0% –12.8% –6.4% –8.7% –19.9%

Ericsson | Fourth Quarter and Full-Year Report 2018 Alternative performance measures 47
This section includes a reconciliation of certain Alternative Perfor-mance Measures (APMs) to the most directly reconcilable line items in the financial statements. The presentation of APMs has limita-tions as analytical tools and should not be considered in isolation or as a substitute for related financial measures prepared in accor-dance with IFRS.
APMs are presented to enhance an investor’s evaluation of ongoing operating results, to aid in forecasting future periods and to facilitate meaningful comparison of results between periods.
Management uses these APMs to, among other things, evaluate ongoing operations in relation to historical results, for internal plan-ning and forecasting purposes and in the calculation of certain performance-based compensation.
The APMs presented in this report may differ from similarly titled measures used by other companies.
For additional information, see Alternative Performance Mea-sures in the Ericsson Annual Report 2017.
Sales growth adjusted for comparable units and currency
Sales growth adjusted for the impact of acquisitions and divestments as well as the effects of foreign currency fluctuations.
2018 2017
Isolated quarter, sequential change Q4 Q3 Q2 Q1 Q4 Q3 Q2 Q1
Reported net sales 63,809 53,810 49,808 43,411 – – – –
Acquired/divested business – – – – – – – –
Net FX impact 41 –752 –2,460 423 – – – –
Comparable net sales, excluding FX impact 63,850 53,058 47,348 43,834 – – – –
Sales growth adjusted for comparable units and currency (%) 19% 7% 9% –24% – – – –
2018 2017
Isolated quarter, year over year change Q4 Q3 Q2 Q1 Q4 Q3 Q2 Q1
Reported net sales 63,809 53,810 49,808 43,411 – – – –
Acquired/divested business – – – – – – – –
Net FX impact –3,549 –3,748 –263 3,328 – – – –
Comparable net sales, excluding FX impact 60,260 50,062 49,545 46,739 – – – –
Sales growth adjusted for comparable units and currency (%) 4% 1% –1% –2% – – – –
2018 2017
Year to date, year over year change Jan-Dec Jan-Sep Jan-Jun Jan-Mar Jan-Dec Jan-Sep Jan-Jun Jan-Mar
Reported net sales 210,838 147,029 93,219 43,411 – – – –
Acquired/divested business – – – – – – – –
Net FX impact –4,232 –683 3,065 3,328 – – – –
Comparable net sales, excluding FX impact 206,606 146,346 96,284 46,739 – – – –
Sales growth adjusted for comparable units and currency (%) 1% –1% –2% –2% – – – –
Alternative performance measures

Ericsson | Fourth Quarter and Full-Year Report 2018 Alternative performance measures 48
Items excluding restructuring charges
Gross income, operating expenses, and operating income (loss) are presented excluding restructuring charges and, for certain measures, as a percentage of net sales.
2018 2017
Isolated quarters, SEK million Q4 Q3 Q2 Q1 Q4 Q3 Q2 Q1
Gross income 16,379 19,630 17,333 14,858 12,516 13,281 14,629 7,501
Net sales 63,809 53,810 49,808 43,411 57,881 49,413 50,281 47,803
Gross margin (%) 25.7% 36.5% 34.8% 34.2% 21.6% 26.9% 29.1% 15.7%
Gross income 16,379 19,630 17,333 14,858 12,516 13,281 14,629 7,501
Restructuring charges included in cost of sales 4,054 204 937 743 2,038 817 927 1,460
Gross income, excluding restructuring charges 20,433 19,834 18,270 15,601 14,554 14,098 15,556 8,961
Net sales 63,809 53,810 49,808 43,411 57,881 49,413 50,281 47,803
Gross margin, excluding restructuring charges (%) 32.0% 36.9% 36.7% 35.9% 25.1% 28.5% 30.9% 18.7%
Operating expenses –17,964 –16,422 –17,205 –15,257 –18,863 –17,354 –15,417 –18,929
Restructuring charges included in R&D expenses 251 214 502 326 –147 1,896 344 214
Restructuring charges included in selling and administrative expenses 106 134 441 103 534 106 243 69
Operating expenses, excluding restructur-ing charges –17,607 –16,074 –16,262 –14,828 –18,476 –15,352 –14,830 –18,646
Operating income (loss) –1,852 3,241 165 –312 –19,278 –3,652 –537 –11,276
Net sales 63,809 53,810 49,808 43,411 57,881 49,413 50,281 47,803
Operating margin (%) –2.9% 6.0% 0.3% –0.7% –33.3% –7.4% –1.1% –23.6%
Operating income (loss) –1,852 3,241 165 –312 –19,278 –3,652 –537 –11,276
Total restructuring charges 4,411 552 1,880 1,172 2,425 2,819 1,514 1,743
Operating income (loss), excluding restructuring charges 2,559 3,793 2,045 860 –16,853 –833 977 –9,533
Net sales 63,809 53,810 49,808 43,411 57,881 49,413 50,281 47,803
Operating margin, excluding restructuring charges (%) 4.0% 7.0% 4.1% 2.0% –29.1% –1.7% 1.9% –19.9%

Ericsson | Fourth Quarter and Full-Year Report 2018 Alternative performance measures 49
Items excluding restructuring charges (continued)
2018 2017
Year to date, SEK million Jan-Dec Jan-Sep Jan-Jun Jan-Mar Jan-Dec Jan-Sep Jan-Jun Jan-Mar
Gross income 68,200 51,821 32,191 14,858 47,927 35,411 22,130 7,501
Net sales 210,838 147,029 93,219 43,411 205,378 147,497 98,084 47,803
Gross margin (%) 32.3% 35.2% 34.5% 34.2% 23.3% 24.0% 22.6% 15.7%
Gross income 68,200 51,821 32,191 14,858 47,927 35,411 22,130 7,501
Restructuring charges included in cost of sales 5,938 1,884 1,680 743 5,242 3,204 2,387 1,460
Gross income, excluding restructuring charges 74,138 53,705 33,871 15,601 53,169 38,615 24,517 8,961
Net sales 210,838 147,029 93,219 43,411 205,378 147,497 98,084 47,803
Gross margin, excluding restructuring charges (%) 35.2% 36.5% 36.3% 35.9% 25.9% 26.2% 25.0% 18.7%
Operating expenses –66,848 –48,884 –32,462 –15,257 –70,563 –51,700 –34,346 –18,929
Restructuring charges included in R&D expenses 1,293 1,042 828 326 2,307 2,454 558 214
Restructuring charges included in selling and administrative expenses 784 678 544 103 952 418 312 69
Operating expenses, excluding restructur-ing charges –64,771 –47,164 –31,090 –14,828 –67,304 –48,828 –33,476 –18,646
Operating income (loss) 1,242 3,094 –147 –312 –34,743 –15,465 –11,813 –11,276
Net sales 210,838 147,029 93,219 43,411 205,378 147,497 98,084 47,803
Operating margin (%) 0.6% 2.1% –0.2% –0.7% –16.9% –10.5% –12.0% –23.6%
Operating income (loss) 1,242 3,094 –147 –312 –34,743 –15,465 –11,813 –11,276
Total restructuring charges 8,015 3,604 3,052 1,172 8,501 6,076 3,257 1,743
Operating income (loss), excluding restructuring charges 9,257 6,698 2,905 860 –26,242 –9,389 –8,556 –9,533
Net sales 210,838 147,029 93,219 43,411 205,378 147,497 98,084 47,803
Operating margin, excluding restructuring charges (%) 4.4% 4.6% 3.1% 2.0% –12.8% –6.4% –8.7% –19.9%

Ericsson | Fourth Quarter and Full-Year Report 2018 Alternative performance measures 50
EBITA and EBITA margin
Earnings (loss) before interest, taxes, amortization and write-downs of acquired intangibles, also expressed as a percentage of net sales.
2018 2017
Isolated quarters, SEK million Q4 Q3 Q2 Q1 Q4 Q3 Q2 Q1
Net income (loss) –6,497 2,748 –1,802 –725 –18,493 –3,457 –457 –10,026
Taxes 3,930 –146 1,157 –128 –1,303 –516 –24 –1,682
Financial income and expenses 715 639 810 541 518 321 –56 432
Amortization and write-downs of acquired intangibles 621 344 350 347 13,953 379 445 1,875
EBITA –1,231 3,585 515 35 –5,325 –3,273 –92 –9,401
Net sales 63,809 53,810 49,808 43,411 57,881 49,413 50,281 47,803
EBITA margin (%) –1.9% 6.7% 1.0% 0.1% –9.2% –6.6% –0.2% –19.7%
2018 2017
Year to date, SEK million Jan-Dec Jan-Sep Jan-Jun Jan-Mar Jan-Dec Jan-Sep Jan-Jun Jan-Mar
Net income (loss) –6,276 221 –2,527 –725 –32,433 –13,940 –10,483 –10,026
Taxes 4,813 883 1,029 –128 –3,525 –2,222 –1,706 –1,682
Financial income and expenses 2,705 1,990 1,351 541 1,215 697 376 432
Amortization and write-downs of acquired intangibles 1,662 1,041 697 347 16,652 2,699 2,320 1,875
EBITA 2,904 4,135 550 35 –18,091 –12,766 –9,493 –9,401
Net sales 210,838 147,029 93,219 43,411 205,378 147,497 98,084 47,803
EBITA margin (%) 1.4% 2.8% 0.6% 0.1% –8.8% –8.7% –9.7% –19.7%
Cash conversion
Cash flow from operating activities divided by the sum of net income (loss) and adjustments to reconcile net income to cash, expressed as a percentage.
2018 2017
Isolated quarters, SEK million Q4 Q3 Q2 Q1 Q4 Q3 Q2 Q1
Net income (loss) –6,497 2,748 –1,802 –725 –18,493 –3,457 –457 –10,026
Net income reconciled to cash –98 2,916 –259 –1,005 –4,001 –779 –142 –8,187
Cash flow from operating activities 4,287 2,040 1,442 1,573 11,159 –18 1 –1,541
Cash conversion (%) –4374.5% 70.0% –556.8% –156.5% –278.9% 2.3% –0.7% 18.8%
2018 2017
Year to date, SEK million Jan-Dec Jan-Sep Jan-Jun Jan-Mar Jan-Dec Jan-Sep Jan-Jun Jan-Mar
Net income (loss) –6,276 221 –2,527 –725 –32,433 –13,940 –10,483 –10,026
Net income reconciled to cash 1,554 1,652 –1,264 –1,005 –13,109 –9,108 –8,329 –8,187
Cash flow from operating activities 9,342 5,055 3,015 1,573 9,601 –1,558 –1,540 –1,541
Cash conversion (%) 601.2% 306.0% –238.5% –156.5% –73.2% 17.1% 18.5% 18.8%
Gross cash and net cash, end of period
Gross cash: Cash and cash equivalents plus interest-bearing securities (current and non-current).Net cash: Cash and cash equivalents plus interest-bearing securities (current and non-current) less interest-bearing liabilities (which include: non-current borrowings and current borrowings).
2018 2017
SEK million Q4 Q3 Q2 Q1 Q4 Q3 Q2 Q1
Cash and cash equivalents 38,389 36,058 37,049 36,697 35,884 26,210 21,446 32,954
+ Interest-bearing securities, current 6,625 6,591 8,304 5,453 6,713 6,526 10,754 13,548
+ Interest-bearing securities, non-current 23,982 23,014 21,501 27,104 25,105 22,405 22,122 19,124
Gross cash, end of period 68,996 65,663 66,854 69,254 67,702 55,141 54,322 65,626
– Borrowings, current 2,255 2,463 2,642 2,554 2,545 3,004 3,230 9,514
– Borrowings, non-current 30,870 31,187 31,131 31,134 30,500 28,039 27,100 27,823
Net cash, end of period 35,871 32,013 33,081 35,566 34,657 24,098 23,992 28,289
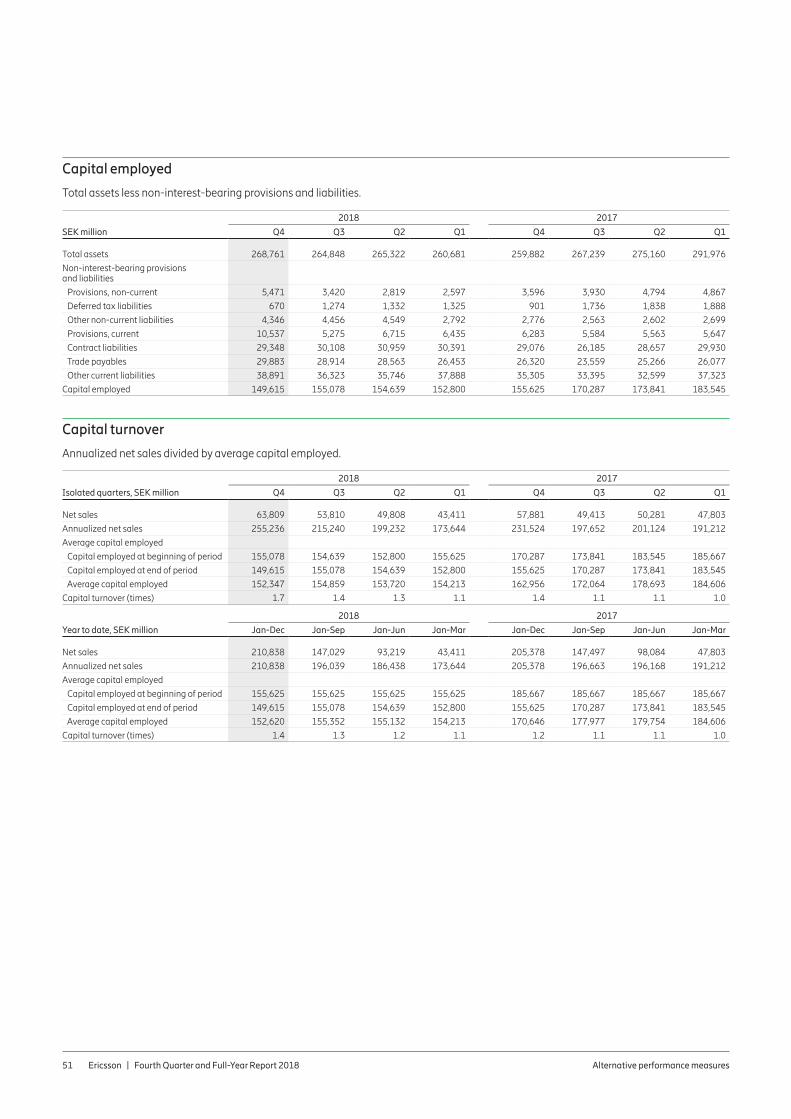
Ericsson | Fourth Quarter and Full-Year Report 2018 Alternative performance measures 51
Capital employed
Total assets less non-interest-bearing provisions and liabilities.
2018 2017
SEK million Q4 Q3 Q2 Q1 Q4 Q3 Q2 Q1
Total assets 268,761 264,848 265,322 260,681 259,882 267,239 275,160 291,976
Non-interest-bearing provisions and liabilities
Provisions, non-current 5,471 3,420 2,819 2,597 3,596 3,930 4,794 4,867
Deferred tax liabilities 670 1,274 1,332 1,325 901 1,736 1,838 1,888
Other non-current liabilities 4,346 4,456 4,549 2,792 2,776 2,563 2,602 2,699
Provisions, current 10,537 5,275 6,715 6,435 6,283 5,584 5,563 5,647
Contract liabilities 29,348 30,108 30,959 30,391 29,076 26,185 28,657 29,930
Trade payables 29,883 28,914 28,563 26,453 26,320 23,559 25,266 26,077
Other current liabilities 38,891 36,323 35,746 37,888 35,305 33,395 32,599 37,323
Capital employed 149,615 155,078 154,639 152,800 155,625 170,287 173,841 183,545
Capital turnover
Annualized net sales divided by average capital employed.
2018 2017
Isolated quarters, SEK million Q4 Q3 Q2 Q1 Q4 Q3 Q2 Q1
Net sales 63,809 53,810 49,808 43,411 57,881 49,413 50,281 47,803
Annualized net sales 255,236 215,240 199,232 173,644 231,524 197,652 201,124 191,212
Average capital employed
Capital employed at beginning of period 155,078 154,639 152,800 155,625 170,287 173,841 183,545 185,667
Capital employed at end of period 149,615 155,078 154,639 152,800 155,625 170,287 173,841 183,545
Average capital employed 152,347 154,859 153,720 154,213 162,956 172,064 178,693 184,606
Capital turnover (times) 1.7 1.4 1.3 1.1 1.4 1.1 1.1 1.0
2018 2017
Year to date, SEK million Jan-Dec Jan-Sep Jan-Jun Jan-Mar Jan-Dec Jan-Sep Jan-Jun Jan-Mar
Net sales 210,838 147,029 93,219 43,411 205,378 147,497 98,084 47,803
Annualized net sales 210,838 196,039 186,438 173,644 205,378 196,663 196,168 191,212
Average capital employed
Capital employed at beginning of period 155,625 155,625 155,625 155,625 185,667 185,667 185,667 185,667
Capital employed at end of period 149,615 155,078 154,639 152,800 155,625 170,287 173,841 183,545
Average capital employed 152,620 155,352 155,132 154,213 170,646 177,977 179,754 184,606
Capital turnover (times) 1.4 1.3 1.2 1.1 1.2 1.1 1.1 1.0

Ericsson | Fourth Quarter and Full-Year Report 2018 Alternative performance measures 52
Return on capital employed
The annualized total of operating income (loss) plus financial income as a percentage of average capital employed.
2018 2017
Isolated quarters, SEK million Q4 Q3 Q2 Q1 Q4 Q3 Q2 Q1
Operating income (loss) –1,852 3,241 165 –312 –19,278 –3,652 –537 –11,276
Financial income –294 –225 275 –72 –124 –139 –27 –82
Annualized operating income (loss) + financial income –8,584 12,064 1,760 –1,536 –77,608 –15,164 –2,256 –45,432
Average capital employed
Capital employed at beginning of period 155,078 154,639 152,800 155,625 170,287 173,841 183,545 185,667
Capital employed at end of period 149,615 155,078 154,639 152,800 155,625 170,287 173,841 183,545
Average capital employed 152,347 154,859 153,720 154,213 162,956 172,064 178,693 184,606
Return on capital employed (%) –5.6% 7.8% 1.1% –1.0% –47.6% –8.8% –1.3% –24.6%
2018 2017
Year to date, SEK million Jan-Dec Jan-Sep Jan-Jun Jan-Mar Jan-Dec Jan-Sep Jan-Jun Jan-Mar
Operating income (loss) 1,242 3,094 –147 –312 –34,743 –15,465 –11,813 –11,276
Financial income –316 –22 203 –72 –372 –248 –109 –82
Annualized operating income (loss) + financial income 926 4,096 112 –1,536 –35,115 –20,951 –23,844 –45,432
Average capital employed
Capital employed at beginning of period 155,625 155,625 155,625 155,625 185,667 185,667 185,667 185,667
Capital employed at end of period 149,615 155,078 154,639 152,800 155,625 170,287 173,841 183,545
Average capital employed 152,620 155,352 155,132 154,213 170,646 177,977 179,754 184,606
Return on capital employed (%) 0.6% 2.6% 0.1% –1.0% –20.6% –11.8% –13.3% –24.6%
Equity ratio
Equity, expressed as a percentage of total assets.
2018 2017
SEK million Q4 Q3 Q2 Q1 Q4 Q3 Q2 Q1
Total equity 87,770 95,953 93,560 93,466 97,571 112,710 119,887 122,434
Total assets 268,761 264,848 265,322 260,681 259,882 267,239 275,160 291,976
Equity ratio (%) 32.7% 36.2% 35.3% 35.9% 37.5% 42.2% 43.6% 41.9%
Return on equity
Annualized net income (loss) attributable to stockholders of the Parent Company as a percentage of average Stockholders’ equity.
2018 2017
Isolated quarters, SEK million Q4 Q3 Q2 Q1 Q4 Q3 Q2 Q1
Net income (loss) attributable to stock-holders of the parent company –6,553 2,745 –1,885 –837 –18,476 –3,561 –471 –10,068
Annualized –26,212 10,980 –7,540 –3,348 –73,904 –14,244 –1,884 –40,272
Average stockholders' equity
Stockholders' equity, beginning of period 95,087 92,689 92,703 96,935 112,095 119,177 121,698 134,582
Stockholders' equity, end of period 86,978 95,087 92,689 92,703 96,935 112,095 119,177 121,698
Average stockholders' equity 91,033 93,888 92,696 94,819 104,515 115,636 120,438 128,140
Return on equity (%) –28.8% 11.7% –8.1% –3.5% –70.7% –12.3% –1.6% –31.4%
2018 2017
Year to date, SEK million Jan-Dec Jan-Sep Jan-Jun Jan-Mar Jan-Dec Jan-Sep Jan-Jun Jan-Mar
Net income (loss) attributable to stock-holders of the parent company –6,530 23 –2,722 –837 –32,576 –14,100 –10,539 –10,068
Annualized –6,530 31 –5,444 –3,348 –32,576 –18,800 –21,078 –40,272
Average stockholders' equity
Stockholders' equity, beginning of period 96,935 96,935 96,935 96,935 134,582 134,582 134,582 134,582
Stockholders' equity, end of period 86,978 95,087 92,689 92,703 96,935 112,095 119,177 121,698
Average stockholders' equity 91,957 96,011 94,812 94,819 115,759 123,339 126,880 128,140
Return on equity (%) –7.1% 0.0% –5.7% –3.5% –28.1% –15.2% –16.6% –31.4%

Ericsson | Fourth Quarter and Full-Year Report 2018 Alternative performance measures 53
Earnings (loss) per share (non-IFRS)
Earnings (loss) per share, diluted, excluding amortizations and write-down of acquired intangible assets and excluding restructuring charges.
2018 2017
Isolated quarters, SEK Q4 Q3 Q2 Q1 Q4 Q3 Q2 Q1
Earnings (loss) per share, diluted –1.99 0.83 –0.58 –0.25 –5.63 –1.09 –0.14 –3.08
Restructuring charges 1.06 0.12 0.41 0.30 0.37 0.73 0.38 0.46
Amortization and write-downs of acquired intangibles 0.16 0.08 0.08 0.06 4.17 0.07 0.09 0.43
Earnings (loss) per share (non-IFRS) –0.77 1.03 –0.09 0.11 –1.09 –0.29 0.33 –2.19
2018 2017
Year to date, SEK Jan-Dec Jan-Sep Jan-Jun Jan-Mar Jan-Dec Jan-Sep Jan-Jun Jan-Mar
Earnings (loss) per share, diluted –1.98 0.01 –0.83 –0.25 –9.94 –4.31 –3.22 –3.08
Restructuring charges 1.88 0.82 0.71 0.30 1.93 1.57 0.84 0.46
Amortization and write-downs of acquired intangibles 0.37 0.21 0.14 0.06 4.77 0.59 0.52 0.43
Earnings (loss) per share (non-IFRS) 0.27 1.04 0.02 0.11 –3.24 –2.15 –1.86 –2.19
Free cash flow and free cash flow excluding M&A
Free cash flow: Cash flow from operating activities less net capital expenditures and other investments.Free cash flow excluding M&A: Cash flow from operating activities less net capital expenditures and other investments (excluding M&A).
2018 2017
Isolated quarters, SEK million Q4 Q3 Q2 Q1 Q4 Q3 Q2 Q1
Cash flow from operating activities 4,287 2,040 1,442 1,573 11,159 –18 1 –1,541
Net capital expenditures and other investments (excluding M&A)
Investments in property, plant and equipment –1,080 –1,088 –951 –856 –1,105 –739 –1,018 –1,015
Sales of property, plant and equipment 57 102 52 123 898 12 37 69
Product development –195 –151 –325 –254 –138 –126 –315 –865
Other investing activities –96 –190 –398 161 –573 42 –42 110
Free cash flow excluding M&A 2,973 713 –180 747 10,241 –829 –1,337 –3,242
Acquisitions/divestments of subsidiaries and other operations, net 20 –425 –431 –449 –107 371 9 3
Free cash flow 2,993 288 –611 298 10,134 –458 –1,328 –3,239
2018 2017
Year to date, SEK million Jan-Dec Jan-Sep Jan-Jun Jan-Mar Jan-Dec Jan-Sep Jan-Jun Jan-Mar
Cash flow from operating activities 9,342 5,055 3,015 1,573 9,601 –1,558 –1,540 –1,541
Net capital expenditures and other invest-ments (excluding M&A)
Investments in property, plant and equipment –3,975 –2,895 –1,807 –856 –3,877 –2,772 –2,033 –1,015
Sales of property, plant and equipment 334 277 175 123 1,016 118 106 69
Product development –925 –730 –579 –254 –1,444 –1,306 –1,180 –865
Other investing activities –523 –427 –237 161 –463 110 68 110
Free cash flow excluding M&A 4,253 1,280 567 747 4,833 –5,408 –4,579 –3,242
Acquisitions/divestments of subsidiaries and other operations, net –1,285 –1,305 –880 –449 276 383 12 3
Free cash flow 2,968 –25 –313 298 5,109 –5,025 –4,567 –3,239


![From: Plant Enquiries [mailto:plant.enquiries@ericsson.com] Sent](https://img.dokumen.tips/doc/110x75/5862d4fb1a28ab0e308ef095/from-plant-enquiries-mailtoplantenquiriesericssoncom-sent-.jpg)