Embed Size (px)
Citation preview
1
THE WENDY’S COMPANY REPORTS FOURTH QUARTER AND FULL YEAR 2020 RESULTS
Dublin, Ohio (March 3, 2021) - The Wendy’s Company (Nasdaq: WEN) today reported results for the fourth quarter and fiscal year ended January 3, 2021. “I could not be more proud of our results and the work that was done by the Wendy’s® System across the globe in 2020 with all the challenges we faced and overcame during the year. I am confident that we have emerged as a stronger, more unified brand that is poised to deliver outsized growth” President and Chief Executive Officer Todd Penegor said. “We accomplished a lot in 2020, including securing our position as the #2 QSR hamburger restaurant chain* in the U.S., achieving our two highest quarterly Global same restaurant sales results in over 15 years, launching our highly successful breakfast daypart, more than doubling our digital sales, enhancing our restaurant economic model, and continuing to enhance access to our brand with net new restaurant development. As we turn the page to 2021, we remain confident in our playbook of investing smartly to drive accelerated growth behind our three major long-term growth pillars: significantly building our breakfast daypart, accelerating our digital business, and expanding our footprint, both Internationally and in the U.S.” Fourth Quarter and Full Year 2020 Summary See “Disclosure Regarding Non-GAAP Financial Measures” and the reconciliation tables that accompany this release for a discussion and reconciliation of certain non-GAAP financial measures included in this release.
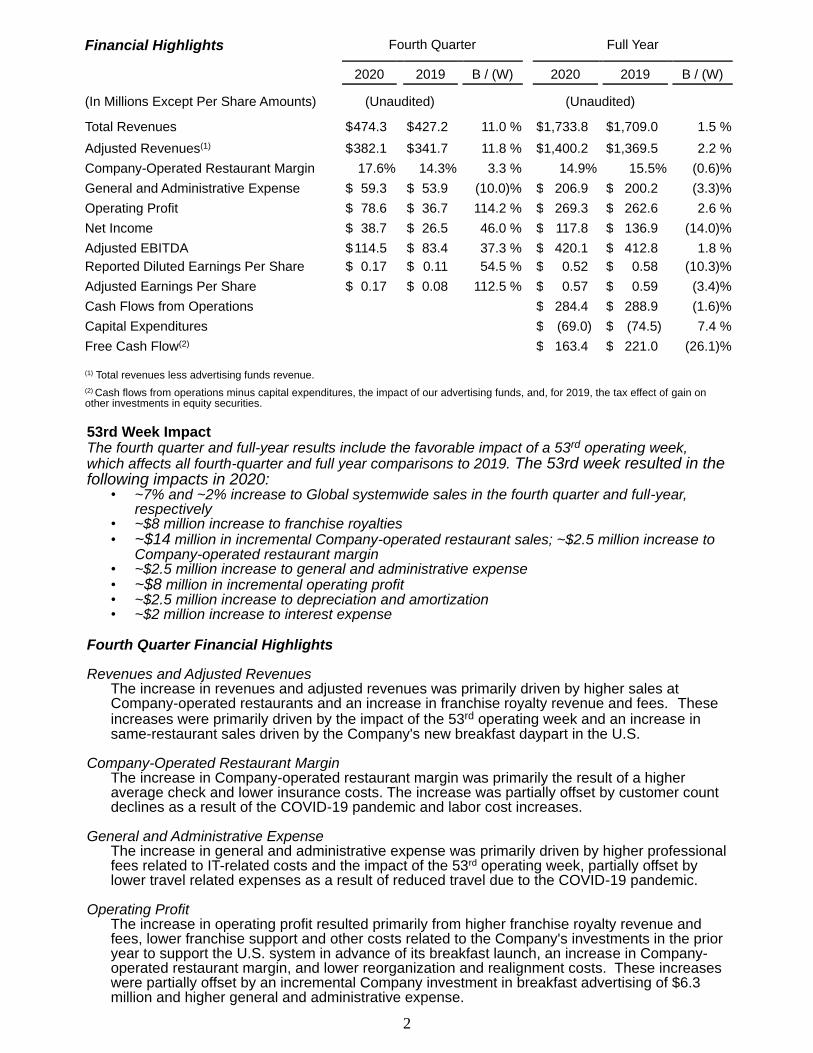
Operational Highlights Fourth Quarter Full Year 2020 2019 2020 2019
Systemwide Sales Growth(1)
U.S. 14.2% 5.9% 4.8% 4.2%
International(2) 5.5% 6.3% (5.5)% 6.7%
Global 13.2% 5.9% 3.7% 4.4%
Same-Restaurant Sales Growth(1) U.S. 5.5% 4.5% 2.0% 2.9%
International(2) (2.3)% 2.7% (6.0)% 3.2%
Global 4.7% 4.3% 1.2% 2.9%
Systemwide Sales (In US$ Millions)(3) U.S. $2,795 $2,447 $10,231 $9,763
International(2) $323 $304 $1,107 $1,182
Global $3,118 $2,751 $11,339 $10,944 Restaurant Openings U.S. - Total / Net 25 / 7 39 / 27 98 / 29 107 / 42
International - Total / Net 26 / 7 32 / 18 49 / 11 75 / 35
Global - Total / Net 51 / 14 71 / 45 147 / 40 182 / 77
Global Reimaging Completion Percentage 64% 58%
(1) Systemwide sales growth and same-restaurant sales growth are calculated on a constant currency basis and include sales by both Company-operated and franchise restaurants. 2020 includes the impact of a 53rd operating week with respect to systemwide sales growth, but excludes the impact of a 53rd operating week with respect to same-restaurant sales.
(2) Excludes Venezuela and Argentina.
(3) Systemwide sales include sales at both Company-operated and franchise restaurants. 2020 includes the impact of a 53rd operating week.
* In the 12 months ended December 2020, Wendy’s is #2 in traffic share among U.S. QSR burger chains, according to The NPD Group CREST® data
2
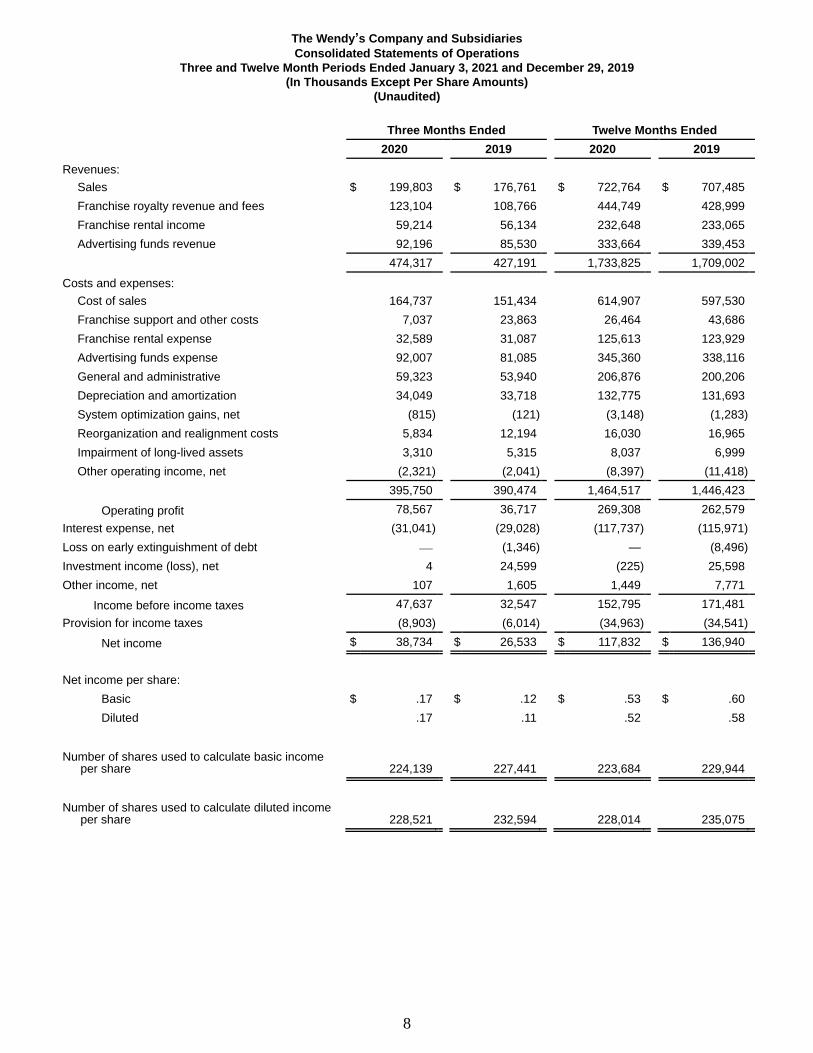
Financial Highlights Fourth Quarter Full Year 2020 2019 B / (W) 2020 2019 B / (W)
(In Millions Except Per Share Amounts) (Unaudited) (Unaudited) Total Revenues $ 474.3 $ 427.2 11.0 % $ 1,733.8 $ 1,709.0 1.5 %
Adjusted Revenues(1) $ 382.1 $ 341.7 11.8 % $ 1,400.2 $ 1,369.5 2.2 %
Company-Operated Restaurant Margin 17.6% 14.3% 3.3 % 14.9% 15.5% (0.6)%
General and Administrative Expense $ 59.3 $ 53.9 (10.0) % $ 206.9 $ 200.2 (3.3) %
Operating Profit $ 78.6 $ 36.7 114.2 % $ 269.3 $ 262.6 2.6 %
Net Income $ 38.7 $ 26.5 46.0 % $ 117.8 $ 136.9 (14.0) %
Adjusted EBITDA $ 114.5 $ 83.4 37.3 % $ 420.1 $ 412.8 1.8 %
Reported Diluted Earnings Per Share $ 0.17 $ 0.11 54.5 % $ 0.52 $ 0.58 (10.3) %
Adjusted Earnings Per Share $ 0.17 $ 0.08 112.5 % $ 0.57 $ 0.59 (3.4) %
Cash Flows from Operations $ 284.4 $ 288.9 (1.6) %
Capital Expenditures $ (69.0) $ (74.5) 7.4 %
Free Cash Flow(2) $ 163.4 $ 221.0 (26.1) %
(1) Total revenues less advertising funds revenue.
(2) Cash flows from operations minus capital expenditures, the impact of our advertising funds, and, for 2019, the tax effect of gain on
other investments in equity securities.
53rd Week Impact The fourth quarter and full-year results include the favorable impact of a 53rd operating week, which affects all fourth-quarter and full year comparisons to 2019. The 53rd week resulted in the following impacts in 2020:
• ~7% and ~2% increase to Global systemwide sales in the fourth quarter and full-year, respectively
• ~$8 million increase to franchise royalties • ~$14 million in incremental Company-operated restaurant sales; ~$2.5 million increase to
Company-operated restaurant margin • ~$2.5 million increase to general and administrative expense • ~$8 million in incremental operating profit • ~$2.5 million increase to depreciation and amortization • ~$2 million increase to interest expense
Fourth Quarter Financial Highlights Revenues and Adjusted Revenues
The increase in revenues and adjusted revenues was primarily driven by higher sales at Company-operated restaurants and an increase in franchise royalty revenue and fees. These increases were primarily driven by the impact of the 53rd operating week and an increase in same-restaurant sales driven by the Company's new breakfast daypart in the U.S.
Company-Operated Restaurant Margin
The increase in Company-operated restaurant margin was primarily the result of a higher average check and lower insurance costs. The increase was partially offset by customer count declines as a result of the COVID-19 pandemic and labor cost increases.
General and Administrative Expense
The increase in general and administrative expense was primarily driven by higher professional fees related to IT-related costs and the impact of the 53rd operating week, partially offset by lower travel related expenses as a result of reduced travel due to the COVID-19 pandemic.
Operating Profit The increase in operating profit resulted primarily from higher franchise royalty revenue and fees, lower franchise support and other costs related to the Company's investments in the prior year to support the U.S. system in advance of its breakfast launch, an increase in Company-operated restaurant margin, and lower reorganization and realignment costs. These increases were partially offset by an incremental Company investment in breakfast advertising of $6.3 million and higher general and administrative expense.

3
Net Income
The increase in net income resulted primarily from higher operating profit, partially offset by lower investment income as the result of a cash settlement related to a previously held investment that the Company received in the prior year.
Adjusted EBITDA
The increase in adjusted EBITDA resulted primarily from higher franchise royalty revenue and fees, lower franchise support and other costs, and an increase in Company-operated restaurant margin. This was partially offset by the incremental Company investment in breakfast advertising, and higher general and administrative expense.
Adjusted Earnings Per Share
The increase in adjusted earnings per share was primarily driven by an increase in adjusted EBITDA.
Full Year Financial Highlights Revenues and Adjusted Revenues
The increase in revenues and adjusted revenues was primarily driven by higher sales at Company-operated restaurants and an increase in franchisee royalty revenue and fees. These increases were primarily driven by the impact of the 53rd operating week and an increase in same-restaurant sales driven by the Company's new breakfast daypart in the U.S.
Company-Operated Restaurant Margin
The decrease in Company-operated restaurant margin was primarily the result of customer count declines as a result of the COVID-19 pandemic, labor cost increases, and higher commodity costs. This was partially offset by a higher average check and lower insurance costs.
General and Administrative Expense
The increase in general and administrative expense reflects a $2.8 million reduction in a prior year legal reserve related to the financial institutions case. Excluding this reserve adjustment, general and administrative expense would have increased by approximately $3.9 million, or 2 percent. The increase was primarily driven by higher professional fees related to IT-related costs, partially offset by lower travel related expenses as a result of reduced travel due to the COVID-19 pandemic and a lower incentive compensation accrual.
Operating Profit The increase in operating profit resulted primarily from higher franchise royalty revenue and fees and lower franchise support and other costs related to the Company's investments in the prior year to support the U.S. system in advance of its breakfast launch. These increases were partially offset by an incremental Company investment in breakfast advertising of approximately $14.6 million, higher general and administrative expense, and lower other operating income.
Net Income The decrease in net income resulted primarily from a cash settlement related to a previously held investment that the Company received in the prior year and lower other income which was primarily due to less interest income earned on cash equivalents. The decrease was partially offset by the benefit of rolling over a loss on early extinguishment of debt that the Company incurred as part of its debt refinancing in 2019 and a higher operating profit.
Adjusted EBITDA The increase in adjusted EBITDA resulted primarily from higher franchise royalty revenue and fees and lower franchise support and other costs, partially offset by the incremental Company investment in breakfast advertising, higher general and administrative expense, and lower other operating income.
Adjusted Earnings Per Share
The decrease in adjusted earnings per share was primarily driven by an increase in income taxes due to a higher tax rate that was primarily the result of a tax reserve release the Company recognized in 2019, as well as lower other income, which was primarily due to less interest income earned on cash equivalents. The decrease was partially offset by fewer shares outstanding as a result of the Company's share repurchase programs and an increase in adjusted EBITDA.

4
Free Cash Flow The decrease in free cash flow resulted primarily from the settlement of the financial institutions case, higher reorganization and realignment payments, a higher incentive compensation payout for the 2019 fiscal period paid in 2020, and rental payment timing. Excluding the $18.3 million tax effected payment related to the settlement of the financial institutions case, free cash flow would have been approximately $182 million.
First Quarter Sales off to a Strong Start Through the week ended February 21, year-to-date U.S. same-restaurant sales increased approximately 6% and Global same-restaurant sales increased approximately 5%. Company Previously Announced 29% Increase in Quarterly Dividend On February 23, the Company announced a 29% increase in its regular quarterly cash dividend to 9 cents per share. The Company believes that its strong liquidity position, along with the momentum it is seeing in its business, supports this increase, while still leaving flexibility to invest in growth. Share Repurchases The Company repurchased 0.7 million shares for $16 million in the fourth quarter of 2020 and has repurchased 0.5 million shares for approximately $10 million thus far in the first quarter of 2021. As of the date of this release, approximately $58 million remains available under the Company’s existing $100 million share repurchase authorization that expires in February 2022. 2021 Outlook This release includes forward-looking projections for certain non-GAAP financial measures, including systemwide sales, adjusted EBITDA, adjusted earnings per share and free cash flow. The Company excludes certain expenses and benefits from adjusted EBITDA, adjusted earnings per share and free cash flow, such as the impact from our advertising funds, including the net change in the restricted operating assets and liabilities and any excess or deficit of advertising funds revenues over advertising funds expenses, impairment of long-lived assets, reorganization and realignment costs, system optimization (gains) losses, net, and the timing and resolution of certain tax matters. Due to the uncertainty and variability of the nature and amount of those expenses and benefits, the Company is unable without unreasonable effort to provide projections of net income, earnings per share or net cash provided by operating activities, or a reconciliation of those projected measures. During 2021, the Company Expects:
• Global systemwide sales growth: 6 to 8 percent (excluding the impact of the 53rd week) • Adjusted EBITDA: $445 to $455 million • Adjusted earnings per share: $0.67 to $0.69 • Cash flows from operations: $310 to $330 million • Capital Expenditures: $80 to $90 million • Free cash flow: $230 to $240 million
Conference Call and Webcast Scheduled for 8:30 a.m. Today, March 3 The Company will host a conference call on Wednesday, March 3 at 8:30 a.m. ET, with a simultaneous webcast from the Company’s Investor Relations website at www.irwendys.com. The related presentation materials will also be available on the Company's Investor Relations website. The live conference call will be available by telephone at (866) 211-4759 for domestic callers and (647) 689-6752 for international callers. An archived webcast and presentation materials will be available on the Company’s Investor Relations website. Forward-Looking Statements This release contains certain statements that are “forward-looking statements” within the meaning of the Private Securities Litigation Reform Act of 1995 (the “Reform Act”). Generally, forward-looking statements include the words “may,” “believes,” “plans,” “expects,” “anticipates,” “intends,” “estimate,” “goal,” “upcoming,” “outlook,” “guidance” or the negation thereof, or similar expressions. In addition, all statements that address future operating, financial or business performance, strategies or initiatives, future efficiencies or savings, anticipated costs or charges, future capitalization, anticipated impacts of recent or pending investments or transactions and statements expressing general views about future results or brand health are forward-looking statements within the meaning of the Reform Act. Forward-looking statements are based on the Company’s expectations at the time such statements are made, speak only as of the dates they are made and are susceptible to a number of risks, uncertainties and other factors. For all such forward-looking statements, the Company claims the protection of the safe harbor for forward-looking statements contained in the Reform Act. The Company’s actual results, performance and achievements may

5
differ materially from any future results, performance or achievements expressed or implied by the Company’s forward-looking statements. Many important factors could affect the Company’s future results and cause those results to differ materially from those expressed in or implied by the Company’s forward-looking statements. Such factors include, but are not limited to, the following: (1) disruption to the Company’s business from the novel coronavirus (COVID-19) pandemic and the impact of the pandemic on the Company’s results of operations, financial condition and prospects; (2) the impact of competition or poor customer experiences at Wendy’s restaurants; (3) economic disruptions, including in regions with a high concentration of Wendy’s restaurants; (4) changes in discretionary consumer spending and consumer tastes and preferences; (5) impacts to the Company’s corporate reputation or the value and perception of the Company’s brand; (6) the effectiveness of the Company’s marketing and advertising programs and new product development; (7) the Company’s ability to manage the accelerated impact of social media; (8) the Company’s ability to protect its intellectual property; (9) food safety events or health concerns involving the Company’s products; (10) the Company’s ability to achieve its growth strategy through new restaurant development and its Image Activation program; (11) the Company’s ability to effectively manage the acquisition and disposition of restaurants or successfully implement other strategic initiatives; (12) risks associated with leasing and owning significant amounts of real estate, including environmental matters; (13) the Company’s ability to achieve and maintain market share in the breakfast daypart; (14) risks associated with the Company’s international operations, including the ability to execute its international growth strategy; (15) changes in commodity and other operating costs; (16) shortages or interruptions in the supply or distribution of the Company’s products and other risks associated with the Company’s independent supply chain purchasing co-op; (17) the impact of increased labor costs or labor shortages; (18) the continued succession and retention of key personnel and the effectiveness of the Company’s leadership structure; (19) risks associated with the Company’s digital commerce strategy, platforms and technologies, including its ability to adapt to changes in industry trends and consumer preferences; (20) the Company’s dependence on computer systems and information technology, including risks associated with the failure, misuse, interruption or breach of its systems or technology or other cyber incidents or deficiencies; (21) risks associated with the Company’s securitized financing facility and other debt agreements, including compliance with operational and financial covenants, restrictions on its ability to raise additional capital, the impact of its overall debt levels and the Company’s ability to generate sufficient cash flow to meet its debt service obligations and operate its business; (22) risks associated with the Company’s capital allocation policy, including the amount and timing of equity and debt repurchases and dividend payments; (23) risks associated with complaints and litigation, compliance with legal and regulatory requirements and an increased focus on environmental, social and governance issues; (24) risks associated with the availability and cost of insurance, changes in accounting standards, the recognition of impairment or other charges, the impact of realignment and reorganization initiatives, changes in tax rates or tax laws and fluctuations in foreign currency exchange rates; (25) conditions beyond the Company’s control, such as adverse weather conditions, natural disasters, hostilities, social unrest, health epidemics or pandemics or other catastrophic events; and (26) other risks and uncertainties cited in the Company’s releases, public statements and/or filings with the Securities and Exchange Commission, including those identified in the “Risk Factors” sections of the Company’s Forms 10-K and 10-Q. In addition to the factors described above, there are risks associated with the Company’s predominantly franchised business model that could impact its results, performance and achievements. Such risks include the Company’s ability to identify, attract and retain experienced and qualified franchisees and effectively manage the transfer of restaurants between and among franchisees, the business and financial health of franchisees, the ability of franchisees to meet their royalty, advertising, development, reimaging and other commitments, participation by franchisees in brand strategies and the fact that franchisees are independent third parties that own, operate and are responsible for overseeing the operations of their restaurants. The Company’s predominantly franchised business model may also impact the ability of the Wendy’s system to effectively respond and adapt to market changes. Many of these risks have been or in the future may be heightened due to the business disruption and impact from the COVID-19 pandemic. All future written and oral forward-looking statements attributable to the Company or any person acting on its behalf are expressly qualified in their entirety by the cautionary statements contained or referred to above. New risks and uncertainties arise from time to time, and it is impossible for the Company to predict these events or how they may affect the Company. The Company assumes no obligation to update any forward-looking statements after the date of this release as a result of new information, future events or developments, except as required by

6
federal securities laws, although the Company may do so from time to time. The Company does not endorse any projections regarding future performance that may be made by third parties. There can be no assurance that any additional regular quarterly cash dividends will be declared or paid after the date hereof, or of the amount or timing of such dividends, if any. Future dividend payments, if any, are subject to applicable law, will be made at the discretion of the Board of Directors and will be based on factors such as the Company’s earnings, financial condition and cash requirements and other factors. Disclosure Regarding Non-GAAP Financial Measures In addition to the financial measures presented in this release in accordance with U.S. Generally Accepted Accounting Principles (“GAAP”), the Company has included certain non-GAAP financial measures in this release, including adjusted revenue, adjusted EBITDA, adjusted earnings per share, free cash flow and systemwide sales. The Company uses adjusted revenue, adjusted EBITDA, adjusted earnings per share and systemwide sales as internal measures of business operating performance and as performance measures for benchmarking against the Company’s peers and competitors. Adjusted EBITDA and systemwide sales are also used by the Company in establishing performance goals for purposes of executive compensation. The Company believes its presentation of adjusted revenue, adjusted EBITDA, adjusted earnings per share and systemwide sales provides a meaningful perspective of the underlying operating performance of our current business and enables investors to better understand and evaluate our historical and prospective operating performance. The Company believes these non-GAAP financial measures are important supplemental measures of operating performance because they eliminate items that vary from period to period without correlation to our core operating performance and highlight trends in our business that may not otherwise be apparent when relying solely on GAAP financial measures. Due to the nature and/or size of the items being excluded, such items do not reflect future gains, losses, expenses or benefits and are not indicative of our future operating performance. The Company believes investors, analysts and other interested parties use adjusted revenue, adjusted EBITDA, adjusted earnings per share and systemwide sales in evaluating issuers, and the presentation of these measures facilitates a comparative assessment of the Company’s operating performance in addition to the Company’s performance based on GAAP results. This release also includes disclosure regarding the Company’s free cash flow. Free cash flow is a non-GAAP financial measure that is used by the Company as an internal measure of liquidity. Free cash flow is also used by the Company in establishing performance goals for purposes of executive compensation. The Company defines free cash flow as cash flows from operations minus (i) capital expenditures and (ii) the net change in the restricted operating assets and liabilities of the advertising funds and any excess/deficit of advertising funds revenue over advertising funds expense included in net income, as reported under GAAP. The impact of our advertising funds is excluded because the funds are used solely for advertising and are not available for the Company’s working capital needs. The Company may also make additional adjustments for certain non-recurring or unusual items as detailed in the reconciliation tables that accompany this release. The Company believes free cash flow is an important liquidity measure for investors and other interested persons because it communicates how much cash flow is available for working capital needs or to be used for repurchasing shares, paying dividends, repaying or refinancing debt, financing possible acquisitions or investments or other uses of cash. Adjusted revenue, adjusted EBITDA, adjusted earnings per share, free cash flow and systemwide sales are not recognized terms under GAAP, and the Company’s presentation of these non-GAAP financial measures does not replace the presentation of the Company’s financial results in accordance with GAAP. Because all companies do not calculate adjusted revenue, adjusted EBITDA, adjusted earnings per share, free cash flow and systemwide sales (and similarly titled financial measures) in the same way, those measures as used by other companies may not be consistent with the way the Company calculates such measures. The non-GAAP financial measures included in this release should not be construed as substitutes for or better indicators of the Company’s performance than the most directly comparable GAAP financial measures. See the reconciliation tables that accompany this release for additional information regarding certain of the non-GAAP financial measures included herein. Key Business Measures The Company tracks its results of operations and manages its business using certain key business measures, including same-restaurant sales, systemwide sales and Company-operated restaurant margin, which are measures commonly used in the quick-service restaurant industry that are important to understanding Company performance.

7
Same-restaurant sales and systemwide sales each include sales by both Company-operated and franchise restaurants. The Company reports same-restaurant sales for new restaurants after they have been open for 15 continuous months and for reimaged restaurants as soon as they reopen. Restaurants temporarily closed for more than one fiscal week are excluded from same-restaurant sales. For fiscal 2020, same-restaurant sales excludes the impact of a 53rd operating week. Same-restaurant sales compares the 52 weeks from December 30, 2019 through December 27, 2020 to the 52 weeks from December 31, 2018 through December 29, 2019. For fiscal 2021, same-restaurant sales will compare the 52 weeks from January 4, 2021 through January 2, 2022 to the 52 weeks from January 6, 2020 through January 3, 2021. Franchise restaurant sales are reported by our franchisees and represent their revenues from sales at franchised Wendy’s restaurants. Sales by franchise restaurants are not recorded as Company revenues and are not included in the Company’s consolidated financial statements. However, the Company’s royalty revenues are computed as percentages of sales made by Wendy’s franchisees and, as a result, sales by franchisees have a direct effect on the Company’s royalty revenues and profitability. Same-restaurant sales and systemwide sales exclude sales from Venezuela and Argentina due to the highly inflationary economies of those countries. The Company calculates same-restaurant sales and systemwide sales growth on a constant currency basis. Constant currency results exclude the impact of foreign currency translation and are derived by translating current year results at prior year average exchange rates. The Company believes excluding the impact of foreign currency translation provides better year over year comparability. Company-operated restaurant margin is defined as sales from Company-operated restaurants less cost of sales divided by sales from Company-operated restaurants. Cost of sales includes food and paper, restaurant labor and occupancy, advertising and other operating costs. About Wendy’s Wendy's® was founded in 1969 by Dave Thomas in Columbus, Ohio. Dave built his business on the premise, “Quality is our Recipe®,” which remains the guidepost of the Wendy’s system. Wendy’s is best known for its made-to-order square hamburgers, using fresh, never frozen beef*, freshly-prepared salads, and other signature items like chili, baked potatoes and the Frosty® dessert. The Wendy’s Company (Nasdaq: WEN) is committed to doing the right thing and making a positive difference in the lives of others. This is most visible through the Company’s support of the Dave Thomas Foundation for Adoption® and its signature Wendy’s Wonderful Kids® program, which seeks to find every child in the North American foster care system a loving, forever home. Today, Wendy’s and its franchisees employ hundreds of thousands of people across more than 6,800 restaurants worldwide with a vision of becoming the world’s most thriving and beloved restaurant brand. For details on franchising, connect with us at www.wendys.com/franchising. Visit www.wendys.com and www.squaredealblog.com for more information and connect with us on Twitter and Instagram using @wendys, and on Facebook at www.facebook.com/wendys. *Fresh beef available in the contiguous U.S., Alaska, and Canada.
Investor Contact: Greg Lemenchick Senior Director - Investor Relations & Corporate FP&A (614) 766-3977; [email protected] Media Contact: Heidi Schauer Vice President – Communications, Public Affairs & Customer Care (614) 764-3368; [email protected]
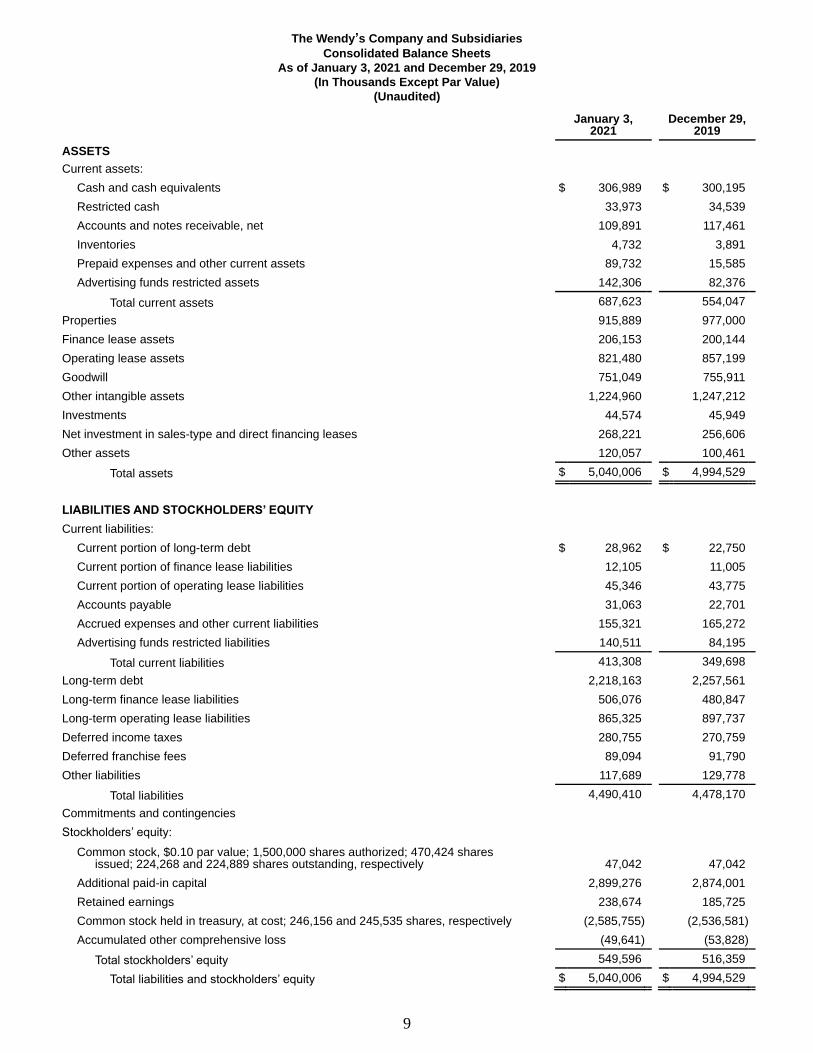
The Wendy’s Company and Subsidiaries
Consolidated Statements of Operations
Three and Twelve Month Periods Ended January 3, 2021 and December 29, 2019
(In Thousands Except Per Share Amounts)
(Unaudited)
8
Three Months Ended Twelve Months Ended
2020 2019 2020 2019
Revenues: Sales $ 199,803 $ 176,761 $ 722,764 $ 707,485 Franchise royalty revenue and fees 123,104 108,766 444,749 428,999 Franchise rental income 59,214 56,134 232,648 233,065 Advertising funds revenue 92,196 85,530 333,664 339,453
474,317 427,191 1,733,825 1,709,002 Costs and expenses:
Cost of sales 164,737 151,434 614,907 597,530 Franchise support and other costs 7,037 23,863 26,464 43,686 Franchise rental expense 32,589 31,087 125,613 123,929 Advertising funds expense 92,007 81,085 345,360 338,116 General and administrative 59,323 53,940 206,876 200,206 Depreciation and amortization 34,049 33,718 132,775 131,693 System optimization gains, net (815) (121) (3,148) (1,283) Reorganization and realignment costs 5,834 12,194 16,030 16,965 Impairment of long-lived assets 3,310 5,315 8,037 6,999 Other operating income, net (2,321) (2,041) (8,397) (11,418)
395,750 390,474 1,464,517 1,446,423 Operating profit 78,567 36,717 269,308 262,579
Interest expense, net (31,041) (29,028) (117,737) (115,971) Loss on early extinguishment of debt — (1,346) — (8,496) Investment income (loss), net 4 24,599 (225) 25,598 Other income, net 107 1,605 1,449 7,771
Income before income taxes 47,637 32,547 152,795 171,481 Provision for income taxes (8,903) (6,014) (34,963) (34,541)
Net income $ 38,734 $ 26,533 $ 117,832 $ 136,940 Net income per share:
Basic $ .17 $ .12 $ .53 $ .60 Diluted .17 .11 .52 .58
Number of shares used to calculate basic income per share 224,139 227,441 223,684 229,944
Number of shares used to calculate diluted income
per share 228,521 232,594 228,014 235,075
The Wendy’s Company and Subsidiaries
Consolidated Balance Sheets
As of January 3, 2021 and December 29, 2019
(In Thousands Except Par Value)
(Unaudited)
9
January 3,
2021 December 29,
2019
ASSETS Current assets:
Cash and cash equivalents $ 306,989 $ 300,195 Restricted cash 33,973 34,539 Accounts and notes receivable, net 109,891 117,461 Inventories 4,732 3,891 Prepaid expenses and other current assets 89,732 15,585 Advertising funds restricted assets 142,306 82,376
Total current assets 687,623 554,047 Properties 915,889 977,000 Finance lease assets 206,153 200,144 Operating lease assets 821,480 857,199 Goodwill 751,049 755,911 Other intangible assets 1,224,960 1,247,212 Investments 44,574 45,949 Net investment in sales-type and direct financing leases 268,221 256,606 Other assets 120,057 100,461
Total assets $ 5,040,006 $ 4,994,529 LIABILITIES AND STOCKHOLDERS’ EQUITY
Current liabilities: Current portion of long-term debt $ 28,962 $ 22,750 Current portion of finance lease liabilities 12,105 11,005 Current portion of operating lease liabilities 45,346 43,775 Accounts payable 31,063 22,701 Accrued expenses and other current liabilities 155,321 165,272 Advertising funds restricted liabilities 140,511 84,195
Total current liabilities 413,308 349,698 Long-term debt 2,218,163 2,257,561 Long-term finance lease liabilities 506,076 480,847 Long-term operating lease liabilities 865,325 897,737 Deferred income taxes 280,755 270,759 Deferred franchise fees 89,094 91,790 Other liabilities 117,689 129,778
Total liabilities 4,490,410 4,478,170 Commitments and contingencies Stockholders’ equity:
Common stock, $0.10 par value; 1,500,000 shares authorized; 470,424 shares issued; 224,268 and 224,889 shares outstanding, respectively 47,042 47,042
Additional paid-in capital 2,899,276 2,874,001 Retained earnings 238,674 185,725 Common stock held in treasury, at cost; 246,156 and 245,535 shares, respectively (2,585,755) (2,536,581) Accumulated other comprehensive loss (49,641) (53,828)
Total stockholders’ equity 549,596 516,359 Total liabilities and stockholders’ equity $ 5,040,006 $ 4,994,529
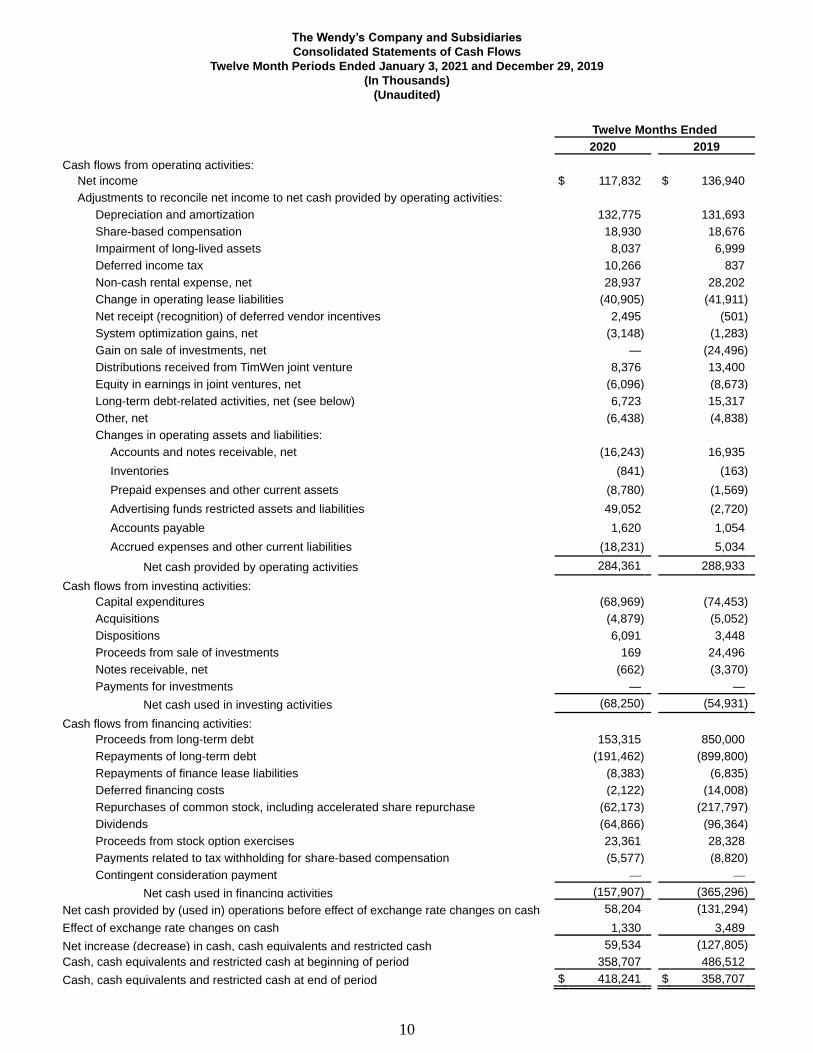
The Wendy’s Company and Subsidiaries
Consolidated Statements of Cash Flows
Twelve Month Periods Ended January 3, 2021 and December 29, 2019
(In Thousands)
(Unaudited)
10
Twelve Months Ended 2020 2019
Cash flows from operating activities: Net income $ 117,832 $ 136,940 Adjustments to reconcile net income to net cash provided by operating activities:
Depreciation and amortization 132,775 131,693 Share-based compensation 18,930 18,676 Impairment of long-lived assets 8,037 6,999 Deferred income tax 10,266 837 Non-cash rental expense, net 28,937 28,202 Change in operating lease liabilities (40,905) (41,911) Net receipt (recognition) of deferred vendor incentives 2,495 (501) System optimization gains, net (3,148) (1,283) Gain on sale of investments, net — (24,496) Distributions received from TimWen joint venture 8,376 13,400 Equity in earnings in joint ventures, net (6,096) (8,673) Long-term debt-related activities, net (see below) 6,723 15,317 Other, net (6,438) (4,838) Changes in operating assets and liabilities:
Accounts and notes receivable, net (16,243) 16,935 Inventories (841) (163) Prepaid expenses and other current assets (8,780) (1,569) Advertising funds restricted assets and liabilities 49,052 (2,720) Accounts payable 1,620 1,054 Accrued expenses and other current liabilities (18,231) 5,034
Net cash provided by operating activities 284,361 288,933 Cash flows from investing activities:
Capital expenditures (68,969) (74,453) Acquisitions (4,879) (5,052) Dispositions 6,091 3,448 Proceeds from sale of investments 169 24,496 Notes receivable, net (662) (3,370) Payments for investments — —
Net cash used in investing activities (68,250) (54,931) Cash flows from financing activities:
Proceeds from long-term debt 153,315 850,000 Repayments of long-term debt (191,462) (899,800) Repayments of finance lease liabilities (8,383) (6,835) Deferred financing costs (2,122) (14,008) Repurchases of common stock, including accelerated share repurchase (62,173) (217,797) Dividends (64,866) (96,364) Proceeds from stock option exercises 23,361 28,328 Payments related to tax withholding for share-based compensation (5,577) (8,820) Contingent consideration payment — —
Net cash used in financing activities (157,907) (365,296) Net cash provided by (used in) operations before effect of exchange rate changes on cash 58,204 (131,294) Effect of exchange rate changes on cash 1,330 3,489 Net increase (decrease) in cash, cash equivalents and restricted cash 59,534 (127,805) Cash, cash equivalents and restricted cash at beginning of period 358,707 486,512 Cash, cash equivalents and restricted cash at end of period $ 418,241 $ 358,707

The Wendy’s Company and Subsidiaries
Reconciliations of Net Income to Adjusted EBITDA and Revenues to Adjusted Revenues
Three and Twelve Month Periods Ended January 3, 2021 and December 29, 2019
(In Thousands)
(Unaudited)
11
Three Months Ended Twelve Months Ended
2020 2019 2020 2019
Net income $ 38,734 $ 26,533 $ 117,832 $ 136,940
Provision for income taxes 8,903 6,014 34,963 34,541 Income before income taxes 47,637 32,547 152,795 171,481
Other income, net (107) (1,605) (1,449) (7,771) Investment (income) loss, net (4) (24,599) 225 (25,598) Loss on early extinguishment of debt — 1,346 — 8,496 Interest expense, net 31,041 29,028 117,737 115,971
Operating profit 78,567 36,717 269,308 262,579 Plus (less):
Advertising funds revenue (92,196) (85,530) (333,664) (339,453) Advertising funds expense (a) 85,745 81,085 330,760 338,116 Depreciation and amortization 34,049 33,718 132,775 131,693 System optimization gains, net (815) (121) (3,148) (1,283) Reorganization and realignment costs 5,834 12,194 16,030 16,965 Impairment of long-lived assets 3,310 5,315 8,037 6,999 Legal reserve for Financial Institutions case — — — (2,829)
Adjusted EBITDA $ 114,494 $ 83,378 $ 420,098 $ 412,787 Revenues $ 474,317 $ 427,191 $ 1,733,825 $ 1,709,002 Less:
Advertising funds revenue (92,196) (85,530) (333,664) (339,453) Adjusted revenues $ 382,121 $ 341,661 $ 1,400,161 $ 1,369,549
(a) For the three and twelve months ended January 3, 2021, excludes advertising funds expense of $6,262 and $14,600,
respectively, related to the Company funding of incremental advertising during 2020.

The Wendy’s Company and Subsidiaries
Reconciliation of Net Income and Diluted Earnings Per Share to
Adjusted Income and Adjusted Earnings Per Share
Three and Twelve Month Periods Ended January 3, 2021 and December 29, 2019
(In Thousands Except Per Share Amounts)
(Unaudited)
12
Three Months Ended Twelve Months Ended
2020 2019 2020 2019
Net income $ 38,734 $ 26,533 $ 117,832 $ 136,940 Plus (less):
Advertising funds revenue (92,196) (85,530) (333,664) (339,453) Advertising funds expense (a) 85,745 81,085 330,760 338,116 System optimization gains, net (815) (121) (3,148) (1,283) Reorganization and realignment costs 5,834 12,194 16,030 16,965 Impairment of long-lived assets 3,310 5,315 8,037 6,999 Loss on early extinguishment of debt — 1,346 — 8,496 Gain on other investments in equity securities — (24,366) — (24,366) Legal reserve for Financial Institutions case — — — (2,829)
Total adjustments 1,878 (10,077) 18,015 2,645 Income tax impact on adjustments (b) (2,161) 1,769 (6,727) (852)
Total adjustments, net of income taxes (283) (8,308) 11,288 1,793
Adjusted income $ 38,451 $ 18,225 $ 129,120 $ 138,733 Diluted earnings per share $ .17 $ .11 $ .52 $ .58 Total adjustments per share, net of income taxes .00 (.03) .05 .01 Adjusted earnings per share $ .17 $ .08 $ .57 $ .59
(a) For the three and twelve months ended January 3, 2021, excludes advertising funds expense of $6,262 and $14,600,
respectively, related to the Company funding of incremental advertising during 2020.
(b) The provision for (benefit from) income taxes on “System optimization gains, net” was $213 and $374 for the three months
ended January 3, 2021 and December 29, 2019, respectively, and $(515) and $482 for the twelve months ended January 3,
2021 and December 29, 2019, respectively. The provision for (benefit from) income taxes on all other adjustments (excluding
the advertising funds adjustments) was calculated using an effective tax rate of 25.96% and 25.31% for the three months
ended January 3, 2021 and December 29, 2019, respectively, and 25.81% and 25.33% for the twelve months ended
January 3, 2021 and December 29, 2019, respectively.

The Wendy’s Company and Subsidiaries
Reconciliation of Net Cash Provided by Operating Activities to Free Cash Flow
Twelve Month Periods Ended January 3, 2021 and December 29, 2019
(In Thousands)
(Unaudited)
13
Twelve Months Ended
2020 2019
Net cash provided by operating activities $ 284,361 $ 288,933 Less:
Capital expenditures (68,969) (74,453) Advertising funds impact (a) (51,956) 1,383 Tax effect of gain on other investments in equity securities — 5,117
Free cash flow $ 163,436 $ 220,980
(a) Advertising funds impact for 2020 and 2019 includes the net change in the restricted operating assets and liabilities of the
funds of $49,052 and $(2,720), respectively, and the advertising funds surplus included in Net income of $2,904 and $1,337,
respectively. Advertising funds impact for 2020 excludes the Company's incremental funding of advertising of $14,600.