Embed Size (px)
Citation preview

V E L O D Y N E L I D A R . C O M | 1Y O U R S A F E T Y D R I V E S U S
FOURTH QUARTER 2020
INVESTOR PRESENTATIONFebruary 25, 2021

V E L O D Y N E L I D A R . C O M | 2
S A F E H A R B O R
This presentation contains “forward-looking statements” within the meaning of the “safe harbor” provisions of the Private Securities Litigation Reform Act of 1995, including but not limited to,statements regarding our financial outlook and market positioning, business strategy and plans, potential contract opportunities, planned products and services, growth opportunities, market demandand technological developments. These forward-looking statements are based on information available to us as of the date of this presentation and are based on our management’s current viewsand assumptions. You can identify forward-looking statements by the fact that they do not relate strictly to historical or current facts. These statements may include words such as “anticipate”,“estimate”, “expect”, “project”, “plan”, “intend”, “believe”, “may”, “will”, “should”, “can have”, “likely” and other words and terms of similar meaning in connection with any discussion of the timing ornature of future operating or financial performance or other events.
All forward-looking statements are subject to risks and uncertainties that may cause actual results to differ materially from those that we expected, including: the impact on our operations andfinancial condition from the effects of the current COVID-19 pandemic; the impact of the COVID-19 pandemic on our customers and suppliers; our ability to execute our business plan; the timing ofrevenue from existing customers, including uncertainties related to the ability of our customers to commercialize their products and the ultimate market acceptance of these products; uncertaintiesrelated to our estimates of the size of the markets for our products and future revenue opportunities; the rate and degree of market acceptance of our products; the success of other competing lidarand sensor-related products and services that exist or may become available; our ability to identify and integrate acquisitions; rising costs adversely affecting our profitability; uncertainties related toour current litigation and potential litigation involving us or our predecessors or the validity or enforceability of our intellectual property; our ability to partner with and rely on third party manufacturers;general economic and market conditions impacting demand for our products and services; and changes in applicable laws or regulations. We operate in a very competitive and rapidly changingenvironment and new risks may emerge from time to time. It is not possible for us to predict all risks, nor can we assess the impact of all factors on our business or the extent to which any factor, orcombination of factors, may cause actual results or outcomes to differ materially from those contained in any forward-looking statements. Additional information concerning risks, uncertainties andother factors that could cause results to differ materially from the expectations described in this presentation can be found in our filings with the U.S. Securities and Exchange Commission, includingquarterly reports on Form 10-Q and current reports on Form 8-K. The forward-looking statements included in this presentation relate only to events as of the date hereof. We undertake no obligationto update or revise any forward-looking statement as a result of new information, future events or otherwise, except as otherwise required by law.
This presentation includes information concerning economic conditions, our industry, our markets and our competitive position that is based on a variety of sources, including information fromindependent industry analysts and publications, as well as our own estimates and research. Our estimates are derived from publicly available information released by third party sources, as well asdata from its internal research, and are based on such data and our knowledge of our industry, which we believe to be reasonable. The independent industry publications used in this presentationwere not prepared on our behalf. While we are not aware of any misstatements regarding any information in this presentation, forecasts, assumptions, expectations, beliefs, estimates andprojections involve risk and uncertainties and are subject to change based on various factors.
In addition to our results determined in accordance with generally accepted accounting principles in the United States (“GAAP”), this presentation includes certain non-GAAP financial measures,including non-GAAP gross profit and non-GAAP operating loss, that we believe are useful in evaluating our operating performance. Certain of these non-GAAP measures exclude stock-basedcompensation, gain from asset sales, one-time IPO-related costs, amortization of acquisition-related intangibles assets, and discrete tax items. The effect of these excluded items may be significant.We believe that non-GAAP financial information, when taken collectively, may be helpful to investors because it provides consistency and comparability with past financial performance and assistsin comparisons with other companies, some of which use similar non-GAAP information to supplement their GAAP results. The non-GAAP financial information is presented for supplementalinformational purposes only. There are limitations related to the use of non-GAAP financial information and such information should not be considered a substitute for financial information presentedin accordance with GAAP. For example, our non-GAAP financial information may be different from similarly-titled non-GAAP measures used by other companies. Reconciliation tables of the mostcomparable GAAP financial measures to the non-GAAP financial measures can be found at the end of this presentation.
The audit of the financial results contained herein as of December 31, 2020 and for the year ended December 31, 2020 is not yet complete and as a result these amounts may change as result ofthe completion of the audit of the 2020 financial statements.
V E L O D Y N E L I D A R . C O M | 3
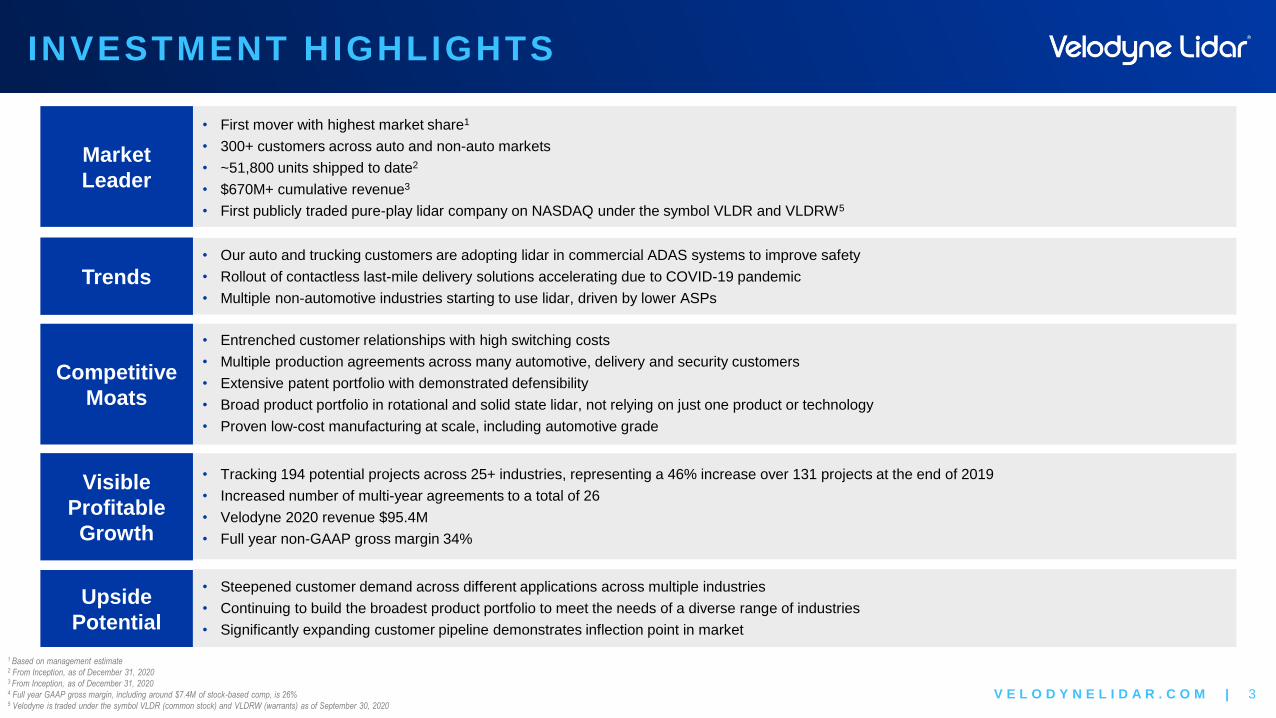
INVESTMENT HIGHLIGHTS
1 Based on management estimate2 From Inception, as of December 31, 20203 From Inception, as of December 31, 20204 Full year GAAP gross margin, including around $7.4M of stock-based comp, is 26%5 Velodyne is traded under the symbol VLDR (common stock) and VLDRW (warrants) as of September 30, 2020
Market
Leader
Trends
Upside
Potential
Competitive
Moats
Visible
Profitable
Growth
• First mover with highest market share1
• 300+ customers across auto and non-auto markets
• ~51,800 units shipped to date2
• $670M+ cumulative revenue3
• First publicly traded pure-play lidar company on NASDAQ under the symbol VLDR and VLDRW5
• Our auto and trucking customers are adopting lidar in commercial ADAS systems to improve safety
• Rollout of contactless last-mile delivery solutions accelerating due to COVID-19 pandemic
• Multiple non-automotive industries starting to use lidar, driven by lower ASPs
• Entrenched customer relationships with high switching costs
• Multiple production agreements across many automotive, delivery and security customers
• Extensive patent portfolio with demonstrated defensibility
• Broad product portfolio in rotational and solid state lidar, not relying on just one product or technology
• Proven low-cost manufacturing at scale, including automotive grade
• Tracking 194 potential projects across 25+ industries, representing a 46% increase over 131 projects at the end of 2019
• Increased number of multi-year agreements to a total of 26
• Velodyne 2020 revenue $95.4M
• Full year non-GAAP gross margin 34%
• Steepened customer demand across different applications across multiple industries
• Continuing to build the broadest product portfolio to meet the needs of a diverse range of industries
• Significantly expanding customer pipeline demonstrates inflection point in market

V E L O D Y N E L I D A R . C O M | 4
BUSINESS UPDATES
1 Velodyne is traded under the symbol VLDR (common stock) and VLDRW (warrants) as of September 30, 2020
• Total sensors shipped in 2020 exceeded 11,700 with 4,237 units shipped in the 4 th quarter
• Momentum in solid state sensors shipped increased to more than 700 in 4th quarter
• As of 2/19/21, the total number of multi-year agreements and projects in pipeline increased to 26 and 194, respectively
• Announced sales agreements with the following:
o Baidu
o Motional (Hyundai Motor Group – Aptiv combination)
o May Mobility
o Local Motors
o Ford Otosan
• Announced Velarray H800, a breakthrough solid state sensor for advanced driver assistance and autonomy
• Announced Velarray M1600, an innovative solid state sensor for autonomous mobile robotics and last-mile delivery
Successfully defended patents with Hesai and RoboSense by entering into recurring global licensing payment agreements
• Joined Qualcomm’s Smart Cities Accelerator Program
• Velodyne’s Velabit lidar sensor was named a winner in the Best of What’s New awards by Popular Science and in the 2020
Innovation Award by Silicon Valley Robotics
• Won TU Automotive Awards 2020 Hardware Supplier of the Year
• Published Pedestrian Automated Emergency Braking and Smart Cities white papers

V E L O D Y N E L I D A R . C O M | 5
STRONG & EXPERIENCED LEADERSHIP TEAM
Drew
Hamer
Chief
Financial
Officer
Mike
Jellen
Chief
Commercial
Officer
Sally
Frykman
Chief
Marketing
Officer
Anand
Gopalan
Chief
Executive
Officer
Matt
Rekow
Chief
Technology
Officer
Rick
Tewell
Chief
Operations
Officer
Kathy
McBeath
Chief
People
Officer
Michael
Vella
General
Counsel

V E L O D Y N E L I D A R . C O M | 6
BROAD PORTFOLIO ADRESSES SAFETY NEEDS FOR DIVERSE APPLICATIONS
DELIVERY | MOVING GOODS AUTOMOTIVE | MOVING PEOPLE SMART CITY & SECURITY
Includes touchless delivery,
B2B transport, railways, and
robotic delivery
Includes ADAS, levels 1-5 AV,
and robotaxis
Includes intelligent intersections, advanced
people monitoring, parking & traffic
management, and drones

V E L O D Y N E L I D A R . C O M | 7
WE ARE THE FIRST MOVER AND TRUSTED MARKET LEADER
2005Invented Real-Time 3D Lidar
2007Began World’s First Commercial Production of Real-Time 3D Lidar
Leading Lidar Technology
TODAY
• Market leader for 13 years
• Broad product portfolio
• Cumulative sales of over $670
million1
• 300+ customers, including major
OEMs and leading Tech companies
• Global sales and mass scale
manufacturing
• 25+ market segments outside
automotive
HIGHLIGHTS
1 As of December 31, 2020.

V E L O D Y N E L I D A R . C O M | 8
VELODYNE IS THE LEADING LIDAR PROVIDER
1Contracts represent agreed upon terms and conditions but do not include firm commitment purchase orders. Actual sales may differ materially from projected volume.2Represents the number of unique customers including distributors that purchased smart vision solutions from us in 2018, 2019 and 2020.3As of December 31, 2020.
2017 2018 20192005 - 2016 2020
David Hall invented smart
vision technology
First
real-time,
3D-lidar
Launched
less than
1kg lidar
Manufacturing
agreement with Nikon
Production partnership
with Veoneer
Opened advanced
manufacturing facility in San Jose
Launched
300 meter, high
resolution lidar
Launched
lidar for price-sensitive
applications
~$95M2020
Revenue
55+3
Granted / PendingPatents
300+2
Customers
HDL-64E Puck Alpha Prime Velabit
Launched
lidar for
consumer
ADAS
Velarray
Launched
near-object
detection lidar
Veladome
Strategic investment
from Ford and Baidu
Strategic investment
from Hyundai Mobis
261
Signed / Awarded Multi-Year Agreements
Acquired
Mapper.ai
Strategic investment
from Nikon
51,800+3
Units Shipped
HDL-32E
Launched
compact, multi-
channel array
Ultra Puck
Launched
first 200m
lidar

V E L O D Y N E L I D A R . C O M | 9
VELODYNE LIDAR PRODUCT ROADMAP
Tireless Innovation to Bring New Technologies and Products
Architectures
BroadProductPortfolio
HDL-64E HDL-32E VLP-16
PuckTM
Series
VLP-32
Ultra PuckTM
Series
VLS-64
Alpha-64TM
VelarrayTM H800
VelabitTM VelaDomeTM VellaTM
Announced Future Products
Surround View Hybrid Solid State Solid State Directional Hemispherical Software
FULL RANGE OF FORM FACTORS | SUPERIOR PERCEPTION | LOW POWER CONSUMPTION | DURABILITY
KeyTechnologies
Embedded Signal Processing
Software
Proprietary Calibration and Manufacturing
Micro-Lidar Array Technology
Custom ASICs IP Portfolio
Sensors Are Ruggedized and Leverage Tightly Integrated Hardware and Software Solutions
VLS-128
Alpha
PrimeTM
VelarrayTM M1600

V E L O D Y N E L I D A R . C O M | 1 0
VELLA SYSTEM ON A CHIP (SoC)
Vella is Our Core Perception Technology That Enables Many Use Cases

V E L O D Y N E L I D A R . C O M | 1 1
PAST INVESTMENTS DRIVE GROSS MARGIN EXPANSION AT SCALE
OVERSEAS PRODUCTION
PROPRIETARY MANUFACTURING IP
MANUFACTURING PARTNERSHIPS
Fully automated wafer-scale lidar
manufacturing processes
Micro-lidar arrays and custom ASICs enable mass
production at lower unit cost
Partnerships add capacity and opportunity
for higher marginsEstablished low cost production in Thailand
Transitioning
Q4’20
Completed
Transition
(NYSE: FN)(TSE: 7731) (NYSE: VNE)
VelarrayVLP-16
TECHNOLOGY MINIATURIZATION

V E L O D Y N E L I D A R . C O M | 1 2
HIGHLY DIVERSIFIED PROJECTS ACROSS INDUSTRIES
(Chart represents sensor units )
ADAS
AV
Delivery
Robotics &
Industrial
Mapping
Smart City
2025
Stages of projects shown in the above table vary
from signed / awarded phase to pre-RFI phase
NUMBER OF PROJECTS
Advanced Driver Assistance Systems (ADAS) 61
Autonomous Vehicles (AV) 32
Delivery 18
Mapping 21
Robotics & Industrial 52
Smart City 10
TOTAL 194
____________________
Note: The chart above reflects a visual representation of how Velodyne believes the market is developing based on multi-year commercial demands that Velodyne currently sees from
customers and is not indicative of projected revenue or unit shipment. Signed and awarded contracts represent agreed terms and conditions of supply, but do not reflect firm orders
unless and until purchase orders are received. To date, shipments under and revenue from these signed contracts have not been material. Based on data as of February 19, 2021.
194 Projects Could Potentially Yield a Total of ~9M Units Shipped by 2025
2025 2021 2022 2023 2024

V E L O D Y N E L I D A R . C O M | 1 3
BARRIERS TO ENTRY: ROBUST DURABIL ITY OF INSTALLED CUSTOMER BASE
A. Technology
differentiation
B. Lengthy and
rigorous validation
process
C. Long-term
contracted volume
arrangements
D. High switching
costs
Why We Have a Sticky
Customer Base
Request for Information
(RFI)
Request for Quotation
(RFQ)
Production
Contract
Our Commitment in Platform Development Drives Customer Loyalty

V E L O D Y N E L I D A R . C O M | 1 4
DEMAND CURVE REFLECTS A GROWING MARKET OPPORTUNITY
RFQ
RFI
Pre-RFI
Signed / Awarded
194 PROJECTS IN FUNNEL
NUMBER OF
CURRENT CONTRACTS / PIPELINE
Signed / Awarded 26
Additional Pipeline 168
TOTAL 194
Chart represents
sensor units
1
SIGNED & AWARDED PROGRESSION
JANUARY2019 3JANUARY
2020 26FEBRUARY2021
Note: The chart above reflects a visual representation of how we believe the market is developing based on multi -year commercial demands that we currently see from customers and is not indicative of projected revenue or unit shipment.
Signed and awarded contracts represent agreed terms and conditions of supply, but do not reflect firm orders unless and until purchase orders are received. To date, shipments under and revenue from these signed contracts have not been material. Based on data as of February 19, 2021.
Additional Pipeline includes RFQ, RFI, and Pre-RFI projects. Pre-RFI projects are defined as i) a particular sensor and/or sensor set for a project has been identified, ii) the goal for a particular project has been identified, iii) pricing and the future ASP have been discussed, iv) an approximate volume growth over the
next 2-5 years has been discussed and identified and v) multiple meetings have taken place regarding the project with several technical discussion. There can be no assurance that any pre-RFI projects will result in significant future unit sales within any specific time frame, if at all.
Velodyne is currently in the process of negotiating RFIs, RFQs, and long-term contracts with many customers. The below pipeline only reflects identified projects as of February 19, 2021.
V E L O D Y N E L I D A R . C O M | 1 5
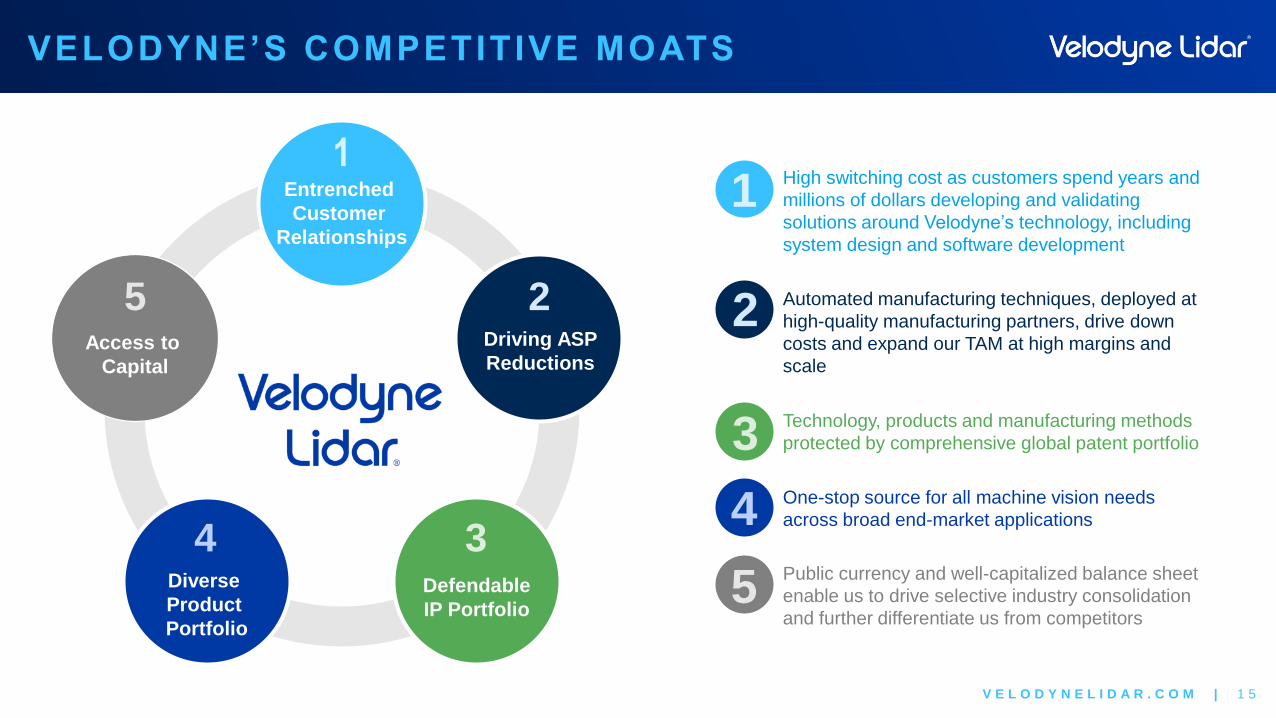
VELODYNE’S COMPETITIVE MOATS
High switching cost as customers spend years and
millions of dollars developing and validating
solutions around Velodyne’s technology, including
system design and software development
Automated manufacturing techniques, deployed at
high-quality manufacturing partners, drive down
costs and expand our TAM at high margins and
scale
Technology, products and manufacturing methods
protected by comprehensive global patent portfolio
One-stop source for all machine vision needs
across broad end-market applications
Public currency and well-capitalized balance sheet
enable us to drive selective industry consolidation
and further differentiate us from competitors
1
2
3
4
5
1Entrenched
Customer
Relationships
2Driving ASP
Reductions
Defendable
IP Portfolio
Diverse
Product
Portfolio
Access to
Capital
34
5

V E L O D Y N E L I D A R . C O M | 1 6
HOW OUR AGREEMENTS TYPICALLY WORK
• Customers typically buy products on a spot basis for several years during pre-contract process
• Customers forecast purchase volume for each contract year, with contracted ASPs for indicated volume
• Contracted ASPs drop as volumes increase
• Binding purchase order for Year 1 confirmed upon signing contract
• Non-recurring engineering (NRE) revenues may be generated in Year 1 of contracts
• Purchase orders for subsequent years typically to be confirmed by September, providing solid visibility on production volume and revenues
more than a year forward
• Velodyne can typically renegotiate pricing upward, at its discretion, if projected volume for any year drops more than 20% below forecast
Year 1 Year 2 Year 3 Year 4 Year 5Purchase Order
for Year 1Contract
Awarded / Signed
3-6 months1-6 months
Discovery
Up to 12 months
Initial Testing
Up to 12 months
Production (Recurring)
P R E - R F I R F I R F Q
System
Specification
C O N T R A C T
Software Development
and Validation
Hardware System
Validation

V E L O D Y N E L I D A R . C O M | 1 7
SUMMARY OF MARKET POSITION
Our Low-Cost Production Drives ASP Reduction and TAM Expansion
Across Industries and Product Portfolio
Sample
Text
Scale1 2 3 4
5 6 7
SCALE COMMERCIALIZATIONPIPELINE / MODEL BUILD
PORTFOLIO
PERFORMANCE / READINESS
SCALABILITY SOFTWARE
~11.7K UnitsShipped in 2020
~51.8K UnitsShipped Since Inception
26Agreements
~$95M2020 Revenue
• Bottom-up approach
• 194 active opportunities across end markets
Unmatched Breadth of
Portfolio for All Applications
• Multi-sourced supply chain and outsourced production
• Design-for-manufacturing process and know-how developed over a decade of manufacturing experience
• Very low cost silicon receivers and 905nm laser
• Velarray product line is automotive grade
• Mature and proven technologies in production today
• Optimal combination of price and performance
• Range of products applicable to diversified end-markets and performance requirements
• <20% of 2024E revenue forecast from software
• Forecasted software revenue based on direct feedback from OEMs using Velarrayhardware
V E L O D Y N E L I D A R . C O M | 1 8
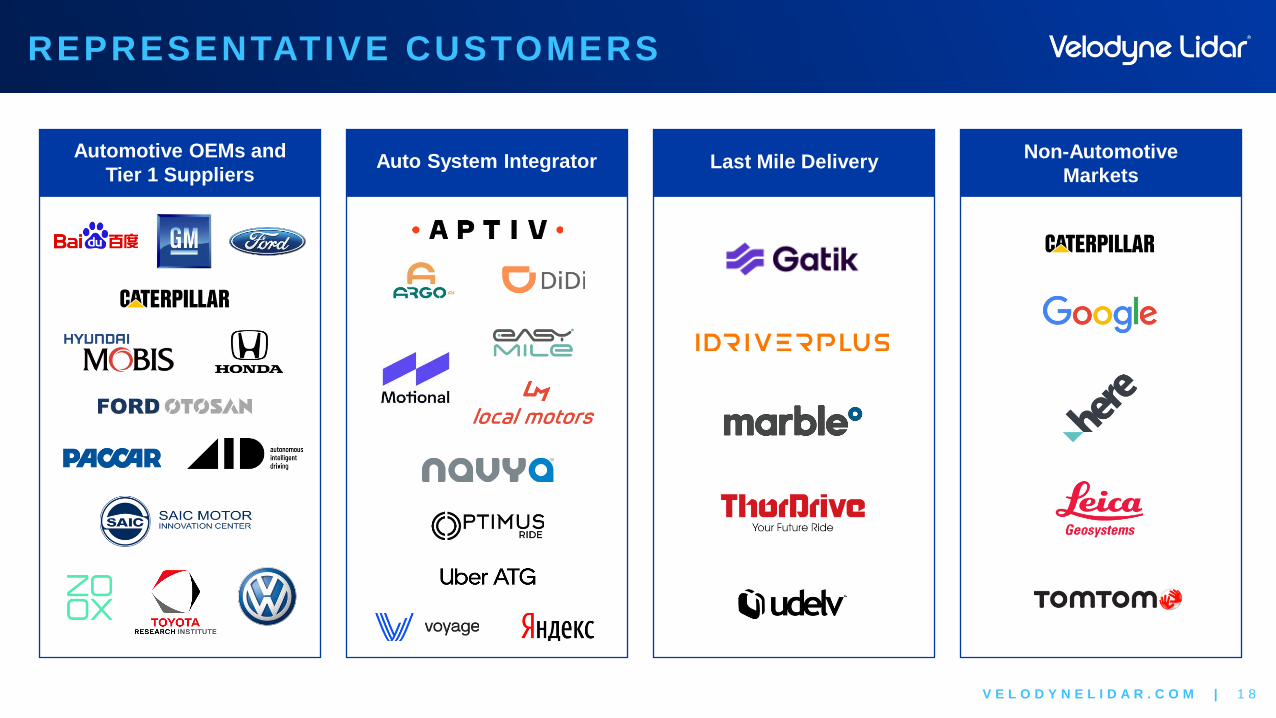
REPRESENTATIVE CUSTOMERS
Automotive OEMs and
Tier 1 SuppliersAUTOMOTIVE | MOVING PEOPLEAuto System Integrator Last Mile Delivery
Non-Automotive
Markets

V E L O D Y N E L I D A R . C O M | 1 9FINANCIAL SUMMARY
V E L O D Y N E L I D A R . C O M | 2 0
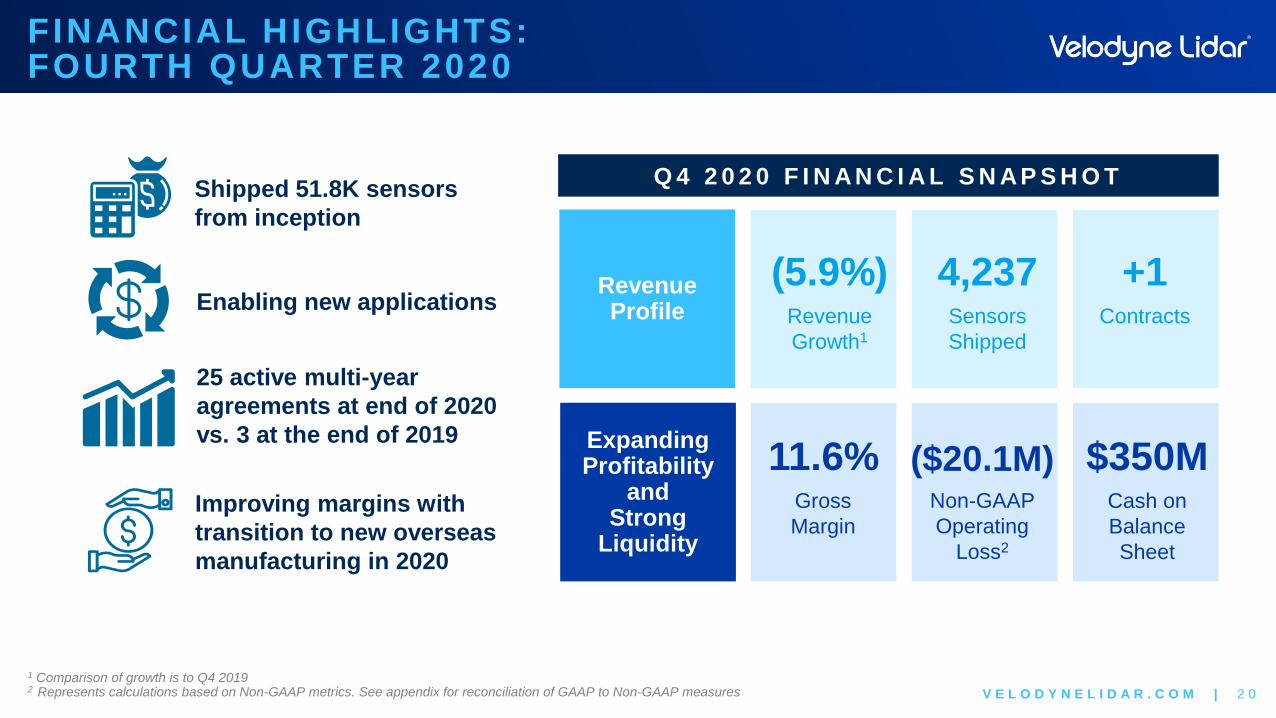
FINANCIAL HIGHLIGHTS:FOURTH QUARTER 2020
Revenue Profile
Expanding Profitability
and Strong
Liquidity
Q 4 2 0 2 0 F I N AN C I A L S N AP S H O T
1 Comparison of growth is to Q4 20192 Represents calculations based on Non-GAAP metrics. See appendix for reconciliation of GAAP to Non-GAAP measures
Shipped 51.8K sensors
from inception
Enabling new applications
25 active multi-year
agreements at end of 2020
vs. 3 at the end of 2019
Improving margins with
transition to new overseas
manufacturing in 2020
(5.9%)Revenue
Growth1
4,237Sensors
Shipped
+1Contracts
11.6%Gross
Margin
($20.1M)Non-GAAP
Operating
Loss2
$350MCash on
Balance
Sheet

V E L O D Y N E L I D A R . C O M | 2 1
FINANCIAL HIGHLIGHTS:FOURTH QUARTER 2020
Revenue Profile
Expanding Profitability
and Strong
Liquidity
F Y 2 0 2 0 F I N AN C I A L S N AP S H O T
1 Comparison of growth is to Q4 20192 Represents calculations based on Non-GAAP metrics. See appendix for reconciliation of GAAP to Non-GAAP measures
Shipped 51.8K sensors
from inception
Enabling new applications
25 active multi-year
agreements at end of 2020
vs. 3 at the end of 2019
Improving margins with
transition to new overseas
manufacturing in 2020
(6.0%)Revenue
Growth1
11,710Sensors
Shipped
+22Contracts
34.1%Gross
Margin2
($62.4M)Non-GAAP
Operating
Loss2
$350MCash on
Balance
Sheet

V E L O D Y N E L I D A R . C O M | 2 2
STRONG CONTRACT AND REVENUE MOMENTUM
R E V E N U E
($ in millions)
FY19 Q4'20
$18.1
$14.4
$0.8
$3.4
0
2
4
6
8
10
12
14
16
18
20
4Q'19 4Q'20
Product Revenue
License and Services
P R O J E C T S I N O U R P I P E L I N E
~7M
Units
~9M
Units
131 Projects
183 Projects

V E L O D Y N E L I D A R . C O M | 2 3
STRONG CONTRACT AND REVENUE MOMENTUM
R E V E N U E
($ in millions)
FY 2019 Q4'20
$81.4$68.4
$20.0
$27.0
0
20
40
60
80
100
120
FY 2019 FY 2020
Product Revenue
License and Services
P R O J E C T S I N O U R P I P E L I N E
~7M
Units
~9M
Units
131 Projects
183 Projects

V E L O D Y N E L I D A R . C O M | 2 4
GROSS PROFIT AND OPERATING INCOME
N O N - G A A P G R O S S P R O F I T 1
($ in millions)
N O N - G A A P O P E R AT I N G L O S S 1
1 Gross Profit and Operating Loss are presented on a Non-GAAP basis (excludes stock-based compensation and amortization). See appendix for reconciliation of GAAP to Non-GAAP measures.
1.2% 11.6% % of Total
Revenue
($ in millions)
($20.1)
($27.2)
-30
-25
-20
-15
-10
-5
0
NM NM% of Total
Revenue
0
0.5
1
1.5
2
2.5
$2.1
$0.2
Q4’19 Q4’20 Q4’20Q4’19

V E L O D Y N E L I D A R . C O M | 2 5
GROSS PROFIT AND OPERATING INCOME
N O N - G A A P G R O S S P R O F I T 1
($ in millions)
N O N - G A A P O P E R AT I N G L O S S 1
1 Gross Profit and Operating Loss are presented on a Non-GAAP basis (excludes stock-based compensation and amortization). See appendix for reconciliation of GAAP to Non-GAAP measures.
29.4% 34.1% % of Total
Revenue
($ in millions)
($62.4)
($66.2)
-67
-66
-65
-64
-63
-62
-61
-60
NM NM% of Total
Revenue
28
28.5
29
29.5
30
30.5
31
31.5
32
32.5
33
$32.5
$29.8
FY’19 FY’20 Q4’20Q4’19

V E L O D Y N E L I D A R . C O M | 2 6
LEVERAGING EFFICIENT COST STRUCTURE
Note: Sales and Marketing, Research and Development and General and Administrative expenses are presented on a Non-GAAP basis. See appendix for reconciliation of GAAP to Non-GAAP measures.
36.7% 37.2%76.5% 63.5%
% of Total Revenue
31.2 % 23.4%
$5.9
$4.2
Q4'19 Q4'20
$7.0
$6.6
Q4'19 Q4'20
$14.5
$11.3
Q4'19 Q4'20
N O N - G A A P S AL E S & M AR K E T I N G
N O N - G A A P G E N E R AL & AD M I N I S T R AT I V E
N O N - G A A P R E S E AR C H & D E V E L O P M E N T
($ in millions) ($ in millions)($ in millions)
% of Total Revenue % of Total Revenue

V E L O D Y N E L I D A R . C O M | 2 7
LEVERAGING EFFICIENT COST STRUCTURE
Note: Sales and Marketing, Research and Development and General and Administrative expenses are presented on a Non-GAAP basis. See appendix for reconciliation of GAAP to Non-GAAP measures.
17.3% 28.6%55.8% 53.1%
% of Total Revenue
21.6 % 17.8%
$21.9
$17.0
FY2019 FY2020
$17.6
$27.3
FY2019 FY2020
$56.6
$50.7
FY2019 FY2020
N O N - G A A P S AL E S & M AR K E T I N G
N O N - G A A P G E N E R AL & AD M I N I S T R AT I V E
N O N - G A A P R E S E AR C H & D E V E L O P M E N T
($ in millions) ($ in millions)($ in millions)
% of Total Revenue % of Total Revenue

V E L O D Y N E L I D A R . C O M | 2 8
TARGET BUSINESS MODEL
Product (Sensor) Gross Margin Mid-to-High 40%s
Gross Margin Mid-to-High 50%s
R&D as Percentage of Revenue 20%
Sales as Percentage of Revenue 10%
G&A as a Percentage of Revenue 7%
EBITDA Margin 20+%
Free Cash Flow 15%

V E L O D Y N E L I D A R . C O M | 2 9
T H A N K Y O U

V E L O D Y N E L I D A R . C O M | 3 0APPENDIX

V E L O D Y N E L I D A R . C O M | 3 1
GAAP TO NON-GAAP GROSS PROFIT RECONCILIATION
NON-GAAP GROSS PROFIT
($ in millions) Q4 2019 Q4 2020 FY 2019 FY 2020
GAAP Gross Profit $0.2 ($5.3) $29.8 $25.1
Stock-Based Compensation – $7.4 – $7.4
Non-GAAP Gross Profit $0.2 $2.1 $29.8 $32.5
Margin % 1.2% 11.6% 29.4% 34.1%

V E L O D Y N E L I D A R . C O M | 3 2
GAAP TO NON-GAAP OPERATING LOSS RECONCILIATION
NON-GAAP OPERATING LOSS
($ in millions) Q4 2019 Q4 2020 FY2019 FY2020
GAAP Operating Loss ($29.8) ($111.5) ($69.0) ($153.9)
Stock-Based Compensation – $91.3 $0.1 $91.4
Gain on Sale of Assets Held-for-Sale – – – ($7.5)
Write-Off of IPO Costs – – – $3.5
Amortization of Acquisition-Related
Intangible Assets $0.1 $0.1 $0.2 $0.4
Restructuring – ($0.1) – $1.0
Legal Settlement $2.5 $0.1 $2.5 $2.6
Non-GAAP Operating Loss ($27.2) ($20.1) ($66.2) ($62.4)

V E L O D Y N E L I D A R . C O M | 3 3
GAAP TO NON-GAAP OPERATING EXPENSE RECONCILIATION
RESEARCH & DEVELOPMENT
($ in millions) Q4 2019 Q4 2020 FY2019 FY2020
GAAP R&D Operating Expense $14.6 $48.4 $56.9 $88.1
Stock-Based Compensation – ($37.0) ($0.1) ($37.0)
Amortization of Acquisition-Related
Intangible Assets ($0.1) ($0.1) ($0.2) ($0.4)
Non-GAAP R&D Operating Expense $14.5 $11.3 $56.6 $50.7

V E L O D Y N E L I D A R . C O M | 3 4
GAAP TO NON-GAAP OPERATING EXPENSE RECONCILIATION
SALES & MARKETING
($ in millions) Q4 2019 Q4 2020 FY2019 FY2020
GAAP Sales and Marketing Operating
Expense$5.9 $19.0 $21.9 $31.8
Stock-Based Compensation – ($14.8) – ($14.8)
Non-GAAP Sales and Marketing
Operating Expense$5.9 $4.2 $21.9 $17.0

V E L O D Y N E L I D A R . C O M | 3 5
GAAP TO NON-GAAP OPERATING EXPENSE RECONCILIATION
GENERAL & ADMINISTRATIVE
($ in millions) Q4 2019 Q4 2020 FY2019 FY2020
GAAP G&A Operating Expense $9.4 $38.8 $20.1 $65.7
Stock-Based Compensation – ($32.1) – ($32.3)
Write-Off of IPO Costs – – – ($3.5)
Legal Settlement ($2.5) ($0.1) ($2.5) ($2.6)
Non-GAAP G&A Operating Expense $7.0 $6.6 $17.6 $27.3

V E L O D Y N E L I D A R . C O M | 3 6
TRADITIONAL VISION SOLUTIONS ALONE HAVE SEVERE LIMITATIONS
Lack of precision at range
Poor object detection and recognition at range,
dangerous optical illusions
Localization: lack of mapping
Field of view: multiple sensors required
Poor performance at night, dawn and dusk
Poor performance in direct sunlight
Camera
High-Resolution Radar
Shortcomings

V E L O D Y N E L I D A R . C O M | 3 7
VELODYNE OFFERS MULTIPLE LIDAR ARCHITECTURES
Each Of Our Products Is Built With Solid State Lidar
HDL-64E HDL-32E VLP-16
(Puck
Series)
VLS-128
(Alpha
Prime)
S U R R O U N D
Long-range directional vision
Subtle vehicle integration
Robust solution for mass
adoption
Announced Future Product
D I R E C T I O N AL
Velarray Velabit
Ultrawide field-of-view for near-
range perception
Excellent resolution and point
density
Tailored to blind spot monitoring
Announced Future Product
H E M I S P H E R I C AL
Veladome
Sees 360-degrees around the
vehicle simultaneously
Best-in-class distance perception
Broad portfolio offering

V E L O D Y N E L I D A R . C O M | 3 8
KEY TECHNOLOGIES FOR SMART VISION
EMBEDDED SOFTWARE & ALGORITHMS
CUSTOM ASICS
• Converts Unstructured Data to
Structured Data
• Maintains High Accuracy Across
Operating Conditions
• Enables Advanced Levels of
Functionality
MICRO-LIDAR ARRAYS
• Enables
Miniaturization of Lidar
• Automotive-Grade
Qualified
• Proprietary ASIC Designs
• Lidar-Specific Data
Converters
• Enhanced Range and
Power Efficiency
(1)
(1)
(1)
ADVANCED MANUFACTURING
• Design for Manufacturing
• Precision Alignment
Techniques
• Calibration
Methodologies
____________________
(1) U.S. patent portfolio as of June 30, 2020.
21 Issued Patents
4 Allowed Patents
55 Pending Patents
V E L O D Y N E L I D A R . C O M | 3 9
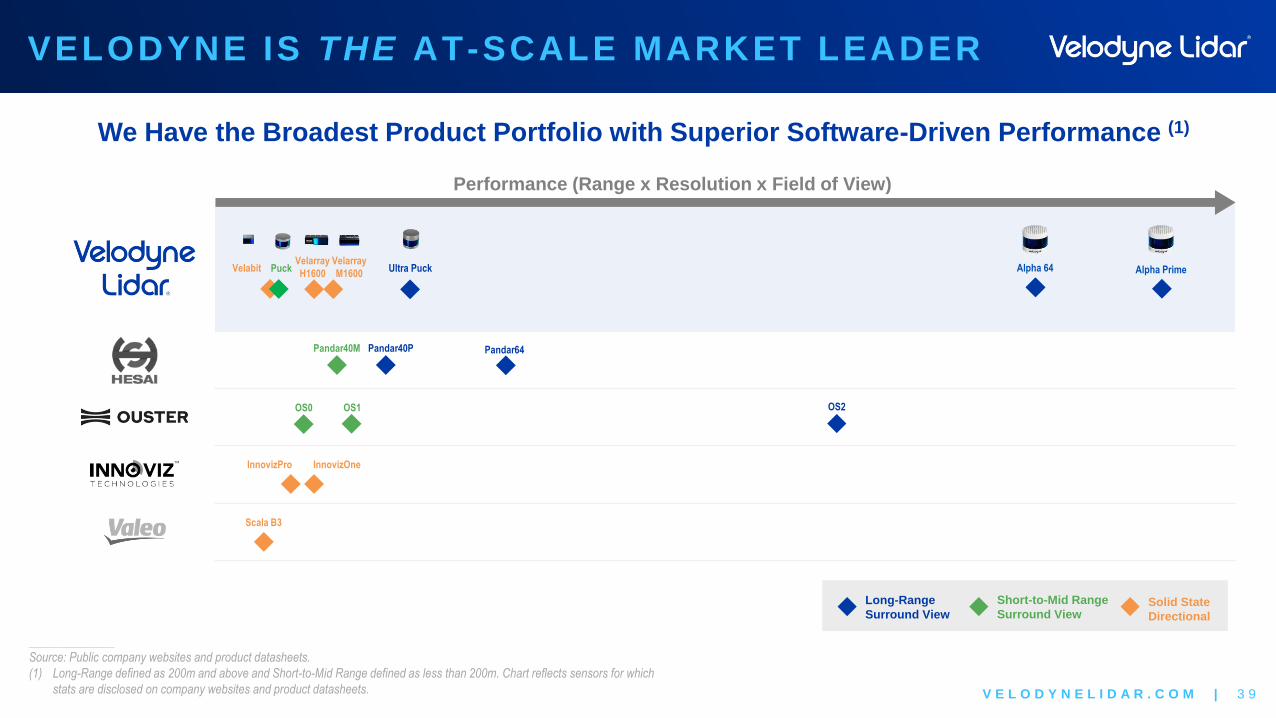
VELODYNE IS THE AT-SCALE MARKET LEADER
____________________
Source: Public company websites and product datasheets.
(1) Long-Range defined as 200m and above and Short-to-Mid Range defined as less than 200m. Chart reflects sensors for which
stats are disclosed on company websites and product datasheets.
Performance (Range x Resolution x Field of View)
We Have the Broadest Product Portfolio with Superior Software-Driven Performance (1)
Alpha PrimeUltra PuckVelabit Alpha 64
Pandar40P Pandar64Pandar40M
OS0 OS1 OS2
InnovizPro InnovizOne
Scala B3
Velarray
M1600Puck
Velarray
H1600
Long-Range
Surround View
Short-to-Mid Range
Surround ViewSolid State
Directional

V E L O D Y N E L I D A R . C O M | 4 0
WHY MAJORITY OF VELODYNE PRODUCTS ARE 905NM
905nm (pulsed) 1550nm (pulsed)
Absorption in
AtmosphereLow At least 2-4 times worse in rain
Detector TechnologyStandard silicon detectors
Very high sensitivity
Expensive InGaAs Detectors
Low sensitivity
Lasers Can use low cost, solid state lasers
Fiber laser needed to achieve high laser power to
overcome atmospheric absorption and worse
detectors
Eye SafetyLower eye safety margin but can be made eye
safe
Higher eye safety margin but use of higher power
laser poses a threat to eye safety
Supply Chain MaturityMature components available from multiple
suppliers
InGaAs detectors without multiple suppliers.
Fiber lasers expensive and not widely available in
automotive grade.
MiniaturizationDue to the use of only solid state components,
amenable to significant miniaturization
Fiber laser will always require a separate laser
source that is actively cooled and placed in a
different location such as vehicle trunk

V E L O D Y N E L I D A R . C O M | 4 1
SALES FOOTPRINT
Direct Sales / Service
Reselling Partner /
Integrator