Embed Size (px)
Citation preview

Fourth Quarter 2016 Conference Call
February 8, 2017

Forward-Looking Statements
Certain information contained in this presentation constitutes forward-looking statements for purposes of the safe
harbor provisions of The Private Securities Litigation Reform Act of 1995. There are a variety of factors, many of which
are beyond our control, that affect our operations, performance, business strategy and results and could cause our
actual results and experience to differ materially from the assumptions, expectations and objectives expressed in any
forward-looking statements. These factors include, but are not limited to: our ability to implement successfully our
strategic initiatives; actions and initiatives taken by both current and potential competitors; increases in the prices paid
for raw materials and energy; a labor strike, work stoppage or other similar event; foreign currency translation and
transaction risks; deteriorating economic conditions or an inability to access capital markets; work stoppages, financial
difficulties or supply disruptions at our suppliers or customers; the adequacy of our capital expenditures; our failure to
comply with a material covenant in our debt obligations; potential adverse consequences of litigation involving the
company; as well as the effects of more general factors such as changes in general market, economic or political
conditions or in legislation, regulation or public policy. Additional factors are discussed in our filings with the Securities
and Exchange Commission, including our annual report on Form 10-K, quarterly reports on Form 10-Q and current
reports on Form 8-K. In addition, any forward-looking statements represent our estimates only as of today and should
not be relied upon as representing our estimates as of any subsequent date. While we may elect to update forward-
looking statements at some point in the future, we specifically disclaim any obligation to do so, even if our estimates
change.
2
Highlights
(a) See Segment Operating Income and Margin reconciliation in Appendix on page 43. Excludes a $24 million unfavorable out of period adjustment related to
intracompany profit elimination in the Americas, primarily related to years 2012 through 2015 with the majority attributable to 2012
(b) See 2016 Adjusted Diluted Earnings Per Share reconciliation in Appendix on page 36.
• 2016 segment operating income (SOI) within range of $2,000 to
$2,025 million guidance (a)
• Full year adjusted earnings per share of $4.00 (b), up 20%
• Americas full-year earnings of $1,151 million, 14.1% operating margin
• Europe, Middle East and Africa full-year earnings of $461 million,
9.4% operating margin
• Asia Pacific sets full-year earnings record of $373 million,
17.7% operating margin
• Share repurchase authorization increased by $1.0 billion
3

Proven ability to drive performance improvement … results reflect our progress
Our Journey
(a) For information on our use of non-GAAP financial measures, including forward-looking non-GAAP financial measures, see the Appendix at page 33. See Segment Operating Income and
Margin reconciliation in Appendix on page 43. 2010 through 2012 have not been restated for the Americas consolidation.
(b) Core Segment Operating Income is Total Segment Operating Income excluding the operating income from our Venezuelan subsidiary which was deconsolidated on December 31, 2015.
(c) See Adjusted Diluted Earnings Per Share reconciliation in Appendix on pages 36 through 42.4
$0.9
$1.4$1.2
$1.6$1.7
$1.9$2.0
2010 2011 2012 2013 2014 2015 2016
Segment Operating Income
Core SOI(b)
(a)
Terms: US$ billions
$2.0
Our Progress
Reduced structural cost
• Pension and footprint
Reduced operating cost
• Net cost savings
Profitable growth
• Not chasing volume for volume’s sake; but right tires, right mix
$0.52
$1.87 $1.92
$2.63$2.83
$3.32
$4.00
2010 2011 2012 2013 2014 2015 2016
Full Year Operating EPS(c)
Terms: Earnings Per Share
$4.00

Fourth Quarter 2016
Income Statement
(a) See Segment Operating Income and Margin reconciliation in Appendix on page 43.
(b) See Adjusted Diluted Earnings Per Share reconciliation in Appendix on pages 34 and 35.
(c) See Appendix on page 28.5
Terms: US$ millions(except EPS)
+5%
excluding
Venezuela(c)
December 31, December 31,2016 2015 Change
Units 41.1 42.1 (2)%
Net Sales 3,741$ 4,063$ (8)%
Gross Margin 27.2% 24.4% 2.8 pts
SAG 600$ 725$ (17)%
Segment Operating Income(a) 479$ 480$ (0)%
Segment Operating Margin(a) 12.8% 11.8% 1.0 pts
Goodyear Net Income (Loss) 561$ (380)$
Goodyear Net Income (Loss) Per Share
Weighted Average Shares Outstanding 258 269
Basic 2.17$ (1.42)$
Weighted Average Shares Outstanding - Diluted 262 269
Diluted 2.14$ (1.42)$
Cash Dividends Declared Per Common Share -$ 0.07$
Adjusted Diluted Earnings Per Share (b) 0.95$ 0.93$
Three Months Ended

Fourth Quarter 2016
Segment Operating Results
(a) Core Segment Operating Income is Total Segment Operating Income excluding the operating income from our Venezuelan subsidiary which was deconsolidated on December 31, 2015.
(b) Raw material variance of $18 million excludes raw material cost saving measures of $43 million, which are included in Cost Savings.
(c) Estimated impact of inflation (wages, utilities, energy, transportation and other).
(d) Includes the favorable impact of incentive compensation and advertising.
6
Q4
2015
Total
SOI
Q4
2015
Core
SOI(a)
Q4
2016
SOI
VenezuelaVolume
Unabsorbed
Fixed Cost
Raw
Materials(b)
Price/Mix Cost
Savings
Inflation(c) Currency Other(d)
Total Volume Impact Net P/M vs Raws Net Cost Savings
$480 ($22)($19)
$479
$563($27) $18 ($66)
$120 ($37)
($3)
$35
Terms: US$ millions
($46) ($48) $83
$458
+5%
Sequential price / mix stable;
decline driven by lower raw
material benefit
Fourth Quarter 2016
Balance Sheet
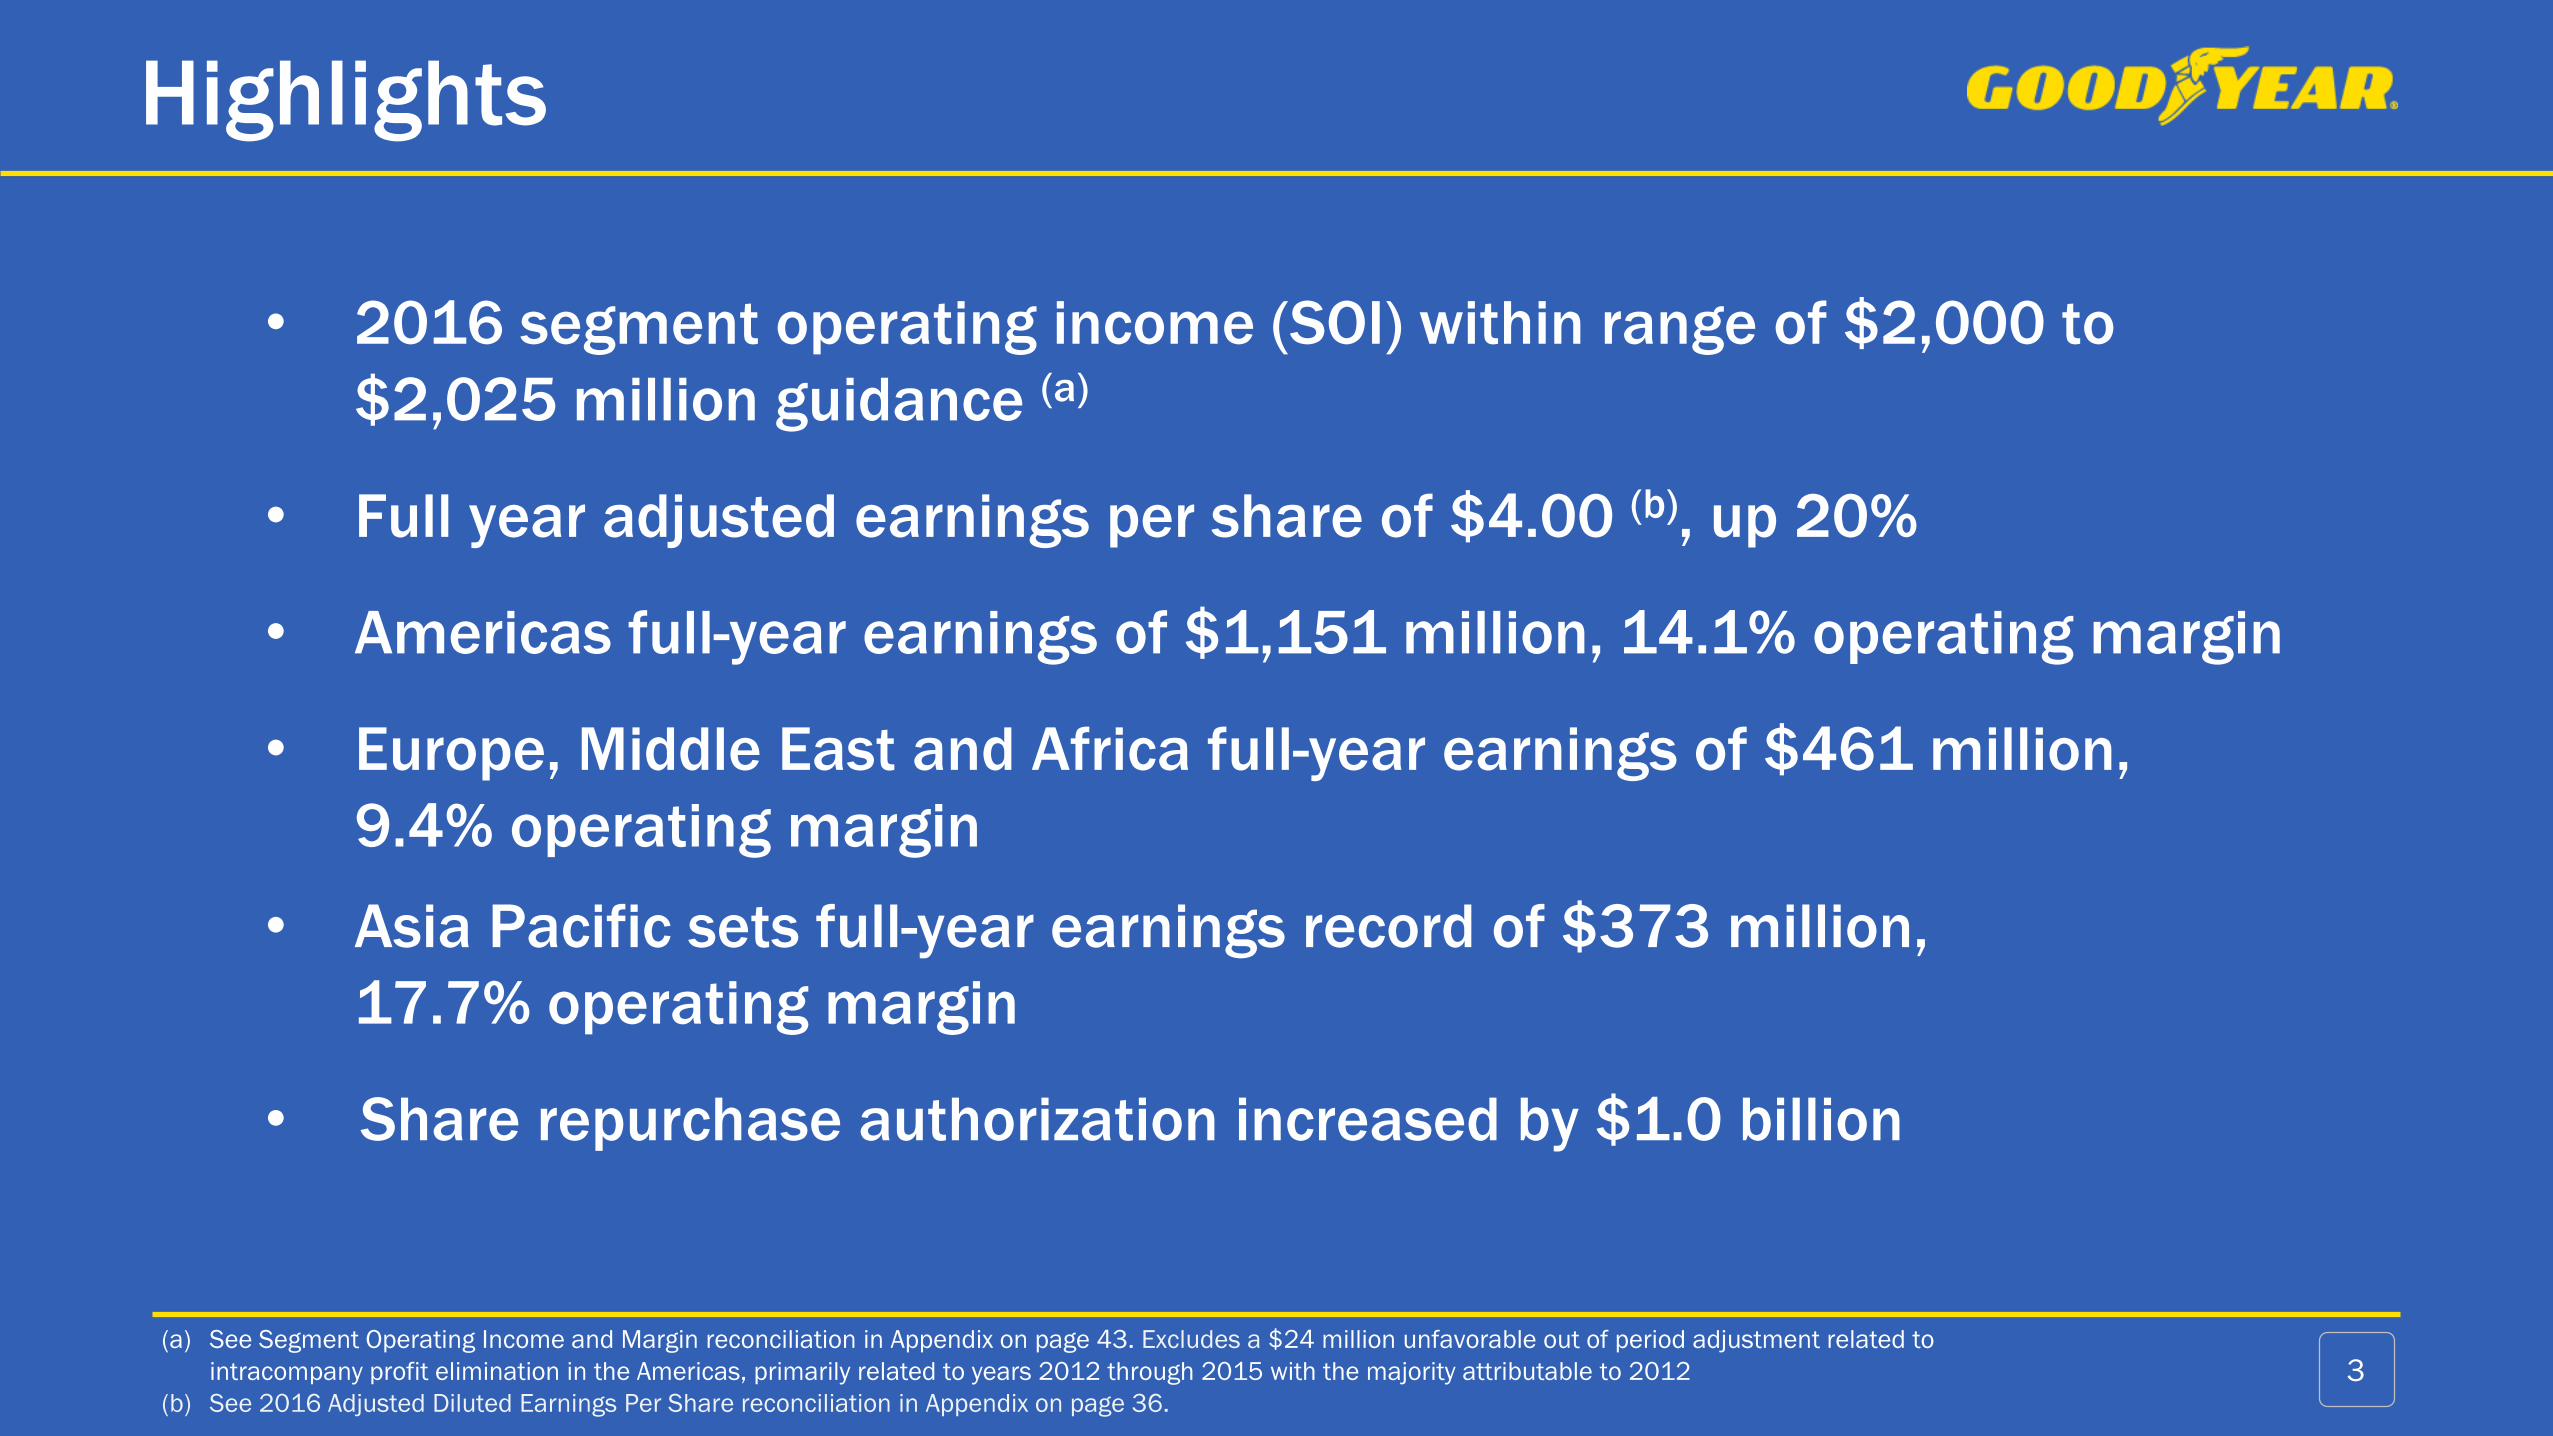
(a) Working capital represents accounts receivable and inventories, less accounts payable – trade.
(b) See Total Debt and Net Debt reconciliation in Appendix on page 44.
(c) See EBITDAP, Adjusted Debt and leverage ratio reconciliations in Appendix on page 45.
7
Terms: US$ millionsDecember 31, September 30, December 31,
2016 2016 2015
Cash and Cash equivalents 1,132$ 975$ 1,476$
Accounts receivable 1,769 2,649 2,033
Inventories 2,627 2,754 2,464
Accounts payable - trade (2,589) (2,600) (2,769)
Working capital(a)
1,807$ 2,803$ 1,728$
Total debt(b)
5,479$ 6,028$ 5,708$
Net debt(b)
4,347$ 5,053$ 4,232$
Memo:
Net Global Unfunded Pension Liability 669$ 642$
Adjusted Debt / EBITDAP(c)
2.39x 2.54x

Fourth Quarter 2016
Free Cash Flow from Operations
(a) Other includes amortization and write-off of debt issuance costs, net pension curtailments and settlements, net (gains) losses on asset sales, compensation and benefits less pension
expense, other current liabilities, and other assets and liabilities.
(b) See Free Cash Flow from Operations reconciliation in Appendix on page 46.8
Terms: US$ millionsTrailing Twelve
Months Ended
2016 2015 December 31, 2016
Net Income (Loss) 567$ (373)$ 1,284$
Depreciation and Amortization 191 176 727
Change in Working Capital 833 666 (117)
Pension Expense 17 27 71
Provision for Deferred Income Taxes (260) (186) (229)
Capital Expenditures (285) (327) (996)
Loss on Deconsolidation of Venezuelan Subsidiary - 646 -
Net Rationalization Charges 16 32 210
Other(a)
(61) 129 (267)
Free Cash Flow from Operations (non-GAAP)(b) 1,018$ 790$ 683$
Cash Flow from Operating Activities (GAAP) 1,267$ 1,052$ 1,504$
Cash Flow from Investing Activities (GAAP) (266)$ (588)$ (973)$
Cash Flow from Financing Activities (GAAP) (804)$ (679)$ (860)$
Three Months Ended
December 31,
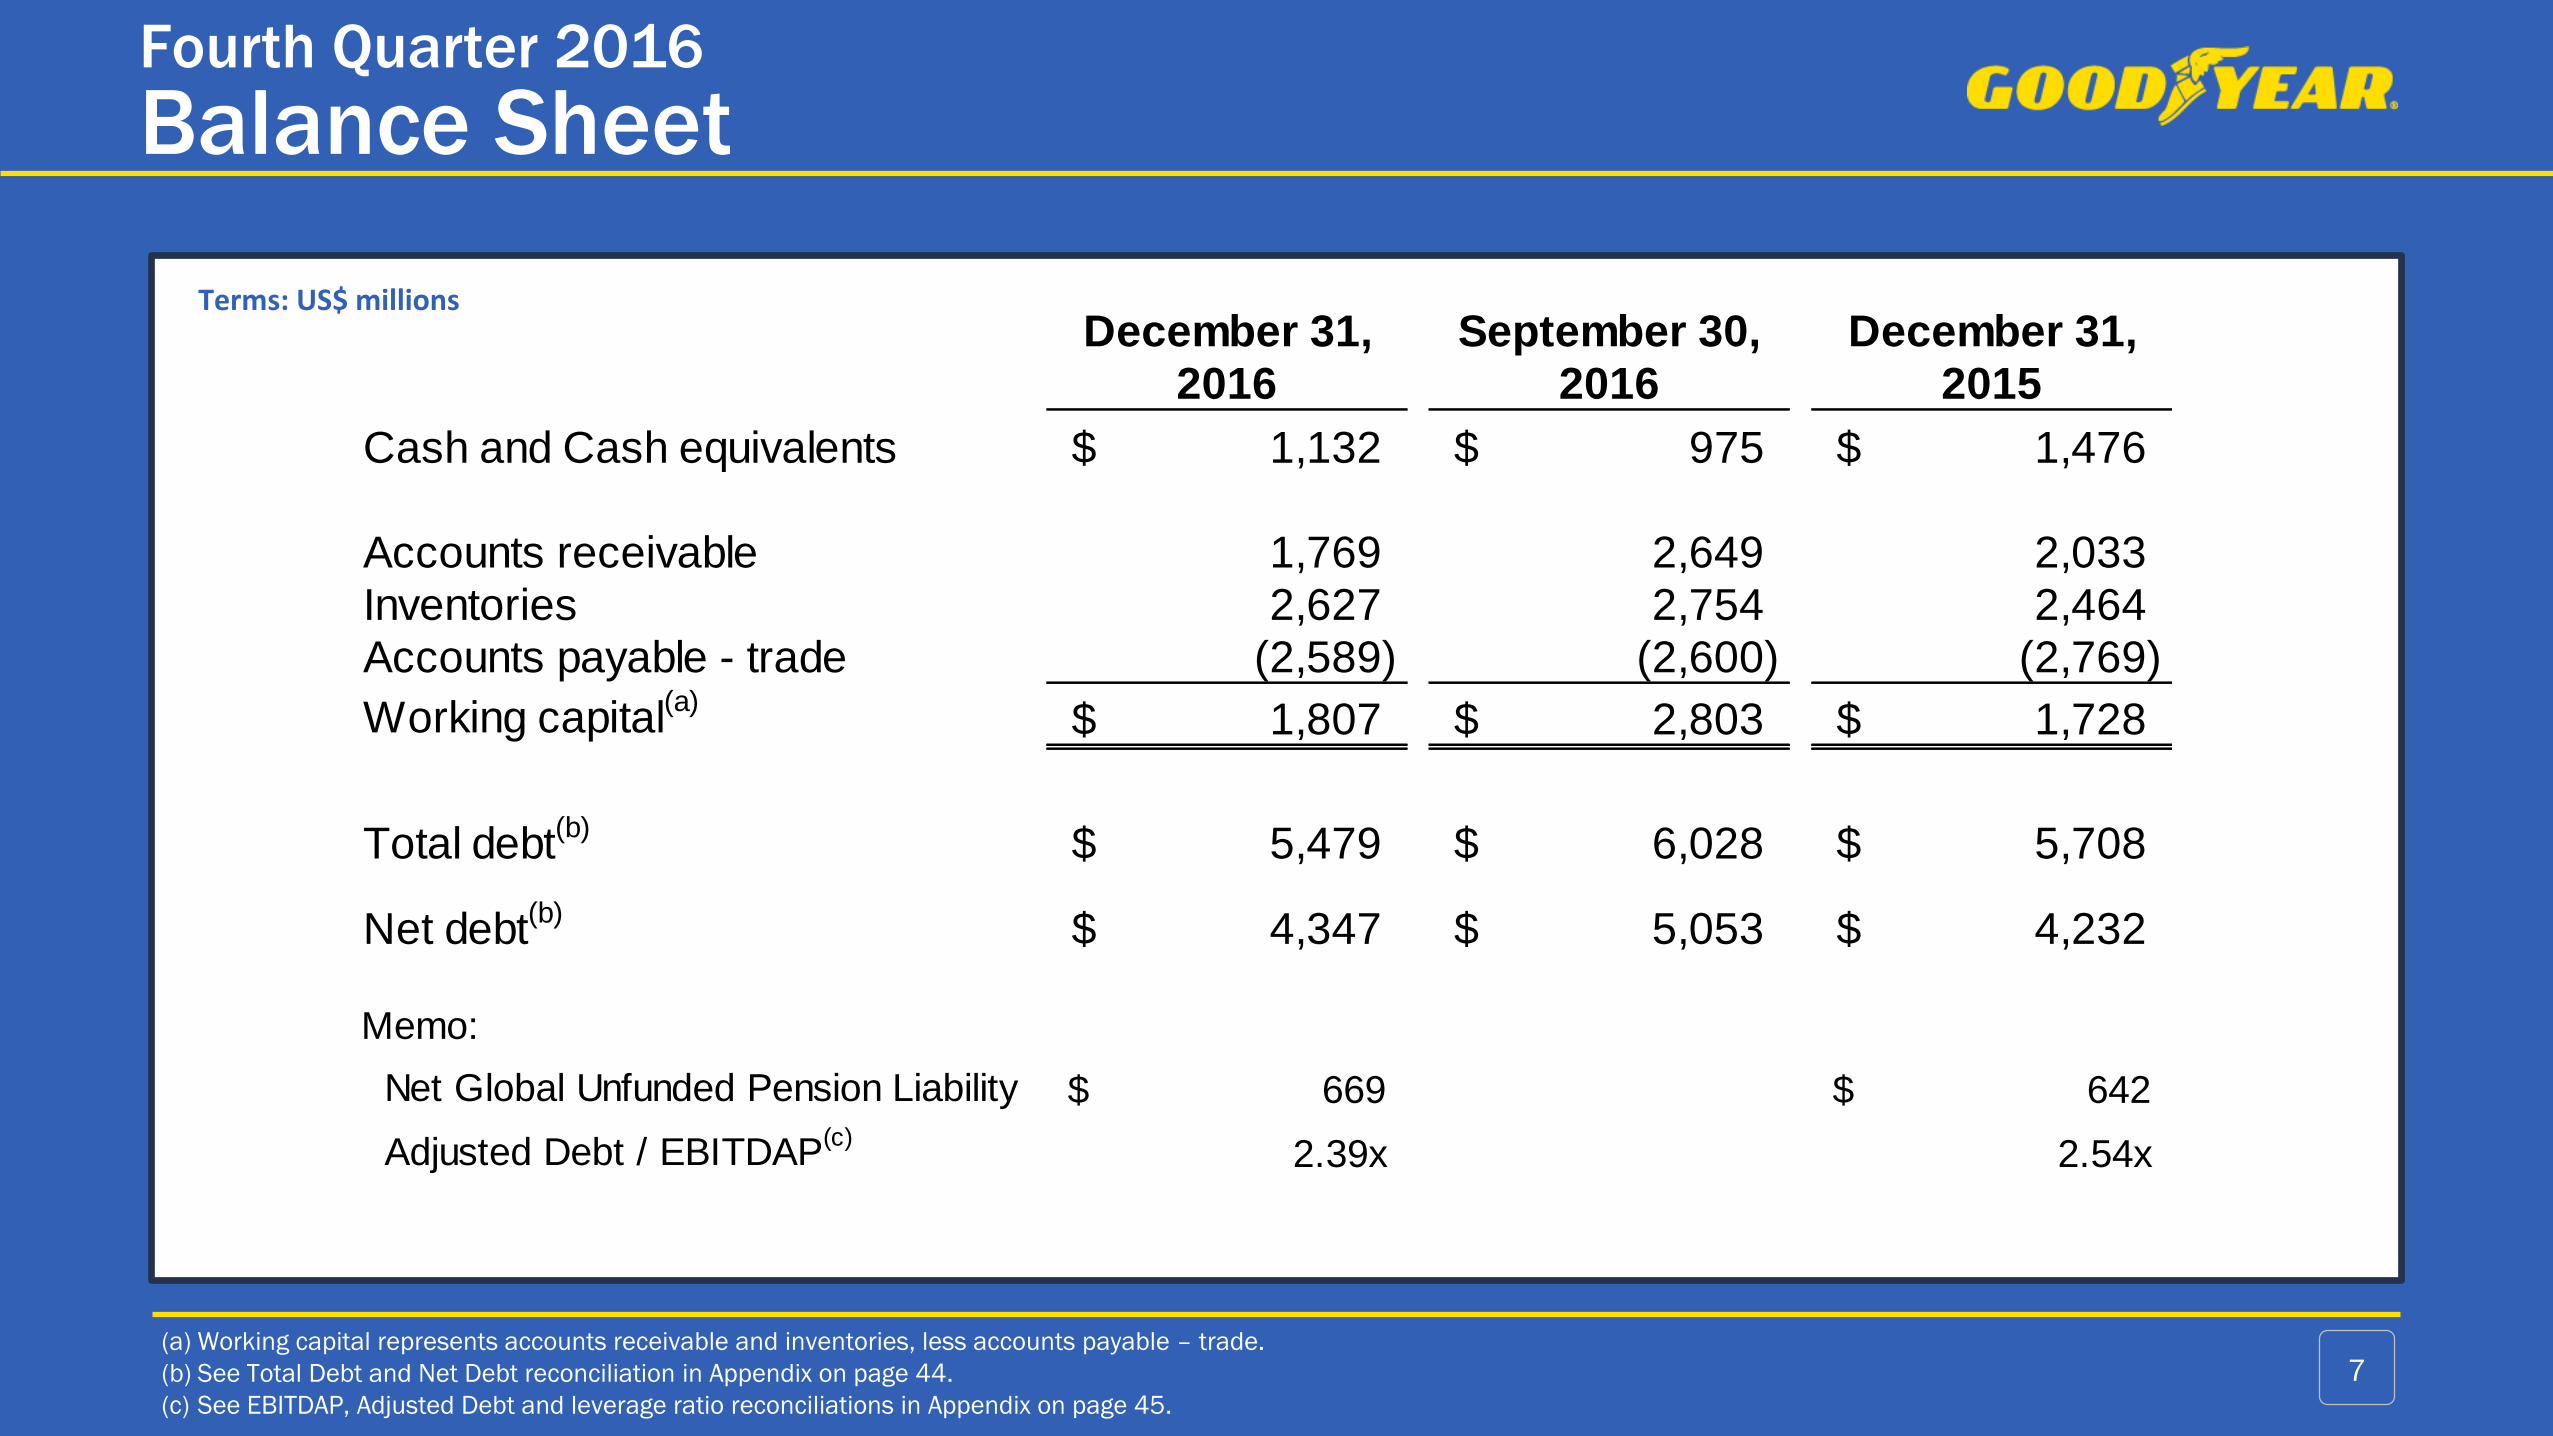
Fourth Quarter 2016 - Segment Results
Americas
• Operating income growth of
$33 million excluding Venezuela
• Strong performance in consumer
offsetting weakness in U.S.
commercial truck
• Volume impact driven by:
• Venezuela deconsolidation (0.3 million units)
• Consumer OE (0.3 million units)
• U.S. Commercial OE (0.2 million units)
9
Terms: US$ millionsUnits in millions
Fourth Quarter
2016 2015 Change
Units 18.7 19.6 (4.6%)
Net Sales $2,061 $2,313 (10.9%)
Operating
Income$295 $284 3.9%
Margin 14.3% 12.3%+13%
excluding
Venezuela

Fourth Quarter 2016 - Segment Results
Europe, Middle East & Africa
• Continued growth in >17”
• Lower OE volume, driven by OE
selectivity and focus on >17”
• Consumer replacement up 1%;
>17” offsetting declines in <17”
• Lower price / mix related to raw
material indexed agreements
with OEMs
10
Terms: US$ millionsUnits in millions
Fourth Quarter
2016 2015 Change
Units 14.1 14.2 (0.7%)
Net Sales $1,132 $1,191 (5.0%)
Operating
Income$81 $100 (19.0%)
Margin 7.2% 8.4%
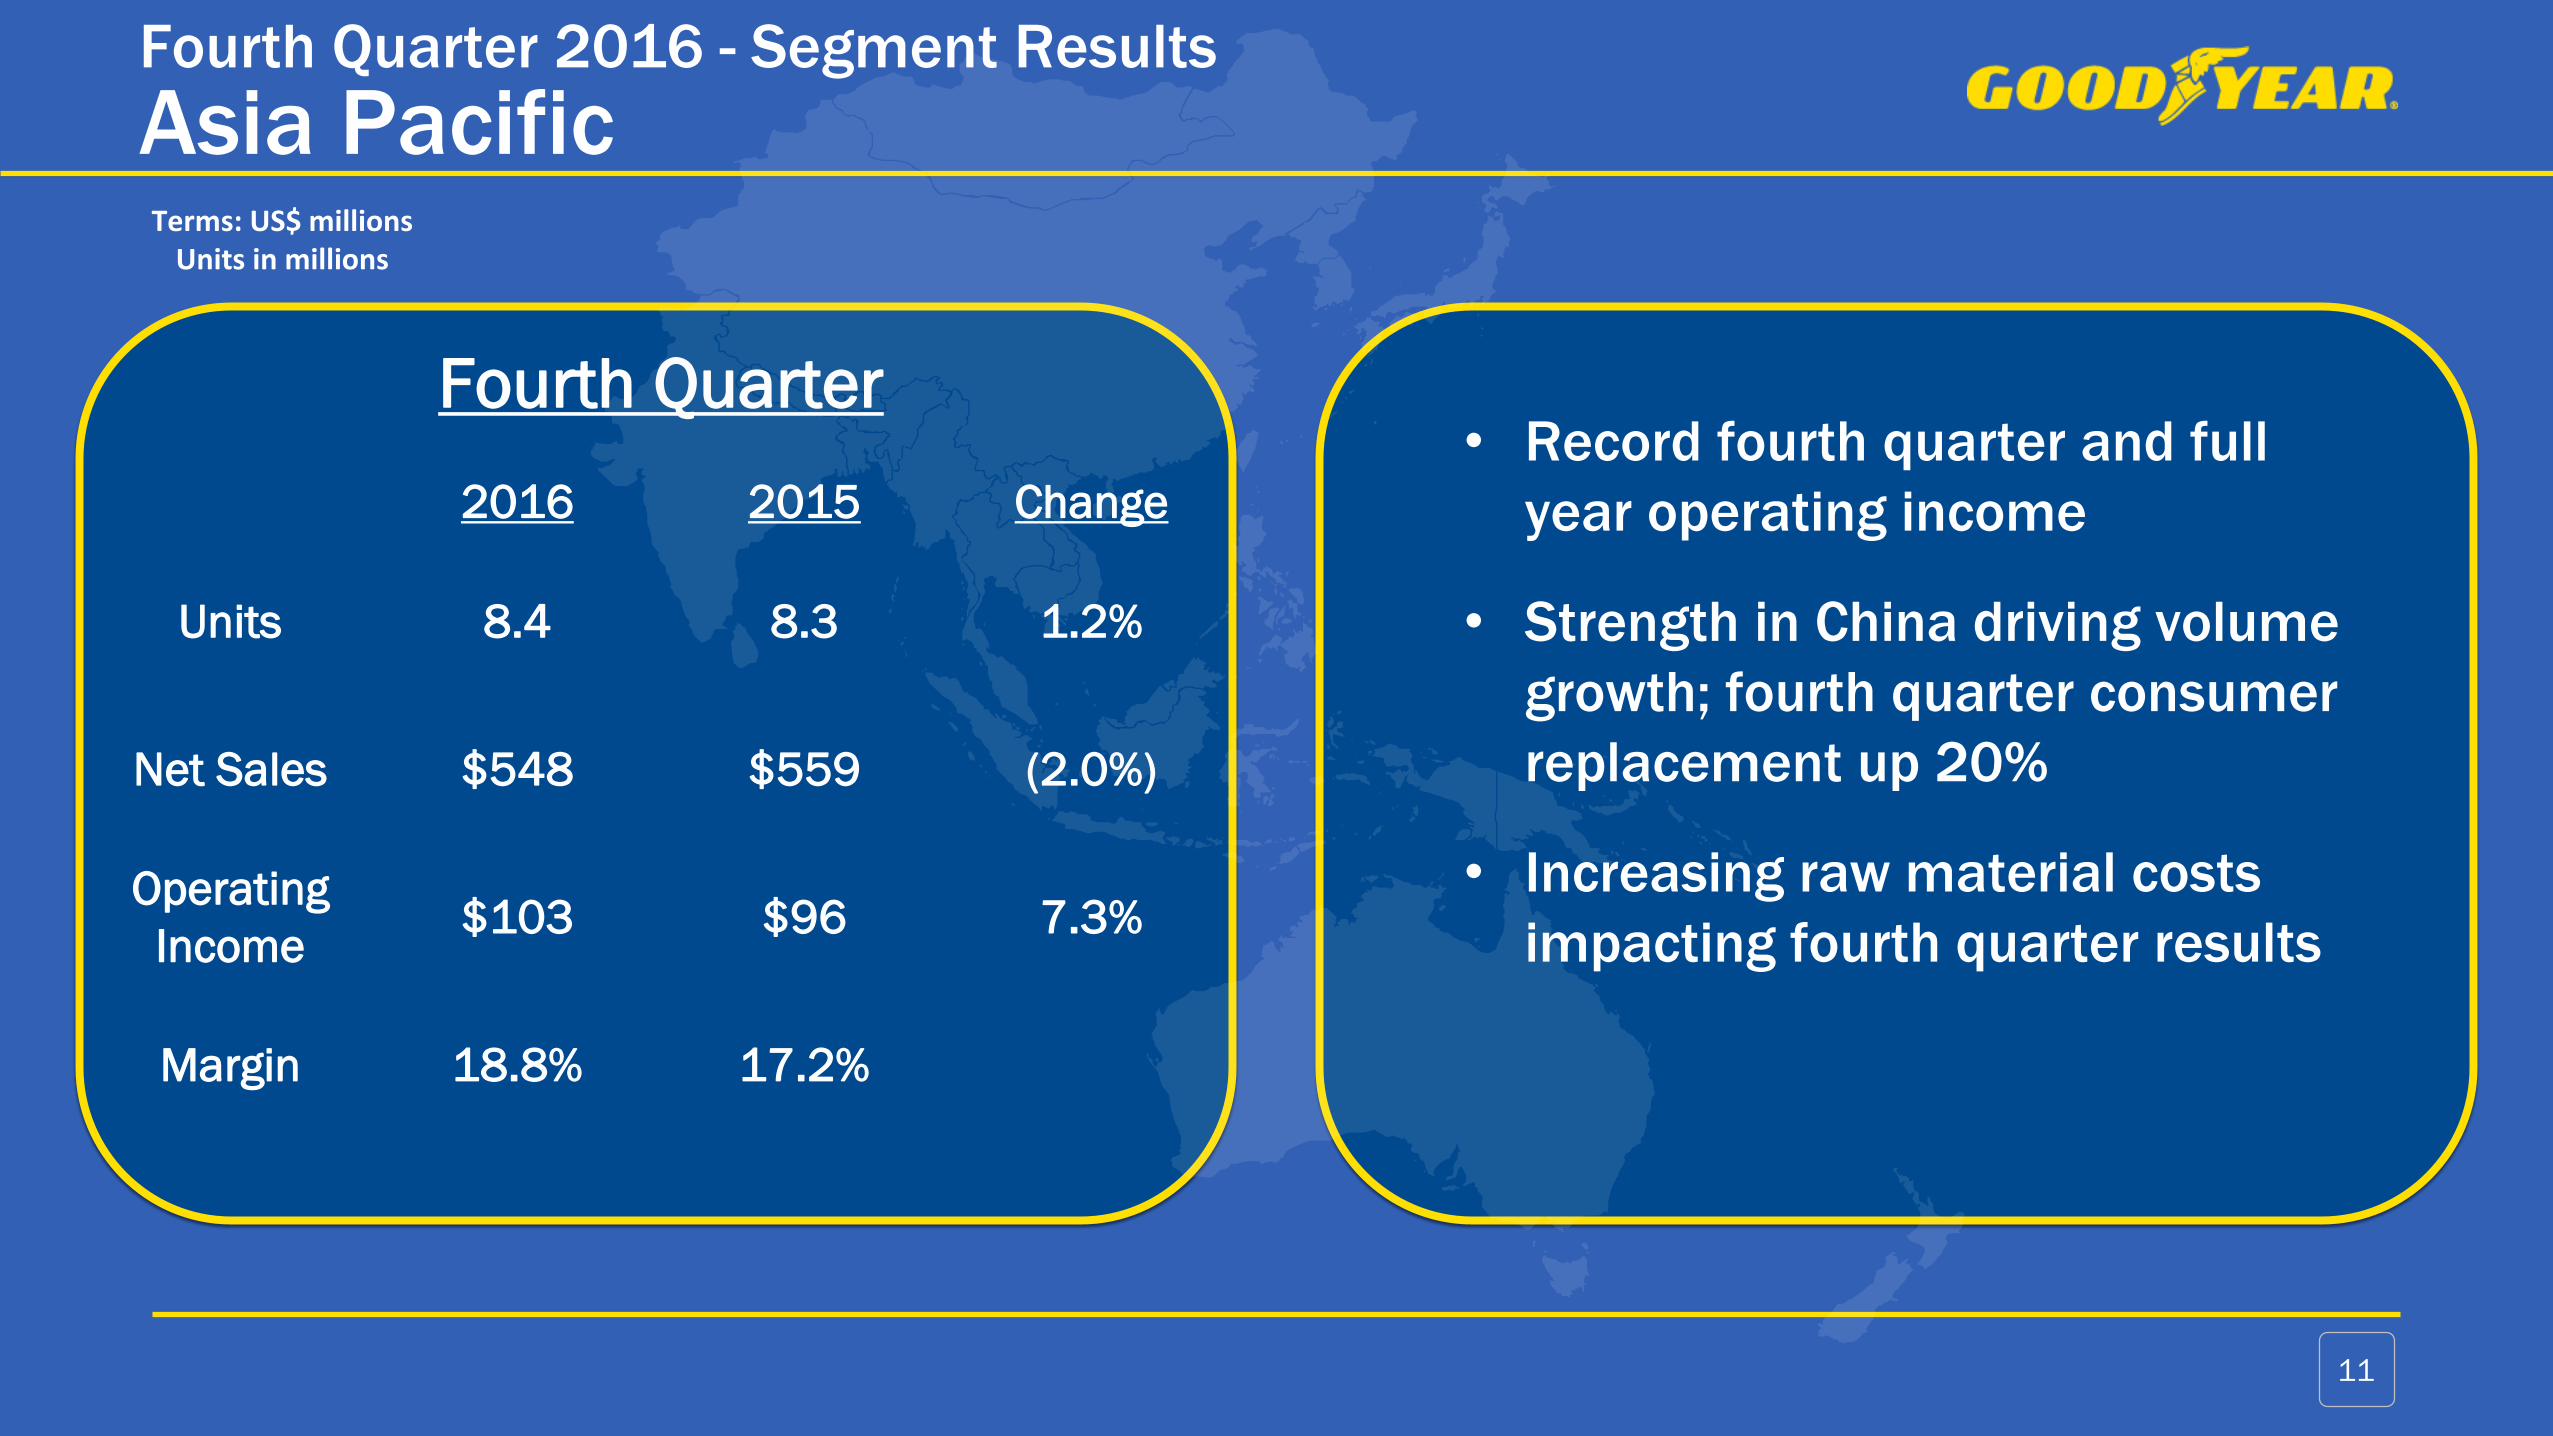
Fourth Quarter 2016 - Segment Results
Asia Pacific
• Record fourth quarter and full
year operating income
• Strength in China driving volume
growth; fourth quarter consumer
replacement up 20%
• Increasing raw material costs
impacting fourth quarter results
11
Terms: US$ millionsUnits in millions
Fourth Quarter
2016 2015 Change
Units 8.4 8.3 1.2%
Net Sales $548 $559 (2.0%)
Operating
Income$103 $96 7.3%
Margin 18.8% 17.2%

2017 Select >17” OE Fitment Wins
12
Americas
Cadillac CT6
Image Credit: Cadillac
Asia Pacific
Audi A4
Ford Super Duty
Image Credit Ford
Image Credit: Cadillac Image Credit: AudiImage Credit Nissan Image Credit BMW
Honda CRV
Image Credit: Honda
Jaguar F-Pace
Image Credit Jaguar
EMEA
BMW 5-Series

Raw Materials
Note: For more information regarding the composition of our raw material costs, see Appendix on page 31. 13
Rapid and dramatic increase in raw material cost driven by commodity inflation
Commodity
$2.7B
Non-
Commodity
$1.2B
2016 Raw Material Costs
CommodityInput costs where
price is set by market
Examples: Natural rubber,
butadiene, styrene, oil
Non-CommoditySupplier costs
Examples: Supplier
conversion costs,
margins,
transportation,
packaging
Nov 1
Spot Rates
Jan 11
Spot Rates
Feb 8
Spot Rates
~$0.4B
~$0.8B
~$1.1B
+27%
+20%
+10%
Q3 Earnings
Call
Detroit Auto
Conference
Q4 Earnings
Call
Raw Material Cost Increase
2017 vs 2016
Terms: $ millions

Price vs. Raws History
(a) Raw Materials are changes versus prior year and excludes raw material cost savings; all data excludes Venezuela. 14
Absolute margin dollars have been protected
during periods of rising & falling raw material costs
Note: This is price only;
excludes thebenefits of mix
Note: This is price only;
excludes thebenefits of mix
Q1
2010
Q4
2016Q1
2010
Q4
2016

U.S. Industry Fundamentals: >17”
(a) Source: Rubber Manufacturers Association 15
U.S. Consumer Replacement Industry
2016 vs 2015 Growth Rate(a)
• Non-members’ growth driven by weak
comparable in 2015
• Focus remains on growth in >17”
• Strong fundamentals in vehicle miles
traveled, gasoline prices and fuel
consumption
Q4 FY
RMA Members (>17”) 9% 9%
RMA Members (<17”) -8% -11%
Total 0% -1%
Non-Members 25% 18%
Total U.S. 4% 2%
Goodyear (>17”) 7% 9%

EMEA Industry Fundamentals: >17”
(a) Source: European Tyre & Rubber Manufacturer’s Association 16
• Continued growth in >17” segment
• Goodyear winter volume nearly
double the market in >17” for Q4,
FY
• Goodyear volume declines in <17”
driven by summer segment and
increased competition
Europool & Turkey Replacement Industry
2016 vs 2015 Growth Rate(a)
Q4 FY
ETRMA Members (>17”) 11% 10%
ETRMA Members (<17”) -1% -4%
Total 5% 2%
Non-Members 3% 3%
Total EU + Turkey 4% 2%
Goodyear (>17”) 19% 10%
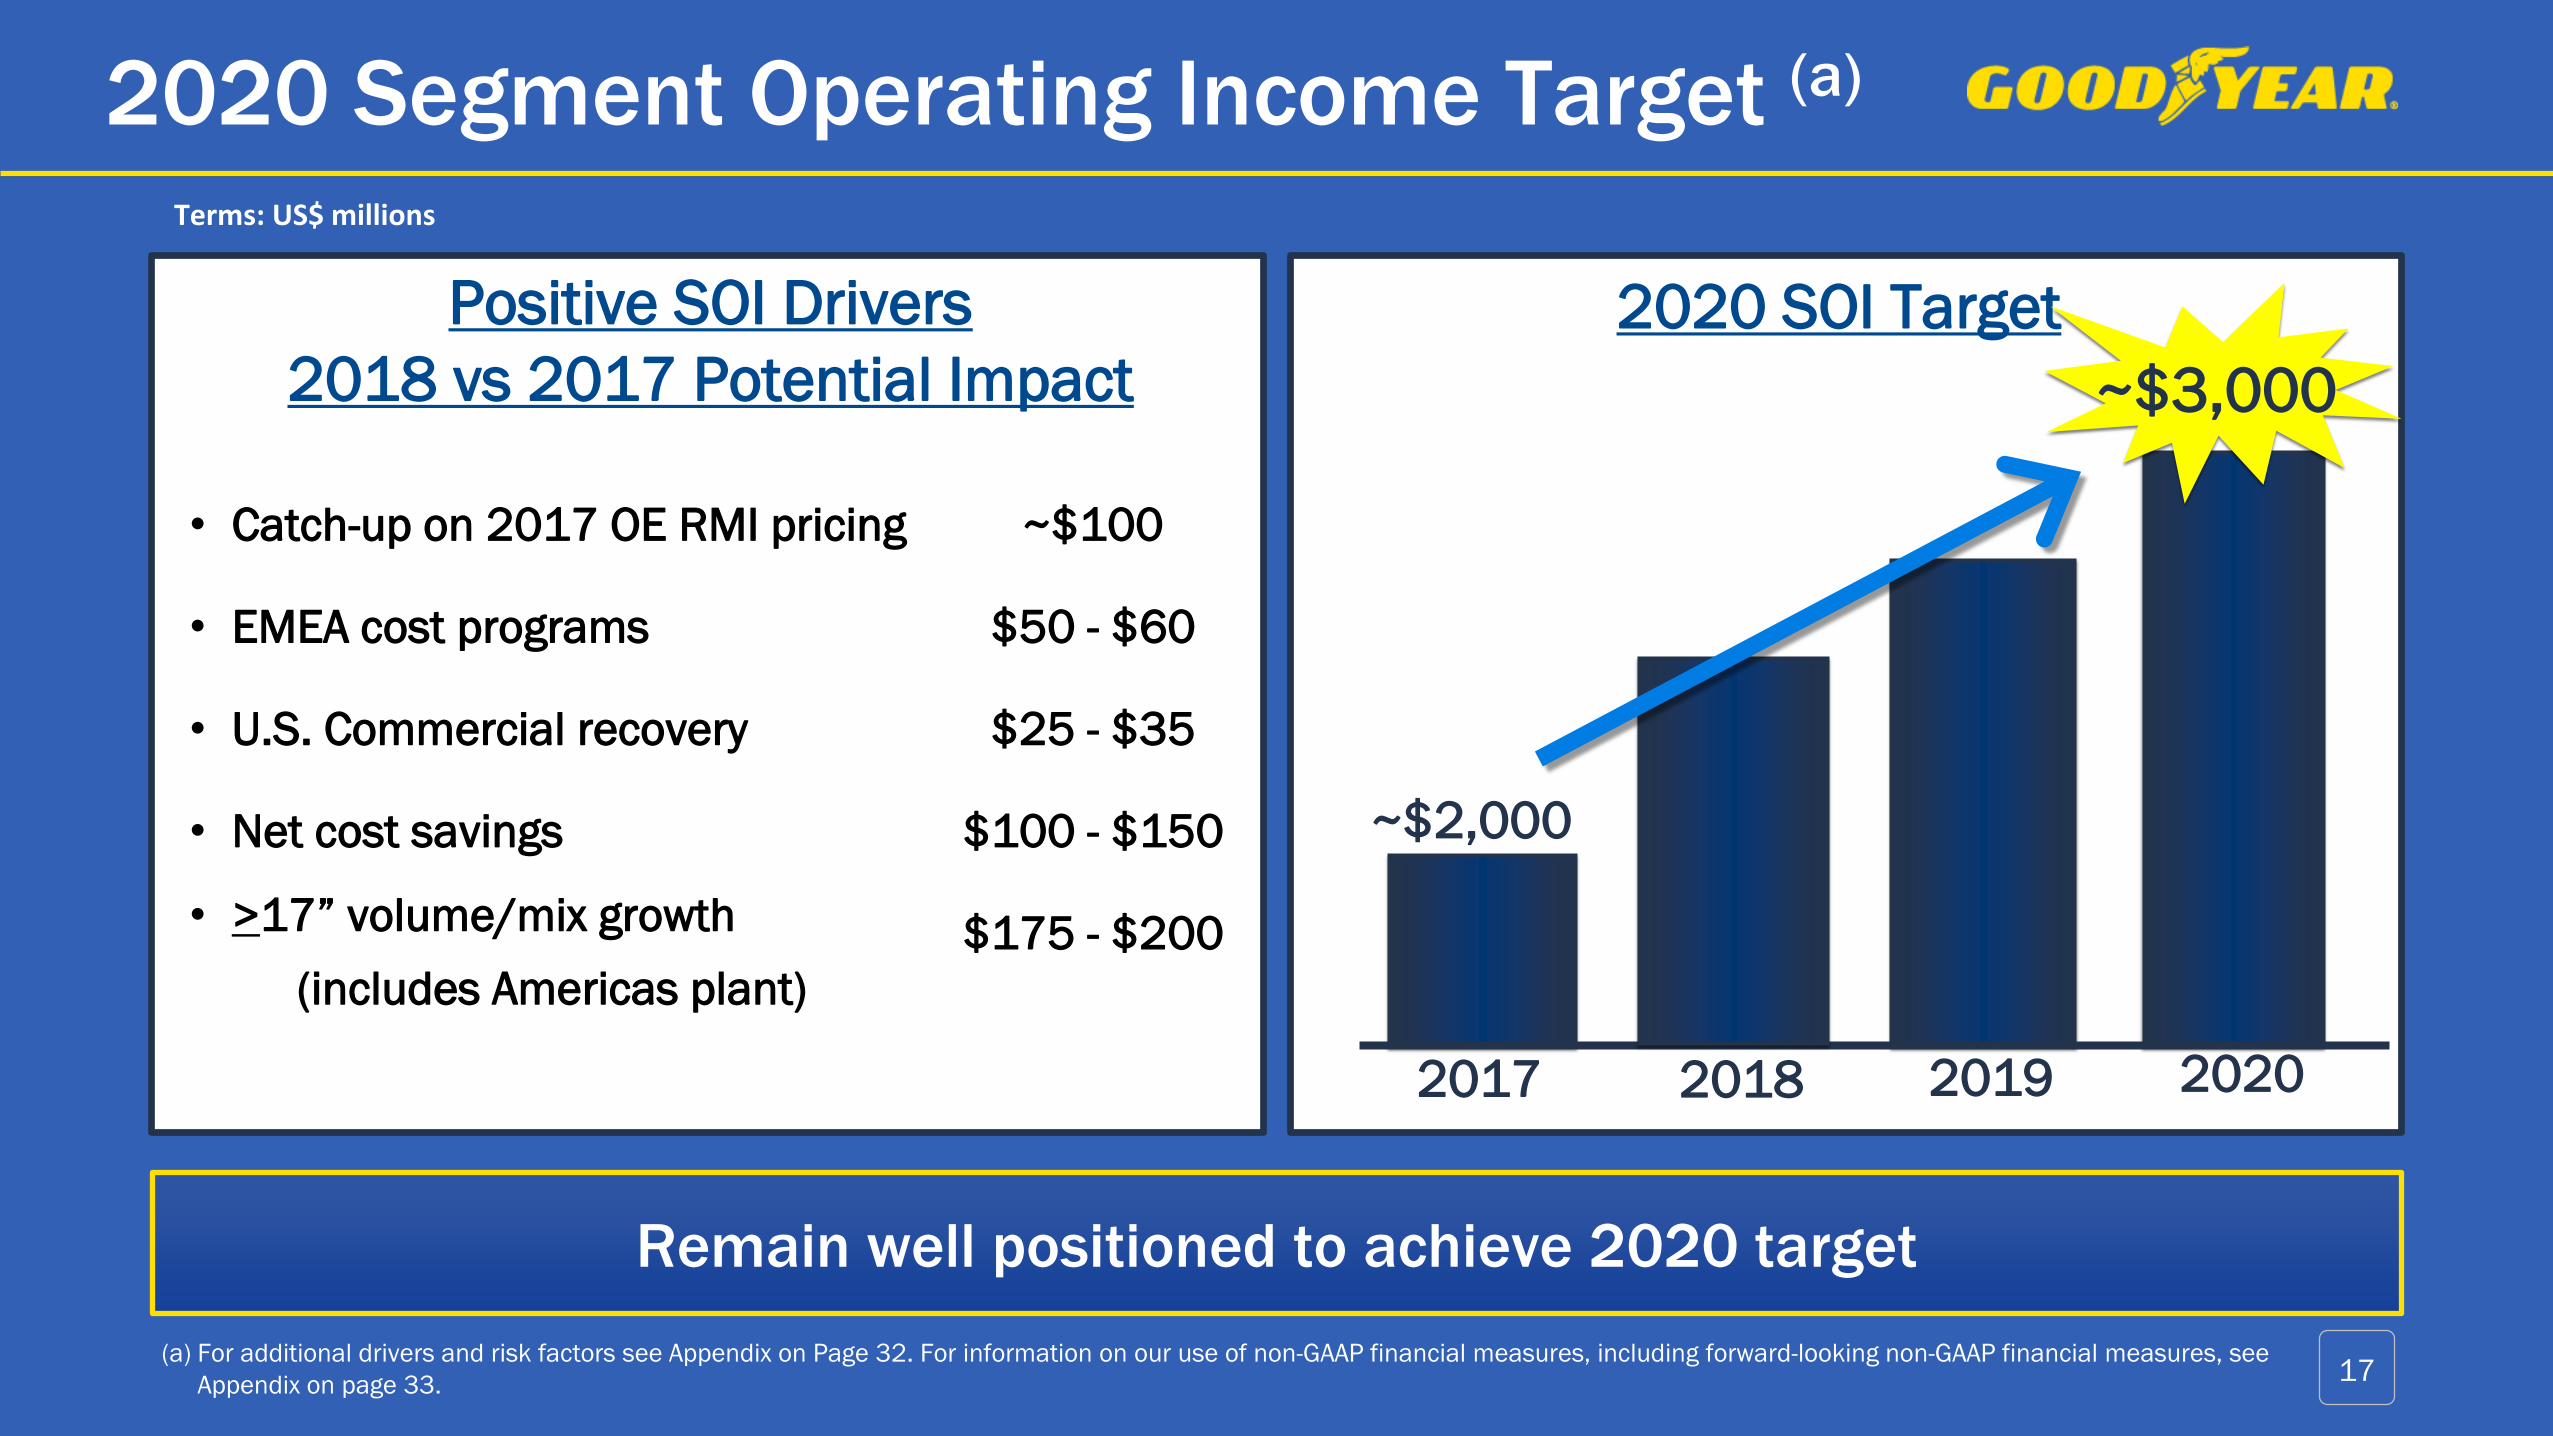
2020 Segment Operating Income Target (a)
(a) For additional drivers and risk factors see Appendix on Page 32. For information on our use of non-GAAP financial measures, including forward-looking non-GAAP financial measures, see
Appendix on page 33.17
Remain well positioned to achieve 2020 target
2017
2020 SOI Target
2018 2019 2020
~$2,000
~$3,000
Positive SOI Drivers
2018 vs 2017 Potential Impact
• Catch-up on 2017 OE RMI pricing
• EMEA cost programs
• U.S. Commercial recovery
• Net cost savings
• >17” volume/mix growth
(includes Americas plant)
Terms: US$ millions
~$100
$50 - $60
$25 - $35
$100 - $150
$175 - $200

Strong second half sets stage for 2018
2017 SOI Cadence
18
~ -10% ~ +10%
1st Half 2017 vs 2016 2nd Half 2017 vs 2016
-- Volume (driven by EMEA)
-- Unabsorbed Overhead
-- Unfavorable Price/Mix vs Raws (Timing)
-- Unfavorable Foreign Exchange
+ Cost Savings
-- Americas plant start-up costs
+ Volume
+ Unabsorbed Overhead
+ Favorable Price/Mix vs Raws
-- Unfavorable Foreign Exchange
+ Cost Savings
-- Americas plant start-up costs
(a) Based on current outlook. For full year 2017 drivers see page 19. For information on our use of non-GAAP financial measures, including forward-looking non-GAAP financial measures,
see Appendix on page 33.

Expect 2017 SOI ~$2.0 billion
2017 Key Segment Operating Income Drivers (a)
(a) Segment Operating Income in 2016 was $1,985 million. For information on our use of non-GAAP financial measures, including forward-looking non-GAAP financial measures, see
Appendix on page 33.
DriverCurrent Outlook
2017 vs 2016Comments
Global Volume ~1% Growth in >17” partially offset by declines in <17”
Net Price/Mix vs Raw
Materials~Flat
Raw material costs up ~$1.1 billion (+27%) at
current spot rates; price/mix to offset
Overhead Absorption ~($70) million Primarily first half
Cost Savings vs Inflation ~$140 million Continue to focus on operational excellence & SAG
Foreign Exchange ~($50) million Based on current spot rates
Other ~($50) million Americas plant start up costs, R&D and depreciation
19
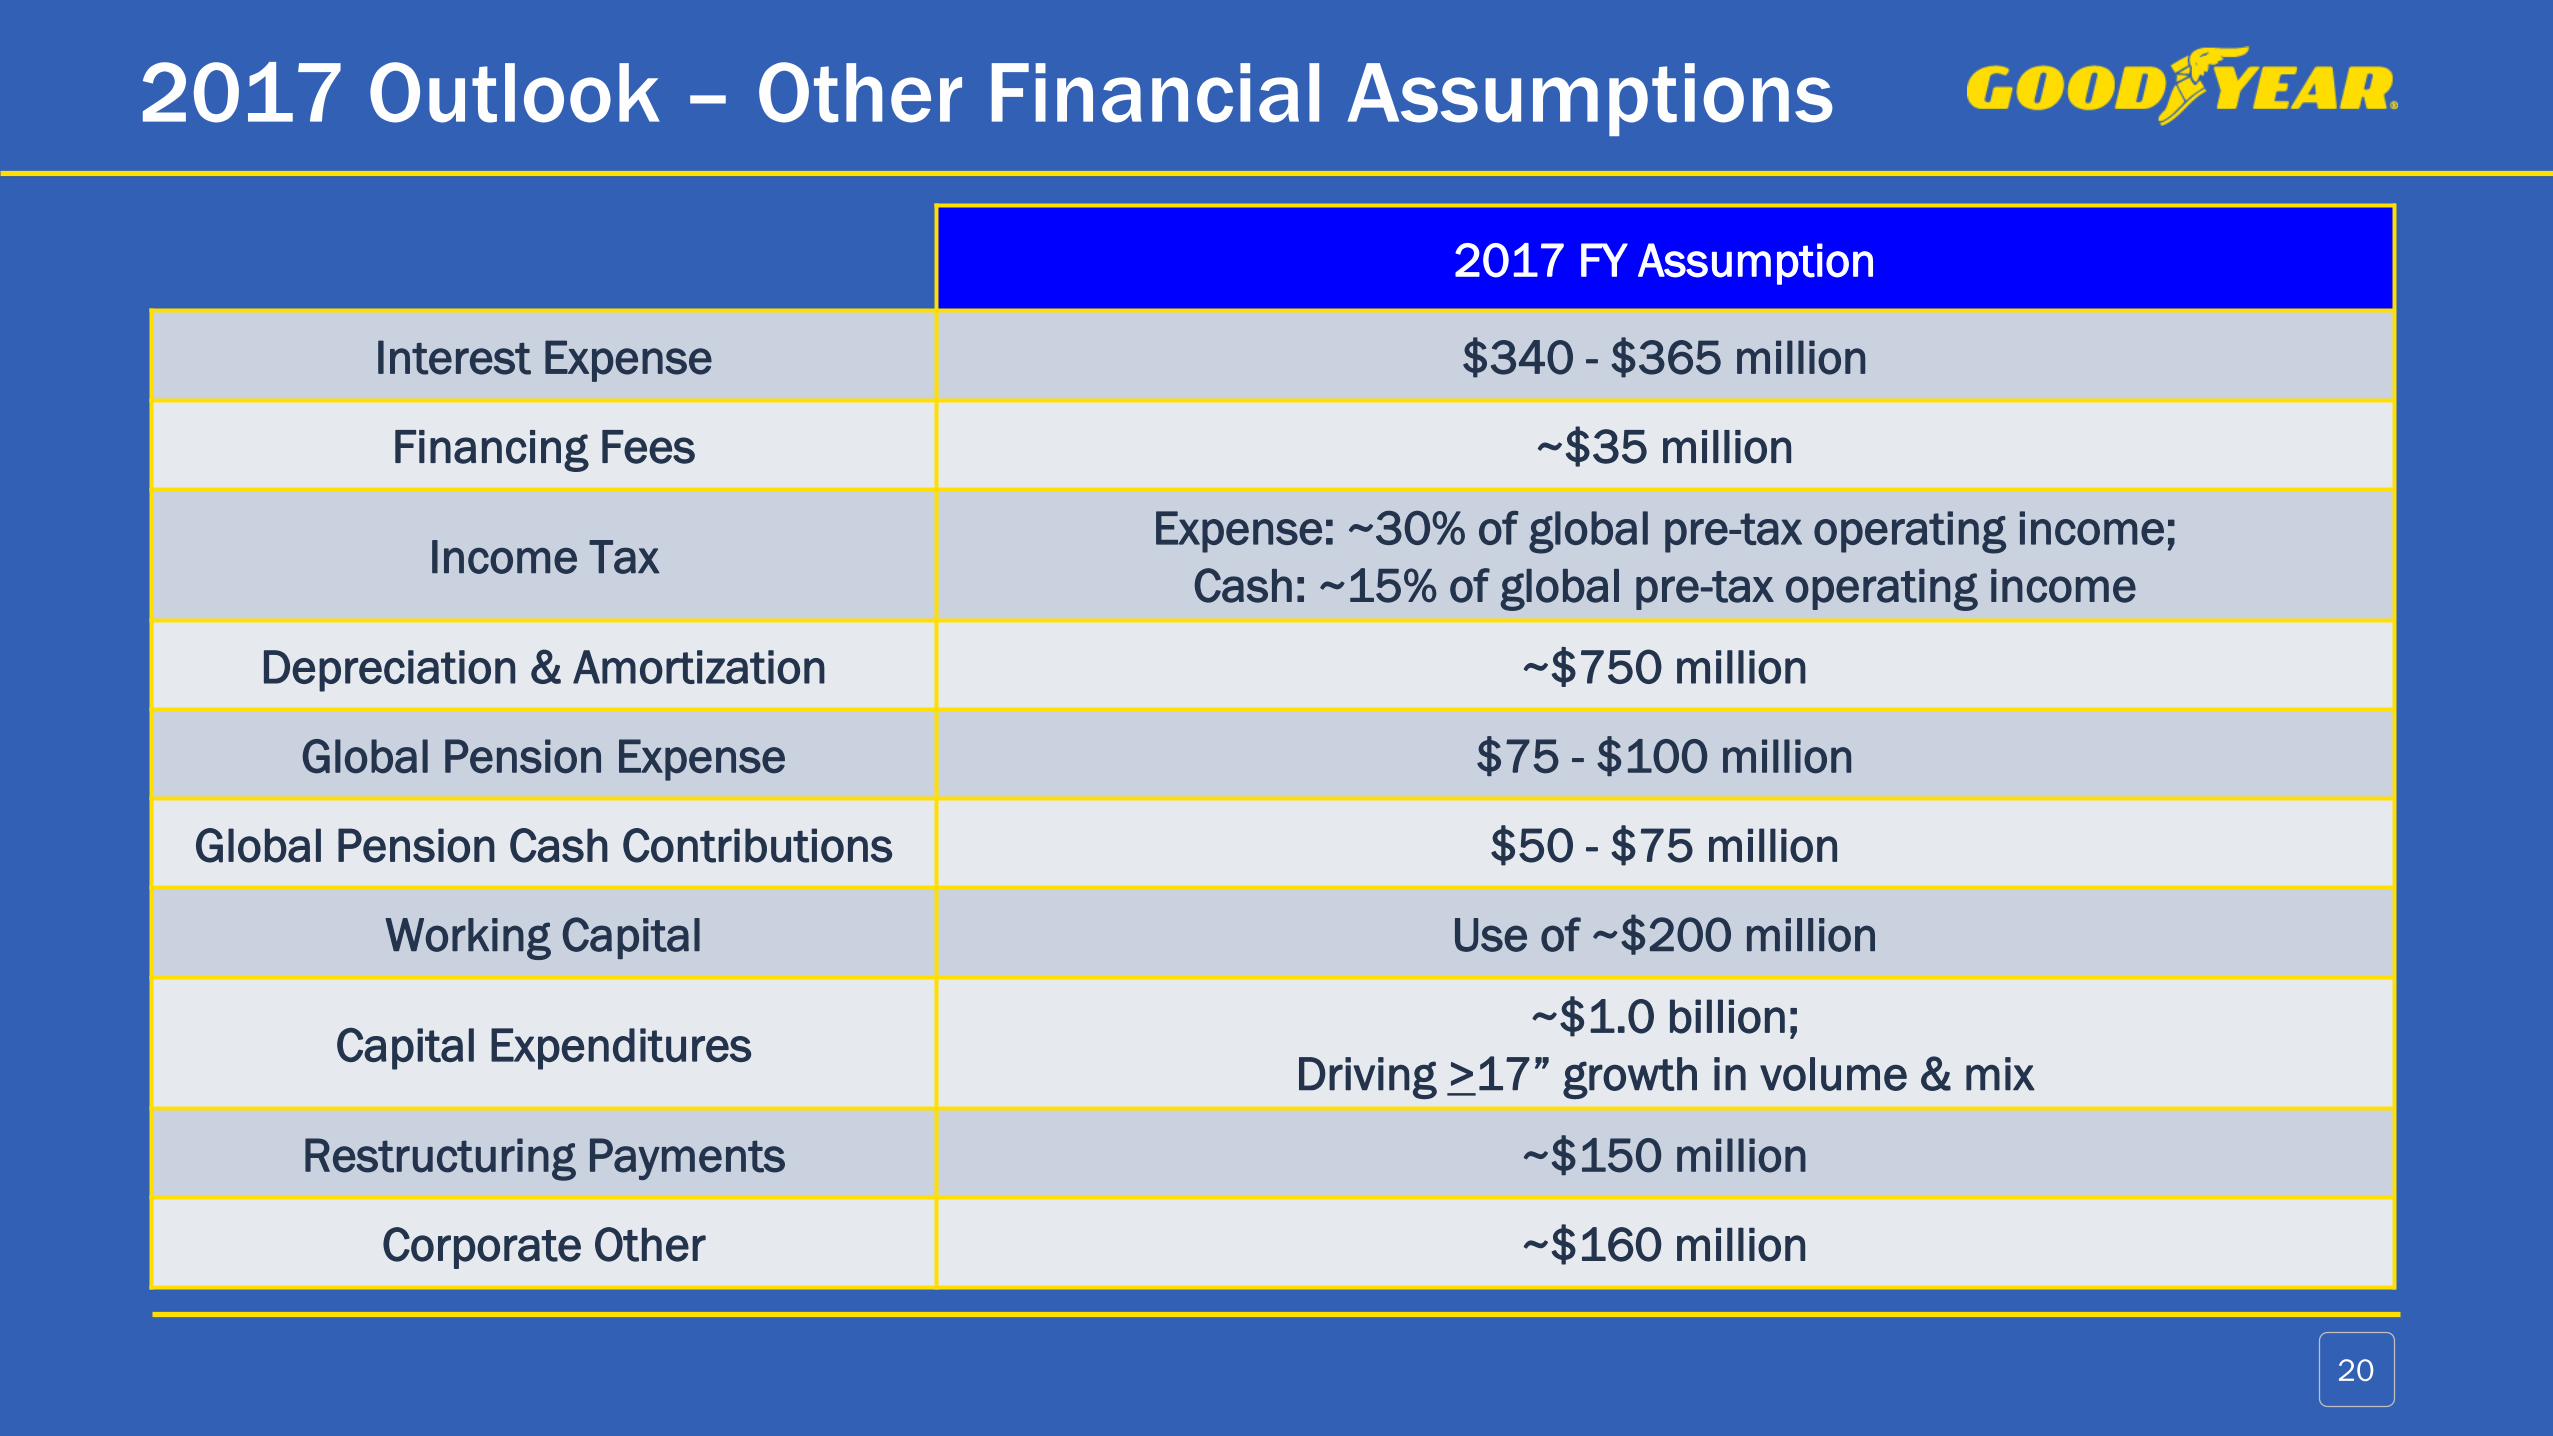
2017 Outlook – Other Financial Assumptions
20
2017 FY Assumption
Interest Expense $340 - $365 million
Financing Fees ~$35 million
Income TaxExpense: ~30% of global pre-tax operating income;
Cash: ~15% of global pre-tax operating income
Depreciation & Amortization ~$750 million
Global Pension Expense $75 - $100 million
Global Pension Cash Contributions $50 - $75 million
Working Capital Use of ~$200 million
Capital Expenditures~$1.0 billion;
Driving >17” growth in volume & mix
Restructuring Payments ~$150 million
Corporate Other ~$160 million
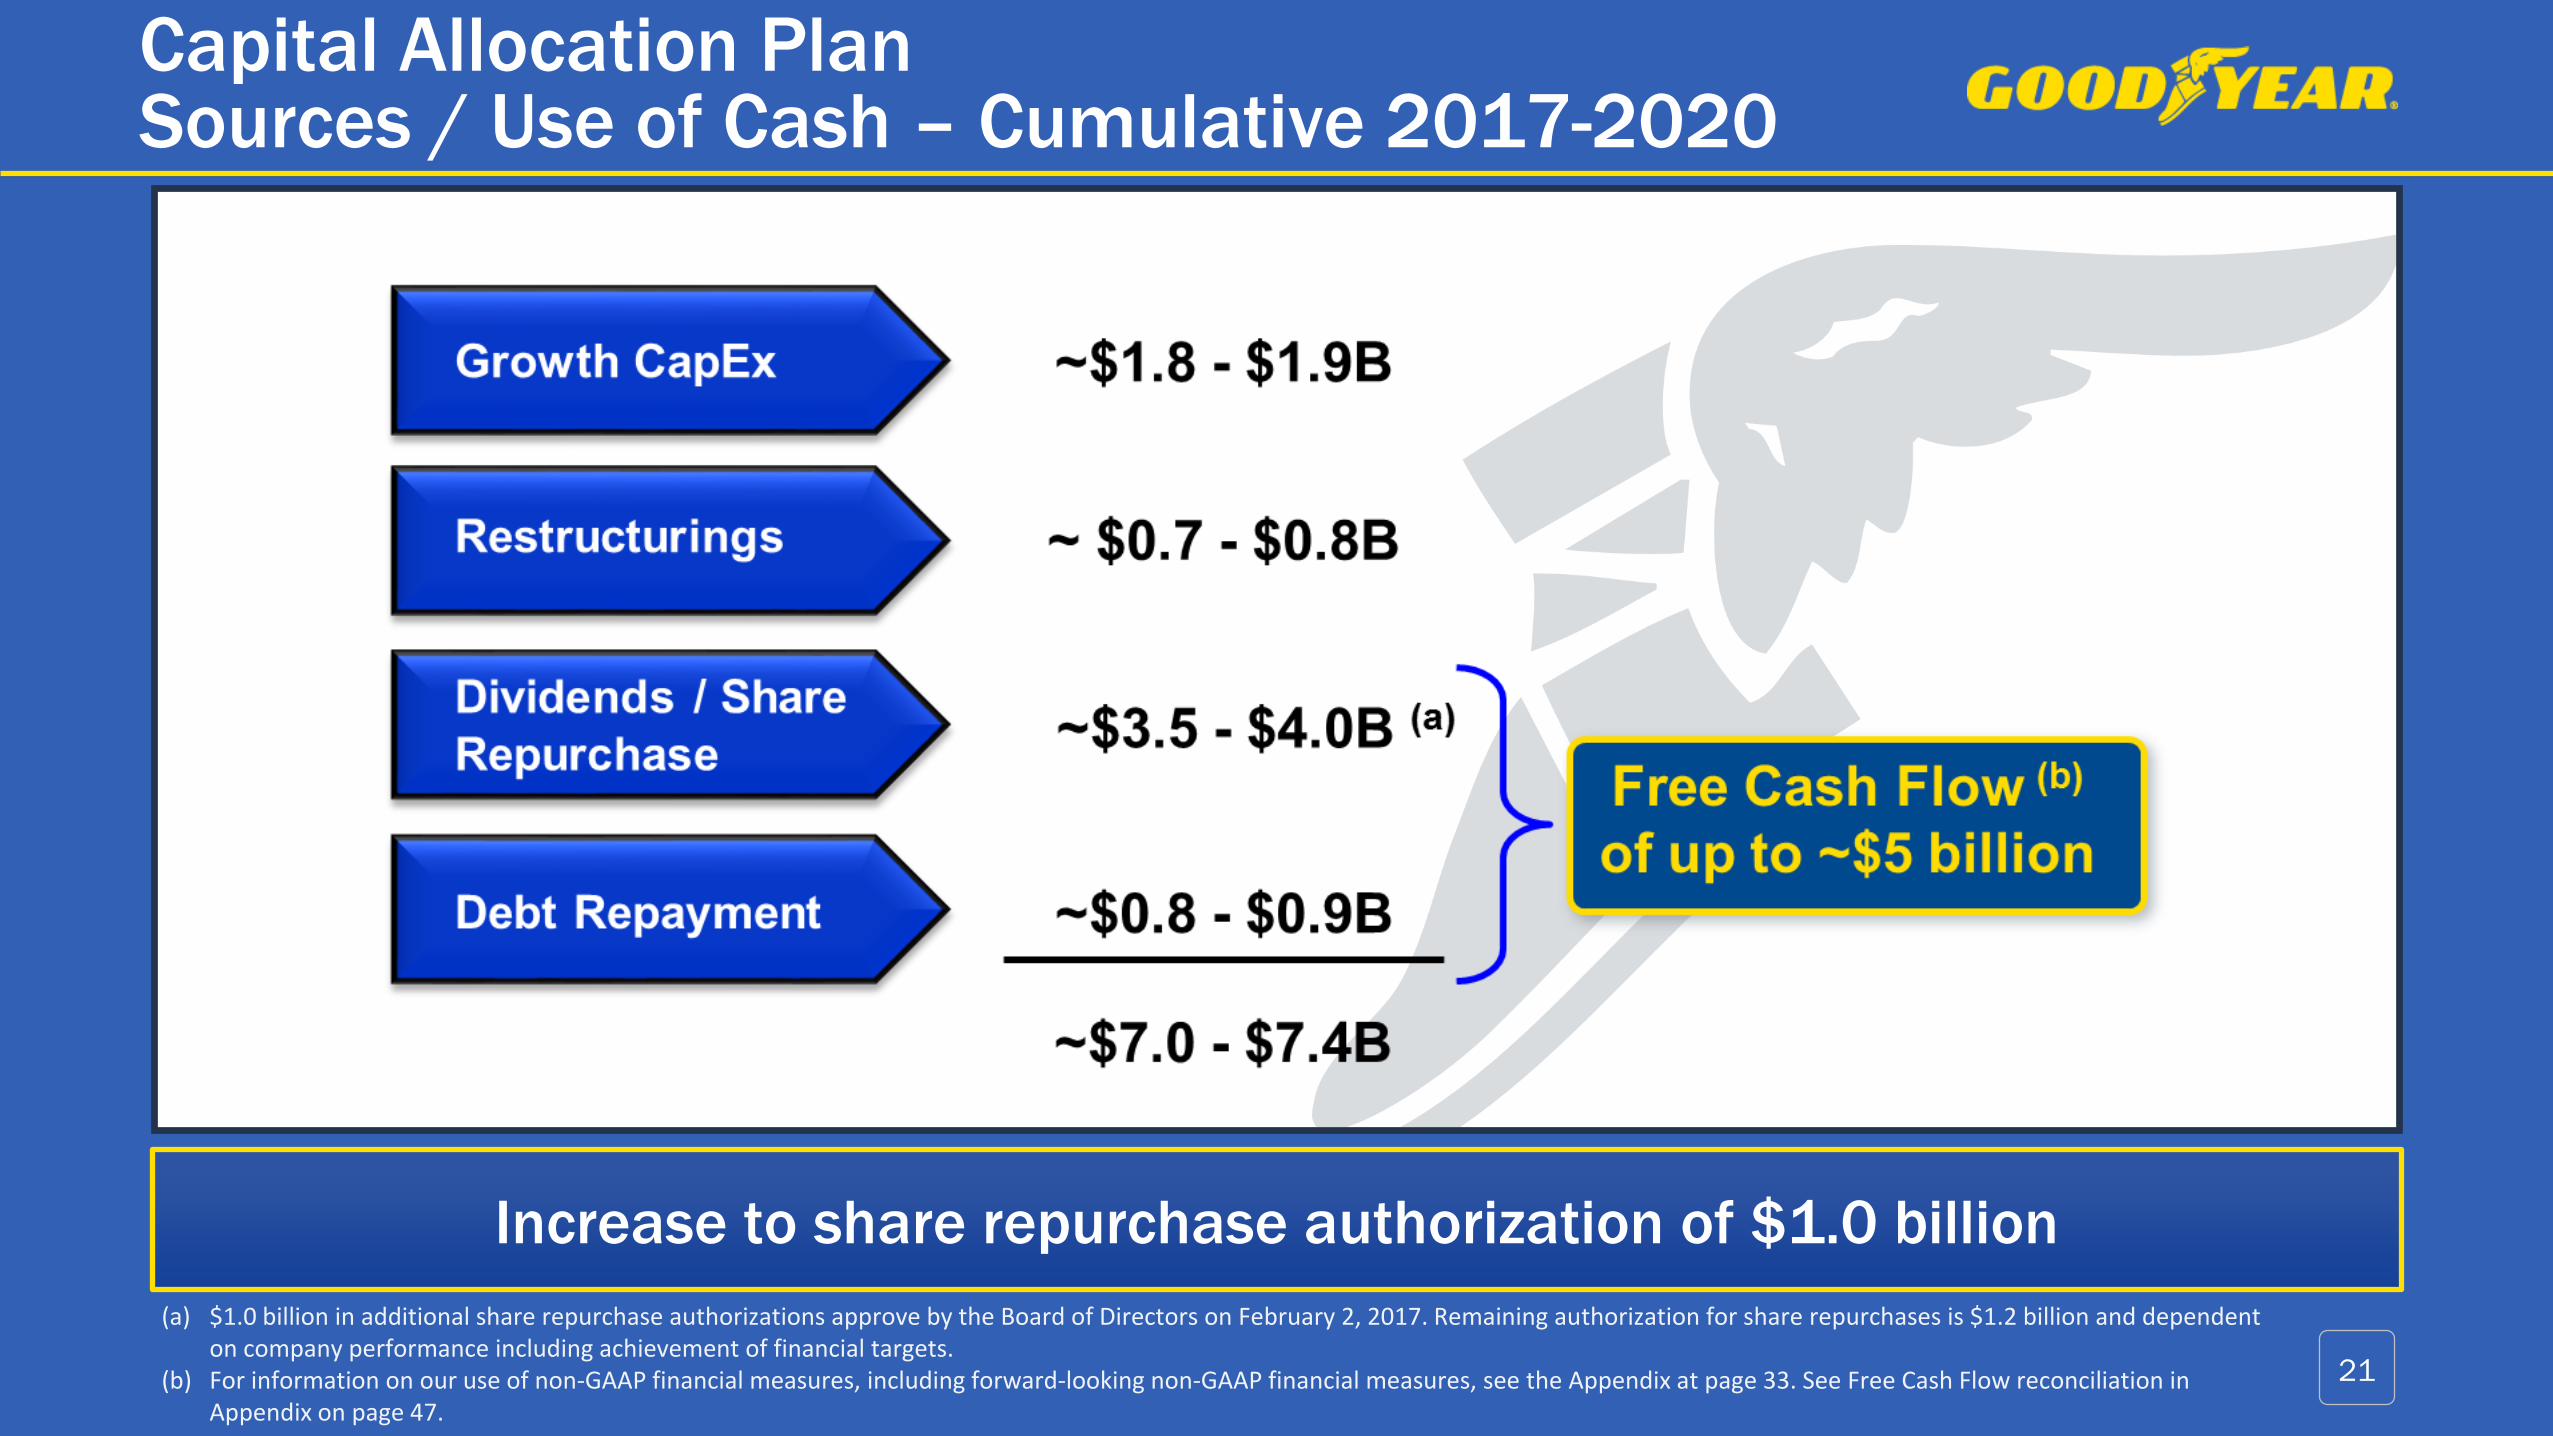
Increase to share repurchase authorization of $1.0 billion
Capital Allocation PlanSources / Use of Cash – Cumulative 2017-2020
(a) $1.0 billion in additional share repurchase authorizations approve by the Board of Directors on February 2, 2017. Remaining authorization for share repurchases is $1.2 billion and dependent on company performance including achievement of financial targets.
(b) For information on our use of non-GAAP financial measures, including forward-looking non-GAAP financial measures, see the Appendix at page 33. See Free Cash Flow reconciliation in Appendix on page 47.
21

Of

Appendix
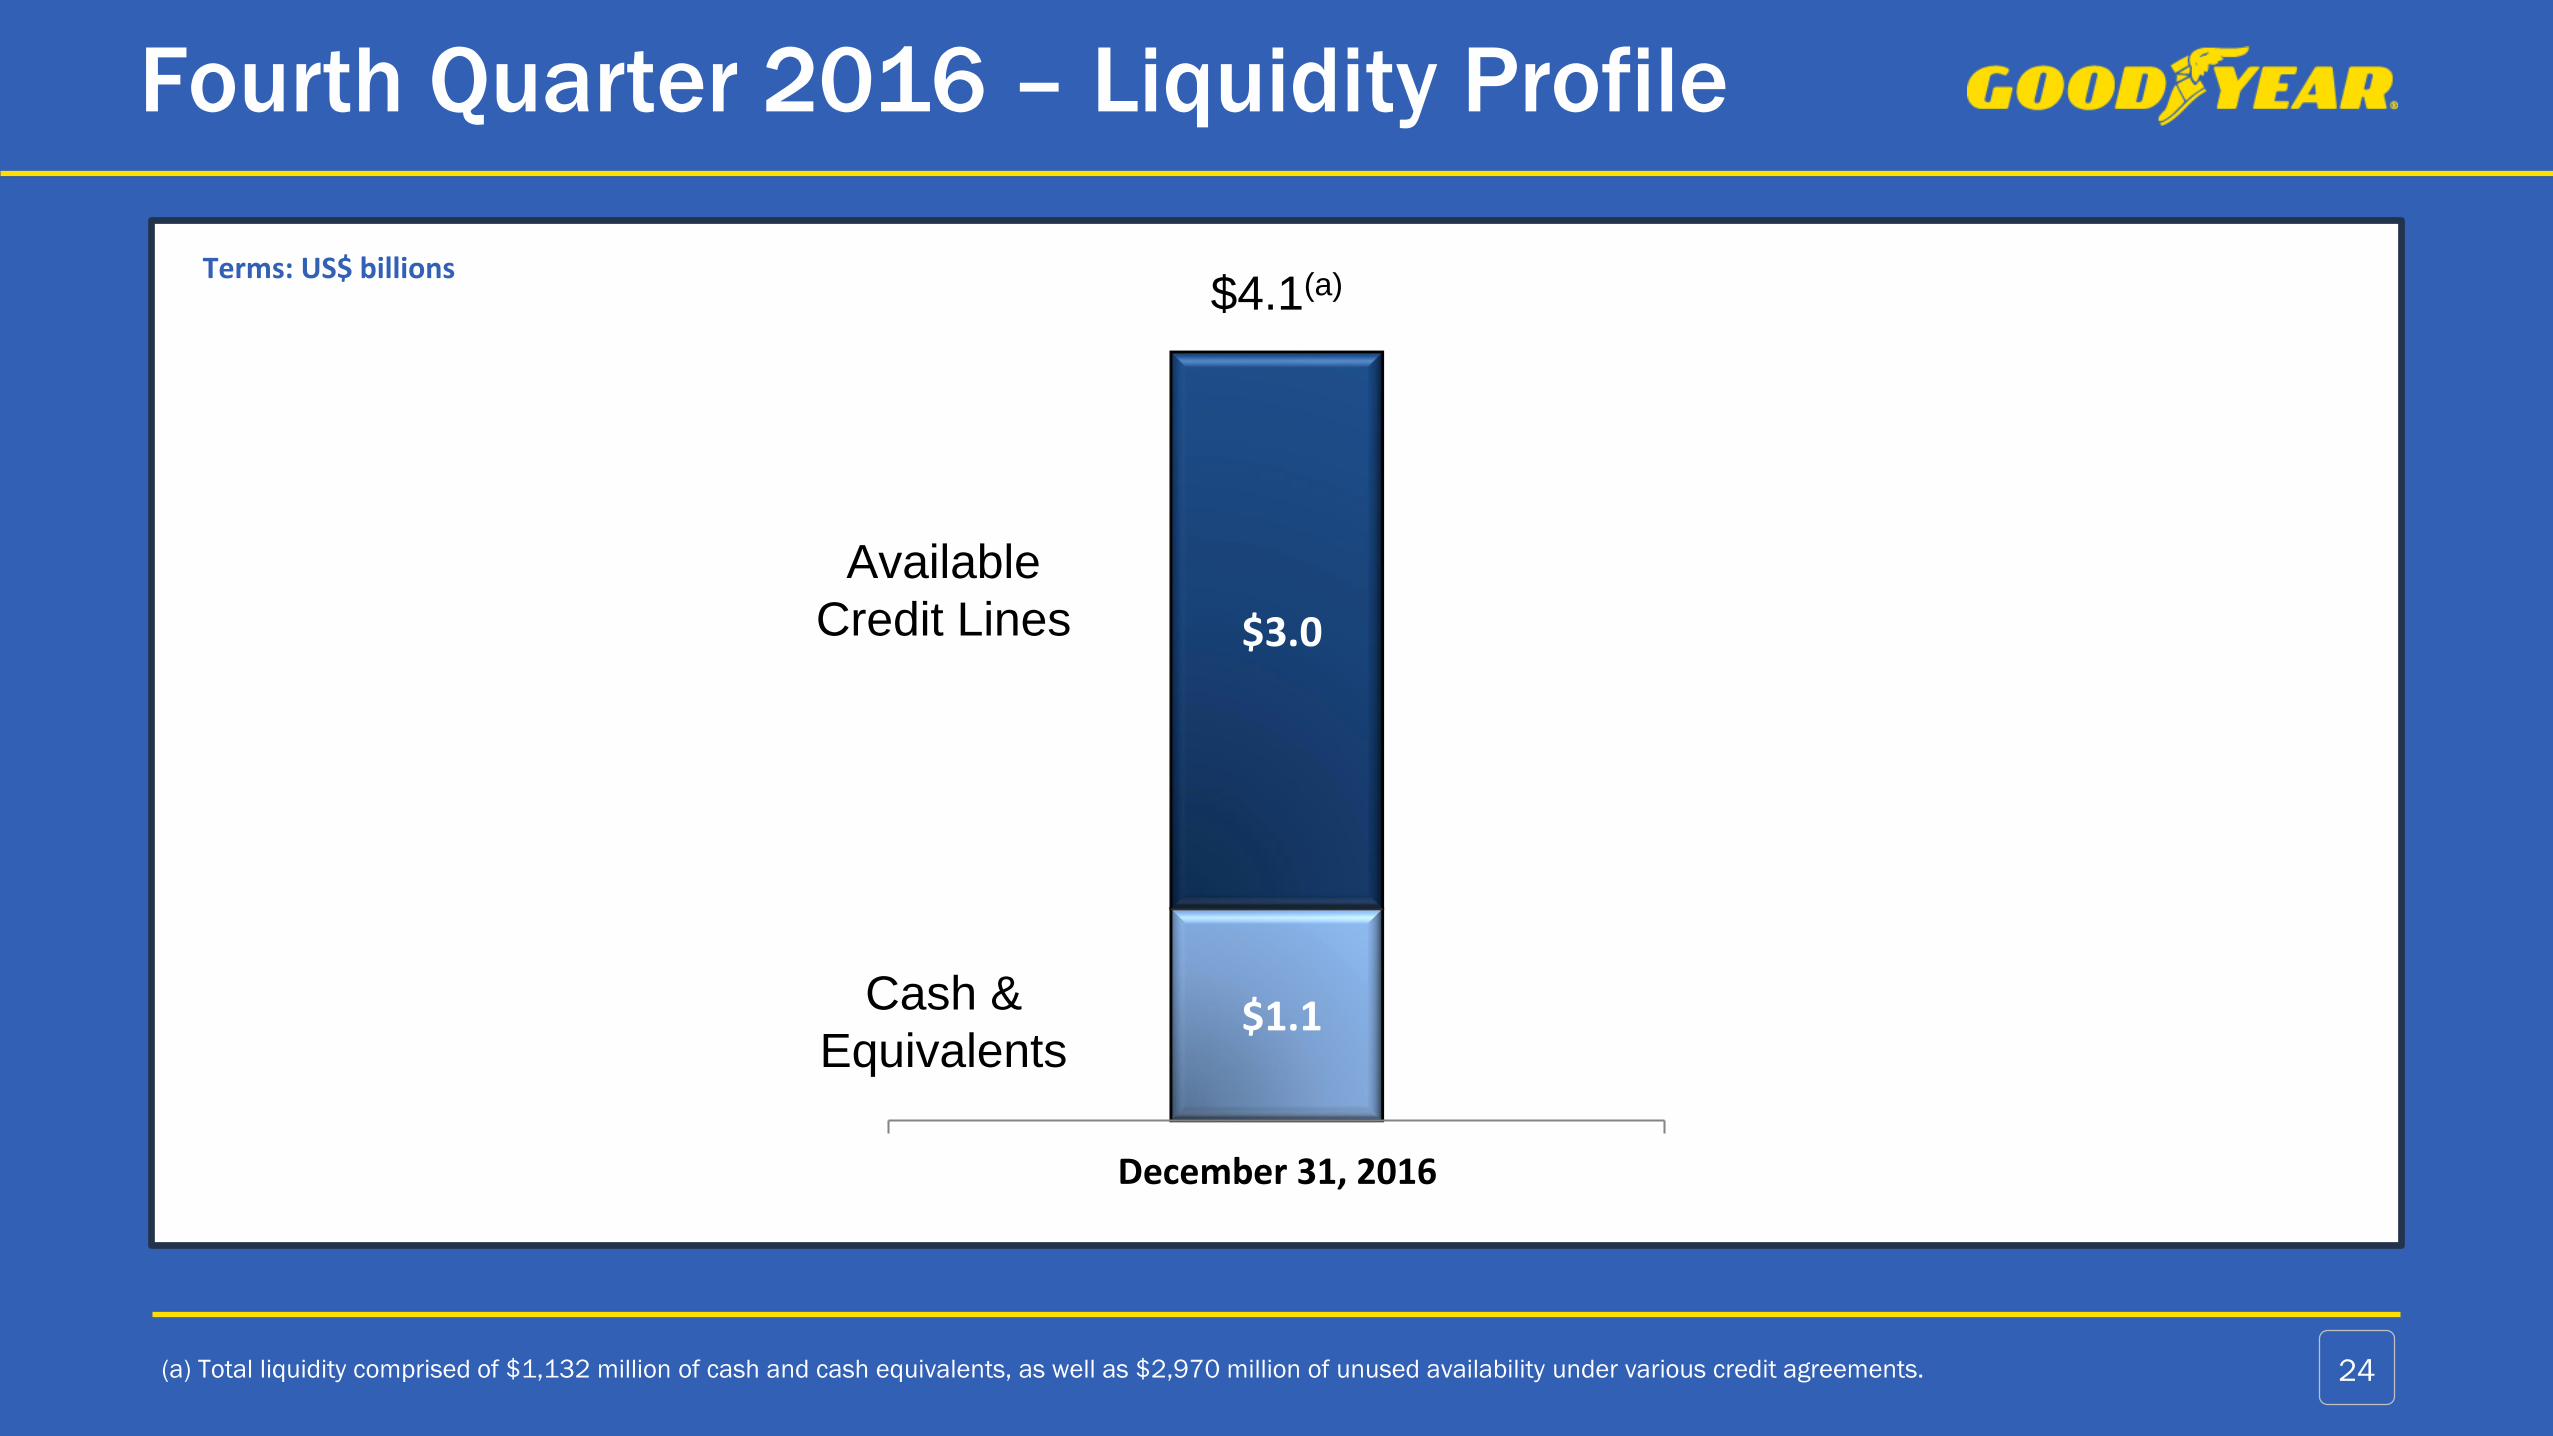
$1.1
$3.0
December 31, 2016
Fourth Quarter 2016 – Liquidity Profile
(a) Total liquidity comprised of $1,132 million of cash and cash equivalents, as well as $2,970 million of unused availability under various credit agreements. 24
Available
Credit Lines
Cash &
Equivalents
$4.1(a)Terms: US$ billions

Fourth Quarter 2016 – Maturity Schedule
Note: Based on December 31, 2016 balance sheet values and excludes notes payable, capital leases and other domestic and foreign debt.
(a) At December 31, 2016 the amounts available and utilized under the Pan-European securitization program totaled $198 million (€188 million).
(b) At December 31, 2016 there were no borrowings outstanding under the €550 million European revolving credit facility and no letters of credit were issued.
(c) At December 31, 2016 our borrowing base, and therefore our availability, under the U.S. revolving credit facility was $369 million below the facility’s stated amount of $2.0 billion. At
December 31, 2016 the total amount outstanding under the U.S. revolving credit facility was $85 million and $40 million of letters of credit were issued.
25
Terms: US$ millions
$597 $273
$85
$700
$1,264
$1,050
$139 (a) $579 (b)
$1,915 (c)
2017 2018 2019 2020 2021 2022 2023 ≥ 2024
Undrawn Credit Lines
Funded Debt
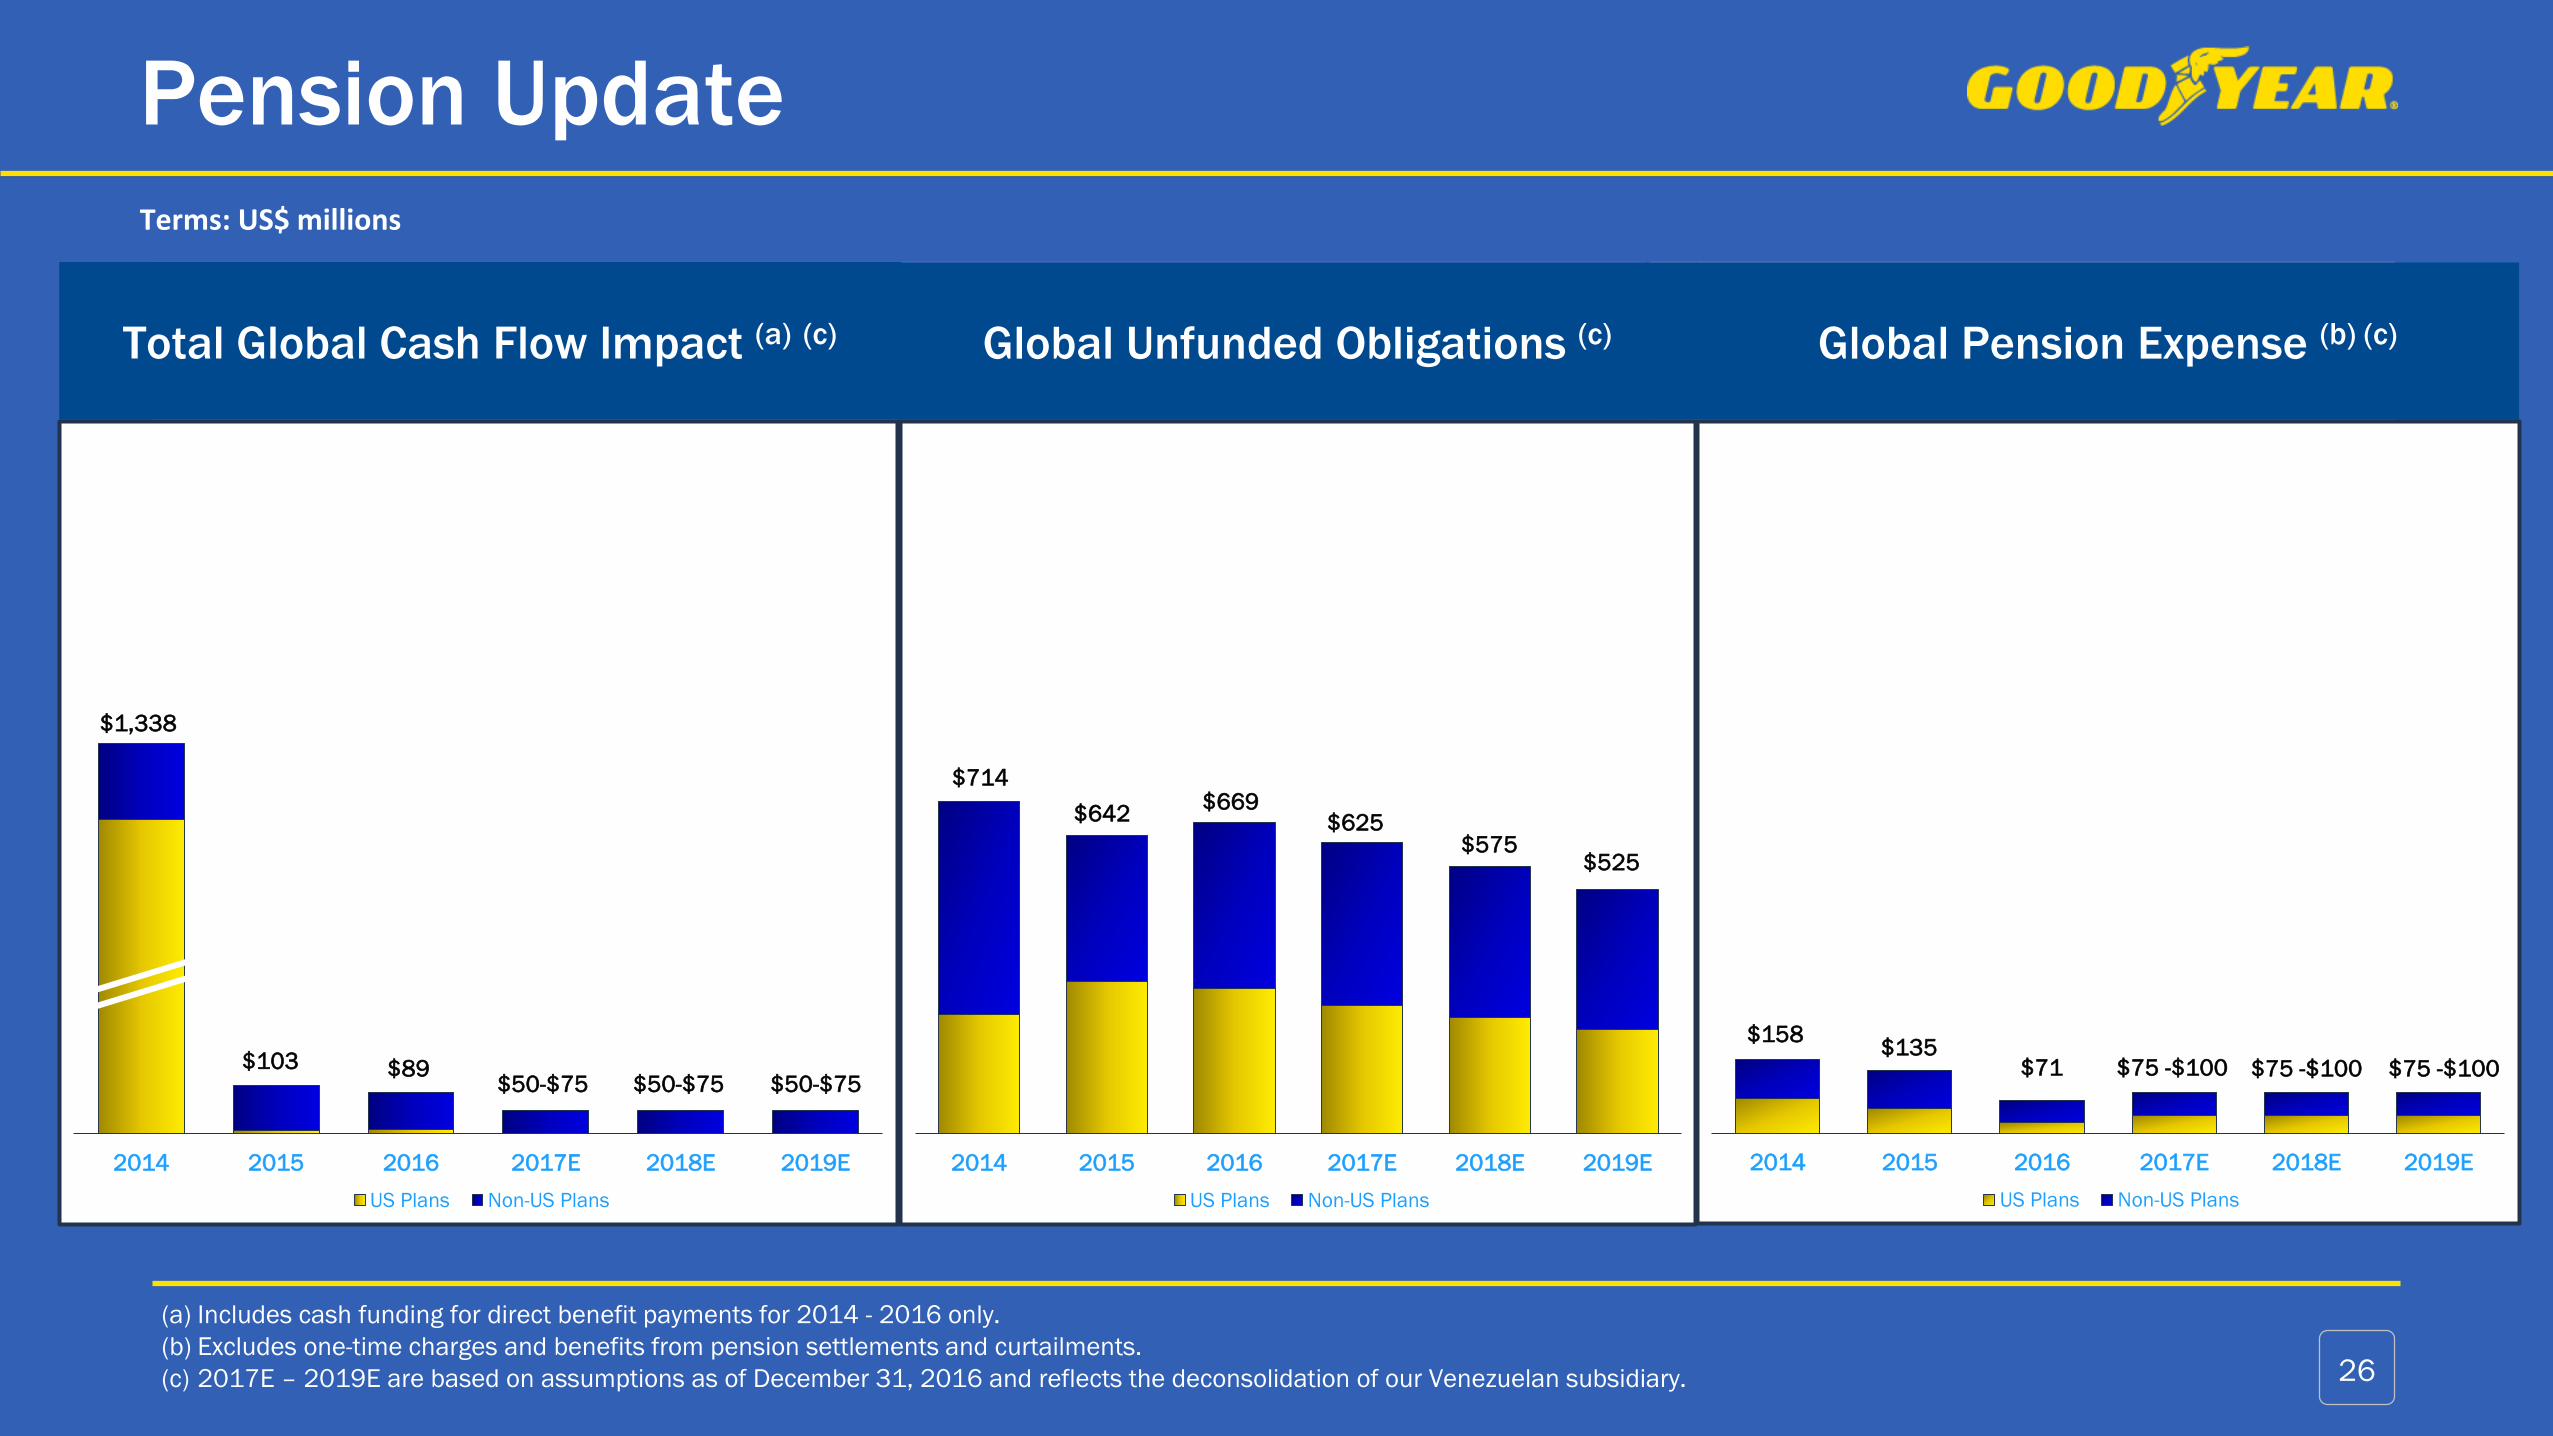
Pension Update
(a) Includes cash funding for direct benefit payments for 2014 - 2016 only.
(b) Excludes one-time charges and benefits from pension settlements and curtailments.
(c) 2017E – 2019E are based on assumptions as of December 31, 2016 and reflects the deconsolidation of our Venezuelan subsidiary.
2014 2015 2016 2017E 2018E 2019E
US Plans Non-US Plans
Total Global Cash Flow Impact (a) (c) Global Unfunded Obligations (c) Global Pension Expense (b) (c)
26
$1,338
$103 $89$50-$75 $50-$75 $50-$75
2014 2015 2016 2017E 2018E 2019E
US Plans Non-US Plans
$714
$642$669
$625$575
$525
2014 2015 2016 2017E 2018E 2019E
US Plans Non-US Plans
$158$135
$71 $75 -$100 $75 -$100 $75 -$100
Terms: US$ millions
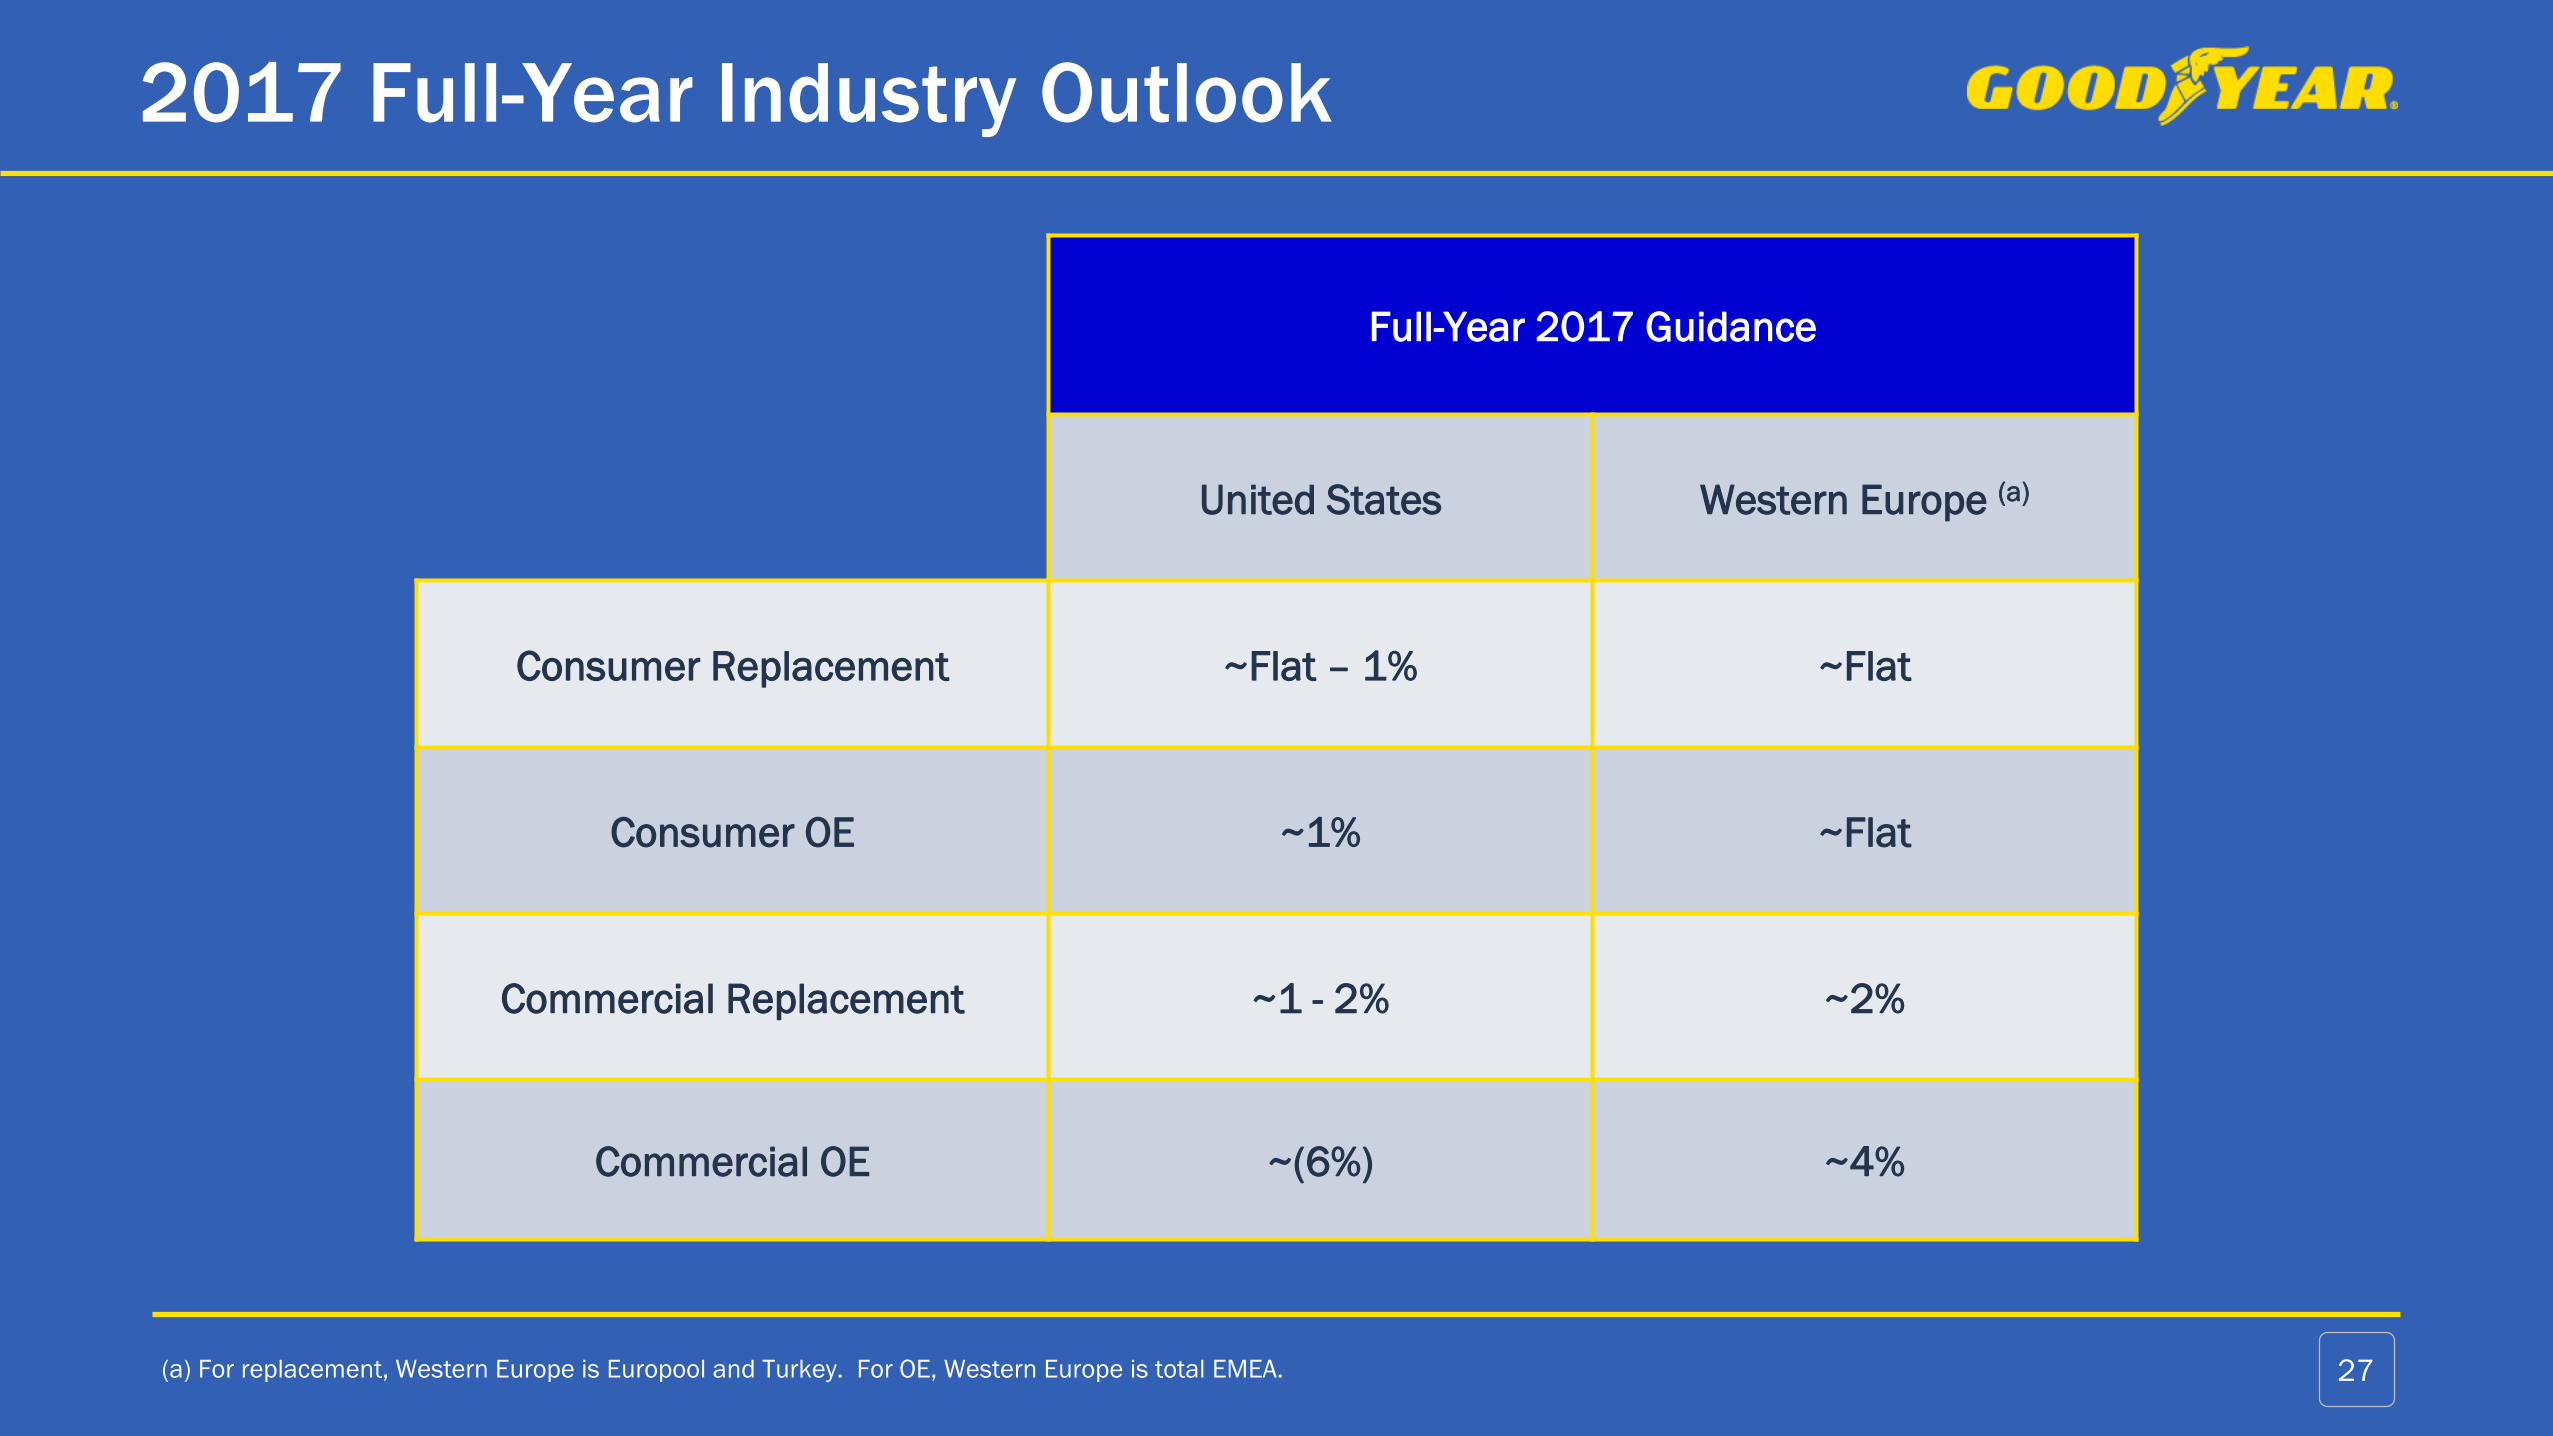
2017 Full-Year Industry Outlook
(a) For replacement, Western Europe is Europool and Turkey. For OE, Western Europe is total EMEA. 27
Full-Year 2017 Guidance
United States Western Europe (a)
Consumer Replacement ~Flat – 1% ~Flat
Consumer OE ~1% ~Flat
Commercial Replacement ~1 - 2% ~2%
Commercial OE ~(6%) ~4%

2015 Venezuela Key Metrics
Note: The Venezuela subsidiary was deconsolidated effective December 31, 2015
(a) In addition to the foreign currency exchange impact in Venezuela, 2015 included $8 million of foreign currency exchange losses on bolivar denominated assets held by other Goodyear
entities.28
Venezuela
Q1 Q2 Q3 Q4 2015 Full Year
Units (000s) 377 318 385 312 1,392
Revenue $94 $115 $155 $167 $531
Operating Income $22 $36 $39 $22 $119
Foreign Currency
Exchange(a)($1) ($12) ($8) ($5) ($26)
Terms: US$ millions

Full Year 2016
Tire Unit & Sales Summary
(a) Excludes Venezuela which was deconsolidated on December 31, 2015. 29
Other
9%
Commercial
18%
Consumer
62%
Retail
8%Chemical
3%
Consumer62%
Commercial18%
Other9%
Retail8%
Chemical3%
2016 2015 (a) % Change
Consumer
Units 153.0 151.3 1.1%
Sales $9,414 $9,591 (1.8%)
Commercial
Units 11.6 12.1 (4.2%)
Sales $2,806 $3,128 (10.3%)
2016 Sales = $15,158
Terms: millions
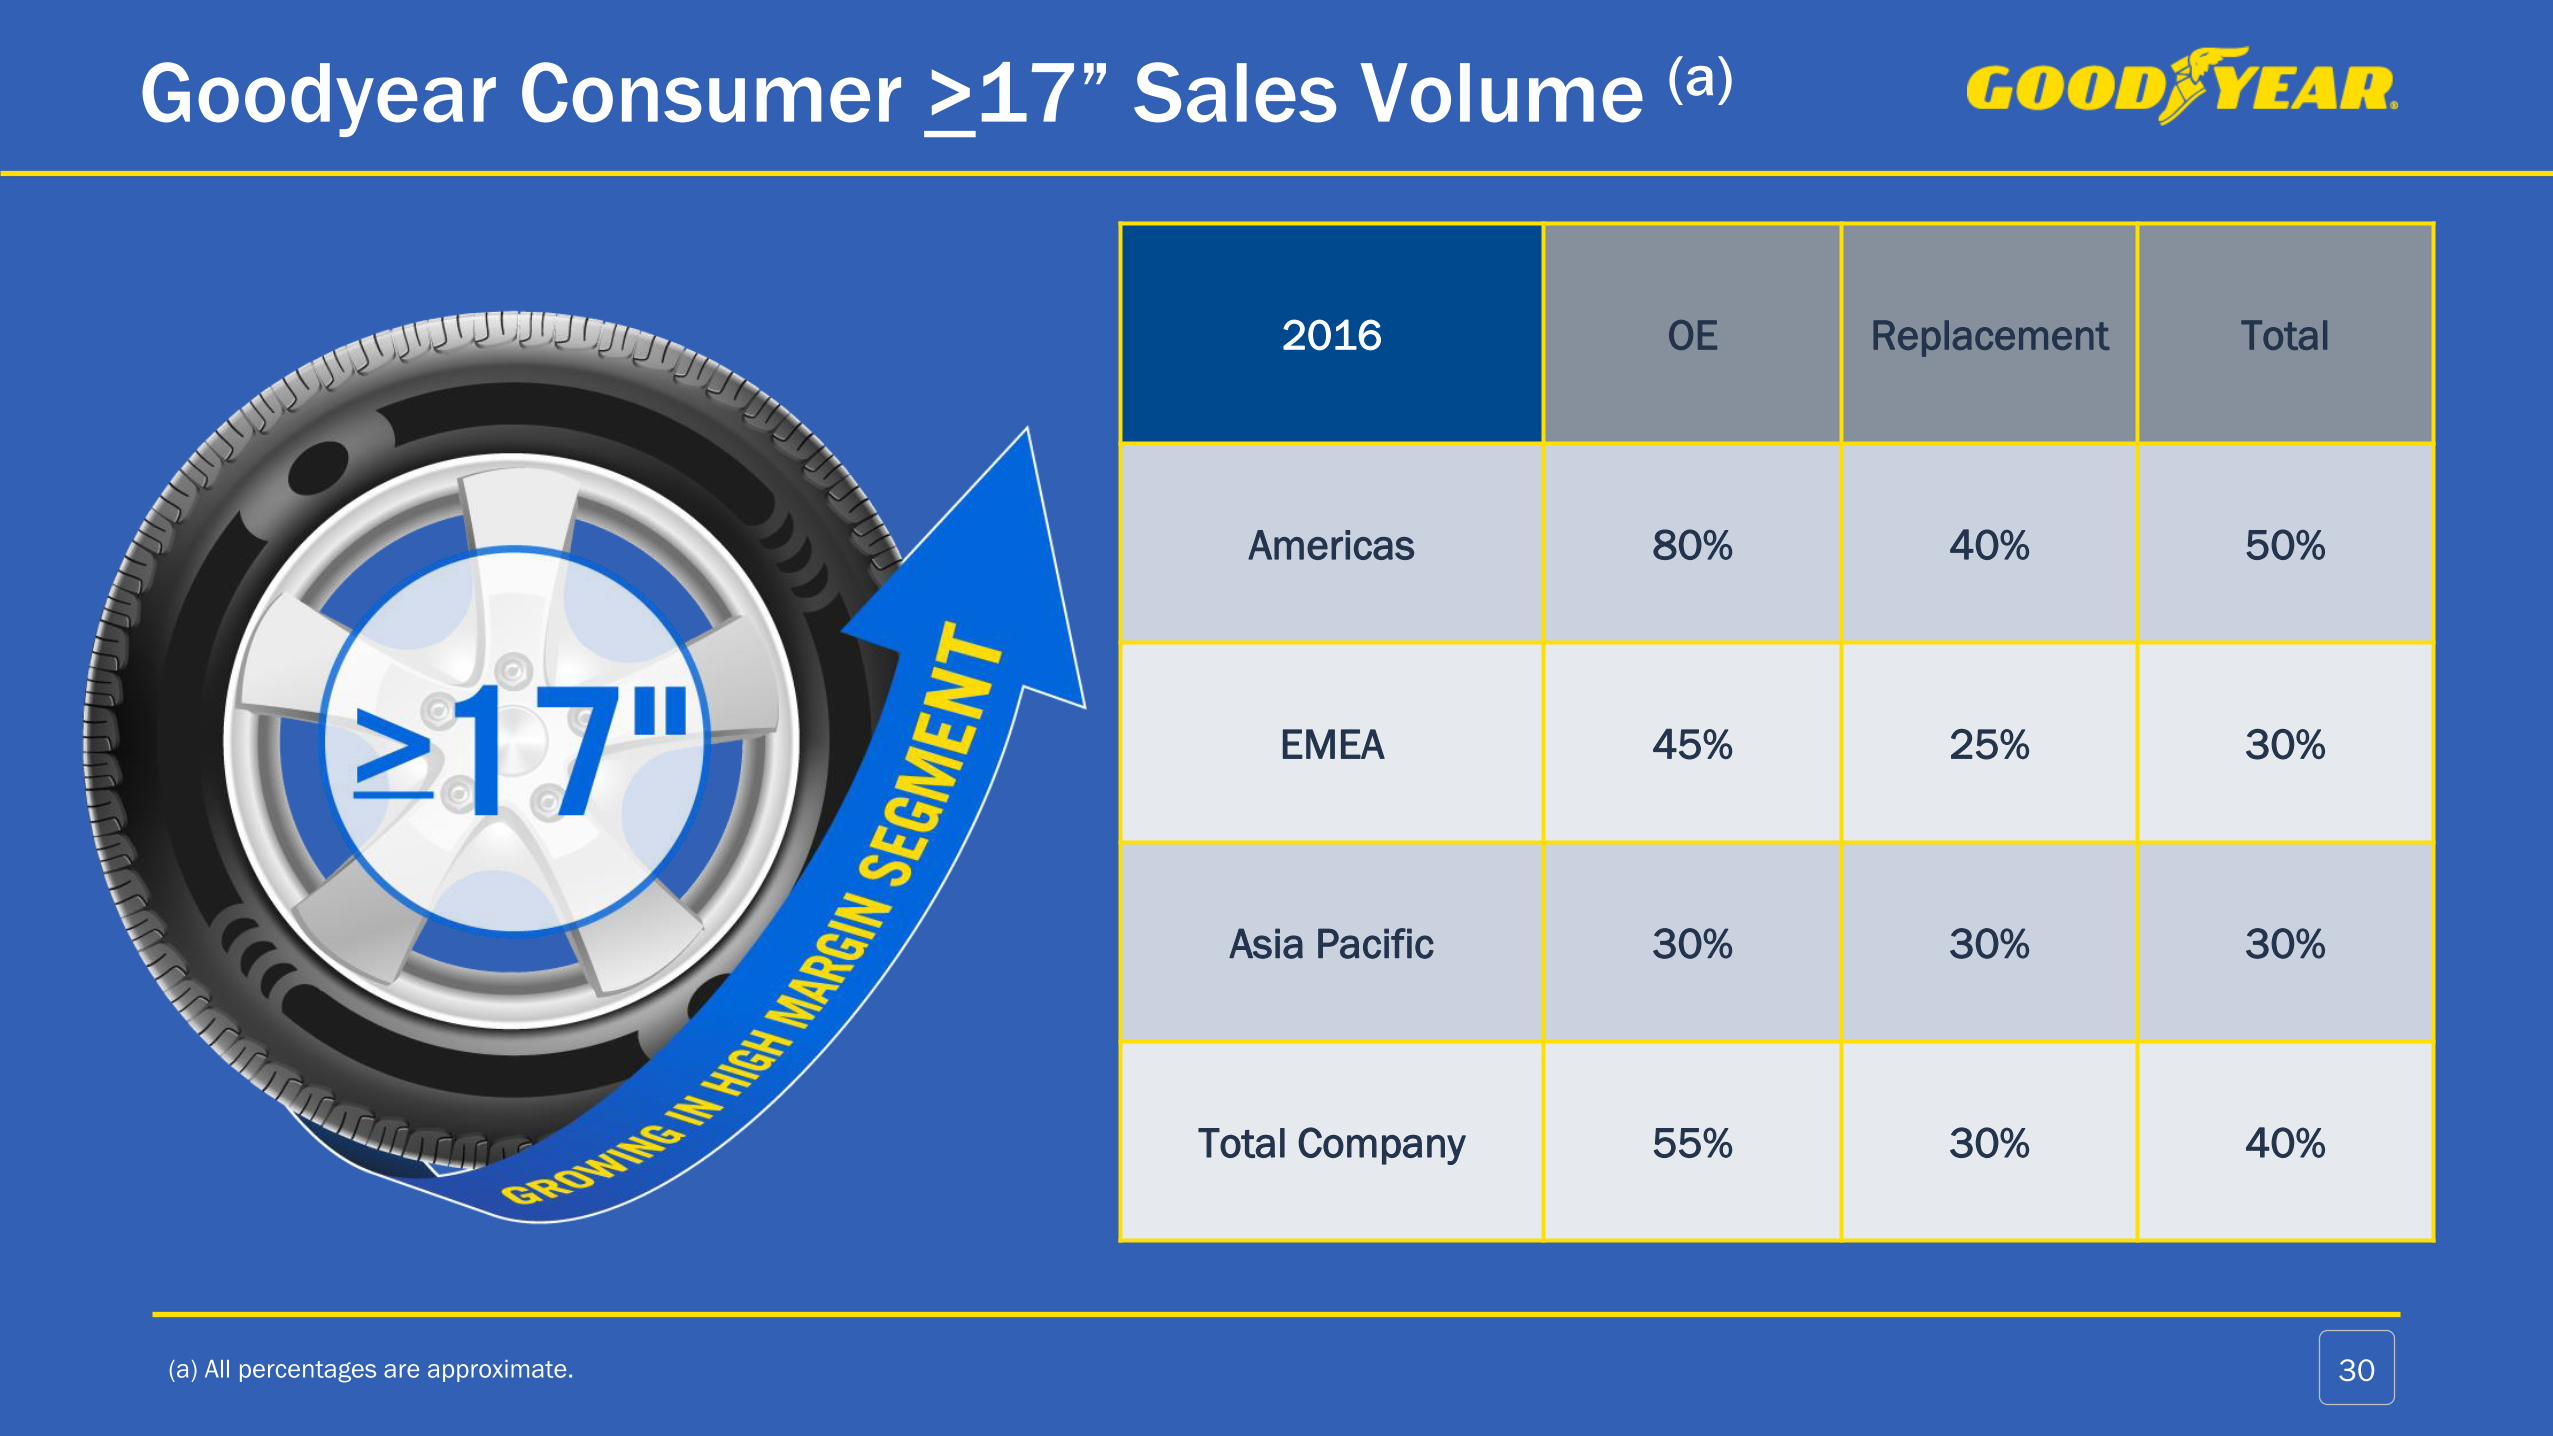
Goodyear Consumer >17” Sales Volume (a)
(a) All percentages are approximate. 30
2016 OE Replacement Total
Americas 80% 40% 50%
EMEA 45% 25% 30%
Asia Pacific 30% 30% 30%
Total Company 55% 30% 40%

Recent increases in commodity prices will be an
~$1.1 billion headwind to 2017 raw material costs
Raw Materials
Raw materials are ~40% of tire COGS
~65% of raw materials are influenced by oil
prices
- P&L impact lags spot rates by 1-2 quarters depending
on commodity
~60% of raw materials are purchased in USD
Customer agreements indexed to raw
materials
- OE customers
- Certain large Commercial fleets
- OTR customers
Global Raw Material SpendFY 2016 Estimate
Natural Rubber, 19%
Wire / Other, 13%
Fabrics, 11%*
Pigments / Oils / Chemicals, 19%*
Carbon Black, 10%*
Synthetic Rubber, 28%*
*Petrochemical based
31

Moderate global industry growth, including:
• Above market growth in > 17”
• Emerging markets growth
Goodyear volume growth of 20 million
units, primarily in > 17”
Price/mix supported by innovation
Achieve cost savings and unabsorbed fixed
cost recovery
Deliver on high-return investments
$3.0 Billion Segment Operating Income Target (a)
(a) For information on our use of non-GAAP financial measures, including forward-looking non-GAAP financial measures, see Appendix on page 33.
Execution required, risks need to be managed
Risk Factors
Economic environment
• Significant weakness in key markets
Raw materials
• Timing of cost increases
• Availability of select materials
Higher wages and general inflation
• Further cost savings may be required
Key drivers
32

Use of Historical and Forward-Looking Non-GAAP Financial MeasuresThis presentation contains historical and forward-looking non-GAAP financial measures, including Total Segment Operating Income and Margin, Core Segment Operating Income and Margin, Free Cash Flow from
Operations, Free Cash Flow, the ratio of Adjusted Debt to EBITDAP, Adjusted Net Income and Adjusted Diluted Earnings Per Share (EPS), which are important financial measures for the company but are not financial
measures defined by U.S. GAAP, and should not be construed as alternatives to corresponding financial measures presented in accordance with U.S. GAAP.
Total Segment Operating Income is the sum of the individual strategic business units’ (SBUs’) Segment Operating Income as determined in accordance with U.S. GAAP. Total Segment Operating Margin is Total Segment
Operating Income divided by Net Sales as determined in accordance with U.S. GAAP. Management believes that Total Segment Operating Income and Margin are useful because they represent the aggregate value of
income created by the company’s SBUs and exclude items not directly related to the SBUs for performance evaluation purposes.
Core Segment Operating Income is Total Segment Operating Income excluding the operating income from our Venezuelan subsidiary, which we deconsolidated on December 31, 2015. Core Segment Operating Margin is
Core Segment Operating Income divided by Net Sales excluding the net sales of our Venezuelan subsidiary. Management believes that Core Segment Operating Income and Margin are useful because they represent
Total Segment Operating Income and Margin from the company’s ongoing reported operations.
The most directly comparable U.S. GAAP financial measures to Total and Core Segment Operating Income and Margin are Goodyear Net Income and Return on Sales (which is calculated by dividing Goodyear Net Income
by Net Sales).
Free Cash Flow from Operations is the company’s Cash Flows from Operating Activities as determined in accordance with U.S. GAAP before pension contributions and direct payments and rationalization payments, less
capital expenditures. Free Cash Flow is the company’s Cash Flows from Operating Activities as determined in accordance with U.S. GAAP, less capital expenditures. Management believes that both Free Cash Flow from
Operations and Free Cash Flow are useful because they represent the cash generating capability of the company’s ongoing operations, after taking into consideration capital expenditures necessary to maintain its
business and pursue growth opportunities. The most directly comparable U.S. GAAP financial measure is Cash Flows from Operating Activities.
Adjusted Net Income is Goodyear Net Income as determined in accordance with U.S. GAAP adjusted for certain significant items. Adjusted Diluted EPS is the company’s Adjusted Net Income divided by Weighted Average
Shares Outstanding-Diluted as determined in accordance with U.S. GAAP. Management believes that Adjusted Net Income and Adjusted Diluted EPS are useful because they represent how management reviews the
operating results of the company excluding the impacts of rationalizations, asset write-offs, accelerated depreciation, asset sales and certain other significant items.
Adjusted Debt is the sum of the company’s total debt and global pension liability, each as determined in accordance with U.S. GAAP, and EBITDAP, as adjusted, represents Net Income, as determined in accordance with
U.S. GAAP (the most directly comparable U.S. GAAP financial measure to EBITDAP), before interest expense, income tax expense, depreciation and amortization expense, net periodic pension cost, rationalization
charges, and other (income) and expense. Management believes that the ratio of Adjusted Debt to EBITDAP, or similar ratios, are widely used by investors as a means of evaluating the company’s leverage.
It should be noted that other companies may calculate similarly-titled non-GAAP financial measures differently and, as a result, the measures presented herein may not be comparable to such similarly-titled measures
reported by other companies.
We are unable to present a quantitative reconciliation of our forward-looking non-GAAP financial measures, other than Free Cash Flow, to the most directly comparable U.S. GAAP financial measures because
management cannot reliably predict all of the necessary components of those U.S. GAAP financial measures without unreasonable effort. Those forward-looking non-GAAP financial measures, or components thereof,
would be reconciled to Goodyear Net Income, which includes several significant items that are not included in the comparable non-GAAP financial measures, such as rationalization charges, other (income) expense,
pension curtailments and settlements, and income taxes. The decisions and events that typically lead to the recognition of these and other similar non-GAAP adjustments, such as a decision to exit part of our business,
acquisitions and dispositions, foreign currency exchange gains and losses, financing fees, actions taken to manage our pension liabilities, and the recording or release of tax valuation allowances, are inherently
unpredictable as to if or when they may occur. The inability to provide a reconciliation is due to that unpredictability and the related difficulty in assessing the potential financial impact of the non-GAAP adjustments. For
the same reasons, we are unable to address the probable significance of the unavailable information, which could be material to our future financial results.
33

Fourth Quarter 2016 Significant Items(After Tax and Minority Interest)
34
Terms: US$ millions, Shares in millions
(except EPS)
As
Reported
Discrete Tax
Items
Insurance
Recovery -
Discontinued
Products
Net Gains on
Asset Sales
Rationalizations,
Asset Write-offs,
and Accelerated
Depreciation
Legal Claims
Unrelated to
Operations
Pension
Settlement As Adjusted
Net Sales 3,741$ -$ -$ -$ -$ -$ -$ 3,741$
Cost of Goods Sold 2,722 - - - (10) - (2) 2,710
Gross Margin 1,019 - - - 10 - 2 1,031
SAG 600 - - - - - (1) 599
Rationalizations 16 - - - (16) - - -
Interest Expense 87 - - - - - - 87
Other (Income) Expense (13) - 17 3 - (10) - (3)
Pre-tax Income 329 - (17) (3) 26 10 3 348
Taxes (238) 331 (7) (1) 2 4 - 91
Minority Interest 6 1 - - 1 - - 8
Goodyear Net Income 561$ (332)$ (10)$ (2)$ 23$ 6$ 3$ 249$
EPS 2.14$ (1.26)$ (0.04)$ (0.01)$ 0.09$ 0.02$ 0.01$ 0.95$

Fourth Quarter 2015 Significant Items (a)
(After Tax and Minority Interest)
(a) Restated for the new guidance on the presentation of debt issuance and amortization costs.
(b) Calculation of Diluted EPS reflects 4 million weighted average shares outstanding for stock options and other securities not included in Goodyear Net Income (Loss) Per Share Diluted as shown on page 5 as
their inclusion was anti-dilutive.35
Terms: US$ millions, Shares in millions
(except EPS)
As
Reported
Loss on
Deconsolidation of
Venezuelan
Subsidiary
Pension
Settlement
Debt
Redemption
Rationalizations,
Asset Write-offs,
and Accelerated
Depreciation
Transaction
Costs and Net
Gains on Asset
Sales SRI Share Sale
Discrete Tax
Items As Adjusted
Net Sales 4,063$ -$ -$ -$ -$ -$ -$ -$ 4,063$
Cost of Goods Sold 3,071 - (88) - (4) - - - 2,979
Gross Margin 992 - 88 - 4 - - - 1,084
SAG 725 - (49) - - 1 - 2 679
Rationalizations 32 - - - (32) - - - -
Interest Expense 116 - - (16) - - - - 100
Loss on Deconsolidation of
Venezuelan Subsidiary646 (646) - - - - - - -
Other (Income) Expense (17) - - (41) - 50 30 - 22
Pre-tax Income (Loss) (510) 646 137 57 36 (51) (30) (2) 283
Taxes (137) 69 51 22 6 (11) 2 18 20
Minority Interest 7 - - - - (1) - - 6
Goodyear Net Income (Loss) (380)$ 577$ 86$ 35$ 30$ (39)$ (32)$ (20)$ 257$
EPS (b)(1.39)$ 2.11$ 0.31$ 0.13$ 0.11$ (0.15)$ (0.12)$ (0.07)$ 0.93$

Full Year 2016 Significant Items(After Tax and Minority Interest)
36
Terms: US$ millions, Shares in millions
(except EPS)As
Reported Discrete Tax Items
Net Gains on
Asset Sales
Insurance
Recovery -
Discontinued
Products
Rationalizations,
Asset Write-offs,
and Accelerated
Depreciation
Debt
Repayments
Americas
Intracompany
Profit
Elimination
Adjustment
Pension
Settlement
Legal Claims
Unrelated to
Operations As Adjusted
Net Sales 15,158$ -$ -$ -$ -$ -$ -$ -$ -$ 15,158$
Cost of Goods Sold 10,972 - - - (20) - (24) (16) - 10,912
Gross Margin 4,186 - - - 20 - 24 16 - 4,246
SAG 2,407 (2) - - - - - (1) - 2,404
Rationalizations 210 - - - (210) - - - - -
Interest Expense 372 - - - - (11) - - - 361
Other (Income) Expense (10) - 31 24 - (54) - - (10) (19)
Pre-tax Income 1,207 2 (31) (24) 230 65 24 17 10 1,500
Taxes (77) 458 (5) (9) 11 20 9 - 4 411
Minority Interest 20 2 - - 1 - - - - 23
Goodyear Net Income 1,264$ (458)$ (26)$ (15)$ 218$ 45$ 15$ 17$ 6$ 1,066$
EPS 4.74$ (1.71)$ (0.10)$ (0.06)$ 0.82$ 0.17$ 0.06$ 0.06$ 0.02$ 4.00$

Full Year 2015 Significant Items (a)
(After Tax and Minority Interest)
(a) Restated for the new guidance on the presentation of debt issuance and amortization costs. 37
Terms: US$ millions, Shares in millions
(except EPS)
As
Reported
Loss on
Deconsolidation of
Venezuelan
Subsidiary
Rationalizations,
Asset Write-offs,
and Accelerated
Depreciation
Pension
Settlement
Debt
Redemption
Charges for
Labor Claims
Related to a
Closed Facility
in Greece
Gain on
Recognition of
Deferred
Royalty Income SRI Share Sale
Net Income
and Other
Discrete Tax
Benefits
Transaction
Costs and Net
Gains on Asset
Sales
Insurance
Recovery -
Discontinued
Products As Adjusted
Net Sales 16,443$ -$ -$ -$ -$ -$ -$ -$ -$ -$ -$ 16,443$
Cost of Goods Sold 12,164 - (9) (88) - - - - 1 - - 12,068
Gross Margin 4,279 - 9 88 - - - - (1) - - 4,375
SAG 2,614 - - (49) - - - - 2 (6) - 2,561
Rationalizations 114 - (114) - - - - - - - - -
Interest Expense 438 - - - (16) - - - - - - 422
Loss on Deconsolidation of
Venezuelan Subsidiary646 (646) - - - - - - - - - -
Other (Income) Expense (141) - - - (41) (4) 155 30 1 41 25 66
Pre-tax Income 608 646 123 137 57 4 (155) (30) (4) (35) (25) 1,326
Taxes 232 69 14 51 22 - (56) 2 19 (11) (9) 333
Minority Interest 69 - 17 - - - - - 2 (1) - 87
Goodyear Net Income 307$ 577$ 92$ 86$ 35$ 4$ (99)$ (32)$ (25)$ (23)$ (16)$ 906$
EPS 1.12$ 2.11$ 0.34$ 0.31$ 0.13$ 0.02$ (0.36)$ (0.12)$ (0.09)$ (0.08)$ (0.06)$ 3.32$

Full Year 2014 Significant Items (a)
(After Tax and Minority Interest)
(a) Restated for the new guidance on the presentation of debt issuance and amortization costs. 38
Terms: US$ millions, Shares in millions
(except EPS)
As
Reported
Discrete Tax
Items
Net Gains on
Asset Sales
Net
Venezuelan
Currency
Losses
Rationalizations,
Asset Write-offs,
and Accelerated
Depreciation
Pension
Curtailments
and
Settlements
Charges for
Labor Claims
Related to a
Closed Facility
in Greece
Government
Investigation in
Africa As Adjusted
Net Sales 18,138$ -$ -$ -$ -$ -$ -$ -$ 18,138$
Cost of Goods Sold 13,906 (11) - - (7) (38) - - 13,850
Gross Margin 4,232 11 - - 7 38 - - 4,288
SAG 2,720 - - - - - - - 2,720
Rationalizations 95 - - - (95) - - - -
Interest Expense 444 6 - - - - - - 450
Other (Income) Expense 286 10 3 (200) - - (22) (16) 61
Pre-tax Income 687 (5) (3) 200 102 38 22 16 1,057
Taxes (1,834) 1,972 - 25 9 - - - 172
Minority Interest 69 1 1 - 22 2 - - 95
Goodyear Net Income 2,452$ (1,978)$ (4)$ 175$ 71$ 36$ 22$ 16$ 790$
EPS 8.78$ (7.09)$ (0.01)$ 0.63$ 0.25$ 0.13$ 0.08$ 0.06$ 2.83$

Full Year 2013 Significant Items (a)
(After Tax and Minority Interest)
(a) Restated for the new guidance on the presentation of debt issuance and amortization costs. 39
Terms: US$ millions, Shares in millions
(except EPS)
As
Reported
Net Venezuela
Remeasurement
Loss
Rationalizations,
Asset Write-offs,
and Accelerated
Depreciation
Charges for
Labor Claims
Related to a
Closed Facility
in Greece
Discrete Tax
Items
Net Gains on
Asset Sales
Insurance
Recoveries
from Thailand
Flood As Adjusted
Net Sales 19,540$ -$ -$ -$ (5)$ -$ -$ 19,535$
Cost of Goods Sold 15,422 - (23) - - - - 15,399
Gross Margin 4,118 - 23 - (5) - - 4,136
SAG 2,758 - - - - - - 2,758
Rationalizations 58 - (58) - - - - -
Interest Expense 407 - - - (1) - - 406
Other (Income) Expense 82 (115) - (6) 11 8 9 (11)
Pre-tax Income 813 115 81 6 (15) (8) (9) 983
Taxes 138 23 10 - 39 (1) (2) 207
Minority Interest 46 - 13 - (7) - (1) 51
Goodyear Net Income 629$ 92$ 58$ 6$ (47)$ (7)$ (6)$ 725$
EPS 2.28$ 0.33$ 0.21$ 0.02$ (0.17)$ (0.02)$ (0.02)$ 2.63$

Full Year 2012 Significant Items (a)
(After Tax and Minority Interest)
(a) Restated for the new guidance on the presentation of debt issuance and amortization costs. 40
Terms: US$ millions, Shares in millions
(except EPS)
As
Reported
Rationalizations,
Asset Write-offs,
and Accelerated
Depreciation
Debt
Repayments
Charges for
Labor Claims
Related to a
Closed Facility
in Greece
Discrete Tax
Items
Pension
Settlement
South Africa
Strike
Fayetteville
Tornado
Net Gains on
Asset Sales
Insurance
Recoveries
from Thailand
Flood As Adjusted
Net Sales 20,992$ -$ -$ -$ -$ -$ -$ -$ -$ -$ 20,992$
Cost of Goods Sold 17,163 (21) - - - (9) (6) (4) - - 17,123
Gross Margin 3,829 21 - - - 9 6 4 - - 3,869
SAG 2,718 - - - - - - - - - 2,718
Rationalizations 175 (175) - - - - - - - - -
Interest Expense 385 - (10) - - - - - - - 375
Other (Income) Expense 111 - (100) (25) - - - - 25 18 29
Pre-tax Income 440 196 110 25 - 9 6 4 (25) (18) 747
Taxes 203 15 - - (19) 3 - - (5) (1) 196
Minority Interest 25 24 - - 2 - - - - (2) 49
Goodyear Net Income 212$ 157$ 110$ 25$ 17$ 6$ 6$ 4$ (20)$ (15)$ 502$
EPS 0.74$ 0.63$ 0.45$ 0.10$ 0.07$ 0.03$ 0.02$ 0.02$ (0.08)$ (0.06)$ 1.92$

Full Year 2011 Significant Items (a)
(After Tax and Minority Interest)
(a) Restated for the new guidance on the presentation of debt issuance and amortization costs. 41
Terms: US$ millions, Shares in millions
(except EPS)
As
Reported
Rationalizations,
Asset Write-offs,
and Accelerated
Depreciation
Debt
Repayments Thailand Flood
Fayetteville
Tornado
Discrete Tax
Items
Net Gains on
Asset Sales As Adjusted
Net Sales 22,767$ -$ -$ -$ -$ -$ -$ 22,767$
Cost of Goods Sold 18,821 (50) - - (4) - - 18,767
Gross Margin 3,946 50 - - 4 - - 4,000
SAG 2,822 - - - - - - 2,822
Rationalizations 103 (103) - - - - - -
Interest Expense 350 - (5) - - - - 345
Other (Income) Expense 53 - (48) (21) - - 16 -
Pre-tax Income 618 153 53 21 4 - (16) 833
Taxes 201 8 - 3 - 36 (3) 245
Minority Interest 74 2 - 2 - 6 (5) 79
Goodyear Net Income 343$ 143$ 53$ 16$ 4$ (42)$ (8)$ 509$
EPS 1.26$ 0.53$ 0.20$ 0.06$ 0.01$ (0.16)$ (0.03)$ 1.87$
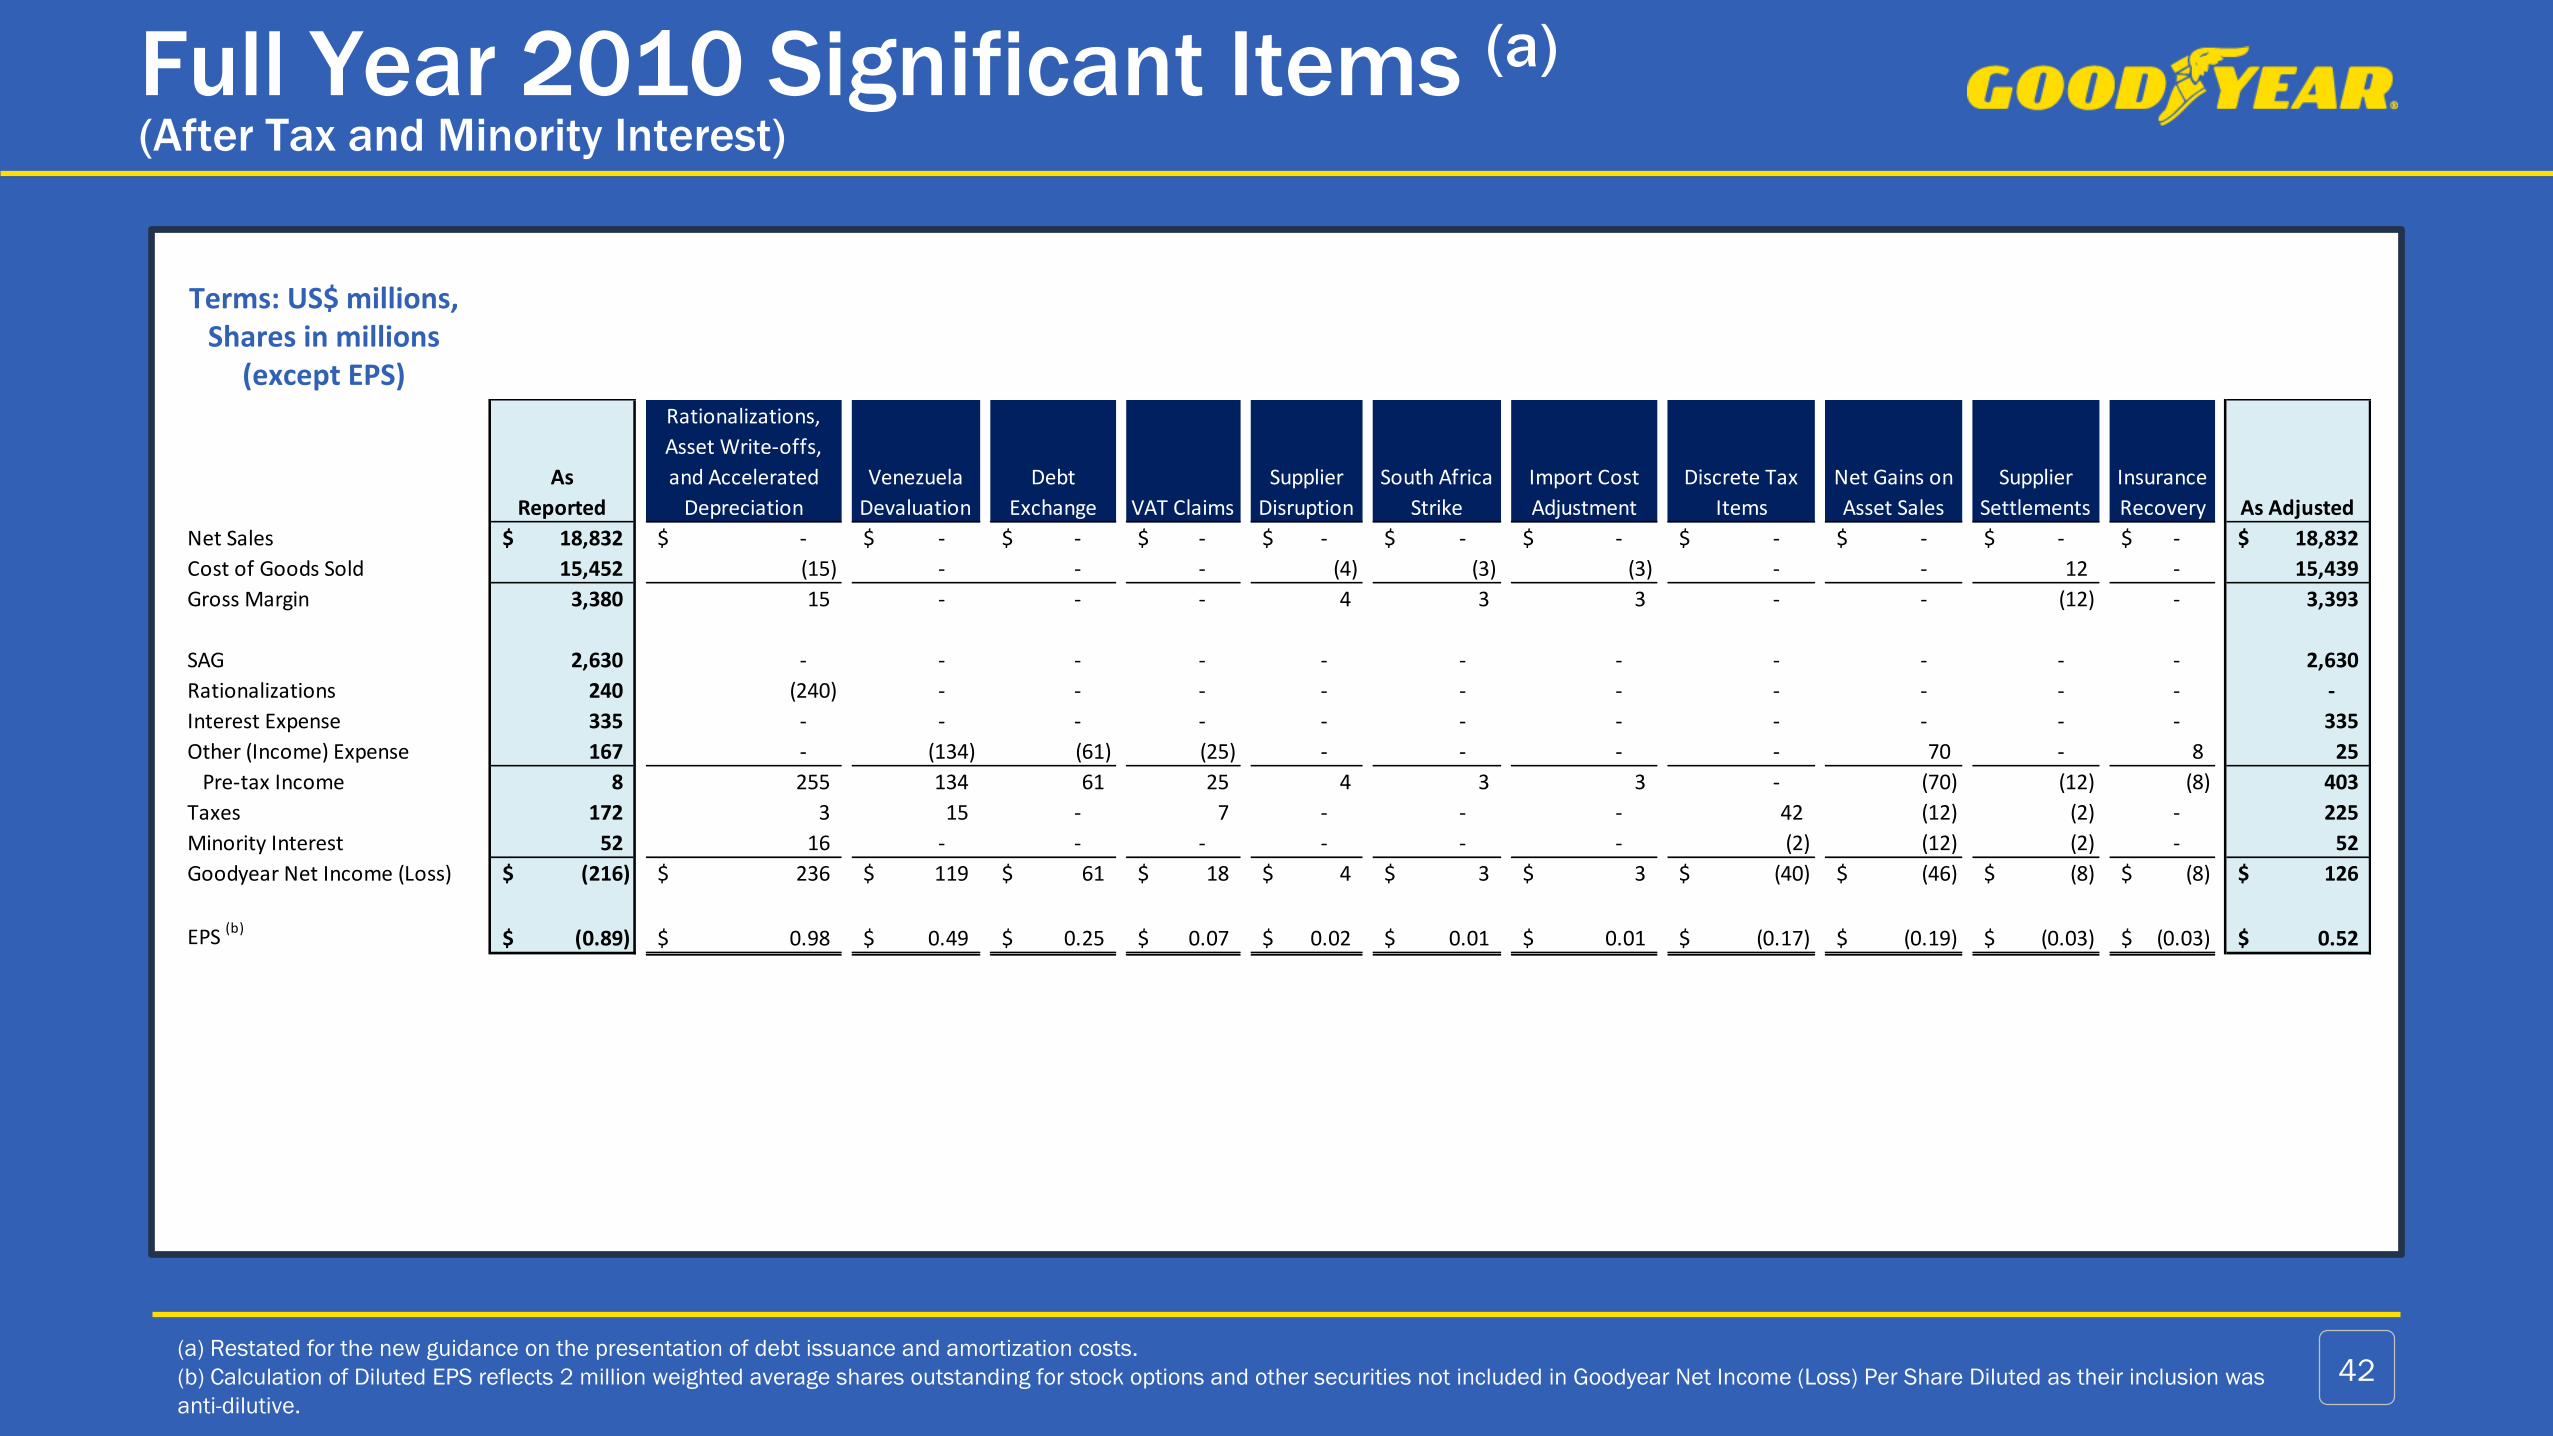
Full Year 2010 Significant Items (a)
(After Tax and Minority Interest)
42
Terms: US$ millions, Shares in millions
(except EPS)
(a) Restated for the new guidance on the presentation of debt issuance and amortization costs.
(b) Calculation of Diluted EPS reflects 2 million weighted average shares outstanding for stock options and other securities not included in Goodyear Net Income (Loss) Per Share Diluted as their inclusion was
anti-dilutive.
As
Reported
Rationalizations,
Asset Write-offs,
and Accelerated
Depreciation
Venezuela
Devaluation
Debt
Exchange VAT Claims
Supplier
Disruption
South Africa
Strike
Import Cost
Adjustment
Discrete Tax
Items
Net Gains on
Asset Sales
Supplier
Settlements
Insurance
Recovery As Adjusted
Net Sales 18,832$ -$ -$ -$ -$ -$ -$ -$ -$ -$ -$ -$ 18,832$
Cost of Goods Sold 15,452 (15) - - - (4) (3) (3) - - 12 - 15,439
Gross Margin 3,380 15 - - - 4 3 3 - - (12) - 3,393
SAG 2,630 - - - - - - - - - - - 2,630
Rationalizations 240 (240) - - - - - - - - - - -
Interest Expense 335 - - - - - - - - - - - 335
Other (Income) Expense 167 - (134) (61) (25) - - - - 70 - 8 25
Pre-tax Income 8 255 134 61 25 4 3 3 - (70) (12) (8) 403
Taxes 172 3 15 - 7 - - - 42 (12) (2) - 225
Minority Interest 52 16 - - - - - - (2) (12) (2) - 52
Goodyear Net Income (Loss) (216)$ 236$ 119$ 61$ 18$ 4$ 3$ 3$ (40)$ (46)$ (8)$ (8)$ 126$
EPS (b)(0.89)$ 0.98$ 0.49$ 0.25$ 0.07$ 0.02$ 0.01$ 0.01$ (0.17)$ (0.19)$ (0.03)$ (0.03)$ 0.52$
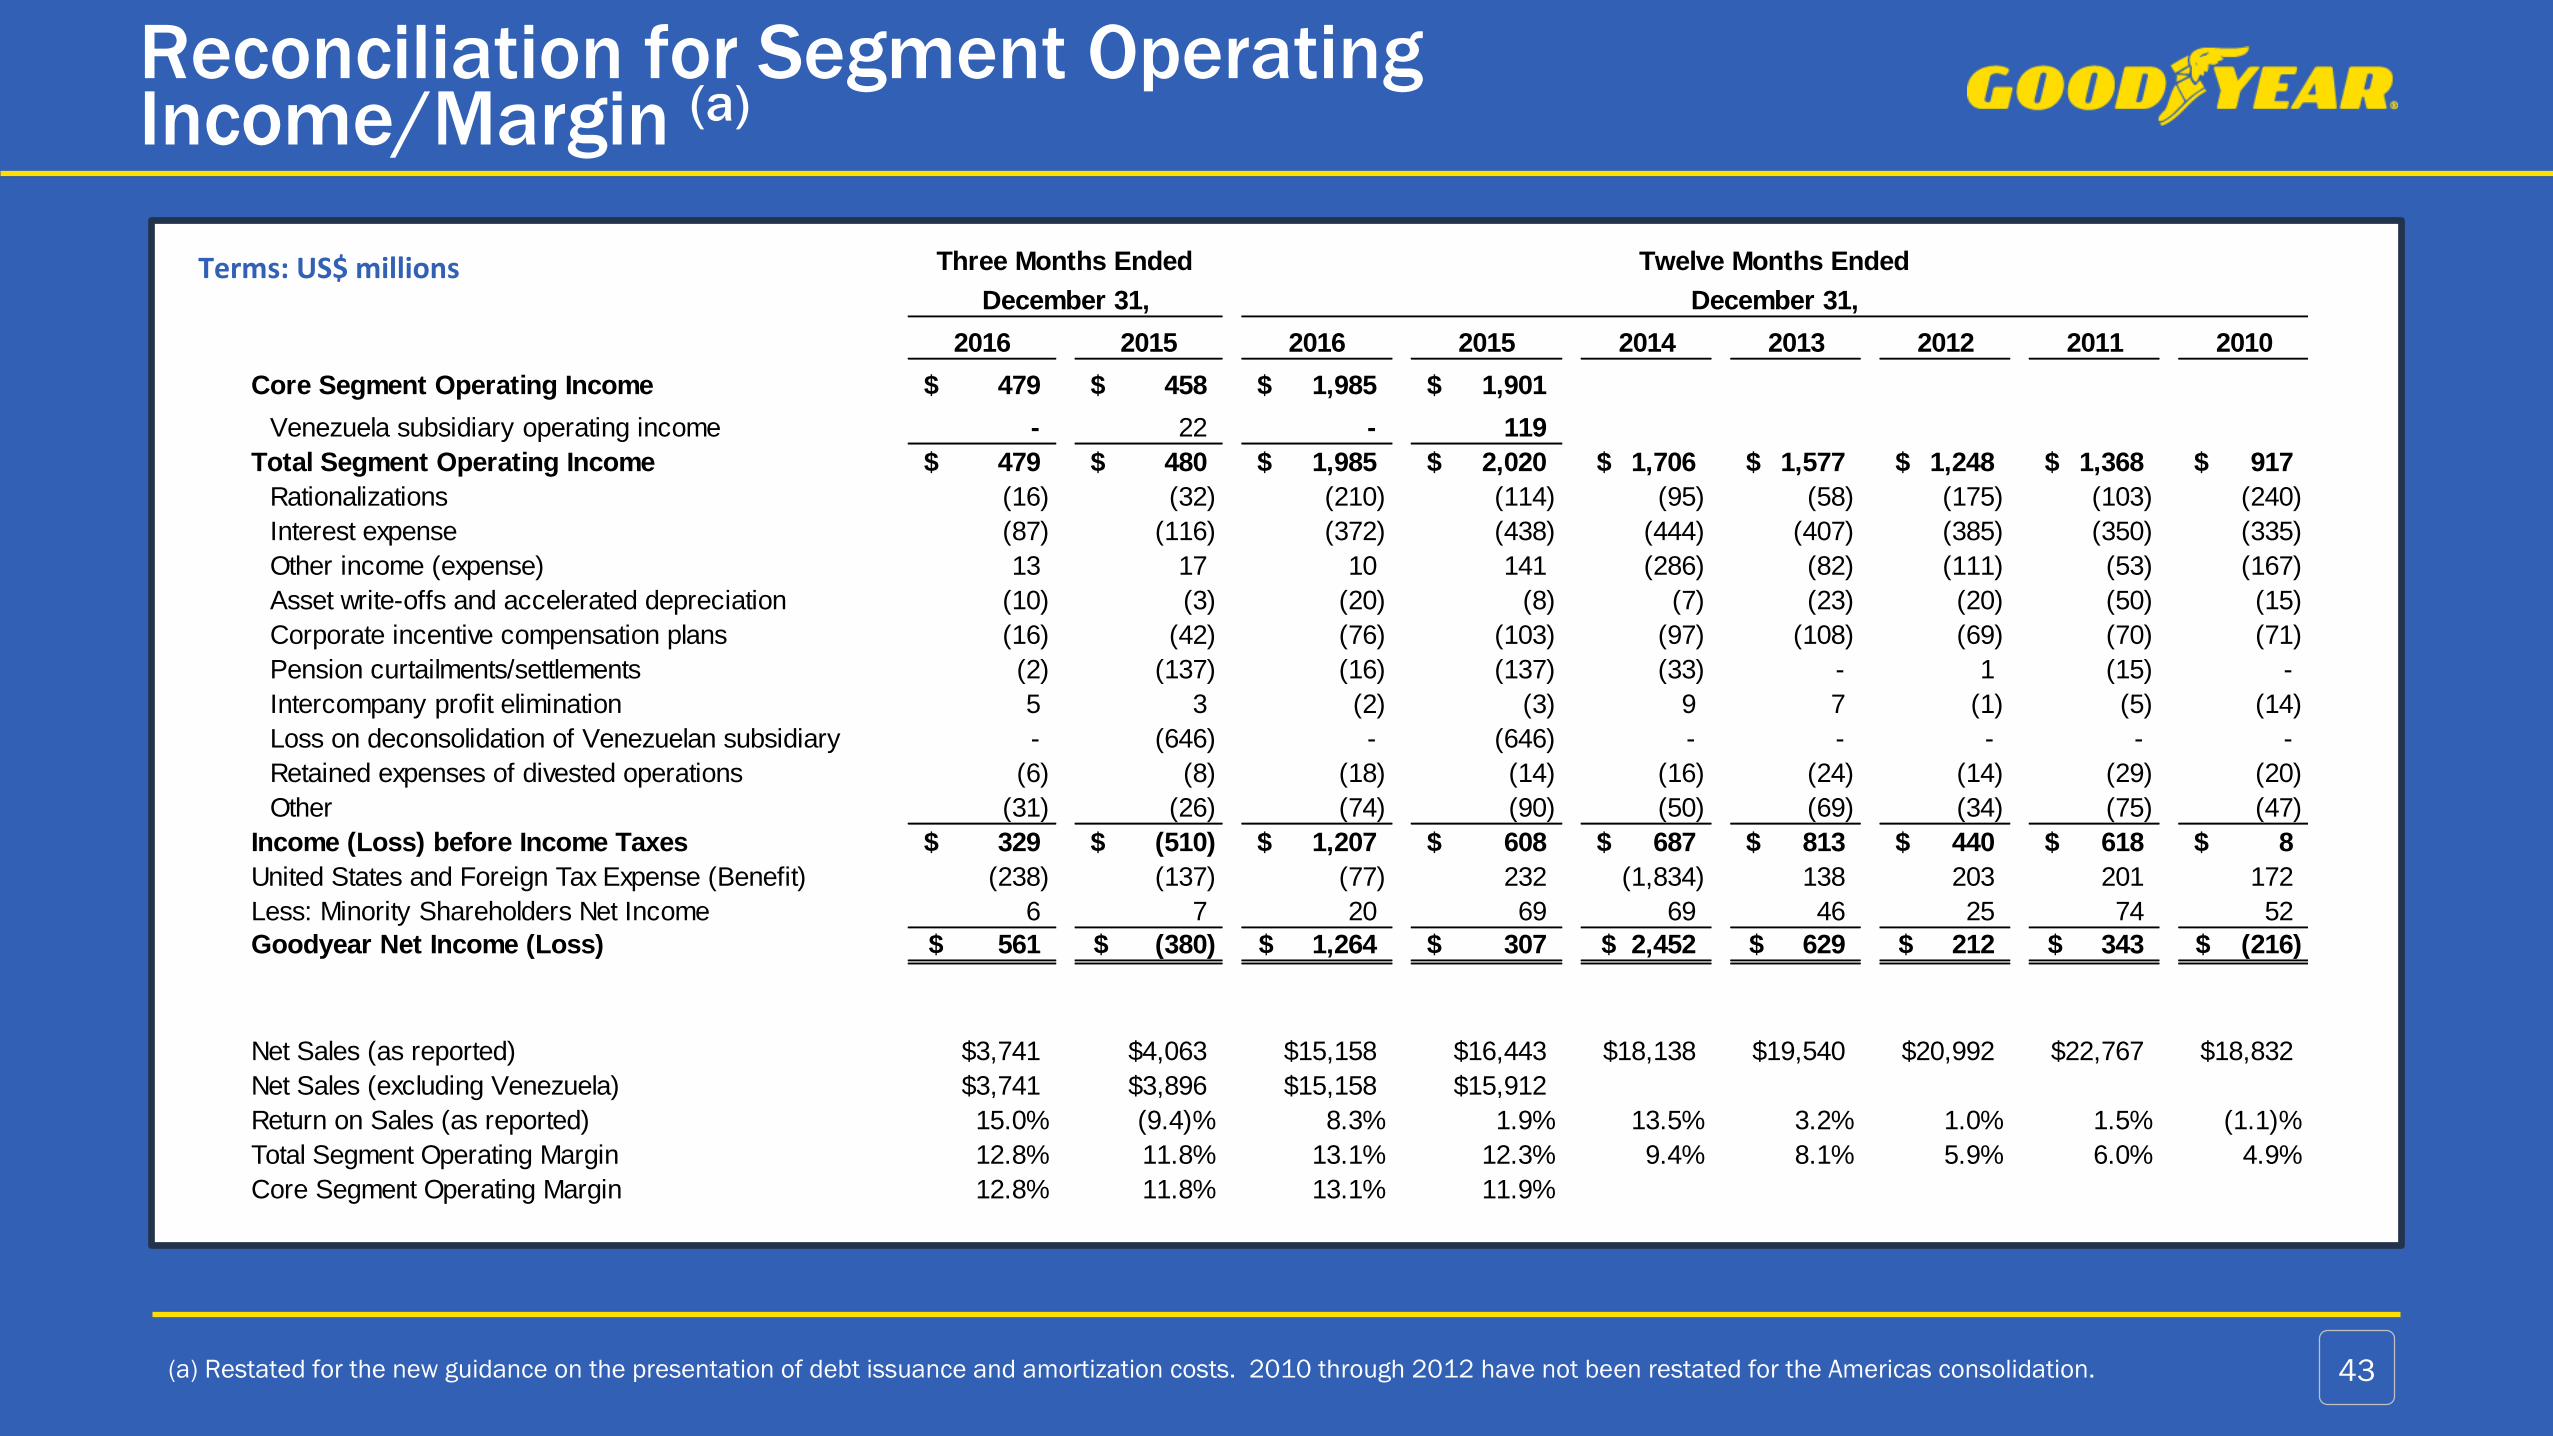
Reconciliation for Segment Operating Income/Margin (a)
43(a) Restated for the new guidance on the presentation of debt issuance and amortization costs. 2010 through 2012 have not been restated for the Americas consolidation.
Terms: US$ millions
2016 2015 2016 2015 2014 2013 2012 2011 2010
Core Segment Operating Income 479$ 458$ 1,985$ 1,901$
Venezuela subsidiary operating income - 22 - 119
Total Segment Operating Income 479$ 480$ 1,985$ 2,020$ 1,706$ 1,577$ 1,248$ 1,368$ 917$
Rationalizations (16) (32) (210) (114) (95) (58) (175) (103) (240)
Interest expense (87) (116) (372) (438) (444) (407) (385) (350) (335)
Other income (expense) 13 17 10 141 (286) (82) (111) (53) (167)
Asset write-offs and accelerated depreciation (10) (3) (20) (8) (7) (23) (20) (50) (15)
Corporate incentive compensation plans (16) (42) (76) (103) (97) (108) (69) (70) (71)
Pension curtailments/settlements (2) (137) (16) (137) (33) - 1 (15) -
Intercompany profit elimination 5 3 (2) (3) 9 7 (1) (5) (14)
Loss on deconsolidation of Venezuelan subsidiary - (646) - (646) - - - - -
Retained expenses of divested operations (6) (8) (18) (14) (16) (24) (14) (29) (20)
Other (31) (26) (74) (90) (50) (69) (34) (75) (47)
Income (Loss) before Income Taxes 329$ (510)$ 1,207$ 608$ 687$ 813$ 440$ 618$ 8$
United States and Foreign Tax Expense (Benefit) (238) (137) (77) 232 (1,834) 138 203 201 172
Less: Minority Shareholders Net Income 6 7 20 69 69 46 25 74 52
Goodyear Net Income (Loss) 561$ (380)$ 1,264$ 307$ 2,452$ 629$ 212$ 343$ (216)$
Net Sales (as reported) $3,741 $4,063 $15,158 $16,443 $18,138 $19,540 $20,992 $22,767 $18,832
Net Sales (excluding Venezuela) $3,741 $3,896 $15,158 $15,912
Return on Sales (as reported) 15.0% (9.4)% 8.3% 1.9% 13.5% 3.2% 1.0% 1.5% (1.1)%
Total Segment Operating Margin 12.8% 11.8% 13.1% 12.3% 9.4% 8.1% 5.9% 6.0% 4.9%
Core Segment Operating Margin 12.8% 11.8% 13.1% 11.9%
Three Months Ended
December 31, December 31,
Twelve Months Ended

Reconciliation for Total Debt and Net Debt
44
Terms: US$ millions
December 31, September 30, December 31,
2016 2016 2015
Long-Term Debt and Capital Leases 4,798$ 5,446$ 5,074$
Notes Payable and Overdrafts 245 179 49
Long-Term Debt and Capital Leases Due Within One Year 436 403 585
Total Debt 5,479$ 6,028$ 5,708$
Less: Cash and Cash Equivalents 1,132 975 1,476
Net Debt 4,347$ 5,053$ 4,232$

EBITDAP, Adjusted Debt & Leverage Ratio Reconciliations
45(a) Pension expense is the net periodic pension cost before curtailments, settlements and termination benefits as reported in the pension-related footnote in the Notes to Consolidated
Financial Statements.
(b) Other includes rationalization charges, other (income) expense and the loss on the deconsolidation of our Venezuelan subsidiary effective December 31, 2015.
Terms: US$ millions
2016 2015
Net Income 1,284$ $376
Interest Expense 372 438
Income Tax (Benefit) Expense (77) 232
Depreciation and Amortization 727 698
Pension Expense(a)
71 135
Other(b)
200 619
EBITDAP, as adjusted $2,577 $2,498
December 31, December 31,
2016 2015
Long-Term Debt and Capital Leases 4,798 5,074
Long-Term Debt and Capital Leases Due Within One Year 436 585
Notes Payable and Overdrafts 245 490 0
Total Debt $5,479 $5,708
Global Unfunded Pension Obligations $669 $642
Adjusted Debt $6,148 $6,350
Adjusted Debt/EBITDAP 2.39x 2.54x
Year Ended December 31,

Reconciliation for Free Cash Flow from Operations
(a) Working capital represents total changes in accounts receivable, inventories and accounts payable – trade.
(b) Pension expense is the net periodic pension cost before curtailments, settlements and termination benefits as reported in the pension-related note in the Notes to Consolidated Financial
Statements.
(c) Other includes amortization and write-off of debt issuance costs, net pension curtailments and settlements, net (gains) losses on asset sales, compensation and benefits less pension
expense, other current liabilities, and other assets and liabilities.46
Terms: US$ millions The amounts below are calculated from the Consolidated Statements of Cash Flows except for pension expense, which is as reported in the pension-related note in the Notes to Consolidated Financial Statements.
Dec. 31,
2016
Sept. 30,
2016
June 30,
2016
Mar. 31,
2016
Dec. 31,
2015
Dec. 31,
2016
Net Income (Loss) 567$ 320$ 208$ 189$ (373)$ 1,284$
Depreciation and Amortization 191 181 181 174 176 727
Change in Working Capital(a)
833 (264) (75) (611) 666 (117)
Pension Expense(b)
17 19 17 18 27 71
Provision for Deferred Income Taxes (260) (56) 41 46 (186) (229)
Capital Expenditures (285) (245) (213) (253) (327) (996)
Loss on Deconsolidation of Venezuelan Subsidiary - - - - 646 -
Net Rationalization Charges 16 135 48 11 32 210
Other(c)
(61) 61 (108) (159) 129 (267)
Free Cash Flow from Operations (non-GAAP) 1,018$ 151$ 99$ (585)$ 790$ 683$
Capital Expenditures 285 245 213 253 327 996
Pension Contributions and Direct Payments (18) (23) (23) (25) (26) (89)
Rationalization Payments (18) (16) (28) (24) (39) (86)
Cash Flow from Operating Activities (GAAP) 1,267$ 357$ 261$ (381)$ 1,052$ 1,504$
Cash Flow from Investing Activities (GAAP) (266) (242) (208) (257) (588) (973)
Cash Flow from Financing Activities (GAAP) (804) (281) 12 213 (679) (860)
Trailing Twelve
Months EndedThree Months Ended
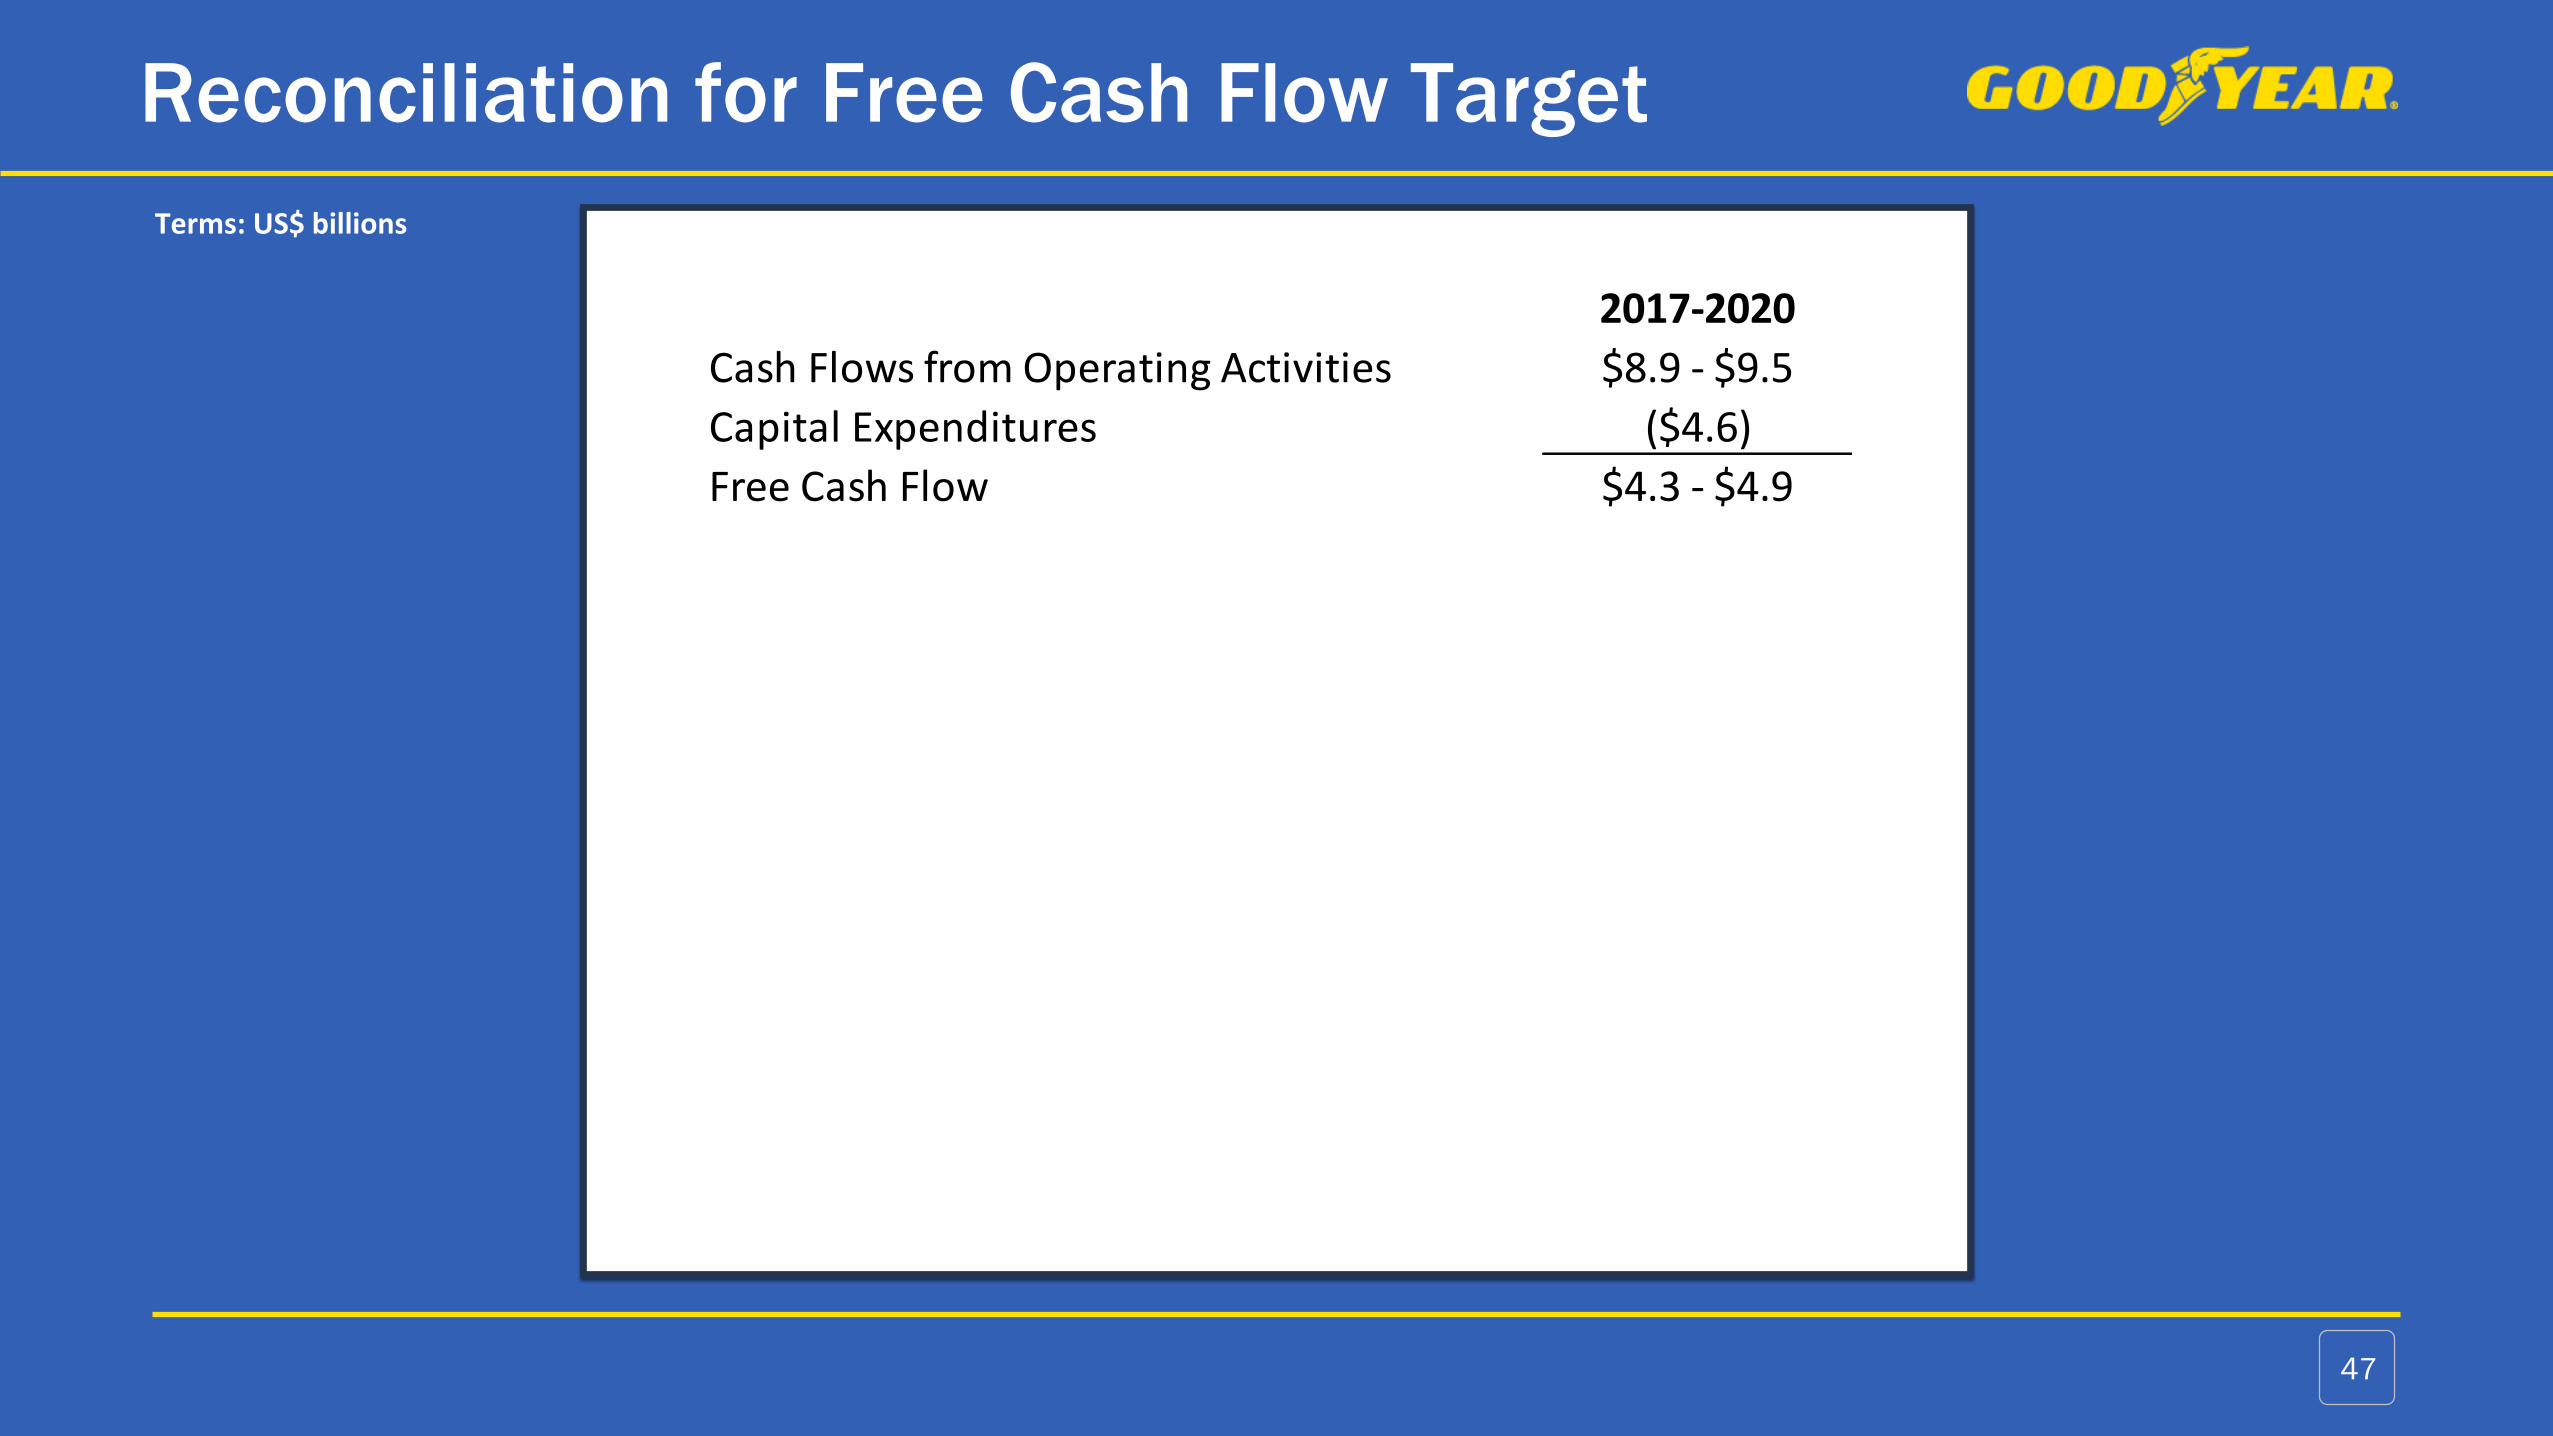
47
Reconciliation for Free Cash Flow Target
Terms: US$ billions
2017-2020
Cash Flows from Operating Activities $8.9 - $9.5
Capital Expenditures ($4.6)
Free Cash Flow $4.3 - $4.9