Embed Size (px)
Citation preview

FOURTH GRADE WEATHER
1 WEEKLESSON PLANS AND
ACTIVITIES

Math/Science Nucleus © 1990,2000 2
WATER CYCLEOVERVIEW OF FOURTH GRADE
WATER
WEEK 1.PRE: Comparing different reservoirs of water. LAB: Experimenting with surface tension and capillary action.POST: Discovering why icebergs float.
OCEANS
WEEK 2.PRE: Comparing fresh and salt water.LAB: Discovering that salt water is an electrolyte.POST: Distinguishing bodies of salt water.
ATMOSPHERE
WEEK 3.PRE: Discovering the affect of air pressure.LAB: Comparing how substances heat up.POST: Exploring how wind is created.
WEATHER
WEEK 4.PRE: Exploring different weather fronts. LAB: Comparing satellite photos and weather maps. POST: Discovering weather and climate patterns of California.

Math/Science Nucleus © 1990,2000 3
Students determine cloud typesnear weather fronts.
WATER CYCLE - WEATHER (4)
PRE LAB
OBJECTIVES:
1. Comparing cold and hot air.2. Exploring different weather fronts.
VOCABULARY:
frontslow pressurehigh pressureatmospheric pressure
MATERIALS:
worksheet
BACKGROUND:
Atmospheric pressure moves weather systems. Cold air is more dense than warmair causing what is called high pressure. Warm air which is lighter cause low pressure.In the area of higher pressure the air molecules are closer together than they are in anarea of lower pressure. Air that is warmed exerts less pressure on the ground creating alow pressure region. Cold air when it is over the oceans will actually depress the sea levelin that area; warm air will elevate the sea level.
Cold air is denser and heavier and pushes the warmer, lighter air upward.Depending on how the warmer air is pushed will depend upon how big the "fight" will be.Where these two air masses meet is called a "front." How these different fronts meetcause weather patterns to change. Remember there are many temperature variations of"cold" air and "warm" air, resulting in many weather types.
Fronts form when air masses collide, for air masses do not mix unless they aresimilar in temperature and moisture content. When warm air displaces cold air at theground, the front is referred to as a warm front. When cold air replaces warm air at theground the front is referred to as a cold front.
Vilhelm Bjerknes (1862-1951), a Norweigian meteorologist discovered the existenceof a distinct air mass that did not mix, which he called a boundary front. His observationsand recordings lead other meteorologists to begin understanding how fronts are causedand moved.

Math/Science Nucleus © 1990,2000 4
Altostratus, Nimbostratus
Cirrus
PROCEDURE:
1. Looking at the worksheet, “Cold Front” refers to cold air pushing hard into warmair. The type of weather created would include showers and thunderstorms. This is calleda cold front. “Warm Front” refers to warm air gently wedging under cold air. Widespreadclouds with rain for a long duration is the prevalent weather, although it is highly erratic.This is called a warm front. Students should label the area between the two masses asthe front in each diagram.
2. Read the following informationabout warm and cold fronts to students.They should then try to draw thisinformation on the worksheet. If yourstudents do not remember the differenttypes of clouds, you may want to reviewcloud types with them. Cirrus are high clouds which arewispy, icy clouds. Cumulus or puffyclouds are mid level clouds that arepacked close together. Stratus cloudsare a long uniform layer of cloudsresembling fog but not resting on theground. Nimbus when used with a cloudname refers to a dark cloud usuallymeaning rain.
WARM FRONT: Warm, moist air from the
tropics slides over a wedge ofcold polar air. As the warm airmoves over the cold air. Wispycirrus clouds form and a milky veilof cirrostratus clouds can beseen. Above the base of thefront, clouds thicken first withaltostratus above great, graynimbostratus clouds. A rainstorm falls in the cold sectorbeneath the front.

Math/Science Nucleus © 1990,2000 5
Cumulus
Cumulonimbus
COLD FRONT:
Thickening cumulus clouds warn of the coming cold front, where cold polar air cutsin sharply beneath the warm, moist tropical air. The cold front slopes much more steeplythan the warm front, and strong updrafts can stir up violent storms. Huge cumulonimbusmany build up all along the front, bring heavy rain and sometimes thunderstorms as itpasses over.

Math/Science Nucleus © 1990,2000 6
WATER CYCLE - WEATHER (4)
Thickening cumulus clouds warn of the coming cold front, where cold polar air cutsin sharply beneath the warm, moist tropical air. The cold front slopes much more steeplythan the warm front, and strong updrafts can stir up violent storms. Huge cumulonimbusmany build up all along the front, bring heavy rain and sometimes thunderstorms as itpasses over.
Warm, moist air from the tropics slides over a wedge of cold polar air. As the warmair moves over the cold air. Wispy cirrus clouds form and a milky veil of cirrostratus cloudscan be seen. Above the base of the front, clouds thicken first with altostratus above great,gray nimbostratus clouds. A rain storm falls in the cold sector beneath the front.

Math/Science Nucleus © 1990,2000 7
Students compare cloud cover onsatellite images.
WATER CYCLE - WEATHER (4)
LAB
OBJECTIVES:
1. Analyzing weather satellite photos.2. Creating a cloud cover map.
VOCABULARY:
meteorologistsatellite photoweather map
MATERIALS:
InternetSymbols Used in Plotting ReportSatellite Map-Southeastern Coast of U.S.United States Placematsnewspaper weather map
BACKGROUND:
Although students have heard TV weather personalities talk about weather satellitephotos, many students do not know really what they mean. Weather is constantlychanging, satellite photos record this dynamic changing system. A satellite photo is whatan area actually looks like from space. There are many types of data that satellites canobtain. They can chart the movement of cloud cover, heat, precipitation, and many otherparameters. Satellite photos have provided an invaluable tool to understand how weathermoves. Sometimes the data may reflect only what the satellite can detect. For instanceon cloud photos, they may only record the highest type of cloud.
A weather map is a graphical representation of how the meteorologist may interpretthe information they receive. The weather map is a way to chart all the data points toeasily see if there are patterns emerging from the weather patterns.
PROCEDURE:
1. Refer back to last week's lab on how air moves. Discuss pressure systems.High pressures refers to air that dense which usually refers to cold air. Low pressuresrefers to air whose molecules are farther apart, which usually refers to warm air. Pressuremoves from high to low pressure.
Math/Science Nucleus © 1990,2000 8
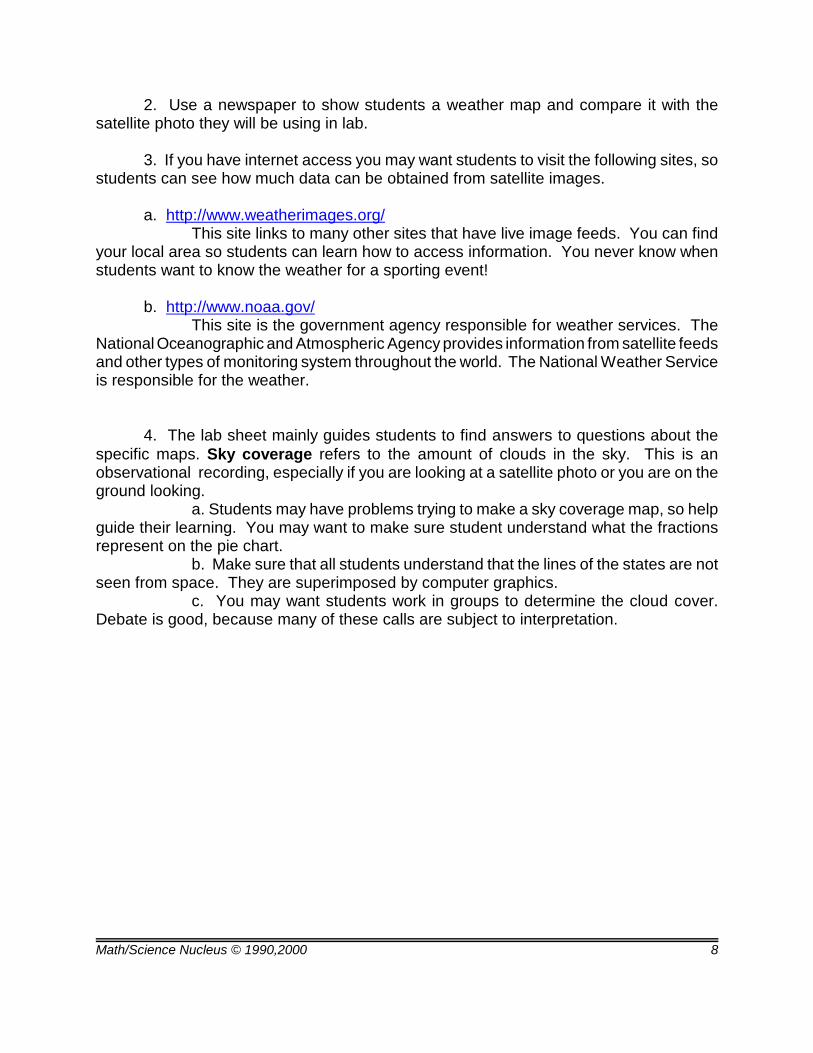
2. Use a newspaper to show students a weather map and compare it with thesatellite photo they will be using in lab.
3. If you have internet access you may want students to visit the following sites, sostudents can see how much data can be obtained from satellite images.
a. http://www.weatherimages.org/This site links to many other sites that have live image feeds. You can find
your local area so students can learn how to access information. You never know whenstudents want to know the weather for a sporting event!
b. http://www.noaa.gov/This site is the government agency responsible for weather services. The
National Oceanographic and Atmospheric Agency provides information from satellite feedsand other types of monitoring system throughout the world. The National Weather Serviceis responsible for the weather.
4. The lab sheet mainly guides students to find answers to questions about thespecific maps. Sky coverage refers to the amount of clouds in the sky. This is anobservational recording, especially if you are looking at a satellite photo or you are on theground looking.
a. Students may have problems trying to make a sky coverage map, so helpguide their learning. You may want to make sure student understand what the fractionsrepresent on the pie chart.
b. Make sure that all students understand that the lines of the states are notseen from space. They are superimposed by computer graphics.
c. You may want students work in groups to determine the cloud cover.Debate is good, because many of these calls are subject to interpretation.

Math/Science Nucleus © 1990,2000 9
WATER CYCLE - WEATHER (4) PROBLEM: What do satellite pictures tell us about the weather?PREDICTION: ___________________________________________________________PROCEDURE: Study and compare the satellite photo maps and answer the questionsbelow. Use maps of the United States reference to help you find specific locations.
1. Which part of the United States is shown in the photo maps?(North, East, South, West)_______________________________________________________________________
2. How many states are shown on 12/7-8/97 satellite photo map? List them._____________________________________________________________________________________________________________________________________________________________________________________________________________________
3. On which satellite map is North Carolina the most cloudy?_______________________________________________________________________
4. On which photo map can you best see New Orleans in Louisiana?_______________________________________________________________________
5. On which photo map is Georgia the least cloudy? _____________________________
6. What kind of clouds are over the Atlantic Ocean on 12/8/97?_______________________________________________________________________
7. Are the white patches over the Appalachia in South Carolina (12/8/97) clouds or snow?How do you know? _____________________________________________________________________________________________________________________________
8. On which satellite photo does the cloud cover seem to be coming from the west?Explain why._____________________________________________________________________________________________________________________________________________
9. Look at the blank maps of the southeast. Create your own sky coverage map from theinformation given on the satellite photos. Label states, Gulf of Mexico, and Atlantic Ocean.
CONCLUSIONS: Can you predict the cloud cover for 12/9/97 with the information givenon the photos labeled,”Cloud Cover Southeastern United States”?____________________________________________________________________________________________________________________________________________________________________________________________________________________________________________________________________________________________

Math/Science Nucleus © 1990,2000 10
WATER CYCLE - WEATHER (4) LAB
CLOUD COVER SOUTHEASTERN UNITED STATES
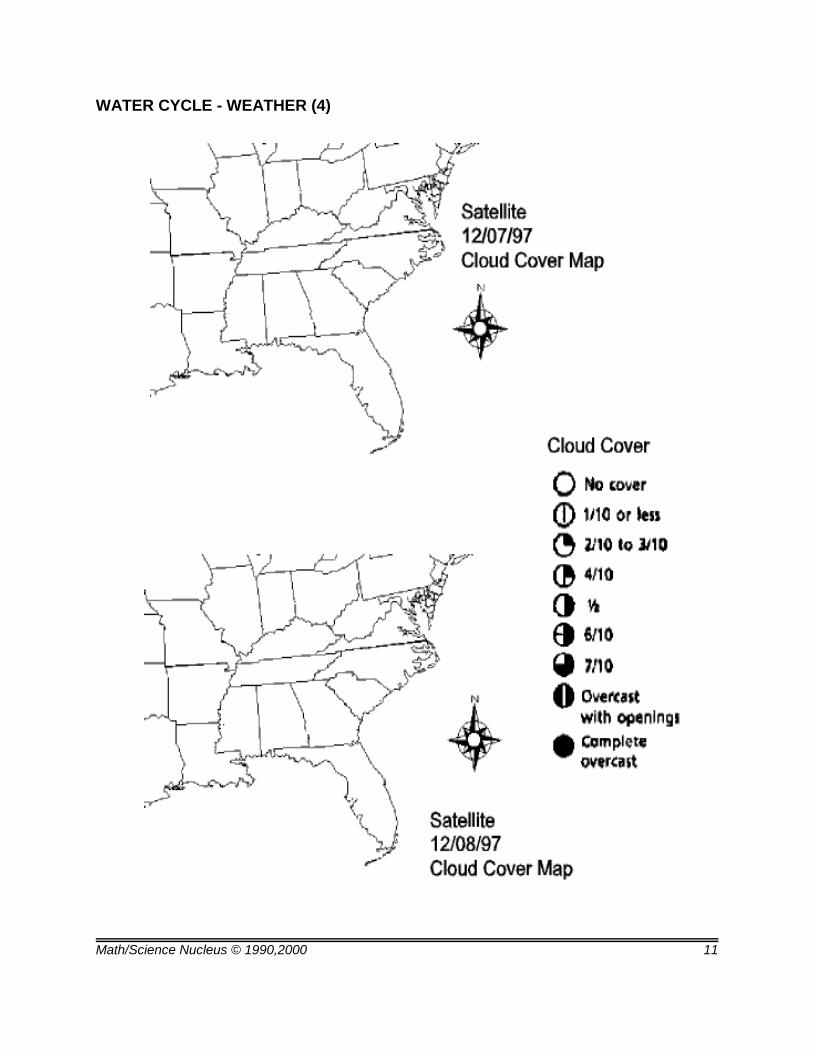
Math/Science Nucleus © 1990,2000 11
WATER CYCLE - WEATHER (4)

Math/Science Nucleus © 1990,2000 12
Students look for weatherpatterns to determine climate.
WATER CYCLE - WEATHER (4)
POST LAB
OBJECTIVES:1. Analyzing the average weather over a period of time.2. Discovering weather and climate patterns using the Internet.
VOCABULARY: snow rain mild climate cold climate warm climate
MATERIALS:
U.S. PlacematInternetother reference materials
BACKGROUND:
Climate can be considered the average weather conditions over a long period oftime. The climate is influenced by latitude, land and water distribution, altitude, landbarrier, air movement, ocean currents, permanent storm areas, temperature, humidity,precipitation, cloud cover, high and low pressure centers, and other weather phenomena.
Overall the major control is governed by solar radiation. This was first recognizedby Eratosthenes (276-192BC) who observed that the angle of the Sun’s rays hadsomething to do with solar radiation. This in effect is due to the tilt of the Earth on its axis,which throughout the year causes the change of the seasons. However, do not confuseseasons with climate. climate has many other factors that have to be considered. Forinstance the climate in St. Louis, Missouri, Washington, D.C. and San Francisco, Californiaare very different, but yet they receive the same solar radiation. Mountains, closeness tocoastal area, and other parameters can cause very different climate.
Climates can be defined by temperature, rain, and humidity. We recognize thefollowing: Tropical climates (rainforest, savanna and monsoon); dry climates (desert andgrasslands); mid-latitude climate (humid subtropical, marine west coast, Mediterranean,and mid latitude monsoon); and polar including tundra areas which are frozen all yearround.
PROCEDURE:
1. The internet has a wealth of information for students to use to develop their own

Math/Science Nucleus © 1990,2000 13
idea of climate. In this exercise the web sites provide long term information on temperatureand precipitation. On the web site we highly suggest you access data from any year.There is many ways to have the students interpret this data.
http://www.cdc.noaa.gov/USclimate/USclimdivs.html
a. Students could compare the temperature and/or precipitation the year they wereborn and last year.
b. Students could look at every 10 years of temperature and see if the UnitedStates is actually “cooling” or “warming.” Debate is sure to occur.
c. Students can look at five years in a row, and see if they could predict the 6th yearwith that information.
2. If you do not have internet access we suggest that you use the figures includedin this lesson and have the students look at all the states to determine whether it hasgotten cooler or warmer. Use a map of the United States to make sure that students knowtheir states. You may want them record the information on a blank map or just to just togather the data in a data chart.
3. The worksheet has the students look at temperature in the United States inJanuary, 1990 and January, 1996. You cannot make a “scientific conclusion” from only twodata points. To interpret data you must have sufficient data to make a valid interpretationthat is accurate. New data can sometimes change the interpretation.

Math/Science Nucleus © 1990,2000 14
WATER CYCLE - WEATHER (4) POST http://www.cdc.noaa.gov/USclimate/USclimdivs.html
Can you interpret if the temperatures are getting hotter from January, 1990 to January,1996? What states were warmer? Which states were colder? Which states remained thesame temperature? Do you have enough information to make a generalized statement.