Embed Size (px)
Citation preview
FOURIER TRANSFORM ION CYCLOTRON RESONANCE MASS
SPECTROMETRY INSTRUMENTATION DESIGN AND
DEVELOPMENT: REDUCTION OF ION CLOUD DE-PHASING
AND TIME-OF-FLIGHT DISCRIMINATION
By
Nathan Kenneth Kaiser
A dissertation submitted in partial fulfillment of the requirements for the degree of
DOCTOR OF PHILOSOPHY
WASHINGTON STATE UNIVERSITY Department of Chemistry
December 2007

To the Faculty of Washington State University: The members of the Committee appointed to examine the dissertation of NATHAN KENNETH KAISER find it satisfactory and recommend that it be accepted.
________________________________
Chair
________________________________
________________________________
ii

ACKNOWLEDGEMENTS
The work presented here could not have been accomplished without the support and
dedication of many individuals. I would like to thank my committee chair and advisor
Dr. James E. Bruce for giving me the opportunity to work in his lab and for providing the
resources necessary to conduct cutting-edge scientific research. He not only helped to
develop my interest for mass spectrometry with his never ending enthusiasm and crazy
ideas and to become an independent researcher but also to grow as a person. I also would
like to thank all my committee members Dr. William F. Siems, Dr. Herbert H. Hill, and
Dr. Ken Nash.
I am grateful for the support I received from Gordon Anderson and David Prior at Pacific
Northwest National Laboratory, their advice on electronics and design of various aspects
of the instrument proved extremely valuable. I would also like to thank the Technical
Services at WSU, in particular all the people at the Machine shop who offered very useful
advice and were responsible for fabricating many of the components for the FTICR mass
spectrometer I helped build.
I would also like to acknowledge all members of the Bruce group present and past, for all
their support and valuable suggestions. In particular I would like to thank Sisi Wu and
Kai Zhang for helping with the initial development of the instrument, and Gunnar
Skulason for all his advice and expertise with electronics and instrument design.
iii

FOURIER TRANSFORM ION CYCLOTRON RESONANCE MASS
SPECTROMETRY INSTRUMENTATION DESIGN AND
DEVELOPMENT: REDUCTION OF ION CLOUD DE-PHASING
AND TIME-OF-FLIGHT DISCRIMINATION
Abstract
By Nathan Kenneth Kaiser, Ph.D.
Washington State University December 2007
Chair: James E. Bruce Fourier Transform Ion Cyclotron Resonance (FTICR) mass spectrometers are the
instruments of choice for analysis of biological ions produced through electrospray
ionization. FTICR mass spectrometers offer highest possible resolution and greatest
mass measurement accuracy of any current mass spectrometer. Though FTICR mass
spectrometers are the highest performance mass spectrometers available, it is a relatively
new technique and still not fully understood in terms of ion dynamics during image
current detection. Thus, there are still many improvements to be made to FTICR
instrumentation. In this research, we explore a novel way to improve ion current
detection and develop instrumentation to overcome the shortcomings of the current ion
injection methods.
We have developed a new technique called Electron Promoted Ion Coherence or EPIC to
improve duration of the detected time-domain signals. The EPIC technique consists of
iv

injecting a high density beam of electrons through the center of the ICR cell during
detection. De-phasing of ion packets during image current detection leads to loss of
signal. In principle, the longer the signal is detected the greater the instrument
performance. With EPIC, we have been able to detect image current for up to 70 seconds
as well as obtain isotopic fine structure. Both experimental and theoretical studies were
carried out to establish a theory on how EPIC improves image current detection. The
basis of the enhancement is from the alteration of the radial electric fields with the
application of the electron beam.
A novel FTICR mass spectrometer which utilizes a 3 Tesla magnet has been developed in
our laboratory. There are number of novel features implemented in this instrument, such
as a flared capillary inlet tube, electrodynamic ion funnel, Restrained Ion Population
Transfer (RIPT) ion guide and a Trapping Ring Electrode Cell (TREC). The RIPT ion
guide was developed to eliminate time-of-flight mass discrimination, as well as transfer
ions of low kinetic energy to the ICR cell. TREC was designed to allow tuning of radial
electric fields during the ICR experiment to improve overall performance.
v

TABLE OF CONTENTS
Page
ACKNOWLEDGEMENTS………………………………………………...…………… iii
ABSTRACT…………………………………………………………………………….. iv LIST OF TABLES………………………………………………………………………...x LIST OF FIGURES………………………………………………………………………xi DEDICATION…………………………………………………………………………..xiv CHAPTER 1 Introduction Research Objectives………………………………………………...……. 1 Fourier Transform Ion Cyclotron Resonance Mass Spectrometry………..2 Attributions………………………………………………………………14 References………………………………………………………………..16 CHAPTER 2 Improved Mass Accuracy for Tandem Mass Spectrometry Abstract…………………………………………………………………..26 Introduction……………………………………….………………..…….27 Experimental………………………………………………………….….32 Results and Discussion……………………………………………….….34 Conclusions………………………………………………………………40 Acknowledgements………………………………...…………...………..41 References………………………………………………………………..42
vi

CHAPTER 3 Observation of Increased Ion Cyclotron Resonance Signal Duration through Electric Field Perturbations Abstract…………………………………………………....……………..54 Introduction…………………………………………...………………….56 Experimental………………………………………….………………….62 Results and Discussion…………………………………………………..64 Conclusions……………………………………...……………………….74 Acknowledgements………………………………………………………75 References…………………………………..……………………………76 CHAPTER 4 Reduction of Ion Magnetron Motion and Space Charge using Radial Electric Field Modulation Abstract…………………………………………………………………..90 Introduction………………………………………………………………91 Experimental…………………………………………..…………………94 Results and Discussion…………………………….…………………….96 Conclusions…………………………………….……………………….110 Acknowledgements…………………………………….……………….110 References………………………………………………………………111 CHAPTER 5 Reduction of Axial Kinetic Energy Induced Perturbations on Observed Cyclotron Frequency
vii
Abstract…………………………………………………………...…….124 Introduction……………………………………………..………………125 Experimental……………………………………………...…………….129 Results and Discussion………………..………………………………..132 Conclusions……………………………………………………………..144 Acknowledgements……………………………………………….…….145 References………………………………………………………..……..145 CHAPTER 6 Restrained Ion Population Transfer: A Novel Ion Transfer Method for Mass
Spectrometry Abstract…………………………………………………………...…….159 Introduction………………………………………..……………………160 Experimental……………………………………………………………164 Results and Discussion…………………………………..……………..168 Conclusions………………………………………………….………….176 Acknowledgements……………………………………..………………176 References…………………………………………..…………………..177 CHAPTER 7 A Novel Fourier Transform Ion Cyclotron Resonance Mass Spectrometer for Biomolecule Analysis Abstract…………………………………………………………………189 Introduction……………………………………………………………..190 Experimental……………………………………………………………193
viii

Results and Discussion…………………………………………………195 Conclusions…………………………………………………………..…199 Acknowledgements……………………………………………………..200 References……………………………………………………………....200 CHAPTER 8 Overall Conclusions Conclusions……………………………………………………………..211
ix

LISTS OF TABLES
Chapter 2 Table 1. Improved probability of protein identification ………………………………..53 Chapter 6 Table 1. Ion kinetic energy with different voltage ramps in RIPT……………………..188
x

LISTS OF FIGURES
Chapter 2: Figures Figure 1. Illustration of the application of DeCAL……………………………...………46 Figure 2. ECD spectrum of ubiquitin (M+11H)11+……………………………………..47 Figure 3. Mass measurement accuracy without DeCAL …………………………….…48 Figure 4. Mass measurement accuracy with DeCAL ……………………………….….49 Figure 5. ECD spectrum of myoglobin (M+16H)16+ ………………………………..….50 Figure 6. Mass measurement accuracy without DeCAL …………………………….…51 Figure 7. Mass measurement accuracy with DeCAL …………………………………..52 Chapter 3: Figures Figure 1. Initial observation of EPIC …………………………………………….……..80 Figure 2. Transient obtained with ubiquitin (M+6H)6+ …………………………...……81 Figure 3. Frequency shift analysis of bradykinin (M+2H)2+ ……………………….…..82 Figure 4. Frequency shift analysis of substance P (M+2H)2+ …………………………..83 Figure 5. Mass spectrum of substance P (M+2H)2+ ……………………………...……..84 Figure 6. Fine structure ………………………………………………………………....85 Figure 7. Comparison of transient length of ubiquitin (M+6H)6+ ………………..…… 86 Figure 8. Comparison of mass spectra of ubiquitin (M+6H)6+ ……………………...….87 Figure 9. Peak coalescence ………………………………………………………….….88 Figure 10. Removal of peak coalescence with the application of EPIC…………………89
xi

Chapter 4: Figures Figure 1. SIMION plot of equipotential contour lines………………………………….115 Figure 2. affect of the number of electrons have on the measured frequency……….....116 Figure 3. radial electric fields…………………………………………………….…….118 Figure 4. frequency shift with time at different cyclotron radius………………………119 Figure 5. frequency shift with time a different electron current………………………..120 Figure 6. mass measurement accuracy with EPIC…………………………………...…121 Figure 7. electron beam switched on/off/on during detect……………………………. 122 Figure 8. electron current measurements……………………………………………….123 Chapter 5 Figures Figure 1. “Double trap” experiment…………………………………………………….151 Figure 2. radial fields and magnetron frequency…………………….………………... 153 Figure 3. observed cyclotron frequency with different ion cooling techniques………..154 Figure 4. experimental determination of magnetron frequency………………………...155 Figure 5. z-axis excitation……………………………………………………………....156 Figure 6 radial electric field and electric potential well with and without EPIC……….157 Figure 7 “Double trap” experiment with EPIC…………………………………………158 Chapter 6 Figures Figure 1. RIPT ion guide set-up……………………………………………...…………181 Figure 2. SIMION simulation of ion transfer……………………………….………….182 Figure 3. adiabatic increase and decrease of ion kinetic energy…………………..……183
xii

Figure 4. ion transfer voltage potentials………………………………………..………184 Figure 5. electron multiplier data from RIPT transfer………………………………….185 Figure 6. Spectrum taken with RIPT transfer…………………………………………..186 Figure 7. Ion transfer of comparison between gated trapping and RIPT……………….187 Chapter 7 Figure 1. vacuum and ion optic design of our new FTICR mass spectrometer…….…..206 Figure 2. ICR cell design……………………………………………………………….207 Figure 3. comparison of open cell vs. TREC…………………………………….……..208 Figure 4. comparison of closed ICR cell vs. TREC…………………………...………..209 Figure 5. kinetic energy profile of ions entering the ICR cell with RIPT and gated Trapping………………………………………………………………………210
xiii

Dedication
This dissertation is dedicated to: my Dad and Mom,
my two brothers Gabe and Chad, and my sister Kelli
xiv
CHAPTER 1 Introduction Research Objectives
Mass spectrometry has become an indispensable tool for the analysis of complex
biological samples, especially in the area of proteomics. Proteomics is the area of
research that explores the dynamically changing proteome. It is an analysis of all
proteins which are expressed, the quantity of protein present, and location of proteins,
which may change based the state of the organism. For example, a certain protein or set
of proteins may be differentially-expressed if a particular disease is present.
Identification of these proteins may lead to biomarker discovery. To find biomarkers and
fully understand protein function more sensitive and accurate methods for protein
identification are needed.
The driving force behind my research was to develop new technology which will
allow us to dig deeper with more confidence into the proteome. The focus of my
research was on the development of novel Fourier transform ion cyclotron resonance
mass spectrometry instrumentation for the task mentioned above. My research can be
narrowed down to two primary research objectives: (i) modification of electric fields
inside the ICR cell during ion measurement to reduce ion cloud de-phasing, and (ii)
development of a novel ion transfer technique to transmit ions of low kinetic energy to
the ICR cell and eliminate time of flight effects.
1

Fourier Transform Ion Cyclotron Resonance Mass Spectrometry
The first ion cyclotron [1] instrument to determine the mass of an ion was called
the “omegatron”, developed in 1949 by Hipple et. al. [2]. This instrument detected ion
current by continually exciting ion cyclotron motion until the ion physically hit a detector
plate. The first commercially available ICR system called the Syrotron, by Varian
Associates, did not become available until 1965. This instrument had low resolution and
could only detect one mass-to-charge ratio (m/z) at a time. It operated with fixed
frequency detection which required slow scanning of the magnetic field strength to obtain
a range of m/z values. Despite these limitations this instrument proved to be an extremely
useful for studying gas phase ion-molecule reaction and rate constants [3-5].
In 1965, Cooley and Tukey developed a fast algorithm which made it possible to
Fourier transform a large data set in less than a minute on a minicomputer [6]. By the
early 1970’s Fourier transform methods had been applied to obtain an entire spectrum at
once for IR [7] and NMR [8] spectroscopy. Ion cyclotron resonance mass spectrometry
[9] had been used for a number of years before Fourier transform was first applied by
Comisarow and Marshall in 1974 [10, 11]. The introduction of Fourier transform to ion
cyclotron resonance mass spectrometry allowed the instrument to become a powerful
analytical tool. The technique offers 10-100 times higher mass resolution, and mass
measurement accuracy than any other mass analysis technique [12]. Up to 12,449
spectral peaks have been assigned in a single mass spectrum [13]. Greater than 8 million
resolving power has been shown on 8.6 kDa protein [14]. Routine sub-part-per-million
mass measurement accuracy has been achieved [15-17].
2

The high performance capability of this instrument is enabled by its non-
destructive ion detection technique. It utilizes image current detection in which ions
spinning on their excited cyclotron orbit induce a charge on two opposed detection plates.
The induced charge from the detection plates is sent through a differential amplifier to
produce an electrical signal. Therefore, as an ion spins on its excited cyclotron orbit, the
signal amplitude varies with time and results in an oscillating signal. Fourier
transformation of the digital time-domain signal converts the oscillating signal to the
frequency domain. The mass-to-charge ratio of the ion is inversely proportional to its
cyclotron frequency as shown in equation 1.
(1) m
qBoc =ω
ωc is the “unperturbed” cyclotron frequency, q is the charge, m is the mass, and Bo is the
magnetic field strength. The amplitude of the induced charge is dependent upon the
number of ions and their proximity to the detection plates. The image charge induced by
an ion of charge q, is given in equation 2
(2) dqyQ 2
−=Δ
ΔQ is the difference in image charge on two opposed infinitely extended parallel
conductive plates. y is the ion cyclotron radius, and d is the distance between the plates.
Therefore, the ICR signal is proportional to the total induced current as shown in
equation 3 [18, 19]. The ICR signal increases with cyclotron radius and ion charge.
Therefore, multiply charged ions will produce a larger signal than singly charged ions if
3

the ion packets contained the same number of ions. It is important to note that the ICR
signal is independent of frequency and magnetic field strength.
(3) ddt
dy
qdt
Qd ⎟⎠⎞⎜
⎝⎛
−=Δ 2
It is also possible to calculate the minimum number of ions that need to be present to
produce a detectable signal. For an undamped signal in a single 1-second acquisition
period the minimum number of ions can be calculated as follows.
(4) )(1
)(
rqACV
N ppd −=
Where C is the capacitance of the detection circuit, Vd(p-p) is the peak-to-peak amplitude
of the detected voltage, and A1(r) is a coefficient that is approximately proportional to r
[20]. Therefore, to produce an observable signal for ions which have a small number of
charges one would need either to have many ions present or sum a number of scans since
the signal-to-noise ratio increases with (n)1/2. It has also been shown that is possible to
detect a single ion with an FTICR mass spectrometer if a there are a large number of
charges present [21].
Ions initially contained in the ICR cell do not produce an observable electrical
signal by themselves for two reasons. First, the cyclotron radius would be too small to
induce a charge on the detection plates. Second, ions of the same m/z species need to be
orbiting in-phase with each other. For ions of the same m/z located randomly about the
same cyclotron orbit in the ICR cell, any given ion and its induced current on a detection
4

plate will be cancelled by a charge induced on the opposite detection plate by ions that
are 180o out of phase. The net difference in detected charge between the two plates is
zero. In order to detect ICR signal, the ions cyclotron motion is excited by applying an
oscillating electric field at the cyclotron frequency of a particular m/z value. This
increases the ion cyclotron radius creating an ion packet with phase coherence. The final
excited cyclotron radius depends upon the excitation voltage and duration. For a single
m/z species only one frequency needs to be applied to excite coherent cyclotron motion.
However, the advantage of FTICR-MS is the ability to simultaneously detect a large
number of species over a broad m/z range. Thus, all species need to be excited to a
detectable cyclotron radius simultaneously. The simultaneous excitation of a number of
cyclotron frequencies is called broadband excitation. Broadband excitation is usually
accomplished by performing a frequency sweep or “chirp” excitation [11, 22, 23]. The
post-excitation radius can be determined by equation 5 [24].
(5) o
dipolarpp
excite dBratesweep
Vr
2_
1β−
=
were rexcite is the post-excitation radius (m), Vp-p is the amplitude of the RF voltage (peak-
to-peak in Volts), βdipolar is the geometry scaling factor for a particular ICR cell design
[25], d is the ICR cell diameter (m), and sweep_rate is in Hz/s. This provides relatively
uniform excitation over a broad frequency range. However, there is limited mass
selectivity near the beginning and end of the frequency sweep. Another common type of
frequency excitation is Stored Wave Inverse Fourier Transform or SWIFT [26-28].
SWIFT provides a more uniform excitation profile than “chirp” and results in improved
5

accuracy and precision [29]. With SWIFT the desired excitation profile is generated by
first creating the desired excitation spectrum in the mass-domain converting it to the
frequency-domain followed by inverse Fourier transform to generate the desired
excitation waveform.
Ions need to be confined in three dimensions in order to observe their cyclotron
frequencies for an extended time period. Ions are trapped in an ICR cell in the x-y
direction by a strong spatially uniform magnetic field and along the z-axis by electrostatic
potentials applied to trapping electrodes. The axial confinement of a single ion in a
magnetic field results in primarily three types of ion motion, (1) cyclotron motion, (2)
magnetron motion, and (3) trapping motion. Cyclotron frequency results from the motion
of a charged particle in a magnetic field. Magnetron motion results from the outward
directed radial force of the electrostatic potential needed to confine the ions axially. This
causes the ions to acquire a drift orbit within the ICR cell at a constant electrostatic
potential. Trapping motion is the ion oscillation along the z-axis of the cell resulting
from the potential well formed by the potentials applied to the trapping electrodes. The
different motions that arise have frequencies that differ by several orders of magnitudes.
Cyclotron frequency >> Trapping frequency >> Magnetron frequency
For a 1000 m/z species in a 7 Tesla magnet field with 1 volt applied to the trapping
electrodes the cyclotron frequency will be approximately 100 kHz, the trapping
frequency will be approximately 3 kHz, while the magnetron frequency will be on the
order of 10-20 Hz.
Below is the set of equations that is used to derive the observed cyclotron
frequency. Ion motion perpendicular to a spatially uniform magnetic field will result in a
6

vector cross product between the ion velocity and the magnetic field, which results in the
Lorentz force that is perpendicular to the direction of the magnetic field. In a strong
spatially homogenous magnetic field the path of the ion is continually altered by Lorentz
forces such that the trajectory is circular.
(6) BqvdtdvmonacceleratimassForce ×==⋅=
Angular acceleration perpendicular to the magnetic field is equal to
(7) rv xy /2
Substituting equation 7 into the acceleration component of equation 6 one gets
(8) oxyxy Bqv
rmv
=2
the equation for angular frequency
(9)r
vxy=ω
Solving for angular velocity and substitution into equation 8 results in the following
(10) rqBrm oωω =2
This equation is reduced to the following “unperturbed” cyclotron frequency
7

(1) m
qBoc =ω
However, the addition of electric fields needed to confine ions to a finite space produces
a radial force describe as
(11) ra
qVrqEforceRadial trap
2)(_α
==
Were q is the charge, Vtrap is the trap plate potential, α is an ICR cell geometry factor, a is
the distance between trap plates, and r is the radius. This outward directed electric force
opposes the inward-directed Lorentz force, therefore they have opposite signs. With the
presence of this outward-directed force we can combine equations 10 and 11 to obtain the
equation for motion in a static magnetic field and we assume a three-dimensional axial
quadrupolar electrostatic potential is created by the trap electrodes.
(12) ra
qVrqBrmForce trap
o 22 α
ωω −==
This equation can be reduced as follows
(13) 022 =+−
maqV
mqB trapo αω
ω
Thus, two important things are a direct result of this relationship: 1) in a perfectly three
dimensional axial quadrupolar electric field the observed frequency is independent of
radius and 2) the expression reduces to a quadratic equation. When this equation is
8

solved it produces two separate frequencies in place of the “unperturbed” cyclotron
frequency.
(14) 222
22zcc ωωω
ω −⎟⎠⎞
⎜⎝⎛+=+ “reduced” cyclotron frequency
(15) 222
22zcc ωωω
ω −⎟⎠⎞
⎜⎝⎛−=− “magnetron” frequency
The trapping oscillation can be described as
(16) 2
2ma
qVtrapz
αω = “Trapping” frequency
One of the figures of merit which allows FTICR mass spectrometry to stand
above other types of mass spectrometers is the ability to provide ultra-high accuracy mass
measurements. The mass-to-charge ratio of an ion is inversely proportional to the
cyclotron frequency of that ion; however, there are other factors which cause
perturbations to the cyclotron frequency which degrades the performance of the
instrument if not carefully controlled [30]. The magnetron frequency reduces the
unperturbed cyclotron frequency so that the observed cyclotron frequency can be
expressed by equation 17.
(17) ω+ = ωc - ω-
9

Where ωc is the “unperturbed” cyclotron frequency, ω+ is the reduced cyclotron
frequency and ω- is the magnetron frequency. The inclusion of trapping potentials
produces an outward-directed radial electric field which effectively reduces the ion
cyclotron frequency. The observed cyclotron frequency can be converted to a mass-to-
charge ratio simply by matching the observed cyclotron frequencies to masses of known
elemental composition. The coefficients are usually fit to the data by a simple least-
squares best fit, whose coefficients are generated directly form the data. The two most
common frequency-to-mass formulas in use were derived by Ledford et al. [31, 32] who
assumed that the m/z < (m/z)critical were (m/z)critical is the value at which the magnetron and
reduced cyclotron converge. The other calibration equation developed by Francl. et al.
[33] assumes that the m/z<< (m/z)critical. Shi et. al. [34] showed that the mass
measurement accuracy resulting from these two calibration functions (and their
interconversion) are indistinguishable.
(18) ++
+= 2vB
vA
zm Ledford et al.
(19) Bv
Azm
−=
+
Francl et al.
Though these are the two most common mass calibration equations, many more
investigators have taken these equations and expanded them to take into account factors
which may cause perturbations to the calibration [35]. Since FTICR measurements are
usually carried out with a large number of trapped ions it is necessary to consider static
and dynamic effects of ion-ion repulsion. Increasing the number of ions decreases the
10

observed cyclotron frequency [36]. This frequency shift based on the number of ions is
called the “space charge” effect. Therefore, when performing accurate mass
measurements it is necessary trap the same number of ions in every data acquisition
period. This can be accomplished with automated gain control [37, 38]. If the number of
ions injected into the ICR cell does vary, the frequency can be corrected for by
performing internal calibration [39-42]. Since space charge results in a constant
frequency shift across the entire spectrum a single peak can be used to shift all
frequencies [43]. A calibration curve can also be established to account for frequency
shifts as a function of ion intensity [17, 44]. A post calibration method has also been
developed to correct for space charge frequency shifts when multiple charge states are
present by adjusting the calibration equation so the deconvolved isotope envelopes
overlay exactly [45, 46]. However, recently it has been shown that an ion cloud
experiences different interactions with other ion clouds. Thus, ion packets with a lower
number of ions will have more of a frequency shift than a packet that contains a large
number of ions [47]. This idea has been used to modify the calibration equations to
increase the mass measurement accuracy [48-50].
Ion-ion interactions can also lead to peak coalescence between two closely spaced
peaks if too many ions are present [51]. This is a problem when determining isotopic
fine structure within the isotope envelope [52, 53]. Isotopic fine structure can provide
information such as the number of sulfur atoms present in the molecule [54]. The peak
coalescence phenomenon is also a problem for large proteins that are highly charged
since the frequency difference between isotope peaks becomes small [55]. When
performing high resolution measurements, it is also possible for the frequency to shift
11

during ion detection. It is most common to see a frequency shift to high m/z because as
the ion cloud encounters collisions the cyclotron radius decreases and the space charge
increases. The spatial distribution of ions decreases as the cyclotron radius decreases. A
number of corrections have been developed to correct for the time based frequency shift
[56, 57].
There are three ideal types of electric fields within the ICR cell that need to be
generated to form the ideal cell [58]. (1) When the RF voltage is applied to the excite
plates, the electric field lines should be parallel to the excite plates. If these electric field
lines are not completely parallel to the direction of the magnetic field, ions will gain
velocity in the z-direction Thus, ejection of ions along the z-axis during excitation when
the excitation frequency is twice the trapping frequency or the cyclotron frequency plus
twice the trapping frequency can occur [59, 60]. For optimized excitation profile, the
open coupled cell [61], infinity cell [62], and electric field shimming electrode cell were
designed [63, 64]. These cells are desirable since they eliminate z-axis ejection during
excitation, and are able to excite ions to the same cyclotron radius more reliably. (2) To
obtain a frequency that is independent of ion position in the cell, the trapping electric
fields should form a three dimensional quadrupolar potential inside the ICR cell. This
can be achieved with a hyperbolic geometry cell [65, 66]. Deviations to these non-ideal
electric fields results in frequency perturbations due to static electric fields [67-70]. A
number of ICR cells have been designed to reduce frequency perturbations from static
electric fields [63, 64, 67, 71]. (3) Azimuthal quadrupolar R.F. potential is applied for
ion axialization [72], the generation of this type of electric field converts magnetron
motion to cyclotron motion in the presence of a collision gas [73, 74]. This technique of
12

quadrupolar axialization improves virtually every aspect of FTICR instrument
performance, and allows accurate remeasurment of ions which improves signal-to-noise
ratio and lowering the detection limit [75-79]. Since most instruments create ions external
to the magnetic field, the trap design must also consider open access for externally
generated ions [80, 81]. There is usually a trade-off in one of these electrical fields
during ICR cell design. However, there are a number of cells that have been developed
to optimize one or more the ideal electric fields [82-85]. However, Marshall and
coworkers, designed a matrix-shimmed ICR cell that consisted of 150 electrodes that was
able to produce any desired electric field inside the ICR cell, though was unable to
produce the desired performance from the ICR cell [86]. The ICR cells employed in
commercial instruments have been designed to minimize z-axis ejection during ion
excitation [61, 62].
Calculation of a single molecule in an ICR cell in a static magnetic field has been
done to get an approximation of ion motion [68]. Though a single ion has been detected
with FTICR [21, 87, 88] most experiments are carried out with large number of ions.
Therefore, Coulombic interactions of ions become extremely important in describing a
model for ion motion within the ICR cell. The increase in the number of ions greatly
increases the complexity of ion motion compared to a single ion. These models need to
account for Coulombic frequency shifts, sideband generation, spectral line broadening as
well as coalescence of closely spaced peaks [30, 89-96]. Therefore, realistic modeling of
ion motion is needed to fully understand ion motion inside an ICR cell [97, 98]. Rapid
degradation of FTICR signal is still a major problem and a better understanding of the
13

mechanisms which causes ion cloud de-phasing is needed for FTICR to reach its full
potential.
Attributions
Chapters 2-6 were written based on the format required for publication in their respective
journals. I collected all the data that is presented here as well as wrote the manuscripts.
Dr. Bruce advised all the projects and provided the funding. The work described in
Chapter 2 was published in the Journal of the American Society for Mass Spectrometry
(Nathan K. Kaiser, Gordon A. Anderson, and James E. Bruce, J. Am. Soc. Mass
Spectrom. 2005, 16, 463-470.). In this work, Gordon offered valuable advice on the data
processing.
Chapter 3 contains the work published in the journal of Analytical Chemistry (Nathan K.
Kaiser and James E. Bruce, Anal. Chem. 2005, 77, 5973-5981).
The research work in chapter 4 was published in the International Journal of Mass
Spectrometry (Nathan K. Kaiser and James E. Bruce, Int. J. Mass Spectrom. 2007, 265,
271-280.).
The research work contained in chapter 5 has been submitted for publication to the
Journal of the American Society for Mass Spectrometry (Nathan K. Kaiser, Brian N.
14

Webb, Chad R. Weisbrod, and James E. Bruce.) Chad and Brian help perform the
SIMION calculations.
Chapter 6 was written in the format required for publication in the journal of Rapid
Communications in Mass Spectrometry (Nathan K. Kaiser, Gunnar E. Skulason, Chad R.
Weisbrod, David C. Prior, Michael Buschbach, Gordon A. Anderson, and James E.
Bruce.) Gunnar built the RF generators, excitation amplifier, and was crucial in
developing and trouble shooting the instrument. Chad designed the ICR cell used for
image current detection. Buschbach wrote the RIPT computer program. David Prior
helped build the RF generators and offered sound advice on construction of the RIPT ion
guide. Gordon offered advice on the RIPT ion guide construction.
Chapter 7 describes the in-house designed FTICR mass spectrometer. Si Wu and Kai
Zhang helped in the instrument design and construction. In particular, help with the
development of the ion source region. Gunnar helped troubleshoot the instrument and
made valuable suggestions as well as provided most of the electronics support.
15

References 1. Lawrence, E. O., Livingston, M. S., The production of high-speed light ions without the use of high voltages, Physical Review. 1932, 40, 19-35. 2. Hipple, J. A., Sommer, H., Thomas, H. A., Physcial Reviews. 1949, 76, 1877. 3. Moylan, C. R., Brauman, J. I., Gas phase acid-base chemistry, Annu Rev Phys
Chem. 1983, 34, 187-215. 4. Baldeschwieler, J. D., Benz, H., Llewellyn, P. M., Ion-molecule reactions in an
ion-cyclotron-resonance mass spectrometer, Advances in Mass Spectrometry. 1968, 4, 113-120.
5. Anders, L. R., Beauchamp, J. L., Dunbar, R. C., Baldeschwieler, J. D., Ion-
cyclotron double resonance, J Chem Phys. 1966, 45, 1062-1063. 6. Cooley, J. W., Tukey, J. W., Math Comp. 1975, 19, 9. 7. Low, M. J. D., Freeman, S. K., Measurements of infrared spectra of gas-liquid
chromatography fractions using multiple-scan interference spectrometry, Analytical Chemistry. 1967, 39, 194-198.
8. Ernst, R. R., Anderson, W. A., Application of Fourier transform spectroscopy to
magnetic resonance, Review of Scientific Instruments. 1966, 37, 93-102. 9. Bloom, M., Riggin, M., Theory of ion cyclotron resonance, Can J Phys. 1974,
52, 436-455. 10. Comisarow, M. B., Marshall, A. G., Fourier transform ion cyclotron resonance
spectroscopy, Chemical Physics Letters. 1974, 25, 282-283. 11. Comisarow, M. B., Marshall, A. G., Frequency-sweep Fourier transform ion
cyclotron resonance spectroscopy, Chemical Physics Letters. 1974, 26, 489-490. 12. Marshall, A. G., Milestones in Fourier transform ion cyclotron resonance mass
spectrometry technique development, International Journal of Mass Spectrometry. 2000, 200, 331-356.
13. Purcell, J. M., Hendrickson, C. L., Rodgers, R. P., Marshall, A. G., Atmospheric
Pressure Photoionization Proton Transfer for Complex Organic Mixtures Investigated by Fourier Transform Ion Cyclotron Resonance Mass Spectrometry, Journal of the American Society for Mass Spectrometry. 2007, 18, 1682-1689.
16

14. Shi, S. D. H., Hendrickson, C. L., Marshall, A. G., Counting individual sulfur atoms in a protein by ultrahigh-resolution Fourier transform ion cyclotron resonance mass spectrometry: experimental resolution of isotopic fine structure in proteins, Proceedings of the National Academy of Sciences of the United States of America. 1998, 95, 11532-11537.
15. Kim, S., Rodgers, R. P., Marshall, A. G., Truly "exact" mass: Elemental
composition can be determined uniquely from molecular mass measurement at .apprx.0.1mDa accuracy for molecules up to .apprx.500Da, International Journal of Mass Spectrometry. 2006, 251, 260-265.
16. Muddiman, D. C., Oberg, A. L., Statistical Evaluation of Internal and External
Mass Calibration Laws Utilized in Fourier Transform Ion Cyclotron Resonance Mass Spectrometry, Analytical Chemistry. 2005, 77, 2406-2414.
17. Easterling, M. L., Mize, T. H., Amster, I. J., Routine part-per-million mass
accuracy for high-mass ions: space-charge effects in MALDI FT-ICR, Analytical Chemistry. 1999, 71, 624-632.
18. Limbach, P. A., Grosshans, P. B., Marshall, A. G., Experimental determination of
the number of trapped ions, detection limit, and dynamic range in Fourier transform ion cyclotron resonance mass spectrometry, Analytical Chemistry. 1993, 65, 135-140.
19. Guan, S., Marshall, A. G., Ion traps for Fourier transform ion cyclotron
resonance mass spectrometry: principles and design of geometric and electric configurations, International Journal of Mass Spectrometry and Ion Processes. 1995, 146/147, 261-296.
20. Grosshans, P. B., Marshall, A. G., Theory of ion cyclotron resonance mass
spectrometry: resonant excitation and radial ejection in orthorhombic and cylindrical ion traps, International Journal of Mass Spectrometry and Ion Processes. 1990, 100, 347-379.
21. Smith, R. D., Cheng, X., Bruce, J. E., Hofstadler, S. A., Anderson, G. A.,
Trapping, detection and reaction of very large single molecular ions by mass spectrometry, Nature (London, United Kingdom). 1994, 369, 137-139.
22. Marshall, A. G., Roe, D. C., Theory of Fourier transform ion cyclotron resonance
mass spectroscopy: response to frequency-sweep excitation, J Chem Phys. 1980, 73, 1581-1590.
23. Alan G. Marshall, Verdun, F. R., Fourier Transforms in NMR, optical, and mass
spectrometry: a user's handbook, 1990.
17

24. Marshall, A. G., Hendrickson, C. L., Jackson, G. S., Fourier transform ion cyclotron resonance mass spectrometry: a primer, Mass Spectrometry Reviews. 1998, 17, 1-35.
25. Jackson, G. S., Canterbury, J. D., Guan, S., Marshall, A. G., Linearity and
quadrupolarity of tetragonal and cylindrical Penning traps of arbitrary length-to-width ratio, Journal of the American Society for Mass Spectrometry. 1997, 8, 283-293.
26. Marshall, A. G., Ricca, T. L., Wang, T.-C. L., Tailored excitation for trapped ion
mass spectrometry, U.S. 1988, 23 pp. 27. Marshall, A. G., Wang, T. C. L., Ricca, T. L., Tailored excitation for Fourier
transform ion cyclotron mass spectrometry, Journal of the American Chemical Society. 1985, 107, 7893-7897.
28. Guan, S., Marshall, A. G., Stored waveform inverse Fourier transform (SWIFT)
ion excitation in trapped-ion mass spectrometry: theory and applications, International Journal of Mass Spectrometry and Ion Processes. 1996, 157/158, 5-37.
29. Frahm, J. L., Velez, C. M. C., Muddiman, D. C., Understanding the influence of
post-excite radius and axial confinement on quantitative proteomic measurements using Fourier transform ion cyclotron resonance mass spectrometry, Rapid Communications in Mass Spectrometry. 2007, 21, 1196-1204.
30. Gorshkov, M. V., Marshall, A. G., Analysis and elimination of systematic errors
originating from Coulomb mutual interaction and image charge in Fourier transform ion cyclotron resonance precise mass difference measurements, Journal of the American Society for Mass Spectrometry. 1993, 4, 855-868.
31. Ledford, E. B., Jr., Rempel, D. L., Gross, M. L., Space charge effects in Fourier
transform mass spectrometry. I. Electrons, International Journal of Mass Spectrometry and Ion Processes. 1984, 55, 143-154.
32. Ledford, E. B., Jr., Rempel, D. L., Gross, M. L., Space charge effects in Fourier
transform mass spectrometry. Mass calibration, Anal Chem. 1984, 56, 2744-2748. 33. Francl, T. J., Fukuda, E. K., McIver, R. T., Jr., A diffusion model for nonreactive
ion loss in pulsed ion cyclotron resonance experiments, International Journal of Mass Spectrometry and Ion Physics. 1983, 50, 151-167.
34. Shi, S. D. H., Drader, J. J., Freitas, M. A., Hendrickson, C. L., Marshall, A. G.,
Comparison and interconversion of the two most common frequency-to-mass calibration functions for fourier transform ion cyclotron resonance mass
18
spectrometry, International Journal of Mass Spectrometry. 2000, 195/196, 591-598.
35. Zhang, L. K., Rempel, D. L., Gross, M. L., Accurate Mass Measurements by
Fourier Transform Mass Spectrometry, Mass Spectrometry Reviews. 2005, 24, 286-309.
36. Jeffries, J. B., Barlow, S. E., Dunn, G. H., Theory of space-charge shift of ion
cyclotron resonance frequencies, International Journal of Mass Spectrometry and Ion Processes. 1983, 54, 169-187.
37. Belov, M. E., Zhang, R., Strittmatter, E. F., Prior, D. C., Tang, K., Smith, R. D.,
Automated gain control and internal calibration with external ion accumulation capillary liquid chromatography-electrospray ionization-Fourier transform ion cyclotron resonance, Analytical Chemistry. 2003, 75, 4195-4205.
38. Syka, J. E. P., Marto, J. A., Bai, D. L., Horning, S., Senko, M. W., Schwartz, J.
C., Ueberheide, B., Garcia, B., Busby, S., Muratore, T., Shabanowitz, J., Hunt, D. F., Novel linear quadrupole ion trap/FT mass spectrometer: performance characterization and use in the comparative analysis of histone H3 post-translational modifications, Journal of Proteome Research. 2004, 3, 621-626.
39. Hannis, J. C., Muddiman, D. C., A dual electrospray ionization source combined
with hexapole accumulation to achieve high mass accuracy of biopolymers in Fourier transform ion cyclotron resonance mass spectrometry, Journal of the American Society for Mass Spectrometry. 2000, 11, 876-883.
40. Kruppa, G., Schnier, P. D., Tabei, K., Van Orden, S., Siegel, M. M., Multiple ion
isolation applications in FT-ICR MS: exact-mass MSn internal calibration and purification/interrogation of protein-drug complexes, Anal Chem. 2002, 74, 3877-3886.
41. Solouki, T., Gillig, K. J., Russell, D. H., Mass measurement accuracy of matrix-
assisted laser desorbed biomolecules: a Fourier-transform ion cyclotron resonance mass spectrometry study, Rapid Communications in Mass Spectrometry. 1994, 8, 26-31.
42. Yanofsky, C. M., Bell, A. W., Lesimple, S., Morales, F., Lam, T. T., Blakney, G.
T., Marshall, A. G., Carrillo, B., Lekpor, K., Boismenu, D., Kearney, R. E., Multicomponent Internal Recalibration of an LC-FTICR-MS Analysis Employing a Partially Characterized Complex Peptide Mixture: Systematic and Random Errors, Analytical Chemistry. 2005, 77, 7246-7254.
43. Burton, R. D., Matuszak, K. P., Watson, C. H., Eyler, J. R., Exact mass
measurements using a 7 tesla fourier transform ion cyclotron resonance mass
19
spectrometer in a good laboratory practices-regulated environment, Journal of the American Society for Mass Spectrometry. 1999, 10, 1291-1297.
44. Taylor, P. K., Amster, I. J., Space charge effects on mass accuracy for multiply
charged ions in ESI-FTICR, International Journal of Mass Spectrometry. 2003, 222, 351-361.
45. Bruce, J. E., Anderson, G. A., Brands, M. D., Pasa-Tolic, L., Smith, R. D.,
Obtaining more accurate Fourier transform ion cyclotron resonance mass measurements without internal standards using multiply charged ions, Journal of the American Society for Mass Spectrometry. 2000, 11, 416-421.
46. Kaiser, N. K., Anderson, G. A., Bruce, J. E., Improved mass accuracy for tandem
mass spectrometry, Journal of the American Society for Mass Spectrometry. 2005, 16, 463-470.
47. Masselon, C., Tolmachev, A. V., Anderson, G. A., Harkewicz, R., Smith, R. D.,
Mass measurement errors caused by "local" frequency perturbations in FTICR mass spectrometry, Journal of the American Society for Mass Spectrometry. 2002, 13, 99-106.
48. Wong Richard, L., Amster, I. J., Sub part-per-million mass accuracy by using
stepwise-external calibration in fourier transform ion cyclotron resonance mass spectrometry, J Am Soc Mass Spectrom 2006, 17, 1681-1691.
49. Tolmachev, A. V., Monroe, M. E., Jaitly, N., Petyuk, V. A., Adkins, J. N., Smith,
R. D., Mass Measurement Accuracy in Analyses of Highly Complex Mixtures Based Upon Multidimensional Recalibration, Analytical Chemistry. 2006, 78, 8374-8385.
50. Williams, D. K., Jr., Muddiman, D. C., Parts-Per-Billion Mass Measurement
Accuracy Achieved through the Combination of Multiple Linear Regression and Automatic Gain Control in a Fourier Transform Ion Cyclotron Resonance Mass Spectrometer, Analytical Chemistry. 2007, 79, 5058-5063.
51. Naito, Y., Inoue, M., Peak confluence phenomenon in Fourier transform ion
cyclotron resonance mass spectrometry, Journal of the Mass Spectrometry Society of Japan. 1994, 42, 1-9.
52. Stults, J. T., Minimizing peak coalescence: high-resolution separation of isotope
peaks in partially deamidated peptides by matrix-assisted laser desorption/ionization Fourier transform ion cyclotron resonance mass spectrometry, Analytical Chemistry. 1997, 69, 1815-1819.
53. Pasa-Tolic, L., Huang, Y., Guan, S., Kim, H. S., Marshall, A. G., Ultrahigh-
resolution matrix-assisted laser desorption/ionization Fourier transform ion
20

cyclotron resonance mass spectra of peptides, Journal of Mass Spectrometry. 1995, 30, 825-833.
54. Solouki, T., Emmett, M. R., Guan, S., Marshall, A. G., Detection, number, and
sequence location of sulfur-containing amino acids and disulfide bridges in peptides by ultrahigh-resolution MALDI FTICR mass spectrometry, Anal Chem:1997. 69, 1163-1168.
55. Beu, S. C., Senko, M. W., Quinn, J. P., Wampler, F. M., III, McLafferty, F. W.,
Fourier-transform electrospray instrumentation for tandem high-resolution mass spectrometry of large molecules, Journal of the American Society for Mass Spectrometry. 1993, 4, 557-565.
56. Guan, S., Wahl, M. C., Marshall, A. G., Elimination of frequency drift from
Fourier transform ion cyclotron resonance mass spectra by digital quadrature heterodyning: ultrahigh mass resolving power for laser-desorbed molecules, Anal Chem. 1993, 65, 3647-3653.
57. Bruce, J. E., Anderson, G. A., Hofstadler, S. A., Winger, B. E., Smith, R. D.,
Time-base modulation for the correction of cyclotron frequency shifts observed in long-lived transients from Fourier-transform ion-cyclotron-resonance mass spectrometry of electrosprayed biopolymers, Rapid Communications in Mass Spectrometry. 1993, 7, 700-703.
58. Anderson, J. S., Vartanian, H., Laude, D. A., Evolution of trapped ion cells in
Fourier transform ion cyclotron resonance mass spectrometry, TrAC, Trends in Analytical Chemistry. 1994, 13, 234-239.
59. Van der Hart, W. J., Van de Guchte, W. J., Excitation of the z-motion of ions in a
cubic ICR cell, International Journal of Mass Spectrometry and Ion Processes. 1988, 82, 17-31.
60. Van de Guchte, W. J., Van der Hart, W. J., Excitation of the z motion of ions in
cubic and elongated ion cyclotron resonance cells, International Journal of Mass Spectrometry and Ion Processes. 1990, 95, 317-326.
61. Beu, S. C., Laude, D. A., Jr., Elimination of axial ejection during excitation with
a capacitively coupled open trapped-ion cell for Fourier transform ion cyclotron resonance mass spectrometry, Analytical Chemistry. 1992, 64, 177-180.
62. Caravatti, P., Allemann, M., The infinity cell: a new trapped-ion cell with
radiofrequency covered trapping electrodes for Fourier transform ion cyclotron resonance mass spectrometry, Organic Mass Spectrometry. 1991, 26, 514-518.
63. Wang, M., Marshall, A. G., A "screened" electrostatic ion trap for enhanced mass
resolution, mass accuracy, reproducibility, and upper mass limit in Fourier-
21

transform ion cyclotron resonance mass spectrometry, Analytical Chemistry. 1989, 61, 1288-1293.
64. Hanson, C. D., Castro, M. E., Kerley, E. L., Russell, D. H., Field-corrected ion
cell for ion cyclotron resonance, Analytical Chemistry. 1990, 62, 520-526. 65. Marto, J. A., Marshall, A. G., Schweikhard, L., A two-electrode ion trap for
Fourier transform ion cyclotron resonance mass spectrometry, International Journal of Mass Spectrometry and Ion Processes. 1994, 137, 9-30.
66. Rempel, D. L., Ledford, E. B., Jr., Huang, S. K., Gross, M. L., Parametric mode
operation of a hyperbolic Penning trap for Fourier transform mass spectrometry, Analytical Chemistry. 1987, 59, 2527-2532.
67. Vartanian, V. H., Hadjarab, F., Laude, D. A., Open cell analog of the screened
trapped-ion cell using compensation electrodes for Fourier transform ion cyclotron resonance mass spectrometry, International Journal of Mass Spectrometry and Ion Processes. 1995, 151, 175-187.
68. Mitchell, D. W., Theory of trapped ion motion in the non-quadrupolar
electrostatic potential of a cubic ion cyclotron resonance cell, International Journal of Mass Spectrometry and Ion Processes. 1995, 142, 1-22.
69. Brown, L. S., Gabrielse, G., Geonium theory: physics of a single electron or ion
in a Penning trap, Reviews of Modern Physics. 1986, 58, 233-311. 70. Holliman, C. L., Rempel, D. L., Gross, M. L., A mechanism for poor high mass
performance in Fourier transform mass spectrometry, Journal of the American Society for Mass Spectrometry. 1992, 3, 460-463.
71. Solouki, T., Gillig, K. J., Russell, D. H., Detection of High-Mass Biomolecules in
Fourier Transform Ion Cyclotron Resonance Mass Spectrometry: Theoretical and Experimental Investigations, Analytical Chemistry. 1994, 66, 1583-1587.
72. Guan, S., Kim, H. S., Marshall, A. G., Wahl, M. C., Wood, T. D., Xiang, X.,
Shrink-wrapping an ion cloud for high-performance Fourier transform ion cyclotron resonance mass spectrometry, Chemical Reviews. 1994, 94, 2161-2182.
73. Guan, S., Gorshkov, M. V., Marshall, A. G., Circularly polarized quadrature
excitation for Fourier-transform ion cyclotron resonance mass spectrometry, Chemical Physics Letters. 1992, 198, 143-148.
74. Bollen, G., Moore, R. B., Savard, G., Stolzenberg, H., The accuracy of heavy-ion
mass measurements using time of flight-ion cyclotron resonance in a Penning trap, J Appl Phys. 1990, 68, 4355-4374.
22

75. Speir, J. P., Gorman, G. S., Pitsenberger, C. C., Turner, C. A., Wang, P. P., Amster, I. J., Remeasurement of ions using quadrupolar excitation Fourier transform ion cyclotron resonance spectrometry, Analytical Chemistry. 1993, 65, 1746-1752.
76. O'Connor, P. B., Speir, J. P., Wood, T. D., Chorush, R. A., Guan, Z., McLafferty,
F. W., Broadband quadrupolar axialization of large multiply charged ions to enhance measurement and minimize conformational restrictions, Journal of Mass Spectrometry. 1996, 31, 555-559.
77. Williams, E. R., Henry, K. D., McLafferty, F. W., Multiple remeasurement of
ions in Fourier-transform mass spectrometry, Journal of the American Chemical Society. 1990, 112, 6157-6162.
78. Solouki, T., Pasa-Tolic, L., Jackson, G. S., Guan, S., Marshall, A. G., High-
Resolution Multistage MS, MS2, and MS3 Matrix-Assisted Laser Desorption/Ionization FT-ICR Mass Spectra of Peptides from a Single Laser Shot, Analytical Chemistry. 1996, 68, 3718-3725.
79. Solouki, T., Marto, J. A., White, F. M., Guan, S., Marshall, A. G., Attomole
Biomolecule Mass Analysis by Matrix-Assisted Laser Desorption/Ionization Fourier Transform Ion Cyclotron Resonance, Analytical Chemistry. 1995, 67, 4139-4144.
80. Gabrielse, G., Haarsma, L., Rolston, S. L., Open-endcap Penning traps for high
precision experiments, International Journal of Mass Spectrometry and Ion Processes. 1989, 88, 319-332.
81. Beu, S. C., Laude, D. A., Jr., Open trapped ion cell geometries for Fourier
transform ion cyclotron resonance mass spectrometry, International Journal of Mass Spectrometry and Ion Processes. 1992, 112, 215-230.
82. Malek, R., Wanczek, K. P., Nested ion traps and their effects on ion storage and
excitation, Advances in Mass Spectrometry. 1998, 14, B025210/025211-B025210/025210.
83. Vartanian, V. H., Laude, D. A., Optimization of a fixed-volume open geometry
trapped ion cell for Fourier transform ion cyclotron mass spectrometry, International Journal of Mass Spectrometry and Ion Processes. 1995, 141, 189-200.
84. Bruce, J. E., Anderson, G. A., Lin, C.-Y., Gorshkov, M., Rockwood, A. L.,
Smith, R. D., A novel high-performance Fourier transform ion cyclotron resonance cell for improved biopolymer characterization, Journal of Mass Spectrometry. 2000, 35, 85-94.
23

85. Quint, W., Kaiser, R., Hall, D., Gabrielse, G., (Anti)hydrogen recombination studies in a nested Penning trap, Hyperfine Interact. 1993, 76, 181-188.
86. Jackson, G. S., White, F. M., Guan, S., Marshall, A. G., Matrix-shimmed ion
cyclotron resonance ion trap simultaneously optimized for excitation, detection, quadrupolar axialization, and trapping, Journal of the American Society for Mass Spectrometry. 1999, 10, 759-769.
87. Bruce, J. E., Cheng, X., Bakhtiar, R., Wu, Q., Hofstadler, S. A., Anderson, G. A.,
Smith, R. D., Trapping, Detection, and Mass Measurement of Individual Ions in a Fourier Transform Ion Cyclotron Resonance Mass Spectrometer, Journal of the American Chemical Society. 1994, 116, 7839-7847.
88. Bruce, J. E., Anderson, G. A., Udseth, H. R., Smith, R. D., Large Molecule
Characterization Based upon Individual Ion Detection with Electrospray Ionization-FTICR Mass Spectrometry, Analytical Chemistry. 1998, 70, 519-525.
89. Hendrickson, C. L., Beu, S. C., Laude, D. A., Jr., Two-dimensional Coulomb-
induced frequency modulation in Fourier transform ion cyclotron resonance: a mechanism for line broadening at high mass and for large ion populations, Journal of the American Society for Mass Spectrometry. 1993, 4, 909-916.
90. Peurrung, A. J., Kouzes, R. T., Long-term coherence of the cyclotron mode in a
trapped ion cloud, Physical Review. E. Statistical Physics, Plasmas, Fluids, and Related Interdisciplinary Topics. 1994, 49, 4362-4368.
91. Mitchell, D. W., Smith, R. D., Cyclotron motion of two Coulombically
interacting ion clouds with implications to Fourier-transform ion cyclotron resonance mass spectrometry, Physical Review. E. Statistical Physics, Plasmas, Fluids, and Related Interdisciplinary Topics. 1995, 52, 4366-4386.
92. Laukien, F. H., The effects of residual spatial magnetic field gradients on Fourier
transform ion cyclotron resonance spectra, International Journal of Mass Spectrometry and Ion Processes. 1986, 73, 81-107.
93. Hartmann, H., Chung, K. M., Baykut, G., Wanczek, K. P., Dependence of ion
cyclotron frequency on electric field inhomogeneity, J Chem Phys. 1983, 78, 424-431.
94. Chen, S. P., Comisarow, M. B., Simple physical models for Coulomb-induced
frequency shifts and Coulomb-induced inhomogeneous broadening for like and unlike ions in Fourier transform ion cyclotron resonance mass spectrometry, Rapid Communications in Mass Spectrometry. 1991, 5, 450-455.
95. Mitchell, D. W., Smith, R. D., Prediction of a space charge induced upper
molecular mass limit towards achieving unit mass resolution in Fourier transform
24

ion cyclotron resonance mass spectrometry, Journal of Mass Spectrometry. 1996, 31, 771-790.
96. Nikolaev, E. N., Miluchihin, N., Inoue, M., Evolution of an ion cloud in a Fourier
transform ion cyclotron resonance mass spectrometer during signal detection: its influence on spectral line shape and position, International Journal of Mass Spectrometry and Ion Processes. 1995, 148, 145-157.
97. Nikolaev, E. N., 54th ASMS Conference on Mass Spectrometry and Allied
Topics, Seattle, WA, 2006. 98. Mitchell, D. W., Realistic simulation of the ion cyclotron resonance mass
spectrometer using a distributed three-dimensional particle-in-cell code, Journal of the American Society for Mass Spectrometry. 1999, 10, 136-152.
25

CHAPTER 2 Improved Mass Accuracy for Tandem Mass Spectrometry Abstract
With the emergence of top-down proteomics the ability to achieve high mass
measurement accuracy on tandem MS/MS data will be beneficial for protein
identification and characterization. Fourier Transform Ion Cyclotron Resonance Mass
Spectrometers (FT-ICR MS) are the ideal instruments to perform these experiments with
their ability to provide high resolution and mass accuracy. A major limitation to mass
measurement accuracy in FT-ICR instruments arises from the occurrence of space charge
effects. These space charge effects shift the cyclotron frequency of the ions, which
compromises the mass measurement accuracy. While several methods have been
developed that correct for these space charge effects, they have limitations when applied
to MS/MS experiments. It has already been shown that additional information inherent in
electrospray spectra can be used for improved mass measurement accuracy with the use
of a computer algorithm called DeCAL (Deconvolution of Coulombic Affected
Linearity). This paper highlights a new application of the strategy for improved mass
accuracy in tandem mass analysis. The results show a significant improvement in mass
measurement accuracy on complex electron capture dissociation spectra of proteins. We
also demonstrate how the improvement in mass accuracy can increase the confidence in
26

protein identification from the fragment masses of proteins acquired in MS/MS
experiments.
Introduction
FT-ICR MS [1] (Fourier Transform Ion Cyclotron Resonance Mass
Spectrometry) is a unique technique with its ability to provide simultaneous high
resolution, sensitivity, and accurate mass measurements. However, the mass accuracy of
the FT-ICR is known to be compromised by the influence of space charge effects [2-4],
which arise from the Coulombic interaction of trapped ions in the ICR cell. The
measured quantity in FT-ICR MS is ion cyclotron frequency. Space charge effects
resultant from ion-ion repulsion can produce a systematic shift in the observed cyclotron
frequencies. If unaccounted for, these shifts in cyclotron frequency severely degrade
mass measurement accuracy. Ion cyclotron frequency and m/z are related by equation
(1), and perturbations in the observed cyclotron frequency will correspond to a shift in
the m/z value. The relationship between m/z, charge state, and frequency is
n
cn f
kBn
MnMzm =+
=)()/(
(1) where (m/z)n is the observed mass-to-charge ratio, n is the number of charges, M is the
molecular weight of the analyte being measured, Mc is the mass of the charge carrier, k is
a proportionality constant relating m/z to the magnetic field B, and fn is the cyclotron
frequency. The magnitude of the frequency shift depends on the changes in the total ion
population in the ICR cell during experimental conditions, as compared to the total ion
27

population present during calibration [4]. The frequency shift is constant to a first order
approximation across the entire spectrum, in that all ions are shifted by the same amount
in frequency space. With a larger number of charge states with increased intensity,
possible higher-order non-linear frequency shifts can occur. The systematic shift in ion
cyclotron frequency can be expressed by equation (2) where f is the expected cyclotron
frequency and ∆f is the frequency shift that is resultant from the imposed space charge
effects.
( )ffkBzmΔ+
=/ (2)
A number of different calibration functions that convert the ion cyclotron frequency to
m/z have been developed [3, 5].
Space charge effects limit the mass accuracy and have spurred an active area of
research to correct for and reduce this phenomenon. There have been a few methods
developed to correct for space charge effects to obtain more accurate mass
measurements, while others have reduced the presence of space charge effects by
controlling the number of ions that are trapped in the ICR cell [6, 7]. Burton et al. [8]
developed a method based on the addition of an internal standard after the initial
calibration. Since the frequency shift is constant across the entire spectrum, the added
standard will encounter the same shift in frequency space as all the other trapped ions.
The frequency shift of the standard can be determined by the difference in observed and
expected mass of the added standard. This frequency shift is then applied to all ions
present in the ICR cell to obtain improved mass accuracy. Another method developed by
Easterling et al. [4] shows that space charge effects can be corrected with a calibration
28

expression that relates the trapped ion population in the ICR cell during calibration to the
trapped ion population during the experiment, through a shift in frequency. A third
method called Deconvolution of Coulombic Affect Linearity (DeCAL) developed by
Bruce et al. [9] corrects for space charge effects in spectra that contain multiply charged
ions. This method relies on a computer algorithm that aligns the deconvoluted isotopic
distributions of multiple charge states of the same molecular species. Improved mass
accuracy was demonstrated by iteratively shifting the entire frequency-domain spectra
prior to deconvolution. This is done without knowing any other parameters, such as
exact molecular weight, ion abundances, or the identity of the species.
Mass accuracy is a critical feature in the emerging field of proteomics.
Proteomics can be defined as the effort to establish identity, structure, and function of all
proteins present in the organism, and how these can change in time, space, and other
conditions. A newer approach to proteome analysis with mass spectrometry called “top-
down proteomics” [10-12], aims to combine protein identification with protein
characterization, and locate post-translational modifications (PTMs) present on the
proteins. PTMs are important to biological systems because they can change the
structure and regulate the functionality of proteins. To determine sequence and PTM
sites, proteins have traditionally been proteolytically digested prior to mass spectral
analysis. However, some of these PTMs are labile and dissociate easily from the parent
ion when performing tandem MS/MS techniques such as CAD (collisionally activated
dissociation) or IRMPD (infrared multiphoton dissociation). These methods can
potentially lose information on some PTM sites. A unique new dissociation method
pioneered by McLafferty et al. called Electron Capture Dissociation (ECD) [13, 14] gives
29

a larger number of fragments and sequence coverage than the previously mentioned
fragmentation techniques, while preserving labile PTMs intact on the fragment ions [15-
18]. This technique offers the capability to locate PTMs from the intact protein without
first having to digest the protein. Currently ECD is only compatible with the FT-ICR
mass spectrometer [19]. Although Electron Transfer Dissociation (ETD) reported
recently by Hunt et al. [20], enables similar fragmentation pathways to be observed with
other types of mass spectrometers, FT-ICR instrumentation uniquely allows simultaneous
high resolution, mass accuracy, and sensitivity for complex spectral interpretation. The
advantage that high mass accuracy offers to proteomics is its ability to identify and
unambiguously confirm protein identification through the production of sequence tag
information, and peptide or fragment masses when dealing with the top-down approach.
When analyzing proteins through the bottom up approach it is possible to identify
a protein based only on a few peptide masses, when these masses are searched against a
database. The number of peptide masses required for positive identification of a protein
is decreased as the mass accuracy increases [21-23]. It has been shown that with
adequate mass accuracy and additional constraints, it is possible to identify a protein with
just one peptide mass [23]. There have been a number of different search tools designed
to deal with this type of bottom up analysis of proteins. The same idea applies when
dealing with MS/MS fragments of whole proteins instead of peptides; as the mass
accuracy of the measurement increases, the number of fragment masses needed to
identify a protein is decreased. High mass accuracy will prove to be advantageous when
doing chromatographic runs of whole proteins which are heavily modified or when there
are multiple proteins present. Since the mass accuracy in ICR technology can be limited
30

by space charge effects, a method to correct for space charge effects in tandem MS/MS
experiments to obtain high mass accuracy is needed. Furthermore, the number of ions
entering the mass spectrometer during a chromatographic run can vary greatly which will
lead to mass errors associated with space charge effects since the number of ions entering
the ICR cell is not constant. There have been many research efforts designed to
circumvent this problem and obtain high mass accuracy in tandem MS/MS ICR
experiments [24-28]. Efforts have also been made to control the number of ions entering
the ICR cell; the development of automated gain control limits the need to correct for
space charge effects by routinely allowing the same total ion population to enter the ICR
cell [6, 7, 29]. However, during ECD and top-down experiments it is desirable to obtain
a large parent ion population in the ICR cell. This is because of the lower efficiency of
the dissociation process and the large number of possible fragmentation pathways that
result in an increased production of lower intensity fragment ions. If a smaller population
of precursor ions is used for dissociation, the fragment ions that form to a lesser degree
are lost in the noise and not detected. Also, the parent ion population is often not the
same as the total ion population after dissociation because of the charge reduction
processes that can take place during ECD. Thus, controlling the ion population by
limiting the number of ions in the ICR cell can be problematic when doing ECD
experiments. Finally, correction of space charge effects with an internal calibrant for
MS/MS experiments adds additional complexity to the experiments, such as the need to
inject the calibrant species along with the MS/MS fragment ions into the ICR cell. In
dissociation spectra such as those resultant from ECD, there are a large number of peaks
with a wide range of charge states. This makes the detected time-domain signal more
31

complex due to the amount of constructive and destructive interferences [30, 31]. The
complexity affects the peak intensities in such a way that the summation of the peak
intensities may no longer reflect the total ion intensity in the ICR cell [32]. During
MS/MS experiments there are a wide range of fragment masses that are formed. The
calibration procedure works best when it is possible to accurately determine the exact ion
intensity and works best for high mass species when the m/z of the calibrant is matched to
the analyte [32]. DeCAL only requires that multiple charge states of the same molecular
species be present in the spectrum; therefore it will only work with multiply charged ions.
During MS/MS experiments there is usually only one charge state that is selected for
dissociation. However, for highly charged ions, these species often dissociate in such a
way that there are multiple charge states of the same molecular fragment produced.
When intact protein ions are analyzed by electrospray and ECD they dissociate to
produce many charge state pairs, thus allowing the opportunity for space charge effect
correction with DeCAL. The advantage that DeCAL provides is that everything that is
needed to correct for space charge effects is inherent in the spectrum. The correction is
done through post processing and can be done without any further manipulation of the
ion population or previous knowledge of the species being analyzed.
Experimental
Ubiquitin (MWavg = 8565Da) and horse myoglobin (MWavg = 16952Da) were dissolved
in a solution of 49:49:2 by volume of water, methanol, and acetic acid and diluted to
10uM. Electrospray was used as the ionization source. The voltage on the capillary was
32

set between 2,050V and 2,350V. A syringe pump used to introduce the solutions was set
between 15-25uL/hr. A Bruker Daltonics Apex-Q 7T FT-ICR mass spectrometer was
used to acquire the mass spectral data using Xmass as the data acquisition software
program. The instrument was externally calibrated using ubiquitin a few days prior to the
collection of data presented here. However, careful adjustments of trapped ion
population sizes present during data acquisition to match those that were present during
calibration was not performed. Therefore, the observed uncorrected error is not what one
might expect from a high performance mass analyzer operated under carefully controlled
conditions. The ions enter the instrument through a glass capillary and then pass through
a hexapole followed by a quadrupole then a second hexapole. The quadrupole was used
to select the specific m/z ions of interest to be fragmented (11+ for ubiquitin, 16+ for
myoglobin). These ions were accumulated between 1-2 seconds in the second hexapole
to acquire sufficient ion population for ECD. The ions were then transported to the ICR
cell using electrostatic focusing. The ions were trapped in the ICR cell using a low
energy sidekick potential to keep the ions close to the central z-axis of the cell. Electron
capture dissociation was performed using a heated cathode dispenser located outside the
ICR cell to obtain the MS/MS data. The cathode dispenser was heated with 1.6 to 1.8A
and held at approximately 5 to 6V. The electron injection time was set at 1.0-3.0ms, the
potential on the solid cathode dispenser was set at -7.5 to -15V. The spectra were
obtained by signal averaging 65 scans. All data sets acquired were 512k points. Data
were interpreted with aid of the computer program ICR-2LS [33]. The calibration
function that was used to convert ion cyclotron frequency to m/z values is written as a
33

variation of Equation 2 and represented by Equation 3, where A and B are calibration
constants, and f is the measured cyclotron frequency.
( )BfAzm−
=/ (3)
The data sets were apodized using the Welch apodization function and zero-filled twice
before Fourier transformation to the frequency domain. The DeCAL program used to
correct for the frequency shift in the tandem MS/MS data is a module written within ICR-
2LS. The monoisotopic masses of the fragment ions from the spectra were entered into
the web based software and database tool called ProSight PTM, designed by Kelleher et.
al. [34] to specifically deal with the characteristics of the top-down proteomics approach.
To compare the effects of identification of a protein using fragment masses from ECD
data, monoisotopic masses of the fragment ions with and without the use of DeCAL were
entered into the ProSight PTM program.
Results and Discussion
When two charge states of the same molecular species are deconvoluted and
overlaid, optimum overlap occurs when the observed frequency shift is equal to the shift
resultant from space charge effects. Here our assumption is that the frequency shift is a
constant value across the entire spectrum, which seems to be true at least to a first order
approximation. However, DeCAL or derivatives of this approach can also account for
more complex non-linear shifts. This requires that sufficient charge states exist in the
spectrum to allow functional characterization of non-linear shifts. A constant shift in
frequency space causes different m/z values to be shifted to slightly different degrees in
34

the mass domain causing the two deconvoluted isotopic distributions of the same
molecular species to not overlap exactly as would be expected. The two isotopic
distributions are expected to overlap exactly when deconvoluted because they have the
same molecular composition. DeCAL shifts the original frequency-domain spectrum in
an iterative fashion in frequency-space until the resultant two deconvoluted isotopic
distributions overlap in the mass-domain. Importantly, when the two isotopic
distributions converge, they do so in alignment with the theoretical isotopic distribution
as can be seen in Figure 1. In this figure, the theoretical isotopic distribution of ubiquitin
is shown, along with deconvolved isotopic distributions resultant from the 8+ and 7+
charge states of ubiquitin. Initially, the two isotopic distributions do not overlap
extremely well. As the two isotopic distributions are shifted in frequency space they
begin to merge together and do so in good agreement with the theoretical isotopic
distribution. The error between the deconvoluted isotopic distributions is minimized at
the same time that the alignment with the theoretical distribution (which is not normally
known, but shown here for illustrative purpose) becomes optimal. When the two
deconvoluted isotopic distributions overlap, the shift in frequency is equal to the
frequency shift due to the space charge effects. DeCAL acts as a correction process for
space charge effects resultant from Coulombic interactions. However, it should be noted
that this correction process will be ineffective if the instrument is initially poorly
calibrated.
ECD was performed on the 11+ charge state of ubiquitin (Figure 2), and the
resulting fragment ion peaks within 100ppm error range were identified using ProSight
PTM. The average mass error in the spectrum without correction for space charge effects
35

was 53ppm. While better than data from some MS/MS instruments, these results do not
match the performance in mass accuracy that is expected from a FT-ICR instrument. It
should also be noted that much better performance could have been obtained through
careful calibration and matching of total ion populations. This example is used to show
the utility of DeCAL to correct space charge effects when the ion populations are not
matched. In the absence of sophisticated “automated gain control” type experiments, this
mismatch of ion population sizes is very likely in LC/MS or LC/MS/MS experiments.
Fortunately, space charge effects result in a systematic error in which a constant offset is
applied to all frequencies in the spectrum. Plotting the error in ppm of the identified
peaks in the spectrum vs. m/z as seen in Figure 3, gives a visual indication of the
systematic error that occurs. As the m/z value increases, the error also increases in a
linear fashion. This increase in error as the m/z increases is expected based on the inverse
relationship between m/z and cyclotron frequency as seen in Equation 1. As the m/z
value increases, the frequency decreases. Thus, for a constant frequency offset, the
higher m/z (lower frequency) will exhibit a larger relative shift in frequency and be
shifted to a greater extent in the mass-domain than the lower m/z (higher frequency) ions.
DeCAL was then applied to the same set of acquired data to correct space charge effects.
No knowledge of the ion identity or ion abundance was used. A plot of resultant error in
ppm of the identified fragment ions vs. m/z is shown in Figure 4. This figure shows
substantial improvement in error and the feasibility of correction for this type of
systematic error in MS/MS spectra. The plotted error points no longer have a linear trend
of increasing error, which shows that DeCAL has virtually removed the systematic error.
After applying DeCAL to the data, the average error in ppm decreased to less than 2ppm
36

which is greater than a 30 fold improvement. Thus, DeCAL has the capability of
correcting space charge effects in tandem MS/MS experiments used for top-down
proteomics.
During the experiment, the 11+ charge state of ubiquitin was isolated using the
mass selective quadrupole. These ions were then dissociated inside the ICR cell by ECD
to give an array of charge states that ranged from 11+ to 1+. When the ions dissociated, a
large number of isotopic distributions resulted, some of which were the same molecular
fragment but with different charge states. This production of charge state pairs is
common with dissociation of highly charged precursor ions, and is advantageous since
DeCAL relies on charge state pairs to perform its calculations for correction. Within the
ubiquitin spectrum, the program was able to locate eleven charge state pairs, and these
charge state pairs were used to perform DeCAL. The induced frequency shift for the data
set was determined to be 6.03Hz.
The application of DeCAL to MS/MS data is useful for the top-down proteomic
approach. The increased mass accuracy is useful when analyzing fragment masses to
determine the identity and possible PTM sites. The data collected from the ECD
spectrum of the 16+ charge state of horse myoglobin (Figure 5) was used in the database
search to determine how the mass accuracy effects the ability to identify the protein based
on the fragment masses. ECD produces primarily c and z• fragments when the parent ion
dissociates, so the search was performed looking for these fragments. Without the
correction of space charge effects, 50 monoisotopic masses were selected corresponding
to the most intense isotopic distributions in the spectrum, and were entered into ProSight
PTM. When setting the parameter for fragment mass tolerance to 25ppm, there were 28
37

proteins that were identified as possible matches, none of which were myoglobin. After
performing DeCAL and running the search at 5ppm myoglobin is readily identified with
a P-score of 8.1x10-48. This P-score gives the probability of a match being a random
event, so the lower the P-score the higher the confidence of the search [35]. The average
error for the identified fragment ion peaks in the myoglobin raw data was 58.8ppm.
Figure 6 shows this substantial error. The error associated with the spectrum is not too
surprising since the FT-ICR instrument was calibrated using ubiquitin, with a different
set of parameters and different ion abundances in the ICR cell, a few days prior to
obtaining the mass spectrum of myoglobin. Figure 7 shows how the error in ppm
changes after the application of DeCAL on the same set of data. DeCAL indicated a
frequency shift of 6.07 Hz and the average error dropped to 5.5ppm, which is over a
factor of 10 improvement. By statically removing the two outliers, which can be seen in
Figure 7, the average error drops to 1.7ppm which gives about another factor of 3
improvement.
The advantage that DeCAL offers when applied to MS/MS data for this type of
analysis is to increase the confidence of obtaining positive protein identification.
Ubiquitin was used to test how the probability of a random match is effect by mass
accuracy. The top 50 most intense fragment masses from the spectrum were selected and
entered into the database. The mass tolerance parameter in ProSight PTM was varied
with and without the application of DeCAL (Table 1). Without DeCAL, ubiquitin was
not selected as a probable match until the mass tolerance parameter of the search
increased to 35ppm. At this tolerance, even though ubiquitin was selected as a probable
match, it did not receive the lowest P-score of the proteins selected as a probable match.
38

The probability of a match did not become significant until the mass tolerance was
increased to 50ppm, which is also close to the average error of the assigned isotopic
peaks (53ppm) in the data shown in Figure 3. The probability that the identified protein
was not a random event reached a maximum at 1.2x10⁻¹⁸, at which the mass tolerance
was set at 65ppm. With the use of DeCAL, ubiquitin was detected with confidence
within a mass tolerance of 5ppm, with the probability of it being a random event being
9.8x10-43. Table 1 shows the impact of database searching with and without the
application of DeCAL. In Table 1, the P-scores are lower with the application of DeCAL
until the mass tolerance is set to 65ppm, at which the two columns have equal P-scores.
The reason is that at 65ppm the same number of fragment ions have been assigned to
ubiquitin for both cases. As the mass tolerance is allowed to increase to 100ppm the P-
score without DeCAL becomes less (more significant) than the P-score with DeCAL.
The reason for this observation is that there are more peaks assigned to ubiquitin within
that mass tolerance. As seen in Figure 3 there is a cluster of identified peaks that fall
below the trend line formed due to the systematic error. These peaks are the result of the
misassigned monoisotopic peaks in the ECD spectrum. All of the misassigned fragment
ions were highly charged and of relatively low abundance so that the monoisotopic peak
was not visible in the spectrum. These peaks were actually assigned to the correct
fragment. However, since the algorithm misidentified the monoisotopic peaks, the error
values from these fragments do not follow the observed trend. When the frequency shift
is corrected, these peaks are shifted out of the 100ppm error window and are not seen in
Figure 4. These possible misassigned peaks are taken into account when determining the
P-score, which artificially causes the P-score of the uncorrected data to be better than it
39
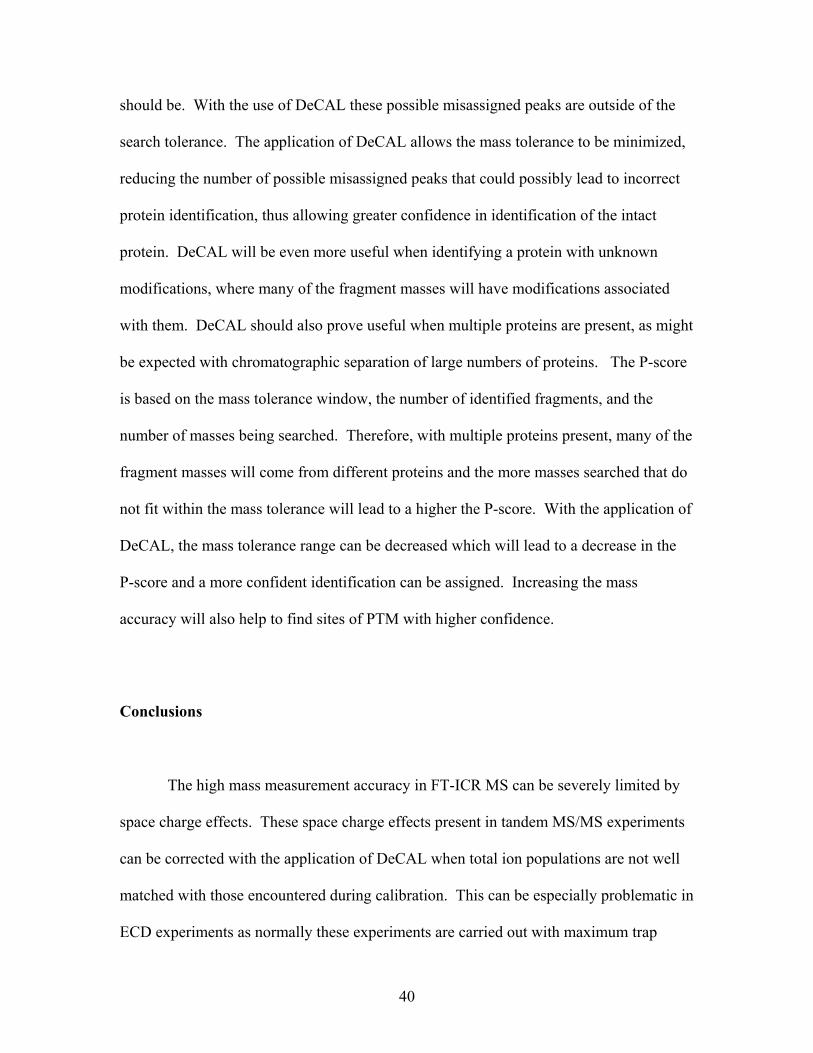
should be. With the use of DeCAL these possible misassigned peaks are outside of the
search tolerance. The application of DeCAL allows the mass tolerance to be minimized,
reducing the number of possible misassigned peaks that could possibly lead to incorrect
protein identification, thus allowing greater confidence in identification of the intact
protein. DeCAL will be even more useful when identifying a protein with unknown
modifications, where many of the fragment masses will have modifications associated
with them. DeCAL should also prove useful when multiple proteins are present, as might
be expected with chromatographic separation of large numbers of proteins. The P-score
is based on the mass tolerance window, the number of identified fragments, and the
number of masses being searched. Therefore, with multiple proteins present, many of the
fragment masses will come from different proteins and the more masses searched that do
not fit within the mass tolerance will lead to a higher the P-score. With the application of
DeCAL, the mass tolerance range can be decreased which will lead to a decrease in the
P-score and a more confident identification can be assigned. Increasing the mass
accuracy will also help to find sites of PTM with higher confidence.
Conclusions
The high mass measurement accuracy in FT-ICR MS can be severely limited by
space charge effects. These space charge effects present in tandem MS/MS experiments
can be corrected with the application of DeCAL when total ion populations are not well
matched with those encountered during calibration. This can be especially problematic in
ECD experiments as normally these experiments are carried out with maximum trap
40

capacity of the precursor, and result in variable amounts of product ions. However, ECD
spectra often contain a number of charge state pairs that can be used for correction. The
application of DeCAL results in an average error for tandem MS/MS data in the low ppm
range, even when trapped ion populations are not carefully controlled. This improvement
in mass accuracy allows one to accurately identify proteins based on accurate fragment
masses. Without the use of DeCAL, our database search did not correctly identify
myoglobin protein when the search mass tolerance was set at 25ppm or better. With
DeCAL application, we were able to identify proteins unambiguously with the mass
tolerance set to much tighter constraints. These tighter search constraints yield much
greater confidence in the search results. Additionally, the higher mass accuracy possible
with DeCAL will be beneficial when analyzing complex protein mixtures. Finally,
increased mass measurement accuracy will also likely allow more accurate determination
of posttranslational sites from top-down proteomic studies.
Acknowledgements
This research was supported by the National Science Foundation, Instrument
Development for Biological Research Program, Grant No. DBI-0352451, and the
Murdock Charitable Trust. The authors also thank Dr. Gary Kruppa for his assistance
with initial ECD experiments.
41

References 1. Marshall, A.G., C.L. Hendrickson, and G.S. Jackson, Fourier transform ion cyclotron resonance mass spectrometry: a primer. Mass Spectrometry Reviews, 1998. 17(1): p. 1-35. 2. Ledford, E.B., Jr., D.L. Rempel, and M.L. Gross, Space charge effects in Fourier
transform mass spectrometry. I. Electrons. International Journal of Mass Spectrometry and Ion Processes, 1984. 55(2): p. 143-54.
3. Ledford, E.B., Jr., D.L. Rempel, and M.L. Gross, Space charge effects in Fourier
transform mass spectrometry. Mass calibration. Anal Chem, 1984. 56(14): p. 2744-8.
4. Easterling, M.L., T.H. Mize, and I.J. Amster, Routine part-per-million mass
accuracy for high-mass ions: space-charge effects in MALDI FT-ICR. Analytical Chemistry, 1999. 71(3): p. 624-632.
5. Francl, T.J., R.L. Hunter, and R.T. McIver, Jr., Zoom transform for mass
measurement accuracy in Fourier transform mass spectrometry. Analytical Chemistry, 1983. 55(13): p. 2094-6.
6. Belov, M.E., R. Zhang, E.F. Strittmatter, D.C. Prior, K. Tang, and R.D. Smith,
Automated gain control and internal calibration with external ion accumulation capillary liquid chromatography-electrospray ionization-Fourier transform ion cyclotron resonance. Analytical Chemistry, 2003. 75(16): p. 4195-4205.
7. Belov, M.E., V.S. Rakov, E.N. Nikolaev, M.B. Goshe, G.A. Anderson, and R.D.
Smith, Initial implementation of external accumulation liquid chromatography/electrospray ionization Fourier transform ion cyclotron resonance with automated gain control. Rapid Communications in Mass Spectrometry, 2003. 17(7): p. 627-636.
8. Burton, R.D., K.P. Matuszak, C.H. Watson, and J.R. Eyler, Exact mass
measurements using a 7 tesla fourier transform ion cyclotron resonance mass spectrometer in a good laboratory practices-regulated environment. Journal of the American Society for Mass Spectrometry, 1999. 10(12): p. 1291-1297.
9. Bruce, J.E., G.A. Anderson, M.D. Brands, L. Pasa-Tolic, and R.D. Smith,
Obtaining more accurate Fourier transform ion cyclotron resonance mass measurements without internal standards using multiply charged ions. Journal of the American Society for Mass Spectrometry, 2000. 11(5): p. 416-421.
42

10. Ge, Y., B.G. Lawhorn, M. ElNaggar, E. Strauss, J.H. Park, T.P. Begley, and F.W. McLafferty, Top down characterization of larger proteins (45 kDa) by electron capture dissociation mass spectrometry. J Am Chem Soc, 2002. 124(4): p. 672-8.
11. Reid, G.E. and S.A. McLuckey, 'Top down' protein characterization via tandem
mass spectrometry. J Mass Spectrom, 2002. 37(7): p. 663-75. 12. Sze, S.K., Y. Ge, H. Oh, and F.W. McLafferty, Top-down mass spectrometry of a
29-kDa protein for characterization of any posttranslational modification to within one residue. Proc Natl Acad Sci U S A, 2002. 99(4): p. 1774-9.
13. Zubarev, R.A., N.L. Kelleher, and F.W. McLafferty, Electron Capture
Dissociation of Multiply Charged Protein Cations. A Nonergodic Process. Journal of the American Chemical Society, 1998. 120(13): p. 3265-3266.
14. McLafferty, F.W., D.M. Horn, K. Breuker, Y. Ge, M.A. Lewis, B. Cerda, R.A.
Zubarev, and B.K. Carpenter, Electron capture dissociation of gaseous multiply charged ions by Fourier-transform ion cyclotron resonance. Journal of the American Society for Mass Spectrometry, 2001. 12(3): p. 245-249.
15. Kelleher, N.L., R.A. Zubarev, K. Bush, B. Furie, B.C. Furie, F.W. McLafferty,
and C.T. Walsh, Localization of Labile Posttranslational Modifications by Electron Capture Dissociation: The Case of g-Carboxyglutamic Acid. Analytical Chemistry, 1999. 71(19): p. 4250-4253.
16. Hakansson, K., H.J. Cooper, M.R. Emmett, C.E. Costello, A.G. Marshall, and
C.L. Nilsson, Electron capture dissociation and infrared multiphoton dissociation MS/MS of an N-glycosylated tryptic peptide to yield complementary sequence information. Analytical Chemistry, 2001. 73(18): p. 4530-4536.
17. Mirgorodskaya, E., P. Roepstorff, and R.A. Zubarev, Localization of O-
glycosylation sites in peptides by electron capture dissociation in a Fourier Transform mass spectrometer. Analytical Chemistry, 1999. 71(20): p. 4431-4436.
18. Shi, S.D.H., M.E. Hemling, S.A. Carr, D.M. Horn, I. Lindh, and F.W.
McLafferty, Phosphopeptide/phosphoprotein mapping by electron capture dissociation mass spectrometry. Analytical Chemistry, 2001. 73(1): p. 19-22.
19. Zubarev, R.A., Reactions of polypeptide ions with electrons in the gas phase.
Mass Spectrometry Reviews, 2003. 22(1): p. 57-77. 20. Syka, J.E., J.J. Coon, M.J. Schroeder, J. Shabanowitz, and D.F. Hunt, Peptide and
protein sequence analysis by electron transfer dissociation mass spectrometry. Proc Natl Acad Sci U S A, 2004. 101(26): p. 9528-33.
43

21. Takach, E.J., W.M. Hines, D.H. Patterson, P. Juhasz, A.M. Falick, M.L. Vestal, and S.A. Martin, Accurate Mass measurements using MALDI-TOF with delayed extraction. Journal of Protein Chemistry, 1997. 16(5): p. 363-369.
22. Clauser, K.R., P. Baker, and A.L. Burlingame, Role of Accurate Mass
Measurement (+-10 ppm) in Protein Identification Strategies Employing MS or MS/MS and Database Searching. Analytical Chemistry, 1999. 71(14): p. 2871-2882.
23. Goodlett, D.R., J.E. Bruce, G.A. Anderson, B. Rist, L. Pasa-Tolic, O. Fiehn, R.D.
Smith, and R. Aebersold, Protein Identification with a Single Accurate Mass of a Cysteine-Containing Peptide and Constrained Database Searching. Analytical Chemistry, 2000. 72(6): p. 1112-1118.
24. Masselon, C., G.A. Anderson, R. Harkewicz, J.E. Bruce, L. Pasa-Tolic, and R.D.
Smith, Accurate mass multiplexed tandem mass spectrometry for high-throughput polypeptide identification from mixtures. Analytical chemistry, 2000 Apr 15. 72(8): p. 1918-24.
25. Kruppa, G., P.D. Schnier, K. Tabei, S. Van Orden, and M.M. Siegel, Multiple ion
isolation applications in FT-ICR MS: exact-mass MSn internal calibration and purification/interrogation of protein-drug complexes. Anal Chem, 2002. 74(15): p. 3877-86.
26. Hannis, J.C. and D.C. Muddiman, A dual electrospray ionization source
combined with hexapole accumulation to achieve high mass accuracy of biopolymers in Fourier transform ion cyclotron resonance mass spectrometry. Journal of the American Society for Mass Spectrometry, 2000. 11(10): p. 876-883.
27. Brock, A., D.M. Horn, E.C. Peters, C.M. Shaw, C. Ericson, Q.T. Phung, and A.R.
Salomon, An Automated Matrix-Assisted Laser Desorption/Ionization Quadrupole Fourier Transform Ion Cyclotron Resonance Mass Spectrometer for "Bottom-Up" Proteomics. Analytical Chemistry, 2003. 75(14): p. 3419-3428.
28. Chan, T.W.D., L. Duan, and T.P.E. Sze, Accurate Mass Measurements for
Peptide and Protein Mixtures by Using Matrix-Assisted Laser Desorption/Ionization Fourier Transform Mass Spectrometry. Analytical Chemistry, 2002. 74(20): p. 5282-5289.
29. Michael Senko, Vladimir Zabrouskov, Oliver Lange, Andreas Wieghaus, and S.
Horning, LC/MS with External Calibration Mass Accuracies Approaching 100 ppb. In Proceedings of the 52nd ASMS Conference on Mass Spectrometry and Allied Topics, Nashville, TN, May 23-27, 2004.
44

30. Easterling, M.L., I.J. Amster, G.J. van Rooij, and R.M.A. Heeren, Isotope beating effects in the analysis of polymer distributions by Fourier transform mass spectrometry. Journal of the American Society for Mass Spectrometry, 1999. 10(11): p. 1074-1082.
31. Hofstadler, S.A., J.E. Bruce, A.L. Rockwood, G.A. Anderson, B.E. Winger, and
R.D. Smith, Isotopic beat patterns in Fourier transform ion cyclotron resonance mass spectrometry: implications for high resolution mass measurements of large biopolymers. International Journal of Mass Spectrometry and Ion Processes, 1994. 132(1-2): p. 109-27.
32. Taylor, P.K. and I.J. Amster, Space charge effects on mass accuracy for multiply
charged ions in ESI-FTICR. International Journal of Mass Spectrometry, 2003. 222(1-3): p. 351-361.
33. Anderson, G.A., J.E. Bruce, and Eds, ICR-2LS1995, Pacific Northwest National
Laboratory: Richland, WA,1995. 34. Taylor, G.K., Y.-B. Kim, A.J. Forbes, F. Meng, R. McCarthy, and N.L. Kelleher,
Web and database software for identification of intact proteins using "top down" mass spectrometry. Analytical Chemistry, 2003. 75(16): p. 4081-4086.
35. Meng, F., B.J. Cargile, L.M. Miller, A.J. Forbes, J.R. Johnson, and N.L. Kelleher,
Informatics and multiplexing of intact protein identification in bacteria and the archaea. Nat Biotechnol, 2001. 19(10): p. 952-7.
45

Figure 1
8562.2 8563.1 8564.0 8564.9 8565.8Mass
(M+7H)7+
Theoretical (M+8H)8+
8562.2 8563.1 8564.0 8564.9 8565.8Mass
(M+7H)7+
Theoretical
(M+8H)8+
0
33
66
100
8554.4 8559.4 8564.4 8569.4Mass
8574.4
Rel
ativ
e M
agni
tude
Application of DeCAL
0
33
66
100
8554.4 8559.4 8564.4 8569.4 8574.4Mass
A
m
p
u
d
Rel
ativ
e M
agni
tude
No DeCAL
Figure 1. The deconvoluted isotopic distributions of the 8+ and 7+ charge states of
ubiquitin are overlaid. The spectrum on the left is with no correction of frequency. The
expanded region reveals that the two isotopic distributions do not exactly overlap. The
theoretical isotopic distribution is also displayed. The spectrum on the right is after the
application of DeCAL. Here the isotopic distributions overlap much better, and as the
isotopic distributions converge they do so in good agreement with the theoretical isotopic
distribution.
46

Figure 2
0
25
50
75
100
200 400 600 800 1000 1200 1400 1600m/z
Rel
ativ
e M
agni
tude
1100 1125 1150 1175 1200m/z
z29
c40 c20
c10
z20
c41c51
c31
c21
z21
Figure 2. The ECD spectrum of ubiquitin 11+. The inset shows identification of several
c and z ions.
47

Figure 3.
-100
-80
-60
-40
-20
0
20
40
60
80
100
200 400 600 800 1000 1200 1400 1600
m/z
Erro
r (pp
m)
Figure 3. A visual representation of the error associated with the identified isotopic
distributions of ubiquitin fragment ions following ECD of the ubiquitin 11+ ions. The
graph shows a systematic increase in error with increasing m/z. The average error in the
spectra was 53.1ppm. Peaks that have misassigned monoisotopic peaks are located in a
cluster toward the bottom of the graph.
48

Figure 4
-100
-80
-60
-40
-20
0
20
40
60
80
100
200 400 600 800 1000 1200 1400 1600
m/z
Erro
r (pp
m)
Figure 4. The error associated with the identified isotopic distributions of the fragment
ions produced from ECD of the ubiquitin 11+ ions following the application of DeCAL.
The graph shows the correction of the systematic error produced by space charge effects.
The average error in the fragment ion spectra after DeCAL application was 1.59ppm.
The cluster of misassigned peaks seen in Figure 3 are now shifted out of the 100ppm
search window.
49

Figure 5
0
25
50
75
100
300 500 700 900 1100 1300 1500 1700m/z
Rel
ativ
e M
agni
tude
z55 z28 c46 z29
z9z49
z58c30
c98
1000 1025 1050 1075 1100m/z
(M+16H)16+
Figure 5. ECD-FTICR mass spectrum of myoglobin 16+. The inset shows the
identification of several c and z ions.
50

Figure 6
-150
-100
-50
0
50
100
150
300 500 700 900 1100 1300 1500 1700
m/z
Erro
r (pp
m)
Figure 6. The error associated with the identified isotopic distributions of the fragment
ions produced from ECD of the myoglobin 16+ ion. The average error of the identified
peaks in the spectra was 58.9ppm.
51
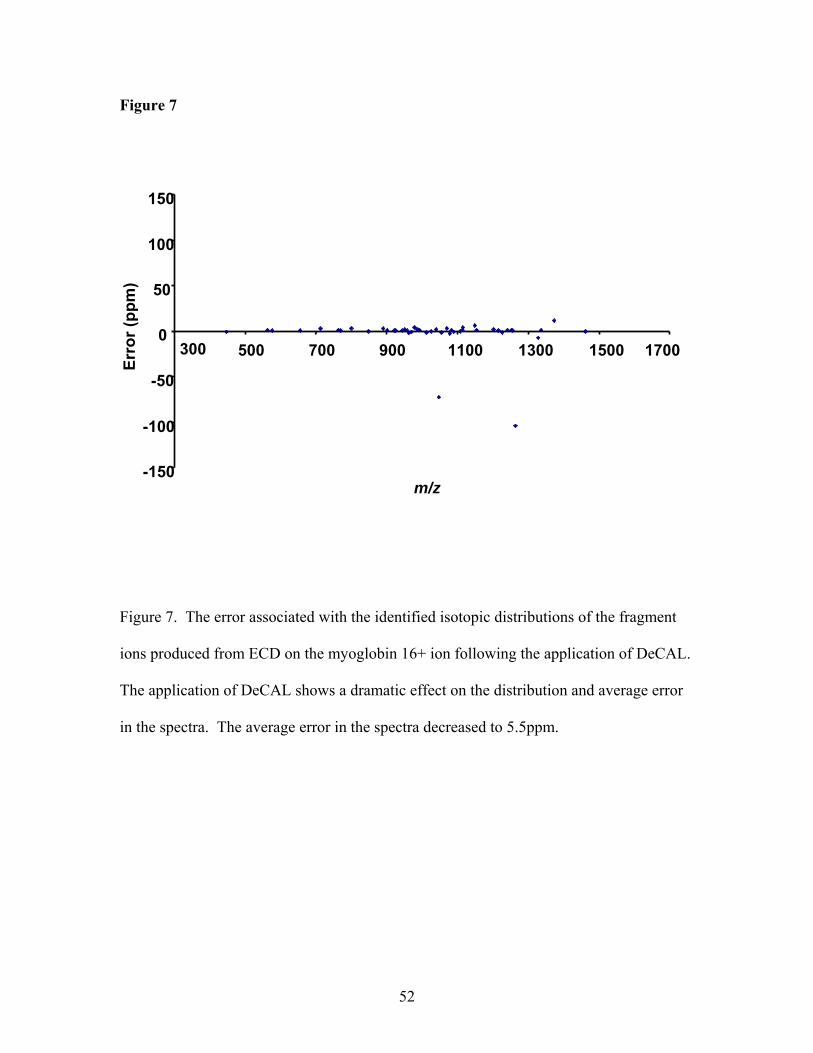
Figure 7
-150
-100
-50
0
50
100
150
300 500 700 900 1100 1300 1500 1700
m/z
Erro
r (pp
m)
Figure 7. The error associated with the identified isotopic distributions of the fragment
ions produced from ECD on the myoglobin 16+ ion following the application of DeCAL.
The application of DeCAL shows a dramatic effect on the distribution and average error
in the spectra. The average error in the spectra decreased to 5.5ppm.
52

Table 1
9.22E-15 22 4.16E-17 24 100
3.27E-16 22 1.90E-17 23 85
1.22E-18 22 1.22E-18 22 65
4.84E-21 22 2.19E-11 15 50
2.40E-24 22 35.92 3 35
1.71E-27 22 ---- 0 25
3.80E-36 22 ---- 0 10
9.84E-43 22 ---- 0 5
P-score Fragments Identified
P-score Fragments Identified
P-score With DeCAL
Without DeCAL Allowed Mass Tolerance
in ppm
Table 1. The top 50 most intense fragment masses from the ubiquitin ECD spectra of the
11+ ions were entered into ProSight PTM. The intact protein mass range was set at 8500
+/- 2000 Da while the mass tolerance of the fragment masses was varied. The use of
DeCAL shows a substantial improvement in the P-Score and in the ability to identify a
protein from its fragment masses.
53

CHAPTER 3 Observation of Increased Ion Cyclotron Resonance Signal Duration through Electric Field Perturbation Abstract Ion motion in Fourier Transform Ion Cyclotron Resonance Mass Spectrometry (FTICR-
MS) is complex and the subject of ongoing theoretical and experimental studies. Two
predominant pathways for the loss of ICR signals are thought to include damping of
cyclotron motion, where ions lose kinetic energy and radially damp toward the center of
the ICR cell, and de-phasing of ion coherence, where ions of like cyclotron frequency
become distributed out of phase at similar cyclotron radii. Both mechanisms result in the
loss of induced ion image current in FTICR-MS measurements and are normally
inseparable during time-domain signal analysis. For conventional ICR measurements
which take advantage of ion ensembles, maximization of the ion population size and
density can produce the desired effect of increasing phase coherence of ions during
cyclotron motion. However, this approach also presents the risk of coalescence of ion
packets of similar frequencies. In general, ICR researchers in the past have lacked the
tools necessary to distinguish or independently control de-phasing and damping
54

mechanisms for ICR signal loss. Nonetheless, the ability to impart greater phase
coherence of ions in ICR measurements will allow significant advances in FTICR-MS
research by improving the current understanding of ICR signal loss contributions of de-
phasing and damping of ion ensembles, increasing overall time-domain signal length, and
possibly, resulting in more routine ultrahigh resolution measurements. The results
presented here demonstrate the ability to employ a high density electron beam to perturb
electric fields within the ICR cell during detection of cyclotron motion, in an approach
we call Electron-Promoted Ion Coherence (EPIC). As such, EPIC reduces ICR signal
degradation through loss of phase coherence and much longer time-domain signals can be
obtained. Our results demonstrate that time-domain signals can be extended by more
than a factor of 4 with the implementation of EPIC, compared to conventional
experiments with otherwise identical conditions. The application of EPIC has also been
observed to reduce the appearance of peak coalescence. These capabilities are not yet
fully optimized nor fully understood in terms of the complex physics that underlie the
enhancement. However, the enhanced time-domain signals can result in improved
resolution in frequency-domain signals and as such, this result is important for more
efficient utilization of FTICR-MS. High resolution and accurate mass analysis are prime
motivating factors in the application of advanced FTICR technology. We believe the
approach presented here and derivatives from it may have significant benefit in future
applications of advanced FTICR technology.
55

Introduction
Fourier Transform Ion Cyclotron Resonance (FTICR) mass spectrometry1 is
unique in its ability to measure the mass-to-charge ratios (m/z) of many different charged
species simultaneously while providing high resolution and mass measurement accuracy.
The high performance capabilities associated with FTICR mass spectrometry arise from
the extended time period in which ion detection takes place, and allows for unambiguous
charge state determination of large multiply charged ions, accurate mass analysis of
complex peptide mixtures, and interpretation of complex MS/MS spectra2-10. The ICR
experiment starts by first trapping the ions in the ICR cell with an axial magnetic field
and an electrostatic potential well. Ions of the same m/z are excited together and form a
coherent ion cloud that has a single measurable cyclotron frequency. Excited ion clouds
must remain coherent in cyclotron motion for an extended period of time to allow
multiple period measurements. As the ion clouds traverse their cyclotron orbits, they
induce oscillating current in the detection circuitry with oscillation frequencies that result
from the summation of all ion cyclotron frequencies. This detection process allows for
simultaneous high resolution and mass measurement accuracy, as is detailed in many
excellent review articles and books 11-13. Other types of mass spectrometers besides
FTICR mass spectrometers have also utilized this non-destructive detection technique14,
15. Detection of ICR signals for extended periods of time allows multiple measurements
of each m/z species, and provides the foundation for the high performance capabilities of
FTICR-MS. In principle, the longer time period that ion signals are detected, the greater
the possible resolution and mass measurement accuracy. Furthermore, the achievable
56

sensitivity of FTICR-MS is also related to the length of the detectable sinusoidal signal.
However, in practice, acquisition of long time-domain signals does not guarantee high
performance measurements with FTICR-MS.
Several factors can affect higher performance measurements with FTICR-MS.
Although resolution, mass accuracy, and sensitivity can all be increased with improved
time-domain signal length, Coulombic interactions and inhomogeneities in the axial
electrostatic trapping potentials can cause variations in the observed cyclotron frequency
with time and space within the ICR cell. In a three-dimensional quadrupolar potential
field, the ion cyclotron frequency is independent of the positions of the ion clouds in the
ICR cell 16. However in most ICR cell designs, this ideal three-dimensional quadrupolar
potential is not achieved and the resulting non-quadrupolar trapping potentials may
contribute to frequency drifts17, 18. There have been many different trap geometries
designed to minimize electric field inhomogeneity and achieve improved quadrupolar
trapping potentials, while also maintaining high excitation and detection efficiencies 16, 19-
21. Also, the space charge potential arising from Coulombic interactions among ion
clouds may vary with time. For example, as the ion clouds relax back toward the center
of the ICR cell through collisional damping, their Coulombic interactions increase due to
the higher ion density experienced at smaller cyclotron radii. This increase in ion density
may cause the observed cyclotron frequency to decrease, as discussed by Guan et al 17.
Therefore, conditions can arise within the ICR cell that decrease instrument performance
and prevent extended periods of ion signal detection. To exploit the high performance
capabilities of FTICR-MS in more routine fashion, these conditions must be minimized.
57

Two primary processes are currently thought to limit ions from being detected for
extended periods of time. The combination of collisional damping 22 and de-phasing of
the ion packet cause the detected ICR signal to decay over time. Collisional damping is
resultant from collisions between the ions and residual neutral gas molecules present in
the ICR cell during detection of cyclotron motion. The coherent ion packet loses kinetic
energy through these collisions. To maintain constant cyclotron frequency, the lower
kinetic energy of the ions results in a smaller cyclotron orbit. As such, the ions become
further away from the detection plates and the observed signal is decreased. Ion/neutral
collisions are the primary reason that ICR measurements are normally carried out under
ultra-low pressure conditions. There are two limiting forms of collisional damping, ion-
induced dipole (Langevin) collision model, leading to an equation of ion motion damping
term that is linear in velocity resulting in a Lorentzian frequency-domain line shape, and
a hard-sphere collisional model, that produces a quadratic damping term22. The other
primary mechanism for loss of ICR signal is de-phasing. This process happens when the
ion cloud losses its phase coherence and ions of the same m/z value become distributed at
varying cyclotron phase angles instead of remaining as a coherent ion packet. A number
of different processes have been identified that contribute to ion cloud de-phasing. For
example, ion cloud density, magnetic field strength, Coulombic interaction with other ion
clouds, total cloud charge, and ion velocity are all parameters that have an effect on de-
phasing 23. As described by Peurrung and Kouzes, imposed shear effects disrupt the ion
phase coherence and cause the ion cloud to be distributed at various cyclotron phase
angles. These authors list possible sources of shear to include magnetic-field
inhomogeneities, image charge effects, passive space charge at the trap center and non-
58

harmonic or asymmetric components of the trapping potential well23. Also, some ions
present in the ICR cell may have sufficient energy to follow a trajectory that is different
from that of the bulk ion cloud. For example, ions with velocities significantly different
from that of the ion cloud are able to separate from the majority of ions which leads to a
loss of detected ICR signal. As a result, the reduction of charge in the ion packet
decreases coherence and induces a smaller image charge on the detection plates.
Currently, there is no convenient way to determine the contribution of each signal loss
mechanism to the observed signal decay; however, differentiation between damping and
de-phasing of cyclotron motion can be obtained through observation of multiple
harmonics24-27. Normally, the observed decay in the time-domain signal is considered to
be some combination of collisional damping and de-phasing.
Efforts have been made to minimize damping and de-phasing of ion cyclotron
motion 7, 28, 29,10. There are also examples in which ion de-phasing has been completely
eliminated, such as demonstrated with single or individual ion measurements 30-35. In
those experiments, a single ion carried enough charge that it produced a detectable image
current. Single ion measurements are unique in that there is no need for phase coherence
between ions, since only one ion of a specific m/z is present. In those cases, the only
signal loss mechanism other than through reaction, is through collisional damping. This
earlier work 36 demonstrated a significant improvement in time-domain signal length
compared to the conventional ion ensemble detection scheme. In single ion experiments,
measurements were conducted with species of the same molecular weight and under
similar vacuum conditions. Thus, increased time-domain signals could be attributed to
the removal of de-phasing mechanisms. However, most ions do not carry enough total
59

charge to be detected as single ions. In most conventional detection methods, an
ensemble of ions is needed to supply enough charge to induce a detectable image current.
Ions of the exact same m/z are excited in-phase with each other. These ions form a stable
ion packet and their collective charge induces a measurable image current for detection.
These ion packets seem to be more stable as the number of charges in the ion packets
increase. Ion cloud stability is important since it prevents de-phasing, however it can also
be limited by a number of factors. Peurrung and Kouzes 23 presented an explanation for
the underlying foundation of long term ion cloud stability. Nikoleav et al. have recently
presented numerical simulations with a higher degree of accuracy and give a more
revealing model of the complex ion motion in the ICR cell37. Peurrung and Kouzes
pointed out that the ion cloud undergoes an additional rotational motion separate from
cyclotron and magnetron motion. The ion cloud generates its own electric field and in
the presence of a magnetic field the ion cloud rotates about its own center. Ion cloud
rotation counterbalances shear factors mentioned above that can tear the ion cloud apart.
Ion cloud rotation is thought to be the primary basis which makes the duration of long
time-domain signals possible for an ensemble of ions. This ion cloud spin rotation
increases cloud stability as a function of higher charge density. However, the number of
ions that can form an ion cloud and still retain the resolving power necessary to separate
closely spaced peaks is limited by phase-locking or ion cloud coalescence. Mitchell and
Smith 38 reported that this coalescence phenomenon occurs when ion clouds have similar
cyclotron frequencies and large Coulombic charges. As the Coulombic charge in the ion
clouds increase, there is an increased likelihood that ion clouds with similar, but not
identical cyclotron frequencies will begin to rotate around each other. These separate ion
60

clouds can phase-lock and continue on a cyclotron orbit at a mutual cyclotron frequency
and will appear as one peak in the mass spectrum. Thus, mitigation of ion cloud de-
phasing through increased ion cloud density requires careful control to avoid conditions
that promote phase-locking or coalescence 29. These two opposing constraints, namely,
the ability to trap enough ions to promote single m/z ion cloud stability during detection
while keeping the ion population small enough to avoid coalescence represent real,
fundamental limitations of FTICR-MS performance.
Increased time-domain signal length can provide improved resolution and mass
measurement accuracy, and as such, increased routine time-domain signal acquisition
length is a goal of many studies to advance FTICR-MS technology. However, ion
motion in the ICR cell is still not completely understood and improved comprehension of
ion motion could result from methods that de-couple collisional damping and de-phasing
signal loss mechanisms. The primary motivation of the present manuscript is to report
the observation of experimental effects that serve to reduce ion cloud de-phasing
mechanisms. We call the observed effect, Electron-Promoted Ion Coherence, or EPIC,
since, with the application of a high density electron beam during detection, we observed
significant improvement in the length of detected coherent cyclotron motion. Electron
beams have been previously introduced into the ICR detection cell for a number of
different reasons such as ionization, dissociation39, ion transfer40, and ion trapping
(EBIT)41. However, to the best of our knowledge this is the first time that the electron
beam has been used to modulate electric fields during detection of during detection of
cyclotron motion. To the best of our ability to determine, the effects described below
appear to result in decreased ion cloud de-phasing and result in significantly improved
61

time-domain signal length. Also to the best of our knowledge, this capability represents
an entirely new tool that can be used to improve FTICR-MS performance as well as help
distinguish the two primary signal loss mechanisms. For example, this de-coupling could
enable a better understanding of ion motion and phase coherence which ultimately
enables improved detection techniques that enhance resolution, mass measurement
accuracy, and sensitivity.
Experimental
Ubiquitin (MWavg = 8,565Da), Bradykinin (MWavg = 1,060Da), and Substance P
(MWavg = 1348Da) obtained from Sigma Aldrich were dissolved and diluted to 10uM
concentration with a solution of 49:49:2 by volume of water, methanol, and acetic acid.
The experiments were performed with a Bruker Daltonics Apex-Q 7-T FTICR mass
spectrometer. The instrument has a mass selective quadrupole which allows for mass-
selective accumulation of a specific m/z species. Electrospray was used as the ionization
source in which the voltage on the capillary was set between -1,800V and -2,000V. A
syringe pump was used to introduce solutions at a rate of 15-25uL/hr. Ions were trapped
in the ICR cell using sidekick 42. In select experiments, argon was pulsed into the ICR
cell to cool the ions followed by a 2 to 4 second delay for pump down time before
excitation of ion cyclotron motion. Experiments that utilized argon cooling gas are
indicated below. In all experiments, the ion-gauge reached a minimum value of 5 X 10⁻¹⁰
Torr before the ions were excited. The projected pressure in the cell may be up to an
order of magnitude higher. Electron-Promoted Ion Coherence, or EPIC experiments
62

were performed by supplying a high density beam of electrons through the center of the
ICR cell during the detection event. The electron beam was produced using a hollow
cathode emitter43 normally used for Electron Capture Dissociation (ECD) experiments 39,
44, 45. The cathode emitter is located outside the ICR cell and is positioned along the
central axis of the ICR cell. The outer diameter of the cathode is 7.6 mm and has an
inner diameter of 3.5mm and was heated by passing a current of 1.5 Amps through it
using an external power supply. The pulse sequence of the experiment was modified so
that the electron beam was initiated after the cyclotron excitation event and before the
detection event. The electrons were pulsed into the ICR cell with conditions similar to
those used with ECD, except that the timing of the pulse sequence is different from
normal ECD experiments. The electron emitter was continually heated throughout all
phases of the experiment. The bias applied to the emitter was set at 0.0V for no electron
beam, and between -0.1V and -1.3V to stimulate emission of electrons. This high density
beam of electrons was continuously produced during the entire length of the detection
event. In EPIC experiments, the electron beam was turned on only after ions reached
their excited cyclotron orbits and was turned off after the termination of the detection
event. Experiments were performed in narrow-band detection mode for ultra-high
resolution and acquisition of longer attainable time-domain signals. Isolation of specific
charge states was performed prior to the ions entering the ICR cell with the mass-
selective quadrupole. Xmass (version 7.0.6) was used as the data acquisition software.
All data sets were collected as single scans. Control, or normal time-domain signals
shown for comparison were obtained by applying 0.0V bias to the emitter; during the
subsequent EPIC experiment, a voltage bias of -0.1V to -1.3V was applied to the emitter
63

to produce the high density electron beam. No other parameters were changed between
experiments. ICR-2LS 46 was used for data processing. The substance P data set was
apodized (Welch) and zero-filled once before obtaining the mass spectrum. The
measurements of cyclotron frequency drift with time were obtained using the "Sweep" 18
program, written as a module within ICR-2LS.
Results and Discussion
A high density, low energy electron beam produced along the central axis outside
the ICR cell during detection of ion cyclotron motion was found to significantly increase
the length of the observed time-domain signal. Though the dispenser cathode used to
create the electron beam was installed to produce electrons for ECD, no fragmentation
resultant from the electron beam was observed during EPIC experiments. The ion cloud
and electron beam likely have no overlap during detection, since the ion cloud is at a
larger cyclotron orbit as its motion is being detected. The calculated post excitation ICR
orbital radius was ~1.8cm, determined through single frequency excitation experiments.
Furthermore, if the electron beam and the excited ion cloud were to intersect during
detection, the resultant ECD fragment ions, if formed, would likely be distributed out of
phase with each other at similar radii, and little or no observable signal would have been
detected. With the present EPIC approach, the electron beam is only turned on after the
ions have been promoted to their excited cyclotron radius. As mentioned above, this
process is different than what normally occurs for ECD in which the electrons are pulsed
into the ICR cell with the sole purpose of interacting with the parent ions to cause
64

fragmentation. It should be noted that ECD experiments performed with application of
electron beams of similar density and duration result in complete loss of all observed ion
signals. For ECD experiments, the electron pulse is initiated for a short time period,
fragmentation takes place, and the resulting ions are excited and detected.
We originally investigated the use of the electron beam on ion cyclotron motion
in an attempt to learn about electrostatic field effects on ion cyclotron frequencies.
Previous publications reported the observation and correction of cyclotron frequencies
drifts during signal acquisition 17, 18. Since many of these efforts ascribe measured
cyclotron frequency shifts to electrostatic field effects on cyclotron motion, we
anticipated the high density electron beam produced from the ECD dispenser cathode
would prove to be a useful tool to investigate these affects.
However, a very striking and unexpected result was observed from the initial
experiments, which was a substantial increase in time-domain transient length. The
initial observation of increased time-domain transient length with the electron beam was
carried out using bradykinin with conditions that were not optimized for long-time
domain signal acquisition. Bradykinin ions were trapped in the ICR cell using sidekick,
which is thought to cause the ions to have slight magnetron motion and to be slightly
more spatially distributed in the ICR cell 42. Also, no collision gas was added for ion
cooling and compression of trapped ions before excitation. The initial observed result is
illustrated in Figure 1, which shows both the traditional time-domain signal and the
initial EPIC results along with their corresponding mass spectra. As mentioned above,
the initial non-EPIC results shown here were acquired without prior optimization of
conditions that enable long time-domain signal acquisition and thus, are not
65

representative of what one might expect in terms of longer time-domain transient
performance from this type of instrument. However, initial application of EPIC resulted
in improvement in the observed time-domain signal length, even for these non-ideal
conditions. The striking feature here of significant interest to us was the unexpected
increase in time-domain signal length.
The observation of increased signal duration during the electron beam application
was surprising to us for several reasons. First, ICR signal detection was not precluded
from noise or disrupted ion phase coherence caused by pulsing the dispenser cathode
during detection. One might expect that, given the small signals resultant from ion
motion, and the extreme high sensitivity of the detection circuitry normally used with
FTICR-MS, that signal detection might be much more difficult with the electron beam
turned on. Secondly, one might consider that changes in the electrostatic field inside the
ICR cell might disrupt all coherent ion motion due to the previous discussion of cloud
stability and electrostatic field-induced shear effects. These data suggest, at least under a
range of conditions that were investigated, that this is not the case. In fact, the ICR signal
appears more stable with EPIC conditions.
We believe that this observation of increased time-domain signal length has
significance, and our initial results warranted further investigation. Therefore, the next
experiments were performed to see if we could obtain a similar increase in ICR signal
duration under conditions that were more amenable to longer time-domain signals with
conventional or non-EPIC experiments. The conditions in the ICR cell were slightly
modified from those applied for the experiments discussed above by pulsing argon gas
into the ICR cell to cool the ions and reduce axial oscillation after trapping, but prior to
66

cyclotron excitation. This approach is similar to those used in most labs to acquire longer
time-domain signals, since reduction of axial motion results in a more compact ion cloud
and the opportunity to work at lower trapping potentials which seem more suitable to
longer time-domain signal detection. Figure 2a shows the resultant time-domain signal
from the narrow-band detection of ubiquitin (M+7H)7+. All parameters in the experiment
were carefully adjusted and controlled to maximize the observed time-domain signal
length. This resulted in detectable signal for approximately 25 seconds, and this result
represents the best we could achieve with the normal detection method on that particular
day. The subsequent time-domain signal was acquired immediately following, with the
exact same experimental parameters as was used in Figure 2a with the exception of the
application of the electron beam, and the results are shown in Figure 2b. With EPIC, the
length of the observed time-domain signal increased to over 70 seconds. This
observation was very exciting, since it demonstrated that significantly improved ion
signal duration could be achieved with EPIC, even when carefully optimized conditions
were implemented prior to EPIC. We were still able to observe the same significant
improvement in time-domain signal length as we observed without careful tuning and
cooling of axial motion. With the application of EPIC, the time-duration that signal
could be detected was enhanced by approximately a factor of 3.
As mentioned above, ICR signal loss is a convoluted combination of collisional
damping and de-phasing. Collisional damping occurs when the ion packet collides with
neutral molecules in the ICR cell. Therefore, with higher pressure in the ICR cell, we
would expect to see shorter time-domain signals. In our experiments, the pressure in the
ICR cell during signal acquisition was the same to the best of our ability to measure it.
67

Since the only difference was the application of the electron beam, one might consider
the effects of the electron beam on the effective pressure in the ICR cell. Pressure
changes associated with the activation of the electron beam are likely small, if any, based
on the lack of any measured changes observed with the ion gauge. In addition, any
negative change in pressure, as would be needed to ascribe the observed increase in
performance with EPIC to changes in collisional damping rates seem highly unlikely,
given the low energy of the electrons and the low base pressure measured on the system.
That is, any possible "pumping" resultant from electrons interacting with neutrals,
producing ions that are effectively able to escape the trap, and thus result in lower in-cell
pressures, is unlikely due to the fact that the electron energies are well below the
ionization energies of any possible neutral species that could be present in the cell.
Instead, it seems more likely that if any change to the pressure were to occur as a result of
the electron beam, it would likely be a shift to a higher pressure resulting from the
heating associated with the production of electrons from the dispenser cathode. This too,
is likely a very small contribution to the observations. Therefore, decay of signal
amplitude resultant from collisional damping of the ion packet is expected to be
approximately the same in both experiments. The calculated collision frequency between
the ions and residual neutral molecules was ~2 collisions per second, based on the
approximate cell pressure of 5x10⁻⁹ Torr and an excitation radius of 1.8cm. Thus, we
suspect that electrostatic field effects and ion cloud coherence are much more likely the
root of the observed enhancement in time-domain signal length and that application of a
steady stream of electrons through the ICR cell reduces electrostatic factors that promote
ion cloud de-phasing.
68
As pointed out in several previous theoretical treatments of ion motion, the
number of ions can significantly impact the stability of ion clouds and the length of
detectable ICR signals. This factor was considered in these investigations as well. The
number of ions that make up the ion clouds in each experiment from Figures 2a and 2b
was held constant to the best of our ability. Since the number of ions can be significantly
altered with ionization, ion accumulation, injection, trapping and excitation conditions,
all parameters were held constant between EPIC and non-EPIC experiments.
Furthermore, one thing to note in comparison of Figures 2a and 2b is that the initial
amplitudes of the two time-domain signals are approximately the same. The initial
amplitude is a function of the total charge in the ion packet and the radius to which the
ions clouds are accelerated. The initial amplitudes of the time-domain signals shown in
Figure 2 are the same within expected experimental error, indicating that the number of
ions present in each experiment is very nearly the same. Besides the application of the
electron beam, no modification was performed to any other parameter in the experiment.
As the number of ions in the ICR cell was decreased by reducing the ion accumulation
time, the length of the detected transient signal also decreased with and without the
application of EPIC. However, the same relative improvement in transient signal length
was observed with the application of EPIC, even with reduced ion population sizes. This
suggests that the effects of EPIC can not be entirely ascribed to reduction of the number
of trapped ions present during detection.
As mentioned previously, the initial motivation behind the application of the
electron beam during detection was to investigate possible perturbations in the
electrostatic fields and subsequent frequency shifts that may arise. Figure 3 illustrates
69

the effect that the electron beam can have on the measured cyclotron frequency shift,
compared to that observed with non-EPIC experiments using different isotope peaks of
bradykinin (M+2H)2+. This figure illustrates how the ion cyclotron frequency of the ion
packet is shifting with time as it spins on its excited cyclotron orbit. With the traditional
detection technique, it is common to see the frequency shift to a lower value with time 17,
47. However, with the EPIC-produced signals, we observe the frequency shift to a higher
value with time. One possible explanation for this observation is that when the electron
beam is turned on, changes in the electrostatic field potentials inside the ICR cell are
observed. The addition of the electron beam produces a radially inward-directed force on
the positive ions, and would thus be expected to shift the ICR frequency higher, lower
m/z, even at time zero during detection as observed in figure 3. This figure shows the
frequency shift with time to be much more prominent with the EPIC produced spectra. In
the resultant mass spectra of bradykinin (data not shown) the peaks produced from the
EPIC signal are thus broader due to the cyclotron frequency drifting with time. However,
this is not always the case; with careful optimization of the detection parameters it is
possible to nearly eliminate any frequency shift with time. Figure 4 shows the frequency
shift with time of the different isotope peaks of substance P (M+2H)2+. Here the
frequency shifts with the non-EPIC results are greater and slope to a lower frequency
with time with EPIC. The frequency with EPIC produced signal is relatively constant, in
which the standard deviation of the detected frequency for the monoisotopic peak is
0.119 Hz over the 10 second detection period, while the standard deviation for non-EPIC
result is 1.4 Hz. This results in higher resolving power in the mass spectra which are
shown in Figure 5. In this figure, the observed resolving power (FWHM) increased from
70
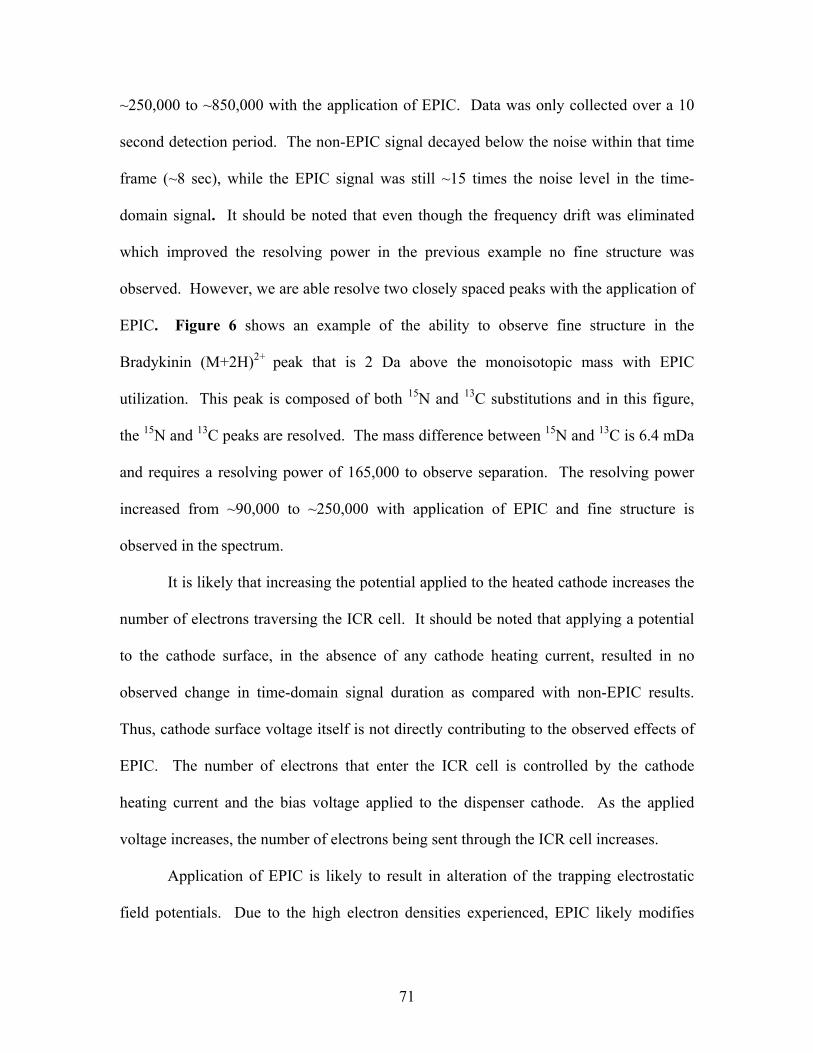
~250,000 to ~850,000 with the application of EPIC. Data was only collected over a 10
second detection period. The non-EPIC signal decayed below the noise within that time
frame (~8 sec), while the EPIC signal was still ~15 times the noise level in the time-
domain signal. It should be noted that even though the frequency drift was eliminated
which improved the resolving power in the previous example no fine structure was
observed. However, we are able resolve two closely spaced peaks with the application of
EPIC. Figure 6 shows an example of the ability to observe fine structure in the
Bradykinin (M+2H)2+ peak that is 2 Da above the monoisotopic mass with EPIC
utilization. This peak is composed of both 15N and 13C substitutions and in this figure,
the 15N and 13C peaks are resolved. The mass difference between 15N and 13C is 6.4 mDa
and requires a resolving power of 165,000 to observe separation. The resolving power
increased from ~90,000 to ~250,000 with application of EPIC and fine structure is
observed in the spectrum.
It is likely that increasing the potential applied to the heated cathode increases the
number of electrons traversing the ICR cell. It should be noted that applying a potential
to the cathode surface, in the absence of any cathode heating current, resulted in no
observed change in time-domain signal duration as compared with non-EPIC results.
Thus, cathode surface voltage itself is not directly contributing to the observed effects of
EPIC. The number of electrons that enter the ICR cell is controlled by the cathode
heating current and the bias voltage applied to the dispenser cathode. As the applied
voltage increases, the number of electrons being sent through the ICR cell increases.
Application of EPIC is likely to result in alteration of the trapping electrostatic
field potentials. Due to the high electron densities experienced, EPIC likely modifies
71

potential fields in a similar manner as a solid electrode placed through the center of the
ICR cell. Solouki et al. 48 previously implemented a Kingdon trap49 to be used with ICR
detection which utilized a solid copper wire electrode placed on the central axis of the
ICR cell to act as an ion guide and facilitate ion transfer from the source cell to the
analyzer cell. The presence of this wire caused perturbations in electrostatic field lines of
the trapping potentials. It is likely that there are similar shifts in the electrostatic field
lines when there is a high density electron beam present in the ICR cell, as encountered
during EPIC experiments. The electron beam will produce a negative potential region
through the center of the ICR cell. Gillig et. al.50 described the theoretical ion motion
within this particular ICR cell design. When a negative potential is placed through the
center of the ICR cell, the radial electric field is directed inwards for some volume of the
ICR cell. Thus, the magnetron motion within this region will relax back toward the
central axis of the ICR cell with time, with the presence of collisional damping.
Potentially, EPIC experiments will present many advantages inherent in the cell design
presented by Solouki et al., but also allow flexibility in the time in which the “electrode”
is present within the cell. However, the similarity of the axial electron beam to the actual
Kingdon trap will depend on the extent to which the electron beam density is constant
along the z-axis of the ICR cell.
Another important point to consider is that increased time-domain signals are a
prerequisite for high performance, but do not always translate into improved resolving
power. The time-domain signals in Figure 2a and 2b resulted in mass spectra of
approximately equal resolving power despite the much longer EPIC-produce result.
However under some conditions, it is possible to produce spectra of improved resolving
72
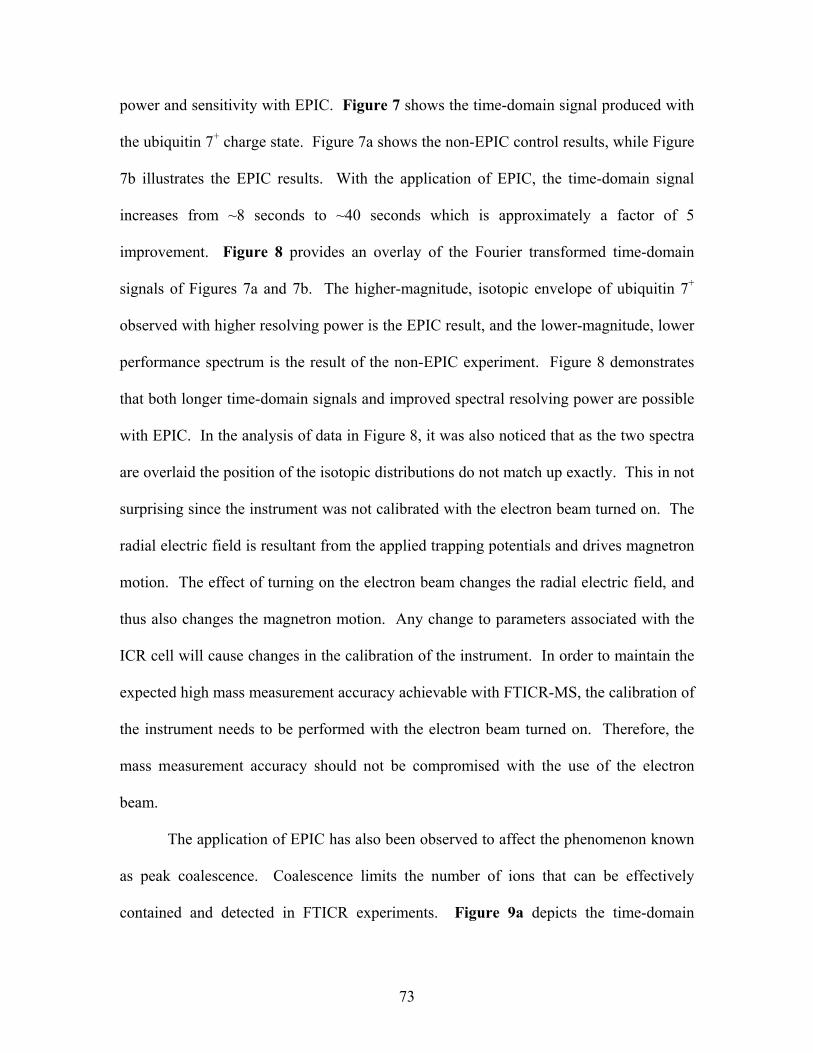
power and sensitivity with EPIC. Figure 7 shows the time-domain signal produced with
the ubiquitin 7+ charge state. Figure 7a shows the non-EPIC control results, while Figure
7b illustrates the EPIC results. With the application of EPIC, the time-domain signal
increases from ~8 seconds to ~40 seconds which is approximately a factor of 5
improvement. Figure 8 provides an overlay of the Fourier transformed time-domain
signals of Figures 7a and 7b. The higher-magnitude, isotopic envelope of ubiquitin 7+
observed with higher resolving power is the EPIC result, and the lower-magnitude, lower
performance spectrum is the result of the non-EPIC experiment. Figure 8 demonstrates
that both longer time-domain signals and improved spectral resolving power are possible
with EPIC. In the analysis of data in Figure 8, it was also noticed that as the two spectra
are overlaid the position of the isotopic distributions do not match up exactly. This in not
surprising since the instrument was not calibrated with the electron beam turned on. The
radial electric field is resultant from the applied trapping potentials and drives magnetron
motion. The effect of turning on the electron beam changes the radial electric field, and
thus also changes the magnetron motion. Any change to parameters associated with the
ICR cell will cause changes in the calibration of the instrument. In order to maintain the
expected high mass measurement accuracy achievable with FTICR-MS, the calibration of
the instrument needs to be performed with the electron beam turned on. Therefore, the
mass measurement accuracy should not be compromised with the use of the electron
beam.
The application of EPIC has also been observed to affect the phenomenon known
as peak coalescence. Coalescence limits the number of ions that can be effectively
contained and detected in FTICR experiments. Figure 9a depicts the time-domain
73

signals for the 2+ charge state of bradykinin in which closely spaced m/z species coalesce
after a short time period. The resulting mass spectra show a small peak just to the right
of the monoisotopic which is the result of peak coalescence. This was determined by
segmenting the time-domain signal into two different regions. Figure 9b shows the first
segment which contains the first 1.15 seconds of the time-domain signal. This part of the
signal contains information of different isotopes of bradykinin. Figure 9c shows the
second segment which contains the information from 1.25 to 16 seconds. The mass
spectrum that results from this time-domain segment contains only a single m/z peak, and
no isotopic information. The appearance of this peak happens at the same time that all
the isotopic peaks disappear. This collapse of isotopic peaks into a single peak is known
as coalescence and serves as a limitation to FTICR performance. Figure 10 shows the
EPIC produced time-domain signal and the resulting mass spectra under otherwise
identical experimental conditions as those in Figure 8. With the application of EPIC, the
coalescence is no longer observed. This observation was repeatable, as we were able to
turn the electron beam on and off and see the appearance and disappearance of the peak
coalescence. Under normal conditions, coalescence was observed with bradykinin
(M+2H)2+, however, with the application of EPIC, peak coalescence was mitigated.
Conclusions Factors which promote de-phasing and degrade ion cloud phase coherence during
detection can be substantially reduced by producing a high density beam of electrons
through the center of the ICR cell. The improved ion cloud stability can be observed by
74
the increased length of the time-domain signal. The application of EPIC produces time-
domain signals that are on average, 3 to 5 times longer than non-EPIC results. Though
resolution and mass accuracy are typically a function of time-domain signal length, the
improved time-domain data sets taken with EPIC do not necessarily lead to improved
resolution. However, under some of the experimental conditions we investigated, it is
possible to obtain an increase in both resolution and sensitivity with EPIC. We
demonstrate a factor of 3 improvement in resolution with the application of EPIC.
An additional interesting feature of the EPIC results is the observed effect that the
electron beam has on the cyclotron frequency shift. The application of EPIC seems to
cause the frequencies to shift to a higher value with time. Also, the application of EPIC
can prevent closely spaced peaks from coalescing. The mechanisms underlying the
electron beam effects on ion cloud motion that result in longer observed time-domain
signals are not fully understood at present. However, this observation of increased time-
domain signal is significant and should provide greater insight into ion motion and the
effects caused by perturbations in the electric field within the ICR cell. Finally it is likely
that the application of EPIC, or a derivative of it, can be implemented in the future to
exploit the unique enhancements that it provides.
Acknowledgements
This research was supported by the National Science Foundation, Instrument
Development for Biological Research Program, grant no. DBI-0352451, the Murdock
Charitable Trust, and the National Institutes of Health Biotechnology Training Grant. The
75

authors would also like to thank Gordon Anderson for the data analysis tools (ICR-2LS)
and Harold R. Udseth, Gökhan Baykut and Eugene Nikolaev for helpful discussions.
References
(1) Comisarow, M. B.; Marshall, A. G. Chemical Physics Letters 1974, 25, 282-283. (2) Masselon, C.; Anderson, G. A.; Harkewicz, R.; Bruce, J. E.; Pasa-Tolic, L.;
Smith, R. D. Analytical Chemistry 2000, 72, 1918-1924. (3) He, F.; Emmett, M. R.; Hakansson, K.; Hendrickson, C. L.; Marshall, A. G. J
Proteome Res 2004, 3, 61-67. (4) Bossio, R. E.; Marshall, A. G. Anal Chem 2002, 74, 1674-1679. (5) Kelleher, N. L.; Lin, H. Y.; Valaskovic, G. A.; Aaserud, D. J.; Fridriksson, E. K.;
McLafferty, F. W. Journal of the American Chemical Society 1999, 121, 806-812. (6) Reid, G. E.; McLuckey, S. A. J Mass Spectrom 2002, 37, 663-675. (7) Wigger, M.; Eyler, J. R.; Benner, S. A.; Li, W.; Marshall, A. G. J Am Soc Mass
Spectrom 2002, 13, 1162-1169. (8) Little, D. P.; Speir, J. P.; Senko, M. W.; O'Connor, P. B.; McLafferty, F. W. Anal
Chem 1994, 66, 2809-2815. (9) Lipton, M. S.; Pasa-Tolic, L.; Anderson, G. A.; Anderson, D. J.; Auberry, D. L.;
Battista, J. R.; Daly, M. J.; Fredrickson, J.; Hixson, K. K.; Kostandarithes, H.; Masselon, C.; Markillie, L. M.; Moore, R. J.; Romine, M. F.; Shen, Y.; Stritmatter, E.; Tolic, N.; Udseth, H. R.; Venkateswaran, A.; Wong, K. K.; Zhao, R.; Smith, R. D. Proc Natl Acad Sci U S A 2002, 99, 11049-11054.
(10) Shi, S. D. H.; Hendrickson, C. L.; Marshall, A. G. Proceedings of the National
Academy of Sciences of the United States of America 1998, 95, 11532-11537. (11) Marshall, A. G.; Hendrickson, C. L.; Jackson, G. S. Mass Spectrometry Reviews
1998, 17, 1-35. (12) Marshall, A. G.; Hendrickson, C. L. International Journal of Mass Spectrometry
2002, 215, 59-75.
76

(13) Alan G. Marshall; Verdun, F. R. Fourier Transforms in NMR, optical, and mass spectrometry: a user's handbook; Elsevier Science Publishers: New York, 1990.
(14) Benner, W. H. Analytical Chemistry 1997, 69, 4162-4168. (15) Makarov, A. Analytical Chemistry 2000, 72, 1156-1162. (16) Guan, S.; Marshall, A. G. International Journal of Mass Spectrometry and Ion
Processes 1995, 146/147, 261-296. (17) Guan, S.; Wahl, M. C.; Marshall, A. G. Anal Chem 1993, 65, 3647-3653. (18) Bruce, J. E.; Anderson, G. A.; Hofstadler, S. A.; Winger, B. E.; Smith, R. D.
Rapid Communications in Mass Spectrometry 1993, 7, 700-703. (19) Ostrander, C. M.; Arkin, C. R.; Laude, D. Journal of the American Society for
Mass Spectrometry 2001, 12, 30-37. (20) Guan, S.; Marshall, A. G. Review of Scientific Instruments 1995, 66, 63-66. (21) Bruce, J. E.; Anderson, G. A.; Lin, C.-Y.; Gorshkov, M.; Rockwood, A. L.;
Smith, R. D. Journal of Mass Spectrometry 2000, 35, 85-94. (22) Guan, S.; Li, G.-Z.; Marshall, A. G. International Journal of Mass Spectrometry
and Ion Processes 1997, 167/168, 185-193. (23) Peurrung, A. J.; Kouzes, R. T. Physical Review. E. Statistical Physics, Plasmas,
Fluids, and Related Interdisciplinary Topics 1994, 49, 4362-4368. (24) Pan, Y. P.; Ridge, D. P.; Wronka, J.; Rockwood, A. L. Rapid Communications in
Mass Spectrometry 1987, 1, 121. (25) Pan, Y. P.; Ridge, D. P.; Rockwood, A. L. International Journal of Mass
Spectrometry and Ion Processes 1988, 84, 144. (26) Nikolaev, E. N.; Gorshkov, M. V.; Mordehai, A. V.; Talrose, V. L. Rapid
Communications in Mass Spectrometry 1990, 4, 144. (27) Grosshans, P. B.; Marshall, A. G. International Journal of Mass Spectrometry
and Ion Processes 1991, 107, 49-81. (28) Gordon, E. F.; Muddiman, D. C. Journal of Mass Spectrometry 2001, 36, 195-
203. (29) Stults, J. T. Analytical Chemistry 1997, 69, 1815-1819.
77

(30) DiFilippo, F.; Natarajan, V.; Bradley, M.; Palmer, F.; Pritchard, D. E. Physica Scripta, T 1995, T59, 144-154.
(31) Bruce, J. E.; Cheng, X.; Bakhtiar, R.; Wu, Q.; Hofstadler, S. A.; Anderson, G. A.;
Smith, R. D. Journal of the American Chemical Society 1994, 116, 7839-7847. (32) Smith, R. D.; Cheng, X.; Bruce, J. E.; Hofstadler, S. A.; Anderson, G. A. Nature
(London, United Kingdom) 1994, 369, 137-139. (33) Cheng, X.; Camp, D. G., 2nd; Wu, Q.; Bakhtiar, R.; Springer, D. L.; Morris, B. J.;
Bruce, J. E.; Anderson, G. A.; Edmonds, C. G.; Smith, R. D. Nucleic Acids Res 1996, 24, 2183-2189.
(34) Cheng, X.; Bakhtiar, R.; Van Orden, S.; Smith, R. D. Anal Chem 1994, 66, 2084-
2087. (35) Chen, R.; Cheng, X.; Mitchell, D. W.; Hofstadler, S. A.; Wu, Q.; Rockwood, A.
L.; Sherman, M. G.; Smith, R. D. Analytical Chemistry 1995, 67, 1159-1163. (36) Bruce, J. E.; Anderson, G. A.; Udseth, H. R.; Smith, R. D. Analytical Chemistry
1998, 70, 519-525. (37) Nikolaev, E. N.; Popov, A. M.; Heeren, R. M. A.; Sharova, M. S.; Pozdneev, A.
V.; Chingin, K. S.; Taban, I. M., 53rd ASMS Conference, San Antonio, TX, June 5-9 2005.
(38) Mitchell, D. W.; Smith, R. D. Physical Review. E. Statistical Physics, Plasmas,
Fluids, and Related Interdisciplinary Topics 1995, 52, 4366-4386. (39) Zubarev, R. A.; Kelleher, N. L.; McLafferty, F. W. Journal of the American
Chemical Society 1998, 120, 3265-3266. (40) Hendrickson, C. L.; Hadjarab, F.; Laude, D. A., Jr. International Journal of Mass
Spectrometry and Ion Processes 1995, 141, 161-170. (41) Beiersdorfer, P.; Becker, S.; Beck, B.; Elliott, S.; Widmann, K.; Schweikhard, L.
Nuclear Instruments & Methods in Physics Research, Section B: Beam Interactions with Materials and Atoms 1995, 98, 558-561.
(42) Caravatti, P.; Allemann, M. Organic Mass Spectrometry 1991, 26, 514-518. (43) Tsybin, Y. O.; Witt, M.; Baykut, G.; Kjeldsen, F.; Hakansson, P. Rapid
Communications in Mass Spectrometry 2003, 17, 1759-1768. (44) Zubarev, R. A. Mass Spectrometry Reviews 2003, 22, 57-77.
78

(45) Sze, S. K.; Ge, Y.; Oh, H.; McLafferty, F. W. Proc Natl Acad Sci U S A 2002, 99, 1774-1779.
(46) Anderson, G. A., Bruce J.E., Smith R.D., 2.18 ed.: Richland, WA, 1996. (47) Guan, S.; Wahl, M. C.; Wood, T. D.; Marshall, A. G. Anal Chem 1993, 65, 1753-
1757. (48) Solouki, T.; Gillig, K. J.; Russell, D. H. Analytical Chemistry 1994, 66, 1583-
1587. (49) Kingdon, K. H. Physical Review 1923, 21, 408-418. (50) Gillig, K. J.; Bluhm, B. K.; Russell, D. H. International Journal of Mass
Spectrometry and Ion Processes 1996, 157/158, 129-147.
79

Figure 1
m
u
d
-9.3e+3
-3.1e+3
3.1e+3
9.3e+3
Am
plitu
de
-3.4e+4
Figure 1. Our initial observation of EPIC is shown with successive time-domain signals
of bradykinin (M+2H)2+. a) with no modification to the detection scheme. b) EPIC time-
domain signal. The EPIC results extend well past the collected 4 seconds. The resultant
mass spectra obtained from the time-domain signal are also shown.
-1.2e+4
1.e+4
3.2e+4
0 1.0 2.0 3.0 4.0Time (s)
0
5.8e+6
1.2e+7
1.7e+7
530.56 530.89 531.23 531.56 531.89m/z
530.65 530.75 530.85 530.96 531.06
R~90,000
R ~ 250,000
m/z
Abs
olut
e M
agni
tude
Am
plitu
de
80

Figure 2
-11033
-2772
5487
13748
0. 18.24 36.49 54.73 72.98Time (s)
Am
plitu
de
-14858
-4954
4949
14854
0. 18.24 36.49 54.73 72.98Time (s)
Am
plitu
de
a)
b)
Figure 2. Successive time-domain signals for the ubiquitin (M+7H)7+ a) with the no
modification to the detection scheme there is signal duration for approximately 25
seconds. b) With the EPIC experiment there is signal duration for over 70 seconds.
There is approximately a factor of 3 improvement with the application of EPIC
81

Figure 3
200910
200920
200930
200940
Freq
uenc
y (H
z)
200541
200547
200553
200559
0 5 10 15 20 25 30 Time (s)
Freq
uenc
y (H
z)
200724
200732
200740
200748
Freq
uenc
y (H
z)
a)
b)
c) 13C2
Monoisotopic
13C
Figure 3. Bradykinin (M+2H)2+ was used to show that the frequency shift in time changes
direction with the application of EPIC. The non-modified detection technique (dotted
line) slopes to a lower frequency with time, while the EPIC produced signal (solid line)
shifts to a higher frequency with time. a) the frequency change for the monoisotopic m/z
species. b) the frequency shift for the 13C1 isotope peak. c) the frequency shift for the
13C2 isotope peak. The higher magnitude peaks are detected for a longer period of time,
when comparing the monoisotopic peak in part a to the 13C2 isotope peak in part c.
82

Figure 4
13C2
159865
159875
159885
159895
0 1 2 3 4 5 6 7 8 9 10Time (s)
Freq
uenc
y (H
z)
13C
159985
159995
160005
160015
Freq
uenc
y (H
z)
Monoisotopic Peak
160105
160115
160125
160135 Fr
eque
ncy
(Hz)
Figure 4. Plots the shift in frequency for the different isotope peaks for substance P
(M+2H)2+. The solid line is the result of the EPIC experiment. The dotted line is the
non-EPIC result. The EPIC results produce less drift in frequency and yield a higher
resolution mass spectrum.
83

Figure 5
m/zm/z 674.67 675.62 676.56 0
1.1e+7
2.1e+7
3.1e+7
674.67 675.62 676.56
0
6.4e+6
1.3e+7
1.9e+7
R ≈ 250,000
0
6.4e+6
1.3e+7
1.9e+7
674.84 674.87 674.90 0
1.1e+7
2.1e+7
3.1e+7
674.84 674.87 674.90
R ≈ 850,000
Abs
olut
e M
agni
tude
Figure 5. Mass spectrum of the substance P (M+2H)2+ without EPIC (right) and with
EPIC (left). The inset spectra illustrate the observed monoisotopic peak and demonstrate
a factor of 3 improvement in resolving power with the application of EPIC.
84
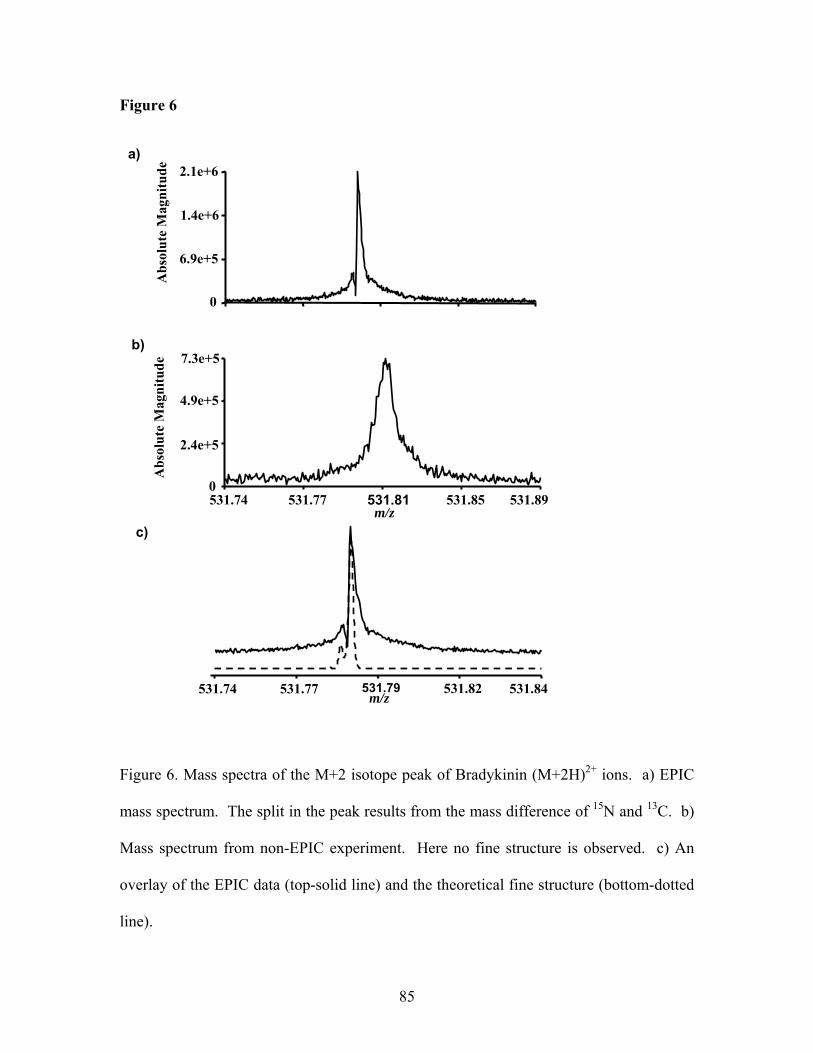
Figure 6
Abs
olut
e M
agni
tude
a)
0
2.4e+5
4.9e+5
7.3e+5
531.74 531.77 531.81 531.85 531.89m/z
Abs
olut
e M
agni
tude
0
6.9e+5
1.4e+6
2.1e+6
531.74 531.77 531.79 531.82 531.84m/z
b)
c)
Figure 6. Mass spectra of the M+2 isotope peak of Bradykinin (M+2H)2+ ions. a) EPIC
mass spectrum. The split in the peak results from the mass difference of 15N and 13C. b)
Mass spectrum from non-EPIC experiment. Here no fine structure is observed. c) An
overlay of the EPIC data (top-solid line) and the theoretical fine structure (bottom-dotted
line).
85

Figure 7
-1791
-469
853
2175 A
mpl
itude
-2076
-560
954
2469
0 13.4 26.8 40.3 53.8Time (s)
Am
plitu
de
b)
a)
Figure 7. Successive time-domain signals for ubiquitin (M+6H)6+. a) Time-domain
signal for the non-modified detection technique. b) EPIC-produced time-domain signal.
The length of the detected ion signal increased by an approximate factor of 5 with the
application of EPIC.
86
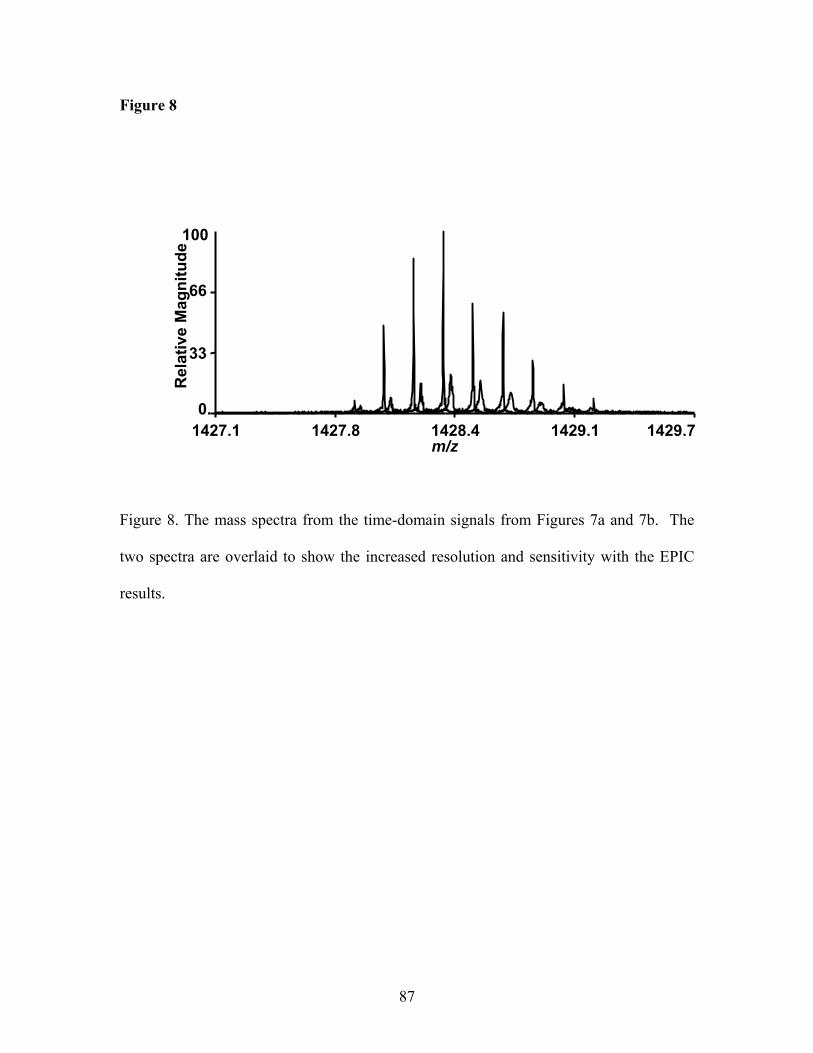
Figure 8
0.
33
66
100
1427.1 1427.8 1428.4 1429.1 1429.7m/z
Rel
ativ
e M
agni
tude
Figure 8. The mass spectra from the time-domain signals from Figures 7a and 7b. The
two spectra are overlaid to show the increased resolution and sensitivity with the EPIC
results.
87

Figure 9
Time (s)
Am
plitu
de
-1.4e+4
-4.8e+3
4.2e+3
1.3e+4
0 4.09 8.18 12.27 16.36 Time (s)
-1.3e+4
-4.4e+3
4.6e+3
1.4e+4
0 4.09 8.18 12.27 16.36Time (s)
-1.4e+3
-4.7e+2
4.1e+2
1.3e+3
0 4.09 8.18 12.27 16.36
530.88
Rel
ativ
e M
agni
tude
0
9.e+5
1.8e+6
2.7e+6
530.67 530.97 531.28 531.59 531.9 m/z
0
4.2e+6
8.3e+6
1.2e+7
530.67 530.97 531.28 531.59 531.9 m/z
530.84
530.84
0
4.2e+
8.4e+6
1.3e+7
530.6 530.97 531.28 531.59 531.9m/z
530.88
c)
b)
a)
Figure 9. Peak coalescence a) The full time-domain signal and the resultant mass
spectrum of bradykinin (M+2H)2+. The small peak to the right of the monoisotopic peak
is the coalesced signal (marked by an arrow). b) The first part of the time-domain signal
is conserved and all other data points are set to zero. The Fourier transform of the
truncated time-domain signal yields a mass spectrum with an isotopic distribution of
bradykinin 2+ as would be expected. c) The second part of the time-domain signal is
conserved, while all data points in the first part are set to zero. The resultant mass
spectrum yields a single peak which is caused from the coalescence of the different
isotope peaks of bradykinin 2+.
88

Figure 10
m/z
16.357
529.87 530.78 531.68 532.58 533.48
-1.3e+4
-4.3e+3
4.1e+3
1.2e+4
0. 4.089 8.179 12.268 Time (s)
0
33
66
100
Am
plitu
de
Rel
ativ
e M
agni
tude
Figure 10. The time-domain signal and the resultant mass spectrum after application of
EPIC under the same conditions that yielded peak coalescence shown in figure 9. With
EPIC, peak coalescence is eliminated.
89

CHAPTER 4 Reduction of Ion Magnetron Motion and Space Charge Using Radial Electric Field Modulation Abstract
Ions of the same m/z must remain in phase with each other during the detection time
period used for FTICR-MS signal acquisition for optimal performance. The loss of
coherence of the ion cloud during detection leads to faster rates of signal decay which
results in a decrease in the achievable resolution and mass measurement accuracy with
FTICR-MS technology. As the ions spin on their excited cyclotron orbit, many factors
contribute to de-phasing of ion motion; such as the presence of radial electric fields and
the Coulombic interaction of ion clouds of different mass-to-charge ratios. With the
application of Electron Promoted Ion Coherence or EPIC, signal duration can be
increased. Since FTICR-MS achieves high performance through measurement of
frequency, the ability to observe ions over a longer time period increases the performance
of FTICR-MS. Radial electric fields are an unavoidable consequence of applied trapping
potentials to confine ion motion parallel to the magnetic field in the ICR cell; however,
the presence of radial electric fields also induces magnetron motion. With EPIC it is
possible to control the shape of the radial electric fields that the ions experience by
changing the number of electrons that are sent through the center of the ICR cell.
Furthermore, the electric field shape produced with EPIC can be altered to decrease space
90

charge contributions by increasing the length of the ion oscillation path along the axis of
the ICR cell and decrease radial electric fields effects, which alter detected ion
frequencies. Here we report theoretical and experimental results to evaluate and describe
the impact of EPIC on the performance of FTICR-MS.
Introduction
Fourier transform ion cyclotron resonance mass spectrometry FTICR-MS [1] has
become an important analytical tool, especially in the analysis of complex mixtures. The
capability to provide high resolution, mass measurement accuracy, and sensitivity is
important in the area of proteomics [2]. The basis for which FTICR mass spectrometers
can offer such high performance is their ability to detect ions for an extended period of
time. The mass-to-charge ratio (m/z) of an ion is determined by measuring the frequency
of its excited cyclotron motion in the ICR cell. The longer that the frequency is detected
the more accurately the frequency can be determined and the higher the performance of
the instrument. The ions are trapped in the detection cell by the Lorentz force (x-y
dimension) and by an electric potential applied to trapping electrodes (z dimension). The
application of an electrostatic field retains ions in the homogenous region of the magnetic
field. However, this electrostatic field also induces magnetron motion and lead to
deviations in the observed cyclotron frequency. Magnetron motion changes the observed
ion frequency, limits the critical mass that can be stored [3], and causes ion loss and
reduced sensitivity. Ideally, the application of trapping potentials will create a three
91

dimensional axial quadrupolar electrostatic potential, which will result in ion frequency
being independent of ion position inside the ICR cell [4].
The stability of an excited ion cloud is critical for detection of image current for
an extended period of time [5]. There are many factors which contribute to ion cloud
coherence such ion cloud density [6] and applied trapping potentials [7]. Control of the
total ion population trapped in the ICR cell is very critical for the performance of the
instrument [8, 9]. A trapped population with too few ions leads to a reduction in the
signal-to-noise ratio and less stable ion clouds. However, if too many ions are trapped
the Coulombic interaction of ion clouds with different mass-to-charge ratios disrupts ion
cloud stability, causes ion cloud coalescence for closely spaced m/z species [10], and
induce space charge effects. An increase in space charge conditions effectively reduces
the observed cyclotron frequency. Due to the presence of quadrupolar trapping fields
parallel to the magnetic field, the space charge in the ICR cell is not constant throughout
an experiment and results in observed frequency shifts with time [11, 12]. Ions which are
excited to a large cyclotron orbit can travel a longer distance in the z-dimension than if
they were located close to the central axis of the cell. As ions traverse their excited
cyclotron orbit, they encounter collisions with residual gas molecules, and damp back
toward the center of the ICR cell (collisional damping). This causes the ion cyclotron
radius to decrease and the ions are funneled back toward the central axis of the ICR cell,
where the ions also have a shorter path length in the z-dimension. Furthermore, the radial
spatial distribution of the ions is decreased with decreased cyclotron radius. The increase
in space charge causes the observed cyclotron frequency to shift to lower frequency with
92

time as the ions damp back toward the center of the ICR cell, which causes the m/z value
of the ions to increase to a larger value with time [12].
There has been considerable attention devoted to ICR cell design to improve the
performance of FTICR mass spectrometers [13-16]. There are three different types of
electrical field shapes that are critical for optimal ICR analysis, including uniform RF
electric field for excitation, azimuthal quadrupolar RF electric field for ion axialization,
and three-dimensional axial quadrupolar electric field for ion axial confinement [17].
There is usually a compromise between these different electrical field shapes for most
ICR cell designs. Solouki et al. [18] suspended a copper wire through the center of the
ICR to form electric field potentials that simulate a Kingdon trap [19] which was later
described by Gillig et al. [20]. Electrons sent through the center of the ICR cell have
previously been used for electron impact ionization, to trap ions in the cell [21] and to
perform electron capture dissociation (ECD) [22, 23]. The application of an electron
beam through the center of the ICR cell during detection has brought interesting results.
Easterling and Amster [24] reported that with the presence of a low energy electron beam
during detection the transient signals lasted much longer. However, they also reported a
current dependent mass shift which in extreme cases approached 10-12 m/z units. An
earlier paper from our group demonstrated that proper tuning of a low energy electron
beam, which we call Electron Promoted Ion Coherence or EPIC [25], not only enhanced
the time of signal duration but could eliminate frequency shifts and allow acquisition of
higher quality spectra. Nikolaev et al. has produced the most accurate computer
simulations of ICR motion to date [26], has modeled the effect of an electron beam
93

through the center of the ICR cell, and has shown an increase in ICR signal duration is
possible with this configuration [27].
This paper aims to further describe the unique characteristics of EPIC and the
basis for an improvement in instrument performance. Here we report that EPIC is a
method capable of reducing both conditions. We present a comparison between
theoretical predictions and experimental results of how EPIC affects the electric field
shape in the ICR cell. We investigate how the numbers of electrons affect the trapping
electric field shape. We also determine how perturbations in the trapping fields affect the
mass measurement accuracy.
Experimental
Electrospray was used as the ionization method. Electrospray solutions consisted
of 49/49/2 by volume of water/methanol/acetic acid. All samples (substance p,
bradykinin, melittin, and BSA digest) of 10uM were infused by direct injection with a
syringe pump at a rate of 0.4 uL/min. All standard proteins and peptides were purchased
from Sigma (St. Louis, MO) and used without further purification. Sequencing grade
modified trypsin was purchased from Promega (Madison, WI). A Bruker Daltonics 7T
Apex-Q FTICR mass spectrometer (Billerica, MA) was used to acquire the mass spectral
data using Xmass version 7.0.6 as the data acquisition software program. Ion
accumulation took place in the hexapole ion guide that is external to the magnetic field
prior to injection into the ICR cell. Typically the ion accumulation time was set between
0.5–1.0 s, but was held constant for all EPIC and non-EPIC comparison spectra. Ions
94

were trapped in an infinity cell [28] using the sidekick technique [29]. The conventional
detection technique was modified to perform EPIC experiments. After the ions had been
excited to a large cyclotron orbit using a broadband frequency sweep excitation
waveform, the electron beam was initiated allowing electrons to traverse the cell. The
electron beam was produced with a hollow heated cathode, 3.5 mm I.D, 7.6 mm O.D.
The outer diameter of the electron beam entering the ICR cell was determined by a lens
which has an I.D. of 6 mm placed between the heated cathode and the back trap plate.
The cathode was heated with approximately 1.50 A, the lens was held at ground, and a
voltage bias of 0.0 to -1.5 V was placed on the heated cathode to produce an electron
beam through the central axis of the ICR cell. At all other times when the cathode was
heated there was an applied voltage bias of +10 V. The numbers of electrons that are
emitted is determined by the heating current and the applied bias potential. The number
of electrons entering the ICR cell is controlled by changing the bias potential since a
change in the heating current takes a much longer time to stabilize.
ICR signal was analyzed with ICR-2LS [30]. The time-dependence of the
detected frequency was obtained with the sweep [11] module within ICR-2LS, which
Fourier transforms consecutive segments of the transient signals. Each segment of the
transient signal was Welch apodized, zero-filled 3 times, and Fourier transformed to
obtain a frequency-domain spectrum and allow determination of ion frequency at various
points along the transient signal. The number of data points in each segment of the
recorded time-domain signal was dependent upon the total data set size; typically
parameters for a 128k data set consisted of a segment size of 16,384 points with an
advancement of 8,192 points.
95

The resolution and mass accuracy for the broadband experiments were limited by
the size of the data sets that could be recorded with the conventional Bruker hardware
and software. For extended broadband signal acquisition experiments, the broadband
spectra of BSA digest were digitized with a PCI-6111 National Instruments board
(Austin, TX) and recorded on PC with 512 MB of RAM. The data sets collected were 4
MB at a sample rate of 600,000 Hz. BSA digest spectra were collected after a pulsed gas
event to cool the ions followed by a 7 second delay to allow time for the cooling gas to be
pumped away.
Simion 7.0 software (SIMION 7.0 3D, version 7.0, D.A. Dahl, Idaho National
Engineering Laboratory, Idaho Falls, ID) was used to produce the equipotential field
lines, to provide an approximation of the shape of the electric field and the effects of an
electron beam through the center of the ICR cell. Electron current was measured on the
lens with a current amplifier (Keithley, model 428, Cleveland, OH), with the cathode
heated with 1.5 A and various applied voltages.
Results and Discussion
The unperturbed cyclotron frequency is dependent only on the m/z of the ion and
the strength of the magnetic field. However, the application of trapping potentials to trap
ions in the z-axis induces deviations in the observed cyclotron frequency. The magnitude
of these deviations depends on the magnitude of the applied trapping potential. The
application of an electron beam through the center of the ICR cell during detection has
been shown to increase the resolution and the signal-to-noise ratio of FTICR-MS [25].
96

However, if experimental conditions such as total ion abundance, trap plate potentials,
and number of electrons are not carefully controlled, an increase in performance is not
observed and can result in large observed frequency shifts. The presence of an electron
beam through the center of the ICR cell results in a negative charge along the central
axis. This negative charge dramatically alters the shape of the electric field used to
confine the ions to a finite space, thus altering the space charge conditions within the cell.
Therefore, changes in the measured frequency should be expected. The electric field
lines produced with a closed cylindrical cell are shown in Figure 1a. The segmented
trapping electrodes in the Infinity cell are used to flatten out the excite potential across
the entire cell. Each trapping electrode has the same applied trapping potential with
varying RF amplitude applied during the excite. Thus, the shape of the electric field lines
produced from the segmented trapping electrodes will be very similar to those generated
with a solid trapping electrode. The exact modeling of an electron beam and the affect it
will have on the shape of the electric field is not easily solved. However, the presence of
electrons will produce a negative potential along the axis of cell. For simplification of
modeling efforts, a solid electrode that was biased at a negative potential was used to
represent the electron beam. Therefore, the electrode represents a first approximation of
the negative potential produced by the electrons and the resulting change in field shape,
which is shown in Figure 1b. The electrons produced in the magnetic field will follow
the magnetic field lines, thus electrons created on the axis of the ICR cell will remain in a
beam on axis through the cell. Any electrons that do scatter in the cell will hit the
positive trapping electrodes, thus the negative charge will be kept localized along the z-
axis of the cell. For the ICR cell with an electron beam through the center, the
97

equipotential contour lines for a given potential do not penetrate as far into the middle of
the cell as the unmodified cell (cell with no electron beam). Therefore, ions with the
same cyclotron radius and z-axis kinetic energy should exhibit a larger range of z-axis
motion. Figure 1c shows how the electric field lines are affected by an increase in the
number of electrons through the center of the ICR cell. As the potential applied to the
central electrode becomes more negative, the electric field lines become closer to the trap
plates and the inflection point (point at which radial electric field changes from inward-
to outward-directed) is located further from the central axis.
With no electron beam, the electric fields in the cylindrical cell should
approximate a three dimensional axial quadrupolar electrostatic potential. This is
important since in this case, cyclotron frequency is independent of cyclotron radius.
However, Figure 2a illustrates the measured cyclotron frequency at different applied
excitation voltages and shows that there is a very strong dependence of observed
frequency with cyclotron radius. At higher excitation voltage and larger cyclotron radius,
the observed change in frequency can be attributed to alterations in space charge effects
at different excited cyclotron radii. Cyclotron radius can affect space charge conditions
in two different ways. First, since the trapping potentials approximate a quadrupolar
electric field, the z-axis oscillation path length decreases as the cyclotron radius gets
smaller. Therefore, at smaller cyclotron radii the ions are confined closer axially.
Second, at large cyclotron radii, ions with different mass-to-charge ratios will have a
greater spatial distribution in the plane perpendicular to the magnetic field. These two
effects are detrimental to high performance measurements which require long acquisition
time periods, since the measured frequency will change with time. As the ions damp
98

back toward the center of the ICR cell (i.e., exhibit smaller cyclotron radii) the ions
become confined to a smaller space increasing the ion density, and thus space charge
conditions. This time-based frequency shift behavior may not be observed in all ICR
applications, because either the acquisition time period is not long enough or the ions do
not stay in a cohesive cloud for a sufficient period of time.
The simulated shape of the electric field lines within the ICR cell with EPIC will
no longer form a three dimensional quadrupolar potential. Therefore, the magnetron
frequency of an ion is no longer independent of its radial position in the ICR cell. The
observed cyclotron frequency will be dependent upon the radial force exerted by the
electric field and thus, the cyclotron radius that the ions exhibit as well as any changes in
space charge conditions. This is demonstrated in Figure 2a which illustrates the
observed cyclotron frequency of melittin (M+4H)+4 at different RF excitation voltages
with different cathode bias potentials. The observed cyclotron frequencies for different
excitation voltages converge at larger cyclotron radii. This indicates that at larger
cyclotron radii, the effect from the electron beam is diminished under the beam
conditions used for these experiments. However as the initial cyclotron radius decreases,
the ions become closer to the electron beam and the observed differences in cyclotron
frequencies increase. This observation can be explained by the electric field shapes in
Figure 1. At greater distances from the central axis, the deviation between the
equipotential contour lines in Figure 1a and b are small and the observed frequencies
should be similar. As the distance from the central axis becomes smaller there is a larger
deviation in contour lines, which should result in larger differences in observed cyclotron
frequencies, and is in agreement with experimentally observed results.
99

Figure 2b illustrates the measured cyclotron frequency for different numbers of
trapped ions in the cell for the same experimental conditions as in Figure 2a with no
electron beam. This is done to extrapolate the cyclotron frequency that would be
observed with no space charge effects. This was determined to be ~151,659 Hz. Any
change in the observed cyclotron frequency would then be attributed to a change in the
magnetron frequency as shown in equation 1 were ωc is the unperturbed cyclotron
frequency, ω+ is the reduced cyclotron frequency, and ω_ is the magnetron frequency.
(1) ω+ = ωc – ω_.
The magnetron frequency is negative in magnitude because the outward direction of the
radial fields opposes the force induced by the magnetic field, resulting in a decrease in
the observed cyclotron frequency. The space charge-induced frequency shift can be
accounted for by introducing an addition term to equation 1. McIver el al. [31]
developed the following equation to account for space charge effect:
(2) BGq
BaaV
mqB
o
iobs ε
ρω −−= 2
2
The first term in the equation describes the unperturbed cyclotron frequency, the second
term describes the magnetron frequency in a perfectly quadrupolar static trapping field.
While the third term represents the space charge component of the observed frequency,
where q is the elementary charge, ρ the ion density, Gi the ion cloud geometry, and εo the
permittivity of free space.
The numbers of electrons that are in the center of the ICR cell are controlled by
the bias applied to the heated cathode. The more negative the bias potential the greater
the electron current and the larger the negative potential through the center of the ICR
cell. Increasing the bias potential will affect the electric field lines similar to what is
100

shown in Figure 1c. In Figure 2a, the plot of the data acquired with a cathode bias
potential of -0.55 and -0.60 V shows there is an increase in frequency at low excitation
voltage, but at higher excitation voltages the frequencies remain constant over a range of
excited cyclotron radii. The change in spatial ion distribution perpendicular to the
magnetic field is dependent only upon the excitation voltage; therefore, ions should have
the same spatial distribution regardless of applied cathode bias. This would lead to an
increase in space charge at smaller cyclotron radii which should result in a reduction in
observed frequency. However, the reduction in the outward-directed radial field
encountered when the electron beam is present in the cell leads to an increase in observed
frequency. The two contributions offset each other and result in a frequency that appears
more constant at various cyclotron radii. At smaller cyclotron radii the observed
frequency increases indicating a larger shift in the magnetron frequency.
The ions excited and detected with the applied cathode bias potential <-0.45
exhibit an increase in frequency for all applied excite potentials, relative to non-EPIC
measurements. This is likely because the ions are not excited beyond the inflection point
in the equipotential contour lines shown in the SIMION calculations shown in Figure 1b
and 1c. As the cathode bias potential increases, there is an increase in observed
cyclotron frequency for a given excite potential. As the number of electrons increase, the
electric field lines are pulled closer to the trap plate which expands the ion pathlength
along the z-axis of the ICR cell and decreases the space charge conditions. Therefore, the
same ion at a given excite potential within the same ion population will have a different
measured cyclotron frequency at different cathode bias potential. As seen in Figure 1c
101

this change will be more dramatic at lower excite potentials which is also observed
experimentally.
In the example shown in Figure 1b the electric field lines become flat at about
half the cell radius, which may not be exact for the applied electron beam. However,
with a negative potential through the center of the cell, the positive electric field lines will
be drawn toward the center of the trapping electrode resulting in an inflection in the
electric field shape. At this inflection point there is no outward-directed radial force to
drive magnetron motion. At smaller radii the ion would be located on the interior of the
inflection point and there would be an inward-directed radial force. The greater the
number of electrons, the greater the negative potential through the center of the cell, and
the further from the central axis the inflection point becomes. In comparing -0.55 and -
0.60 V bias data in Figure 2a, both curves reach a minimum frequency as cyclotron
radius is increased; however, -0.60 V bias curve reaches a minimum frequency at a
larger cyclotron radius, since its expected inflection point is further from the central axis
of the cell, as is shown in Figure 1c. The observed minimum frequency is slightly
greater at -0.60 V than the minimum observed frequency for the -0.55 V bias likely due
to differences in space charge conditions. There will be a greater axial distribution of the
ions at larger bias potentials and greater spatial distribution at larger cyclotron radii. It
should be noted that the observed frequencies at a bias potential of -0.50 V should not
remain constant over a range of excite potentials because the change in spatial
distribution of the ions at different excite amplitudes will alter the space charge
conditions.
102

There are a number of advantages to exciting ions to larger cyclotron radii; there is less
space charge contribution, the ions are closer to the detection plates resulting in increased
signal. Figure 2c shows the time-domain signals acquired with the same excitation
voltage at different cathode bias potentials. Without any applied bias potential the signal
damps quickly and as the cathode bias potential increases the time-domain signal
improves. This results in a 1.6-fold increase in the signal-to-noise ratio following
comparison of spectra acquired with no electron beam to those acquired with a cathode
bias of -0.60 V. For this example, the improvement in signal-to-noise ratio was limited
by the size of the data set acquired, since the signal amplitude is dependent upon the
magnitude of the image current and how long it is detected. However, if the post-
excitation radius of the ions exceeds ~70% of the cell radius, image current interactions
increase and result in a decrease in mass measurement accuracy and detected ion
abundances [32-34]. The post-excitation voltage can be approximated by equation 3:
(3) 02
1
dBratesweep
V dippp
exciterβ−
=
where rexcite is the post-excitation radius (m), Vp-p is the amplitude of the RF voltage, βdip
is the dipolar constant (0.9 for Infinity Cell), the sweep rate was 3.48x10⁸ Hz/s, B0 is the
magnetic field strength ( 7T ), and d is the ICR cell diameter (m). Therefore, RF excite
voltage of 300 V corresponds to ~57% of the cell radius. However, it should be noted
that since the ions are trapped using the sidekick method, the ions are not located directly
on axis of the ICR cell at the beginning of the excite. Therefore, the exact post-excitation
radius is not known, although 50-60% of the cell radius is a reasonable approximation.
103

With the application of EPIC, the radial field can be made flatter at larger radii.
Radial electric fields are plotted in Figure 3 at different ICR cell radii with and without
the electron beam. The radial electric fields for a closed cylindrical ICR cell were
calculated with SIMION 7.0. The radial electric fields induce magnetron motion. The
negative values have an outward-directed value from the central axis of the ICR cell,
while the positive values have an inward directing value. Figure 3 shows that magnetron
motion should not be constant as an ion oscillates along the z-axis. Generally, the larger
the cyclotron radius that an ion exhibits, the larger the deviation in the radial field the ion
will experience as the ions oscillate over the same distance along the z-axis. These
deviations in radial electric field produce deviations in magnetron motion and may lead
to de-phasing of the ion cloud. This is especially true of ion populations with a wide
distribution of z-axis kinetic energies. With the application of the electron beam, it is
possible to flatten out the radial field over a set radius, as is shown in the SIMION
results. Therefore, as the ion oscillates along the z-axis the magnitude of the radial field
remains constant.
As the ions spin on their excited cyclotron orbits they encounter collisions with
residual neutral molecules in the cell. These collisions cause the cyclotron orbit to
decrease with time. Since the frequency of the ion is dependent upon its radial location
in the ICR cell, as the ion damps back toward the center of the ICR cell it should
experience a shift in frequency. This frequency shift is based on continually decreasing
radius with time and should follow the same trend in frequency change as if the ions were
excited to different cyclotron radii as shown in Figure 2a. Figure 4 illustrates the
frequency of bradykinin (M+2H)2+ over time for different excitation voltages with the
104
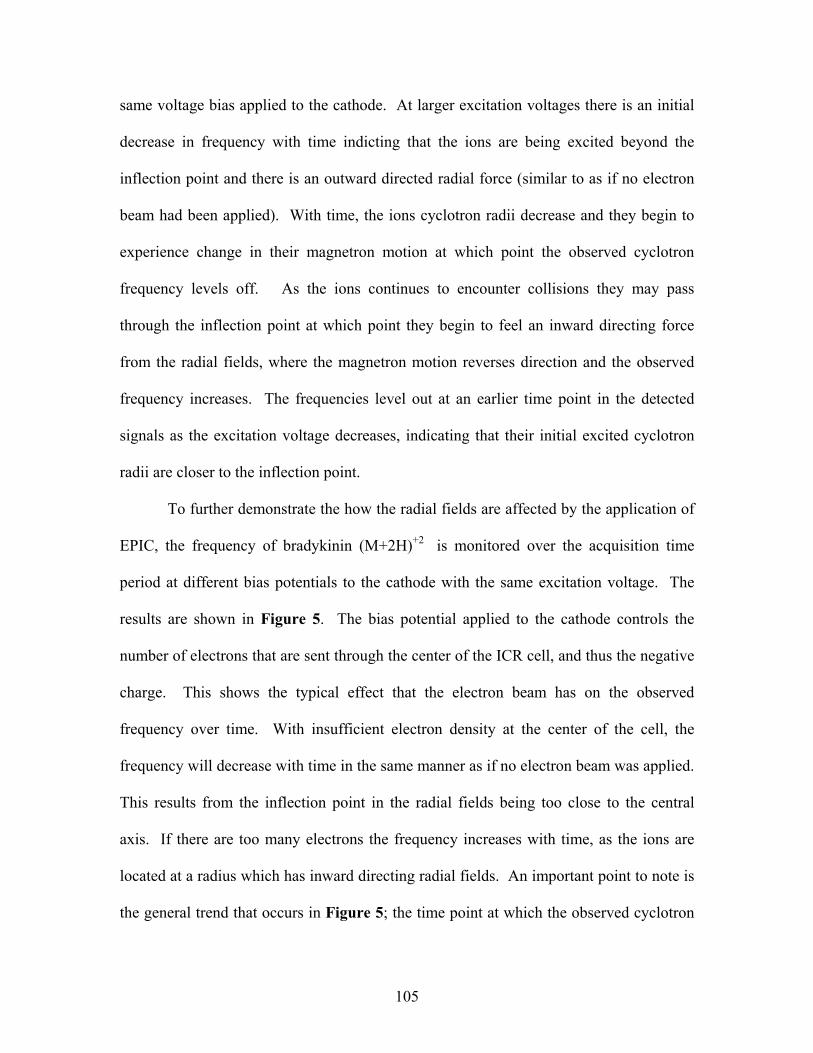
same voltage bias applied to the cathode. At larger excitation voltages there is an initial
decrease in frequency with time indicting that the ions are being excited beyond the
inflection point and there is an outward directed radial force (similar to as if no electron
beam had been applied). With time, the ions cyclotron radii decrease and they begin to
experience change in their magnetron motion at which point the observed cyclotron
frequency levels off. As the ions continues to encounter collisions they may pass
through the inflection point at which point they begin to feel an inward directing force
from the radial fields, where the magnetron motion reverses direction and the observed
frequency increases. The frequencies level out at an earlier time point in the detected
signals as the excitation voltage decreases, indicating that their initial excited cyclotron
radii are closer to the inflection point.
To further demonstrate the how the radial fields are affected by the application of
EPIC, the frequency of bradykinin (M+2H)+2 is monitored over the acquisition time
period at different bias potentials to the cathode with the same excitation voltage. The
results are shown in Figure 5. The bias potential applied to the cathode controls the
number of electrons that are sent through the center of the ICR cell, and thus the negative
charge. This shows the typical effect that the electron beam has on the observed
frequency over time. With insufficient electron density at the center of the cell, the
frequency will decrease with time in the same manner as if no electron beam was applied.
This results from the inflection point in the radial fields being too close to the central
axis. If there are too many electrons the frequency increases with time, as the ions are
located at a radius which has inward directing radial fields. An important point to note is
the general trend that occurs in Figure 5; the time point at which the observed cyclotron
105

frequency reaches a minimum occurs at an earlier time point with increasing voltage bias.
By observing the change in frequency of the ions resultant from the direction and
magnitude of the radial force acting on the ions, we can observe the rate the ions are
damping back toward the center of the cell. Ideally, the electric fields would be modified
to obtain long time-domain signals at larger cyclotron radius where space charge effects
are minimal. This can be done by changing the number of electrons and thus, the
inversion point of the radial fields and by changing the excitation voltage.
High mass measurement accuracy is a prime attribute of ICR mass spectrometers
[35]. The ability to obtain accurate mass measurements is dependent on the ability to
detect stable image current for an extended period of time. If the detected frequency is
changing with time, it will lead to peak broadening and decrease sensitivity, resolution,
and mass measurement accuracy. With the observed frequency shifts that occur with the
application of EPIC, we attempted to determine if the mass measurement accuracy is
affected by alterations to the radial trapping fields. The mass accuracy was tested with
BSA digest peptides which would provide a wide m/z range of ions to help determine if
there was an m/z dependence on observed frequency shift. Since the spectra collected in
broadband were limited by the dataset size available in the conventional Bruker data
acquisition hardware, the time-domain signal was simultaneously collected and digitized
on a separate computer during signal acquisition. This allowed us to collect much larger
datasets to determine if the frequencies of different peptides would change at different
rates, thus limiting the improvement of mass measurement accuracy with EPIC. The
time-domain signals were truncated at time points of 0.25, 0.50, 1.0, 2.0, 3.5, 7.0 seconds
to observe if the mass measurement accuracy would deviate after extended time periods;
106

no further post-processing was done following truncation. Internal calibration was
performed on the same 5 peptide peaks at each time interval and the mass errors for 8
other peptides were calculated. The results of the calibration at each time point are
shown in Figure 6. There is a large increase in mass measurement accuracy within the
first second, after which the mass measurement accuracy remains relatively constant.
The average absolute mass measurement error for the 8 peptides measured was 0.28 ppm
after 7.0 seconds. Therefore, these results show that with proper calibration, EPIC can
provide high mass measurement accuracy for a diverse population of different m/z ions.
De-phasing of the excited ion cloud leads to a loss of ion signal. It is important
that the stability of the ion cloud is not compromised with the application of the electron
beam due to changes in the shape of the electrostatic trapping field and the radial force
acting on the ions. Since the electron beam is turned on after the ions are excited, the
ions will experience changes in their frequencies that may disrupt coherent motion of the
ion cloud. One way of testing the stability of the ion cloud was to turn the electron beam
on-off-on to see if the ion cloud stays together. Figure 7 shows a graph of the
frequencies of substance p (M+2H)2+ at various time points for this experiment. The
electron beam was turned on initially with -0.43 V bias immediately after excitation, after
~5 s the electron beam was turned off by changing the bias to 0.00 V, then at ~8 s the
bias to the cathode was switched to -0.50 V. The frequency with time from the switched
voltage bias experiment is compared with the frequency with time at constant bias
potentials of 0.00, -0.43, and -0.50 V. The frequency in the switched voltage bias
experiment matches well with the constant bias potentials. The bias potential of -0.38 V
likely resulted in an inflection point in the electric field at a cell radius that is smaller than
107

the post-excitation cyclotron radius. This results in a continual decrease of the observed
frequency with time. At -0.50 V bias the frequency is relatively flat with time meaning
that the ion cloud is probably close to the inflection point in the electric field lines. In
comparing the switched voltage bias to the constant -0.38 V bias we observe a slight
deviation in their frequencies. This could be due to the instability of the electron beam,
as we discuss below. However, the important point of Figure 7 is that the stability of the
ion cloud is not compromised by turning on and off the electron beam during a single
detection event. This illustrates that the number of electrons in the ICR cell can be
modulated during the course of a single acquisition without deleterious effects on ion
coherence.
One note worth further consideration is the stability of the electron beam. Since
the outer diameter of the cathode is larger than the hole in the lens, it is possible to
measure a percentage of the electrons emitted from the cathode which hit the lens. There
is a slight drift in the electron current over the course of an experiment (1-10 seconds)
which may cause deviations in the frequency of the ion. Figure 8a shows the electron
current which is collected on the lens during typical EPIC experiments at different bias
potentials to the cathode. Figure 8a demonstrates the electron current is not entirely
stable with time. Figure 8b shows the electron current for a single signal acquisition
period taken after a number of consecutive signal acquisition periods and the electron
current for a single acquisition period after a 5 min. delay between experiments. During
the delay the cathode was held at +10 V. Both current measurements were taken under
identical conditions. The electron current is much higher after some delay period, the
exact mechanism for this phenomenon is not currently known. However, the current
108
fluctuations are mostly likely caused by fluctuations in the heating current. However, if
multiple spectra are taken after a delay period, the current slowly decreases with each
spectrum. The current typically measured on the lens at 1.5 A of heating current and -
0.50 V bias on the cathode is ~3 uA. The electron current drift may limit the ability of
high performance measurements since slight changes in the frequency will result in
broadening of the peak and less precise determination of the exact cyclotron frequency.
The variation in electron current will also make it difficult to signal average a number of
high resolution spectra. It would be easier to produce a more accurate and defined
negative potential along the central axis of the ICR cell with a solid electrode. The flow
of electrons through the cell and unintended changes in electron flow will produce
inhomogeneities in the radial electric field. However, the main advantage of the use of
the electron beam is that charge is only present in the ICR cell during the detection event.
The frequency of an ion is determined by its radial location in the ICR cell as a
result of the electron beam. This suggests that modulation of the electron beam could be
used to eliminate frequency drift by applying a feedback loop through the bias potential
to the cathode. All ions would be excited to the flat part of the electric field at larger
cyclotron radii to minimize space charge effects, and the potential to the cathode could be
modulated to match the flat part of the electric field with the ions radial position as their
cyclotron radius damps back toward the center of the ICR cell.
109

Conclusions
The electric field shape can be modulated with the number of electrons present in
the center of the ICR cell. Careful control of the number of electrons is needed to
increase instrument performance. The application of EPIC forms an inversion point in
the equipotential contours which can be determined by monitoring the frequency as a
function of excited cyclotron radius. The best performance with EPIC comes when the
ions are excited to a cyclotron radius close the inflection point in the radial fields. The
cyclotron frequency of an ion can change with time, based on the shape of the electric
field and the number of ions present within the ICR cell. The shape of the electric field
potentials can be modified to reduce the time based frequency shift, and thus obtain high
resolution spectra. The number of electrons being present in the ICR cell is dependent
upon the heating current and the applied voltage bias; however, the number of electrons
may not be constant from spectrum to spectrum and will limit the performance of this
technique if not monitored.
Acknowledgements The authors acknowledge helpful discussions with Drs. Jean Futrell and Göhkan Baykut.
This material is based upon work supported by the National Science Foundation under
Grant No. 0352451; Murdock Charitable Trust; Office of Science (BER), U. S.
Department of Energy, Grant No. DE-FG02-04ER63924, and the National Institutes of
Health Biotechnology Training Grant.
110

References
1. Comisarow, M. B., Marshall, A. G., Fourier transform ion cyclotron resonance spectroscopy, Chemical Physics Letters. 1974, 25, 282-283. 2. He, F., Emmett, M. R., Hakansson, K., Hendrickson, C. L., Marshall, A. G.,
Theoretical and experimental prospects for protein identification based solely on accurate mass measurement, J Proteome Res. 2004, 3, 61-67.
3. May, M. A., Grosshans, P. B., Marshall, A. G., Theoretical mass and energy
upper limits for thermal ions in Fourier transform ion cyclotron resonance mass spectrometry, International Journal of Mass Spectrometry and Ion Processes. 1992, 120, 193-205.
4. Jackson, G. S., Canterbury, J. D., Guan, S., Marshall, A. G., Linearity and
quadrupolarity of tetragonal and cylindrical Penning traps of arbitrary length-to-width ratio, Journal of the American Society for Mass Spectrometry. 1997, 8, 283-293.
5. Shi, S. D. H., Hendrickson, C. L., Marshall, A. G., Counting individual sulfur
atoms in a protein by ultrahigh-resolution Fourier transform ion cyclotron resonance mass spectrometry: experimental resolution of isotopic fine structure in proteins, Proceedings of the National Academy of Sciences of the United States of America. 1998, 95, 11532-11537.
6. Peurrung, A. J., Kouzes, R. T., Long-term coherence of the cyclotron mode in a
trapped ion cloud, Physical Review. E. Statistical Physics, Plasmas, Fluids, and Related Interdisciplinary Topics. 1994, 49, 4362-4368.
7. Holliman, C. L., Rempel, D. L., Gross, M. L., Detection of high mass-to-charge
ions by Fourier transform mass spectrometry, Mass Spectrometry Reviews. 1994, 13, 105-132.
8. Easterling, M. L., Mize, T. H., Amster, I. J., Routine part-per-million mass
accuracy for high-mass ions: space-charge effects in MALDI FT-ICR, Analytical Chemistry. 1999, 71, 624-632.
9. Ledford, E. B., Jr., Rempel, D. L., Gross, M. L., Space charge effects in Fourier
transform mass spectrometry. Mass calibration, Anal Chem. 1984, 56, 2744-2748. 10. Mitchell, D. W., Smith, R. D., Cyclotron motion of two Coulombically
interacting ion clouds with implications to Fourier-transform ion cyclotron resonance mass spectrometry, Physical Review. E. Statistical Physics, Plasmas, Fluids, and Related Interdisciplinary Topics. 1995, 52, 4366-4386.
111

11. Bruce, J. E., Anderson, G. A., Hofstadler, S. A., Winger, B. E., Smith, R. D.,
Time-base modulation for the correction of cyclotron frequency shifts observed in long-lived transients from Fourier-transform ion-cyclotron-resonance mass spectrometry of electrosprayed biopolymers, Rapid Communications in Mass Spectrometry. 1993, 7, 700-703.
12. Guan, S., Wahl, M. C., Marshall, A. G., Elimination of frequency drift from
Fourier transform ion cyclotron resonance mass spectra by digital quadrature heterodyning: ultrahigh mass resolving power for laser-desorbed molecules, Anal Chem. 1993, 65, 3647-3653.
13. Jackson, G. S., White, F. M., Guan, S., Marshall, A. G., Matrix-shimmed ion
cyclotron resonance ion trap simultaneously optimized for excitation, detection, quadrupolar axialization, and trapping, Journal of the American Society for Mass Spectrometry. 1999, 10, 759-769.
14. Bruce, J. E., Anderson, G. A., Lin, C.-Y., Gorshkov, M., Rockwood, A. L.,
Smith, R. D., A novel high-performance Fourier transform ion cyclotron resonance cell for improved biopolymer characterization, Journal of Mass Spectrometry. 2000, 35, 85-94.
15. Ostrander, C. M., Arkin, C. R., Laude, D., Central ring electrode for trapping and
excitation/detection in Fourier transform ion cyclotron resonance mass spectrometry, Journal of the American Society for Mass Spectrometry. 2001, 12, 30-37.
16. Guan, S., Marshall, A. G., Ion traps for Fourier transform ion cyclotron
resonance mass spectrometry: principles and design of geometric and electric configurations, International Journal of Mass Spectrometry and Ion Processes. 1995, 146/147, 261-296.
17. Vartanian, V. H., Anderson, J. S., Laude, D. A., Advances in trapped ion cells for
Fourier transform ion cyclotron resonance mass spectrometry, Mass Spectrometry Reviews. 1995, 14, 1-19.
18. Solouki, T., Gillig, K. J., Russell, D. H., Detection of High-Mass Biomolecules in
Fourier Transform Ion Cyclotron Resonance Mass Spectrometry: Theoretical and Experimental Investigations, Analytical Chemistry. 1994, 66, 1583-1587.
19. Kingdon, K. H., A method for neutralizing the electron space charge by positive
ionization at very low pressures, Physical Review. 1923, 21, 408-418. 20. Gillig, K. J., Bluhm, B. K., Russell, D. H., Ion motion in a Fourier transform ion
cyclotron resonance wire ion guide cell, International Journal of Mass Spectrometry and Ion Processes. 1996, 157/158, 129-147.
112

21. Hendrickson, C. L., Hadjarab, F., Laude, D. A., Jr., Electron beam potential
depression as an ion trap in Fourier transform ion cyclotron resonance mass spectrometry, International Journal of Mass Spectrometry and Ion Processes. 1995, 141, 161-170.
22. Kruger, N. A., Zubarev, R. A., Horn, D. M., McLafferty, F. W., Electron capture
dissociation of multiply charged peptide cations, International Journal of Mass Spectrometry. 1999, 185/186/187, 787-793.
23. McLafferty, F. W., Horn, D. M., Breuker, K., Ge, Y., Lewis, M. A., Cerda, B.,
Zubarev, R. A., Carpenter, B. K., Electron capture dissociation of gaseous multiply charged ions by Fourier-transform ion cyclotron resonance, Journal of the American Society for Mass Spectrometry. 2001, 12, 245-249.
24. Easterling, M. L., Amster, I. Jonathan, 43rd ASMS Conference on Mass
Spectrometry and Allied Topics, Atlanta, GA, 1995. 25. Kaiser, N. K., Bruce, J. E., Observation of Increased Ion Cyclotron Resonance
Signal Duration through Electric Field Perturbations, Analytical Chemistry. 2005, 77, 5973-5981.
26. Nikolaev, E. N., Popov, A. M., Heeren, R. M. A., Sharova, M. S., Pozdneev, A.
V., Chingin, K. S., Taban, I. M., 53rd ASMS Conference on Mass Spectrometry and Allied topics, San Antonio, TX, 2005.
27. Nikolaev, E. N., 54th ASMS Conference on Mass Spectrometry and Allied
Topics, Seattle, WA, 2006. 28. Caravatti, P., Allemann, M., The infinity cell: a new trapped-ion cell with
radiofrequency covered trapping electrodes for Fourier transform ion cyclotron resonance mass spectrometry, Organic Mass Spectrometry. 1991, 26, 514-518.
29. Caravatti, P., Method and Apparatus for The Accumulation of Ions in a Trap of
an Ion Cyclotron Resonance Spectrometer, by Transferring the Kinetic Energy of the Motion Parallel to the Magnetic Field into Directions Perpendicular to the Magnetic Field., US Patent. 4,924,089. 1990.
30. Anderson, G. A., Bruce J.E., Smith R.D., ICR-2LS, Richland, WA, 1996. 31. Francl, T. J., Sherman, M. G., Hunter, R. L., Locke, M. J., Bowers, W. D.,
McIver, R. T., Jr., Experimental determination of the effects of space charge on ion cyclotron resonance frequencies, International Journal of Mass Spectrometry and Ion Processes. 1983, 54, 189-199.
113

32. Gorshkov, M. V., Marshall, A. G., Analysis and elimination of systematic errors originating from Coulomb mutual interaction and image charge in Fourier transform ion cyclotron resonance precise mass difference measurements, Journal of the American Society for Mass Spectrometry. 1993, 4, 855-868.
33. Hawkridge, A. M., Nepomuceno, A. I., Lovik, S. L., Mason, C. J., Muddiman, D.
C., Effect of post-excitation radius on ion abundance, mass measurement accuracy, and isotopic distributions in Fourier transform ion cyclotron resonance mass spectrometry, Rapid Communications in Mass Spectrometry. 2005, 19, 915-918.
34. Xiang, X., Grosshans, P. B., Marshall, A. G., Image charge-induced ion
cyclotron orbital frequency shift for orthorhombic and cylindrical FT-ICR ion traps, International Journal of Mass Spectrometry and Ion Processes. 1993, 125, 33-43.
35. Goodlett, D. R., Bruce, J. E., Anderson, G. A., Rist, B., Pasa-Tolic, L., Fiehn, O.,
Smith, R. D., Aebersold, R., Protein Identification with a Single Accurate Mass of a Cysteine-Containing Peptide and Constrained Database Searching, Analytical Chemistry. 2000, 72, 1112-1118.
114

Figure 1
a.)
b.)
c.)
Figure 1) Simion plot of equipotential contour lines of a closed cylindrical cell with 1.0 V
placed on the trapping electrodes. a) equipotential contours of 0.8, 0.6, 0.4, 0.2 V
are shown b) equipotential contours of 0.8, 0.6, 0.4, 0.2 V are shown; an electrode
with a -0.5 V potential is placed through the center of the closed cylindrical cell to
approximate the affect the electron beam will have on the shape of the trapping
potentials c) an overlay of the 0.2 V equipotential contour lines for potentials of
-0.01, -0.10, -0.30, and -0.50 V applied to the central electrode.
115

Figure 2
151630
151635
151640
151645
151650
151655
151660
151665
151670 151675
50 100 150 200 250 300 Excite Voltage (p-p)
Freq
uenc
y (H
z)
No beam -0.35 -0.45 -0.55 -0.60
voltage bias
a)
b)
y = -8E-07x + 151659 R2= 0.9728
151648
151649
151650
151651
151652
151653
151654
151655
151656
151657
0 20 40 60 80 100 120 140 Total Ion Intensity (arbitrary units)
Freq
uenc
y (H
z)
Figure 2) a) The measured cyclotron frequency of melittin (M+4H)+4 is plotted at
different RF excitation voltages. Experiments were done with different voltage
biases applied on the cathode carried out to demonstrate the affect of the number
of electrons have on the measured frequency. Each collected spectrum was an
average of 10 signal acquisitions and the data set size was 128k. b) The total ion
population in the ICR cell was varied to determine the cyclotron frequency with
reduced space charge conditions.
116

Figure 2
c)
0. 0.07 0.15 0.23 0.30Time (s)
0.00
-0.35
-0.45
-0.55
-0.60
voltage bias
c) The time-domain signal acquired after excitation with voltage of 200 Vp-p is shown for
different bias voltages applied to the cathode.
117

Figure 3
-20.0
-15.0
-10.0
-5.0
0.0
5.0
10.0
15.0
-35.0 -25.0 -15.0 -5.0 5.0 15.0 25.0 35.0Z-Axis Position (mm)
Rad
ial E
lect
ric
Fiel
d (V
/m)
33% cell radius 50% cell radius 33% cell radius EPIC 50% cell radius EPIC
42% cell radius EPIC
Figure 3) Radial electric fields are shown at set radii across the z-axis of the ICR cell. 1
V applied to the trapping electrodes. The EPIC radial electric fields were
constructed with -0.2 V on the central electrode.
118
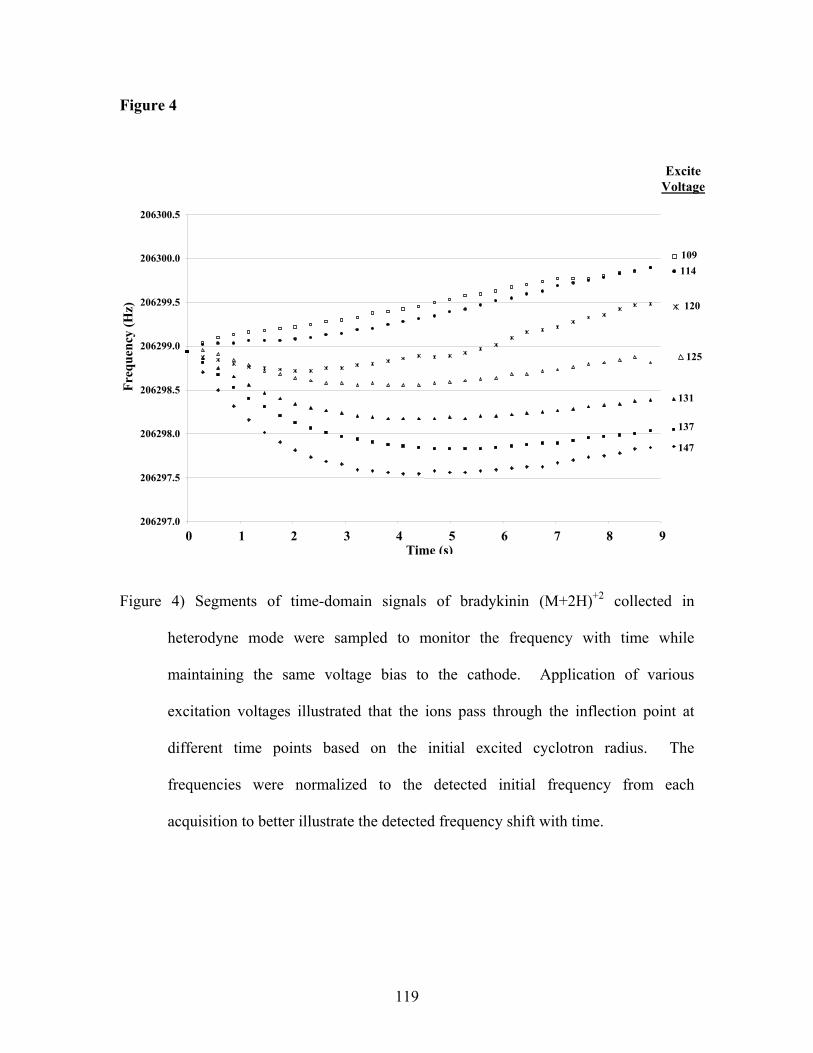
Figure 4
206297.0
206297.5
206298.0
206298.5
206299.0
206299.5
206300.0
206300.5
0 1 2 3 4 5 6 7 8 9Time (s)
Freq
uenc
y (H
z)
147
137
131
125
120
114 109
Excite Voltage
Figure 4) Segments of time-domain signals of bradykinin (M+2H)+2 collected in
heterodyne mode were sampled to monitor the frequency with time while
maintaining the same voltage bias to the cathode. Application of various
excitation voltages illustrated that the ions pass through the inflection point at
different time points based on the initial excited cyclotron radius. The
frequencies were normalized to the detected initial frequency from each
acquisition to better illustrate the detected frequency shift with time.
119

Figure 5
206295
206295.5
206296
206296.5
206297
206297.5
206298
206298.5
206299
0 1 2 3 4 5 6 7 8 9Time (s)
freq
uenc
y (H
z)
-0.35
-0.36-0.37
-0.38
-0.39
-0.40
Cathode Bias Potential
Figure 5) Segmented FFT analysis of time-domain signals of bradykinin (M+2H)+2 ions.
Various cathode bias potentials were applied to demonstrate how the detected
frequency changes with time while maintaining the same excited cyclotron radius.
At low applied bias potentials the frequency decreases with time. At higher
applied bias potentials the frequency increases with time.
120

Figure 6
0
0.5
1
1.5
2
2.5
3
0 1 2 3 4 5 6 7 8Time (s)
MM
A (p
pm)
Figure 6) Broadband spectrum of BSA tryptic digest peptides from a recorded 7 second
ICR signal acquisition. The resultant time-domain of a single acquisition period was
truncated at time intervals of, 0.25, 0.50, 1.0, 2.0, 3.5, 7.0 seconds. The spectrum was
calibrated with 5 peptides after each truncation. The average mass measurement error of
8 other peptides in the spectrum is plotted with time. The error bars show +/- one
standard deviation.
121
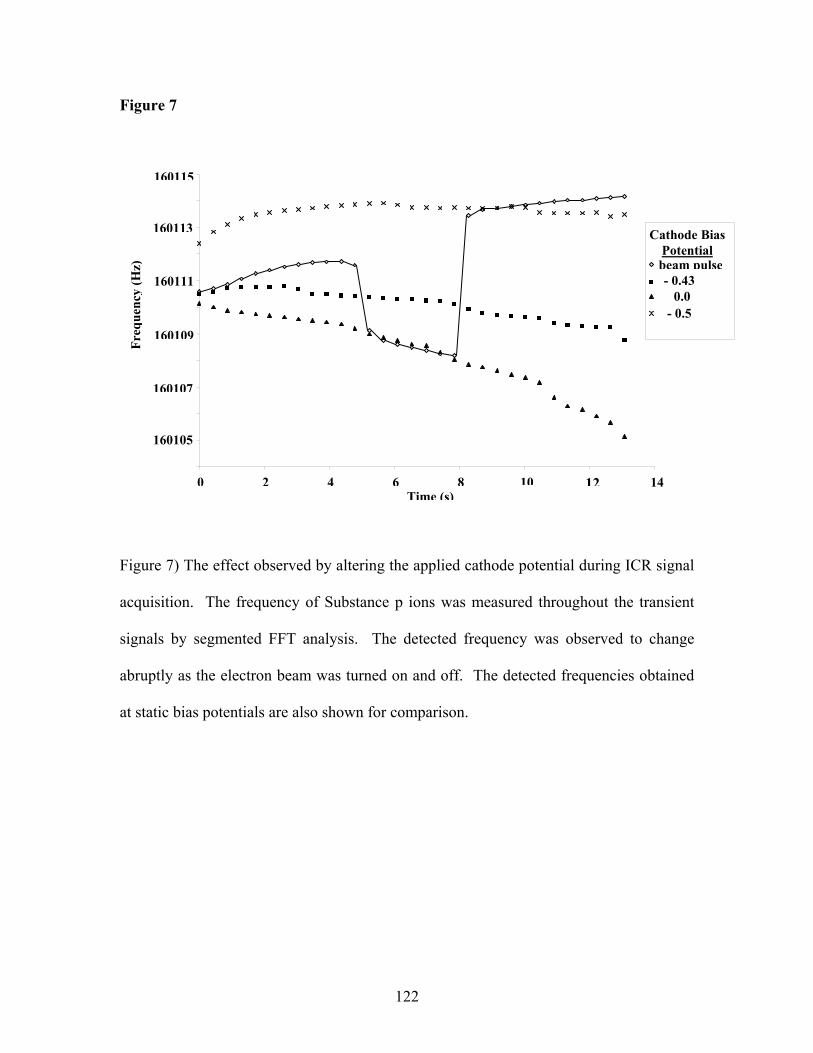
Figure 7
160105
160107
160109
160111
160113
160115
0 2 4 6 8 10 12 14Time (s)
beam pulse- 0.43 0.0 - 0.5
Cathode Bias Potential
Freq
uenc
y (H
z)
Figure 7) The effect observed by altering the applied cathode potential during ICR signal
acquisition. The frequency of Substance p ions was measured throughout the transient
signals by segmented FFT analysis. The detected frequency was observed to change
abruptly as the electron beam was turned on and off. The detected frequencies obtained
at static bias potentials are also shown for comparison.
122

Figure 8
0
0.05
0.1
0.15
0.2
0.25
0.3
0.35
-0.5 0 0.5 1 1.5 2 2.5 3 3.5 Time (s)
mic
ro a
mp
0.10
0.15
0.20
0.25
0.30
0.35
0.40
-1 0 1 2 3 4 5 6 7 8 9 Time (s)
mic
ro a
mps
-
-
-
-
-
-
a)
b
0.500.48
0.450.40
0.380.35
Figure 8) Time-dependence of electron beam current collected on the lens. a) The
measured electron current resultant from application of various voltage biases to the
cathode. The electron current follows the same general drift in current with time. b) The
upper electron current trace was recorded taken after the cathode remained idle for 5
minutes. The lower current trace was detected immediately after 20 previous signal
acquisition periods.
123

CHAPTER 5 Reduction of Axial Kinetic Energy Induced Perturbations on Observed Cyclotron Frequency Abstract
With Fourier Transform Ion Cyclotron Resonance (FTICR) mass spectrometry one
determines the mass-to-charge ratio of an ion by measuring its cyclotron frequency.
However, the need to contain ions to the trapping region of the ICR cell with electric
fields induces deviations in the unperturbed cyclotron frequency. Additional
perturbations to the observed cyclotron frequency are often attributed to changes in space
charge conditions. This study presents a detailed investigation of the observed ion
cyclotron frequency as a function of ion z-axis kinetic energy. In a perfect three-
dimensional quadrupolar field, cyclotron frequency is independent of position within the
trap. However, in most ICR cell designs, this ideality is approximated only near the trap
center and deviations arise from this ideal quadrupolar field as the ion moves both
radially and axially from the center of the trap. To allow differentiation between
deviations in observed cyclotron frequency caused from changes in space charge
conditions or differences in oscillation amplitude, ions with identical molecular weights
but different axial kinetic energy, and therefore, amplitude of z-axis motion, were
simultaneously trapped within the ICR cell. This allows one to attribute deviations in
124

observed cyclotron frequency to differences in the average force from the radial electric
d by ions of different axial amplitude. Experimentally derived magnetron
equency is compared with the magnetron frequency calculated using SIMION 7.0 for
o
ifferences in radial electric fields at different axial positions. Thus with the
pplication of EPIC, the differences in observed cyclotron frequencies are minimized for
ferent axial oscillation amplitudes.
field experience
fr
ions of different axial amplitude. Electron Promoted Ion Coherence, or EPIC, is used t
reduce the d
a
ions of dif
Introduction
Fourier Transform Ion Cyclotron Resonance (FTICR) mass spectrometry [1, 2]
has become the ideal mass analyzer for the analysis of multiply charged ions produced by
electrospray ionization with its ability to provide high resolution and accurate mass
measurements. It has become common practice to couple electrospray ionization to
liquid chromatography for online analysis of complex mixtures with FTICR-MS [3-5].
To effectively sample the chromatographic peaks as they elute from the column, a short
duty cycle is needed. However, with ICR mass spectrometers the mass resolving power,
sensitivity, and mass measurement accuracy decrease with shorter acquisition time
periods. Therefore, the majority of the time ions spend in the ICR cell is used for
detection and not on some form of ion manipulation event such as ion accumulation, ion
focusing, or ion selection. In order to meet the demand for high-throughput analysis
while utilizing the high performance that FTICR mass spectrometers offer, ions are
usually accumulated external to the magnetic field and then trapped in the ICR cell with
125

some variation of gated trapping [3, 6-8]. Hybrid instruments allow for ion selection and
fragmentation to take place external to the magnetic field. Minimizing individual
spectrum acquisition time increases the number of MS and MS/MS acquisitions that can
be obtained during an LC-MS analysis. Therefore, little time is spent on ion
manipulation inside the ICR cell.
Ions are trapped in the ICR cell perpendicular (x-y) to the cell axis by the
magnetic field and along the ICR cell axis (z) by a static potential applied to the trapping
lectrodes. The finite dimensions of the ICR cell result in two further motions in addition
tion within the ICR cell, a trapping oscillation along the z-axis and
agnetron motion. The ability to produce a three dimensional axial quadrupolar
of
ar
s
z-axis
e
to cyclotron mo
m
potential is needed to obtain an ion cyclotron resonance frequency that is independent of
the ion location within the ICR cell. This ideal electric field shape can only be achieved
with a hyperbolic shaped cell [9]. However, by applying the same dc voltage to each
the trapping electrodes of just about any trap geometry will approximate a quadrupol
electrostatic trapping potential near the center of the ICR cell [10]. This idealized
electrostatic field is only present at the center of the ICR cell and as the ions are moved
axially and/or radially away from the ICR cell center, the electric field deviates from
quadrupolar. Therefore, the observed cyclotron frequency becomes dependent on it
position inside the ICR cell. The variation in cyclotron frequency as a function of
position has been of concern in to researchers in the ICR field for a long time [11, 12].
The first trapped cell experiments by McIver and coworkers had hyperbolic shaped
electrodes to minimize these effects [13]. Many groups have identified that detailed
knowledge of frequency shifts due to non-ideal electric fields was required to maximize
126
instrument performance [14-16]. Mitchell developed a theory of trapped ion motion in
the non-quadrupolar electrostatic potential of a cubic ICR cell [17]. At a large radi
axial distance from center of the ICR cell the rapid periodic cyclotron and axial motions
of a single ion time averages spatial nonidealities in the electric and magnetic
However, these same nonidealities
al or
fields [18].
also disrupt the ion motion of a coherent ion packet,
s that
-kick
due
ions
increasing the rate of signal decay [19]. There are a number of trap configuration
have been proposed or tested to decrease these nonidealities [20-25].
With the three-dimensional quadrupolar potential achieved at the center of the
ICR cell it becomes desirable to reduce the ion oscillation amplitude so that ions are
located primarily at the center of the ICR cell during excitation and detection. In
addition, quadrupolar axialization improves virtually every aspect of FTICR performance
[26]. Higher performance measurements are usually obtained with some form of ion
cooling method as well as a reduction of trap plate potentials prior to ion detection [27,
28]. There are a number of different methods that have been used to reduce ion axial
motion in the ICR cell such as introducing a collision gas into the ICR cell [29], side
[8], evaporative cooling [30, 31], and adiabatic cooling [27]. The method we describe
here has great potential in combination with these methods to further minimize
differences in magnetron frequency for ions of different z-axis oscillation amplitudes.
Gated trapping is attractive because it can decrease the data acquisition time
period by accumulating ions external to the ICR cell. However, when gated trapping is
performed ions can have different z-axis kinetic energies in the ICR cell. However,
to time-of-flight effects and the ion distribution as they exit the accumulation cell, all
do not reach the center of the ICR cell at the same time [32]. The position of the ions at
127

the moment the potential applied on the front plate is increased will result in different
trapping oscillation amplitudes. Ions located at the center of the trap will be efficiently
trapped. However, ions located at the edges of the trapping regions when the potential is
increased will result in those ions having larger z-axis oscillation amplitudes. This results
in a dispersion of ions along the z-axis of the ICR cell. This will result in a change in the
observed cyclotron frequency based on ion axial position and/or rapid de-phasing of the
ion cloud [6, 19, 33, 34]. Therefore, scan-to-scan variation of ion kine n
tic e ergy will
ce
d
cy
drical cell
change the observed cyclotron frequency and also should cause non-linear calibration
errors. Z-axis motion is an important parameter to consider when performing high
performance measurements, since ions of different z-axis amplitude may experien
different average magnetic field strength and radial electric field strength. It has been
reported that during the detection period, the trapping motion effectively averages out
differences in electric or magnetic field over z-axis amplitudes [18, 35]. This is explaine
by motional averaging of the radial electric field. That is, the z-axis oscillation frequen
is usually much higher than the magnetron frequency. Thus, motional averaging of the
radial electric field during z-axis oscillation yields an average of the radial electric field
experienced by an ion [36]. Vartanian and Laude showed that for an open cylin
modulation of the z-axis oscillation amplitude induced changes in the magnetron
frequency [37].
Motion of ions in the ICR cell is complex and still not fully understood. Though
fairly simple for a single ion, the complexity of ion motion increases with increasing
number of ions within the ICR cell. Small perturbations in the observed cyclotron
frequency from scan-to-scan are often attributed to changes in space charge conditions.
128

This work focuses on changes in the observed cyclotron frequency as a function of z-ax
oscillation amplitude. We show that ions with the same mass but different axial kinetic
energies exhibit different observed cyclotron frequencies. We also present a further
utility of the technique called Electron Promoted Ion Coherence [38-40] or EPIC, in
which the application of an electron beam through the center of the ICR cell during
detection alters the radial electric fields to produce longer transients. This technique is
similar the wire ion guide ICR cell designed by Russell and coworkers, which utilized
charged wire suspended along the axis of the ICR cell for modification of the trapping
electric field [41, 42]. In our first paper we showed that with EPIC we could achiev
improvement in resolution and sensitivity by changing the electric fields. In the seco
paper we demonstrated that high mass measurement accuracy is possible with the
technique, and characterized the effects the electron beam has on the observed cyclotro
frequency. Here we present the underlying principle for the improvements this technique
presents. In this research the use of EPIC produces an observed cyclotron frequency that
is independent of z-axis oscillation amplitude.
Experimental
Ions were u
is
a
e a 3x
nd
n
prod ced using electrospray ionization by applying ~2.5 kV to the
ntranc
[43]
e e to the mass spectrometer. The electrospray solution was 49:49:2 by volume of
water:methanol:acetic acid. Ions were analyzed with a Bruker Daltonics 7T ApexQ
FTICR mass spectrometer (Billerica, MA). The instrument utilizes the Infinity cell
for image current detection. The mass spectral data was acquired with Xmass version
129

7.0.6 as the data acquisition software. Bradykinin, melittin, and insulin were purchased
from Sigma (St. Louis, MO). 10μM solutions of peptides were infused by direct
injection with a syringe pump at a rate of 0.4 μL/min. Ions were accumulated in a
hexapole following isolation with the mass selective quadrupole. Ion intensity was
varied by changing the ion accumulation time in the hexapole. The accumulation tim
varied between 0.1 ms and 2.0 s. Ions were trapped in the ICR cell with the use of gated
trapping. The ions were typically excited to cyclotron radius between 30 – 40% of the
ICR cell radius. The data was analyzed with ICR-2LS [44]. To determine frequencies,
all transients were Welch apodized followed by one zero-fill before Fourier
transformation to the frequency domain. Ion abundances used for space charge
frequency corrections were calculated by taking the initial amplitude from the extra
transient of the monoisotopic peak in the frequency domain [45, 46]. This process was
done instead of obtaining ion abundances directly from the peak intensity because the
peak intensity will change for ions with different signal decay rates.
The pulse sequence to simultaneously trap ions with diffe
e
cted
rent axial kinetic
nergies in the ICR cell called a “Double Trap” experiment is shown in Figure 1a.
2H)2+ was accumulated in the hexapole region and then sent to the ICR
ell followed by injection of a cooling gas (argon) with a pulse length of 1.5ms. After an
r
e
Bradykinin (M+
c
8 second delay, a second ion packet of Bradykinin (M+2H)2+ is accumulated in the
hexapole and sent to the ICR cell, followed immediately by excitation and detection. The
pulse sequence was set up to individually control the ion accumulation time period fo
each ion injection event. The trapping potentials were set at 1.5 V for all “Double Trap”
experiments.
130

The magnetron frequency was calculated with SIMION 7.0 software (SIMION
7.0 3D, version 7.0, D.A. Dahl, Idaho National Engineering Laboratory, Idaho Fa
The magnetic field strength was set at 7 Tesla for the magnetron frequency simulati
The ICR cell used for the simulations was a closed cylindrical cell with dimensions o
64mm in length and with a diameter of 60mm. The radial electric fields were also
calculated with SIMION 7.0 at 1mm intervals along the z-axis, at different cell radii. The
segmented trap plates of the infinity cell were treated as if they were a single electrode.
This will only cause minor deviations in the calculations very near the surface of the
electrodes, and would not alter the calculated fields presented here.
In order to initiate larger z-axis amplitude, ions were first cooled axially w
pulse valve event. 1.5 volts were applied to both trap plates. After an 8 second delay the
back trap plate was dropped to ground for defined period of time (51us to 2000us), then
raised back to 1.5 V for 400usec, before being dropped back to ground. The front trap
plate remained at 1.5 V. The number of times that the back trap plate
lls, ID).
ons.
f
ith a
was lowered and
t.
raised was varied between 1 and 10.
EPIC was carried out with a hollow cathode originally installed to conduct
electron capture dissociation experiments. The cathode was heated with 1.5 to 1.6 amps
of current. To send electrons through the center of the ICR cell during detection the
potential to the cathode was pulsed negative (0.0 V to -1.0 V). At all other times the
potential applied on the cathode was held at a positive 10 V. The cathode is pulsed
negative after the excitation event and remained negative throughout the detection even
131

Results and Discussion
Simultaneous detection of ions with different kinetic energies:
Though it has been shown that motional averaging of the radial electric field
results in a single observed cyclotron frequency for a range of different axial kinetic
energies, it is possible to observe separate peaks within the same spectrum for ions with
the same mass value but distinctly different axial kinetic energies. Figure 1b shows the
results from the double trap experiment in which the first ion packet is injected into th
ICR cell followed by a pulse gas event. This was done to cool the ax
e
ial motion and allow
ng mass spectrum yields two peaks for the same
ass va s
n an
the separate ion injection events. The results from the double trap experiment were
compared with a single ion injection event that mimicked either the first or second ion
the ions to be focused axially to the center of the ICR cell. After an 8 second delay to
allow the cooling gas to be pumped away, a second ion packet is injected into the ICR
cell. This allows for two packets of ions with the exact same mass value that differ only
in kinetic energy to be trapped in the ICR cell. The cooled ions will have small z-axis
oscillation amplitudes while the ion from the second injection will have much larger z-
axis oscillation amplitude. The resulti
m lue. In Figure 1b, the accumulation time for the first ion injection event wa
varied while the accumulation time for the second ion injection event remained constant.
As expected increasing the accumulation time for the first ion injection event results i
increase in peak intensity for the corresponding peak in the spectra, while the peak
intensity resultant from the second ion injection event remained constant. This
demonstrates independent control over the number of ions injected into the ICR cell for
132

injection event of the double trap experiment. The result from only a single ion injection
r the first injection event is represented by the dotted line in Figure 1b. The result for
n Figure 1c. The pulse
p
et
r
e
at
In
e
fo
the single ion injection for the second ejection event is shown i
sequence remained the same between the single ion injection event and the double tra
experiment, with the exception of altering a voltage parameter in the source region to
gate the ions. For the same ion accumulation times, the peak intensities are similar
between the single ion injection and the corresponding peak in the double trap
experiment. The peak for the single injection is shifted to a slightly lower m/z value,
indicating higher frequency. This could result from a lower number of total ions trapped
in the ICR cell, (one ion injection vs. two ion injections) that results in different space
charge conditions. Alternatively, the z-axis oscillation amplitude of the cooled ion pack
may have increased slightly during the injection of the second ion packet. The front trap
plate was pulsed to ground for the ion flight time (1.5ms) before being raised to 1.5 V fo
ion detection.
The double trap experiment was designed to minimize differences in space charg
conditions that might occur if the experiments were performed separately. If the
frequencies had been measured in separate experiments it would be difficult to decipher
the contribution between space charge and axial oscillation amplitude on the observed
cyclotron frequency. By performing the double trap experiment, we can conclude th
the differences in observed frequencies are from the axial oscillation amplitude.
reducing the axial kinetic energy of the ions in the ICR cell with a collision gas, the spac
charge conditions are also changing. A cooled ion packet likely experiences higher
space charge conditions since the spread in axial positions of the ions is decreased. One
133

might therefore expect cooled ions to exhibit lower cyclotron frequencies due to
increased space charge conditions [47, 48]. However, as shown in Figure 1b the cooled
ion packet is observed at a lower m/z value indicating that it has a higher observed
cyclotron frequency. The difference in frequency results from the difference in average
radial electric field experienced by the ions. Figure 2 shows the calculated magnitude
the outward directed radial electric field along the z-axis at 45% of the ICR cell radius
with 1 V applied to the trap electrodes. The magnitude of the radial electric fiel
with ion position along the z-axis. Increasing the trap plate voltage will increase the
difference in magnitude of the radial electric field across the z-axis of the ICR cell.
Therefore, as an ion oscillates between the trap plates it will experience differences in t
magnitude of the radial electric field. The resultant magnetron frequency is correlated to
the average radial electric field experienced by the ions. Therefore, changes in the
average radial electric field produced from differences in axial motion will be reflected in
the magnetron
of
d changes
he
frequency. The magnetron frequency is also shown in Figure 2 for ions
a
ns
g
y
with different axial oscillation amplitudes. Ions with different axial kinetic energy in the
ICR cell will have different axial oscillation amplitudes, and thus will experience
different average radial electric force. Dunbar and coworkers were able map out electric
field imperfections in a cubic ICR cell by monitoring the magnetron frequency of the io
[49]. A cooled ion packet will have small axial oscillation amplitude and be located at
the center of the ICR cell, and experience little change in the radial electric field alon
the z-axis. In Figure 2, the magnetron frequency is smallest at the center of the ICR cell.
As the kinetic energy or amplitude of z-axis motion increases, the magnetron frequenc
increases. An ion with small amplitude of z-axis motion will have a greater observed
134

cyclotron frequency because it has a smaller magnetron frequency. This relations
shown in Equation (1) where ω+ is the observed cyclotron frequency, ωc is the
unperturbed cyclotron frequency, and ω- is the magnetron frequency [1].
−+ −=
hip is
ωωω c (1)
Effect of ion cooling on observed cyclotron frequency:
Ion kinetic energies were varied to observe the effect of different axial oscillation
amplitude on observed cyclotron frequency. Ions are cooled either through a pulsed g
event or by the addition of a significant delay between ion injection into the ICR cell
excitation. The results for the experiments are shown in Figure 3. The highest observed
cyclotron frequency occurs after the ions have been cooled to the middle of the ICR cell.
Three sets of data are illustrated in this figure. The duration between the pulse valv
event following ion injection and cyclotron excitation (ο) was varied. Increasing the
duration between the pulse event showed no noticeable trend in measured cyclotron
frequencies. This indicates that ions are cooled axially to the middle of the ICR cell. No
time points were taken with a delay of 2 seconds or less due to the deleterious effect
high pressure has on ICR signal detection. Thus, the delay period between ion cooling
and ion excitation had no observable effect on the axial position of the ions. The next set
of experiments examined the frequency difference for ions that were subjected to variab
delay times between ion injection into the ICR cell and cyclotron excitation with no
pulsed valve (). With a delay of approximately 10μs between ion injection and
excitation the ions have the lowest observed frequency, which indicates that these ions
have the largest axial motion immediately after ion injection. As the delay period
as
and
e
s the
le
135

increases the observed frequency increases, which results from ions being cooled to the
middle of the ICR cell through either ion-neutral or ion-ion interactions. The si
amplitude remained constant for each delay period, indicating that ions ar
gnal
e not lost from
the ICR cell during the delay period. Therefore, the change in frequency can be
ttributed to a change in axial position, rather than alterations in space charge conditions.
uenc leveled off at the same
ed
ng
gas
the
ter
a
After approximately a 7 second delay the observed freq y
frequency one would expect if the ions were cooled to the center of the ICR cell with the
addition of a cooling gas. This indicates two things: first, after some set time period the
axial oscillation amplitude was not being reduced further, and second the ion axial
amplitude with the delay between ion injection and excitation approaches the ion axial
amplitude following the pulse gas event. This experiment was also carried out with
melittin and insulin to test for mass-dependence of this axial relaxation. All three test
species exhibited the same effect of increased frequency with delay time before leveli
off at observed frequencies that agreed with those recorded with corresponding pulse
experiments. Figure 3 also shows result of the experiments in which a pulse gas event
was followed by a variable delay time before ion injection into the ICR cell (♦). When
the pulse gas event is immediately followed by ion injection, there are enough neutral
molecules in the ICR cell to cool the ions the same as if the ions were trapped and cooled
with a pulse gas event. This is evident from the data in Figure 3 since the measured
frequencies with this delay period of 0.5 seconds or less agreed closely with those
measured for cooled ions (ο). It should be noted that, if the delay period between
pulse gas event and ion injection was less than two seconds an additional delay was
added so that the total time between the pulse gas and cyclotron excitation was grea
136

than 2 seconds to allow time for the residual neutral molecules to be pumped away. As
the delay period between the pulse gas and ion injection increases, the observed
frequency decreases. This results from the neutral gas molecules being pumped away
and therefore, when ions reach the ICR cell there are insufficient ion-neutral colli
promote complete cooling of axial ion motion. Furthermore, a delay of 1 second or more
results in observed frequencies that are in close agreement with those acquired with no
pulsed valve (). Importantly, these data illustrate the degree to which the ions are
cooled changes their axial oscillation amplitude and thus, their observed frequencies.
Determination of magnetron frequency:
Magnetron frequency was determined experimentally for both the pulsed gas
the non-pulsed gas experiments. This was achieved by varying the trap plate potentials
from 3.0 V to 0.5 V. The application of trap plate potentials induces the radial electric
field which drives magnetron motion. Increasing the applied trap plate potentials
increases the force from the outward directed radial fields and results in higher
magnetron frequencies. The results from investigation of trap potential effects on
observed frequencies with and without pulsed gas both produced a linear increase with
decrease in trap plate potential. The observed frequencies for the cooled ions were larger
at every trap plate potential. The difference between the two data sets becomes great
with increased trap plate potential. The observed cyclotron frequency for the non-p
gas experiments decreases (as trap potentials are increased) at a greater rate. These
results are illustrated in Figure 4a. This indicates that the radial electric fields are
changing more at greater z-axis position with increased trap plate potentials. By
sions to
and
a
er
ulsed
137

extrapolating the trend line of the measured cyclotron frequency to 0 V on the trapping
plates one will obtain the unperturbed cyclotron frequency. With 0 V applied to
trapping plates, the ions will not experience any radial fields and there should be an
absence of magnetron motion. The difference between the y-intercept and the observed
cyclotron frequency is the result of the magnetron frequency in the absence of space
charge conditions. Differences in ion intensity at the different trap plate potentials were
corrected for with the method developed by Easterling et al. [50]. Separate ion inten
calibration curves were constructed for the pulsed gas and non-pulsed gas experiments
the
sity
.
was corrected by adding the correct shift (based on ion intensity) to
arg conditions. The two experiments have
ted
gas
the
is
of
Each frequency
obtain a frequency with minimal space ch e
different calculated magnetron frequencies that result from differences in the z-axis
oscillation amplitudes. As the trap plate potentials increase, the difference in magnetron
frequency increases. This result is compared with the magnetron frequency calculated
with SIMION 7.0, and is shown in Figure 4b. The magnetron frequency is calcula
with z-axis amplitude of 2mm and a radius of 10mm to compare with the pulsed
event, and also with z-axis amplitude of 38mm and a radius of 10mm to compare to
non-pulse gas experiment. The radius of 10mm is chosen to match the calculated excited
cyclotron radius; ions will experience the radial electric force at the position they are
located in the ICR cell. The experimental and calculated magnetron frequencies match
closely indicating that ions of different z-axis oscillation amplitudes have different
magnetron frequencies.
At 1 V trap potential, the frequency difference between the two experiments
~2.5 Hz. A 1-2 Hz shift in frequency will result in a 9-18 ppm error for m/z value
138

1,000 for an FTICR instrument equipped with a 7 Tesla magnet. Ions which do not have
the same ion kinetic energy from scan-to-scan will have a slight variation in the obse
cyclotron frequency. Thus, degradation in the observed mass measurement accuracy
expected under these conditions. Also, one might expect ions of the same cyclotron
frequency but different magnetron frequency to de-phase more rapidly. A 1-2 Hz
difference indicates that ions with extreme differences in z-axis motion (2 mm – 38 mm)
will be 180o out of phase within 0.5-0.25 seconds. This is in general agreement with
experimental observations. The magnetron frequency decreases proportionally with
increased magnetic field strength; thus the difference in magnetron frequency resulta
from different oscillation amplitudes also decreases. Doubling the magnetic field
strength should double the time it takes for ions to become 180o out of phase. There
working with higher field magnets will help, but ultimately not circumvent these
problems. Improved performance must involve further ICR cell technology
development.
Increased z-axis amplitude through excitation of trapping motion:
The z-axis motion of a cooled ion packet was excited to further probe the effect of
z-axis distribution on observed ion cyclotron frequency. The z-axis motion was excite
by first cooling the ion packet to the middle of the ICR cell with cooling gas followed by
dropping the back trap plate to ground successive times for a total of 10 cycles. The
period that the back trap plate was held at ground was varied. This was done to excite the
rved
is
nt
fore,
d
time
-axis m
ap
z otion and move the ions from the middle of the trap. Figure 5 illustrates the
results observed by varying the duration of the “pulse length” to ground on the back tr
139

plate. When the back trap plate potential was dropped for a time period that
approximated one period of trapping motion, the ions changed their axial distribution.
The calculated trapping oscillation period for bradykinin (M+2H)2+ with 1.5 V trapping
potential was 0.323ms. If the “pulse length” was too long or too short the observed
cyclotron frequency shifted back to the original frequency. The frequency of the tr
plate oscillation was estimated to be one half the trapping frequency when the pulse
length matched the trapping oscillation period. Therefore, at this pulse length it is
possible to directly excite the axial motion and thus, increase the amplitude of ion axi
oscillation . The total ion intensity shown in Figure 5 remained relatively constant
indicating that ions are not being ejected from the ICR cell when the trap plate was
dropped to ground. However, if the time period that the back trap plate was dropped was
too long (~2ms or greater) the ion intensity decreased. This result agrees with our
previous results that showed that ions with larger axial kinetic energies have
observed cyclo
ap
al
lower
tron frequencies. The frequency shift observed in the experiment when
n larger z-axis amplitude is ~4.5 Hz lower frequency. The magnetron
the ions are give
frequency difference calculated with SIMION 7.0 for an ion with z-axis amplitudes of
2mm - 38mm at a 10 mm radius with 1.5 V applied trapping potential was ~4.1 Hz. The
experimental results compare well with the calculated value. The decrease in the
observed cyclotron frequency by increasing the z-axis amplitude results from a change in
the magnetron frequency.
EPIC results:
140

EPIC was carried out to determine the effect it has on the observed cy
frequency as a function of z-axis oscillation amplitude. For the SIMION model a solid
electrode is used to approximate the electron beam. Though it is not an exact solution,
the model does provide a first order approximation of the electric fields inside the IC
cell with EPIC and agrees well with our previous results [40]. It is possible that the lar
numbers of electrons in the beam behave more like negatively charged plasma, and
occupies the space between the cathode and the source trap electrode of the ICR cel
The application of EPIC flattens the radial electric field across the z-axis of the ICR cell
at some non-zero cell radius. The radius which EPIC results in minimal change in r
field across the z-axis is a function of the applied trap plate potential and the number
electrons traversing the ICR cell. The ability to produce invariable radial electric fields
along the z-axis with EPIC is shown in Figure 6 [40]. The trapping potential was s
volt on both trapping electrodes. The electrostatic potential was calculated at 1mm
intervals at 42% of the cell radius with EPIC Figure 6a and under normal operation
Figure 6b. Radial electric fields are also calculated and overlaid on top of the
electrostatic trapping potentials. The ion oscillation length is also shown for two
different ion kinetic energies. In the non-EPIC case, Figure 6b, there is a larger
difference in the radial electric force experienced by ions with different kinetic ene
With EPIC the ions of different kinetic energies will experience similar radial electric
fields. When the ion cyclotr
clotron
R
ge
l.
adial
of
et to 1
rgies.
on radius is excited to this particular cell radius, the ions will
xperience the same radial force regardless of their axial distribution. Therefore,
uency and thus the observed cyclotron frequency will become
independent of z-axis amplitude.
e
magnetron freq
141

EPIC was carried out with a variety of applied cathode bias potentials which
changes the numbers of electrons that transverse the ICR cell for both the pulse gas and
non-pulsed gas experiments individually. The changes in detected cyclotron frequency
observed with changing EPIC conditions for pulsed gas and non-pulsed gas experiments
are shown in Figure 7a. With 0 volts applied to the heated cathode, the difference in
observed frequency between the two experiments is approximately 6 Hz. This differ
in frequency has been consistent throughout all of our experiments, with the pulse gas
having a higher frequency than the non-pulse gas experiment. This also indicates that
there were not enough electrons being sent through the center of the ICR cell to
significantly alter the radial electric fields. As the cathode potential is biased more
negatively, the observed cyclotron frequency increases for both experiments. The rates a
which the frequencies increase for the two sets of experiments are different. This
indicates that the radial electric field is changing greater at further distance from the
center of the ICR cell. At ~ -0.38 V bias to the cathode, there is no difference in the
observed cyclotron frequencies between the two different experiments. This si
that with the application of EPIC, the radial electric fields are constant across the I
at the excited cyclotron radius of the ions. If the cathode potential is further incre
(negatively), the two frequencies diverge. The observed frequency with the non-pulse
gas becomes greater than the pulse gas experiment. The increase in frequency is result
from the change in magnitude and direction of the radial electric field experienced by the
ions. This indicates that with careful adjustment of the number of electrons sent th
the ICR cell, the observed cyclotron frequency becomes independent of the ion
oscillation amplitude.
ence
t
gnifies
CR cell
ased
ant
rough
’s z-axis
142

To further test the effect EPIC has on the observed cyclotron frequency with z
axis oscillation amplitude the “double trap” experiment was conducted with EPIC. The
results are shown in Figure 7b-e. In the non-EPIC conditions there are two separate
peaks that are visible in the spectrum for the “double trap” experiment, as would be
expected based on the results from Figures 1b and 7a. Results from the cooled and un-
cooled single ion injection experiments are overlaid for reference of peak position. With
-0.4 V applied to the cathode there is only one peak that is visible for the “double trap”
experiment. This corresponds to the data from Figure 7a, where the ions from the
separate ion injection events exhibited the same observed frequencies. The frequ
from the single ion injection experiments with EPIC match with the double ion injec
experiments with EPIC. The ion intensity for the EPIC result in the “double trap”
experiment is higher than the single ion injection, since the “double trap” experime
more ions resulting from two different ion injection events. This shows that with EPI
there is no change in observed cyclotron frequency between cooled and un-cooled ion
This is especially important for gated trapping when trapped ions may have differences
trapping oscillation amplitudes.
In our previous publication, we showed that the application of EPIC can improv
the resolution and sensitivity by approximately 3-fold. Even after the ions were cooled
with a collision gas and the trap plates set at low voltage potentials we were still able to
see these same improvements. In the double trap experiments ions were forced to have
different kinetic energies to study the change in frequency based on z-axis oscillation.
Typically an instrument is tuned to minimize large differences in axial kinetic energy. If
the instrument is not pr
-
ency
tion
nt had
C
s.
in
e
operly tuned this energy distribution may lead to peak splitting
143

and rapid de-phasing of the ion packet. However, in almost all cases a distribution of z
axis kinetic energy still persists. This is important because these ions will have slightly
different reduced cyclotron frequencies which will not result in corresponding peaks i
the mass spectra but rather a decrease in ion intensity as the ion packets de-phase as
as peak broadening.
Conclusions
The observed cyclotron frequency for ions that have been cooled to the middle o
the ICR cell is higher than for ions with larger z-axis oscillation amplitudes. Space
charge effects did not appear to have a significant impact on the measured ion cyclo
frequency. However, the dominant divergence in observed cyclotron frequency between
ion packets of distinctly different kinetic energy can be attributed to the difference in
axial oscillation amplitude of the ions along the center of the ICR cell. Bradykinin
(M+2H)2+ ions of different axial kinetic energies were detected in the same spectrum to
minimize differences that are assoc
-
n
well
f
tron
iated with changing space charge conditions. At the
s
excited ion cyclotron radii, the ion will experience differences in the radial electric field
as it transverses the ICR cell. These differences become larger as difference in the ion
kinetic energy increases. Since the force from the radial electric field produces
magnetron motion, the magnetron frequency will change at different axial positions. Ion
of different axial amplitude exhibit different magnetron frequencies which were
determined experimentally and correlated well with the theoretical magnetron
frequencies calculated in SIMION 7.0. Changes in magnetron frequency produce
144
differences in observed cyclotron frequency. With the application of EPIC, changes in
the radial electric field across the z-axis of the ICR cell at a selected cyclotron radius can
be minimized. Therefore, as the ions of different kinetic energy oscillate along the z-ax
of the ICR cell, they will experience little change in the radial electric field. Thus, the
observed cyclotron freq
is
uency becomes independent of z-axis position. This can have
gnificance in terms of ion de-phasing.
cknowledgements
The authors acknowledge helpful discussions with Drs. Jean Futrell and Göhkan Baykut.
This material is based upon work supported by the National Science Foundation under
Grant No. 0352451; Murdock Charitable Trust; Office of Science (BER), U. S.
si
A
Department of Energy, Grant No. DE-FG02-04ER63924, and the National Institutes of
Health Biotechnology Training Grant.
References
1. Marshall, A. G., Hendrickson, C. L., Jackson, G. S., Fourier transform ion views.
1998, 17, 1-35.
2. Comisarow, M. B., Marshall, A. G., Fourier transform ion cyclotron resonance
all, A. G.,
External accumulation of ions for enhanced electrospray ionization Fourier can
Society for Mass Spectrometry. 1997, 8, 970-976.
cyclotron resonance mass spectrometry: a primer, Mass Spectrometry Re
spectroscopy, Chemical Physics Letters. 1974, 25, 282-283.
3. Senko, M. W., Hendrickson, c. L., Emmett, M. R., Shi, S. D. H., Marsh
transform ion cyclotron resonance mass spectrometry, Journal of the Ameri
145

D., Pasa-Tolic, L., Proteomic Profiling of Intact Proteins Using WAX-RPLC 2-D
6, 602-610.
5. Belov, M. E., Anderson, G. A., Wingerd, M. A., Udseth, H. R., Tang, K., Prior
R. D., An automated high performance capillary liquid chromatography-Fourie
proteomics, Journal of the Ameri
4. Sharma, S., Simpson, D. C., Tolic, N., Jaitly, N., Mayampurath, A. M., Smith, R.
Separations and FTICR Mass Spectrometry, Journal of Proteome Research. 2007,
,
D. C., Swanson, K. R., Buschbach, M. A., Strittmatter, E. F., Moore, R. J., Smith, r
transform ion cyclotron resonance mass spectrometer for high-throughput can Society for Mass Spectrometry. 2004, 15,
212-232.
. Gorshkov, M. V., Masselon, C. D., Anderson, G. A., Udseth, H. R., Harkewicz, R., Smith, R. D., A dynamic ion cooling technique for FTICR mass spectrometry,
American Society for Mass Spectrometry. 2001, 12, 1169-1173.
. Alford, J. M., Williams, P. E., Trevor, D. J., Smalley, R. E., Metal cluster ion cyclotron resonance. Combining supersonic metal cluster beam technology with
72, 33-51.
8. Caravatti, P., Method and Apparatus for The Accumulation of Ions in a Trap of
the Motion Parallel to the Magnetic Field into Directions Perpendicular to the
hweikhard, L., A two-electrode ion trap for
Fourier transform ion cyclotron resonance mass spectrometry, International Journal of Mass Spectrometry and Ion Processes. 1994, 137, 9-30.
, S., Marshall, A. G., Ion traps for Fourier transform ion cyclotron
resonance mass spectrometry: principles and design of geometric and electric configurations, International Journal of Mass Spectrometry and Ion Processes. 1995, 146/147, 261-296.
ernational Journal of Mass Spectrometry and Ion Physics. 1974, 14, 449-458.
12. on line shapes, J Chem Phys. 1971, 55, 1343-1354.
13. ss
6
Journal of the 7
FT-ICR, International Journal of Mass Spectrometry and Ion Processes. 1986,
an Ion Cyclotron Resonance Spectrometer, by Transferring the Kinetic Energy of
Magnetic Field., US Patent. 4,924,089. 1990.
9. Marto, J. A., Marshall, A. G., Sc
10. Guan
11. McIver, R. T., Jr., Baranyi, A. D., High resolution ion cyclotron resonance
spectroscopy, Int
Marshall, A. G., Theory for ion cyclotron resonance absorpti
McIver, R. T., Jr., Ledford, E. B., Jr., Miller, J. S., Proposed method for maspectrometric analysis for ultra-low vapor pressure compounds, Analytical Chemistry. 1975, 47, 692-697.
146

14. Brown, L. S., Gabrielse, G., Geonium theory: physics of a single electron or ion
in a Penning trap, Reviews of Modern Physics. 1986, 58, 233-311.
Holliman, C
15. . L., Rempel, D. L., Gross, M. L., A mechanism for poor high mass
performance in Fourier transform mass spectrometry, Journal of the American
16.
8, 424-
7. Mitchell, D. W., Theory of trapped ion motion in the non-quadrupolar
8. Comisarow, M., Fourier transform ion cyclotron resonance spectroscopy,
19.
ass limit towards achieving unit mass resolution in Fourier transform ion cyclotron resonance mass spectrometry, Journal of Mass Spectrometry. 1996,
20.
r transform ion cyclotron resonance cell for improved biopolymer characterization, Journal of Mass
21. e screened
trapped-ion cell using compensation electrodes for Fourier transform ion
22. D., "Linearizing" an ion cyclotron resonance cell,
Review of Scientific Instruments. 2002, 73, 4185-4200.
23. ss accuracy, reproducibility, and upper mass limit in Fourier-
transform ion cyclotron resonance mass spectrometry, Analytical Chemistry.
4. Jackson, G. S., White, F. M., Guan, S., Marshall, A. G., Matrix-shimmed ion
, Mass
9.
Society for Mass Spectrometry. 1992, 3, 460-463.
Hartmann, H., Chung, K. M., Baykut, G., Wanczek, K. P., Dependence of ion cyclotron frequency on electric field inhomogeneity, J Chem Phys. 1983, 7431.
1electrostatic potential of a cubic ion cyclotron resonance cell, International Journal of Mass Spectrometry and Ion Processes. 1995, 142, 1-22.
1Advances in Mass Spectrometry. 1978, 7B, 1042-1046.
Mitchell, D. W., Smith, R. D., Prediction of a space charge induced upper molecular m
31, 771-790.
Bruce, J. E., Anderson, G. A., Lin, C.-Y., Gorshkov, M., Rockwood, A. L., Smith, R. D., A novel high-performance Fourie
Spectrometry. 2000, 35, 85-94.
Vartanian, V. H., Hadjarab, F., Laude, D. A., Open cell analog of th
cyclotron resonance mass spectrometry, International Journal of Mass Spectrometry and Ion Processes. 1995, 151, 175-187.
Barlow, S. E., Tinkle, M.
Wang, M., Marshall, A. G., A "screened" electrostatic ion trap for enhanced mass resolution, ma
1989, 61, 1288-1293.
2cyclotron resonance ion trap simultaneously optimized for excitation, detectionquadrupolar axialization, and trapping, Journal of the American Society for Spectrometry. 1999, 10, 759-76
147
25. Rempel, D. L., Ledford, E. B., Jr., Huang, S. K., Gross, M. L., Parametric mode
operation of a hyperbolic Penning trap for Fourier transform mass spectrometry, Analytical Chemistry. 1987, 59, 2527-2532.
26. n Fourier transform ion
cyclotron resonance mass spectrometry by ion axialization and cooling, Anal
27. S. D. H., Hendrickson, C. L., Marshall, A. G., Counting individual sulfur
atoms in a protein by ultrahigh-resolution Fourier transform ion cyclotron ructure in
tes of
High- using a new electrospray
ionization ion cyclotron resonance mass spectrometer, Journal of the American
29.
s spectrometry, Analytical Chemistry. 1983, 55, 2419-2421.
of rometry,
1. Dunbar, R. C., Weddle, G. H., Ion cyclotron resonance time-of-flight
J
32. proved ion extraction from
a linear octopole ion trap: SIMION analysis and experimental demonstration, J
3. Mitchell, D. W., Realistic simulation of the ion cyclotron resonance mass
34. , S. E., Image charge forces inside conducting boundaries,
J Appl Phys. 2001, 90, 1612-1624.
35.
Guan, S., Wahl, M. C., Wood, T. D., Marshall, A. G., Enhanced mass resolvingpower, sensitivity, and selectivity in laser desorptio
Chem. 1993, 65, 1753-1757.
Shi,
resonance mass spectrometry: experimental resolution of isotopic fine stproteins, Proceedings of the National Academy of Sciences of the United StaAmerica. 1998, 95, 11532-11537.
28. Winger, B. E., Hofstadler, S. A., Bruce, J. E., Udseth, H. R., Smith, R. D.,
resolution accurate mass measurements of biomolecules
Society for Mass Spectrometry. 1993, 4, 566-577.
Sack, T. M., Gross, M. L., Pulsed valve interface for gas chromatography/Fourier transform mas
30. Hogan, J. D., Laude, D. A., Jr., Suspended trapping procedure for alleviation
space charge effects in gas chromatography/Fourier-transform mass spectAnalytical Chemistry. 1990, 62, 530-535.
3spectroscopy. Kinetic energy of p-iodotoluene photodissociation fragment ions, Phys Chem. 1988, 92, 5706-5709.
Wilcox, B. E., Hendrickson, C. L., Marshall, A. G., Im
Am Soc Mass Spectrom. 2002, 13, 1304-1312.
3spectrometer using a distributed three-dimensional particle-in-cell code, Journal of the American Society for Mass Spectrometry. 1999, 10, 136-152.
Tinkle, M. D., Barlow
Marshall, A. G., Milestones in Fourier transform ion cyclotron resonance mass spectrometry technique development, International Journal of Mass Spectrometry. 2000, 200, 331-356.
148

36. Bloom, M., Riggin, M., Theory of ion cyclotron resonance, Can J Phys. 1974,
52, 436-455.
7. Vartanian, V. H., Laude, D. A., Motional averaging of ions for control of
3-
8. Kaiser, N. K., Bruce, J. E., Observation of Increased Ion Cyclotron Resonance
5,
39.
., Modification of Trapping Potential by Inverted Sidekick Electrode Voltage during Detection To Extend Time-Domain
40. ntron motion and space charge
using radial electric field modulation, International Journal of Mass
1. Gillig, K. J., Bluhm, B. K., Russell, D. H., Ion motion in a Fourier transform ion
2. Solouki, T., Gillig, K. J., Russell, D. H., Detection of High-Mass Biomolecules in
retical and
3. Caravatti, P., Allemann, M., The infinity cell: a new trapped-ion cell with
4. Anderson, G. A., Bruce J.E., Smith R.D., ICR-2LS, Richland, WA, 1996.
45. yclotron
resonance mass spectra via time-domain data extraction, Journal of the American
6. Du, Y., Parks, B. A., Sohn, S., Kwast, K. E., Kelleher, N. L., Top-Down
8, 686-694.
3magnetron motion in Fourier transform ion cyclotron resonance open-geometry trapped-ion cells, International Journal of Mass Spectrometry. 1998, 178, 17186.
3Signal Duration through Electric Field Perturbations, Analytical Chemistry. 20077, 5973-5981.
Kim, S., Choi, M. C., Kim, S., Hur, M., Kim, H. S., Yoo, J. S., Blakney, G. T., Hendrickson, C. L., Marshall, A. G
Signal Duration for Significantly Enhanced Fourier Transform Ion Cyclotron Resonance Mass Resolution, Analytical Chemistry. 2007, 79, 3575-3580.
Kaiser, N. K., Bruce, J. E., Reduction of ion mage
Spectrometry. 2007, 265, 271-280.
4cyclotron resonance wire ion guide cell, International Journal of Mass Spectrometry and Ion Processes. 1996, 157/158, 129-147.
4Fourier Transform Ion Cyclotron Resonance Mass Spectrometry: TheoExperimental Investigations, Analytical Chemistry. 1994, 66, 1583-1587.
4radiofrequency covered trapping electrodes for Fourier transform ion cyclotron resonance mass spectrometry, Organic Mass Spectrometry. 1991, 26, 514-518.
4
Bresson, J. A., Anderson, G. A., Bruce, J. E., Smith, R. D., Improved isotopic abundance measurements for high resolution Fourier transform ion c
Society for Mass Spectrometry. 1998, 9, 799-804.
4Approaches for Measuring Expression Ratios of Intact Yeast Proteins Using Fourier Transform Mass Spectrometry, Analytical Chemistry. 2006, 7
149

47. Francl, T. J., Sherman, M. G., Hunter, R. L., Locke, M. J., Bowers, W. D.,
resonance frequencies, International Journal of Mass Spectrometry and Ion Processes. 1983, 54, 189-199.
48. 8.
9. Dunbar, R. C., Chen, J. H., Hays, J. D., Magnetron motion of ions in the cubical
0. Easterling, M. L., Mize, T. H., Amster, I. J., Routine part-per-million mass
l
McIver, R. T., Jr., Experimental determination of the effects of space charge on ion cyclotron
Ledford, E. B., Jr., Rempel, D. L., Gross, M. L., Space charge effects in Fouriertransform mass spectrometry. Mass calibration, Anal Chem. 1984, 56, 2744-274
4ICR cell, International Journal of Mass Spectrometry and Ion Processes. 1984, 57, 39-56.
5accuracy for high-mass ions: space-charge effects in MALDI FT-ICR, AnalyticaChemistry. 1999, 71, 624-632.
150

1 Figure
Figure 1. “Double trap” experiment. a) Pulse sequence for the “double trap” experiment that includes two separate ion injection events. b) The monoisotopic peak of Bradykinin (M+2H)2+ with different ion accumulation time periods given in μs. Solid line represents the “double trap” experiment. The first ion accumulation time period (located left of the peak) was varied while the second ion accumulation time period (located to the right of the peak) remained constant. The dotted line represents a single ion injection which corresponds to the first ion injection event (cooled ion packet) of the “double trap” experiment. The accumulation for the single ion injection experiment was also varied.
Pulse g
530.63 530.80 530.97 m/z
100 100,000
1,000 100,000
10,000 100,000
50,000 100,000
100,000 100
as
b,000
accumulation
Ion
First ion transfer
Second ion transfer
Excite/ accumulation
Ion
Detect
a)
)
151
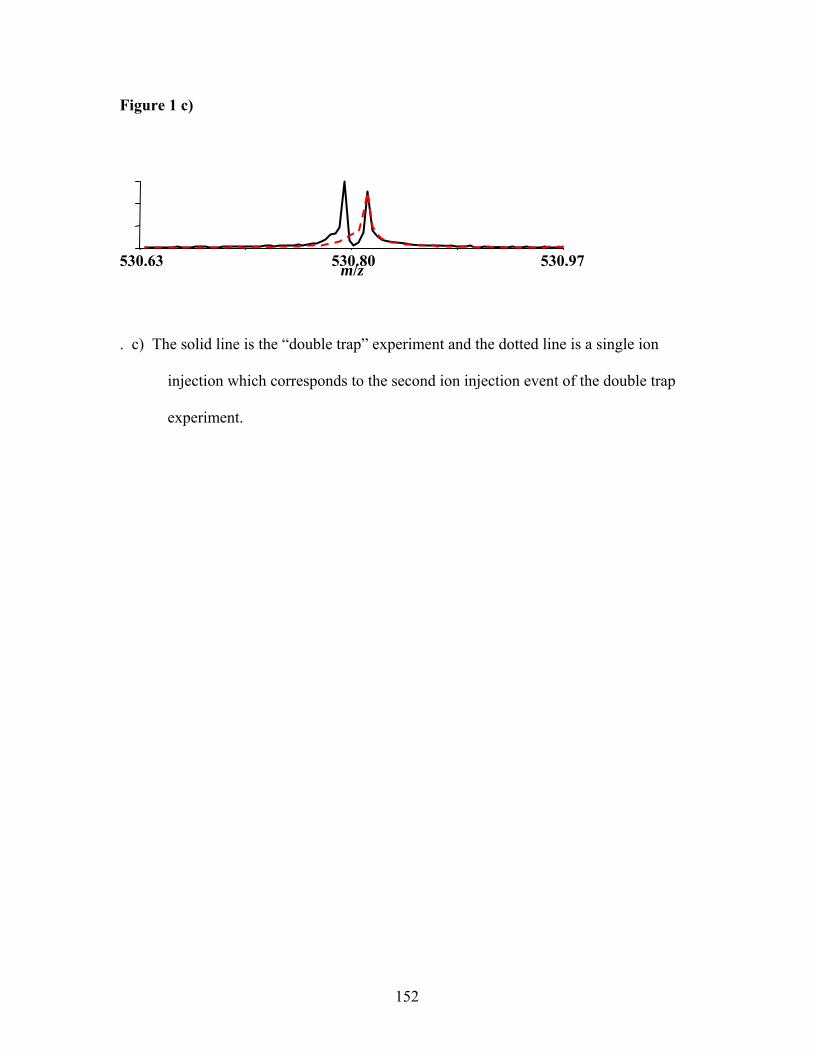
Figure 1 c)
. c) The solid line is the “double trap” experiment and the dotted line is a single ion
injection which corresponds to the second ion injection event of the double trap
experiment.
530.63 530.80 530.97 m/z
152

Figure 2
Figure 2. SIMION calculated radial electric fields and magnetron frequency at 45% of
the ICR cell radius with 1V applied to the trap electrodes. The center of the ICR cell is
set at 0 mm.
-20
-18
-16
-40 -30
-14
-12
-10
-8
-6
-4
-2
0
-20 -10 0 10 20 30 4020
14
12
10
8
6
4
2
0
Z-axis oscillation amplitude (mm)
Mag
netr
on fr
eque
ncy
(Hz)
dict
ric
field
s (V
/m) radial
electric fields
magnetron frequency
al e
le
18
16 Ra
153

Figure 3
Figure 3. Observed cyclotron frequency of the monoisotopic peak from bradykinin
(M+2H) with different time delays between events. The error bars represent the
maximum and minimum values obtained for each data set.
203554
203556
203558
203560
203562
203564
203566
0 1 2 3 4 5 6 7 8 9 10
Time (s)
Freq
uenc
y (H
z)
Time between pulse valve and ion injection
Time between ion injection and excitation
Time between pulse valve and excitation
2+
154

Figure 4
203520
203530
203540
203550
203560
203570
203580
203590
No cooling Pulse gas
Freq
uenc
y (H
z)
+2H)2+ at different trap plate
potentials with the pulsed gas and non-pulsed gas experiments. b) The experimentally
derived magnetron frequencies at different trap plate potentials for the pulsed gas and
non-pulsed gas experiment are compared to the magnetron frequencies calculated with
SIMION.
Figure 4. a) Observed cyclotron frequency of bradykinin (M
0 0 1 2 3
trap plate potential (V)
10
20
30
40
50
60
0.5 1.5 2.5 3.5
SIMION z = 34 mmNo gas SIMION z = 2 mmPulse gas
Freq
uenc
y (H
z)
a)
b)
155

Figure 5
on.
he
ate 10 times. The time given represents the “pulse length” or time period the
back trap plate was dropped to ground. The dashed line represents the same frequency in
both columns and is added to provide a reference point for the frequency shift.
203558.2 Hz 203553.7 Hz
0.402 ms
0.344ms
0.312ms
0.336ms
0.300ms
0.266ms
0.0 ms
0.354 ms
4.2e+6
Figure 5. Observed cyclotron frequency of bradykinin (M+2H)2+ after z-axis excitati
Ions are first cooled with a pulse gas event, and then displaced axially by dropping t
back trap pl
0.0
0.0
2.8e+6
0.0
6.5e+5
0.0
5.3e+5
203508 203562 203616
1.5e+6
0.0
1.3e+6
0.0
2.3e+6
0.0
1.6e+6
0.0
Frequency (Hz)203508 203562 203616
Frequency (Hz)
Applied dc potential for direct excitation of trapping motion
Pulse length
volts
Abs
olut
e m
agni
tude
156
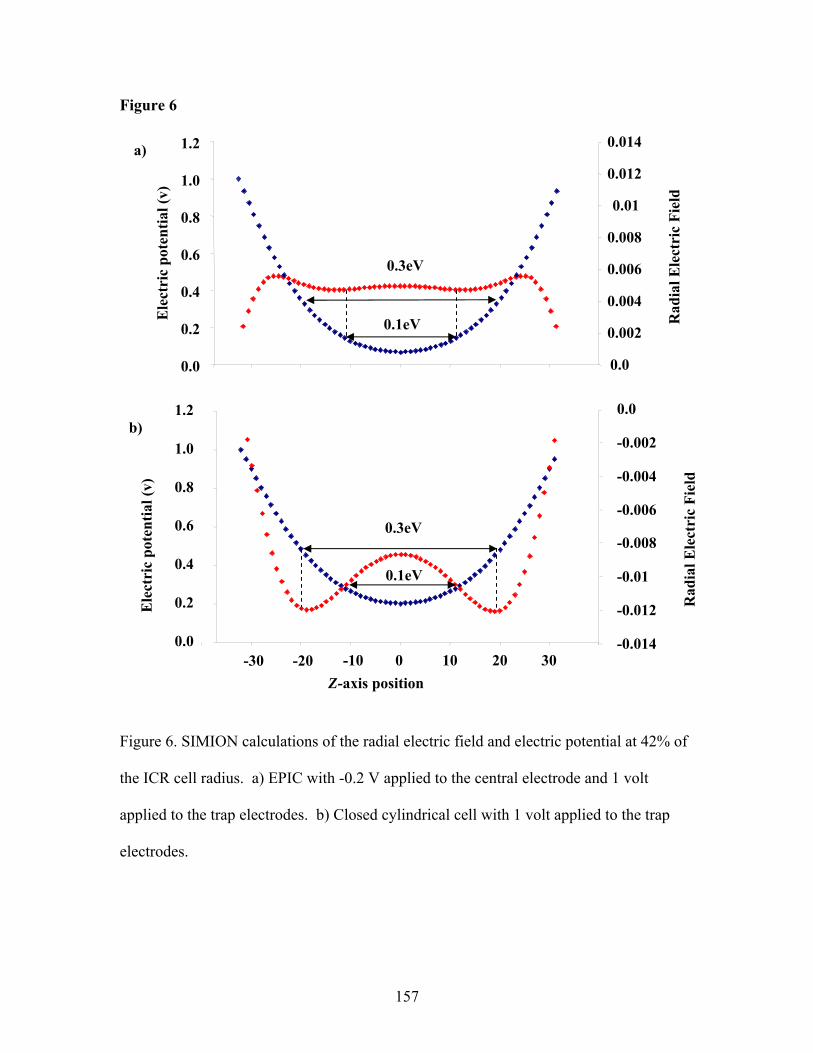
Figure 6
0.0
0.002
0.004
0.006
0.008
0.01
0.012
0.014
0.0
0.2
0.4
0.6
0.8
1.0
1.2
0.1eV
-0.014
-0.012
-0.01
-0.008
-0.006
-0.004
-0.002
0.0
0.0
0.2
0.4
0.6
0.8
1.0
1.2
-30 -20 -10 0 10 20 30
0.1eV
0.3eV
0.3eV
Ele
ctri
c po
tent
ial (
v)
Rad
ial E
lect
ric
Fiel
d
Ele
ctri
c po
tent
ial (
v)
Rad
ial E
lect
ric
Fiel
d
a)
b)
Z-axis position
Figure 6. SIMION calculations of the radial electric field and electric potential at 42% of
the ICR cell radius. a) EPIC with -0.2 V applied to the central electrode and 1 volt
applied to the trap electrodes. b) Closed cylindrical cell with 1 volt applied to the trap
electrodes.
157

Figure 7
monoisotopic peak of bradykinin (M+2H)2+ for the pulsed gas and non-pulsed gas
b) non-EPIC conditions, the dotted line represents the second ion injection event only. c) de
potential set at -0.4 V, the dotted line represents the second ion injection event only. e) tential set at -0.4 V, the dotted line represents the first ion injection event
only. The “double trap” experiment is indicated by the solid line, the single ion injection experiment is indicated by the dotted line.
203550
203560
203570
203580
203590
203600
0 0.1 0.2 0.3 0.4 0.5 0.6 0.7 0.8 IIE potential (V)
freq
uenc
y (H
z)
No gas Pulse gas
Figure 7. EPIC experiments a) Comparison of the observed cyclotron frequency for the
experiment with EPIC at different bias potentials applied to the heated cathode.
non-EPIC conditions, the dotted line represents the first ion injection only. d) Catho
Cathode po
100
0.0
33
67
100
203472 203604 203736Frequency (Hz)
100 b)
0.0
33
67
203472 203604 2037360.0
33
67
203472 203597 203721
c)
100
0.0
33
67
203472 203597 203721
d) e)
a)
Frequency (Hz)
158

CHAPTER 6
Restrained Ion Population Transfer: A Novel Ion Transfer Method for Mass
Spectrometry
Abstract
With modern Fourier transform ion cyclotron resonance (FTICR) mass spectrometers the
ion accumulation event takes place in a region of higher pressure which allows ions to be
thermally cooled before being accelerated toward the ICR cell where they are decelerated
and re-trapped. This transfer process induces mass discrimination due to time-of-flight
effects. Also, trapping ions with substantial axial kinetic energy can decrease the
performance of the ICR instrument when compared to the analysis of thermally-cooled
ions located at the trap center. Therefore, it is desirable to limit the energy imparted to
the ions within the ICR cell as well as minimize time-of-flight effects. The approach
presented here for ion transfer called restrained ion population transfer or RIPT is
designed to provide complete axial containment of an ion population throughout the
entire transfer process from the accumulation region to the ICR cell eliminating mass
discrimination associated with time-of-flight separation. This is accomplished by
R cell. Initial ICR data is presented which illustrates the feasibility of RIPT. The
utilization of a number of quadrupole segments arranged in series with independent
control of the dc bias voltage applied to each segment of the quadrupole ion guide. The
dc bias voltage is applied in such a way to minimize the energy imparted to the ions
allowing transfer of ions with low kinetic energy from the ion accumulation region to the
IC
159

technique was also modeled with SIMION 7.0 and simulation results that support our
tudies of the ions transfer process are presented.
Fourier transform ion cyclotron resonance mass spectrometry1 (FTICRMS) is
for the analysis of biological molecules and complex mixtures2-7. In most
le
ificant
g
h
an
ginally
axial
e ICR
ide12,
esult
in significant mass discrimination when ions are pulsed to and trapped in an ICR cell
feasibility s
Introduction:
well-suited
modern FTICR mass spectrometers, ions are created external to the mass analyzer.
External ion production allows for large populations of ions to be accumulated before
transfer to the ICR cell for mass analysis. External ion accumulation has been shown to
improve the signal-to-noise ratio and mass resolving power, and increase the duty cyc
to nearly 100% 8, 9. Ions are typically accumulated inside an ion trap a sign
distance from the ICR cell to allow for multiple stages of differential vacuum pumpin
and reduce interference resultant from fringe magnetic fields produced from the hig
field magnet needed for ICR analysis. Though gated trapping has proven to be
extremely useful technique it is not without limitations. The ions which are ori
trapped in the accumulation region are accelerated toward the ICR cell with no
constraints and are to be decelerated and re-trapped once they reach the ICR cell. A
number of different ion transfer devices have been developed to transfer ions to th
cell, such as, a number of RF multipole devices10, 11, stacked-ring electrostatic gu
charged wire ion guide13, and electrostatic focusing elements14.
In ICR instruments which have external ion sources, there is typically a meter or
more separation in distance between the accumulation region and the ICR cell. This
separation in space leads to time-of-flight dispersion of the injected ions which can r
160

using gated trapping15, 16. Therefore, all m/z species trapped in the accumulation reg
are not equally represented in ICR cell. Pulsed extraction o
ion
f ions to the ICR cell limits
e m/z range that can be detected in a single scan. Therefore, gated trapping may require
ection events with varied trapping delays to sample the entire mass range
of inter
on
d u upole collision cell of a
triple q
th
multiple ion inj
est17. Ions with different m/z ratios will have different optimal ion transfer times.
Another aspect to consider when performing gated trapping of ions in the ICR cell is that
not all ions are pulsed from the accumulation region through the ion guide at the same
time. The length of a multipole ion trap is usually chosen to be much larger than its
width to store a large number of ions without excessive space-charge repulsion. This
results in low penetration of the trapping dc potential field in a multipole storage device
in the central regi of the trap. Therefore, ions of the same m/z but with different axial
position or velocity trapped in the accumulation region will be ejected at slightly different
times, which will reduce the efficiency of gated trapping in the ICR cell. Since the ion
transfer process can result in a loss of ions, longer accumulation times are required. Also,
the rate of ion injection depends on the space-charge repulsion resultant from the total
number of ions present in the multipole ion trap9, 18.
It has been shown that by producing an axial potential gradient inside a multipole
ion trap, the ion exit time distribution can be reduced by an order of magnitude relative to
the application of potentials only to the trapping lenses19. Thomson et. al. investigated
various methods to pro uce axial potential gradients in the q adr
uadrupole instrument to decrease ion transient time while maintaining the same
ion transmission efficiency20. Axial potential gradients have been produced within the
accumulation region through a variety of methods, such as an angled wire arrangement
161

between parallel rods of a multipole19, 21, 22, the introduction of conical multipole rods23,
encasing the multipole with segmented rings24, and by segmenting the multipole rods9, 20.
Though these methods can reduce the ion exit time distribution and increase the number
of ions reaching the ICR cell at the same time, there are still time-of-flight effects present
when trapping a wide m/z range. In the accumulation region of an FTICR instrument,
low energy collisions with background gas can cool ions both internally and
translationally. However, raising the potential of the accumulation cell to push the ions
toward the ICR cell gives ions axial kinetic energy; this can result in the requirement of
larger trapping potentials in the ICR cell. High trap plate potentials increase the ion
capacity in the ICR cell, resulting in the detection of a larger number of ions.16, 25, 26
However, increased trap plate potentials typically increase radial ion ejection26, space
charge frequency shifts27-29, and peak coalescence30, 31 which result in lower quality
spectral data and make the mass calibration less accurate. Longer transients and higher
resolution spectra are more readily attained at lower trap plate potentials32-34. It can be
desirable to perform quadrupolar excitation in the presence of a collision gas once ions
reach the ICR cell, so that ions collect axially near the trap center where there is a near-
perfect quadrupolar electrostatic trapping potential35, 36. However, this results in an
undesirable pumping delay to reestablish an optimal pressure in the ICR cell region
before ion excitation and detection. Thus, it is not suitable when high duty cycle is
required. Ultimately, it would be attractive to trap ions with low initial axial kinetic
energy in the ICR cell which leads to increased instrument performance37.
In this paper we present a novel ion transfer technique, called Restrained Ion
Population Transfer, or RIPT, which provides complete axial containment of the ions
162
from the accumulation region to the ICR cell by controlling their position in the ion
guide. This technique utilizes a number of quadrupole sets arranged in series with each
other. The ion guide has individually controllable dc potentials applied to each
quadrupole set to allow control of the axial position of the ions. A similar approach to
control ion axial position has been used to increase the efficiency of ion transfer through
intermediate pressure regions using individually controllable dc potentials with a stacked
ring ion guide38-40. That technique utilizes a traveling dc wave coupled to a RF stacked
ring collision cell or ion accumulation region to reduce the exit time of a packet of ions
from the cell. With this method the kinetic energy of the ions can be reduced by slowing
down the waveform and allowing more time for ions to collide with neutral gas
molecules. The rate at which the traveling dc potential wave moves through cell does not
allow time for the ions to oscillate between waveforms (~300m/s); therefore, the ions are
typically located at the leading edge of the waveform as they are pushed through the
device. Each voltage step will cause an increase in ion kinetic energy which is then
offset by collisions with neutral molecules. Unfortunately, FTICR measurements are
done at pressures orders of magnitude lower than the technique mentioned above. Thus
for every voltage step there are few ion neutral collisions to minimize the kinetic energy
imparted to the ions as in the previous method.
To overcome this problem, our dc ramp sequence is designed to limit the amount
of energy distributed to the ion, without needing a collision gas to continually cool the
ions. The rate at which the ions move through the ion guide is also much slower
10m/(< s) which allows the ions to oscillate within each quadrupole segment which is
crucial in minimizing the kinetic energy imparted to the ions. Our technique is designed
163

to offer an alternative ion transfer technique under ultra-high vacuum conditions needed
for FTICRMS. However, this ion guide could be used in any type of mass spectrometer
to transfer ion packets with low kinetic energies. Instead of pulsing the ion packet out of
the accumulation region, which introduces time-of-flight m/z discrimination and requires
re-trapping of the ions at the ICR cell, we maintain complete containment of the ion
packet throughout the entire ion transfer process. This technique eliminates time-of-
flight effects associated the ion transfer process by injecting all ions in the ICR cell at the
same time, as well as minimizes axial kinetic energy imparted to the ions.
Experimental:
SIMION SIMULATIONS:
Ion trajectory modeling was performed with SIMION 7.0 software (SIMION 7.0
3D, version 7.0, D.A. Dahl. Idaho National Engineering Laboratory, Idaho Falls, ID)
running on a 2.80 GHz Pentium 4 PC with 768 MB RAM. For the simulation, nine
quadrupoles were arranged in series. Each of the quadrupole segments was 200 mm in
length, with a 6 mm space between each segment. Simulations were run at two different
settings; RF voltage amplitude = 500 Vp-p, and frequency, Ω/2π = 1.6 MHz, and RF
voltage = 220 Vp-p and frequency 860 kHz. The initial ion kinetic energy (mass-to-
charge ratio, m/z = 2,000, 1,000, and 400) was set at 0.1 eV for all simulations. The final
kinetic energy, ion time-of-flight, and final ion z-axis position were recorded when the
ion reached the end of the last quadrupole segment. Ions were created with 0.1 eV of
164

kinetic energy at the entrance of the ion guide on the central axis with various initial
angles (within 4o of center in both the x and y direction). After an initial delay period
which allowed time for the ions to reach the second segment (1-2 ms), the dc bias applied
to the first segment was ramped up to trap the ions. The ions are trapped in a region of
the ion guide created by a low dc bias voltage applied to quadrupole segment (x) and a
higher dc voltage bias applied to the quadrupole segments on either side. Throughout all
simulations, the low dc bias voltage was set at 0 V, and the high dc bias voltage was set
at 10 V unless otherwise noted. Ion transfer is accomplished by the application of a dc
ias voltage ramp on quadrupole segments (x+1) and (x-1) while maintaining segment x
RF voltage applied to all segments. At the start of each ramp cycle, the
itial bias voltage applied to segment (x) and (x-1) was at 0 V, all other segments were
V. Ions are transferred through the ion guide by holding
gment (x) at 0 V and then simultaneously raising the voltage bias on segment (x-1)
until it
b
at 0 V, the same
in
held at a bias voltage of 10
se
reaches 10 V and lowering the voltage bias on segment (x+1) until it reaches the
same voltage bias as segment (x). The rates at which the voltages on the quadrupole
segments are raised and lowered were varied to investigate the effects that the ramp times
have on the ion kinetic energy as they exit the ion guide. Each ion trajectory was
simulated individually; ion-ion Coulombic repulsion was not included in these
simulations. The overall goal of the simulations was to determine the effects that the dc
ramping rates have on the resultant ion kinetic energy, which to a first approximation, are
independent of ion-ion repulsion. Experimentally, long accumulation times may result in
excessive ion-ion repulsion causing discrimination against higher charge states and lower
m/z species41.
165

INSTRUMENTATION:
All peptides were purchased from Sigma (St. Louis, MO). They were dissolved
in a solution of 49:49:2 by volume of methanol, water, and acetic acid and diluted to 10
μM. Electrospray was used as the ionization source. A syringe pump was used to infuse
the sample at a rate of 0.4 μL/min. Approximately 2.6 kV was applied to the spray
solution through a metal union. Ions entered the vacuum system through a flared inlet
metal capillary42, 43. The FTICR mass spectrometer developed in our laboratory will be
described in full detail in CHAPTER 7. Ions were accumulated in the first quadrupole
region of the instrument at a pressure of 7.9x10⁻³ Torr. The RIPT quadrupole shown in
Figure 1 was divided into 19 segments 3” long. The gaps between the segments were
0.20”. The total length of the ion guide was approximately 61”. The spacers in the high
vacuum region (6x10⁻⁶ Torr) were constructed out of Ultem, and the spacers in the ultra
high vacuum region <1x10⁻⁶ Torr were constructed out of Macor. The quadrupole was
constructed with a solid 0.25” aluminum rod that runs the entire length of the ion guide.
4-40 vented bolts which thread into the aluminum rods are used to secure the rods against
the spacers. The RF voltage is applied directly to these aluminum rods. Aluminum tube
0.27” I.D. and 0.38” O.D are placed over these solid rods. Small mylar sheets were
rolled up and placed between the solid aluminum rods and aluminum tubes. The mylar
sheet acted as an insulator between the surface of the rod and the tube to allow separate
dc voltages to be applied to each tube and capacitive coupling of RF to each segment.
The RF voltage was coupled from the rods to the tubes at approximately 75 – 80%
166
efficiency. Kapton wire was used to carry the electric potential from the feedthrough to
tial split through 2 resistors (1 MΩ) in parallel, one for each
hase of RF. The dc potential was applied to each of the tubes through a terminal held in
to
it
e
e
The
r
S
or
each segment. The poten
p
place with a 2-56 screw that was threaded into the aluminum tube; there were screws at
each end of the tubes to secure the tubes tight to the aluminum rods. These bolts are also
used to secure the tubes in place. The RF voltage applied directly to the rods was 400 Vp-
p at a frequency of 600 kHz. The ions then pass through a 2mm conductance limit in
the RIPT quadrupole ion guide. There are 5 dc sections before the next conductance lim
of 4mm and then another 3 sections before the last conductance limit of 5mm. There is
an aluminum plate at the end of the quadrupole rods with a 6mm hole. To transfer ions,
the first dc voltage profile was coupled to the first three segments. The following dc
voltage profiles were coupled to two segments each. There were a total of eight voltage
biases. The last two segments were held at ground.
The ion signal was initially detected using an electron multiplier located at th
end of the quadrupole rods in which the pressure was 1x10⁻⁷ Torr. The detector respons
from the electron multiplier was recorded using a Tektronix THS 730A oscilloscope
(Beaverton, OR). After the initial testing phase was complete a closed cylindrical ICR
cell was secured at the end of the quadrupole rods for mass detection of the transferred
ions. MIDAS44 was used as the data acquisition software the FTICR parameters.
timing and voltage generation for the RIPT program were located on a separate compute
(National Instruments board PCI-6723) and initiated with a TTL pulse from the MIDA
data station. ICR-2LS45 was used for all data analysis. The pressure at the detect
during ICR experiments was ~3x10⁻⁹ Torr.
167

Results and Discussion:
SIMION SIMULATIONS:
The objective behind development of a segmented quadrupole for ion transfer
from the accumulation region to the ICR cell is to eliminate any time-of-flight effects
associated with the ion transfer process while minimizing the axial kinetic energy that
distributed to the ions. SIMION modeling was performed to investigate how the kinetic
energy of the ions would be altered in the absence of ion-neutral collisions during th
transfer process. The actual ion transfer processes would have limited ion-neutra
collisions; this factor may cause slight deviations in experimental RIPT results and
presented simulations. The simulations illustrate that an ion oscillates a number o
periods within the trapping region of the ion gu
is
e
l
the
f
ide throughout the transfer process.
tant potential) will experience no change in
Figure 2a provides a visual representation of how an ion will oscillate while being
transferred through the ion guide by plotting the z-axis position as a function of time.
Once an ion becomes trapped in a segment it oscillates back and forth while its total
energy remains constant. However, when an ion is being transferred from one segment to
the next it is possible for the ion to gain or lose energy. This can be seen in Figure 2a by
looking at the number of oscillations that occur within a given segment and in Figure 2b
which shows the kinetic energy. As the ion kinetic energy increases, the number of
oscillations increases. An ion can be located in one of three possible segments, one that
has its dc voltage bias staying constant (x), ramping up (x-1), or ramping down (x+1).
Ions located in segment x (held at a cons
168

energy. However, when an ion is located within segment (x-1) in which the dc bias
ion will gain potential energy. Conversely, when an ion is
cated in segment (x+1) on which the dc bias voltage is decreasing, the ion will lose
illustrates how the voltage ramps affect the potential energy
of an io
voltage is increasing, the
lo
potential energy. Figure 3
n as it moves through the ion guide. For an ion to proceed from segment (x) to
(x+1) or (x-1) during the ramp sequence, it may have to overcome a potential energy
barrier. After an ion enters one of these ramping segments its kinetic energy is conserved
while traversing that segment; however, its potential energy will change resulting in a net
change in total energy. The kinetic energy in Figure 2 can be matched against the height
of the observed potential energy well formed by the ion in Figure 3. The higher the
kinetic energy, the higher the ion moves up the potential energy well. The correlation of
the two ramps is important in limiting the amount of energy imparted to the ions. For
example, if only the bias voltage on the x-1 segment was ramped up and the voltage bias
on the x+1 segment was dropped instantaneously, then there would be a larger probability
in a net gain of energy. That is, there would be a much greater chance for an ion to be
located in the x-1 segment being ramped up than located at the x+1 side of the trapping
well when the voltage bias on segment x+1 is dropped instantaneously. Therefore, it is
important to understand how the change in the voltage bias can affect the ion kinetic
energy as it travels through the ion guide.
The ramp times and high dc bias voltage were changed to investigate how the
kinetic energy is affected. The results are shown in Table 1. The results indicate that as
the ramp time increases and the dc bias voltages are lowered, the amount of kinetic
energy imparted to the ions is decreased as they exit the RIPT ion guide. In both cases,
169

either changing the ramp time while holding the high dc potential constant or by holding
the ramp time constant and changing the high dc potential, the rate (V/ms) of the dc bias
is being changed. This would indicate that going to higher dc potentials would result in
longer ramp times to achieve comparable ion kinetic energy. In Table 1, a ramp time of
10 ms at 5 V in the first column is comparable to a ramp time of 20 ms at 10 V in the
second column; both had a voltage ramp rate of 0.5 V/ms. Since the time it takes for an
ion to traverse a segment is small relative to the time during which the bias voltage is
ramped, the energy imparted to the ions can be minimized. By increasing to longer ramp
times or decreasing the high dc bias potential, the rate of the voltage ramp is decreased,
which decreases the change in voltage experienced per ion oscillation. When the voltage
on either segment (x+1 and x-1) is larger than the ion kinetic energy, the ions do not
penetrate into either segment and oscillate without change in total energy, (as seen in
Figure 3 part D). The most critical time of the transfer event is when the kinetic energy
of the ion is similar to the value of the voltage being applied to the ramped segments and
the ion is able to overcome the potential energy barrier. If the ramping rate is too fast, a
wider distribution of ion kinetic energy results and there is a greater possibility for ions to
be lost from the trapping region. Increasing the ramp rate by making the ramp times
longer or lowering the high voltage minimizes the total energy distributed to the ions.
The modeling results suggest optimal conditions can be achieved by orchestrating the two
ramps so energy imparted to the ions is effectively offset by energy removed from the
ions through ramping of the voltage bias. Additionally, simulation of ions of different
m/z values (400, 1000, and 2,000) had the same kinetic energy distribution under the
same ramp conditions. Simulations were performed at two different settings; (RF
170

voltage 220 Vp-p, 860 kHz) and (RF voltage 500 Vp-p, 1.6 MHz). There was no difference
in the final kinetic energy distribution between the two simulation settings. The two
settings were carried out to see if the RF voltage or frequency had any effect on the ion
kinetic energy. The total time it took for ions of different m/z values to traverse the ion
guide was entirely dependent upon the ramp times used (31.3ms for a 5ms ramp: 61.9ms
for a 10ms ramp: 133.4 ms for a 20ms ramp). These simulations indicate that the use of
ramp times of approximately 20 ms or greater with <10 V potential well results in
minimized kinetic energy imparted to the ions.
ION GUIDE EXPERIMENTAL RESULTS:
A dc voltage program was written in Visual Basic to support this study and is
flexible in the type of voltage ramp profile that can be produced. Figure 4 is an example
of a typical voltage ramp profile that can be generated. The first voltage profile is the
voltage applied to the first segment with respect to time, and the second voltage profile is
the voltage applied to the second segment with respect to time. The first waveform starts
at a low potential to allow ions accumulated in the front quadrupole to enter the RIPT ion
guide. There is a time period when both the first and second segments are held at the
same low voltage potential. During this time period, the ions are able to move freely
through both the first and second segments. The dc potential on the first segment is
slowly increased (on the order of ms time scale) to allow the trapped ions to move
exclusively into the second segment. A voltage applied to the conductance limit at the
entrance to the RIPT ion guide stops ions from continually entering the device. Ions are
171

then trapped between the first and third segment. In this way the ions can be transported
one segment at a time to the mass analyzer.
The initial cooling of ions through collisions with neutral gas molecules before
entering the multipole device will focus the ions axially toward the center of the
quadrupole segments. This cooling also reduces the kinetic energy in the axial direction
and leads to significant increase in ion travel time through the instrument. Also, keeping
the ions contained by transferring them one segment at a time increases the time period
for ion transfer compared to having the entire ion packet pulsed to the mass analyzer. ~2-
ms for gated trapping compared to ~300 ms with RIPT. However, it is possible to have
usly. Thus, while one ion packet is being
ccumulated multiple ion packets could be moving toward the mass analyzer while
anothe
5
multiple potential wells present simultaneo
a
r ion packet could be analyzed in the ICR cell. The accumulation process can start
again once the ion packet has been moved into the first segment and the potential to the
conductance limit which serves as the entrance to the ion guide is increased. We have
been able to simultaneously move three ion packets through the ion guide with our
current setup of 8 voltage profiles. For experiments that involve rapid chromatographic
separations, or the implementation of strategies like selective accumulation46 or gas phase
fractionation47, this capability to simultaneously transfer several populations of ions to
the mass spectrometer will be extremely useful.
The feasibility of ion transfer via a contained packet was first tested with an
electron multiplier outside the magnetic field. The ability to transfer ions with RIPT is
shown in Figure 5a. This indicates that we are able to effectively trap and transport ions
as a restrained ion population through the RIPT ion guide. There is no time-of-flight with
172

this technique, since there is a constant axial constraint on the ions. The ions remain
trapped in a voltage well through the entire transfer process. Results shown in Figure 5b
indicat
ding magnetic force, thus the trajectory
of an io
e the ion kinetic energy as they exit the ion guide. The voltage well in this
experiment had a high of 20 volt and a low of -10 volt, and the voltage applied to the last
two segments was varied. The ramp time was set at 30ms. The ions exited the ion guide
when the voltage bias to the last well was approximately 1 volt higher than the bias
applied to the last two segments. This indicates that the trapped ions are not gaining
kinetic energy during the transfer process.
There is one point worth further consideration. In order to transfer ions from near
zero magnetic field strength to the high magnetic field region required for ICR analysis,
they must pass through the fringe magnetic fields. Ions not directly on the central axis of
the solenoid are subjected to an impeding force (magnetic mirror effect) as they pass into
the high field region of the magnet48. A rf quadrupole device has been successfully used
to transport ions through the fringe fields for many years49. As indicated by McIver, this
successful transmission is due to the quadrupole focusing of ions into a beam with less
than a millimeter radius. When this beam is correctly aligned along the axis of the
magnet, the decelerating force which causes the magnetic mirror effect is equal to zero.
Also, calculations by McIver et al. showed that the electrical force from the quadrupole is
several orders of magnitude greater than the impe
n is determined primarily by the operating conditions of the quadrupole50.
The RIPT ion guide is able to successfully transport a contained ion packet from
the accumulation region through the magnetic field to the ICR cell. The ramp function
used to transport ions is shown in Figure 6a. Ions were accumulated in the front
173

quadrupole for 0.1 seconds before transfer to the RIPT ion guide. The voltage ramp-
down and ramp-up were both 15 ms. The resulting mass spectrum of the ions transferred
with RIPT is shown in Figure 6b. To ensure that ions were not continually entering the
RIPT ion guide the voltage applied to the first conductance limit was raised to10 V once
the voltage bias to the first RIPT segment reached its high value. The kinetic energy of
the ions entering the ICR cell was approximated by changing the voltage to the back trap
plate of the ICR cell. If the voltage applied to the back trap plate was too low then ions
with larger kinetic energy entering the ICR cell would not be trapped. Gated trapping can
be pref
ltages
to each
ormed with the RIPT ion guide by holding all the dc segments at 0 V, and biasing
the accumulation quadrupole to ~7 V. For the same relative ion intensity the back trap
plate was typically 3-4 volts lower with RIPT. Thus, the kinetic energy of the ions
entering the ICR cell is smaller than one might encounter with gated trapping alone. It
should be noted that the absolute ion intensity was slightly greater using gated trapping
when compared to RIPT. The ion transfer process with RIPT allowed us to keep the
potentials applied to the trap plates low during ion detection, which is advantageous for
collecting quality spectra.
The distribution of m/z species with RIPT and with gated trapping is shown in
Figure 7. For the gated trapping ions are accumulated in the front quadrupole for 0.1 s
by applying 10 v to the first conductance limit. To eject the ions the front quadrupole
was biased to 7 v, and the first conductance limit is dropped to ground. The bias vo
of the RIPT segments were set to 0 volts. Data in Figure 7a was acquired with a
3 ms time period between ion ejection from the accumulation quadrupole and raising the
front trap plate of the ICR cell while Figure 7b has a time period of 2 ms. The difference
174

in time-of-flight between high or low m/z species results in a dispersion of ions. These
results indicate that by defining a set flight time for an experimental setup, discrimination
against high or low m/z species will occur. These spectra are compared to a spectrum in
which RIPT was used to transfer ions from the accumulation region to the ICR cell. This
result is shown in Figure 7c. The transfer parameters were the same as those shown in
Figure 4, with an initial ion accumulation time period of 0.1 s. With the RIPT transfer
method the observed intensity appear to be an average of those observed with short (2ms)
and long (3ms) ion transfer conditions shown in Figure 7a & b. Importantly, these data
show the ability to simultaneously detect low m/z and high m/z species.
175

Conclusions
We present a novel approach for ion transfer, RIPT, which has been created as
part of a novel FTICR mass spectrometer under development in our lab. This ion transfer
process allows for the transfer of low axial kinetic energy ion packets from the
accumulation region to the ICR cell while imparting little axial kinetic energy to the ions.
The transfer process was modeled with SIMION 7.0 to demonstrate the ability to
minimize axial kinetic energy imparted to the ions with optimal ramping functions.
Initial testing of the ion guide was carried out to demonstrate the feasibility of
transferring ions in a restrained ion population. This approach should eliminate any mass
discrimination due to time-of-flight effects, since all ions initially trapped in the
accumulation region remain confined axially and are deposited directly into the ICR cell
for mass analysis. Though the ion guide transfers ions at a slower rate, the ability to
create multiple trapping regions in the ion guide should allow the duty cycle of the
instrument to remain relatively unchanged. Also, the analysis of ions with lower axial
kinetic energy leads to lower applied trap plate potentials.
Acknowledgments
We greatly apprciate the National High Magnetic Field Labortory to lone us a MIDAS
data station to carry out ICR experiments. This material is based upon work supported by
the National Science Foundation under Grant No. 0352451; Murdock Charitable Trust;
176

Office of Science (BER), U. S. Department of Energy, Grant No. DE-FG02-04ER63924,
al Institutes of Health Biotechnology Training Grant.
References
Analytical Chemistry 2000; 72: 1918
M, Costello CE, O'Connor PB. Journal of the American Society for Mass
American Society for Mass Spectrometry 1997; 8: 970
9. Belov ME, Nikolaev EN, Anderson GA, Udseth HR, Conrads TP, Veenstra TD, l Chemistry 2001; 73: 253
0. Huang Y, Guan S, Kim HS, Marshall AG. International Journal of Mass Spectrometry and Ion Processes 1996; 152: 121
er RT, Jr. International Journal of Mass Spectrometry and Ion Processes 1989; 87: R7
;
and the Nation
1. Comisarow MB, Marshall AG. Chemical Physics Letters 1974; 25: 282
2. Masselon C, Anderson GA, Harkewicz R, Bruce JE, Pasa-Tolic L, Smith RD.
3. Kelleher NL, Zubarev RA, Bush K, Furie B, Furie BC, McLafferty FW, Walsh CT. Analytical Chemistry 1999; 71: 4250
4. He F, Emmett MR, Hakansson K, Hendrickson CL, Marshall AG. Journal of Proteome Research 2004; 3: 61
5. Little DP, Speir JP, Senko MW, O'Connor PB, McLafferty FW. Analytical Chemistry 1994; 66: 2809
6. Sze SK, Ge Y, Oh H, McLafferty FW. Proceedings of the National Academy of Sciences of the United States of America 2002; 99: 1774
7. Jebanathirajah JA, Pittman JL, Thomson BA, Budnik BA, Kaur P, Rape M, Kirschner
Spectrometry 2005; 16: 1985
8. Senko MW, Hendrickson cL, Emmett MR, Shi SDH, Marshall AG. Journal of the
Masselon CD, Gorshkov MV, Smith RD. Analytica
1
11. Lebrilla CB, Amster IJ, McIv
12. Guan S, Marshall AG. Journal of the American Society for Mass Spectrometry 19967: 101
13. Limbach PA, Marshall AG, Wang M. International Journal of Mass Spectrometry and Ion Processes 1993; 125: 135
177

14. Van Vaeck L, Van Espen P, Gijbels R, Baykut G, Laukien FH. European Journal of Mass Spectrometry 2000; 6: 277
15. Beu SC, Hendrickson CL, Marshall AG. 53rd ASMS Conference on Mass Spectrometry and Allied Topics, San Antonio, TX, 2005.
6. Patrie SM, Charlebois JP, Whipple D, Kelleher NL, Hendrickson CL, Quinn JP, Marshall AG, Mukhopadhyay B. Journal of the American Society for Mass
2006;
for
.
23. Mansoori BA, Dyer EW an K, Boyd RK. Journal of the American
24. Th
etry 2005;
30. Mi iew. E. Statistical Physics, Plasmas, Fluids, and Related Interdisciplinary Topics 1995; 52: 4366
1
Spectrometry 2004; 15: 1099
17. Wong RL, Amster IJ. Journal of the American Society for Mass Spectrometry17: 205
18. Belov ME, Nikolaev EN, Harkewicz R, Masselon CD, Alving K, Smith RD. International Journal of Mass Spectrometry 2001; 208: 205
19. Wilcox BE, Hendrickson CL, Marshall AG. Journal of the American Society Mass Spectrometry 2002; 13: 1304
20. Javahery G, Thomson B. Journal of the American Society for Mass Spectrometry 1997; 8: 697
21. Loboda A, Krutchinsky A, Loboda O, McNabb J, Spicer V, Ens W, Standing KEuropean Journal of Mass Spectrometry 2000; 6: 531
22. Taban IM, McDonnell LA, Roempp A, Cerjak I, Heeren RMA. International Journal of Mass Spectrometry 2005; 244: 135
, Lock CM, BatemSociety for Mass Spectrometry 1998; 9: 775
omson BA, Jolliffe CL. PCT Int. Appl., 9707530, 1997.
25. May MA, Grosshans PB, Marshall AG. International Journal of Mass Spectrometry and Ion Processes 1992; 120: 193
26. Arkin CR, Laude DA. Journal of the American Society for Mass Spectrom16: 422
27. Easterling ML, Mize TH, Amster IJ. Analytical Chemistry 1999; 71: 624
28. Francl TJ, Sherman MG, Hunter RL, Locke MJ, Bowers WD, McIver RT, Jr. International Journal of Mass Spectrometry and Ion Processes 1983; 54: 189
29. Ledford EB, Jr., Rempel DL, Gross ML. Analytical Chemistry 1984; 56: 2744
tchell DW, Smith RD. Physical Rev
178

31. Naito Y, Inoue M. Journal of the Mass Spectrometry Society of Japan 1994; 42: 1
32. Easterling ML, Pitsenberger CC, Kulkarni SS, Taylor PK, Amster IJ. International
33. Stults JT. Analytical Chemistry 1997; 69: 1815
34. Sh of f America 1998; 95: 11532
: 2161
753
37. Gorshkov MV, Masselon CD, Anderson GA, Udseth HR, Harkewicz R, Smith RD.
38. Giles K, Pringle SD, ildgoose JL, Bateman RH. Rapid
39. Colburn AW, Giannakopulos AE, Derrick PJ. European Journal of Mass
40. Batem
ass
42. W , Anderson GA. Journal of the 2006; 17: 772
45. Anderson GA, Bruce J.E., Smith R.D. ICR-2LS, Richland, WA, 1996.
R.
s: New York, 1984;
Journal of Mass Spectrometry and Ion Processes 1996; 157/158: 97
i SDH, Hendrickson CL, Marshall AG. Proceedings of the National AcademySciences of the United States o
35. Guan S, Kim HS, Marshall AG, Wahl MC, Wood TD, Xiang X. Chemical Reviews 1994; 94
36. Guan S, Wahl MC, Wood TD, Marshall AG. Analytical Chemistry 1993; 65: 1
Journal of the American Society for Mass Spectrometry 2001; 12: 1169
Worthington KR, Little D, WCommunications in Mass Spectrometry 2004; 18: 2401
Spectrometry 2004; 10: 149
an RH, Pringle S, Giles K. Eur. Pat. Appl., 1378930, 2004.
41. Belov ME, Gorshkov MV, Alving K, Smith RD. Rapid Communications in MSpectrometry 2001; 15: 1988
u S, Zhang K, Kaiser NK, Bruce JE, Prior DCAmerican Society for Mass Spectrometry
43. Prior DC, Price J, Bruce JE. U.S. Patent 6,455,8646, 2002.
44. Senko MW, Canterbury JD, Guan S, Marshall AG. Rapid Communications in Mass Spectrometry 1996; 10: 1839
46. Bruce JE, Anderson GA, Smith RD. Analytical Chemistry 1996; 68: 534
47. Yi EC, Marelli M, Lee H, Purvine SO, Aebersold R, Aitchison JD, Goodlett DElectrophoresis 2002; 23: 3205
48. Chen FF. Introduction to Plasma Physics and Controlled Fusion,. Plenum Pres
49. McIver RT, Jr., Hunter RL, Bowers WD. International Journal of Mass Spectrometry and Ion Processes 1985; 64: 67
179

50. McIver RT, Jr. International Journal of Mass Spectrometry and Ion Processes 1990; 98: 35
180

1 Figure
Figure 1. A visual representation of the experimental set-up that was used to measure ion
current. C1, C2, C3 are the conductance limits in the RIPT ion guide. The inset
illustrates one segment from the ion guide assembly to show how the outer aluminum
tubes and inner aluminum rods are coupled.
Rod O.D. 0.25”
0.27” Tube
3.81”
Al Tube
Aluminum rod
Macor Spacer
0.25”RF
DC Potentials
Mylar sheet
Front quad RIPT Quad closed
cylindrical cell C1 C2 C3
181

Figure 2
0
10
20
30
40
50
60
70
0 20 40 60 80 100 120 140 160 180 200
Tim
e (m
s)
Position along z-axis (cm)
igure 2. SIMION trajectory results for a single ion (m/z 1,000, with an initial KE of 0.10 V, 10 V for the high dc bias potential, and a 10 ms rise time) is shown throughout the ansfer process in the ion guide. A) Plots the position of the ion at every 250 μs time oint. The ion guide segments are shown and numbered at the top of the figure. The ion nters the ion guide through segment 1. The ion is transferred into a new segment every 0 ms, as indicated by its position. B) Plots the KE for the same time points taken above. nce an ion becomes trapped in a segment its kinetic energy remains constant. The few oints scattered around at lower KE potentials at the edge of the segments is because the n is located on the edge of the potential well, and its kinetic energy is converted into
otential energy.
0
0.8
1.0
1.2
1.4
1.6
0 100 120 140 160 180 200position along z-axis (cm)
ergy
(eV
) A)
B)
0.2
0.4
0.6
0 20 40 60 8
Kin
etic
En
Fetrpe1Opiop
182

Figure 3
Figure 3. The ion’s potential energy trace is plotted for the same ion trajectory in Figure
2. The ion guide segments are numbered; the ions enter the ion guide through segment 1.
A number of time points are chosen to describe the ion at that position. A. Ion oscillates
in the first trapping region at 0.1eV. B. The voltage bias on the sixth segment increases
while the ion is located in the sixth segment. C. The ion’s KE is the same as it was at
point B, however the potential energy increased resulting in a net gain of energy. D. The
ion oscillates at a new energy value in the seventh segment. E. Much of the ion’s energy
has been converted into potential energy as it has just enough energy to overcome the
potential energy barrier to reach the eighth segment. F. The ion’s KE is the same as it
was at point E, however, the decrease in bias voltage of the seventh segment resulted in a
loss of potential energy.
12 34567 8 9 Po
tent
ial E
nerg
y
Position along z-axis
Ion start
Ion exit A B
C
D
E
F
183
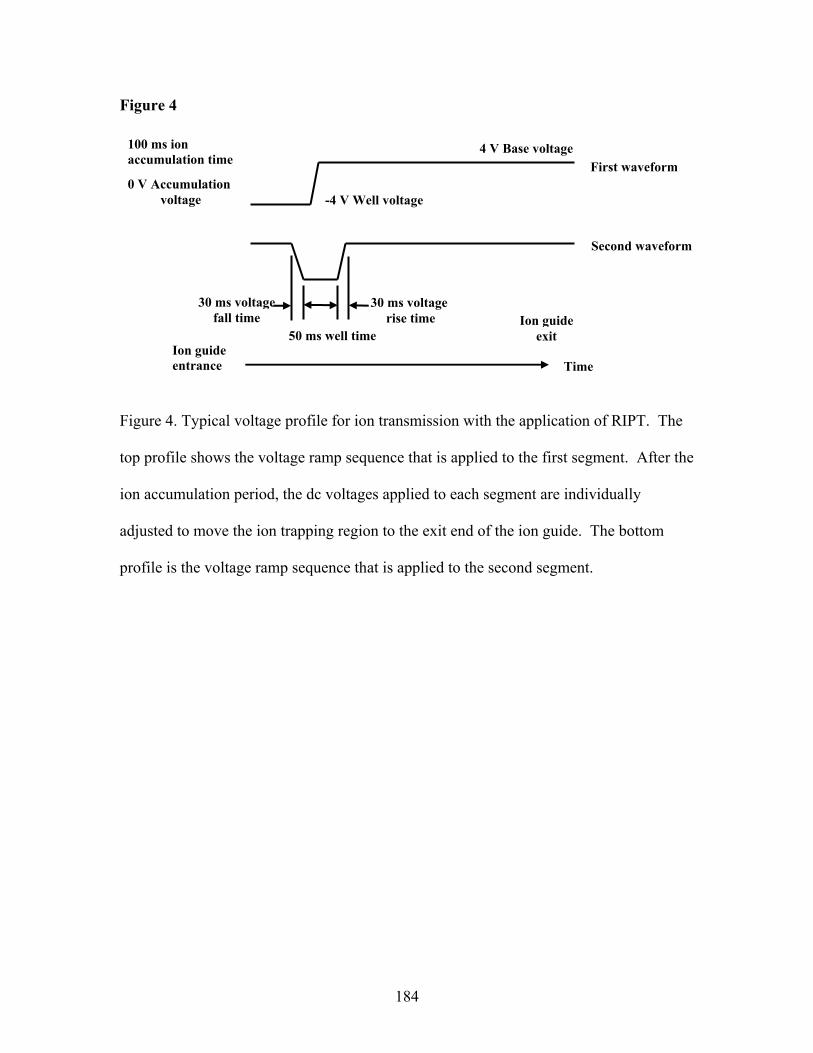
Figure 4
Figure 4. Typical voltage profile for ion transmission with the application of RIPT. The
top profile shows the voltage ramp sequence that is applied to the first segment. After the
ion accumulation period, the dc voltages applied to each segment are individually
adjusted to move the ion trapping region to the exit end of the ion guide. The bottom
profile is the voltage ramp sequence that is applied to the second segment.
100 ms ion accumulation time
-4 V Well voltage
4 V Base voltage
0 V Accumulation voltage
30 ms volta
First waveform
Second waveform
ge fall time
30 ms voltage rise time
50 ms well time
Time Ion guide entrance
Ion guide exit
184

Figure 5
the
Figure5. The ions exit the ion guide as the voltage applied to the second to last segment
nears the bias voltage applied to the last segment of the ion guide. The bias voltage to
last segment was varied. Ion current was measured with the electron multiplier, the
current was scaled so that it could be on the same scale as the voltage ramp.
-15
-10
-5
0
5
-0.1 0.0 0.1time
Vol
10
15
20
25
tage
-20 -15 -10 -5 0 5
10 15 20 25
-0.5 -0.4 -0.3 -0.2 -0.1 0 0.1time (s)
A)
B)
10V bias x 50 last potential well 5V bias x 10 0V bias x 5
185

Figure 6
Figure 6. RIPT results A) The applied voltage profile to the first, seventh, and eighth
voltage wells. B) The resulting mass spectrum of a peptide mixture consisting of
bradykinin, substance p, and oxytocin.
-6
-4
-2
0
2
4
6
8
-0.15 -0.10 -0.05 0.00 0.05 0.10 0.15 Time (s)
Vol
tage
(v)
A)
B)
33
67
100
Rel
ativ
e m
agni
tude
0 487.63 712.53 937.43 1162.3 1387.2
m/z
186

Figure 7
Figure7. Mass spectra of a mixture of bradykinin, melittin, and insulin. A) Ions were
accumulated in the ICR cell with gated trapping with a flight time of 3 ms. B) Gated
trapping with a 2 ms flight time. C) Ions were accumulated with the RIPT method.
470.74 856.72 1242.7 1628.6 2014.6
3 ms
2 ms
Rel
ativ
e m
agni
tude
R
elat
ive
mag
nitu
de
100
67
33
0
100
67
33
0
67
33
0
A)
B)
RIPT
Rel
ativ
e m
agni
tude
100 C)
m/z
187
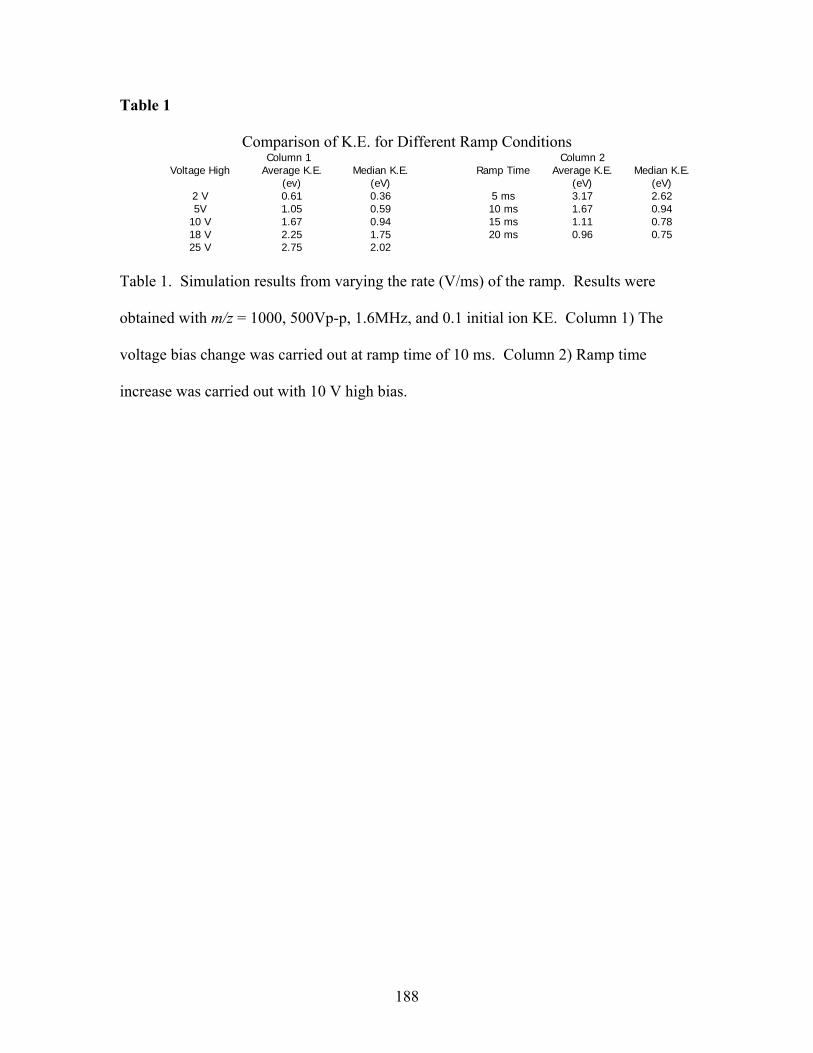
Table 1
Comparison of K.E. for Different Ramp Conditions Column 1 Column 2
Voltage High Average K.E. (ev)
Median K.E. (eV)
Ramp Time Average K.E. (eV)
Median K.E. (eV)
2 V 0.61 0.36 5 ms 3.17 2.62 5V 1.05 0.59 10 ms 1.67 0.94
10 V 1.67 0.94 15 ms 1.11 0.78 18 V 2.25 1.75 20 ms 0.96 0.75 25 V 2.75 2.02
Table 1. Simulation results from varying the rate (V/ms) of the ramp. Results were
obtained with m/z = 1000, 500Vp-p, 1.6MHz, and 0.1 initial ion KE. Column 1) The
voltage bias change was carried out at ramp time of 10 ms. Column 2) Ramp time
increase was carried out with 10 V high bias.
188

CHAPTER 7
A Novel Fourier Transform Ion Cyclotron Resonance Mass Spectrometer for
Biomolecule Analysis Abstract
A novel Fourier transform ion cyclotron resonance FTICR mass spectrometer has been
developed for improved biomolecule analysis. The instrument incorporates a flared
metal capillary and an electrodynamic ion funnel for improved ion transmission in the
source region of the instrument. A novel ion guide called Restrained Ion Population
Transfer, or RIPT, is used to transfer ions from the ion accumulation region to the ICR
cell. The RIPT ion guide reduces the mass discrimination that may occur due to time-of-
flight during gated trapping, and is able to transfer ions with lower kinetic energy to the
ICR cell. A novel ICR cell called, Trapping Ring Electrode Cell, or TREC is employed
for ion current detection. With TREC the trapping electric fields can be tailored to
reduce de-phasing of the coherent cyclotron motion of an excited ion packet. With
TREC we are able to observe a 4X improvement in resolution. The increase in signal
uration with TREC results in an enhancement in the signal-to-noise ratio. d
189

Introduction
Mass spectrometers have becom indispensabl in the of prote cs.
ith the desire to understand biology and analyze lower abundant proteins in the
urier
nce
It has
nents in a complex mixture in a single
spectrum [8, 9]. To attain the high performance capabilities of FTICR-MS there is a
trade off in time, because every aspect of FTICR-MS increases with longer acquisition
periods [10]. However, this depends on the ability to detect an observable signal for the
entire data acquisition period. There are a number of factors which cause the observed
signal to rapidly decay [11]. Many of these factors which cause ion could de-phasing are
associated with the requirement to confine the ions to a finite space for analysis.
There are a number of advantages to increasing the magnetic field strength such
as the data acquisition period decreases linearly for a defined resolution (increased
cyclotron frequency), and upper mass limit and the maximum number of ions increase
quadradically [12-14]. Also, the number of ions needed for have peak coalescence to
occur decreases inverse-quadradically with magnetic field strength [15]. These
parameters are especially critical for top-down proteomic experiments [16-18]. To
observe ion signal for a period of time ions need to be confined parallel to the magnetic
field by electric fields [19]. There are a number of idealized electric fields which the ICR
e an e tool area omi
W
proteome, more accurate and sensitive instruments are required [1, 2]. A Fo
transform ion cyclotron resonance FTICR [3, 4] instrument is the highest performa
mass spectrometer in terms of resolution and mass measurement accuracy [5-7].
the ability to measure thousands of compo
190

cell struggles to produce, rf potential parallel to the magnetic field, and a three
adrupolar potential along the axis of the ICR cell [20]. There is typically
trade-off in the type of electric field produced. A large number of ICR cell designs
most
etries in use today are designed to produce infinity long excite
otentials [23, 24].
ctrospray was successfully coupled to a FTICR mass spectrometer by
cLafferty and coworkers for analysis of large molecules [25, 26]. With external
r
ICR
se
ally
e
e
e
TICR
, ions
ich
the trap plate
the threshold of z-axis kinetic energy of the trapped ions will result in a
ss of ions from the ICR cell and a decrease in sensitivity [34]. Therefore, to reach low
apping potentials ions are usually cooled with a pulse valve event or a slow reduction of
dimensional qu
a
have been developed to target one or more of these electric fields [21, 22]. The
common ICR cell geom
p
Ele
M
ionization sources, ions are usually accumulated outside the magnetic field to allow fo
differential pumping to produce an ultra high vacuum (UHV) required for FT
analysis. Accumulation of ions external to the ICR cell has been shown to increa
sensitivity [27]. With external ion accumulation some form of gated trapping is typic
used to trap ions within the ICR cell [28, 29]. This transfer process from th
accumulation region to the ICR cell give ions kinetic energy, to trap the ions in the ICR
cell the voltage applied to the trap plates need to be greater than the kinetic energy of th
ions entering the ICR cell. Since regions of electric field inhomogeneity increase insid
the ICR cell with larger trapping potential it advantageous to perform F
measurements at low trapping potentials [30-32]. However with gated trapping
trapped in the ICR cell will have a distribution of kinetic energies along the z-axis wh
leads to differences in trapping oscillation amplitude [28, 33]. Lowering
potentials below
lo
tr
191
trapping potential [35]. The addition of a collision gas causes expansion of the
ius. Thus, it is desirable to perform quadrupole axialization which
onverts magnetron motion to cyclotron motion which is rapidly damped in the presence
f a co
gnetic
magnetron rad
c
o llision gas [36, 37]. However, these ion cooling and axiallization techniques
require sufficient time for and are not applicable to be performed on a LC time-scale
which requires a high duty cycle. In addition, there is a loss of sensitivity when
performing gated trapping in the sense that all the ions trapped in the accumulation region
do not exit the accumulation region at the same time and ions reach the ICR cell at
different times due to different flight times. The ions can be forced out of the
accumulation region over a shorter period of time by putting angled wires between the
multipoles of the accumulation cell to induce a voltage gradient within the accumulation
region [38]. However, there is still mass discrimination due to time-of-flight effects to
overcome [39].
All current commercial vendors of FTICR mass spectrometers have developed
hybrid FTICR instruments which have a mass selective device exterior to the ma
field. This allows for ion isolation of ions before accumulation, and also allows for
fragmentation exterior to the ICR cell [40, 41]. This has greatly increased the speed and
flexibility of the type of experiments that can be performed. Though the instrument
described here is not a hybrid instrument, we seek to modify the instrument
configurations to improve the overall FTICR mass spectrometer performance. In this
paper we present a novel FTICR mass spectrometer which is designed to overcome some
of the weakness in current instrument designs. First we incorporated a heated flared
metal inlet capillary [42, 43] followed by an electrodynamic ion funnel [44, 45] for
192

improved ion transmission from atmospheric pressure through the first vacuum stage. A
novel quadrupole ion guide following the ion accumulation region is designed to
minimize time-of-flight effects that occur when transmitting ions from the accumulation
region to the ICR cell, as well as transfer ions with low kinetic energy to the ICR cell.
For ion detection we have developed a novel ICR cell to reducing de-phasing of ion
clouds, without the need to lower trap potentials.
Experimental
The home built FTICR instrument implemented into a 3 Tesla magnet (Magnex
Scientific, Abingdon, UK). The vacuum system shown in Figure 1 A was designed to
allow for atmospheric ionization sources such as electrospray ionization to be used. Ions
enter the mass spectrometer through a 30.5 cm long flared metal capillary tube (I.D.
0.51mm) (Small Parts Inc, Miami Lakes, FL). The capillary is held in place by a heating
block that is heated to 130 oC with two cartridge heaters (Omega, Stamford, CN). The
first stage of pumping is carried out with a rough pump (1.2 Torr). An ion funnel is used
to transfer ions through the first pumping stage. A leak valve was added to the first
pumping stage to allow control over the pressure for optimized ion transmission through
the ion funnel. The ion funnel has 22 electrodes with an outer diameter of 35.5 mm and
1.6 mm thick with 1.0 mm thick nylon washers used as spacers between the electrodes.
The inner diameter of the first electrode was 20.3 mm, the inner diameter of the
electrodes decreased with the last electrode having an inner diameter of 2.2 mm. The
conductance limit at the bottom of the ion funnel is 3.0 mm. The rf voltage that was
193

applied to the ion funnel was ~200 Vp-p. The dc voltage gradient was set up by applying
150 V to the first electrode and 35 V to the last electrode. Following the conductance
limit at the end of the ion funnel is a skimmer. The second stage is pumped by the
auxiliary port on the drag pump used to pump the third stage. The ions are transmitted
through the third pumping stage by a 35.6 cm long quadrupole operated with an RF
voltage of 280 Vp-p at 1.03 MHz (7.9x10⁻³ Torr). A UHV gate valve (HVA Reno, NV)
was added between the third and fourth stage of pumping. The source region of the
instrument has a z-axis translational UHV bellows (McAllister Technical Services,
Coeurd’ Alene, ID). This allows the source region to be accessed for modification or
cleaning while still maintaining the UHV needed for ICR analysis. A conductance limit
of 2 mm separates the ion accumulation region from the novel ion optics used to transfer
ions to the ICR cell. The pressure on the high vacuum side of the gate valve (1x10⁻⁵ Torr)
is monitored with a Micro-Ion gauge (Grandville-Phillips, Longmont, CO). The ion
guide called restrained ion population transfer, or RIPT is described in detail elsewhere.
The pressure in the region UHV region of the instrument was 3x10⁻⁹ Torr monitored with
a Stable-Ion gauge (Grandville-phillips, Longmont, CO). The pressure reading on the ion
gauge reads approximately half the value when the instrument is rolled into the magnet.
After ions were trapped in the ICR cell by transfer with either RIPT or gated trapping,
ions were analyzed directly or the axial energy of the ions trapped in ICR cell was cooled
with a pulse gas event of 1 ms. Argon was used as the collision gas. A delay of 8-10
seconds was used to allow the collision gas to be pumped away.
Ions were created through electrospray by applying 2.75 kV to a metal union
located before the spray tip. The spray solution for all analytical standards purchased
194

from Sigma (St. Loius, MO) was 49:49:2, by volume water:methanol:acetic acid.
Infusion of the electrospray solution was performed with a syringe pump (Cole-Parmer,
Vernon Hills, IL) at a flow rate of 1μL/min. There were two types of ICR cells tested in
the instrument the first was a capacitively coupled open cylindrical cell and a novel ICR
cell called trapping ring electrode cell or TREC which has been described in detail
elsewhere. Both ICR cells had an inner diameter of 47.6 mm and a length of 50.8 mm.
he open cylindrical cell had three equal segments of 50.8 mm. A MIDAS data station
uire the data [46]. Ions were excited with broadband excitation with a
eep width of 200 kHz. The sweep rate and excitation amplitude were varied to change
h
ometers
ow
ld
T
was used to acq
sw
the excited cyclotron radius. The excitation waveform created by the arbitrary waveform
generator was amplified by a novel rf excitation amplifier developed in-house and
described in detail elsewhere. The RIPT quadrupole ion guide was only used with the
TREC cell when all the rings which make of the front trap plate and all the rings whic
make up the back trap plate all had the same potentials. Ions were transported in the
RIPT with 5 V as the high potential and -4 V as the low potential to form the voltage
well. The ramp time down and up were both set at 30ms. A total of eight different
voltages were used. ICR -2LS software package was used for data analysis [47].
Results and Discussion
Many problems associated with signal acquisition for FTICR mass spectr
such as ion cloud de-phasing or Coulombic interaction of ion packets are amplified at l
magnetic field strength; though these problems are still present at higher magnetic fie
195

strength they are not as detrimental. FTICR mass spectrometers which have low field
magnets, such as the 3 Tesla instrument described here, are not in routinely use because
of the disadvantages already mentioned. However, identifying these limitations and
trying to correct for them is needed as an alternative to improve performance without
investing in a higher field magnet. The performance increases shown on a 3 Telsa
instrument will also translate into increased performance with instruments which
incorporated higher field magnets.
The trapping ring electrode cell, or TREC, illustrated in Figure 2 was design
minimize radial electric fields within the ICR cell. It has been shown that altering the
radial fields during ion detection can produce longer transients [48, 49]. Therefore, we
have decided to construct a novel ICR cell which gives us unique control over shape of
the trapping electric fields. This approach differs from the ICR cells in commercial
instruments today, which have been designed to eliminate z-axis ejection during
excitation [50, 51]. The cell has the geometry of a closed cylindrical cell, but the solid
trap plates were replaced with 5 concentric rings with the ability to apply separate
voltages to each ring on either trap plate. This allows the electric fields to be modified to
decrease the electric field inhomogeneity inside the ICR cell. All the rings were kept at
the same voltages during ion accumulation and then switched to individual potentials
between excitation and detection. The voltages on the TREC were tuned by iteratively
changing the ring potentials. Figure 3 shows a comparison of the two ICR cells that
were employed in the instrument. In both cases a collision gas wa
ed to
s introduced into the
s
ts
ICR cell to cool the ions. The ion signal in the time-domain lasts approximately 3X a
long when obtained with the TREC compared to the open cylindrical cell. These resul
196

show that the ability to modify the trapping electric fields with TREC decreases ele
field inhomogeneity inside the ICR cell is important for improving FTICR signal. With
TREC the excited ion clouds are able to remain as a coherent packet for a longer time
period. This results in higher resolving power, signal-to-noise ratio as can be seen from
Figure 3.
With a closed cylindrical cell the ions will experience z-axis excitation and
possibly ejection from the ICR cell during excitation of cyclotron motion. The larger th
z-axis oscillation amplitude of the ions the more likely z-axis excitation will be a
problem. Therefore, with the current design of TREC we have made the trade off in
electric field profile in favor of trapping electric field over the excitation electric field.
However, z-axis excitation can be reduced by coupling the excitation on to the trap
similarly to the Infinity cell. Ion cooling with a collision gas is desirable to reduce the z
axis oscillation amplitude of the ions so they are located at the center of the ICR cell.
Figure 4 compares spectra between TREC and non-TREC conditions with the ion
cooling for mellitin. Figure 4A is the non-TREC spectrum in which the excitation
conditions were optimized, the calculated cyclotron radius was approximately 0.6 cm
1.2 volts were placed on all the ring electrodes. The resolution obtained was ~100
ctric
e
rings,
-
.
,000
ith a signal duration of ~6 seconds. Figure 4B is the spectrum obtained with TREC, in
o a cyclotron radius approximately half the ICR cell radius.
he signal duration lasts longer than the data acquisition period of 13 seconds, with a
w
which ions were excited t
T
resolution of over 400,000. There is also little observed frequency drift with observation
time with TREC [52, 53]. After the 13 second data acquisition the resolution of the peak
is still at the theoretical limit, which can be approximated by frequency * time =
197

resolution. The reason that ions can be excited to a larger cyclotron radius with TREC
because the electric field inhomogeneities increase the further the ions are from the
central axis of the ICR cell, thus leading to faster de-phasing rates under non-TREC
conditions. With TREC the electric fields can be tailored to decrease these electric fie
inhomogeneities at larger ICR cell radius. This is important because the signal inten
increases with cyclotron radius because the ion cloud is closer to the detection elec
In addition, space charge frequency
is
ld
sity
trodes.
shifts from varying number of ions from one data
cquisi
h
re 4
t. Since
l
the
c
a tion period to the next are more prominent at smaller cyclotron radii. Because, for
the same number of ions the charge density is larger at smaller radii, this results in
increased Coulombic interactions. It should be noted that even though the resolution is
good enough to define fine structure, none is observed due to the peak coalescence whic
is more prominent at lower magnetic field strength. In comparing the spectra in Figu
the frequencies of the peaks are shifted since the radial electric fields are differen
the radial electric forces drive magnetron motion, the ion clouds in the two trapping cel
(TREC vs. non-TREC) will exhibit different magnetron frequencies. In this figure
peaks in the TREC spectrum are shifted to a lower frequency. The voltages applied to
the ring electrodes from inner to outer ring is 0.2, 1.2, 2.0, 2.4, 2.8 V. In this case the
magnitude of the radial force is greater (lower observed cyclotron frequency) but the
electric fields have been altered to make this force more constant along the z-axis of the
ICR cell.
The other novel feature of the instrument is the RIPT ion guide. This segmented
quadrupole can work in two modes: 1) Static, in which all segments maintain the same d
voltage at all times. 2) RIPT, in which voltages applied to the quadrupole segments are
198

varied individually to form a potential well to transport ions. In the static mode ions are
transferred to the ICR cell by biasing the front quadrupole to ~8 volts while holding the
dc voltage for all segments of the RIPT quadrupole at ground, and employing gated
trapping to trap ions in the ICR cell. The segmented ion guide resembles a solid set of
quadrupole rods in this mode of operation. The segmented regions do not appear to have
s with
ICR
e
h
the
in
ill
any negative effect on the ion transmission efficiency. It is desirable to transfer ion
low kinetic energy because it takes lower trapping voltages to trap the ions. The higher
the applied voltages the greater the inhomogeneity of the electric fields within the
cell which translates to faster de-phasing rates. The kinetic energy of ions entering th
ICR cell with RIPT and gated trapping is shown in Figure 5. The normalized signal
intensity is an average of three standards: bradykinin (M+2H)2+, mellitin (M+4H)4+, and
insulin (M+5H)5+. The voltage applied to the back trap plate is varied. If the voltage is
lower than the kinetic energy of the ions entering the ICR cell the ions will pass throug
the ICR cell. If the ions have less kinetic energy than the applied voltage potential,
ions will slow down and be forced to change direction. This increases the duration
which the ions are located in the trapping region, and thus the likelihood that the ions w
be trapped with gated trapping. Figure 5 illustrates that with RIPT we are able to transfer
ions to the ICR cell with lower kinetic energy. The RIPT ion guide and TREC use the
same hardware device; therefore, we are currently unable to perform both tasks
simultaneously. We are planning to couple them together in the very near future.
Conclusions
199

A novel FTICR mass spectrometer has been designed and initial performance
described. The TREC design allows ions to be excited to larger cyclotron radii by
reducing electric field inhomogeneity. TREC offers a 4X improvement in resolution
compared to the same voltage applied to all ring electrodes. Exciting ions to larger
cyclotron radii will increase sensitivity and the signal-to-noise ratio. The RIPT ion guide
can reduce time-of-flight effects as well as reduce the kinetic energy of the ions entering
in the ICR cell. This allows the voltage applied to the trapping electrodes to be lower.
Lower voltages results in decreased electric field inhomogeneity and thus decreased de-
phasing rates.
Acknowledgements
This material is based upon work supported by the National Science Foundation under
Grant No. 0352451; Murdock Charitable Trust; Office of Science (BER), U. S.
Department of Energy, Grant No. DE-FG02-04ER63924, and the National Institutes
Health Biotechnology Training Grant.
Reference
1. He
of
, F., Emmett, M. R., Hakansson, K., Hendrickson, C. L., Marshall, A. G.,
Theoretical and experimental prospects for protein identification based solely on
Measurement (+-10 ppm) in Protein Identification Strategies Employing MS or
accurate mass measurement, J Proteome Res. 2004, 3, 61-67.
2. Clauser, K. R., Baker, P., Burlingame, A. L., Role of Accurate Mass
MS/MS and Database Searching, Analytical Chemistry. 1999, 71, 2871-2882.
200

3. Comisarow, M. B., Marshall, A. G., Fourier transform ion cyclotron resonance
cyclotron resonance spectroscopy, Chemical Physics Letters. 1974, 26, 489-4
5. He, F., Hendrickson, C. L., Marshall, A. G., Baseline mass resolution of peptide
647-650.
6. Williams, D. K., Jr., Muddiman, D. C., Parts-Per-Billion Mass Measurement
Automatic Gain Control in a Fourier Transform Ion Cyclotron Resonance Mass
atoms in a protein by ultrahigh-resolution Fourier transform ion cyclotron
proteins, Proceedings of the National Academy of Sciences of the United State
A., Techview: biochemistry. Biomolecule mass spectrometry, Science. 1999, 284
Compositionally Distinct Components in a Single Electrospray Ionization Fourie
Chemistry. 2002, 74, 4145-4149.
10. Marshall, A. G., Hendrickson, C. L., Fourier transform ion cyclotron resonance
Mass Spectrometry. 2002, 215, 59-75.
11. Peurrung, A. J., Kouzes, R. T., Long-term coherence of the cyclotron mode in a
Related Interdisciplinary Topics. 1994, 49, 4362-4368.
12. Mitchell, D. W., Realistic simulation of the ion cyclotron resonance mass
spectroscopy, Chemical Physics Letters. 1974, 25, 282-283.
4. Comisarow, M. B., Marshall, A. G., Frequency-sweep Fourier transform ion 90.
isobars: A record for molecular mass resolution, Analytical Chemistry. 2001, 73,
Accuracy Achieved through the Combination of Multiple Linear Regression and
Spectrometer, Analytical Chemistry. 2007, 79, 5058-5063.
7. Shi, S. D. H., Hendrickson, C. L., Marshall, A. G., Counting individual sulfur
resonance mass spectrometry: experimental resolution of isotopic fine structure in s of
America. 1998, 95, 11532-11537.
8. McLafferty, F. W., Fridriksson, E. K., Horn, D. M., Lewis, M. A., Zubarev, R. ,
1289-1290.
9. Hughey, C. A., Rodgers, R. P., Marshall, A. G., Resolution of 11,000 r
Transform Ion Cyclotron Resonance Mass Spectrum of Crude Oil, Analytical
detection: principles and experimental configurations, International Journal of
trapped ion cloud, Physical Review. E. Statistical Physics, Plasmas, Fluids, and
spectrometer using a distributed three-dimensional particle-in-cell code, Journal of the American Society for Mass Spectrometry. 1999, 10, 136-152.
ell, D. W., Smith, R. D., Prediction of a space charge induced upper molecular mass limit towards achieving unit mass resolution in Fourier transform ion cyclotron resonance mass spectrometry, Journal of Mass Spectrometry. 1996, 31, 771-790.
13. Mitch
201

transform ion cyclotron resonance mass spectrometry, Rapid Communicatio
interacting ion clouds with implications to Fourier-transform ion cyclotron
Fluids, and Related Interdisciplinary Topics. 1995, 52, 4366-4386.
16. Bogdanov, B., Smith, R. D., Proteomics by FTICR mass spectrometry: Top down
McLafferty, F. W., Top Down versus Bottom Up Protein Characterization by
Society.
14. Marshall, A. G., Guan, S., Advantages of high magnetic field for Fourier ns in
Mass Spectrometry. 1996, 10, 1819-1823.
15. Mitchell, D. W., Smith, R. D., Cyclotron motion of two Coulombically
resonance mass spectrometry, Physical Review. E. Statistical Physics, Plasmas,
and bottom up, Mass Spectrometry Reviews. 2005, 24, 168-200.
17. Kelleher, N. L., Lin, H. Y., Valaskovic, G. A., Aaserud, D. J., Fridriksson, E. K.,
Tandem High-Resolution Mass Spectrometry, Journal of the American Chemical 1999, 121, 806-812.
8. Sze, S. K., Ge, Y., Oh, H., McLafferty, F. W., Top-down mass spectrometry of a
29-kDa protein for characterization of any posttranslational modification to within roc Natl Acad Sci U S A. 2002, 99, 1774-1779.
9. McIver, R. T., Jr., Ledford, E. B., Jr., Miller, J. S., Proposed method for mass spectrometric analysis for ultra-low vapor pressure compounds, Analytical
resonance mass spectrometry: principles and design of geometric and electric
1995, 146/147, 261-296.
21. Anderson, J. S., Vartanian, H., Laude, D. A., Evolution of trapped ion cells in Fourier transform ion cyclotron resonance mass spectrometry, Trends Anal Chem. 1994, 13, 234-239.
2. Vartanian, V. H., Anderson, J. S., Laude, D. A., Advances in trapped ion cells for Fourier transform ion cyclotron resonance mass spectrometry, Mass Spectrometry Reviews. 1995, 14, 1-19.
ion cyclotron resonance mass spectrometry, Organic Mass Spectrometry. 1991, 26, 514-518.
24. n
resonance mass spectrometry, Analytical Chemistry. 1992, 64, 177-180.
1
one residue, P 1
Chemistry. 1975, 47, 692-697.
20. Guan, S., Marshall, A. G., Ion traps for Fourier transform ion cyclotron
configurations, International Journal of Mass Spectrometry and Ion Processes.
2
23. Caravatti, P., Allemann, M., The infinity cell: a new trapped-ion cell with
radiofrequency covered trapping electrodes for Fourier transform
Beu, S. C., Laude, D. A., Jr., Elimination of axial ejection during excitation witha capacitively coupled open trapped-ion cell for Fourier transform ion cyclotro
202
Henry, K. D., Williams, E. R., Wang, B. H., McLafferty, F. 25. W., Shabanowitz, J., Hunt, D. F., Fourier-transform mass spectrometry of large molecules by
9,
89, 286-289.
G.,
, metry,
29. .; 1990.
.,
and methods, International Journal of Mass Spectrometry and Ion Processes. 1996, 157/158, 97-113.
31.
form ion cyclotron resonance mass spectrometry, Analytical Chemistry. 1997, 69, 1815-1819.
32. mino acids and disulfide bridges in
peptides by ultrahigh-resolution MALDI FTICR mass spectrometry, Anal Chem.
33. f an ion cloud in a Fourier
transform ion cyclotron resonance mass spectrometer during signal detection: its
4. Wong Richard, L., Amster, I. J., Sub part-per-million mass accuracy by using
ass
electrospray ionization, Proceedings of the National Academy of Sciences. 19886, 9075-9078.
26. Loo, J. A., Quinn, J. P., Ryu, S. I., Henry, K. D., Senko, M. W., McLafferty, F.
W., High-resolution tandem mass spectrometry of large biomolecules, Proc Natl Acad Sci.
27. Senko, M. W., Hendrickson, c. L., Emmett, M. R., Shi, S. D. H., Marshall, A.
External accumulation of ions for enhanced electrospray ionization Fourier transform ion cyclotron resonance mass spectrometry, Journal of the American Society for Mass Spectrometry. 1997, 8, 970-976.
28. Gorshkov, M. V., Masselon, C. D., Anderson, G. A., Udseth, H. R., Harkewicz
R., Smith, R. D., A dynamic ion cooling technique for FTICR mass spectroJournal of the American Society for Mass Spectrometry. 2001, 12, 1169-1173.
Caravatti, P., US Patent. 4,924,089 30. Easterling, M. L., Pitsenberger, C. C., Kulkarni, S. S., Taylor, P. K., Amster, I. J
A 4.7 Tesla internal MALDI-FTICR instrument for high mass studies: performance
Stults, J. T., Minimizing peak coalescence: high-resolution separation of isotope peaks in partially deamidated peptides by matrix-assisted laser desorption/ionization Fourier trans
Solouki, T., Emmett, M. R., Guan, S., Marshall, A. G., Detection, number, and sequence location of sulfur-containing a
1997, 69, 1163-1168.
Nikolaev, E. N., Miluchihin, N., Inoue, M., Evolution o
influence on spectral line shape and position, International Journal of MassSpectrometry and Ion Processes. 1995, 148, 145-157.
3stepwise-external calibration in fourier transform ion cyclotron resonance mspectrometry, J Am Soc Mass Spectrom. 2006, 17, 1681-1691.
203

35. Winger, B. E., Hofstadler, S. A., Bruce, J. E., Udseth, H. R., Smith, R. D., High-ospray
6-577.
, X.,
.
7. Guan, S., Gorshkov, M. V., Marshall, A. G., Circularly polarized quadrature
,
4-member peptide combinatorial library, J Am Soc Mass Spectrom. 2002, 13, 1162-1169.
39. surement, Journal
of the American Society for Mass Spectrometry. 2006, 17, 205-212.
40. ., tion of external accumulation liquid
chromatography/electrospray ionization Fourier transform ion cyclotron
41. . N., Anderson, G. A., Udseth, H. R., Conrads, T. P.,
Veenstra, T. D., Masselon, C. D., Gorshkov, M. V., Smith, R. D., Design and
43. r, N. K., Bruce, J. E., Prior, D. C., Anderson, G. A.,
Incorporation of a Flared Inlet Capillary Tube on a Fourier Transform Ion for
4. Shaffer, S. A., Prior, D. C., Anderson, G. A., Udseth, H. R., Smith, R. D., An ion
resolution accurate mass measurements of biomolecules using a new electrionization ion cyclotron resonance mass spectrometer, Journal of the American Society for Mass Spectrometry. 1993, 4, 56
36. Guan, S., Kim, H. S., Marshall, A. G., Wahl, M. C., Wood, T. D., Xiang
Shrink-wrapping an ion cloud for high-performance Fourier transform ion cyclotron resonance mass spectrometry, Chemical Reviews. 1994, 94, 2161-2182
3excitation for Fourier-transform ion cyclotron resonance mass spectrometry, Chemical Physics Letters. 1992, 198, 143-148.
38. Wigger, M., Eyler, J. R., Benner, S. A., Li, W., Marshall, A. G., Fourier
transform-ion cyclotron resonance mass spectrometric resolution, identificationand screening of non-covalent complexes of Hck Src homology 2 domain receptor and ligands from a 32
Wong, R. L., Amster, I. J., Combining Low and High Mass Ion Accumulation for Enhancing Shotgun Proteome Analysis by Accurate Mass Mea
Belov, M. E., Rakov, V. S., Nikolaev, E. N., Goshe, M. B., Anderson, G. ASmith, R. D., Initial implementa
resonance with automated gain control, Rapid Communications in Mass Spectrometry. 2003, 17, 627-636.
Belov, M. E., Nikolaev, E
performance of an ESI interface for selective external ion accumulation coupledto a fourier transform ion cyclotron mass spectrometer, Analytical Chemistry. 2001, 73, 253-261.
42. Prior, D. C., Price, J., Bruce, J. E., U.S. Patent 6,455,8646; 2002.
Wu, S., Zhang, K., Kaise
Cyclotron Resonance Mass Spectrometer, Journal of the American Society Mass Spectrometry. 2006, 17, 772-779.
4funnel interface for improved ion focusing and sensitivity using electrospray ionization mass spectrometry, Anal Chem. 1998, 70, 4111-4119.
204

45. Shaffer, S. A., Tolmachev, A., Prior, D. C., Anderson, G. A., Udseth, H. R.,
istry.
6. Senko, M. W., Canterbury, J. D., Guan, S., Marshall, A. G., A high-performance
48.
s, Analytical Chemistry. 2005, 77, 5973-5981.
49.
Inverted Sidekick Electrode Voltage during Detection To Extend Time-Domain Fourier Transform Ion Cyclotron
Resonance Mass Resolution, Analytical Chemistry. 2007, 79, 3575-3580.
50. f ions in
90, 95, 317-326.
Ion Processes.
2. Bruce, J. E., Anderson, G. A., Hofstadler, S. A., Winger, B. E., Smith, R. D.,
n
Anal
Smith, R. D., Characterization of an Improved Electrodynamic Ion Funnel Interface for Electrospray Ionization Mass Spectrometry, Analytical Chem1999, 71, 2957-2964.
4modular data system for Fourier transform ion cyclotron resonance mass spectrometry, Rapid Communications in Mass Spectrometry. 1996, 10, 1839-1844.
47. Anderson, G. A., Bruce J.E., Smith R.D., ICR-2LS, Richland, WA, 1996.
Kaiser, N. K., Bruce, J. E., Observation of Increased Ion Cyclotron Resonance Signal Duration through Electric Field Perturbation
Kim, S., Choi, M. C., Kim, S., Hur, M., Kim, H. S., Yoo, J. S., Blakney, G. T., Hendrickson, C. L., Marshall, A. G., Modification of Trapping Potential by
Signal Duration for Significantly Enhanced
Van de Guchte, W. J., Van der Hart, W. J., Excitation of the z motion ocubic and elongated ion cyclotron resonance cells, International Journal of MassSpectrometry and Ion Processes. 19
51. Van der Hart, W. J., Van de Guchte, W. J., Excitation of the z-motion of ions in a
cubic ICR cell, International Journal of Mass Spectrometry and1988, 82, 17-31.
5Time-base modulation for the correction of cyclotron frequency shifts observed ilong-lived transients from Fourier-transform ion-cyclotron-resonance mass spectrometry of electrosprayed biopolymers, Rapid Communications in Mass Spectrometry. 1993, 7, 700-703.
53. Guan, S., Wahl, M. C., Marshall, A. G., Elimination of frequency drift from
Fourier transform ion cyclotron resonance mass spectra by digital quadrature heterodyning: ultrahigh mass resolving power for laser-desorbed molecules, Chem. 1993, 65, 3647-3653.
205

Figure 1
Figure
um
pumpin
valve, I mp
stem. I = ion
e,
TC = T
G
1. Novel FTICR-MS instrument developed in-house. A. Vacuum system of 3T
instr ent. F = Flared capillary inlet, H = heating block, W = bellows, IS = interstage
g from the drag pump (10 l/s) , D = turbomolecular drag pump (220 l/s), G = gate
G1 = ion gauge, IG2 = ion gauge 2, T1 = turbo pump 1 (350 l/s), T2 = turbopu
2 (200 l/s), T3 turbopump 3 (400 l/s). B. Ion optics within the vacuum sy
funnel, Q = front quadrupole, C1, C2, C3 = are conductance limits, R = RIPT ion guid
REC ICR cell
F I T
R
D
T1 T2
T3
IG1 IG2
C1 C2 C3
W
IS
H
Q
E
S
A) PV
B)
206

Figure 2
Figure
cylindr
A)
B)
2. ICR cell designs employed in the instrument A) capacitively coupled open
ical cell B) TREC cell
207

Figure 3
le
B)
Figure 3. Ubiquitin spectra acquired with the different ICR cell designs, both are sing
scans. A) spectrum acquired with the capacitively coupled open cylindrical cell
spectrum acquired with TREC. There was some fragmentation that occurred in the open
cell experiment to account for the other peaks in the spectrum. The inset shows the
zoomed in region of the (M+10)10+ charge state.
0.00
4.8e+5
9.6e+5
1.4e+6
565.7 789.0 1012.3 1235.6 1458.9m/z
0.00
4.8e+5
9.5e+5
1.4e+6
565.72 789.01 1012.3 1235.6 1458.9m/z
856. 857. 857. 858. 859.m/
856. 857. 857. 858. 859.m/
Ubiquitin (M+10H)10+
10+
9+
11+
12+
8+7+
7+
11+10+
9+
12+ 8+
A)
B)
208

Figure 4
ectra acquired with the TREC cell, all spectra are single
scan. A) Optimized conditions for non-TREC conditions (all rings have the same
potential). B) Optimized conditions for TREC with a voltage profile of 0.2, 1.2, 2.0, 2.4,
and 2.8 V from inner most ring out.
Figure 4. Melittin (M+4H)4+ sp
0 712.75 712.81 712.86 712.92 712.98
m/z
100
33
67
Rel
ativ
e m
agni
tude
0
67
33
100 R
elat
ive
mag
nitu
de
0 712.30 712.90 713.49 714.08 714.68
100
67
33
Rel
ativ
e m
agni
tude
A)
B)
C)
*
*
m/z
209

Figure 5
0
back trap plate voltage
norm
aliz
ed si
gnal
am
plitu
de
2
4
6
8
10
12
gated trapping RIPT
0 1 2 3 4 5 6 7 8 9 1
Figure 5. Comparison of kinetic energy between gated trapping and RIPT of ions entering
the ICR cell.
210

Chapter 8
Conclusions
In CHAPTER 2 we presented a method to correct space charge induced frequency
shifts in FTICR measurements which pertains to MS/MS fragment ions. In follow-up
experiments that aim to minimize these frequency shifts, we produced a low energy
electron beam along the z-axis of the ICR cell during detection. The results we obtained
were unexpected; the duration of the time-domain signal increased dramatically.
Characterizing and explaining this phenomenon formed the basis for the rest of my thesis
work. The initial observations of this method, called Electron Promoted Ion Coherence
or EPIC, had on the observed ICR signal was described in CHAPTER 3. The lifetime of
the observed time-domain signal depends upon the coherent motion of ions. Through a
number of experiments and deductions we were able to demonstrate that application of
EPIC results in altered electric fields within the ICR cell. In depth characterization of
EPIC was present in CHAPTER 4, which described how the space charge conditions and
magnetron motion was altered. In the literature, one of the major causes of ion cloud de-
phasing is attributed to inhomogeneity of the electric fields. Though these electric field
inhomogneities have been described in theoretical work, experimental work consists
mainly of axialization and reduction of trapping voltage. It was known that increasing
the trapping potentials induce faster signal decay rates. In CHAPTER 5, we presented a
detailed study of electric field inhomogeneity and EPIC, and how these inhomogeneities
affect ion cloud stability. In most ICR cell designs, the magnitude of the radial electric
211

force which drives magnetron motion is not constant along the z-axis. When ions are
trapped in the ICR cell they will exhibit a distribution of z-axis kinetic energy.
Therefore, ions with different z-axis kinetic energy will exhibit different magnetron
frequencies. This will lead to de-phasing of the ion packet. All ions will be in-phase
after excitation but different magnetron frequencies will result in de-phasing of ion
motion and the signal amplitude will decrease with time. By turning on the electron
beam, we are minimizing changes in radial fields along the z-axis. This results in
observed cyclotron frequency that is independent of z-axis kinetic energy. This work
provides further insight into ion cloud de-phasing mechanisms.
However, it is noted in CHAPTER 4 that the observed cyclotron frequency is very
sensitive to the number of electrons being sent through the ICR cell. With our current
hardware, the reproducibility of the electron current from experiment to experiment was
found to be inadequate, thus limiting the utility of EPIC as an analytical technique.
However, the technique has proved to be extremely useful tool to study ion cloud de-
phasing. All my work with EPIC has led us to develop an ICR cell which is capable of
mimicking the electric fields with more flexibility and great stability than those produced
ith EPIC. This ICR cell design gives us the unique capability of tailoring the electric
er research objective was focused on eliminating time-of-flight effects and
transferring cooled ion packets to the ICR cell. Thus, eliminate ion cooling events which
quire lengthy time periods. The RIPT ion guide I built to accomplish this was
described in detail in CHAPTER 6. Ions were accumulated in a quadrupole at high
pressure which cools the ions translational energy. Through computer modeling we were
w
fields.
My oth
re
212

able to illustrate that the kinetic energy imparted to the ions during the transfer process
as minimized by the transfer waveform applied to the segments of the ion guide. Also,
contained during the entire transfer process there are no time-of-flight
ffects. The ion guide was tested on a novel FTICR instrument under-developed in our
w
since ions are
e
laboratory. The RIPT ion guide was only one of the novel components implemented into
the instrument. A full description of the instrument is available in CHAPTER 7. These
novel features employed in the lab, such as EPIC, RIPT and TREC, have advanced
FTICR mass spectrometry technology, and provide further insight into ion motion in the
ICR cell.
213


![Fourier Transform Ion Cyclotron Resonance Mass ... · corresponding to the cyclotron frequency ω c signal would be constant for a given ion cloud and magnetic field [ 21]. Further-more,](https://img.dokumen.tips/doc/110x75/5ace70c27f8b9ac1478bb302/fourier-transform-ion-cyclotron-resonance-mass-to-the-cyclotron-frequency-.jpg)