Embed Size (px)
Citation preview
Four Years Out: Differences in Postschool Experiences of Youth With Disabilities Who
Did and Did Not Complete High School
Findings from the National Longitudinal Transition Study-2 (NLTS2)
Mary Wagner, Ph.D.SRI International
Secondary Transition State Planning Institute: Building for the Future
Charlotte, North Carolina
May 7-9, 2008

2
NLTS2 Overview
Stratified random sample
Nationally representative sample of 501 LEAs and 38 special schools, stratified by:• Geographic region
• Enrollment size
• District wealth
11,275 students by disability category
Focuses on Youth, ages 13 to 16 at start of study
Study began 2000–2001 school year
Generalizes to All disability categories, each age cohort
Longitudinal10 years (now in year 8)
5 waves of data collection over 9 years (wave 4 recently completed)
NLTS2 has been funded with federal funds from the U.S. Department of Education, Institute of Education Sciences, National Center for Special Education Research, under contract number ED-01-CO-0003. The content of this publication does not necessarily reflect the view or policies of the U.S. Department of Education, nor does mention of trade names, commercial products, or organizations imply endorsement by the U.S. government.
3
Data Sources
Parent telephone interviews
Youth telephone interviews/survey
NLTS2 Wave 3, 2005Responses for youth who have been out of high school up to 4 years (n= approximately 2,390)
Ages 17 through 21

4
Today’s Agenda
Review outcomes of youth with disabilities out of high school up to 4 years regarding:
• High school completion
• GED/high school equivalence
• Postsecondary education
• Employment
• Community participation
• Youth risk behaviors
• Living arrangements and family formation
Identify variations in outcomes associated with school-completion status
5
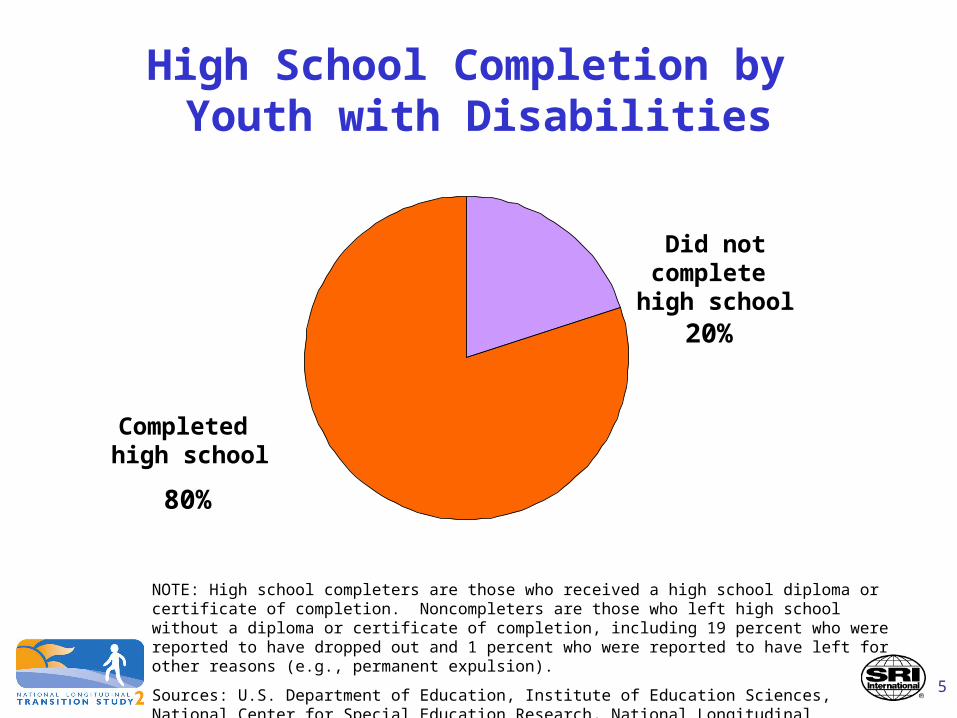
High School Completion by Youth with Disabilities
NOTE: High school completers are those who received a high school diploma or certificate of completion. Noncompleters are those who left high school without a diploma or certificate of completion, including 19 percent who were reported to have dropped out and 1 percent who were reported to have left for other reasons (e.g., permanent expulsion).
Sources: U.S. Department of Education, Institute of Education Sciences, National Center for Special Education Research, National Longitudinal Transition Study-2 (NLTS2) Wave 3 parent interviews and youth interviews/survey, 2005.
Did not complete high school
Completed high school
20%
80%

6
School Completion Rate, by Disability Category
80
81
82
84
84
85
87
87
88
90
62Emotional disturbance
Mental retardation
Other health impairment
Learning disabilities
Speech/language impairment
Autism
Multiple disabilities
Visual impairment
Traumatic brain injury
Orthopedic impairment
Hearing impairment
Percent
Sources: U.S. Department of Education, Institute of Education Sciences, National Center for Special Education Research, National Longitudinal Transition Study-2 (NLTS2) Wave 3 parent interviews and youth interviews/survey, 2005.

7
High School Equivalency Diploma or Certificate Programs
8
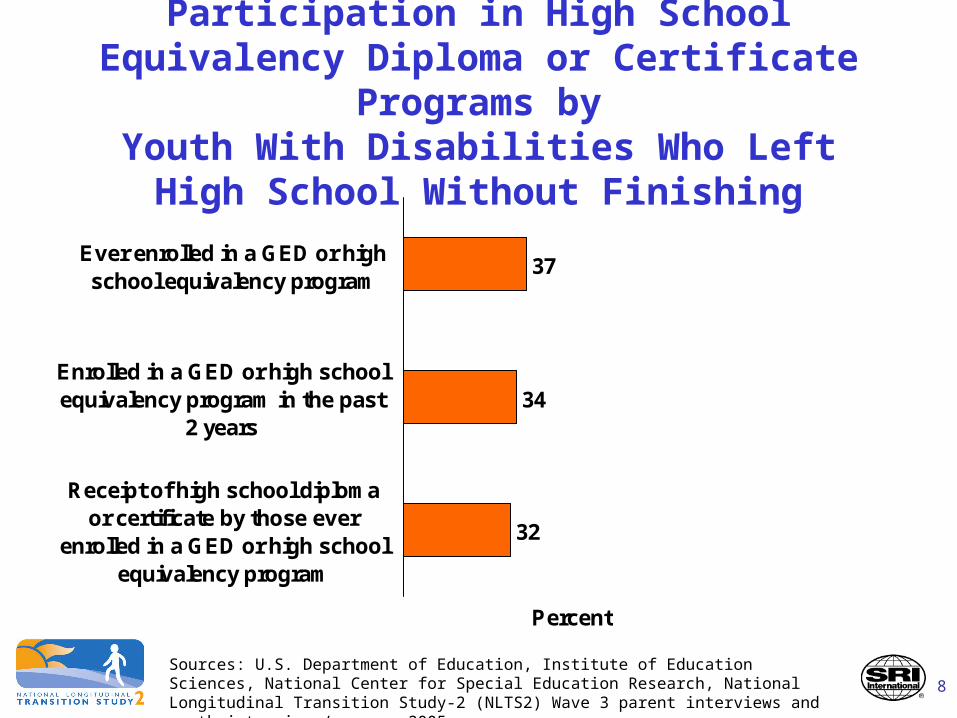
Participation in High School Equivalency Diploma or Certificate Programs by
Youth With Disabilities Who LeftHigh School Without Finishing
32
34
37
Receipt of high school diplomaor certificate by those ever
enrolled in a GED or high schoolequivalency program
Enrolled in a GED or high schoolequivalency program in the past
2 years
Ever enrolled in a GED or highschool equivalency program
Percent
Sources: U.S. Department of Education, Institute of Education Sciences, National Center for Special Education Research, National Longitudinal Transition Study-2 (NLTS2) Wave 3 parent interviews and youth interviews/survey, 2005.

9
High School Equivalency Diploma or Certificate Program Enrollment by Noncompleters, by Disability Category
47
41
38
33
31
23
21
15
10
8
59Emotional disturbance
Other health impairment
Hearing impairment
Multiple disabilities
Orthopedic impairment
Learning disability
Mental retardation
Speech impairment
Visual impairment
Traumatic brain injury
Autism
PercentSources: U.S. Department of Education, Institute of Education Sciences, National Center for Special Education Research, National Longitudinal Transition Study-2 (NLTS2) Wave 3 parent interviews and youth interviews/survey, 2005.

10
Postsecondary Education

11
Enrollment in Postsecondary Education Since Leaving High School
2643
21
30
14
53Any postsecondary institution
Vocational, technical, businessschool
2-year college
4-year college
Percent
Youth with disabilities in 1990
Youth with disabilities in 2005
Youth in the general population in 2001
*** p = <.001 comparing youth with disabilities in 2005 and those in the general population in 2001.Sources: U.S. Department of Education, Institute of Education Sciences, National Center for Special Education Research, National Longitudinal Transition Study-2 (NLTS2) Wave 3 parent interviews and youth interviews/survey, 2005; National Longitudinal Survey of Youth (NLSY), 2001, youth survey, responses for youth ages 17-21.
***
12
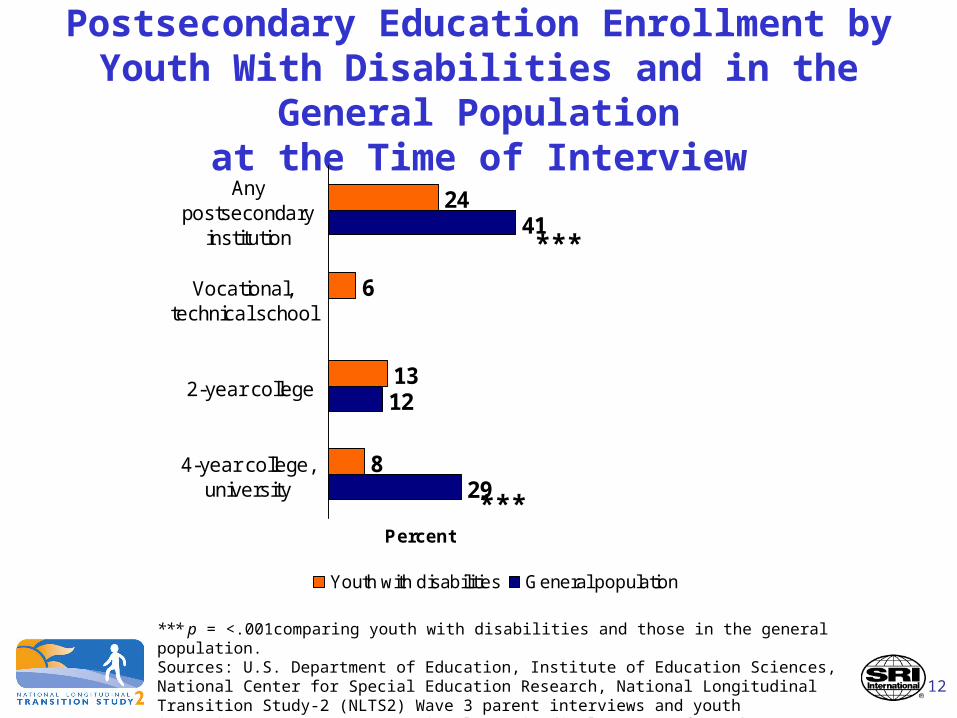
Postsecondary Education Enrollment by Youth With Disabilities and in the General Population
at the Time of Interview
24
6
13
8
41
12
29
Anypostsecondary
institution
Vocational,technical school
2-year college
4-year college,university
Percent
Youth with disabilities General population
*** p = <.001comparing youth with disabilities and those in the general population.Sources: U.S. Department of Education, Institute of Education Sciences, National Center for Special Education Research, National Longitudinal Transition Study-2 (NLTS2) Wave 3 parent interviews and youth interviews/survey, 2005; National Longitudinal Survey of Youth (NLSY), 2001, youth survey, responses for youth ages 17-21.
***
***
13
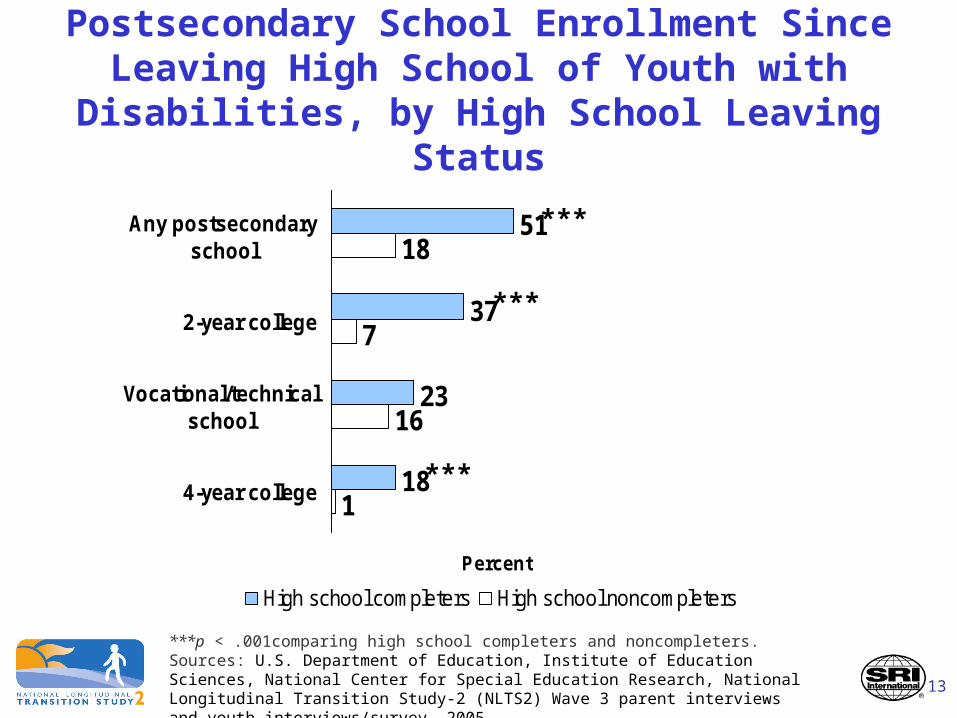
Postsecondary School Enrollment Since Leaving High School of Youth with Disabilities,
by High School Leaving Status
51
37
23
18
18
7
16
1
Any postsecondaryschool
2-year college
Vocational/technicalschool
4-year college
Percent
High school completers High school noncompleters
***p < .001comparing high school completers and noncompleters.Sources: U.S. Department of Education, Institute of Education Sciences, National Center for Special Education Research, National Longitudinal Transition Study-2 (NLTS2) Wave 3 parent interviews and youth interviews/survey, 2005.
***
***
***

14
Postsecondary School Enrollment Since Leaving High School, by Disability Category
72
70
56
54
54
52
51
51
46
31
31
26
Visual impairment
Hearing impairment
Speech/language impairment
Other health impairment
Orthopedic impairment
Autism
Traumatic brain injury
Deaf-blindness
Learning disability
Emotional disturbance
Multiple disabilities
Mental retardation
Percent
Sources: U.S. Department of Education, Institute of Education Sciences, National Center for Special Education Research, National Longitudinal Transition Study-2 (NLTS2) Wave 3 parent interviews and youth interviews/survey, 2005.

15
Full-Time Attendance at Postsecondary Schools by Youth With Disabilities, by School-Completion Status
*p < .001comparing high school completers and noncompleters.Note: Refers to current or most recent emrollment in postsecondary school.Sources: U.S. Department of Education, Institute of Education Sciences, National Center for Special Education Research, National Longitudinal Transition Study-2 (NLTS2) Wave 3 parent interviews and youth interviews/survey, 2005.
26
75
71
High schoolnoncompleters
High schoolcompleters
All youth withdisabilities
Percent
*

16
Primary Focus of Courses at 2-Year Colleges by Youth With Disabilities, by School-Completion Status
58
29
10
3
58
29
10
3
75
25
1
0
Mostly academic
Mostly vocational
Both academic andvocational
Personal interest,neither academic
nor vocationalPercent
All youth with disabilities School completers Noncompleters
Note: Refers to current or most recent enrollment in postsecondary school.Sources: U.S. Department of Education, Institute of Education Sciences, National Center for Special Education Research, National Longitudinal Transition Study-2 (NLTS2) Wave 3 parent interviews and youth interviews/survey, 2005.

17
Disclosure of Disability by Youth With Disabilities in Postsecondary School, by School-Completion Status
60
8
32
62
8
29
35
3
63
Do not consider selfto have a disability
Consider self tohave a disability and
have not informedschool of disability
Consider self tohave a disability and
have informedschool of disability
Percent
All youth with disabilities School completers Noncompleters
Note: Refers to current or most recent enrollment in postsecondary school.Sources: U.S. Department of Education, Institute of Education Sciences, National Center for Special Education Research, National Longitudinal Transition Study-2 (NLTS2) Wave 3 parent interviews and youth interviews/survey, 2005.
18
Employment

19
Employment of Youth With Disabilities and Youth in the General Population
56
66
75
Employed attime of interview
Ever employedsince high
school
Percent
Youth with disabilities General population
U.S. Department of Education, Institute of Education Sciences, National Center for Special Education Research, National Longitudinal Transition Study-2 (NLTS2) Wave 3 parent interviews and youth interviews/survey, 2005; National Longitudinal Survey of Youth (NLSY), 2001, youth survey, responses for youth ages 17-21.

20
Employment of Youth With Disabilities, by School Completion Status
59
43
68
78
Employed attime of interview
Ever employedsince high
school
Percent
School completers Noncompleters
U.S. Department of Education, Institute of Education Sciences, National Center for Special Education Research, National Longitudinal Transition Study-2 (NLTS2) Wave 3 parent interviews and youth interviews/survey, 2005.

21
Employment Since High School of Youth Out of High School 1 to 4 Years, by Disability Category
70
67
64
61
58
57
56
46
44
39
39
72Learning disability
Other health impairment
Speech/language impairment
Emotional disturbance
Autism
Visual impairment
Hearing impairment
Traumatic brain injury
Multiple disabilities
Mental retardation
Deaf-blindness
Orthopedic impairment
Percent
U.S. Department of Education, Institute of Education Sciences, National Center for Special Education Research, National Longitudinal Transition Study-2 (NLTS2) Wave 3 parent interviews and youth interviews/survey, 2005.

22
Hours Worked by Youth With Disabilities Out of High School 1 to 4 Years, by School-Completion Status
60
16
25
34
57
16
27
33
69
13
18
36
35 or more
21 to 34.9
Fewer than 21
Average hours perweek
PercentAll youth with disabilities School completers Noncompleters
Note: Refers to current or most recent job.U.S. Department of Education, Institute of Education Sciences, National Center for Special Education Research, National Longitudinal Transition Study-2 (NLTS2) Wave 3 parent interviews and youth interviews/survey, 2005.
Hours per week

23
Wages of Youth With Disabilities Out of High School 1 to 4 Years, by School-Completion Status
6
37
64
6
37
65
10
37
61
Less than$5.15
$5.15 to $7.00
More than$7.00 per hour
All youth with disabilities School completers Noncompleters
Note: Refers to current or most recent job.U.S. Department of Education, Institute of Education Sciences, National Center for Special Education Research, National Longitudinal Transition Study-2 (NLTS2) Wave 3 parent interviews and youth interviews/survey, 2005.
Percentage of youth earning hourly wage of:
Percent

24
18
3
18
3
23
2
Their employer isaware of youth's
disability
They receive jobaccommodations
All youth with disabilities School completers Noncompleters
Job Accommodations for Youth With Disabilities Out of High School 1 to 4 Years,
by School-Completion Status
Note: Refers to current or most recent job.U.S. Department of Education, Institute of Education Sciences, National Center for Special Education Research, National Longitudinal Transition Study-2 (NLTS2) Wave 3 parent interviews and youth interviews/survey, 2005.
Percentage of youth who report:
Percent
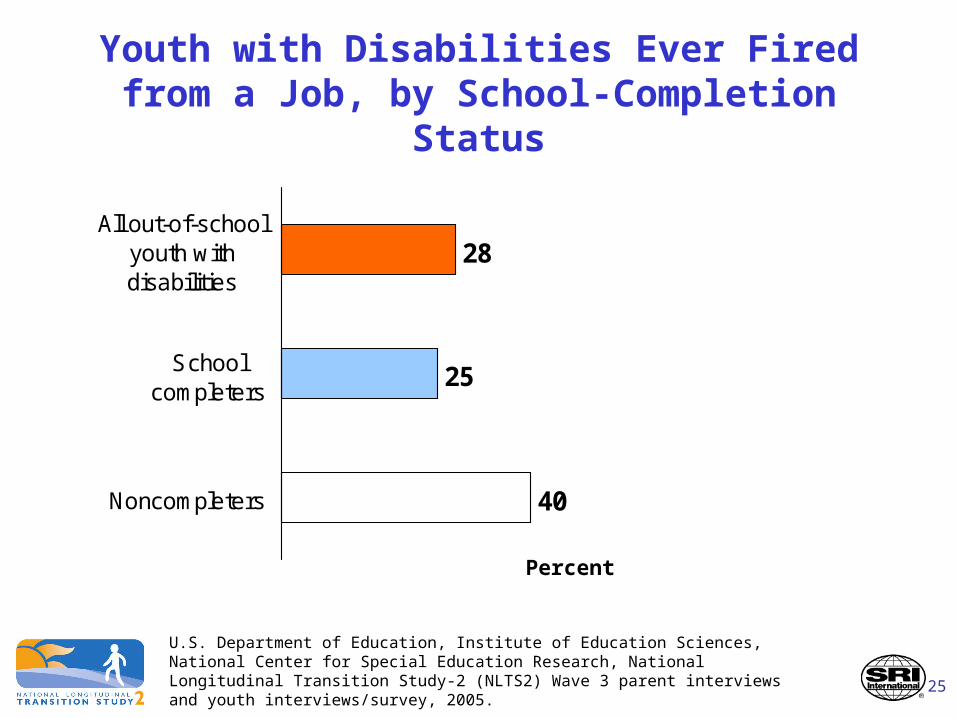
25
25
40
28All out-of-school
youth withdisabilities
Schoolcompleters
Noncompleters
Youth with Disabilities Ever Fired from a Job, by School-Completion Status
U.S. Department of Education, Institute of Education Sciences, National Center for Special Education Research, National Longitudinal Transition Study-2 (NLTS2) Wave 3 parent interviews and youth interviews/survey, 2005.
Percent

26
Engagement in Employment, Postsecondary Education,
and Job Training

27
Engagement of Youth With Disabilities in Employment or Postsecondary Education Since
Leaving High School, by School-Completion Status
22
32
15
31
16
36
9
23
32
33
17
34
Not engaged
Employment only
Postsecondary education only
Employment andpostsecondary education
PercentAll youth with disabilities School completers Noncompleters
*p < .05 comparing high school completers and noncompleters.U.S. Department of Education, Institute of Education Sciences, National Center for Special Education Research, National Longitudinal Transition Study-2 (NLTS2) Wave 3 parent interviews and youth interviews/survey, 2005.
*

28
Engagement of Youth With Disabilities in Employment or Postsecondary Education Since Leaving High
School, by Disability Category
8887
87
85
82
79
73
72
69
61
60
57
Other health impairment
Visual impairment
Hearing impairment
Speech/language impairment
Learning disability
Autism
Orthopedic impairment
Emotional disturbance
Traumatic brain injury
Deaf-blindness
Multiple disabilities
Mental retardation
Percent
Source: U.S. Department of Education, Institute of Education Sciences, National Center for Education Research, National Longitudinal Transition Study-2 (NLTS2), Wave 3 parent interview and youth interview/survey, 2005.
29
Positive and Negative
Community Participation

30
Community Participation of Youth with Disabilities, by School-Completion Status
84
24
27
27
67
84
27
30
30
72
81
8
14
12
44
Got together with friends at leastweekly outside of school or work
Took lessons or classes outsideof school
Took part in volunteer orcommunity service activities
Belonged to out-of-school group
Registered to vote
PercentAll youth with disabilities School completers Noncompleters
*p < .05, **p < .01, ***p < .001comparing high school completers and noncompleters.Source: U.S. Department of Education, Institute of Education Sciences, National Center for Education Research, National Longitudinal Transition Study-2 (NLTS2), Wave 3 parent interview and youth interview/survey, 2005.
***
*
**Youth is:
***
In the past 12 months:

31
Participation in Community-Based Organized Group Activities in the Past 12 Months,
by Disability Category3636
30
30
30
29
28
26
25
22
22
15
Visual impairment
Deaf-blindness
Other health impairment
Speech/language impairment
Hearing impairment
Learning disability
Multiple disabilities
Autism
Orthopedic impairment
Emotional disturbance
Traumatic brain injury
Mental retardation
Percent
Source: U.S. Department of Education, Institute of Education Sciences, National Center for Education Research, National Longitudinal Transition Study-2 (NLTS2), Wave 3 parent interview and youth interview/survey, 2005.

32
Criminal Justice System Involvement of Youth with Disabilities, by School-Completion Status
54
29
17
18
47
23
11
14
73
51
37
33
Been stopped bypolice
Been arrested
Spent the night injail
Been on probationor parole
Percent
All youth with disabilities School completers Noncompleters
**p < .01, ***p < .001comparing high school completers and noncompleters.Source: U.S. Department of Education, Institute of Education Sciences, National Center for Education Research, National Longitudinal Transition Study-2 (NLTS2), Wave 3 parent interview and youth interview/survey, 2005.
***
***
***
**
Youth has ever:
33
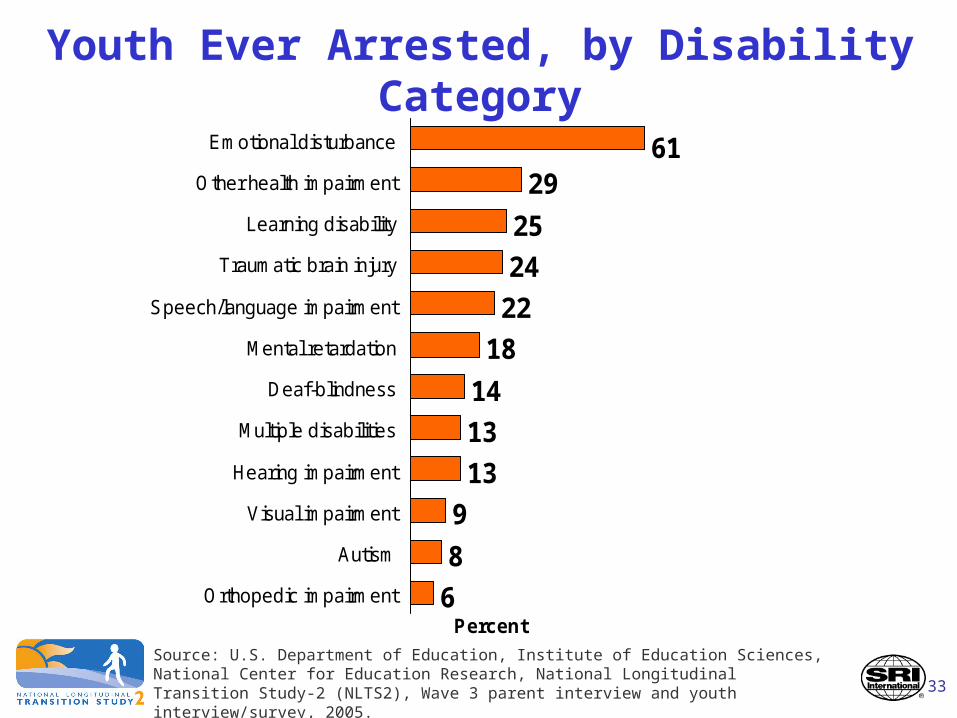
Youth Ever Arrested, by Disability Category
6129
25
24
22
18
14
13
13
9
8
6
Emotional disturbance
Other health impairment
Learning disability
Traumatic brain injury
Speech/language impairment
Mental retardation
Deaf-blindness
Multiple disabilities
Hearing impairment
Visual impairment
Autism
Orthopedic impairment
Percent
Source: U.S. Department of Education, Institute of Education Sciences, National Center for Education Research, National Longitudinal Transition Study-2 (NLTS2), Wave 3 parent interview and youth interview/survey, 2005.

34
Youth Risk Behaviors

35
Smoking Behavior of Youth with Disabilities, by School-Completion Status
67
11
22
72
10
16
44
19
40
Not at all
1 to 29 days
Every day
All youth with disabilities School completers Noncompleters**p < .01 comparing high school completers and noncompleters.Source: U.S. Department of Education, Institute of Education Sciences, National Center for Education Research, National Longitudinal Transition Study-2 (NLTS2), Wave 3 youth interview/survey, 2005.
In the past 30 days reported smoking:
**
**Percent

36
Alcohol Consumption by Youth with Disabilities, by School-Completion Status
49
24
11
16
50
23
11
17
44
32
9
15
Not at all
1 or 2 days
3 to 5 days
6 or moredays
Percent
All youth with disabilities School completers Noncompleters
Source: U.S. Department of Education, Institute of Education Sciences, National Center for Education Research, National Longitudinal Transition Study-2 (NLTS2), Wave 3 youth interview/survey, 2005.
In the past 30 days reported having at least one drink of alcohol:

37
Drug Use by Youth with Disabilities, by School-Completion Status
16
2
3
14
3
3
32
2
5
Marijuana
Cocaine
Other illegaldrug(s)
PercentAll youth with disabilities School completers Noncompleters
*p < 05 comparing high school completers and noncompleters.Source: U.S. Department of Education, Institute of Education Sciences, National Center for Education Research, National Longitudinal Transition Study-2 (NLTS2), Wave 3 youth interview/survey, 2005.
In the past 30 days reported using:
*

38
Sexual Activities of Youth with Disabilities, by School-Completion Status
73
54
87
69
70
51
88
72
90
74
82
59
Has ever been sexually active
Had intercourse in the past 3months
Used any contraceptive during lastintercourse
Used a condom during lastintercourse
Percent
All youth with disabilities School completers Noncompleters
*p < .05 comparing high school completers and noncompleters.Source: U.S. Department of Education, Institute of Education Sciences, National Center for Education Research, National Longitudinal Transition Study-2 (NLTS2), Wave 3 youth interview/survey, 2005.
*
*
*

39
Violence-Related Activities of Youth with Disabilities, by School-Completion Status
11
2
19
11
2
16
13
1
32
Carried aweapon in thepast 30 days
Belongs to agang
Got into aphysical fight
in the pastyear
PercentAll youth with disabilities School completers Noncompleters
Source: U.S. Department of Education, Institute of Education Sciences, National Center for Education Research, National Longitudinal Transition Study-2 (NLTS2), Wave 3 youth interview/survey, 2005.

40
Youth Who Drank Alcohol in the Past 30 Days, by Disability Category
59
55
48
46
45
40
40
28
23
23
19
Emotional disturbance
Learning disability
Visual impairment
Speech/language impairment
Other health impairment
Traumatic brain injury
Hearing impairment
Multiple disabilities
Orthopedic impairment
Mental retardation
Autism
Percent
Note: There were too few youth with deaf-blindness to report separately.Source: U.S. Department of Education, Institute of Education Sciences, National Center for Education Research, National Longitudinal Transition Study-2 (NLTS2), Wave 3 youth interview/survey, 2005.

41
Living Arrangements
and Family Formation

42
14
14
14All out-of-school
youth withdisabilities
Schoolcompleters
Noncompleters
Youth with Disabilities Have Ever Lived Independently Since High School,
by School-Completion Status
Note: Independently includes living alone or with a spouse or room mate.Source: U.S. Department of Education, Institute of Education Sciences, National Center for Education Research, National Longitudinal Transition Study-2 (NLTS2), Wave 3 parent interview and youth interview/survey, 2005.
Percent

43
Has Ever Lived Independently Since High School, by Disability Category
2929
26
19
18
15
15
12
11
11
8
7
Deaf-blindness
Visual impairment
Hearing impairment
Mental retardation
Emotional disturbance
Other health impairment
Speech/language impairment
Orthopedic impairment
Learning disability
Multiple disabilities
Autism
Traumatic brain injury
PercentNote: Independently includes living alone or with a spouse or roommate.Source: U.S. Department of Education, Institute of Education Sciences, National Center for Education Research, National Longitudinal Transition Study-2 (NLTS2), Wave 3 parent interview and youth interview/survey, 2005.
44
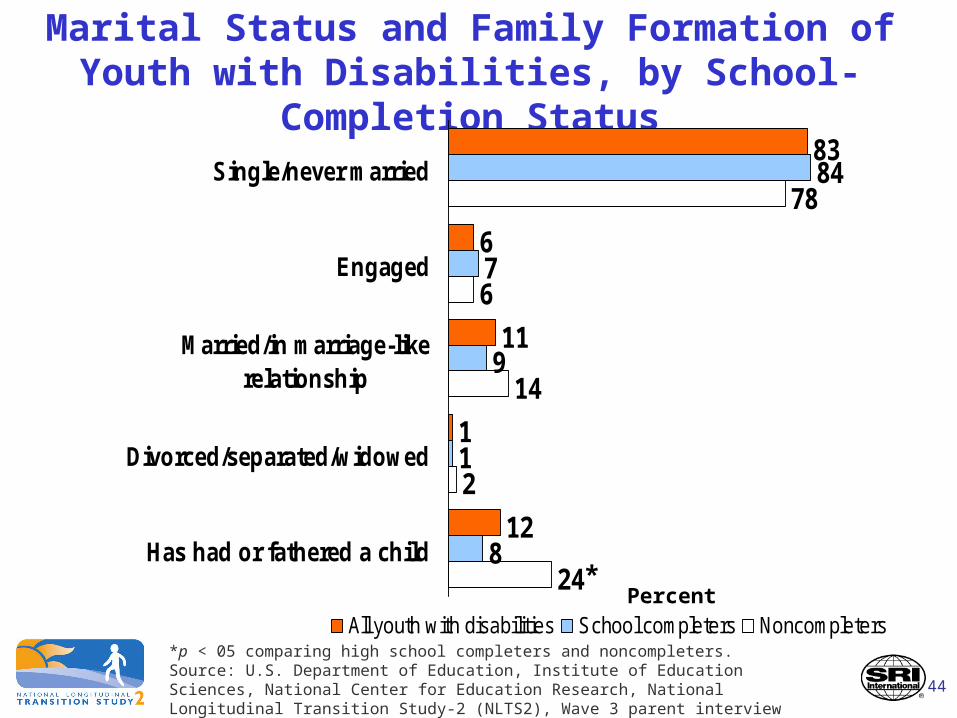
Marital Status and Family Formation of Youth with Disabilities, by School-Completion Status
83
6
11
1
12
84
7
9
1
8
78
6
14
2
24
Single/never married
Engaged
Married/in marriage-likerelationship
Divorced/separated/widowed
Has had or fathered a child
All youth with disabilities School completers Noncompleters*p < 05 comparing high school completers and noncompleters.Source: U.S. Department of Education, Institute of Education Sciences, National Center for Education Research, National Longitudinal Transition Study-2 (NLTS2), Wave 3 parent interview and youth interview/survey, 2005.
*Percent

45
Has Ever Had or Fathered a Child, by Disability Category
17
17
15
11
10
7
6
6
6
4
1
Emotional disturbance
Traumatic brain injury
Mental retardation
Learning disability
Speech/language impairment
Hearing impairment
Visual impairment
Other health impairment
Orthopedic impairment
Multiple disabilities
Autism
Percent
Note: There were too few youth with deaf-blindness to report separately.Source: U.S. Department of Education, Institute of Education Sciences, National Center for Education Research, National Longitudinal Transition Study-2 (NLTS2), Wave 3 parent interview and youth interview/survey, 2005.

46
For more information:
www.nlts2.org
Full Reports Fact Sheets & Data Briefs
Executive Summaries Data Tables