Embed Size (px)
Citation preview

Timeline:
• Divide learners into 4 groups at different tables (this approach is suggested for groups of 8 or more
learners and should be modified to 1 or 2 groups at sites with lower numbers of learners)
• 5 min large group review of the Unit 1 Summary “Approach to Ischemia”
• Give each group 2 copies of the Unit 1 EKG Challenges Packet (merged challenge EKG content for EKGs 1-
4), this allows learner groups to all review content and record their group's answers to the interpretation
and questions for each EKG
• Allow 20 minutes for groups to complete the 4 challenges (give updates at 5min increments)
• 20 minutes large group discussion of answers to challenges. May consider asking each group to present
their responses to a different EKG
Meeting Resources:
• Notify learners in advance of the session that they need to review the unit summary and challenge EKGs
• Before the session, have a few copies of the unit summary (pages 2-6 of this document) printed to give to
learners who forgot their copies/devices and copies of the Unit 1 EKG Challenges Packet to give to groups
• Before the session, make sure to print this document for your own reference during the group discussion
• After the meeting, send out the answer document to learners for independent review
Foundations EKG I
Unit 1 Instructor—Approach to Ischemia

Foundations EKG I Unit 1 Instructor—Approach to Ischemia
Unit 1, Case 1—57 y/o M with PMH of HL, DM2 c/o palpitations and SOB for the past 72 hours. Sent to the ED from PMD’s office.
Challenge Questions: What are the critical actions for this patient once the EKG diag-nosis has been made and your clinical assessment is completed? What EKG finding is most sensitive for ongoing ischemia?
HR: 95 BP: 160/110
RR: 18 O2 Sat: 96%
Unit 1, Case 4—67yM with history of CAD, DM2, HTN c/o crushing CP & diaphoresis for 45 minutes. No old EKG but he states his doctor told him to tell others MDs that he has a LBBB.
Challenge Question: How relevant is a prior LBBB to the diagnosis of STEMI?
What criteria should be used when evaluating this EKG for signs of ischemia?
HR: 90 BP: 140/90
RR: 16 O2 Sat: 100%
Unit 1, Case 3—53 y/o F with history of smoking and hyperlipidemia with chest pain for the past 2 hours.
Challenge Questions: What changes on the standard EKG are suggestive of this diag-nosis? Where should you place leads to get the 2nd EKG?
HR: 95 BP: 130/110
RR: 18 O2 Sat: 96%
Unit 1, Case 2—65yM with history of GERD complaining of indigestion and nausea.
Challenge Questions: What 2 conditions are frequently associated with this EKG pattern and how frequently do they occur? What EKG pattern is frequently associat-ed? How can you confirm? What medication is relatively contraindicated with this EKG pattern? Why?
HR: 60 BP: 160/110
RR: 18 O2 Sat: 96%

The accurate diagnosis of ST elevation myocardial infarction (STEMI) is one of the most time critical duties in the practice of
EM. Diagnosis is not always easy so guidelines can help but realize there may be local, regional, and national variation.
The most recent US-focused consensus on STEMI criteria:
• > 1mm of new STE above the J-point in two contiguous leads (except V2-3)
• V2-3 Specifics
Men: > 2mm of new STE above the J-point
Women: > 1.5mm of new STE above the J-point
• Left Bundle Branch Block
The presence of a LBBB complicates the interpretation of STEMI and requires application of the Sgarbossa and
Modified Sgarbossa criteria that are well described by this CORE EM blog post (https://coreem.net/core/stemi-lbbb/).
Patients with a truly new LBBB resulting from an occluded artery are usually very sick.
The most recent international consensus guideline The 3rd Universal Diagnosis of Acute MI provides the following specific
criteria for posterior and right ventricular MI:
Posterior Lead (V7-9)
> 0.5mm of new STE above the J-point. Except in men under 40: > 1mm of new STE above the J-point
Right Sided Lead (V3R & V4R)
> 0.5mm of new STE above the J-point. Except in Men under 30: > 1mm of new STE above the J-point
Foundations EKG I - Unit 1 Summary

The J point marks the start of ventricular repolarization at the end of the QRS complex and the beginning of the ST Segment.
It is the landmark that guides ST elevation (STE) measurement.
The morphologic abnormalities associated with STEMI can make it difficult to identify the J-point. On the right are several examples with the J-point (Green →) highlighted.
Measure STE from isoelectric line to J point. The isoelectric line is best defined as the segment between the T and P waves (aka TP segment) as the heart is electrically silent. The isoelectric line (Blue →) and STE (Red →) are highlighted.
Identifying the J-Point & Measuring ST Elevation

When the STEMI guidelines refer to contiguous leads they are referring to the territorial regions of the heart that the leads
generally represent. For example, any combination of pathologic STE in at least 2 leads that are right next to each other (i.e.
contiguous) in the septal/anterior/lateral leads V1/V2/V3/V4/V5/V6 would rule in STEMI but STE in V1 & V6 would not
because they are not contiguous. Along the same lines, STE in II & III would rule in STEMI but I and aVR would not. Finally,
any combination of II, III, and aVF with pathologic STE would rule in STEMI. For a deeper review of contiguous and reciprocal
leads please see this post by Tom Boughillet of EMS 12 Lead—goo.gl/3zgZGu.
Localization of Myocardial Infarction
I—Lateral/High
Lateral
aVR—only Right
Facing Lead V1—Septal V4—Anterior
II—Inferior aVL—Lateral/
High Lateral V2—Septal V5—Lateral
III—Inferior aVF—Inferior V3—Anterior V6—Lateral

The 12 lead EKG is a great tool, however, it is imperfect. For example, ST depression (STD) can either represent a reciprocal
change from ST elevation on the opposite side of the heart or ischemia without associated STE. The causes of reciprocal
change are beyond the scope of this summary but essentially they are the mirror image of the STEMI on the opposite side of
the heart. The standard 12 lead has no posterior leads so an isolated posterior STEMI would not cause STE unless posterior
leads were placed. Instead the only evidence of posterior STEMI could be reciprocal STD in V1-3 . This table shows typical
reciprocal change patterns. It is important to realize that reciprocal changes are not always present in STEMI and also that
reciprocal changes may be earliest sign of STEMI!
Localization of Myocardial Infarction Continued
Infarction Distribution ST Elevation ST Depression
(Reciprocal Change)
Anterior Wall V1—V4, I, aVL II, III, & aVF
Lateral Wall I, aVL, V5, V6 V1
Also Right sided leads
Inferior Wall II, III, aVF V1—V4, I, aVL
Right Ventricle III > II and usually V1 > V2
(V2R, V3R, V4R) V2
Posterior Wall Posterior Leads V7, V8, V9 V1-V3
(often tall R waves)

Although ST Elevation is likely the best known EKG change associated with ischemia there are many overt and subtle changes:
T Wave Inversion (TWI)—The best way to think about TWI is a loss of T wave amplitude (height
above the isoelectric line) because before a T Wave becomes inverted it first loses amplitude
until it is flat and then finally inverts. Loss of amplitude and flattening can represent early
ischemia. Finally, don’t fall into the trap of attributing localization to T waves because, unlike ST
elevation, T wave changes do not localize.
R Wave Amplitude—Loss of R wave amplitude should be concerning for active ischemia or prior myocardial
infarction in the right clinical scenario. In fact, a complete loss of R wave amplitude results in in a Q wave.
This finding can certainly be confounded by lead placement, effusion, or a change in habitus however so it is
always reasonable to repeat the EKG.
ST Depression—Like ST elevation, ST depression (STD) is best measured from the isolectric line. Occasionally, STD is very
significant and easy to measure, but much more frequently it is very minimal and difficult to measure. Avoid the temptation
to ignore subtle ST depression. Finally, like T wave changes don’t forget that STD doesn’t localize.
Hyperacute T Waves—T waves that are much larger than their respective R waves (particularly
when they are preceded by Q wave or near Q waves) should be very concerning for ischemia. Early
repolarization can be difficult to distinguish from hyperacute T waves so a good history and
comparison to old EKGs if available is critical.
Ischemia is usually associated with a prolonged QT interval and patients are more likely to be bradycardic than tachycardic.
These changes should only trigger suspicion and are neither sensitive or specific for ischemia.
Other EKG Changes Suggestive of Ischemia
Created by William Burns, MD. Edited by Nick Hartman, MD; Kristen Grabow Moore, MD, Med; & Shanna Jones, MD.

EKG interpretation is a difficult skill that requires deliberate practice to gain mastery. A formulaic
method for interpretation minimizes missed diagnoses and provides a strategy for dealing with EKGs
when the diagnosis is not immediately apparent. Below are two example interpretation strategies
Rule of Fours “Standard”
Four Initial Features: History/Clinical Picture Rate
Rate Rhythm
Rhythm Axis
Axis Intervals
Four Waves: P Waves Hypertrophy
Q/R/S Waves Ischemia
T Waves
U Waves
Four Intervals/Segments: PR Interval
QRS Width
ST Segment
QT Interval
Rule of Fours adapted from Gerard Fennessy (@doctorgerard) and Life in the Fast Lane
Creative Commons License
Foundations EKG - Unit 1

39yF with no PMHx with chest pain. HR: 95 BP: 160/110 RR: 18 O2 Sat: 96%
Example Case
History/Clinical Picture—39 year old woman with no known comorbidities or risk factors
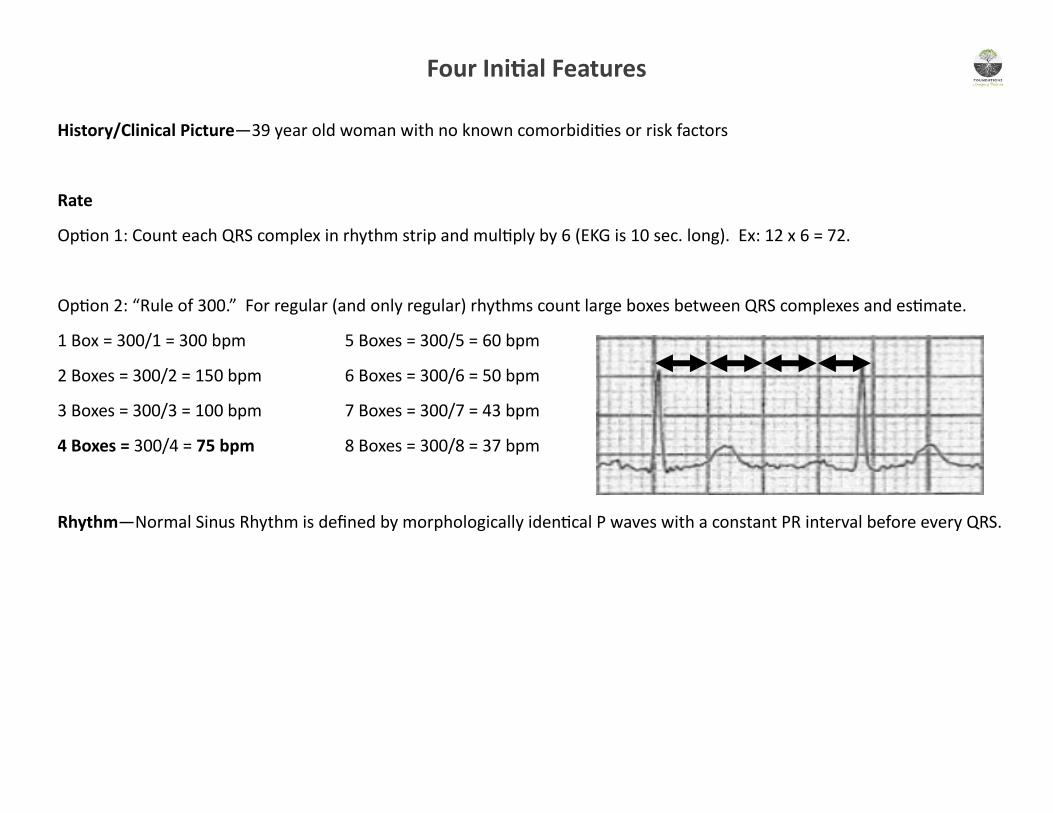
Rate
Option 1: Count each QRS complex in rhythm strip and multiply by 6 (EKG is 10 sec. long). Ex: 12 x 6 = 72.
Option 2: “Rule of 300.” For regular (and only regular) rhythms count large boxes between QRS complexes and estimate.
1 Box = 300/1 = 300 bpm 5 Boxes = 300/5 = 60 bpm
2 Boxes = 300/2 = 150 bpm 6 Boxes = 300/6 = 50 bpm
3 Boxes = 300/3 = 100 bpm 7 Boxes = 300/7 = 43 bpm
4 Boxes = 300/4 = 75 bpm 8 Boxes = 300/8 = 37 bpm
Rhythm—Normal Sinus Rhythm is defined by morphologically identical P waves with a constant PR interval before every QRS.
Four Initial Features

Axis—Modern EKG machines are generally quite good at determining the axis value but it is still important to know how
axis deviation is defined. Machine read was 50 on this EKG.
Axis can be often be manually determined by evaluating whether leads I & aVF are positive, equiphasic or negative. How-
ever when the axis is unclear, like the difference between pathologic and physiologic left axis deviation the tie breaker is
lead II.
Four Initial Features
Images courtesy of Life in the Fast Lane Creative Commons License
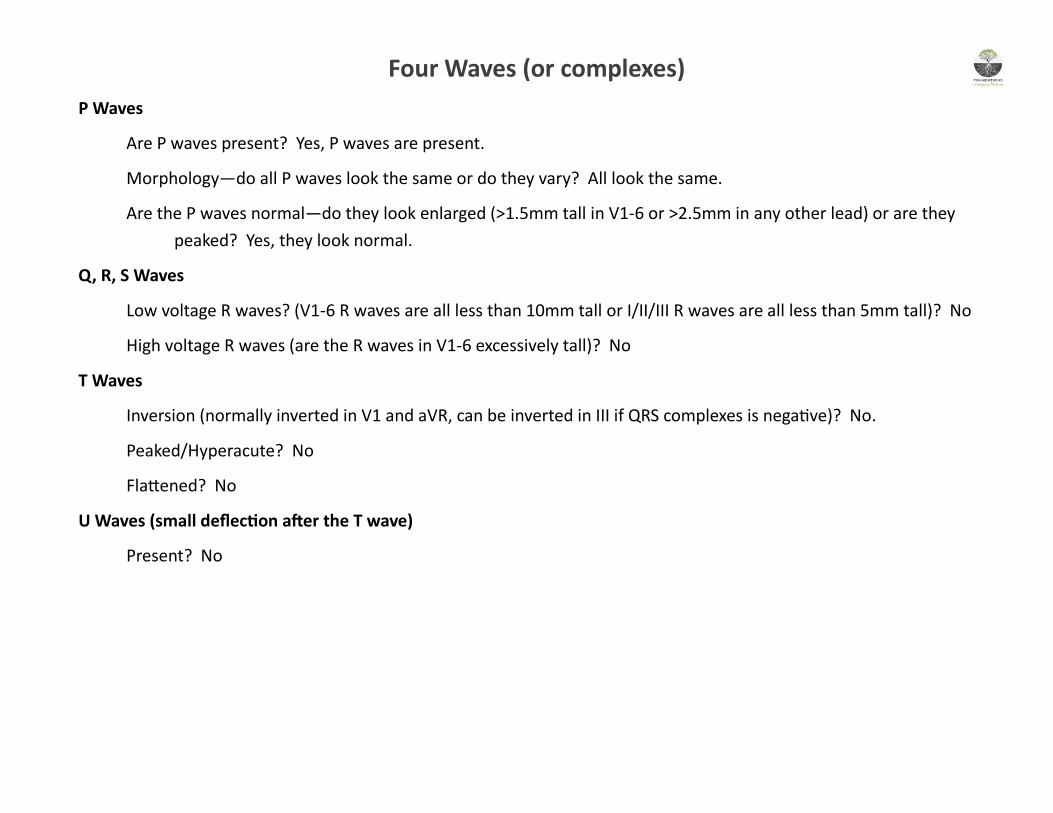
P Waves
Are P waves present? Yes, P waves are present.
Morphology—do all P waves look the same or do they vary? All look the same.
Are the P waves normal—do they look enlarged (>1.5mm tall in V1-6 or >2.5mm in any other lead) or are they
peaked? Yes, they look normal.
Q, R, S Waves
Low voltage R waves? (V1-6 R waves are all less than 10mm tall or I/II/III R waves are all less than 5mm tall)? No
High voltage R waves (are the R waves in V1-6 excessively tall)? No
T Waves
Inversion (normally inverted in V1 and aVR, can be inverted in III if QRS complexes is negative)? No.
Peaked/Hyperacute? No
Flattened? No
U Waves (small deflection after the T wave)
Present? No
Four Waves (or complexes)

PR Interval
Machine read was 178 on this EKG.
Normal PR? Yes, normal range is 120-200ms.
QRS Complexes
Normal width (70-100ms)? Yes, the QRS complexes are 94 ms
Critical diagnoses that affect QRS morphology (Brugada, WPW, new bundle branch block, TCA Overdose)? No.
ST Segments
Any ST elevation? No.
Any ST depression? No.
QT Interval
Machine read was 424 on this EKG.
Normal QTc? Yes, normal upper limit is 440ms for men and 460ms for women.
Four Intervals (or segments)
Created by William Burns, MD. Edited by Nick Hartman, MD; Kristen Grabow Moore, MD, MEd; & Shanna Jones, MD.

57 y/o M with PMH of HL, DM2 c/o palpitations and SOB for
the past 72 hours. Sent to the ED from PMD’s office. HR: 95 BP: 160/110
RR: 18 O2 Sat: 96%
What is your interpretation of the EKG?
History/Clinical Picture
Rate
Rhythm
Axis
P Waves
Q/R/S Waves
T Waves
U Waves
PR Interval
QRS Width
ST Segment
QT Interval
What are the critical actions for this patient once the EKG
diagnosis has been made and your clinical assessment is
completed?
What EKG finding is most sensitive for ongoing ischemia?
Foundations EKG - Unit 1, Case 1

Triage EKG—Unit 1, Case 1

What is your interpretation of the EKG?
History/Clinical Picture—multiple cardiac risk factors (DM2, HL, age) and anginal equivalents
Rate— ~108 (18 x 6 or slightly larger than 3 large boxes)
Rhythm—Sinus Tachycardia with rare PACs
Axis— Lead I is positive which makes normal, physiologic left axis deviation (LAD), and pathologic LAD possible
Lead aVF/III are negative which makes physiologic LAD or pathologic LAD possible
Lead II is the tiebreaker and is essentially equiphasic ruling in physiologic LAD which is normal
P Waves—P waves and premature atrial contraction (after 9th T wave)
Q/R/S Waves—Possibly pathologic Q Waves I & aVL
T Waves—T wave Inversion in V5-6, I, II, aVL
U Waves—No pathologic U waves noted
PR Interval—Normal at ~130ms
QRS Width—Narrow
ST Segment—Massive, “tombstoning” ST elevation V2 with associated ST elevation in V3-5, I, and aVL
QT Interval—Prolonged. Most obvious in leads V1-3.
Diagnosis—This EKG is consistent with an Anterolateral STEMI
What are the critical actions for this patient once the EKG diagnosis has been made and your clinical assessment is
completed?
- IV, O2, Monitor, prepare to defibrillate/cardiovert as needed, chewable aspirin, nitrates/morphine for pain
- Activate cardiology/cath lab if available or tPA and coordination of transfer to PCI capable center
What EKG finding is most sensitive for ongoing ischemia? ST Depression is the most sensitive for ongoing ischemia
Created by William Burns, MD Edited by Nick Hartman, MD & Kristen Grabow Moore, MD, MEd
Resource Links: Life in the Fast Lane — great overview Dr. Steve Smith’s Blog – good case
Unit 1, Case 1—Anterolateral STEMI
65yM with history of GERD complaining of indigestion and nausea. HR: 60 BP: 160/110
RR: 18 O2 Sat: 96%
What is your interpretation of the EKG?
History/Clinical Picture
Rate
Rhythm
Axis
P Waves
Q/R/S Waves
T Waves
U Waves
PR Interval
QRS Width
ST Segment
QT Interval
What 2 conditions are frequently associated with this EKG
pattern and how frequently do they occur? What EKG
pattern is frequently associated? How can you confirm?
What medication is relatively contraindicated with this
EKG pattern? Why?
Foundations EKG - Unit 1, Case 2

Triage EKG—Unit 1, Case 2
Created by William Burns, MD Edited by Nick Hartman, MD & Kristen Grabow Moore, MD

What is your interpretation of the EKG?
History/Clinical Picture—age and possible anginal equivalent symptoms
Rate—66 (11 x 6) or ~66 (>5 large boxes)
Rhythm—Sinus Rhythm
Axis—Normal, positive in I & aVF
P Waves—normal
Q/R/S Waves—Q Waves II, III, aVF
T Waves—T wave Inversion in aVL
U Waves—No pathologic U waves noted
PR Interval—Normal at ~140ms
QRS Width—Narrow
ST Segment—ST elevation in II, III, and aVF with reciprocal ST depression in I, aVL, V1, V2
QT Interval—Normal
Diagnosis—This EKG is consistent with an Inferior STEMI
Life in the Fast Lane — great overview Dr. Steve Smith’s Blog – good case
Unit 1, Case 2—Inferior STEMI

What 2 conditions are frequently associated with this EKG pattern? How frequently do they occur?
Significant bradycardia resulting from 2nd or 3rd degree AV block occurs 20% of the time with inferior MIs.
Right ventricular infarction occurs concurrently with inferior MIs 40% of the time.
What EKG pattern is frequently associated? The following are associated with concomitant RV infarct: ST elevation in lead III
that is greater than lead II, reciprocal depression in I, and ST elevation in V1.
How can you confirm? Right sided EKG—remember only 0.5mm STE in a single lead rules in STEMI (except men < 30 =1mm)
What medication is relatively contraindicated with this EKG pattern? Why?
Nitroglycerin can cause severe hypotension when given to patients with RV infarctions so it is critical that you rule it out first.
Created by William Burns, MD Edited by Nick Hartman, MD & Kristen Grabow Moore, MD, MEd
Unit 1, Case 2—Inferior STEMI

53 y/o F with history of smoking and hyperlipidemia with
chest pain for the past 2 hours. HR: 95 BP: 130/110
RR: 18 O2 Sat: 96%
What is your interpretation of the EKG?
History/Clinical Picture
Rate
Rhythm
Axis
P Waves
Q/R/S Waves
T Waves
U Waves
PR Interval
QRS Width
ST Segment
QT Interval
What changes on the standard EKG are suggestive of this
diagnosis?
Foundations EKG I - Unit 1, Case 3

Triage EKG—Unit 1, Case 3

Repeat EKG—Unit 1, Case 3

What is your interpretation of the Triage EKG?
History/Clinical Picture—multiple cardiac risk factors (smoking, HL, age) and active CP
Rate—72 (12 x 6) or ~75 (4 large boxes)
Rhythm—Sinus Rhythm
Axis—Normal, predominantly positive in I and aVF
P Waves—normal, no clear enlargement or peaking
Q/R/S Waves—Q wave present in aVL
T Waves—T wave flattening in aVL, atypical biphasic appearance in V2-3
U Waves—no pathologic U waves noted
PR Interval—approximately 160ms, no PR depression or elevation
QRS Width—narrow
ST Segment—1mm ST depression in V1-2
QT Interval—not prolonged
Diagnosis—Ischemic changes concerning for posterior STEMI
Unit 1, Case 3—Posterior STEMI
Resources Links: Life in the Fast Lane Dr. Steve Smith’s Blog

What is your interpretation of the second EKG (repeat)?
History/Clinical Picture—multiple cardiac risk factors (smoking, HL, age) and active CP
Rate—72 (12 x 6) or ~75 (4 large boxes)
Rhythm—Sinus Rhythm
Axis—Normal, predominantly positive in I and aVF
P Waves—normal, no clear enlargement or peaking
Q/R/S Waves—Q wave present in aVL
T Waves—T wave flattening in aVL, atypical biphasic appearance in V2-3
U Waves—no pathologic U waves noted
PR Interval—approximately 160ms, no PR depression or elevation
QRS Width—narrow
ST Segment—1.5mm ST elevation in V7, 1mm in V8 & V9
QT Interval—not prolonged
Diagnosis—Posterior STEMI given ST elevation in V7-9 equal to or greater than 0.5mm
Unit 1, Case 3—Posterior STEMI
Resources Links: Life in the Fast Lane Dr. Steve Smith’s Blog

What changes on the standard EKG are suggestive of this diagnosis?
ST depression in V1, V2, or V3 which represent ST elevation in posterior surface of the heart
R wave larger than S wave in V1-2 and wide R waves (greater than 30ms) which represent Q waves in posterior
surface of the heart.
Terminally positive T waves which represent terminally negative T waves in the posterior surface of the heart
Where should you place leads to get the 2nd EKG?
Unit 1, Case 3—Posterior STEMI
Created by William Burns, MD. Edited by Nick Hartman, MD; Kristen Grabow Moore, MD, Med; & Shanna Jones, MD.
V7 V8 V9

67yM with history of CAD, DM2, HTN c/o crushing CP & diaphoresis
for 45 minutes. No old EKG but he states his doctor told him to tell
others MDs that he has a LBBB.
What is your interpretation of the EKG?
History/Clinical Picture
Rate
Rhythm
Axis
P Waves
Q/R/S Waves
T Waves
U Waves
PR Interval
QRS Width
ST Segment
QT Interval
How relevant is a prior LBBB to the diagnosis of STEMI?
What criteria should be used when evaluating this EKG
for signs of ischemia?
Foundations EKG - Unit 1, Case 4
HR: 90 BP: 140/90
RR: 16 O2 Sat: 100%

Triage EKG—Unit 1, Case 4
EKG courtesy of Robert Cooney, MD, MS

What is your interpretation of the EKG?
History/Clinical Picture—age and possible anginal equivalent symptoms
Rate—90 (15 x 6)
Rhythm—Sinus
Axis—Normal but leftward between 0 and –30 (I positive, II positive)
P Waves—normal morphology
Q, R, S Waves—no Q waves
T Waves—bizarre morphology particularly in V1 through V5
U Waves—no pathologic U waves noted
PR Interval—normal, ~180ms
QRS Width—wide, ~160ms
ST Segment
Concordant ST elevation: 2mm in V6
Discordant ST elevation: 2mm in V1, 5mm in V2, 5mm in V3, 4mm in V4, 4mm in V5, 2mm in III
Concordant ST Depression: none
QT Interval—normal with QTc ~440
Diagnosis—This EKG is consistent with STEMI (likely Anterolateral)
Unit 1, Case 4—Sgarbossa STEMI

How relevant is a prior LBBB to the diagnosis of STEMI?
A new or old LBBB that doesn’t meet the Sgarbossa or Smith criteria does not appear to be relevant to the diagnosis of
STEMI in emergency department patients. A study by Chang et al of nearly 8,000 ED presentations compared patients with a
new LBBB, old LBBB, and no LBBB and found no difference between the rates of AMI across all three groups.
Study link: http://www.ncbi.nlm.nih.gov/pubmed/19857407
What criteria should be used when evaluating this EKG for signs of ischemia?
Sgarbossa Criteria (Score > 3 is 90% specific for AMI, however overall poor sensitivity)
A. Concordant STE > 1mm = 5 points (STE in lead with positive QRS)
B. Concordant STD > 1mm in V1-3 = 3 points (STD in lead with negative QRS)
C. Discordant STE > 5mm = 2 points (STE in lead with negative QRS)
In the original study only the discordant STE > 5mm criteria met statistical significance but a single other criteria with a
good clinical history for occlusion should be concerning
Resource Links: Dr. Steve Smith’s Blog—Great lecture Life in the Fast Lane—General information
Created by William Burns, MD. Edited by Nick Hartman, MD; Kristen Grabow Moore, MD, MEd; & Shanna Jones, MD.
Unit 1, Case 4—Sgarbossa STEMI
![Foundations EKG Unit 1, Case 4 · Foundations EKG 04 - Page Width U01.C04 - Sgarbossa 17-18 revl.pub - Publisher William Burns C] Boundaries Rulers C] Graphics Manager Guides Single](https://img.dokumen.tips/doc/110x75/5e3b895fcd645b667e47cb2b/foundations-ekg-unit-1-case-4-foundations-ekg-04-page-width-u01c04-sgarbossa.jpg)