Embed Size (px)
Citation preview

UNITED STATES SECURITIES AND EXCHANGE COMMISSIONWashington, D.C. 20549
Form 10-QÈ QUARTERLY REPORT PURSUANT TO SECTION 13 OR 15(d) OF THE SECURITIES
EXCHANGE ACT OF 1934
For the quarterly period ended June 30, 2017
or
‘ TRANSITION REPORT PURSUANT TO SECTION 13 OR 15(d) OF THE SECURITIESEXCHANGE ACT OF 1934
For the transition period from to
Commission File Number: 001-14965
The Goldman Sachs Group, Inc.(Exact name of registrant as specified in its charter)
Delaware 13-4019460(State or other jurisdiction of
incorporation or organization)(I.R.S. Employer
Identification No.)
200 West Street, New York, N.Y. 10282(Address of principal executive offices) (Zip Code)
(212) 902-1000(Registrant’s telephone number, including area code)
Indicate by check mark whether the registrant (1) has filed all reports required to be filed by Section 13 or 15(d) of theSecurities Exchange Act of 1934 during the preceding 12 months (or for such shorter period that the registrant was requiredto file such reports), and (2) has been subject to such filing requirements for the past 90 days. È Yes ‘ No
Indicate by check mark whether the registrant has submitted electronically and posted on its corporate Web site, if any, everyInteractive Data File required to be submitted and posted pursuant to Rule 405 of Regulation S-T (§232.405 of this chapter)during the preceding 12 months (or for such shorter period that the registrant was required to submit and post such files).È Yes ‘ No
Indicate by check mark whether the registrant is a large accelerated filer, an accelerated filer, a non-accelerated filer, a smallerreporting company, or an emerging growth company. See the definitions of “large accelerated filer,” “accelerated filer,”“smaller reporting company” and “emerging growth company” in Rule 12b-2 of the Exchange Act.
Large accelerated filer È Accelerated filer ‘
Non-accelerated filer ‘ (Do not check if a smaller reporting company) Smaller reporting company ‘
Emerging growth company ‘
If an emerging growth company, indicate by check mark if the registrant has elected not to use the extended transition periodfor complying with any new or revised financial accounting standards provided pursuant to Section 13(a) of the ExchangeAct. ‘
Indicate by check mark whether the registrant is a shell company (as defined in Rule 12b-2 of the Exchange Act).‘ Yes È No
APPLICABLE ONLY TO CORPORATE ISSUERS
As of July 21, 2017, there were 386,875,130 shares of the registrant’s common stock outstanding.

THE GOLDMAN SACHS GROUP, INC. AND SUBSIDIARIESQUARTERLY REPORT ON FORM 10-Q FOR THE QUARTER ENDED JUNE 30, 2017
INDEX
Form 10-Q Item Number Page No.
PART I
FINANCIAL INFORMATION 1Item 1
Financial Statements (Unaudited) 1Condensed Consolidated Statements of Earnings 1Condensed Consolidated Statements of
Comprehensive Income 2Condensed Consolidated Statements of Financial
Condition 3Condensed Consolidated Statements of Changes in
Shareholders’ Equity 4Condensed Consolidated Statements of Cash Flows 5Notes to Condensed Consolidated Financial
Statements 6Note 1. Description of Business 6Note 2. Basis of Presentation 6Note 3. Significant Accounting Policies 7Note 4. Financial Instruments Owned and Financial
Instruments Sold, But Not Yet Purchased 14Note 5. Fair Value Measurements 15Note 6. Cash Instruments 16Note 7. Derivatives and Hedging Activities 22Note 8. Fair Value Option 34Note 9. Loans Receivable 41Note 10. Collateralized Agreements and Financings 44Note 11. Securitization Activities 48Note 12. Variable Interest Entities 50Note 13. Other Assets 54Note 14. Deposits 56Note 15. Short-Term Borrowings 57Note 16. Long-Term Borrowings 57Note 17. Other Liabilities and Accrued Expenses 60Note 18. Commitments, Contingencies and
Guarantees 60Note 19. Shareholders’ Equity 64Note 20. Regulation and Capital Adequacy 67Note 21. Earnings Per Common Share 76Note 22. Transactions with Affiliated Funds 76Note 23. Interest Income and Interest Expense 77Note 24. Income Taxes 77Note 25. Business Segments 78Note 26. Credit Concentrations 80Note 27. Legal Proceedings 81
Page No.
Report of Independent Registered PublicAccounting Firm 89
Statistical Disclosures 90Item 2
Management’s Discussion and Analysis of FinancialCondition and Results of Operations 92
Introduction 92Executive Overview 92Business Environment 93Critical Accounting Policies 94Recent Accounting Developments 96Use of Estimates 96Results of Operations 97Balance Sheet and Funding Sources 108Equity Capital Management and Regulatory Capital 113Regulatory Matters and Developments 118Off-Balance-Sheet Arrangements and Contractual
Obligations 121Risk Management 123
Overview and Structure of Risk Management 123Liquidity Risk Management 127Market Risk Management 135Credit Risk Management 140Operational Risk Management 146Model Risk Management 147
Available Information 148Cautionary Statement Pursuant to the U.S. Private
Securities Litigation Reform Act of 1995 149Item 3
Quantitative and Qualitative Disclosures AboutMarket Risk 150
Item 4
Controls and Procedures 150PART II
OTHER INFORMATION 150Item 1
Legal Proceedings 150Item 2
Unregistered Sales of Equity Securities and Use ofProceeds 150
Item 6
Exhibits 151SIGNATURES 151
Goldman Sachs June 2017 Form 10-Q

PART I. FINANCIAL INFORMATIONItem 1. Financial Statements (Unaudited)
THE GOLDMAN SACHS GROUP, INC. AND SUBSIDIARIES
Condensed Consolidated Statements of Earnings(Unaudited)
Three MonthsEnded June
Six MonthsEnded June
in millions, except per share amounts 2017 2016 2017 2016
Revenues
Investment banking $1,730 $1,787 $ 3,433 $ 3,250Investment management 1,433 1,260 2,830 2,522Commissions and fees 794 777 1,565 1,694Market making 1,915 2,490 4,333 4,352Other principal transactions 1,227 864 2,448 815Total non-interest revenues 7,099 7,178 14,609 12,633
Interest income 3,220 2,530 5,966 4,878Interest expense 2,432 1,776 4,662 3,241Net interest income 788 754 1,304 1,637Net revenues, including net interest income 7,887 7,932 15,913 14,270
Operating expenses
Compensation and benefits 3,233 3,331 6,524 5,993
Brokerage, clearing, exchange and distribution fees 663 625 1,278 1,316Market development 141 112 275 234Communications and technology 224 205 447 402Depreciation and amortization 265 245 522 484Occupancy 190 181 366 364Professional fees 229 231 434 451Other expenses 433 539 1,019 987Total non-compensation expenses 2,145 2,138 4,341 4,238Total operating expenses 5,378 5,469 10,865 10,231
Pre-tax earnings 2,509 2,463 5,048 4,039Provision for taxes 678 641 962 1,082Net earnings 1,831 1,822 4,086 2,957Preferred stock dividends 200 188 293 123Net earnings applicable to common shareholders $1,631 $1,634 $ 3,793 $ 2,834
Earnings per common share
Basic $ 4.00 $ 3.77 $ 9.24 $ 6.47Diluted $ 3.95 $ 3.72 $ 9.10 $ 6.39
Dividends declared per common share $ 0.75 $ 0.65 $ 1.40 $ 1.30
Average common shares
Basic 406.1 431.9 409.3 436.2Diluted 413.3 439.2 416.7 443.2
The accompanying notes are an integral part of these condensed consolidated financial statements.
1 Goldman Sachs June 2017 Form 10-Q

THE GOLDMAN SACHS GROUP, INC. AND SUBSIDIARIES
Condensed Consolidated Statements of Comprehensive Income(Unaudited)
Three MonthsEnded June
Six MonthsEnded June
$ in millions 2017 2016 2017 2016
Net earnings $1,831 $1,822 $4,086 $2,957Other comprehensive income/(loss) adjustments, net of tax:
Currency translation 29 (22) 13 (39)Debt valuation adjustment (275) (50) (414) (62)Pension and postretirement liabilities — (1) 1 (37)Available-for-sale securities 1 — 1 —
Other comprehensive loss (245) (73) (399) (138)Comprehensive income $1,586 $1,749 $3,687 $2,819
The accompanying notes are an integral part of these condensed consolidated financial statements.
Goldman Sachs June 2017 Form 10-Q 2

THE GOLDMAN SACHS GROUP, INC. AND SUBSIDIARIES
Condensed Consolidated Statements of Financial Condition(Unaudited)
As of
$ in millions, except per share amountsJune2017
December2016
Assets
Cash and cash equivalents $110,888 $121,711Collateralized agreements:
Securities purchased under agreements to resell and federal funds sold (includes $115,121 and $116,077 at fair value) 115,553 116,925Securities borrowed (includes $70,298 and $82,398 at fair value) 178,301 184,600
Receivables:Brokers, dealers and clearing organizations 32,291 18,044Customers and counterparties (includes $4,895 and $3,266 at fair value) 59,343 47,780Loans receivable 53,952 49,672
Financial instruments owned (at fair value and includes $52,773 and $51,278 pledged as collateral) 327,740 295,952Other assets 28,450 25,481Total assets $906,518 $860,165
Liabilities and shareholders’ equity
Deposits (includes $20,686 and $13,782 at fair value) $125,544 $124,098Collateralized financings:
Securities sold under agreements to repurchase (at fair value) 83,635 71,816Securities loaned (includes $4,753 and $2,647 at fair value) 12,005 7,524Other secured financings (includes $21,967 and $21,073 at fair value) 22,433 21,523
Payables:Brokers, dealers and clearing organizations 10,604 4,386Customers and counterparties 188,958 184,069
Financial instruments sold, but not yet purchased (at fair value) 117,979 117,143Unsecured short-term borrowings (includes $15,945 and $14,792 at fair value) 42,966 39,265Unsecured long-term borrowings (includes $33,760 and $29,410 at fair value) 203,647 189,086Other liabilities and accrued expenses (includes $64 and $621 at fair value) 12,072 14,362Total liabilities 819,843 773,272
Commitments, contingencies and guarantees
Shareholders’ equity
Preferred stock, $0.01 par value; aggregate liquidation preference of $11,203 and $11,203 11,203 11,203Common stock, $0.01 par value; 4,000,000,000 and 4,000,000,000 shares authorized, 881,816,771 and 873,608,100 shares
issued, and 388,213,152 and 392,632,230 shares outstanding 9 9Share-based awards 3,308 3,914Nonvoting common stock, $0.01 par value; 200,000,000 and 200,000,000 shares authorized, no shares issued and outstanding — —Additional paid-in capital 53,187 52,638Retained earnings 92,225 89,039Accumulated other comprehensive loss (1,615) (1,216)Stock held in treasury, at cost, $0.01 par value; 493,603,621 and 480,975,872 shares (71,642) (68,694)Total shareholders’ equity 86,675 86,893Total liabilities and shareholders’ equity $906,518 $860,165
The accompanying notes are an integral part of these condensed consolidated financial statements.
3 Goldman Sachs June 2017 Form 10-Q

THE GOLDMAN SACHS GROUP, INC. AND SUBSIDIARIES
Condensed Consolidated Statements of Changes in Shareholders’ Equity(Unaudited)
$ in millionsSix Months Ended
June 2017Year Ended
December 2016
Preferred stock
Beginning balance $ 11,203 $ 11,200Issued — 1,325Redeemed — (1,322)Ending balance 11,203 11,203Common stock
Beginning balance 9 9Issued — —Ending balance 9 9Share-based awards
Beginning balance, as previously reported 3,914 4,151Cumulative effect of the change in accounting principle related to forfeiture of share-based awards 35 —Beginning balance, adjusted 3,949 4,151Issuance and amortization of share-based awards 1,460 2,143Delivery of common stock underlying share-based awards (1,959) (2,068)Forfeiture of share-based awards (34) (102)Exercise of share-based awards (108) (210)Ending balance 3,308 3,914Additional paid-in capital
Beginning balance 52,638 51,340Delivery of common stock underlying share-based awards 2,056 2,282Cancellation of share-based awards in satisfaction of withholding tax requirements (1,504) (1,121)Preferred stock issuance costs, net — (10)Excess net tax benefit related to share-based awards — 147Cash settlement of share-based awards (3) —Ending balance 53,187 52,638Retained earnings
Beginning balance, as previously reported 89,039 83,386Cumulative effect of the change in accounting principle related to debt valuation adjustment, net of tax — (305)Cumulative effect of the change in accounting principle related to forfeiture of share-based awards, net of tax (24) —Beginning balance, adjusted 89,015 83,081Net earnings 4,086 7,398Dividends and dividend equivalents declared on common stock and share-based awards (583) (1,129)Dividends declared on preferred stock (293) (577)Preferred stock redemption discount — 266Ending balance 92,225 89,039Accumulated other comprehensive loss
Beginning balance, as previously reported (1,216) (718)Cumulative effect of the change in accounting principle related to debt valuation adjustment, net of tax — 305Beginning balance, adjusted (1,216) (413)Other comprehensive loss (399) (803)Ending balance (1,615) (1,216)Stock held in treasury, at cost
Beginning balance (68,694) (62,640)Repurchased (2,966) (6,069)Reissued 28 22Other (10) (7)Ending balance (71,642) (68,694)Total shareholders’ equity $ 86,675 $ 86,893
The accompanying notes are an integral part of these condensed consolidated financial statements.
Goldman Sachs June 2017 Form 10-Q 4

THE GOLDMAN SACHS GROUP, INC. AND SUBSIDIARIES
Condensed Consolidated Statements of Cash Flows(Unaudited)
Six MonthsEnded June
$ in millions 2017 2016
Cash flows from operating activities
Net earnings $ 4,086 $ 2,957Adjustments to reconcile net earnings to net cash provided by/(used for) operating activities:
Depreciation and amortization 522 484Share-based compensation 1,452 1,814Gain related to extinguishment of subordinated borrowings (108) —
Changes in operating assets and liabilities:Receivables and payables (excluding loans receivable), net (14,527) 738Collateralized transactions (excluding other secured financings), net 23,971 (19,350)Financial instruments owned (31,640) 17,274Financial instruments sold, but not yet purchased 472 7,766Other, net 1,919 (4,141)
Net cash provided by/(used for) operating activities (13,853) 7,542Cash flows from investing activities
Purchase of property, leasehold improvements and equipment (1,521) (1,242)Proceeds from sales of property, leasehold improvements and equipment 202 282Net cash acquired in/(used for) business acquisitions (1,086) 15,882Purchase of investments (728) —Proceeds from sales and paydowns of investments 877 818Loans receivable, net (4,686) (2,925)Net cash provided by/(used for) investing activities (6,942) 12,815Cash flows from financing activities
Unsecured short-term borrowings, net (28) 839Other secured financings (short-term), net (881) 1,450Proceeds from issuance of other secured financings (long-term) 4,683 1,995Repayment of other secured financings (long-term), including the current portion (3,151) (3,849)Purchase of APEX, senior guaranteed securities and trust preferred securities (62) (632)Proceeds from issuance of unsecured long-term borrowings 31,654 25,965Repayment of unsecured long-term borrowings, including the current portion (19,343) (22,612)Derivative contracts with a financing element, net 1,002 27Deposits, net 1,446 9,937Common stock repurchased (2,969) (3,294)Settlement of share-based awards in satisfaction of withholding tax requirements (1,507) (902)Dividends and dividend equivalents paid on common stock, preferred stock and share-based awards (876) (860)Proceeds from issuance of preferred stock, net of issuance costs — 655Proceeds from issuance of common stock, including exercise of share-based awards 7 1Cash settlement of share-based awards (3) —Net cash provided by financing activities 9,972 8,720Net increase/(decrease) in cash and cash equivalents (10,823) 29,077Cash and cash equivalents, beginning balance 121,711 93,439Cash and cash equivalents, ending balance $110,888 $122,516
SUPPLEMENTAL DISCLOSURES:
Cash payments for interest, net of capitalized interest, were $6.28 billion and $3.47 billion, and cash payments for income taxes, net of refunds, were $464 millionand $400 million during the six months ended June 2017 and June 2016, respectively.
Cash flows related to common stock repurchased includes common stock repurchased in the prior period for which settlement occurred during the current periodand excludes common stock repurchased during the current period for which settlement occurred in the following period.
Non-cash activities during the six months ended June 2017:
• The firm exchanged $62 million of Trust Preferred Securities and common beneficial interests for $67 million of the firm’s junior subordinated debt.
Non-cash activities during the six months ended June 2016:
• The impact of adoption of ASU No. 2015-02 was a net reduction to both total assets and liabilities of approximately $200 million. See Note 3 for further information.
• The firm sold assets and liabilities of $1.81 billion and $697 million, respectively, that were previously classified as held for sale, in exchange for $1.11 billion offinancial instruments.
• The firm exchanged $505 million of APEX for $666 million of Series E and Series F Preferred Stock. See Note 19 for further information.
The accompanying notes are an integral part of these condensed consolidated financial statements.
5 Goldman Sachs June 2017 Form 10-Q

THE GOLDMAN SACHS GROUP, INC. AND SUBSIDIARIES
Notes to Condensed Consolidated Financial Statements(Unaudited)
Note 1.
Description of Business
The Goldman Sachs Group, Inc. (Group Inc. or parentcompany), a Delaware corporation, together with itsconsolidated subsidiaries (collectively, the firm), is a leadingglobal investment banking, securities and investmentmanagement firm that provides a wide range of financialservices to a substantial and diversified client base thatincludes corporations, financial institutions, governmentsand individuals. Founded in 1869, the firm isheadquartered in New York and maintains offices in allmajor financial centers around the world.
The firm reports its activities in the following four businesssegments:
Investment Banking
The firm provides a broad range of investment bankingservices to a diverse group of corporations, financialinstitutions, investment funds and governments. Servicesinclude strategic advisory assignments with respect tomergers and acquisitions, divestitures, corporate defenseactivities, restructurings, spin-offs and risk management,and debt and equity underwriting of public offerings andprivate placements, including local and cross-bordertransactions and acquisition financing, as well as derivativetransactions directly related to these activities.
Institutional Client Services
The firm facilitates client transactions and makes marketsin fixed income, equity, currency and commodity products,primarily with institutional clients such as corporations,financial institutions, investment funds and governments.The firm also makes markets in and clears clienttransactions on major stock, options and futures exchangesworldwide and provides financing, securities lending andother prime brokerage services to institutional clients.
Investing & Lending
The firm invests in and originates loans to providefinancing to clients. These investments and loans aretypically longer-term in nature. The firm makesinvestments, some of which are consolidated, directly andindirectly through funds that the firm manages, in debtsecurities and loans, public and private equity securities,infrastructure and real estate entities. The firm also makesunsecured loans to individuals through its online platform.
Investment Management
The firm provides investment management services andoffers investment products (primarily through separatelymanaged accounts and commingled vehicles, such asmutual funds and private investment funds) across allmajor asset classes to a diverse set of institutional andindividual clients. The firm also offers wealth advisoryservices, including portfolio management and financialcounseling, and brokerage and other transaction services tohigh-net-worth individuals and families.
Note 2.
Basis of Presentation
These condensed consolidated financial statements areprepared in accordance with accounting principlesgenerally accepted in the United States (U.S. GAAP) andinclude the accounts of Group Inc. and all other entities inwhich the firm has a controlling financial interest.Intercompany transactions and balances have beeneliminated.
These condensed consolidated financial statements areunaudited and should be read in conjunction with theaudited consolidated financial statements included in thefirm’s Annual Report on Form 10-K for the year endedDecember 31, 2016. References to “the 2016 Form 10-K”are to the firm’s Annual Report on Form 10-K for the yearended December 31, 2016. The condensed consolidatedfinancial information as of December 31, 2016 has beenderived from audited consolidated financial statements notincluded herein.
These unaudited condensed consolidated financialstatements reflect all adjustments that are, in the opinion ofmanagement, necessary for a fair statement of the resultsfor the interim periods presented. These adjustments are ofa normal, recurring nature. Interim period operating resultsmay not be indicative of the operating results for a full year.
All references to June 2017, March 2017 and June 2016refer to the firm’s periods ended, or the dates, as the contextrequires, June 30, 2017, March 31, 2017 andJune 30, 2016, respectively. All references toDecember 2016 refer to the date December 31, 2016. Anyreference to a future year refers to a year ending onDecember 31 of that year. Certain reclassifications havebeen made to previously reported amounts to conform tothe current presentation.
Goldman Sachs June 2017 Form 10-Q 6

THE GOLDMAN SACHS GROUP, INC. AND SUBSIDIARIES
Notes to Condensed Consolidated Financial Statements(Unaudited)
Note 3.
Significant Accounting Policies
The firm’s significant accounting policies include when andhow to measure the fair value of assets and liabilities,accounting for goodwill and identifiable intangible assets,and when to consolidate an entity. See Notes 5 through 8for policies on fair value measurements, Note 13 forpolicies on goodwill and identifiable intangible assets, andbelow and Note 12 for policies on consolidationaccounting. All other significant accounting policies areeither described below or included in the followingfootnotes:
Financial Instruments Owned and Financial InstrumentsSold, But Not Yet Purchased Note 4
Fair Value Measurements Note 5
Cash Instruments Note 6
Derivatives and Hedging Activities Note 7
Fair Value Option Note 8
Loans Receivable Note 9
Collateralized Agreements and Financings Note 10
Securitization Activities Note 11
Variable Interest Entities Note 12
Other Assets Note 13
Deposits Note 14
Short-Term Borrowings Note 15
Long-Term Borrowings Note 16
Other Liabilities and Accrued Expenses Note 17
Commitments, Contingencies and Guarantees Note 18
Shareholders’ Equity Note 19
Regulation and Capital Adequacy Note 20
Earnings Per Common Share Note 21
Transactions with Affiliated Funds Note 22
Interest Income and Interest Expense Note 23
Income Taxes Note 24
Business Segments Note 25
Credit Concentrations Note 26
Legal Proceedings Note 27
Consolidation
The firm consolidates entities in which the firm has acontrolling financial interest. The firm determines whetherit has a controlling financial interest in an entity by firstevaluating whether the entity is a voting interest entity or avariable interest entity (VIE).
Voting Interest Entities. Voting interest entities areentities in which (i) the total equity investment at risk issufficient to enable the entity to finance its activitiesindependently and (ii) the equity holders have the power todirect the activities of the entity that most significantlyimpact its economic performance, the obligation to absorbthe losses of the entity and the right to receive the residualreturns of the entity. The usual condition for a controllingfinancial interest in a voting interest entity is ownership of amajority voting interest. If the firm has a controllingmajority voting interest in a voting interest entity, the entityis consolidated.
Variable Interest Entities. A VIE is an entity that lacksone or more of the characteristics of a voting interest entity.The firm has a controlling financial interest in a VIE whenthe firm has a variable interest or interests that provide itwith (i) the power to direct the activities of the VIE thatmost significantly impact the VIE’s economic performanceand (ii) the obligation to absorb losses of the VIE or theright to receive benefits from the VIE that could potentiallybe significant to the VIE. See Note 12 for furtherinformation about VIEs.
Equity-Method Investments. When the firm does nothave a controlling financial interest in an entity but canexert significant influence over the entity’s operating andfinancial policies, the investment is accounted for either(i) under the equity method of accounting or (ii) at fair valueby electing the fair value option available under U.S. GAAP.Significant influence generally exists when the firm owns20% to 50% of the entity’s common stock or in-substancecommon stock.
In general, the firm accounts for investments acquired afterthe fair value option became available, at fair value. Incertain cases, the firm applies the equity method ofaccounting to new investments that are strategic in natureor closely related to the firm’s principal business activities,when the firm has a significant degree of involvement in thecash flows or operations of the investee or when cost-benefit considerations are less significant. See Note 13 forfurther information about equity-method investments.
7 Goldman Sachs June 2017 Form 10-Q

THE GOLDMAN SACHS GROUP, INC. AND SUBSIDIARIES
Notes to Condensed Consolidated Financial Statements(Unaudited)
Investment Funds. The firm has formed numerousinvestment funds with third-party investors. These fundsare typically organized as limited partnerships or limitedliability companies for which the firm acts as generalpartner or manager. Generally, the firm does not hold amajority of the economic interests in these funds. Thesefunds are usually voting interest entities and generally arenot consolidated because third-party investors typicallyhave rights to terminate the funds or to remove the firm asgeneral partner or manager. Investments in these funds aregenerally measured at net asset value (NAV) and areincluded in “Financial instruments owned.” See Notes 6, 18and 22 for further information about investments in funds.
Use of Estimates
Preparation of these condensed consolidated financialstatements requires management to make certain estimatesand assumptions, the most important of which relate to fairvalue measurements, accounting for goodwill andidentifiable intangible assets, discretionary compensationaccruals, the provisions for losses that may arise fromlitigation, regulatory proceedings (including governmentalinvestigations) and tax audits, and the allowance for losseson loans receivable and lending commitments held forinvestment. These estimates and assumptions are based onthe best available information but actual results could bematerially different.
Revenue Recognition
Financial Assets and Financial Liabilities at Fair Value.
Financial instruments owned and Financial instrumentssold, but not yet purchased are recorded at fair value eitherunder the fair value option or in accordance with other U.S.GAAP. In addition, the firm has elected to account forcertain of its other financial assets and financial liabilities atfair value by electing the fair value option. The fair value ofa financial instrument is the amount that would be receivedto sell an asset or paid to transfer a liability in an orderlytransaction between market participants at themeasurement date. Financial assets are marked to bid pricesand financial liabilities are marked to offer prices. Fairvalue measurements do not include transaction costs. Fairvalue gains or losses are generally included in “Marketmaking” for positions in Institutional Client Services and“Other principal transactions” for positions in Investing &Lending. See Notes 5 through 8 for further informationabout fair value measurements.
Investment Banking. Fees from financial advisoryassignments and underwriting revenues are recognized inearnings when the services related to the underlyingtransaction are completed under the terms of theassignment. Expenses associated with such transactions aredeferred until the related revenue is recognized or theassignment is otherwise concluded. Expenses associatedwith financial advisory assignments are recorded asnon-compensation expenses, net of client reimbursements.Underwriting revenues are presented net of relatedexpenses.
Investment Management. The firm earns managementfees and incentive fees for investment management services.Management fees for mutual funds are calculated as apercentage of daily net asset value and are receivedmonthly. Management fees for hedge funds and separatelymanaged accounts are calculated as a percentage ofmonth-end net asset value and are generally receivedquarterly. Management fees for private equity funds arecalculated as a percentage of monthly invested capital orcommitments and are received quarterly, semi-annually orannually, depending on the fund. All management fees arerecognized over the period that the related service isprovided. Incentive fees are calculated as a percentage of afund’s or separately managed account’s return, or excessreturn above a specified benchmark or other performancetarget. Incentive fees are generally based on investmentperformance over a 12-month period or over the life of afund. Fees that are based on performance over a 12-monthperiod are subject to adjustment prior to the end of themeasurement period. For fees that are based on investmentperformance over the life of the fund, future investmentunderperformance may require fees previously distributedto the firm to be returned to the fund. Incentive fees arerecognized only when all material contingencies have beenresolved. Management and incentive fee revenues areincluded in “Investment management” revenues.
The firm makes payments to brokers and advisors relatedto the placement of the firm’s investment funds. Thesepayments are calculated based on either a percentage of themanagement fee or the investment fund’s net asset value.Where the firm is principal to the arrangement, such costsare recorded on a gross basis and included in “Brokerage,clearing, exchange and distribution fees,” and where thefirm is agent to the arrangement, such costs are recorded ona net basis in “Investment management” revenues.
Goldman Sachs June 2017 Form 10-Q 8
THE GOLDMAN SACHS GROUP, INC. AND SUBSIDIARIES
Notes to Condensed Consolidated Financial Statements(Unaudited)
Commissions and Fees. The firm earns “Commissionsand fees” from executing and clearing client transactions onstock, options and futures markets, as well asover-the-counter (OTC) transactions. Commissions andfees are recognized on the day the trade is executed.
Transfers of Financial Assets
Transfers of financial assets are accounted for as sales whenthe firm has relinquished control over the assets transferred.For transfers of financial assets accounted for as sales, anygains or losses are recognized in net revenues. Assets orliabilities that arise from the firm’s continuing involvementwith transferred financial assets are initially recognized atfair value. For transfers of financial assets that are notaccounted for as sales, the assets generally remain in“Financial instruments owned” and the transfer isaccounted for as a collateralized financing, with the relatedinterest expense recognized over the life of the transaction.See Note 10 for further information about transfers offinancial assets accounted for as collateralized financingsand Note 11 for further information about transfers offinancial assets accounted for as sales.
Cash and Cash Equivalents
The firm defines cash equivalents as highly liquid overnightdeposits held in the ordinary course of business. As ofJune 2017 and December 2016, “Cash and cash equivalents”included $15.18 billion and $11.15 billion, respectively, ofcash and due from banks, and $95.71 billion and$110.56 billion, respectively, of interest-bearing depositswith banks. The firm segregates cash for regulatory andother purposes related to client activity. As of June 2017 andDecember 2016, $18.64 billion and $14.65 billion,respectively, of “Cash and cash equivalents” were segregatedfor regulatory and other purposes. See “Recent AccountingDevelopments” for further information.
In addition, the firm segregates securities for regulatory andother purposes related to client activity. See Note 10 forfurther information about segregated securities.
Receivables from and Payables to Brokers, Dealers
and Clearing Organizations
Receivables from and payables to brokers, dealers andclearing organizations are accounted for at cost plusaccrued interest, which generally approximates fair value.While these receivables and payables are carried at amountsthat approximate fair value, they are not accounted for atfair value under the fair value option or at fair value inaccordance with other U.S. GAAP and therefore are notincluded in the firm’s fair value hierarchy in Notes 6through 8. Had these receivables and payables beenincluded in the firm’s fair value hierarchy, substantially allwould have been classified in level 2 as of June 2017 andDecember 2016.
Receivables from Customers and Counterparties
Receivables from customers and counterparties generallyrelate to collateralized transactions. Such receivables areprimarily comprised of customer margin loans, certaintransfers of assets accounted for as secured loans ratherthan purchases at fair value and collateral posted inconnection with certain derivative transactions.Substantially all of these receivables are accounted for atamortized cost net of estimated uncollectible amounts.Certain of the firm’s receivables from customers andcounterparties are accounted for at fair value under the fairvalue option, with changes in fair value generally includedin “Market making” revenues. See Note 8 for furtherinformation about receivables from customers andcounterparties accounted for at fair value under the fairvalue option. In addition, as of June 2017 andDecember 2016, the firm’s receivables from customers andcounterparties included $2.81 billion and $2.60 billion,respectively, of loans held for sale, accounted for at thelower of cost or fair value. See Note 5 for an overview of thefirm’s fair value measurement policies.
As of June 2017 and December 2016, the carrying value ofreceivables not accounted for at fair value generallyapproximated fair value. While these receivables are carriedat amounts that approximate fair value, they are notaccounted for at fair value under the fair value option or atfair value in accordance with other U.S. GAAP andtherefore are not included in the firm’s fair value hierarchyin Notes 6 through 8. Had these receivables been includedin the firm’s fair value hierarchy, substantially all wouldhave been classified in level 2 as of June 2017 andDecember 2016. Interest on receivables from customers andcounterparties is recognized over the life of the transactionand included in “Interest income.”
Payables to Customers and Counterparties
Payables to customers and counterparties primarily consistof customer credit balances related to the firm’s primebrokerage activities. Payables to customers andcounterparties are accounted for at cost plus accruedinterest, which generally approximates fair value. Whilethese payables are carried at amounts that approximate fairvalue, they are not accounted for at fair value under the fairvalue option or at fair value in accordance with other U.S.GAAP and therefore are not included in the firm’s fair valuehierarchy in Notes 6 through 8. Had these payables beenincluded in the firm’s fair value hierarchy, substantially allwould have been classified in level 2 as of June 2017 andDecember 2016. Interest on payables to customers andcounterparties is recognized over the life of the transactionand included in “Interest expense.”
9 Goldman Sachs June 2017 Form 10-Q

THE GOLDMAN SACHS GROUP, INC. AND SUBSIDIARIES
Notes to Condensed Consolidated Financial Statements(Unaudited)
Offsetting Assets and Liabilities
To reduce credit exposures on derivatives and securitiesfinancing transactions, the firm may enter into masternetting agreements or similar arrangements (collectively,netting agreements) with counterparties that permit it tooffset receivables and payables with such counterparties. Anetting agreement is a contract with a counterparty thatpermits net settlement of multiple transactions with thatcounterparty, including upon the exercise of terminationrights by a non-defaulting party. Upon exercise of suchtermination rights, all transactions governed by the nettingagreement are terminated and a net settlement amount iscalculated. In addition, the firm receives and posts cash andsecurities collateral with respect to its derivatives andsecurities financing transactions, subject to the terms of therelated credit support agreements or similar arrangements(collectively, credit support agreements). An enforceablecredit support agreement grants the non-defaulting partyexercising termination rights the right to liquidate thecollateral and apply the proceeds to any amounts owed. Inorder to assess enforceability of the firm’s right of setoffunder netting and credit support agreements, the firmevaluates various factors including applicable bankruptcylaws, local statutes and regulatory provisions in thejurisdiction of the parties to the agreement.
Derivatives are reported on a net-by-counterparty basis(i.e., the net payable or receivable for derivative assets andliabilities for a given counterparty) in the condensedconsolidated statements of financial condition when a legalright of setoff exists under an enforceable nettingagreement. Resale and repurchase agreements andsecurities borrowed and loaned transactions with the sameterm and currency are presented on a net-by-counterpartybasis in the condensed consolidated statements of financialcondition when such transactions meet certain settlementcriteria and are subject to netting agreements.
In the condensed consolidated statements of financialcondition, derivatives are reported net of cash collateralreceived and posted under enforceable credit supportagreements, when transacted under an enforceable nettingagreement. In the condensed consolidated statements offinancial condition, resale and repurchase agreements, andsecurities borrowed and loaned, are not reported net of therelated cash and securities received or posted as collateral.See Note 10 for further information about collateralreceived and pledged, including rights to deliver or repledgecollateral. See Notes 7 and 10 for further information aboutoffsetting.
Share-based Compensation
The cost of employee services received in exchange for ashare-based award is generally measured based on thegrant-date fair value of the award. Share-based awards thatdo not require future service (i.e., vested awards, includingawards granted to retirement-eligible employees) areexpensed immediately. Share-based awards that requirefuture service are amortized over the relevant serviceperiod. Effective January 2017, forfeitures are recordedwhen they occur. Prior to January 2017, expectedforfeitures were estimated and recorded over the vestingperiod. See “Recent Accounting Developments —Improvements to Employee Share-Based PaymentAccounting (ASC 718)” for additional information.
Cash dividend equivalents paid on outstanding restrictedstock units (RSUs) are charged to retained earnings. If RSUsthat require future service are forfeited, the related dividendequivalents originally charged to retained earnings arereclassified to compensation expense in the period in whichforfeiture occurs.
The firm generally issues new shares of common stock upondelivery of share-based awards. In certain cases, primarilyrelated to conflicted employment (as outlined in theapplicable award agreements), the firm may cash settleshare-based compensation awards accounted for as equityinstruments. For these awards, whose terms allow for cashsettlement, additional paid-in capital is adjusted to theextent of the difference between the value of the award atthe time of cash settlement and the grant-date value of theaward.
Foreign Currency Translation
Assets and liabilities denominated in non-U.S. currenciesare translated at rates of exchange prevailing on the date ofthe condensed consolidated statements of financialcondition and revenues and expenses are translated ataverage rates of exchange for the period. Foreign currencyremeasurement gains or losses on transactions innonfunctional currencies are recognized in earnings. Gainsor losses on translation of the financial statements of anon-U.S. operation, when the functional currency is otherthan the U.S. dollar, are included, net of hedges and taxes,in the condensed consolidated statements of comprehensiveincome.
Goldman Sachs June 2017 Form 10-Q 10

THE GOLDMAN SACHS GROUP, INC. AND SUBSIDIARIES
Notes to Condensed Consolidated Financial Statements(Unaudited)
Recent Accounting Developments
Revenue from Contracts with Customers (ASC 606).
In May 2014, the FASB issued ASU No. 2014-09,“Revenue from Contracts with Customers (Topic 606).”This ASU, as amended, provides comprehensive guidanceon the recognition of revenue from customers arising fromthe transfer of goods and services, guidance on accountingfor certain contract costs, and new disclosures.
The ASU is effective for the firm in January 2018 under amodified retrospective approach or retrospectively to allperiods presented. The firm’s implementation effortsinclude identifying revenues and costs within the scope ofthe ASU, reviewing contracts, and analyzing any changes toits existing revenue recognition policies. Based onimplementation work to date, as a result of adopting thisASU, the firm expects that it will, among other things, berequired to recognize certain investment management feesearlier than under the firm’s current revenue recognitionpolicy. The firm will also be required to change the currentpresentation of certain costs from a net presentation withinnet revenues to a gross basis, or vice versa. The firm willadopt this ASU in January 2018 using a modifiedretrospective approach. The firm does not currently expectthat the ASU will have a material impact on its financialcondition, results of operations or cash flows on the date ofadoption.
Measuring the Financial Assets and the Financial
Liabilities of a Consolidated Collateralized Financing
Entity (ASC 810). In August 2014, the FASB issued ASUNo. 2014-13, “Consolidation (Topic 810) — Measuringthe Financial Assets and the Financial Liabilities of aConsolidated Collateralized Financing Entity (CFE).” ThisASU provides an alternative to reflect changes in the fairvalue of the financial assets and the financial liabilities ofthe CFE by measuring either the fair value of the assets orliabilities, whichever is more observable, and provides newdisclosure requirements for those electing this approach.
The firm adopted the ASU in January 2016. Adoption ofthe ASU did not materially affect the firm’s financialcondition, results of operations or cash flows.
Amendments to the Consolidation Analysis
(ASC 810). In February 2015, the FASB issued ASUNo. 2015-02, “Consolidation (Topic 810) — Amendmentsto the Consolidation Analysis.” This ASU eliminates thedeferral of the requirements of ASU No. 2009-17,“Consolidations (Topic 810) — Improvements to FinancialReporting by Enterprises Involved with Variable InterestEntities” for certain interests in investment funds andprovides a scope exception for certain investments inmoney market funds. It also makes several modifications tothe consolidation guidance for VIEs and general partners’investments in limited partnerships, as well asmodifications to the evaluation of whether limitedpartnerships are VIEs or voting interest entities.
The firm adopted the ASU in January 2016, using amodified retrospective approach. The impact of adoptionwas a net reduction to both total assets and total liabilitiesof approximately $200 million, substantially all included in“Financial instruments owned” and in “Other liabilitiesand accrued expenses,” respectively. Adoption of this ASUdid not have an impact on the firm’s results of operations.See Note 12 for further information about the adoption.
Simplifying the Accounting for Measurement-Period
Adjustments (ASC 805). In September 2015, the FASBissued ASU No. 2015-16, “Business Combinations(Topic 805) — Simplifying the Accounting forMeasurement-Period Adjustments.” This ASU eliminatesthe requirement for an acquirer in a business combinationto account for measurement-period adjustmentsretrospectively.
The firm adopted the ASU in January 2016. Adoption ofthe ASU did not materially affect the firm’s financialcondition, results of operations or cash flows.
Recognition and Measurement of Financial Assets
and Financial Liabilities (ASC 825). In January 2016, theFASB issued ASU No. 2016-01, “Financial Instruments(Topic 825) — Recognition and Measurement of FinancialAssets and Financial Liabilities.” This ASU amends certainaspects of recognition, measurement, presentation anddisclosure of financial instruments. It includes arequirement to present separately in other comprehensiveincome changes in fair value attributable to a firm’s owncredit spreads (debt valuation adjustment or DVA), net oftax, on financial liabilities for which the fair value optionwas elected.
11 Goldman Sachs June 2017 Form 10-Q

THE GOLDMAN SACHS GROUP, INC. AND SUBSIDIARIES
Notes to Condensed Consolidated Financial Statements(Unaudited)
The ASU is effective for the firm in January 2018. Earlyadoption is permitted under a modified retrospectiveapproach for the requirements related to DVA. InJanuary 2016, the firm early adopted this ASU for therequirements related to DVA and reclassified thecumulative DVA, a gain of $305 million (net of tax), from“Retained earnings” to “Accumulated other comprehensiveloss.” The firm does not expect the adoption of theremaining provisions of the ASU to have a material impacton its financial condition, results of operations or cashflows.
Leases (ASC 842). In February 2016, the FASB issued ASUNo. 2016-02, “Leases (Topic 842).” This ASU requiresthat, for leases longer than one year, a lessee recognize inthe statements of financial condition a right-of-use asset,representing the right to use the underlying asset for thelease term, and a lease liability, representing the liability tomake lease payments. It also requires that for finance leases,a lessee recognize interest expense on the lease liability,separately from the amortization of the right-of-use asset inthe statements of earnings, while for operating leases, suchamounts should be recognized as a combined expense. Inaddition, this ASU requires expanded disclosures about thenature and terms of lease agreements.
The ASU is effective for the firm in January 2019 under amodified retrospective approach. Early adoption ispermitted. The firm’s implementation efforts includereviewing existing leases and service contracts, which mayinclude embedded leases. The firm expects a gross up on itsconsolidated statements of financial condition uponrecognition of the right-of-use assets and lease liabilities anddoes not expect the amount of the gross up to have amaterial impact on its financial condition.
Improvements to Employee Share-Based Payment
Accounting (ASC 718). In March 2016, the FASB issuedASU No. 2016-09, “Compensation — Stock Compensation(Topic 718) — Improvements to Employee Share-BasedPayment Accounting.” This ASU includes a requirementthat the tax effect related to the settlement of share-basedawards be recorded in income tax benefit or expense in thestatements of earnings rather than directly to additionalpaid-in capital. This change has no impact on totalshareholders’ equity and is required to be adoptedprospectively. The ASU also allows for forfeitures to berecorded when they occur rather than estimated over thevesting period. This change is required to be applied on amodified retrospective basis.
The firm adopted the ASU in January 2017 and the impactof the RSU deliveries and option exercises in the first half of2017 was a reduction to the provision for taxes of$485 million, which was recognized in the condensedconsolidated statements of earnings. The impact will varyin future periods depending upon, among other things, thenumber of RSUs delivered and their change in value sincegrant. Prior to the adoption of this ASU, this amount wouldhave been recorded directly to additional paid-in capital.The firm also elected to account for forfeitures as theyoccur, rather than to estimate forfeitures over the vestingperiod, and the cumulative effect of this election uponadoption was an increase of $35 million to “Share-basedawards” and a decrease of $24 million (net of tax of$11 million) to “Retained earnings” within the condensedconsolidated statements of changes in shareholders’ equity.
In addition, the ASU modifies the classification of certainshare-based payment activities within the statements ofcash flows. As a result, the firm reclassified, on aretrospective basis, a cash outflow of $902 million relatedto the settlement of share-based awards in satisfaction ofwithholding tax requirements from operating activities tofinancing activities and a cash inflow of $78 million ofexcess tax benefits related to share-based awards fromfinancing activities to operating activities within thecondensed consolidated statements of cash flows for the sixmonths ended June 2016.
Measurement of Credit Losses on Financial
Instruments (ASC 326). In June 2016, the FASB issuedASU No. 2016-13, “Financial Instruments — Credit Losses(Topic 326) — Measurement of Credit Losses on FinancialInstruments.” This ASU amends several aspects of themeasurement of credit losses on financial instruments,including replacing the existing incurred credit loss modeland other models with the Current Expected Credit Losses(CECL) model and amending certain aspects of accountingfor purchased financial assets with deterioration in creditquality since origination.
Under CECL, the allowance for losses for financial assetsthat are measured at amortized cost reflects management’sestimate of credit losses over the remaining expected life ofthe financial assets. Expected credit losses for newlyrecognized financial assets, as well as changes to expectedcredit losses during the period, would be recognized inearnings. For certain purchased financial assets withdeterioration in credit quality since origination, an initialallowance would be recorded for expected credit losses andrecognized as an increase to the purchase price rather thanas an expense. Expected credit losses, including losses onoff-balance-sheet exposures such as lending commitments,will be measured based on historical experience, currentconditions and forecasts that affect the collectability of thereported amount.
Goldman Sachs June 2017 Form 10-Q 12

THE GOLDMAN SACHS GROUP, INC. AND SUBSIDIARIES
Notes to Condensed Consolidated Financial Statements(Unaudited)
The ASU is effective for the firm in January 2020 under amodified retrospective approach. Early adoption ispermitted in January 2019. Adoption of the ASU will resultin earlier recognition of credit losses and an increase in therecorded allowance for certain purchased loans withdeterioration in credit quality since origination with acorresponding increase to their gross carrying value. Theimpact of adoption of this ASU on the firm’s financialcondition, results of operations and cash flows will dependon, among other things, the economic environment and thetype of financial assets held by the firm on the date ofadoption.
Classification of Certain Cash Receipts and Cash
Payments (ASC 230). In August 2016, the FASB issuedASU No. 2016-15, “Statement of Cash Flows(Topic 230) — Classification of Certain Cash Receipts andCash Payments.” This ASU provides guidance on thedisclosure and classification of certain items within thestatements of cash flows.
The ASU is effective for the firm in January 2018 under aretrospective approach. Early adoption is permitted. Sincethe ASU only impacts classification in the statements ofcash flows, adoption will not affect the firm’s cash and cashequivalents.
Restricted Cash (ASC 230). In November 2016, the FASBissued ASU No. 2016-18, “Statement of Cash Flows(Topic 230) — Restricted Cash.” This ASU requires thatcash segregated for regulatory and other purposes beincluded in cash and cash equivalents disclosed in thestatements of cash flows and is required to be appliedretrospectively.
The firm early adopted the ASU in December 2016 andreclassified cash segregated for regulatory and otherpurposes into “Cash and cash equivalents” disclosed in theconsolidated statements of cash flows. The impact ofadoption was an increase of $889 million for the sixmonths ended June 2016 to “Net cash used for operatingactivities.” In addition, in December 2016, to be consistentwith the presentation of segregated cash in the consolidatedstatements of cash flows under the ASU, the firmreclassified amounts previously included in “Cash andsecurities segregated for regulatory and other purposes”into “Cash and cash equivalents,” “Securities purchasedunder agreements to resell and federal funds sold,”“Securities borrowed” and “Financial instruments owned”in the consolidated statements of financial condition.Previously reported amounts in the condensed consolidatedstatements of cash flows and notes to the condensedconsolidated financial statements have been conformed tothe current presentation.
Clarifying the Definition of a Business (ASC 805). InJanuary 2017, the FASB issued ASU No. 2017-01,“Business Combinations (Topic 805) — Clarifying theDefinition of a Business.” The ASU amends the definitionof a business and provides a threshold which must beconsidered to determine whether a transaction is anacquisition (or disposal) of an asset or a business.
The ASU is effective for the firm in January 2018 under aprospective approach. Early adoption is permitted. Theimpact of this ASU will depend on the nature of the firm’sactivities after adoption, although the firm expects thatfewer transactions will be treated as acquisitions (ordisposals) of businesses.
Simplifying the Test for Goodwill Impairment
(ASC 350). In January 2017, the FASB issued ASUNo. 2017-04, “Intangibles — Goodwill and Other(Topic 350) — Simplifying the Test for GoodwillImpairment.” The ASU simplifies the quantitative goodwillimpairment test by eliminating the second step of the test.Under this ASU, impairment will be measured bycomparing the estimated fair value of the reporting unitwith its carrying value.
The ASU is effective for the firm in 2020. Early adoption ispermitted. The firm does not expect adoption will have amaterial impact to its goodwill impairment test.
Clarifying the Scope of Asset Derecognition Guidance
and Accounting for Partial Sales of Nonfinancial
Assets (ASC 610-20). In February 2017, the FASB issuedASU No. 2017-05, “Other Income — Gains and Lossesfrom the Derecognition of Nonfinancial Assets (Subtopic610-20) — Clarifying the Scope of Asset DerecognitionGuidance and Accounting for Partial Sales of NonfinancialAssets.” The ASU clarifies the scope of guidance applicableto sales of nonfinancial assets and also provides guidanceon accounting for partial sales of such assets.
The ASU is effective for the firm in January 2018 under aretrospective or modified retrospective approach. The firmwill adopt this ASU using a modified retrospectiveapproach and does not expect adoption of the ASU willhave a material impact on its financial condition, results ofoperations or cash flows.
13 Goldman Sachs June 2017 Form 10-Q

THE GOLDMAN SACHS GROUP, INC. AND SUBSIDIARIES
Notes to Condensed Consolidated Financial Statements(Unaudited)
Note 4.
Financial Instruments Owned and FinancialInstruments Sold, But Not Yet Purchased
Financial instruments owned and financial instrumentssold, but not yet purchased are accounted for at fair valueeither under the fair value option or in accordance withother U.S. GAAP. See Note 8 for further information aboutother financial assets and financial liabilities accounted forat fair value primarily under the fair value option.
The table below presents the firm’s financial instrumentsowned and financial instruments sold, but not yet purchased.
$ in millions
FinancialInstruments
Owned
FinancialInstruments
Sold, ButNot Yet
Purchased
As of June 2017
Money market instruments $ 1,649 $ —
U.S. government and agency obligations 74,238 17,746
Non-U.S. government and agency obligations 35,011 26,754
Loans and securities backed by:Commercial real estate 4,364 5
Residential real estate 9,816 1
Corporate loans and debt securities 33,735 8,654
State and municipal obligations 783 —
Other debt obligations 1,592 1
Equity securities 109,002 25,065
Commodities 3,225 —
Investments in funds at NAV 5,910 —
Subtotal 279,325 78,226
Derivatives 48,415 39,753
Total $327,740 $117,979
As of December 2016Money market instruments $ 1,319 $ —U.S. government and agency obligations 57,657 16,627Non-U.S. government and agency obligations 29,381 20,502Loans and securities backed by:
Commercial real estate 3,842 —Residential real estate 12,195 3
Corporate loans and debt securities 28,659 6,570State and municipal obligations 1,059 —Other debt obligations 1,358 1Equity securities 94,692 25,941Commodities 5,653 —Investments in funds at NAV 6,465 —Subtotal 242,280 69,644Derivatives 53,672 47,499Total $295,952 $117,143
In the table above:
‰ Money market instruments includes commercial paper,certificates of deposit and time deposits, substantially allof which have a maturity of less than one year.
‰ Equity securities includes public and private equities,exchange-traded funds and convertible debentures.
‰ Financial instruments owned included $330 million and$89 million of debt securities accounted for asavailable-for-sale as of June 2017 and December 2016,respectively. As of both June 2017 and December 2016,these securities were primarily comprised of U.S.government and agency obligations and other debtobligations. As of June 2017, substantially all of thesesecurities had maturities of greater than five years (half ofwhich had maturities of greater than ten years). As ofDecember 2016, these securities primarily had maturitiesof greater than ten years. The gross unrealized gains/(losses) included in “Accumulated other comprehensiveloss” related to available-for-sale securities were notmaterial as of both June 2017 and December 2016.
Gains and Losses from Market Making and Other
Principal Transactions
The table below presents “Market making” revenues bymajor product type, as well as “Other principaltransactions” revenues.
Three MonthsEnded June
Six MonthsEnded June
$ in millions 2017 2016 2017 2016
Interest rates $ 2,625 $ (907) $ 3,989 $ 270Credit 382 630 926 1,248Currencies (2,422) 1,618 (2,740) 710Equities 1,293 861 1,871 1,552Commodities 37 288 287 572Market making 1,915 2,490 4,333 4,352Other principal transactions 1,227 864 2,448 815Total $ 3,142 $3,354 $ 6,781 $5,167
In the table above:
‰ Gains/(losses) include both realized and unrealized gainsand losses, and are primarily related to the firm’s financialinstruments owned and financial instruments sold, butnot yet purchased, including both derivative andnon-derivative financial instruments.
‰ Gains/(losses) exclude related interest income and interestexpense. See Note 23 for further information aboutinterest income and interest expense.
‰ Gains/(losses) on other principal transactions areincluded in the firm’s Investing & Lending segment. SeeNote 25 for net revenues, including net interest income,by product type for Investing & Lending, as well as theamount of net interest income included in Investing &Lending.
Goldman Sachs June 2017 Form 10-Q 14

THE GOLDMAN SACHS GROUP, INC. AND SUBSIDIARIES
Notes to Condensed Consolidated Financial Statements(Unaudited)
‰ Gains/(losses) are not representative of the manner inwhich the firm manages its business activities becausemany of the firm’s market-making and client facilitationstrategies utilize financial instruments across variousproduct types. Accordingly, gains or losses in one producttype frequently offset gains or losses in other producttypes. For example, most of the firm’s longer-termderivatives across product types are sensitive to changesin interest rates and may be economically hedged withinterest rate swaps. Similarly, a significant portion of thefirm’s cash instruments and derivatives across producttypes has exposure to foreign currencies and may beeconomically hedged with foreign currency contracts.
Note 5.
Fair Value Measurements
The fair value of a financial instrument is the amount thatwould be received to sell an asset or paid to transfer aliability in an orderly transaction between marketparticipants at the measurement date. Financial assets aremarked to bid prices and financial liabilities are marked tooffer prices. Fair value measurements do not includetransaction costs. The firm measures certain financial assetsand financial liabilities as a portfolio (i.e., based on its netexposure to market and/or credit risks).
The best evidence of fair value is a quoted price in an activemarket. If quoted prices in active markets are not available,fair value is determined by reference to prices for similarinstruments, quoted prices or recent transactions in lessactive markets, or internally developed models thatprimarily use market-based or independently sourcedinputs including, but not limited to, interest rates,volatilities, equity or debt prices, foreign exchange rates,commodity prices, credit spreads and funding spreads (i.e.,the spread or difference between the interest rate at which aborrower could finance a given financial instrument relativeto a benchmark interest rate).
U.S. GAAP has a three-level hierarchy for disclosure of fairvalue measurements. This hierarchy prioritizes inputs to thevaluation techniques used to measure fair value, giving thehighest priority to level 1 inputs and the lowest priority tolevel 3 inputs. A financial instrument’s level in thishierarchy is based on the lowest level of input that issignificant to its fair value measurement. In evaluating thesignificance of a valuation input, the firm considers, amongother factors, a portfolio’s net risk exposure to that input.The fair value hierarchy is as follows:
Level 1. Inputs are unadjusted quoted prices in activemarkets to which the firm had access at the measurementdate for identical, unrestricted assets or liabilities.
Level 2. Inputs to valuation techniques are observable,either directly or indirectly.
Level 3. One or more inputs to valuation techniques aresignificant and unobservable.
The fair values for substantially all of the firm’s financialassets and financial liabilities are based on observable pricesand inputs and are classified in levels 1 and 2 of the fairvalue hierarchy. Certain level 2 and level 3 financial assetsand financial liabilities may require appropriate valuationadjustments that a market participant would require toarrive at fair value for factors such as counterparty and thefirm’s credit quality, funding risk, transfer restrictions,liquidity and bid/offer spreads. Valuation adjustments aregenerally based on market evidence.
See Notes 6 through 8 for further information about fairvalue measurements of cash instruments, derivatives andother financial assets and financial liabilities accounted for atfair value primarily under the fair value option, respectively.
The table below presents financial assets and financialliabilities accounted for at fair value under the fair valueoption or in accordance with other U.S. GAAP.
As of
$ in millionsJune2017
March2017
December2016
Total level 1 financial assets $163,555 $151,691 $135,401Total level 2 financial assets 407,480 406,332 419,585Total level 3 financial assets 20,847 23,288 23,280Investments in funds at NAV 5,910 6,183 6,465Counterparty and cash collateral netting (79,738) (78,540) (87,038)Total financial assets at fair value $518,054 $508,954 $497,693
Total assets $906,518 $894,069 $860,165Total level 3 financial assets divided by:
Total assets 2.3% 2.6% 2.7%Total financial assets at fair value 4.0% 4.6% 4.7%
Total level 1 financial liabilities $ 68,534 $ 67,732 $ 62,504Total level 2 financial liabilities 248,257 246,087 232,027Total level 3 financial liabilities 19,595 21,067 21,448Counterparty and cash collateral netting (37,597) (37,802) (44,695)Total financial liabilities at fair value $298,789 $297,084 $271,284
Total level 3 financial liabilities divided bytotal financial liabilities at fair value 6.6% 7.1% 7.9%
In the table above:
‰ Counterparty netting among positions classified in thesame level is included in that level.
‰ Counterparty and cash collateral netting represents theimpact on derivatives of netting across levels of the fairvalue hierarchy.
‰ Total assets included $878 billion, $867 billion and$835 billion as of June 2017, March 2017 andDecember 2016, respectively, that is carried at fair valueor at amounts that generally approximate fair value.
15 Goldman Sachs June 2017 Form 10-Q

THE GOLDMAN SACHS GROUP, INC. AND SUBSIDIARIES
Notes to Condensed Consolidated Financial Statements(Unaudited)
The table below presents a summary of level 3 financialassets.
As of
$ in millionsJune2017
March2017
December2016
Cash instruments $16,196 $18,324 $18,035Derivatives 4,650 4,950 5,190Other financial assets 1 14 55Total $20,847 $23,288 $23,280
Level 3 financial assets as of June 2017 decreased comparedwith March 2017 and December 2016, primarily reflectinga decrease in level 3 cash instruments. See Notes 6 through8 for further information about level 3 financial assets(including information about unrealized gains and lossesrelated to level 3 financial assets and financial liabilities,and transfers in and out of level 3).
Note 6.
Cash Instruments
Cash instruments include U.S. government and agencyobligations, non-U.S. government and agency obligations,mortgage-backed loans and securities, corporate loans anddebt securities, equity securities, investments in funds atNAV, and other non-derivative financial instrumentsowned and financial instruments sold, but not yetpurchased. See below for the types of cash instrumentsincluded in each level of the fair value hierarchy and thevaluation techniques and significant inputs used todetermine their fair values. See Note 5 for an overview ofthe firm’s fair value measurement policies.
Level 1 Cash Instruments
Level 1 cash instruments include certain money marketinstruments, U.S. government obligations, most non-U.S.government obligations, certain government agencyobligations, certain corporate debt securities and activelytraded listed equities. These instruments are valued usingquoted prices for identical unrestricted instruments inactive markets.
The firm defines active markets for equity instrumentsbased on the average daily trading volume both in absoluteterms and relative to the market capitalization for theinstrument. The firm defines active markets for debtinstruments based on both the average daily trading volumeand the number of days with trading activity.
Level 2 Cash Instruments
Level 2 cash instruments include most money marketinstruments, most government agency obligations, certainnon-U.S. government obligations, most mortgage-backedloans and securities, most corporate loans and debtsecurities, most state and municipal obligations, most otherdebt obligations, restricted or less liquid listed equities,commodities and certain lending commitments.
Valuations of level 2 cash instruments can be verified toquoted prices, recent trading activity for identical or similarinstruments, broker or dealer quotations or alternativepricing sources with reasonable levels of price transparency.Consideration is given to the nature of the quotations (e.g.,indicative or firm) and the relationship of recent marketactivity to the prices provided from alternative pricingsources.
Valuation adjustments are typically made to level 2 cashinstruments (i) if the cash instrument is subject to transferrestrictions and/or (ii) for other premiums and liquiditydiscounts that a market participant would require to arriveat fair value. Valuation adjustments are generally based onmarket evidence.
Level 3 Cash Instruments
Level 3 cash instruments have one or more significantvaluation inputs that are not observable. Absent evidence tothe contrary, level 3 cash instruments are initially valued attransaction price, which is considered to be the best initialestimate of fair value. Subsequently, the firm uses othermethodologies to determine fair value, which vary based onthe type of instrument. Valuation inputs and assumptionsare changed when corroborated by substantive observableevidence, including values realized on sales of financialassets.
Valuation Techniques and Significant Inputs of
Level 3 Cash Instruments
Valuation techniques of level 3 cash instruments vary byinstrument, but are generally based on discounted cash flowtechniques. The valuation techniques and the nature ofsignificant inputs used to determine the fair values of eachtype of level 3 cash instrument are described below:
Loans and Securities Backed by Commercial Real
Estate. Loans and securities backed by commercial realestate are directly or indirectly collateralized by a singlecommercial real estate property or a portfolio of properties,and may include tranches of varying levels ofsubordination. Significant inputs are generally determinedbased on relative value analyses and include:
Goldman Sachs June 2017 Form 10-Q 16

THE GOLDMAN SACHS GROUP, INC. AND SUBSIDIARIES
Notes to Condensed Consolidated Financial Statements(Unaudited)
‰ Transaction prices in both the underlying collateral andinstruments with the same or similar underlyingcollateral;
‰ Market yields implied by transactions of similar or relatedassets and/or current levels and changes in market indicessuch as the CMBX (an index that tracks the performanceof commercial mortgage bonds);
‰ A measure of expected future cash flows in a defaultscenario (recovery rates) implied by the value of theunderlying collateral, which is mainly driven by currentperformance of the underlying collateral, capitalizationrates and multiples. Recovery rates are expressed as apercentage of notional or face value of the instrument andreflect the benefit of credit enhancements on certaininstruments; and
‰ Timing of expected future cash flows (duration) which, incertain cases, may incorporate the impact of otherunobservable inputs (e.g., prepayment speeds).
Loans and Securities Backed by Residential Real
Estate. Loans and securities backed by residential realestate are directly or indirectly collateralized by portfoliosof residential real estate and may include tranches ofvarying levels of subordination. Significant inputs aregenerally determined based on relative value analyses,which incorporate comparisons to instruments with similarcollateral and risk profiles. Significant inputs include:
‰ Transaction prices in both the underlying collateral andinstruments with the same or similar underlyingcollateral;
‰ Market yields implied by transactions of similar or relatedassets;
‰ Cumulative loss expectations, driven by default rates,home price projections, residential property liquidationtimelines, related costs and subsequent recoveries; and
‰ Duration, driven by underlying loan prepayment speedsand residential property liquidation timelines.
Corporate Loans and Debt Securities. Corporate loansand debt securities includes bank loans and bridge loansand corporate debt securities. Significant inputs aregenerally determined based on relative value analyses,which incorporate comparisons both to prices of creditdefault swaps that reference the same or similar underlyinginstrument or entity and to other debt instruments for thesame issuer for which observable prices or brokerquotations are available. Significant inputs include:
‰ Market yields implied by transactions of similar or relatedassets and/or current levels and trends of market indicessuch as CDX and LCDX (indices that track theperformance of corporate credit and loans, respectively);
‰ Current performance and recovery assumptions and,where the firm uses credit default swaps to value therelated cash instrument, the cost of borrowing theunderlying reference obligation; and
‰ Duration.
Equity Securities. Equity securities includes private equitysecurities and convertible debentures. Recent third-partycompleted or pending transactions (e.g., merger proposals,tender offers, debt restructurings) are considered to be thebest evidence for any change in fair value. When these arenot available, the following valuation methodologies areused, as appropriate:
‰ Industry multiples (primarily EBITDA multiples) andpublic comparables;
‰ Transactions in similar instruments;
‰ Discounted cash flow techniques; and
‰ Third-party appraisals.
The firm also considers changes in the outlook for therelevant industry and financial performance of the issuer ascompared to projected performance. Significant inputsinclude:
‰ Market and transaction multiples;
‰ Discount rates and capitalization rates; and
‰ For equity securities with debt-like features, market yieldsimplied by transactions of similar or related assets,current performance and recovery assumptions, andduration.
Other Cash Instruments. Other cash instruments consistsof non-U.S. government and agency obligations, state andmunicipal obligations, and other debt obligations.Significant inputs are generally determined based onrelative value analyses, which incorporate comparisonsboth to prices of credit default swaps that reference thesame or similar underlying instrument or entity and toother debt instruments for the same issuer for whichobservable prices or broker quotations are available.Significant inputs include:
‰ Market yields implied by transactions of similar or relatedassets and/or current levels and trends of market indices;
‰ Current performance and recovery assumptions and,where the firm uses credit default swaps to value therelated cash instrument, the cost of borrowing theunderlying reference obligation; and
‰ Duration.
17 Goldman Sachs June 2017 Form 10-Q

THE GOLDMAN SACHS GROUP, INC. AND SUBSIDIARIES
Notes to Condensed Consolidated Financial Statements(Unaudited)
Fair Value of Cash Instruments by Level
The tables below present cash instrument assets andliabilities at fair value by level within the fair valuehierarchy.
As of June 2017
$ in millions Level 1 Level 2 Level 3 Total
Assets
Money market instruments $ 266 $ 1,383 $ — $ 1,649
U.S. government and agencyobligations 44,431 29,807 — 74,238
Non-U.S. government and agencyobligations 27,787 7,222 2 35,011
Loans and securities backed by:Commercial real estate — 2,964 1,400 4,364
Residential real estate — 9,009 807 9,816
Corporate loans and debtsecurities 702 29,388 3,645 33,735
State and municipal obligations — 684 99 783
Other debt obligations — 1,182 410 1,592
Equity securities 90,264 8,905 9,833 109,002
Commodities — 3,225 — 3,225
Subtotal $163,450 $ 93,769 $16,196 $273,415
Investments in funds at NAV 5,910
Total cash instrument assets $279,325
Liabilities
U.S. government and agencyobligations $ (17,738) $ (8) $ — $ (17,746)
Non-U.S. government and agencyobligations (25,097) (1,657) — (26,754)
Loans and securities backed by:Commercial real estate — (5) — (5)
Residential real estate — (1) — (1)
Corporate loans and debtsecurities (6) (8,616) (32) (8,654)
Other debt obligations — (1) — (1)
Equity securities (24,765) (290) (10) (25,065)
Total cash instrument liabilities $ (67,606) $(10,578) $ (42) $ (78,226)
As of December 2016
$ in millions Level 1 Level 2 Level 3 Total
Assets
Money market instruments $ 188 $ 1,131 $ — $ 1,319U.S. government and agency
obligations 35,254 22,403 — 57,657Non-U.S. government and agency
obligations 22,433 6,933 15 29,381Loans and securities backed by:
Commercial real estate — 2,197 1,645 3,842Residential real estate — 11,350 845 12,195
Corporate loans and debt securities 215 23,804 4,640 28,659State and municipal obligations — 960 99 1,059Other debt obligations — 830 528 1,358Equity securities 77,276 7,153 10,263 94,692Commodities — 5,653 — 5,653Subtotal $135,366 $82,414 $18,035 $235,815Investments in funds at NAV 6,465Total cash instrument assets $242,280
Liabilities
U.S. government and agencyobligations $ (16,615) $ (12) $ — $ (16,627)
Non-U.S. government and agencyobligations (19,137) (1,364) (1) (20,502)
Loans and securities backed byresidential real estate — (3) — (3)
Corporate loans and debt securities (2) (6,524) (44) (6,570)Other debt obligations — (1) — (1)Equity securities (25,768) (156) (17) (25,941)Total cash instrument liabilities $ (61,522) $ (8,060) $ (62) $ (69,644)
In the tables above:
‰ Cash instrument assets and liabilities are included in“Financial instruments owned” and “Financialinstruments sold, but not yet purchased,” respectively.
‰ Cash instrument assets are shown as positive amountsand cash instrument liabilities are shown as negativeamounts.
‰ Money market instruments includes commercial paper,certificates of deposit and time deposits.
‰ Equity securities includes public and private equities,exchange-traded funds and convertible debentures.
‰ As of June 2017 and December 2016, substantially all ofthe firm’s level 3 equity securities were comprised ofprivate equity securities.
‰ Total cash instrument assets included collateralized debtobligations (CDOs) and collateralized loan obligations(CLOs) backed by real estate and corporate obligations of$490 million and $461 million in level 2, and$477 million and $624 million in level 3 as of June 2017and December 2016, respectively.
Goldman Sachs June 2017 Form 10-Q 18

THE GOLDMAN SACHS GROUP, INC. AND SUBSIDIARIES
Notes to Condensed Consolidated Financial Statements(Unaudited)
Significant Unobservable Inputs
The table below presents the amount of level 3 assets, andranges and weighted averages of significant unobservableinputs used to value the firm’s level 3 cash instruments.
Level 3 Assets and Range of SignificantUnobservable Inputs (Weighted Average) as of
$ in millionsJune2017
December2016
Loans and securities backed by commercial real estate
Level 3 assets $1,400 $1,645Yield 3.9% to 22.0% (11.4%) 3.7% to 23.0% (13.0%)Recovery rate 15.9% to 98.7% (50.8%) 8.9% to 99.0% (60.6%)Duration (years) 0.8 to 5.9 (2.2) 0.8 to 6.2 (2.1)
Loans and securities backed by residential real estate
Level 3 assets $807 $845Yield 1.8% to 18.0% (8.0%) 0.8% to 15.6% (8.7%)Cumulative loss rate 1.3% to 46.3% (20.8%) 8.9% to 47.1% (24.2%)Duration (years) 1.2 to 15.1 (7.7) 1.1 to 16.1 (7.3)
Corporate loans and debt securities
Level 3 assets $3,645 $4,640Yield 2.9% to 20.3% (10.7%) 2.5% to 25.0% (10.3%)Recovery rate 0.0% to 94.7% (56.9%) 0.0% to 85.0% (56.5%)Duration (years) 1.2 to 6.6 (3.0) 0.6 to 15.7 (2.9)
Equity securities
Level 3 assets $9,833 $10,263Multiples 0.9x to 18.6x (7.5x) 0.8x to 19.7x (6.8x)Discount rate/yield 6.5% to 29.5% (16.3%) 6.5% to 25.0% (16.0%)Capitalization rate 4.5% to 12.5% (6.7%) 4.2% to 12.5% (6.8%)
Other cash instruments
Level 3 assets $511 $642Yield 3.0% to 15.0% (8.2%) 1.9% to 14.0% (8.8%)Recovery rate N/A 0.0% to 93.0% (61.4%)Duration (years) 0.7 to 11.9 (4.5) 0.9 to 12.0 (4.3)
In the table above:
‰ Ranges represent the significant unobservable inputs thatwere used in the valuation of each type of cashinstrument.
‰ Weighted averages are calculated by weighting each inputby the relative fair value of the cash instruments.
‰ The ranges and weighted averages of these inputs are notrepresentative of the appropriate inputs to use whencalculating the fair value of any one cash instrument. Forexample, the highest multiple for private equity securitiesis appropriate for valuing a specific private equity securitybut may not be appropriate for valuing any other privateequity security. Accordingly, the ranges of inputs do notrepresent uncertainty in, or possible ranges of, fair valuemeasurements of the firm’s level 3 cash instruments.
‰ Increases in yield, discount rate, capitalization rate,duration or cumulative loss rate used in the valuation ofthe firm’s level 3 cash instruments would result in a lowerfair value measurement, while increases in recovery rateor multiples would result in a higher fair valuemeasurement. Due to the distinctive nature of each of thefirm’s level 3 cash instruments, the interrelationship ofinputs is not necessarily uniform within each producttype.
‰ Equity securities includes private equity securities andconvertible debentures.
‰ Loans and securities backed by commercial andresidential real estate, corporate loans and debt securitiesand other cash instruments are valued using discountedcash flows, and equity securities are valued using marketcomparables and discounted cash flows.
‰ The fair value of any one instrument may be determinedusing multiple valuation techniques. For example, marketcomparables and discounted cash flows may be usedtogether to determine fair value. Therefore, the level 3balance encompasses both of these techniques.
‰ Recovery rate was not significant to the valuation oflevel 3 other cash instrument assets as of June 2017.
Transfers Between Levels of the Fair Value Hierarchy
Transfers between levels of the fair value hierarchy arereported at the beginning of the reporting period in whichthey occur. See “Level 3 Rollforward” below forinformation about transfers between level 2 and level 3.
During the three and six months ended June 2017, transfersinto level 2 from level 1 of cash instruments were$66 million and $168 million, respectively, reflectingtransfers of public equity securities due to decreased marketactivity in these instruments. Transfers into level 1 fromlevel 2 of cash instruments during the three and six monthsended June 2017, were $138 million and $178 million,respectively, reflecting transfers of public equity securitiesdue to increased market activity in these instruments.
During the three and six months ended June 2016, transfersinto level 2 from level 1 of cash instruments were$82 million and $162 million, respectively, reflectingtransfers of public equity securities primarily due todecreased market activity in these instruments. Transfersinto level 1 from level 2 of cash instruments during the threeand six months ended June 2016, were $6 million and$195 million, respectively, reflecting transfers of publicequity securities principally due to increased market activityin these instruments.
19 Goldman Sachs June 2017 Form 10-Q

THE GOLDMAN SACHS GROUP, INC. AND SUBSIDIARIES
Notes to Condensed Consolidated Financial Statements(Unaudited)
Level 3 Rollforward
The table below presents a summary of the changes in fairvalue for level 3 cash instrument assets and liabilities.
Three MonthsEnded June
Six MonthsEnded June
$ in millions 2017 2016 2017 2016
Total cash instrument assets
Beginning balance $18,324 $18,469 $18,035 $18,131Net realized gains/(losses) 119 157 230 292Net unrealized gains/(losses) 554 50 892 (69)Purchases 518 708 1,026 2,096Sales (693) (480) (1,299) (1,169)Settlements (697) (1,014) (1,281) (1,763)Transfers into level 3 774 1,599 1,717 2,239Transfers out of level 3 (2,703) (1,358) (3,124) (1,626)Ending balance $16,196 $18,131 $16,196 $18,131
Total cash instrument liabilities
Beginning balance $ (49) $ (138) $ (62) $ (193)Net realized gains/(losses) 1 — — 2Net unrealized gains/(losses) (1) 17 3 19Purchases 40 23 50 69Sales (27) (24) (33) (39)Settlements (5) (5) (1) (11)Transfers into level 3 (6) (1) (2) (4)Transfers out of level 3 5 5 3 34Ending balance $ (42) $ (123) $ (42) $ (123)
In the table above:
‰ Changes in fair value are presented for all cash instrumentassets and liabilities that are classified in level 3 as of theend of the period.
‰ Net unrealized gains/(losses) relate to instruments thatwere still held at period-end.
‰ Purchases includes originations and secondary purchases.
‰ If a cash instrument asset or liability was transferred tolevel 3 during a reporting period, its entire gain or loss forthe period is classified in level 3. For level 3 cashinstrument assets, increases are shown as positiveamounts, while decreases are shown as negative amounts.For level 3 cash instrument liabilities, increases are shownas negative amounts, while decreases are shown aspositive amounts.
‰ Level 3 cash instruments are frequently economicallyhedged with level 1 and level 2 cash instruments and/orlevel 1, level 2 or level 3 derivatives. Accordingly, gains orlosses that are classified in level 3 can be partially offsetby gains or losses attributable to level 1 or level 2 cashinstruments and/or level 1, level 2 or level 3 derivatives.As a result, gains or losses included in the level 3rollforward below do not necessarily represent the overallimpact on the firm’s results of operations, liquidity orcapital resources.
The table below disaggregates, by product type, theinformation for cash instrument assets included in thesummary table above.
Three MonthsEnded June
Six MonthsEnded June
$ in millions 2017 2016 2017 2016
Loans and securities backed by commercial real estate
Beginning balance $ 1,604 $2,168 $ 1,645 $1,924Net realized gains/(losses) 12 18 23 41Net unrealized gains/(losses) 57 (38) 78 (55)Purchases 116 104 166 466Sales (60) (100) (110) (207)Settlements (167) (175) (298) (286)Transfers into level 3 82 438 134 480Transfers out of level 3 (244) (303) (238) (251)Ending balance $ 1,400 $2,112 $ 1,400 $2,112
Loans and securities backed by residential real estate
Beginning balance $ 830 $1,434 $ 845 $1,765Net realized gains/(losses) 11 12 27 18Net unrealized gains/(losses) 60 19 80 67Purchases 93 56 121 141Sales (158) (143) (214) (463)Settlements (38) (64) (69) (131)Transfers into level 3 38 85 40 106Transfers out of level 3 (29) (99) (23) (203)Ending balance $ 807 $1,300 $ 807 $1,300
Corporate loans and debt securities
Beginning balance $ 4,553 $5,791 $ 4,640 $5,242Net realized gains/(losses) 55 94 105 176Net unrealized gains/(losses) 20 (15) 108 (72)Purchases 200 255 491 589Sales (212) (174) (630) (235)Settlements (289) (601) (507) (918)Transfers into level 3 527 587 806 1,023Transfers out of level 3 (1,209) (604) (1,368) (472)Ending balance $ 3,645 $5,333 $ 3,645 $5,333
Equity securities
Beginning balance $10,715 $8,474 $10,263 $8,549Net realized gains/(losses) 38 26 65 47Net unrealized gains/(losses) 402 80 618 (13)Purchases 90 254 186 706Sales (256) (49) (290) (113)Settlements (163) (118) (330) (350)Transfers into level 3 124 374 726 558Transfers out of level 3 (1,117) (336) (1,405) (679)Ending balance $ 9,833 $8,705 $ 9,833 $8,705
Other cash instruments
Beginning balance $ 622 $ 602 $ 642 $ 651Net realized gains/(losses) 3 7 10 10Net unrealized gains/(losses) 15 4 8 4Purchases 19 39 62 194Sales (7) (14) (55) (151)Settlements (40) (56) (77) (78)Transfers into level 3 3 115 11 72Transfers out of level 3 (104) (16) (90) (21)Ending balance $ 511 $ 681 $ 511 $ 681
Goldman Sachs June 2017 Form 10-Q 20
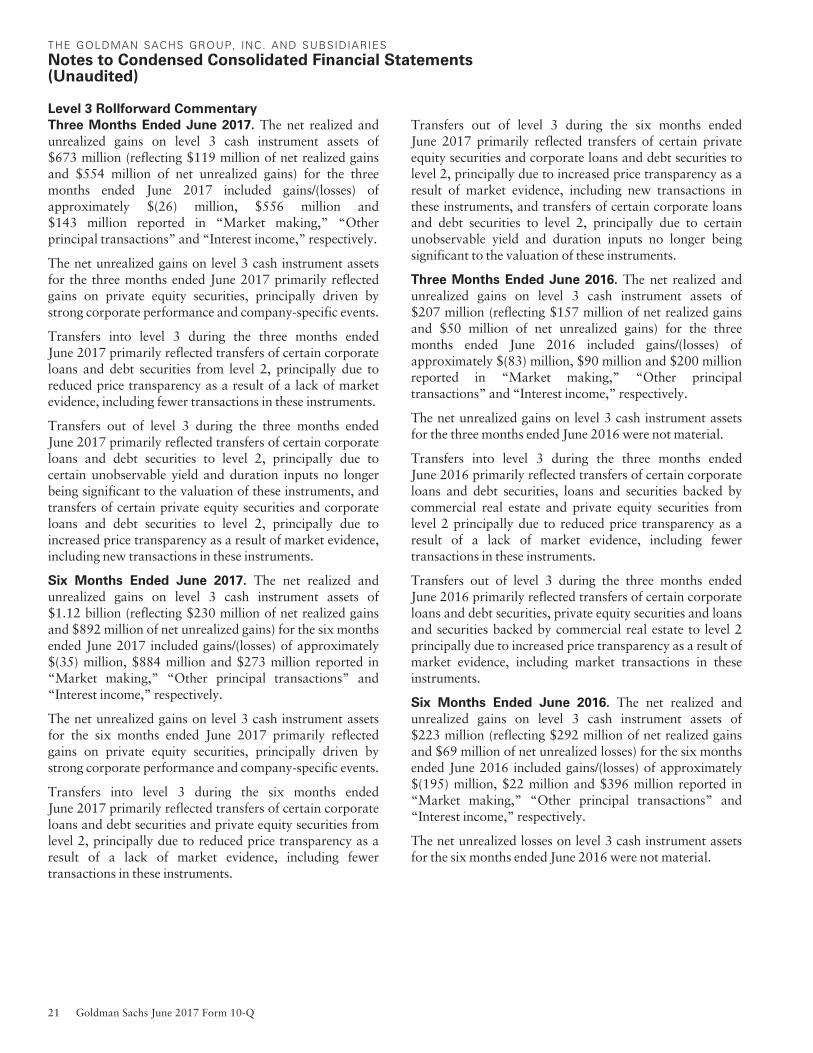
THE GOLDMAN SACHS GROUP, INC. AND SUBSIDIARIES
Notes to Condensed Consolidated Financial Statements(Unaudited)
Level 3 Rollforward Commentary
Three Months Ended June 2017. The net realized andunrealized gains on level 3 cash instrument assets of$673 million (reflecting $119 million of net realized gainsand $554 million of net unrealized gains) for the threemonths ended June 2017 included gains/(losses) ofapproximately $(26) million, $556 million and$143 million reported in “Market making,” “Otherprincipal transactions” and “Interest income,” respectively.
The net unrealized gains on level 3 cash instrument assetsfor the three months ended June 2017 primarily reflectedgains on private equity securities, principally driven bystrong corporate performance and company-specific events.
Transfers into level 3 during the three months endedJune 2017 primarily reflected transfers of certain corporateloans and debt securities from level 2, principally due toreduced price transparency as a result of a lack of marketevidence, including fewer transactions in these instruments.
Transfers out of level 3 during the three months endedJune 2017 primarily reflected transfers of certain corporateloans and debt securities to level 2, principally due tocertain unobservable yield and duration inputs no longerbeing significant to the valuation of these instruments, andtransfers of certain private equity securities and corporateloans and debt securities to level 2, principally due toincreased price transparency as a result of market evidence,including new transactions in these instruments.
Six Months Ended June 2017. The net realized andunrealized gains on level 3 cash instrument assets of$1.12 billion (reflecting $230 million of net realized gainsand $892 million of net unrealized gains) for the six monthsended June 2017 included gains/(losses) of approximately$(35) million, $884 million and $273 million reported in“Market making,” “Other principal transactions” and“Interest income,” respectively.
The net unrealized gains on level 3 cash instrument assetsfor the six months ended June 2017 primarily reflectedgains on private equity securities, principally driven bystrong corporate performance and company-specific events.
Transfers into level 3 during the six months endedJune 2017 primarily reflected transfers of certain corporateloans and debt securities and private equity securities fromlevel 2, principally due to reduced price transparency as aresult of a lack of market evidence, including fewertransactions in these instruments.
Transfers out of level 3 during the six months endedJune 2017 primarily reflected transfers of certain privateequity securities and corporate loans and debt securities tolevel 2, principally due to increased price transparency as aresult of market evidence, including new transactions inthese instruments, and transfers of certain corporate loansand debt securities to level 2, principally due to certainunobservable yield and duration inputs no longer beingsignificant to the valuation of these instruments.
Three Months Ended June 2016. The net realized andunrealized gains on level 3 cash instrument assets of$207 million (reflecting $157 million of net realized gainsand $50 million of net unrealized gains) for the threemonths ended June 2016 included gains/(losses) ofapproximately $(83) million, $90 million and $200 millionreported in “Market making,” “Other principaltransactions” and “Interest income,” respectively.
The net unrealized gains on level 3 cash instrument assetsfor the three months ended June 2016 were not material.
Transfers into level 3 during the three months endedJune 2016 primarily reflected transfers of certain corporateloans and debt securities, loans and securities backed bycommercial real estate and private equity securities fromlevel 2 principally due to reduced price transparency as aresult of a lack of market evidence, including fewertransactions in these instruments.
Transfers out of level 3 during the three months endedJune 2016 primarily reflected transfers of certain corporateloans and debt securities, private equity securities and loansand securities backed by commercial real estate to level 2principally due to increased price transparency as a result ofmarket evidence, including market transactions in theseinstruments.
Six Months Ended June 2016. The net realized andunrealized gains on level 3 cash instrument assets of$223 million (reflecting $292 million of net realized gainsand $69 million of net unrealized losses) for the six monthsended June 2016 included gains/(losses) of approximately$(195) million, $22 million and $396 million reported in“Market making,” “Other principal transactions” and“Interest income,” respectively.
The net unrealized losses on level 3 cash instrument assetsfor the six months ended June 2016 were not material.
21 Goldman Sachs June 2017 Form 10-Q

THE GOLDMAN SACHS GROUP, INC. AND SUBSIDIARIES
Notes to Condensed Consolidated Financial Statements(Unaudited)
Transfers into level 3 during the six months endedJune 2016 primarily reflected transfers of certain corporateloans and debt securities, private equity securities and loansand securities backed by commercial real estate from level 2principally due to reduced price transparency as a result of alack of market evidence, including fewer transactions inthese instruments.
Transfers out of level 3 during the six months endedJune 2016 primarily reflected transfers of certain privateequity securities, corporate loans and debt securities, loansand securities backed by commercial real estate, and loansand securities backed by residential real estate to level 2principally due to increased price transparency as a result ofmarket evidence, including market transactions in theseinstruments.
Investments in Funds at Net Asset Value Per Share
Cash instruments at fair value include investments in fundsthat are measured at NAV of the investment fund. The firmuses NAV to measure the fair value of its fund investmentswhen (i) the fund investment does not have a readilydeterminable fair value and (ii) the NAV of the investmentfund is calculated in a manner consistent with themeasurement principles of investment companyaccounting, including measurement of the investments atfair value.
Substantially all of the firm’s investments in funds at NAVconsist of investments in firm-sponsored private equity,credit, real estate and hedge funds where the firm co-investswith third-party investors.
Private equity funds primarily invest in a broad range ofindustries worldwide, including leveraged buyouts,recapitalizations, growth investments and distressedinvestments. Credit funds generally invest in loans andother fixed income instruments and are focused onproviding private high-yield capital for leveraged andmanagement buyout transactions, recapitalizations,financings, refinancings, acquisitions and restructurings forprivate equity firms, private family companies andcorporate issuers. Real estate funds invest globally,primarily in real estate companies, loan portfolios, debtrecapitalizations and property. Private equity, credit andreal estate funds are closed-end funds in which the firm’sinvestments are generally not eligible for redemption.Distributions will be received from these funds as theunderlying assets are liquidated or distributed.
The firm also invests in hedge funds, primarily multi-disciplinary hedge funds that employ a fundamentalbottom-up investment approach across various asset classesand strategies. The firm’s investments in hedge fundsprimarily include interests where the underlying assets areilliquid in nature, and proceeds from redemptions will notbe received until the underlying assets are liquidated ordistributed.
Many of the funds described above are “covered funds” asdefined by the Volcker Rule of the U.S. Dodd-Frank WallStreet Reform and Consumer Protection Act (Dodd-FrankAct). The Board of Governors of the Federal ReserveSystem (Federal Reserve Board) extended the conformanceperiod to July 2022 for the firm’s investments in, andrelationships with, certain legacy “illiquid covered funds”(as defined by the Volcker Rule) that were in place prior toDecember 2013. This extension is applicable tosubstantially all of the firm’s remaining investments in, andrelationships with, covered funds in the table below. Thefirm will continue to manage and conform its investmentsin, and relationships with, such covered funds, taking intoaccount the conformance period.
The table below presents the fair value of the firm’sinvestments in funds at NAV and related unfundedcommitments.
$ in millionsFair Value ofInvestments
UnfundedCommitments
As of June 2017
Private equity funds $4,346 $ 629
Credit funds 295 408
Hedge funds 321 —
Real estate funds 948 270
Total $5,910 $1,307
As of December 2016Private equity funds $4,628 $1,393Credit funds 421 166Hedge funds 410 —Real estate funds 1,006 272Total $6,465 $1,831
Note 7.
Derivatives and Hedging Activities
Derivative Activities
Derivatives are instruments that derive their value fromunderlying asset prices, indices, reference rates and otherinputs, or a combination of these factors. Derivatives maybe traded on an exchange (exchange-traded) or they may beprivately negotiated contracts, which are usually referred toas OTC derivatives. Certain of the firm’s OTC derivativesare cleared and settled through central clearingcounterparties (OTC-cleared), while others are bilateralcontracts between two counterparties (bilateral OTC).
Goldman Sachs June 2017 Form 10-Q 22

THE GOLDMAN SACHS GROUP, INC. AND SUBSIDIARIES
Notes to Condensed Consolidated Financial Statements(Unaudited)
Market-Making. As a market maker, the firm enters intoderivative transactions to provide liquidity to clients and tofacilitate the transfer and hedging of their risks. In this role,the firm typically acts as principal and is required to commitcapital to provide execution, and maintains inventory inresponse to, or in anticipation of, client demand.
Risk Management. The firm also enters into derivatives toactively manage risk exposures that arise from its market-making and investing and lending activities in derivativeand cash instruments. The firm’s holdings and exposuresare hedged, in many cases, on either a portfolio or risk-specific basis, as opposed to an instrument-by-instrumentbasis. The offsetting impact of this economic hedging isreflected in the same business segment as the relatedrevenues. In addition, the firm may enter into derivativesdesignated as hedges under U.S. GAAP. These derivativesare used to manage interest rate exposure in certain fixed-rate unsecured long-term and short-term borrowings, anddeposits, and to manage foreign currency exposure on thenet investment in certain non-U.S. operations.
The firm enters into various types of derivatives, including:
‰ Futures and Forwards. Contracts that commitcounterparties to purchase or sell financial instruments,commodities or currencies in the future.
‰ Swaps. Contracts that require counterparties toexchange cash flows such as currency or interest paymentstreams. The amounts exchanged are based on thespecific terms of the contract with reference to specifiedrates, financial instruments, commodities, currencies orindices.
‰ Options. Contracts in which the option purchaser hasthe right, but not the obligation, to purchase from or sellto the option writer financial instruments, commoditiesor currencies within a defined time period for a specifiedprice.
Derivatives are reported on a net-by-counterparty basis(i.e., the net payable or receivable for derivative assets andliabilities for a given counterparty) when a legal right ofsetoff exists under an enforceable netting agreement(counterparty netting). Derivatives are accounted for at fairvalue, net of cash collateral received or posted underenforceable credit support agreements (cash collateralnetting). Derivative assets and liabilities are included in“Financial instruments owned” and “Financial instrumentssold, but not yet purchased,” respectively. Realized andunrealized gains and losses on derivatives not designated ashedges under ASC 815 are included in “Market making”and “Other principal transactions” in Note 4.
The tables below present the gross fair value and thenotional amounts of derivative contracts by major producttype, the amounts of counterparty and cash collateralnetting in the condensed consolidated statements offinancial condition, as well as cash and securities collateralposted and received under enforceable credit supportagreements that do not meet the criteria for netting underU.S. GAAP.
As of June 2017 As of December 2016
$ in millionsDerivative
AssetsDerivativeLiabilities
DerivativeAssets
DerivativeLiabilities
Not accounted for as hedges
Exchange-traded $ 455 $ 582 $ 443 $ 382OTC-cleared 143,572 121,483 189,471 168,946Bilateral OTC 279,604 256,454 309,037 289,491Total interest rates 423,631 378,519 498,951 458,819OTC-cleared 5,390 5,212 4,837 4,811Bilateral OTC 18,542 16,667 21,530 18,770Total credit 23,932 21,879 26,367 23,581Exchange-traded 37 49 36 176OTC-cleared 594 516 796 798Bilateral OTC 104,801 102,717 111,032 106,318Total currencies 105,432 103,282 111,864 107,292Exchange-traded 2,852 2,866 3,219 3,187OTC-cleared 211 226 189 197Bilateral OTC 7,259 9,413 8,945 10,487Total commodities 10,322 12,505 12,353 13,871Exchange-traded 9,329 8,826 8,576 8,064Bilateral OTC 38,557 43,501 39,516 45,826Total equities 47,886 52,327 48,092 53,890Subtotal 611,203 568,512 697,627 657,453Accounted for as hedges
OTC-cleared 5,539 161 4,347 156Bilateral OTC 2,928 7 4,180 10Total interest rates 8,467 168 8,527 166OTC-cleared 4 12 30 40Bilateral OTC 10 189 55 64Total currencies 14 201 85 104Subtotal 8,481 369 8,612 270Total gross fair value $ 619,684 $ 568,881 $ 706,239 $ 657,723
Offset in condensed consolidated statements of financial condition
Exchange-traded $ (10,719) $ (10,719) $ (9,727) $ (9,727)OTC-cleared (127,416) (127,416) (171,864) (171,864)Bilateral OTC (354,816) (354,816) (385,647) (385,647)Counterparty netting (492,951) (492,951) (567,238) (567,238)OTC-cleared (27,282) (97) (27,560) (2,940)Bilateral OTC (51,036) (36,080) (57,769) (40,046)Cash collateral netting (78,318) (36,177) (85,329) (42,986)Total amounts offset $(571,269) $(529,128) $(652,567) $(610,224)
Included in condensed consolidated statements of financial condition
Exchange-traded $ 1,954 $ 1,604 $ 2,547 $ 2,082OTC-cleared 612 97 246 144Bilateral OTC 45,849 38,052 50,879 45,273Total $ 48,415 $ 39,753 $ 53,672 $ 47,499
Not offset in condensed consolidated statements of financial condition
Cash collateral $ (565) $ (1,935) $ (535) $ (2,085)Securities collateral (14,056) (8,848) (15,518) (10,224)Total $ 33,794 $ 28,970 $ 37,619 $ 35,190
23 Goldman Sachs June 2017 Form 10-Q
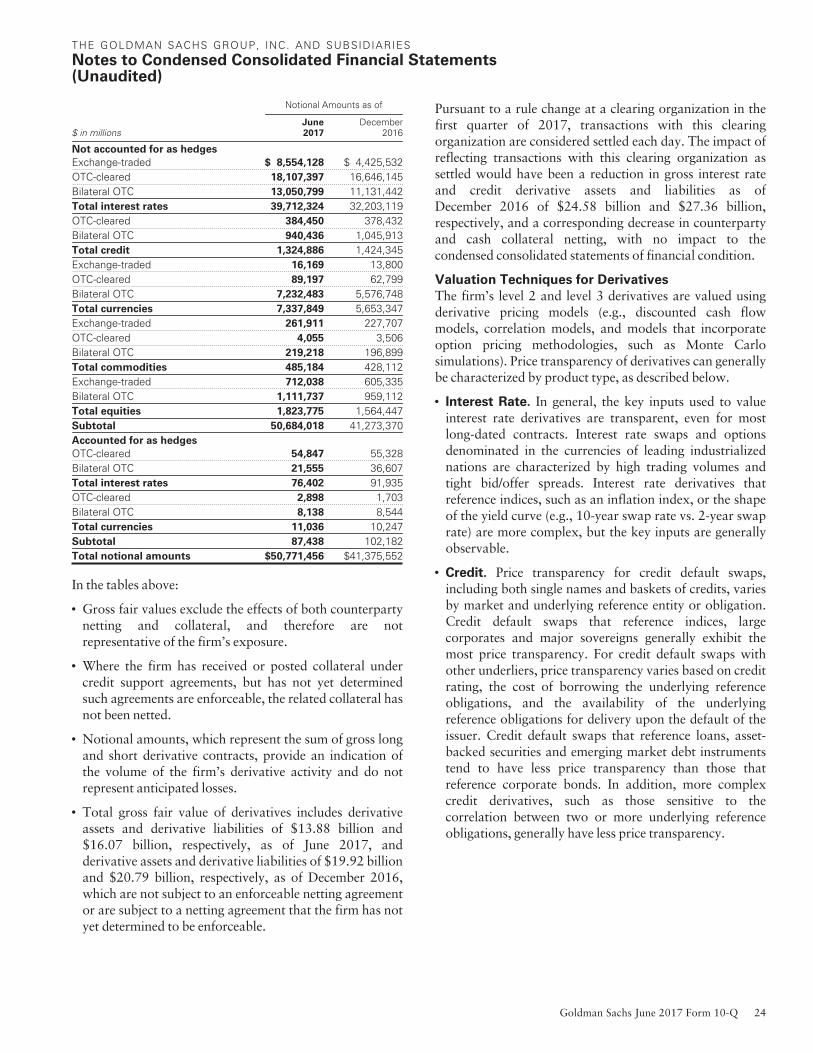
THE GOLDMAN SACHS GROUP, INC. AND SUBSIDIARIES
Notes to Condensed Consolidated Financial Statements(Unaudited)
Notional Amounts as of
$ in millionsJune2017
December2016
Not accounted for as hedges
Exchange-traded $ 8,554,128 $ 4,425,532OTC-cleared 18,107,397 16,646,145Bilateral OTC 13,050,799 11,131,442Total interest rates 39,712,324 32,203,119OTC-cleared 384,450 378,432Bilateral OTC 940,436 1,045,913Total credit 1,324,886 1,424,345Exchange-traded 16,169 13,800OTC-cleared 89,197 62,799Bilateral OTC 7,232,483 5,576,748Total currencies 7,337,849 5,653,347Exchange-traded 261,911 227,707OTC-cleared 4,055 3,506Bilateral OTC 219,218 196,899Total commodities 485,184 428,112Exchange-traded 712,038 605,335Bilateral OTC 1,111,737 959,112Total equities 1,823,775 1,564,447Subtotal 50,684,018 41,273,370Accounted for as hedges
OTC-cleared 54,847 55,328Bilateral OTC 21,555 36,607Total interest rates 76,402 91,935OTC-cleared 2,898 1,703Bilateral OTC 8,138 8,544Total currencies 11,036 10,247Subtotal 87,438 102,182Total notional amounts $50,771,456 $41,375,552
In the tables above:
‰ Gross fair values exclude the effects of both counterpartynetting and collateral, and therefore are notrepresentative of the firm’s exposure.
‰ Where the firm has received or posted collateral undercredit support agreements, but has not yet determinedsuch agreements are enforceable, the related collateral hasnot been netted.
‰ Notional amounts, which represent the sum of gross longand short derivative contracts, provide an indication ofthe volume of the firm’s derivative activity and do notrepresent anticipated losses.
‰ Total gross fair value of derivatives includes derivativeassets and derivative liabilities of $13.88 billion and$16.07 billion, respectively, as of June 2017, andderivative assets and derivative liabilities of $19.92 billionand $20.79 billion, respectively, as of December 2016,which are not subject to an enforceable netting agreementor are subject to a netting agreement that the firm has notyet determined to be enforceable.
Pursuant to a rule change at a clearing organization in thefirst quarter of 2017, transactions with this clearingorganization are considered settled each day. The impact ofreflecting transactions with this clearing organization assettled would have been a reduction in gross interest rateand credit derivative assets and liabilities as ofDecember 2016 of $24.58 billion and $27.36 billion,respectively, and a corresponding decrease in counterpartyand cash collateral netting, with no impact to thecondensed consolidated statements of financial condition.
Valuation Techniques for Derivatives
The firm’s level 2 and level 3 derivatives are valued usingderivative pricing models (e.g., discounted cash flowmodels, correlation models, and models that incorporateoption pricing methodologies, such as Monte Carlosimulations). Price transparency of derivatives can generallybe characterized by product type, as described below.
‰ Interest Rate. In general, the key inputs used to valueinterest rate derivatives are transparent, even for mostlong-dated contracts. Interest rate swaps and optionsdenominated in the currencies of leading industrializednations are characterized by high trading volumes andtight bid/offer spreads. Interest rate derivatives thatreference indices, such as an inflation index, or the shapeof the yield curve (e.g., 10-year swap rate vs. 2-year swaprate) are more complex, but the key inputs are generallyobservable.
‰ Credit. Price transparency for credit default swaps,including both single names and baskets of credits, variesby market and underlying reference entity or obligation.Credit default swaps that reference indices, largecorporates and major sovereigns generally exhibit themost price transparency. For credit default swaps withother underliers, price transparency varies based on creditrating, the cost of borrowing the underlying referenceobligations, and the availability of the underlyingreference obligations for delivery upon the default of theissuer. Credit default swaps that reference loans, asset-backed securities and emerging market debt instrumentstend to have less price transparency than those thatreference corporate bonds. In addition, more complexcredit derivatives, such as those sensitive to thecorrelation between two or more underlying referenceobligations, generally have less price transparency.
Goldman Sachs June 2017 Form 10-Q 24

THE GOLDMAN SACHS GROUP, INC. AND SUBSIDIARIES
Notes to Condensed Consolidated Financial Statements(Unaudited)
‰ Currency. Prices for currency derivatives based on theexchange rates of leading industrialized nations,including those with longer tenors, are generallytransparent. The primary difference between the pricetransparency of developed and emerging market currencyderivatives is that emerging markets tend to be observablefor contracts with shorter tenors.
‰ Commodity. Commodity derivatives includetransactions referenced to energy (e.g., oil and naturalgas), metals (e.g., precious and base) and softcommodities (e.g., agricultural). Price transparency variesbased on the underlying commodity, delivery location,tenor and product quality (e.g., diesel fuel compared tounleaded gasoline). In general, price transparency forcommodity derivatives is greater for contracts withshorter tenors and contracts that are more closely alignedwith major and/or benchmark commodity indices.
‰ Equity. Price transparency for equity derivatives varies bymarket and underlier. Options on indices and thecommon stock of corporates included in major equityindices exhibit the most price transparency. Equityderivatives generally have observable market prices,except for contracts with long tenors or reference pricesthat differ significantly from current market prices. Morecomplex equity derivatives, such as those sensitive to thecorrelation between two or more individual stocks,generally have less price transparency.
Liquidity is essential to observability of all product types. Iftransaction volumes decline, previously transparent pricesand other inputs may become unobservable. Conversely,even highly structured products may at times have tradingvolumes large enough to provide observability of prices andother inputs. See Note 5 for an overview of the firm’s fairvalue measurement policies.
Level 1 Derivatives
Level 1 derivatives include short-term contracts for futuredelivery of securities when the underlying security is alevel 1 instrument, and exchange-traded derivatives if theyare actively traded and are valued at their quoted marketprice.
Level 2 Derivatives
Level 2 derivatives include OTC derivatives for which allsignificant valuation inputs are corroborated by marketevidence and exchange-traded derivatives that are notactively traded and/or that are valued using models thatcalibrate to market-clearing levels of OTC derivatives.
The selection of a particular model to value a derivativedepends on the contractual terms of and specific risksinherent in the instrument, as well as the availability ofpricing information in the market. For derivatives thattrade in liquid markets, model selection does not involvesignificant management judgment because outputs ofmodels can be calibrated to market-clearing levels.
Valuation models require a variety of inputs, such ascontractual terms, market prices, yield curves, discountrates (including those derived from interest rates oncollateral received and posted as specified in credit supportagreements for collateralized derivatives), credit curves,measures of volatility, prepayment rates, loss severity ratesand correlations of such inputs. Significant inputs to thevaluations of level 2 derivatives can be verified to markettransactions, broker or dealer quotations or otheralternative pricing sources with reasonable levels of pricetransparency. Consideration is given to the nature of thequotations (e.g., indicative or firm) and the relationship ofrecent market activity to the prices provided fromalternative pricing sources.
Level 3 Derivatives
Level 3 derivatives are valued using models which utilizeobservable level 1 and/or level 2 inputs, as well asunobservable level 3 inputs. The significant unobservableinputs used to value the firm’s level 3 derivatives aredescribed below.
‰ For the majority of the firm’s interest rate and currencyderivatives classified in level 3, significant unobservableinputs include correlations of certain currencies andinterest rates (e.g., the correlation between Euro inflationand Euro interest rates) and specific interest ratevolatilities.
‰ For level 3 credit derivatives, significant unobservableinputs include illiquid credit spreads and upfront creditpoints, which are unique to specific reference obligationsand reference entities, recovery rates and certaincorrelations required to value credit derivatives (e.g., thelikelihood of default of the underlying referenceobligation relative to one another).
‰ For level 3 commodity derivatives, significantunobservable inputs include volatilities for options withstrike prices that differ significantly from current marketprices and prices or spreads for certain products for whichthe product quality or physical location of the commodityis not aligned with benchmark indices.
25 Goldman Sachs June 2017 Form 10-Q

THE GOLDMAN SACHS GROUP, INC. AND SUBSIDIARIES
Notes to Condensed Consolidated Financial Statements(Unaudited)
‰ For level 3 equity derivatives, significant unobservableinputs generally include equity volatility inputs foroptions that are long-dated and/or have strike prices thatdiffer significantly from current market prices. Inaddition, the valuation of certain structured tradesrequires the use of level 3 correlation inputs, such as thecorrelation of the price performance of two or moreindividual stocks or the correlation of the priceperformance for a basket of stocks to another asset classsuch as commodities.
Subsequent to the initial valuation of a level 3 derivative,the firm updates the level 1 and level 2 inputs to reflectobservable market changes and any resulting gains andlosses are classified in level 3. Level 3 inputs are changedwhen corroborated by evidence such as similar markettransactions, third-party pricing services and/or broker ordealer quotations or other empirical market data. Incircumstances where the firm cannot verify the model valueby reference to market transactions, it is possible that adifferent valuation model could produce a materiallydifferent estimate of fair value. See below for furtherinformation about significant unobservable inputs used inthe valuation of level 3 derivatives.
Valuation Adjustments
Valuation adjustments are integral to determining the fairvalue of derivative portfolios and are used to adjust themid-market valuations produced by derivative pricingmodels to the appropriate exit price valuation. Theseadjustments incorporate bid/offer spreads, the cost ofliquidity, credit valuation adjustments and fundingvaluation adjustments, which account for the credit andfunding risk inherent in the uncollateralized portion ofderivative portfolios. The firm also makes fundingvaluation adjustments to collateralized derivatives wherethe terms of the agreement do not permit the firm to deliveror repledge collateral received. Market-based inputs aregenerally used when calibrating valuation adjustments tomarket-clearing levels.
In addition, for derivatives that include significantunobservable inputs, the firm makes model or exit priceadjustments to account for the valuation uncertaintypresent in the transaction.
Fair Value of Derivatives by Level
The tables below present the fair value of derivatives on agross basis by level and major product type as well as theimpact of netting, included in the condensed consolidatedstatements of financial condition.
As of June 2017
$ in millions Level 1 Level 2 Level 3 Total
Assets
Interest rates $ 92 $ 431,419 $ 587 $ 432,098
Credit — 19,515 4,417 23,932
Currencies — 105,269 177 105,446
Commodities — 9,945 377 10,322
Equities 13 47,365 508 47,886
Gross fair value 105 613,513 6,066 619,684
Counterparty netting in levels — (490,115) (1,416) (491,531)
Subtotal $ 105 $ 123,398 $ 4,650 $ 128,153
Cross-level counterparty netting (1,420)
Cash collateral netting (78,318)
Net fair value $ 48,415
Liabilities
Interest rates $(542) $(377,239) $ (906) $(378,687)
Credit — (19,461) (2,418) (21,879)
Currencies — (103,331) (152) (103,483)
Commodities — (12,246) (259) (12,505)
Equities (386) (50,570) (1,371) (52,327)
Gross fair value (928) (562,847) (5,106) (568,881)
Counterparty netting in levels — 490,115 1,416 491,531
Subtotal $(928) $ (72,732) $(3,690) $ (77,350)
Cross-level counterparty netting 1,420
Cash collateral netting 36,177
Net fair value $ (39,753)
As of December 2016
$ in millions Level 1 Level 2 Level 3 Total
Assets
Interest rates $ 46 $ 506,818 $ 614 $ 507,478Credit — 21,388 4,979 26,367Currencies — 111,762 187 111,949Commodities — 11,950 403 12,353Equities 1 47,667 424 48,092Gross fair value 47 699,585 6,607 706,239Counterparty netting in levels (12) (564,100) (1,417) (565,529)Subtotal $ 35 $ 135,485 $ 5,190 $ 140,710Cross-level counterparty netting (1,709)Cash collateral netting (85,329)Net fair value $ 53,672
Liabilities
Interest rates $ (27) $(457,963) $ (995) $(458,985)Credit — (21,106) (2,475) (23,581)Currencies — (107,212) (184) (107,396)Commodities — (13,541) (330) (13,871)Equities (967) (49,083) (3,840) (53,890)Gross fair value (994) (648,905) (7,824) (657,723)Counterparty netting in levels 12 564,100 1,417 565,529Subtotal $(982) $ (84,805) $(6,407) $ (92,194)Cross-level counterparty netting 1,709Cash collateral netting 42,986Net fair value $ (47,499)
Goldman Sachs June 2017 Form 10-Q 26

THE GOLDMAN SACHS GROUP, INC. AND SUBSIDIARIES
Notes to Condensed Consolidated Financial Statements(Unaudited)
In the tables above:
‰ The gross fair values exclude the effects of bothcounterparty netting and collateral netting, and thereforeare not representative of the firm’s exposure.
‰ Counterparty netting is reflected in each level to the extentthat receivable and payable balances are netted within thesame level and is included in counterparty netting in levels.Where the counterparty netting is across levels, the nettingis included in cross-level counterparty netting.
‰ Derivative assets are shown as positive amounts andderivative liabilities are shown as negative amounts.
Significant Unobservable Inputs
The table below presents the amount of level 3 assets(liabilities), and ranges, averages and medians of significantunobservable inputs used to value the firm’s level 3derivatives.
Level 3 Assets (Liabilities) and Range of SignificantUnobservable Inputs (Average/Median) as of
$ in millionsJune2017
December2016
Interest rates, net $(319) $(381)Correlation (10)% to 86% (56%/60%) (10)% to 86% (56%/60%)Volatility (bps) 31 to 151 (84/57) 31 to 151 (84/57)
Credit, net $1,999 $2,504Correlation 36% to 88% (66%/67%) 35% to 91% (65%/68%)Credit spreads (bps) 1 to 737 (89/44) 1 to 993 (122/73)Upfront credit points 0 to 99 (47/40) 0 to 100 (43/35)Recovery rates 22% to 93% (57%/60%) 1% to 97% (58%/70%)
Currencies, net $25 $3Correlation 25% to 70% (50%/55%) 25% to 70% (50%/55%)
Commodities, net $118 $73Volatility 9% to 61% (27%/26%) 13% to 68% (33%/33%)
Natural gas spread$(1.61) to $3.60
($(0.18)/$(0.09))
$(1.81) to $4.33($(0.14)/$(0.05))
Oil spread $(11.13) to $58.64
($11.49/$0.33)
$(19.72) to $64.92($25.30/$16.43)
Equities, net $(863) $(3,416)Correlation (35)% to 92% (43%/41%) (39)% to 88% (41%/41%)Volatility 5% to 85% (24%/22%) 5% to 72% (24%/23%)
In the table above:
‰ Derivative assets are shown as positive amounts andderivative liabilities are shown as negative amounts.
‰ Ranges represent the significant unobservable inputs thatwere used in the valuation of each type of derivative.
‰ Averages represent the arithmetic average of the inputsand are not weighted by the relative fair value or notionalof the respective financial instruments. An average greaterthan the median indicates that the majority of inputs arebelow the average. For example, the difference betweenthe average and the median for credit spreads and oilspread inputs indicates that the majority of the inputs fallin the lower end of the range.
‰ The ranges, averages and medians of these inputs are notrepresentative of the appropriate inputs to use whencalculating the fair value of any one derivative. Forexample, the highest correlation for interest ratederivatives is appropriate for valuing a specific interestrate derivative but may not be appropriate for valuing anyother interest rate derivative. Accordingly, the ranges ofinputs do not represent uncertainty in, or possible rangesof, fair value measurements of the firm’s level 3derivatives.
‰ Interest rates, currencies and equities derivatives arevalued using option pricing models, credit derivatives arevalued using option pricing, correlation and discountedcash flow models, and commodities derivatives are valuedusing option pricing and discounted cash flow models.
‰ The fair value of any one instrument may be determinedusing multiple valuation techniques. For example, optionpricing models and discounted cash flows models aretypically used together to determine fair value. Therefore,the level 3 balance encompasses both of these techniques.
‰ Correlation within currencies and equities includes cross-product correlation.
‰ Natural gas spread represents the spread per millionBritish thermal units of natural gas.
‰ Oil spread represents the spread per barrel of oil andrefined products.
Range of Significant Unobservable Inputs
The following is information about the ranges of significantunobservable inputs used to value the firm’s level 3derivative instruments:
‰ Correlation. Ranges for correlation cover a variety ofunderliers both within one market (e.g., equity index andequity single stock names) and across markets (e.g.,correlation of an interest rate and a foreign exchangerate), as well as across regions. Generally, cross-productcorrelation inputs are used to value more complexinstruments and are lower than correlation inputs onassets within the same derivative product type.
‰ Volatility. Ranges for volatility cover numerousunderliers across a variety of markets, maturities andstrike prices. For example, volatility of equity indices isgenerally lower than volatility of single stocks.
27 Goldman Sachs June 2017 Form 10-Q

THE GOLDMAN SACHS GROUP, INC. AND SUBSIDIARIES
Notes to Condensed Consolidated Financial Statements(Unaudited)
‰ Credit spreads, upfront credit points and recovery
rates. The ranges for credit spreads, upfront credit pointsand recovery rates cover a variety of underliers (index andsingle names), regions, sectors, maturities and creditqualities (high-yield and investment-grade). The broadrange of this population gives rise to the width of theranges of significant unobservable inputs.
‰ Commodity prices and spreads. The ranges forcommodity prices and spreads cover variability inproducts, maturities and delivery locations.
Sensitivity of Fair Value Measurement to Changes
in Significant Unobservable Inputs
The following is a description of the directional sensitivityof the firm’s level 3 fair value measurements to changes insignificant unobservable inputs, in isolation:
‰ Correlation. In general, for contracts where the holderbenefits from the convergence of the underlying asset orindex prices (e.g., interest rates, credit spreads, foreignexchange rates, inflation rates and equity prices), anincrease in correlation results in a higher fair valuemeasurement.
‰ Volatility. In general, for purchased options, an increasein volatility results in a higher fair value measurement.
‰ Credit spreads, upfront credit points and recovery
rates. In general, the fair value of purchased creditprotection increases as credit spreads or upfront creditpoints increase or recovery rates decrease. Credit spreads,upfront credit points and recovery rates are stronglyrelated to distinctive risk factors of the underlyingreference obligations, which include reference entity-specific factors such as leverage, volatility and industry,market-based risk factors, such as borrowing costs orliquidity of the underlying reference obligation, andmacroeconomic conditions.
‰ Commodity prices and spreads. In general, forcontracts where the holder is receiving a commodity, anincrease in the spread (price difference from a benchmarkindex due to differences in quality or delivery location) orprice results in a higher fair value measurement.
Due to the distinctive nature of each of the firm’s level 3derivatives, the interrelationship of inputs is not necessarilyuniform within each product type.
Level 3 Rollforward
The table below presents a summary of the changes in fairvalue for all level 3 derivatives.
Three MonthsEnded June
Six MonthsEnded June
$ in millions 2017 2016 2017 2016
Total level 3 derivatives
Beginning balance $ 97 $ 55 $(1,217) $ 495Net realized gains/(losses) (125) (60) (163) (136)Net unrealized gains/(losses) 103 440 (43) 947Purchases 75 110 234 171Sales (200) (150) (313) (249)Settlements 506 1,587 1,681 918Transfers into level 3 (39) 426 25 359Transfers out of level 3 543 22 756 (75)Ending balance $ 960 $2,430 $ 960 $2,430
In the table above:
‰ Changes in fair value are presented for all derivativeassets and liabilities that are classified in level 3 as of theend of the period.
‰ Net unrealized gains/(losses) relate to instruments thatwere still held at period-end.
‰ If a derivative was transferred into level 3 during areporting period, its entire gain or loss for the period isclassified in level 3. Transfers between levels are reportedat the beginning of the reporting period in which theyoccur.
‰ Positive amounts for transfers into level 3 and negativeamounts for transfers out of level 3 represent net transfersof derivative assets. Negative amounts for transfers intolevel 3 and positive amounts for transfers out of level 3represent net transfers of derivative liabilities.
‰ A derivative with level 1 and/or level 2 inputs is classifiedin level 3 in its entirety if it has at least one significantlevel 3 input.
‰ If there is one significant level 3 input, the entire gain orloss from adjusting only observable inputs (i.e., level 1and level 2 inputs) is classified in level 3.
‰ Gains or losses that have been classified in level 3resulting from changes in level 1 or level 2 inputs arefrequently offset by gains or losses attributable to level 1or level 2 derivatives and/or level 1, level 2 and level 3cash instruments. As a result, gains/(losses) included inthe level 3 rollforward below do not necessarily representthe overall impact on the firm’s results of operations,liquidity or capital resources.
Goldman Sachs June 2017 Form 10-Q 28

THE GOLDMAN SACHS GROUP, INC. AND SUBSIDIARIES
Notes to Condensed Consolidated Financial Statements(Unaudited)
The table below disaggregates, by major product type, theinformation for level 3 derivatives included in the summarytable above.
Three MonthsEnded June
Six MonthsEnded June
$ in millions 2017 2016 2017 2016
Interest rates, net
Beginning balance $ (282) $ (383) $ (381) $ (398)Net realized gains/(losses) (6) (6) (24) (16)Net unrealized gains/(losses) (45) 98 56 182Purchases 1 — 3 2Sales — — (3) (8)Settlements (5) (20) 40 36Transfers into level 3 7 375 (10) 288Transfers out of level 3 11 (8) — (30)Ending balance $ (319) $ 56 $ (319) $ 56Credit, net
Beginning balance $ 2,239 $ 2,821 $ 2,504 $ 2,793Net realized gains/(losses) 10 (40) 60 (59)Net unrealized gains/(losses) 1 5 (192) 349Purchases 9 14 64 41Sales (17) (2) (66) (39)Settlements (177) 49 (334) (150)Transfers into level 3 48 78 49 98Transfers out of level 3 (114) 17 (86) (91)Ending balance $ 1,999 $ 2,942 $ 1,999 $ 2,942Currencies, net
Beginning balance $ 24 $ 9 $ 3 $ (34)Net realized gains/(losses) (7) (7) (33) (33)Net unrealized gains/(losses) (13) 20 (20) 9Purchases 1 2 4 11Sales — — — (3)Settlements 18 (14) 66 56Transfers into level 3 2 6 — 2Transfers out of level 3 — 1 5 9Ending balance $ 25 $ 17 $ 25 $ 17Commodities, net
Beginning balance $ 78 $ (291) $ 73 $ (262)Net realized gains/(losses) 1 14 10 18Net unrealized gains/(losses) 63 141 131 160Purchases 6 23 23 34Sales (39) (99) (51) (123)Settlements 21 21 (37) 8Transfers into level 3 (32) (8) (38) (10)Transfers out of level 3 20 (23) 7 (47)Ending balance $ 118 $ (222) $ 118 $ (222)Equities, net
Beginning balance $(1,962) $(2,101) $(3,416) $(1,604)Net realized gains/(losses) (123) (21) (176) (46)Net unrealized gains/(losses) 97 176 (18) 247Purchases 58 71 140 83Sales (144) (49) (193) (76)Settlements 649 1,551 1,946 968Transfers into level 3 (64) (25) 24 (19)Transfers out of level 3 626 35 830 84Ending balance $ (863) $ (363) $ (863) $ (363)
Level 3 Rollforward Commentary
Three Months Ended June 2017. The net realized andunrealized losses on level 3 derivatives of $22 million(reflecting $125 million of net realized losses and$103 million of net unrealized gains) for the three monthsended June 2017 included gains/(losses) of $59 million and$(81) million reported in “Market making” and “Otherprincipal transactions,” respectively.
The net unrealized gains on level 3 derivatives for the threemonths ended June 2017 were primarily attributable togains on certain equity derivatives, reflecting the impact ofchanges in the prices of underlying indices.
Transfers into level 3 derivatives during the three monthsended June 2017 were not material.
Transfers out of level 3 derivatives during the three monthsended June 2017 primarily reflected transfers of certainequity derivative liabilities to level 2, principally due tocertain unobservable inputs no longer being significant tothe valuation of these derivatives.
Six Months Ended June 2017. The net realized andunrealized losses on level 3 derivatives of $206 million(reflecting $163 million of net realized losses and$43 million of net unrealized losses) for the six monthsended June 2017 included losses of $33 million and$173 million reported in “Market making” and “Otherprincipal transactions,” respectively.
The net unrealized losses on level 3 derivatives for the sixmonths ended June 2017 were primarily attributable tolosses on certain credit derivatives, reflecting the impact oftighter credit spreads, partially offset by gains on certaincommodity derivatives, reflecting the impact of a decreasein commodity prices.
Transfers into level 3 derivatives during the six monthsended June 2017 were not material.
Transfers out of level 3 derivatives during the six monthsended June 2017 primarily reflected transfers of certainequity derivative liabilities to level 2, principally due tocertain unobservable inputs no longer being significant tothe valuation of these derivatives.
29 Goldman Sachs June 2017 Form 10-Q

THE GOLDMAN SACHS GROUP, INC. AND SUBSIDIARIES
Notes to Condensed Consolidated Financial Statements(Unaudited)
Three Months Ended June 2016. The net realized andunrealized gains on level 3 derivatives of $380 million(reflecting $60 million of net realized losses and$440 million of net unrealized gains) for the three monthsended June 2016 included gains/(losses) of $450 millionand $(70) million reported in “Market making” and“Other principal transactions,” respectively.
The net unrealized gains on level 3 derivatives for the threemonths ended June 2016 were primarily attributable togains on certain equity derivatives reflecting the impact ofchanges in equity prices, and gains on certain commodityderivatives, reflecting the impact of an increase incommodity prices.
Transfers into level 3 derivatives during the three monthsended June 2016 primarily reflected transfers of certaininterest rate derivative assets from level 2, principally due toreduced transparency of certain unobservable inputs usedto value these derivatives.
Transfers out of level 3 derivatives during the three monthsended June 2016 were not material.
Six Months Ended June 2016. The net realized andunrealized gains on level 3 derivatives of $811 million(reflecting $136 million of net realized losses and$947 million of net unrealized gains) for the six monthsended June 2016 included gains/(losses) of $893 millionand $(82) million reported in “Market making” and“Other principal transactions,” respectively.
The net unrealized gains on level 3 derivatives for the sixmonths ended June 2016 were primarily attributable togains on certain credit derivatives, principally reflecting theimpact of a decrease in interest rates, and gains on certainequity derivatives reflecting the impact of changes in equityprices.
Transfers into level 3 derivatives during the six monthsended June 2016 primarily reflected transfers of certaininterest rate derivative assets from level 2, principally due toreduced transparency of certain unobservable inputs usedto value these derivatives.
Transfers out of level 3 derivatives during the six monthsended June 2016 were not material.
OTC Derivatives
The table below presents the fair values of OTC derivativeassets and liabilities by tenor and major product type.
$ in millionsLess than
1 Year1 - 5
YearsGreater than
5 Years Total
As of June 2017
Assets
Interest rates $ 4,710 $19,949 $76,881 $101,540
Credit 1,019 3,795 3,746 8,560
Currencies 13,965 6,635 8,812 29,412
Commodities 2,644 1,492 169 4,305
Equities 3,237 6,009 1,389 10,635
Counterparty netting in tenors (2,611) (5,268) (3,754) (11,633)
Subtotal $22,964 $32,612 $87,243 $142,819
Cross-tenor counterparty netting (18,040)
Cash collateral netting (78,318)
Total $ 46,461
Liabilities
Interest rates $ 5,742 $10,153 $32,110 $ 48,005
Credit 1,848 3,378 1,281 6,507
Currencies 15,041 7,782 4,612 27,435
Commodities 2,519 1,502 2,452 6,473
Equities 6,743 5,709 3,127 15,579
Counterparty netting in tenors (2,611) (5,268) (3,754) (11,633)
Subtotal $29,282 $23,256 $39,828 $ 92,366
Cross-tenor counterparty netting (18,040)
Cash collateral netting (36,177)
Total $ 38,149
As of December 2016Assets
Interest rates $ 5,845 $18,376 $79,507 $103,728Credit 1,763 2,695 4,889 9,347Currencies 18,344 8,292 8,428 35,064Commodities 3,273 1,415 179 4,867Equities 3,141 9,249 1,341 13,731Counterparty netting in tenors (3,543) (5,550) (3,794) (12,887)Subtotal $28,823 $34,477 $90,550 $153,850Cross-tenor counterparty netting (17,396)Cash collateral netting (85,329)Total $ 51,125
Liabilities
Interest rates $ 5,679 $10,814 $38,812 $ 55,305Credit 2,060 3,328 1,167 6,555Currencies 14,720 9,771 5,879 30,370Commodities 2,546 1,555 2,315 6,416Equities 7,000 10,426 2,614 20,040Counterparty netting in tenors (3,543) (5,550) (3,794) (12,887)Subtotal $28,462 $30,344 $46,993 $105,799Cross-tenor counterparty netting (17,396)Cash collateral netting (42,986)Total $ 45,417
Goldman Sachs June 2017 Form 10-Q 30

THE GOLDMAN SACHS GROUP, INC. AND SUBSIDIARIES
Notes to Condensed Consolidated Financial Statements(Unaudited)
In the table above:
‰ Tenor is based on expected duration for mortgage-relatedcredit derivatives and generally on remaining contractualmaturity for other derivatives.
‰ Counterparty netting within the same product type andtenor category is included within such product type andtenor category.
‰ Counterparty netting across product types within thesame tenor category is included in counterparty netting intenors. Where the counterparty netting is across tenorcategories, the netting is included in cross-tenorcounterparty netting.
Credit Derivatives
The firm enters into a broad array of credit derivatives inlocations around the world to facilitate client transactionsand to manage the credit risk associated with market-making and investing and lending activities. Creditderivatives are actively managed based on the firm’s net riskposition.
Credit derivatives are generally individually negotiatedcontracts and can have various settlement and paymentconventions. Credit events include failure to pay,bankruptcy, acceleration of indebtedness, restructuring,repudiation and dissolution of the reference entity.
The firm enters into the following types of creditderivatives:
‰ Credit Default Swaps. Single-name credit default swapsprotect the buyer against the loss of principal on one ormore bonds, loans or mortgages (reference obligations) inthe event the issuer (reference entity) of the referenceobligations suffers a credit event. The buyer of protectionpays an initial or periodic premium to the seller andreceives protection for the period of the contract. If thereis no credit event, as defined in the contract, the seller ofprotection makes no payments to the buyer of protection.However, if a credit event occurs, the seller of protectionis required to make a payment to the buyer of protection,which is calculated in accordance with the terms of thecontract.
‰ Credit Options. In a credit option, the option writerassumes the obligation to purchase or sell a referenceobligation at a specified price or credit spread. The optionpurchaser buys the right, but does not assume theobligation, to sell the reference obligation to, or purchaseit from, the option writer. The payments on credit optionsdepend either on a particular credit spread or the price ofthe reference obligation.
‰ Credit Indices, Baskets and Tranches. Creditderivatives may reference a basket of single-name creditdefault swaps or a broad-based index. If a credit eventoccurs in one of the underlying reference obligations, theprotection seller pays the protection buyer. The paymentis typically a pro-rata portion of the transaction’s totalnotional amount based on the underlying defaultedreference obligation. In certain transactions, the creditrisk of a basket or index is separated into various portions(tranches), each having different levels of subordination.The most junior tranches cover initial defaults and oncelosses exceed the notional amount of these juniortranches, any excess loss is covered by the next mostsenior tranche in the capital structure.
‰ Total Return Swaps. A total return swap transfers therisks relating to economic performance of a referenceobligation from the protection buyer to the protectionseller. Typically, the protection buyer receives from theprotection seller a floating rate of interest and protectionagainst any reduction in fair value of the referenceobligation, and in return the protection seller receives thecash flows associated with the reference obligation, plusany increase in the fair value of the reference obligation.
The firm economically hedges its exposure to written creditderivatives primarily by entering into offsetting purchasedcredit derivatives with identical underliers. Substantially allof the firm’s purchased credit derivative transactions arewith financial institutions and are subject to stringentcollateral thresholds. In addition, upon the occurrence of aspecified trigger event, the firm may take possession of thereference obligations underlying a particular written creditderivative, and consequently may, upon liquidation of thereference obligations, recover amounts on the underlyingreference obligations in the event of default.
As of June 2017, written and purchased credit derivativeshad total gross notional amounts of $645.82 billion and$679.07 billion, respectively, for total net notionalpurchased protection of $33.25 billion. As ofDecember 2016, written and purchased credit derivativeshad total gross notional amounts of $690.47 billion and$733.98 billion, respectively, for total net notionalpurchased protection of $43.51 billion. Substantially all ofthe firm’s written and purchased credit derivatives arecredit default swaps.
31 Goldman Sachs June 2017 Form 10-Q

THE GOLDMAN SACHS GROUP, INC. AND SUBSIDIARIES
Notes to Condensed Consolidated Financial Statements(Unaudited)
The table below presents certain information about creditderivatives.
Credit Spread on Underlier (basis points)
$ in millions 0 - 250251 -
500501 -
1,000
Greaterthan
1,000 Total
As of June 2017
Maximum Payout/Notional Amount of Written Credit Derivatives by Tenor
Less than 1 year $210,926 $ 6,034 $ 1,235 $ 5,366 $223,561
1 - 5 years 342,468 11,032 9,412 6,600 369,512
Greater than 5 years 49,030 2,944 577 200 52,751
Total $602,424 $20,010 $11,224 $12,166 $645,824
Maximum Payout/Notional Amount of Purchased Credit DerivativesOffsetting $509,195 $13,080 $10,483 $10,780 $543,538
Other 126,404 6,883 1,219 1,032 135,538
Fair Value of Written Credit DerivativesAsset $ 14,269 $ 487 $ 170 $ 25 $ 14,951
Liability 1,532 534 923 4,301 7,290
Net asset/(liability) $ 12,737 $ (47) $ (753) $ (4,276) $ 7,661
As of December 2016Maximum Payout/Notional Amount of Written Credit Derivatives by Tenor
Less than 1 year $207,727 $ 5,819 $ 1,016 $ 8,629 $223,1911 - 5 years 375,208 17,255 8,643 7,986 409,092Greater than 5 years 52,977 3,928 1,045 233 58,183Total $635,912 $27,002 $10,704 $16,848 $690,466
Maximum Payout/Notional Amount of Purchased Credit DerivativesOffsetting $558,305 $20,588 $10,133 $15,186 $604,212Other 119,509 7,712 1,098 1,446 129,765Fair Value of Written Credit DerivativesAsset $ 13,919 $ 606 $ 187 $ 45 $ 14,757Liability 2,436 902 809 5,686 9,833Net asset/(liability) $ 11,483 $ (296) $ (622) $ (5,641) $ 4,924
In the table above:
‰ Fair values exclude the effects of both netting ofreceivable balances with payable balances underenforceable netting agreements, and netting of cashreceived or posted under enforceable credit supportagreements, and therefore are not representative of thefirm’s credit exposure.
‰ Tenor is based on expected duration for mortgage-relatedcredit derivatives and on remaining contractual maturityfor other credit derivatives.
‰ The credit spread on the underlier, together with the tenorof the contract, are indicators of payment/performancerisk. The firm is less likely to pay or otherwise be requiredto perform where the credit spread and the tenor arelower.
‰ Offsetting purchased credit derivatives represent thenotional amount of purchased credit derivatives thateconomically hedge written credit derivatives withidentical underliers and are included in offsetting.
‰ Other purchased credit derivatives represent the notionalamount of all other purchased credit derivatives notincluded in offsetting.
Impact of Credit Spreads on Derivatives
On an ongoing basis, the firm realizes gains or lossesrelating to changes in credit risk through the unwind ofderivative contracts and changes in credit mitigants.
The net gain/(loss), including hedges, attributable to theimpact of changes in credit exposure and credit spreads(counterparty and the firm’s) on derivatives was $8 millionand $(21) million for the three months ended June 2017and June 2016, respectively, and $19 million and$111 million for the six months ended June 2017 andJune 2016, respectively.
Bifurcated Embedded Derivatives
The table below presents the fair value and the notionalamount of derivatives that have been bifurcated from theirrelated borrowings.
As of
$ in millionsJune2017
December2016
Fair value of assets $ 819 $ 676Fair value of liabilities 1,049 864Net liability $ 230 $ 188
Notional amount $8,559 $8,726
In the table above, these derivatives, which are recorded atfair value, primarily consist of interest rate, equity andcommodity products and are included in “Unsecured short-term borrowings” and “Unsecured long-term borrowings”with the related borrowings. See Note 8 for furtherinformation.
Derivatives with Credit-Related Contingent Features
Certain of the firm’s derivatives have been transacted underbilateral agreements with counterparties who may requirethe firm to post collateral or terminate the transactionsbased on changes in the firm’s credit ratings. The firmassesses the impact of these bilateral agreements bydetermining the collateral or termination payments thatwould occur assuming a downgrade by all rating agencies.A downgrade by any one rating agency, depending on theagency’s relative ratings of the firm at the time of thedowngrade, may have an impact which is comparable tothe impact of a downgrade by all rating agencies.
Goldman Sachs June 2017 Form 10-Q 32

THE GOLDMAN SACHS GROUP, INC. AND SUBSIDIARIES
Notes to Condensed Consolidated Financial Statements(Unaudited)
The table below presents the aggregate fair value of netderivative liabilities under such agreements (excludingapplication of collateral posted to reduce these liabilities),the related aggregate fair value of the assets posted ascollateral and the additional collateral or terminationpayments that could have been called by counterparties inthe event of a one-notch and two-notch downgrade in thefirm’s credit ratings.
As of
$ in millionsJune2017
December2016
Net derivative liabilities under bilateral agreements $28,887 $32,927Collateral posted $25,800 $27,840Additional collateral or termination payments:
One-notch downgrade $ 374 $ 677Two-notch downgrade $ 1,385 $ 2,216
Hedge Accounting
The firm applies hedge accounting for (i) certain interestrate swaps used to manage the interest rate exposure ofcertain fixed-rate unsecured long-term and short-termborrowings and certain fixed-rate certificates of deposit and(ii) certain foreign currency forward contracts and foreigncurrency-denominated debt used to manage foreigncurrency exposures on the firm’s net investment in certainnon-U.S. operations.
To qualify for hedge accounting, the hedging instrumentmust be highly effective at reducing the risk from theexposure being hedged. Additionally, the firm mustformally document the hedging relationship at inceptionand test the hedging relationship at least on a quarterlybasis to ensure the hedging instrument continues to behighly effective over the life of the hedging relationship.
Fair Value Hedges
The firm designates certain interest rate swaps as fair valuehedges. These interest rate swaps hedge changes in fairvalue attributable to the designated benchmark interest rate(e.g., London Interbank Offered Rate (LIBOR) orOvernight Index Swap Rate), effectively converting asubstantial portion of fixed-rate obligations into floating-rate obligations.
The firm applies a statistical method that utilizes regressionanalysis when assessing the effectiveness of its fair valuehedging relationships in achieving offsetting changes in thefair values of the hedging instrument and the risk beinghedged (i.e., interest rate risk). An interest rate swap isconsidered highly effective in offsetting changes in fair valueattributable to changes in the hedged risk when theregression analysis results in a coefficient of determinationof 80% or greater and a slope between 80% and 125%.
For qualifying fair value hedges, gains or losses onderivatives are included in “Interest expense.” The changein fair value of the hedged item attributable to the risk beinghedged is reported as an adjustment to its carrying valueand is subsequently amortized into interest expense over itsremaining life. Gains or losses resulting from hedgeineffectiveness are included in “Interest expense.” When aderivative is no longer designated as a hedge, any remainingdifference between the carrying value and par value of thehedged item is amortized to interest expense over theremaining life of the hedged item using the effective interestmethod. See Note 23 for further information about interestincome and interest expense.
The table below presents the gains/(losses) from interestrate derivatives accounted for as hedges, the related hedgedborrowings and deposits, and the hedge ineffectiveness onthese derivatives, which primarily consists of amortizationof prepaid credit spreads resulting from the passage of time.
Three MonthsEnded June
Six MonthsEnded June
$ in millions 2017 2016 2017 2016
Interest rate hedges $(671) $ 859 $(1,425) $ 2,849Hedged borrowings and deposits 499 (964) 1,053 (2,992)Hedge ineffectiveness $(172) $(105) $ (372) $ (143)
Net Investment Hedges
The firm seeks to reduce the impact of fluctuations inforeign exchange rates on its net investments in certainnon-U.S. operations through the use of foreign currencyforward contracts and foreign currency-denominated debt.For foreign currency forward contracts designated ashedges, the effectiveness of the hedge is assessed based onthe overall changes in the fair value of the forward contracts(i.e., based on changes in forward rates). For foreigncurrency-denominated debt designated as a hedge, theeffectiveness of the hedge is assessed based on changes inspot rates.
For qualifying net investment hedges, the gains or losses onthe hedging instruments, to the extent effective, areincluded in “Currency translation” in the condensedconsolidated statements of comprehensive income.
33 Goldman Sachs June 2017 Form 10-Q

THE GOLDMAN SACHS GROUP, INC. AND SUBSIDIARIES
Notes to Condensed Consolidated Financial Statements(Unaudited)
The table below presents the gains/(losses) from netinvestment hedging.
Three MonthsEnded June
Six MonthsEnded June
$ in millions 2017 2016 2017 2016
Hedges:Foreign currency forward contract $(229) $ 48 $(578) $(308)Foreign currency-denominated debt $ 14 $(211) $ (68) $(361)
The gain/(loss) related to ineffectiveness was not materialfor the three and six months ended June 2017 or June 2016.The net gain reclassified to earnings from accumulatedother comprehensive income for the three months endedJune 2017 was $60 million (reflecting a gain of$247 million related to the hedges and a loss of$187 million on the related net investments in non-U.S.operations) and for the six months ended June 2017 was$60 million (reflecting a gain of $236 million related to thehedges and a loss of $176 million on the related netinvestments in non-U.S. operations). The gain/(loss)reclassified to earnings from accumulated othercomprehensive income was not material for the three andsix months ended June 2016.
As of June 2017 and December 2016, the firm haddesignated $2.04 billion and $1.69 billion, respectively, offoreign currency-denominated debt, included in“Unsecured long-term borrowings” and “Unsecured short-term borrowings,” as hedges of net investments in non-U.S.subsidiaries.
Note 8.
Fair Value Option
Other Financial Assets and Financial Liabilities at
Fair Value
In addition to all cash and derivative instruments includedin “Financial instruments owned” and “Financialinstruments sold, but not yet purchased,” the firm accountsfor certain of its other financial assets and financialliabilities at fair value primarily under the fair value option.The primary reasons for electing the fair value option areto:
‰ Reflect economic events in earnings on a timely basis;
‰ Mitigate volatility in earnings from using differentmeasurement attributes (e.g., transfers of financialinstruments owned accounted for as financings arerecorded at fair value whereas the related securedfinancing would be recorded on an accrual basis absentelecting the fair value option); and
‰ Address simplification and cost-benefit considerations(e.g., accounting for hybrid financial instruments at fairvalue in their entirety versus bifurcation of embeddedderivatives and hedge accounting for debt hosts).
Hybrid financial instruments are instruments that containbifurcatable embedded derivatives and do not requiresettlement by physical delivery of nonfinancial assets (e.g.,physical commodities). If the firm elects to bifurcate theembedded derivative from the associated debt, thederivative is accounted for at fair value and the hostcontract is accounted for at amortized cost, adjusted for theeffective portion of any fair value hedges. If the firm doesnot elect to bifurcate, the entire hybrid financial instrumentis accounted for at fair value under the fair value option.
Other financial assets and financial liabilities accounted forat fair value under the fair value option include:
‰ Repurchase agreements and substantially all resaleagreements;
‰ Securities borrowed and loaned within Fixed Income,Currency and Commodities Client Execution (FICCClient Execution);
‰ Substantially all other secured financings, includingtransfers of assets accounted for as financings rather thansales;
‰ Certain unsecured short-term and long-term borrowings,substantially all of which are hybrid financialinstruments;
‰ Certain receivables from customers and counterparties,including transfers of assets accounted for as securedloans rather than purchases and certain margin loans;
‰ Certain time deposits issued by the firm’s banksubsidiaries (deposits with no stated maturity are noteligible for a fair value option election), includingstructured certificates of deposit, which are hybridfinancial instruments; and
‰ Certain subordinated liabilities of consolidated VIEs.
Goldman Sachs June 2017 Form 10-Q 34
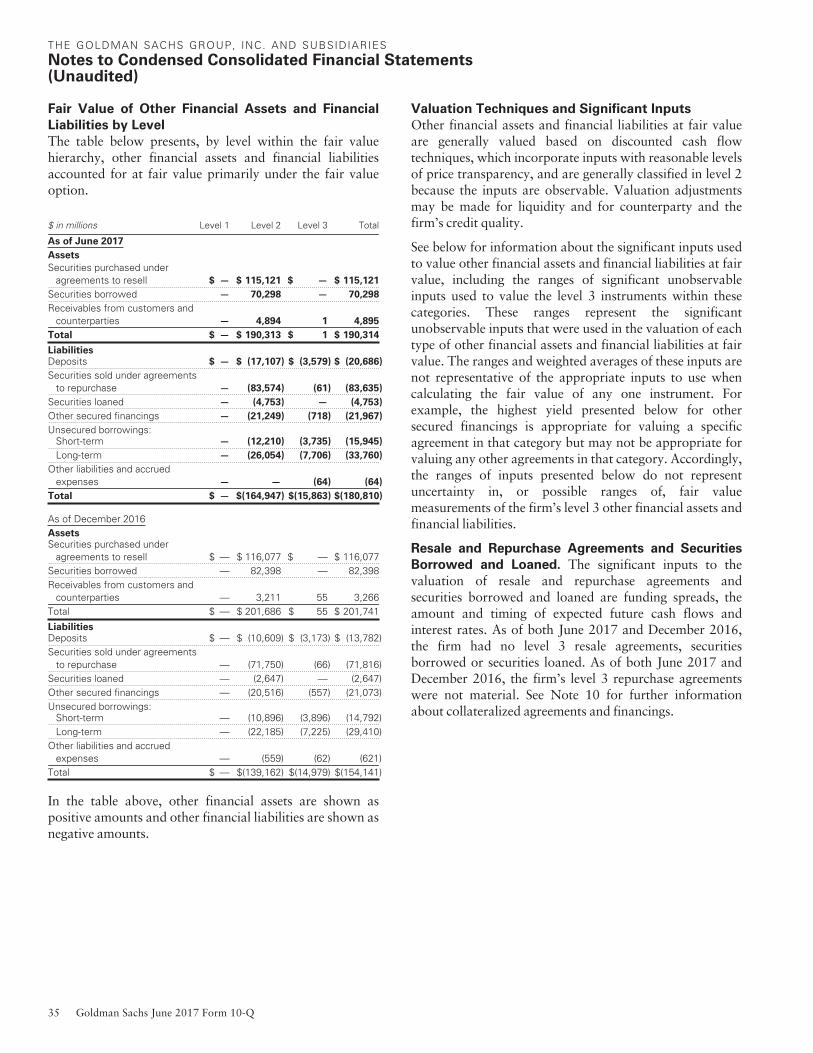
THE GOLDMAN SACHS GROUP, INC. AND SUBSIDIARIES
Notes to Condensed Consolidated Financial Statements(Unaudited)
Fair Value of Other Financial Assets and Financial
Liabilities by Level
The table below presents, by level within the fair valuehierarchy, other financial assets and financial liabilitiesaccounted for at fair value primarily under the fair valueoption.
$ in millions Level 1 Level 2 Level 3 Total
As of June 2017
Assets
Securities purchased underagreements to resell $ — $ 115,121 $ — $ 115,121
Securities borrowed — 70,298 — 70,298
Receivables from customers andcounterparties — 4,894 1 4,895
Total $ — $ 190,313 $ 1 $ 190,314
LiabilitiesDeposits $ — $ (17,107) $ (3,579) $ (20,686)
Securities sold under agreementsto repurchase — (83,574) (61) (83,635)
Securities loaned — (4,753) — (4,753)
Other secured financings — (21,249) (718) (21,967)
Unsecured borrowings:Short-term — (12,210) (3,735) (15,945)
Long-term — (26,054) (7,706) (33,760)
Other liabilities and accruedexpenses — — (64) (64)
Total $ — $(164,947) $(15,863) $(180,810)
As of December 2016AssetsSecurities purchased under
agreements to resell $ — $ 116,077 $ — $ 116,077Securities borrowed — 82,398 — 82,398Receivables from customers and
counterparties — 3,211 55 3,266Total $ — $ 201,686 $ 55 $ 201,741
LiabilitiesDeposits $ — $ (10,609) $ (3,173) $ (13,782)Securities sold under agreements
to repurchase — (71,750) (66) (71,816)Securities loaned — (2,647) — (2,647)Other secured financings — (20,516) (557) (21,073)Unsecured borrowings:
Short-term — (10,896) (3,896) (14,792)Long-term — (22,185) (7,225) (29,410)
Other liabilities and accruedexpenses — (559) (62) (621)
Total $ — $(139,162) $(14,979) $(154,141)
In the table above, other financial assets are shown aspositive amounts and other financial liabilities are shown asnegative amounts.
Valuation Techniques and Significant Inputs
Other financial assets and financial liabilities at fair valueare generally valued based on discounted cash flowtechniques, which incorporate inputs with reasonable levelsof price transparency, and are generally classified in level 2because the inputs are observable. Valuation adjustmentsmay be made for liquidity and for counterparty and thefirm’s credit quality.
See below for information about the significant inputs usedto value other financial assets and financial liabilities at fairvalue, including the ranges of significant unobservableinputs used to value the level 3 instruments within thesecategories. These ranges represent the significantunobservable inputs that were used in the valuation of eachtype of other financial assets and financial liabilities at fairvalue. The ranges and weighted averages of these inputs arenot representative of the appropriate inputs to use whencalculating the fair value of any one instrument. Forexample, the highest yield presented below for othersecured financings is appropriate for valuing a specificagreement in that category but may not be appropriate forvaluing any other agreements in that category. Accordingly,the ranges of inputs presented below do not representuncertainty in, or possible ranges of, fair valuemeasurements of the firm’s level 3 other financial assets andfinancial liabilities.
Resale and Repurchase Agreements and Securities
Borrowed and Loaned. The significant inputs to thevaluation of resale and repurchase agreements andsecurities borrowed and loaned are funding spreads, theamount and timing of expected future cash flows andinterest rates. As of both June 2017 and December 2016,the firm had no level 3 resale agreements, securitiesborrowed or securities loaned. As of both June 2017 andDecember 2016, the firm’s level 3 repurchase agreementswere not material. See Note 10 for further informationabout collateralized agreements and financings.
35 Goldman Sachs June 2017 Form 10-Q

THE GOLDMAN SACHS GROUP, INC. AND SUBSIDIARIES
Notes to Condensed Consolidated Financial Statements(Unaudited)
Other Secured Financings. The significant inputs to thevaluation of other secured financings at fair value are theamount and timing of expected future cash flows, interestrates, funding spreads, the fair value of the collateraldelivered by the firm (which is determined using theamount and timing of expected future cash flows, marketprices, market yields and recovery assumptions) and thefrequency of additional collateral calls. The ranges ofsignificant unobservable inputs used to value level 3 othersecured financings are as follows:
As of June 2017:
‰ Yield: 0.6% to 10.0% (weighted average: 2.3%)
‰ Duration: 0.6 to 17.8 years (weighted average: 8.6 years)
As of December 2016:
‰ Yield: 0.4% to 16.6% (weighted average: 3.5%)
‰ Duration: 0.1 to 5.7 years (weighted average: 2.3 years)
Generally, increases in funding spreads, yield or duration,in isolation, would result in a lower fair valuemeasurement. Due to the distinctive nature of each of thefirm’s level 3 other secured financings, the interrelationshipof inputs is not necessarily uniform across such financings.See Note 10 for further information about collateralizedagreements and financings.
Unsecured Short-term and Long-term Borrowings.
The significant inputs to the valuation of unsecured short-term and long-term borrowings at fair value are the amountand timing of expected future cash flows, interest rates, thecredit spreads of the firm, as well as commodity prices inthe case of prepaid commodity transactions. The inputsused to value the embedded derivative component of hybridfinancial instruments are consistent with the inputs used tovalue the firm’s other derivative instruments. See Note 7 forfurther information about derivatives. See Notes 15 and 16for further information about unsecured short-term andlong-term borrowings, respectively.
Certain of the firm’s unsecured short-term and long-termborrowings are classified in level 3, substantially all ofwhich are hybrid financial instruments. As the significantunobservable inputs used to value hybrid financialinstruments primarily relate to the embedded derivativecomponent of these borrowings, these inputs areincorporated in the firm’s derivative disclosures related tounobservable inputs in Note 7.
Receivables from Customers and Counterparties.
Receivables from customers and counterparties at fair valueare primarily comprised of transfers of assets accounted foras secured loans rather than purchases. The significantinputs to the valuation of such receivables are commodityprices, interest rates, the amount and timing of expectedfuture cash flows and funding spreads. As of bothJune 2017 and December 2016, the firm’s level 3receivables from customers and counterparties were notmaterial.
Deposits. The significant inputs to the valuation of timedeposits are interest rates and the amount and timing offuture cash flows. The inputs used to value the embeddedderivative component of hybrid financial instruments areconsistent with the inputs used to value the firm’s otherderivative instruments. See Note 7 for further informationabout derivatives and Note 14 for further informationabout deposits.
The firm’s deposits that are classified in level 3 are hybridfinancial instruments. As the significant unobservableinputs used to value hybrid financial instruments primarilyrelate to the embedded derivative component of thesedeposits, these inputs are incorporated in the firm’sderivative disclosures related to unobservable inputs inNote 7.
Transfers Between Levels of the Fair Value Hierarchy
Transfers between levels of the fair value hierarchy arereported at the beginning of the reporting period in whichthey occur. There were no transfers of other financial assetsand financial liabilities between level 1 and level 2 duringthe three and six months ended June 2017 and June 2016.See “Level 3 Rollforward” below for information abouttransfers between level 2 and level 3.
Goldman Sachs June 2017 Form 10-Q 36

THE GOLDMAN SACHS GROUP, INC. AND SUBSIDIARIES
Notes to Condensed Consolidated Financial Statements(Unaudited)
Level 3 Rollforward
The table below presents a summary of the changes in fairvalue for other level 3 financial assets and financialliabilities accounted for at fair value.
Three MonthsEnded June
Six MonthsEnded June
$ in millions 2017 2016 2017 2016
Total other financial assetsBeginning balance $ 14 $ 43 $ 55 $ 45Net realized gains/(losses) — 1 — 1Net unrealized gains/(losses) — — (3) —Purchases 1 5 1 5Settlements (14) (1) (52) (3)Ending balance $ 1 $ 48 $ 1 $ 48
Total other financial liabilitiesBeginning balance $(16,165) $(13,650) $(14,979) $(11,244)Net realized gains/(losses) (71) (59) (175) (52)Net unrealized gains/(losses) (272) 76 (609) (36)Purchases — (2) (3) (2)Issuances (2,452) (3,161) (5,226) (6,733)Settlements 2,171 1,626 4,422 3,132Transfers into level 3 (300) (406) (525) (1,029)Transfers out of level 3 1,226 487 1,232 875Ending balance $(15,863) $(15,089) $(15,863) $(15,089)
In the table above:
‰ Changes in fair value are presented for all other financialassets and liabilities that are classified in level 3 as of theend of the period.
‰ Net unrealized gains/(losses) relate to instruments thatwere still held at period-end.
‰ If a financial asset or financial liability was transferred tolevel 3 during a reporting period, its entire gain or loss forthe period is classified in level 3. For level 3 otherfinancial assets, increases are shown as positive amounts,while decreases are shown as negative amounts. Forlevel 3 other financial liabilities, increases are shown asnegative amounts, while decreases are shown as positiveamounts.
‰ Level 3 other financial assets and liabilities are frequentlyeconomically hedged with cash instruments andderivatives. Accordingly, gains or losses that are classifiedin level 3 can be partially offset by gains or lossesattributable to level 1, 2 or 3 cash instruments orderivatives. As a result, gains or losses included in thelevel 3 rollforward below do not necessarily represent theoverall impact on the firm’s results of operations,liquidity or capital resources.
The table below disaggregates, by the condensedconsolidated statements of financial condition line items,the information for other financial liabilities included in thesummary table above.
Three MonthsEnded June
Six MonthsEnded June
$ in millions 2017 2016 2017 2016
DepositsBeginning balance $(3,348) $(2,585) $(3,173) $(2,215)Net realized gains/(losses) (4) (12) (5) (14)Net unrealized gains/(losses) (76) (104) (103) (209)Issuances (172) (240) (345) (513)Settlements 12 5 38 15Transfers out of level 3 9 — 9 —Ending balance $(3,579) $(2,936) $(3,579) $(2,936)Securities sold under agreements to repurchaseBeginning balance $ (64) $ (73) $ (66) $ (71)Net unrealized gains/(losses) — (4) (1) (5)Settlements 3 1 6 —Ending balance $ (61) $ (76) $ (61) $ (76)Other secured financingsBeginning balance $ (568) $ (829) $ (557) $ (549)Net realized gains/(losses) 5 (3) 9 3Net unrealized gains/(losses) (6) — (20) (33)Purchases — (2) (3) —Issuances (12) (119) (19) (344)Settlements 18 220 100 228Transfers into level 3 (213) (19) (230) (67)Transfers out of level 3 58 64 2 74Ending balance $ (718) $ (688) $ (718) $ (688)Unsecured short-term borrowingsBeginning balance $(4,244) $(4,167) $(3,896) $(4,133)Net realized gains/(losses) (65) (46) (150) (38)Net unrealized gains/(losses) (6) 132 (146) 125Issuances (1,570) (1,162) (3,297) (2,319)Settlements 1,180 802 2,788 2,253Transfers into level 3 (59) (310) (85) (750)Transfers out of level 3 1,029 97 1,051 208Ending balance $(3,735) $(4,654) $(3,735) $(4,654)Unsecured long-term borrowingsBeginning balance $(7,878) $(5,923) $(7,225) $(4,224)Net realized gains/(losses) (12) (1) (38) (8)Net unrealized gains/(losses) (183) 72 (337) 106Purchases — — — (2)Issuances (693) (1,621) (1,556) (3,515)Settlements 958 598 1,490 636Transfers into level 3 (28) (77) (210) (212)Transfers out of level 3 130 326 170 593Ending balance $(7,706) $(6,626) $(7,706) $(6,626)Other liabilities and accrued expensesBeginning balance $ (63) $ (73) $ (62) $ (52)Net realized gains/(losses) 5 3 9 5Net unrealized gains/(losses) (1) (20) (2) (20)Issuances (5) (19) (9) (42)Ending balance $ (64) $ (109) $ (64) $ (109)
37 Goldman Sachs June 2017 Form 10-Q

THE GOLDMAN SACHS GROUP, INC. AND SUBSIDIARIES
Notes to Condensed Consolidated Financial Statements(Unaudited)
Level 3 Rollforward Commentary
Three Months Ended June 2017. The net realized andunrealized losses on level 3 other financial liabilities of$343 million (reflecting $71 million of net realized lossesand $272 million of net unrealized losses) for the threemonths ended June 2017 included losses of $271 million,$11 million and $1 million reported in “Market making,”“Other principal transactions” and “Interest expense,”respectively, in the condensed consolidated statements ofearnings and losses of $60 million reported in “Debtvaluation adjustment” in the condensed consolidatedstatements of comprehensive income.
The net unrealized losses on level 3 other financial liabilitiesfor the three months ended June 2017 primarily reflectedlosses on certain hybrid financial instruments included inunsecured long-term borrowings, principally due to anincrease in global equity prices, and changes in interest ratesand credit spreads.
Transfers into level 3 of other financial liabilities during thethree months ended June 2017 primarily reflected transfersof certain other secured financings from level 2, principallydue to reduced transparency of certain yield inputs used tovalue these instruments.
Transfers out of level 3 of other financial liabilities duringthe three months ended June 2017 primarily reflectedtransfers of certain hybrid financial instruments included inunsecured short-term borrowings to level 2, principally dueto increased transparency of certain inputs used to valuethese instruments as a result of market transactions insimilar instruments.
Six Months Ended June 2017. The net realized andunrealized losses on level 3 other financial liabilities of$784 million (reflecting $175 million of net realized lossesand $609 million of net unrealized losses) for the sixmonths ended June 2017 included losses of $644 million,$23 million and $4 million reported in “Market making,”“Other principal transactions” and “Interest expense,”respectively, in the condensed consolidated statements ofearnings and losses of $113 million reported in “Debtvaluation adjustment” in the condensed consolidatedstatements of comprehensive income.
The net unrealized losses on level 3 other financial liabilitiesfor the six months ended June 2017 primarily reflectedlosses on certain hybrid financial instruments included inunsecured long-term and short-term borrowings,principally due to an increase in global equity prices, andchanges in credit spreads.
Transfers into level 3 of other financial liabilities during thesix months ended June 2017 primarily reflected transfers ofcertain other secured financings from level 2, principallydue to reduced transparency of certain yield inputs used tovalue these instruments and transfers of certain hybridfinancial instruments included in unsecured long-termborrowings from level 2, principally due to certainunobservable inputs being significant to the valuation ofthese instruments.
Transfers out of level 3 of other financial liabilities duringthe six months ended June 2017 primarily reflectedtransfers of certain hybrid financial instruments included inunsecured short-term borrowings to level 2, principally dueto increased transparency of certain inputs used to valuethese instruments as a result of market transactions insimilar instruments.
Three Months Ended June 2016. The net realized andunrealized gains on level 3 other financial liabilities of$17 million (reflecting $59 million of net realized losses and$76 million of net unrealized gains) for the three monthsended June 2016 included gains/(losses) of approximately$24 million, $8 million and $(2) million reported in “Marketmaking,” “Other principal transactions” and “Interestexpense,” respectively, in the condensed consolidatedstatements of earnings and losses of $(13) million reported in“Debt valuation adjustment” in the condensed consolidatedstatements of comprehensive income.
The net unrealized gains on level 3 other financial liabilitiesfor the three months ended June 2016 primarily consistedof gains on certain hybrid financial instruments included inunsecured short-term borrowings, principally due to theimpact of changes in foreign exchange rates, and certainhybrid financial instruments included in unsecured long-term borrowings, principally due to a decrease in certainequity prices, partially offset by losses on certain hybridfinancial instruments included in deposits, principally dueto the impact of an increase in the market value of theunderlying assets.
Transfers into level 3 of other financial liabilities during thethree months ended June 2016 primarily reflected transfersfrom level 3 unsecured long-term borrowings to level 3unsecured short-term borrowings, as these borrowingsneared maturity.
Transfers out of level 3 of other financial liabilities duringthe three months ended June 2016 primarily reflectedtransfers to level 3 unsecured short-term borrowings fromlevel 3 unsecured long-term borrowings as theseborrowings neared maturity, and transfers of certain hybridfinancial instruments included in unsecured short-termborrowings to level 2, principally due to increasedtransparency of certain correlation and volatility inputsused to value these instruments.
Goldman Sachs June 2017 Form 10-Q 38

THE GOLDMAN SACHS GROUP, INC. AND SUBSIDIARIES
Notes to Condensed Consolidated Financial Statements(Unaudited)
Six Months Ended June 2016. The net realized andunrealized losses on level 3 other financial liabilities of$88 million (reflecting $52 million of net realized losses and$36 million of net unrealized losses) for the six monthsended June 2016 included gains/(losses) of approximately$(80) million, $5 million and $(5) million reported in“Market making,” “Other principal transactions” and“Interest expense,” respectively, in the condensedconsolidated statements of earnings and losses of$(8) million reported in “Debt valuation adjustment” in thecondensed consolidated statements of comprehensiveincome.
The net unrealized losses on level 3 other financial liabilitiesfor the six months ended June 2016 primarily consisted oflosses on certain hybrid financial instruments included indeposits, principally due to the impact of an increase in themarket value of the underlying assets, partially offset bygains on certain hybrid financial instruments included inunsecured short-term borrowings, principally due to theimpact of changes in foreign exchange rates, and gains oncertain hybrid financial instruments included in unsecuredlong-term borrowings, principally due to a decrease incertain equity prices.
Transfers into level 3 of other financial liabilities during thesix months ended June 2016 primarily reflected transfers ofcertain hybrid financial instruments included in unsecuredshort-term borrowings from level 2, principally due tocertain unobservable inputs becoming significant to thevaluation of these instruments, transfers of certain hybridfinancial instruments included in unsecured short-term andlong-term borrowings from level 2, principally due todecreased transparency of certain correlation and volatilityinputs used to value these instruments, and transfers fromlevel 3 unsecured long-term borrowings to level 3unsecured short-term borrowings, as these borrowingsneared maturity.
Transfers out of level 3 of other financial liabilities duringthe six months ended June 2016 primarily reflectedtransfers to level 3 unsecured short-term borrowings fromlevel 3 unsecured long-term borrowings, as theseborrowings neared maturity, and transfers of level 3unsecured long-term and short-term borrowings to level 2,principally due to increased transparency of certaincorrelation and volatility inputs used to value theseinstruments.
Gains and Losses on Financial Assets and Financial
Liabilities Accounted for at Fair Value Under the
Fair Value Option
The table below presents the gains and losses recognized inearnings as a result of the firm electing to apply the fair valueoption to certain financial assets and financial liabilities.
Three MonthsEnded June
Six MonthsEnded June
$ in millions 2017 2016 2017 2016
Unsecured short-term borrowings $ (356) $(139) $(1,217) $ 59Unsecured long-term borrowings (484) (167) (673) (589)Other liabilities and accrued expenses 1 (59) 188 (87)Other (175) (82) (279) (544)Total $(1,014) $(447) $(1,981) $(1,161)
In the table above:
‰ Gains/(losses) are included in “Market making” and“Other principal transactions.”
‰ Gains/(losses) exclude contractual interest, which isincluded in “Interest income” and “Interest expense,” forall instruments other than hybrid financial instruments.See Note 23 for further information about interestincome and interest expense.
‰ Unsecured short-term borrowings and unsecured long-termborrowings include gains/(losses) on the embeddedderivative component of hybrid financial instruments. Thesegains and losses would have been recognized under otherU.S. GAAP even if the firm had not elected to account for theentire hybrid financial instrument at fair value.
‰ Unsecured short-term borrowings includes gains/(losses)on the embedded derivative component of hybridfinancial instruments of $(343) million and$(137) million for the three months ended June 2017 andJune 2016, respectively, and $(1.20) billion and$68 million for the six months ended June 2017 andJune 2016, respectively.
‰ Unsecured long-term borrowings includes gains/(losses)on the embedded derivative component of hybridfinancial instruments of $(500) million and$(110) million for the three months ended June 2017 andJune 2016, respectively, and $(644) million and$(448) million for the six months ended June 2017 andJune 2016, respectively.
‰ Other liabilities and accrued expenses includes gains/(losses)on certain subordinated liabilities of consolidated VIEs.
‰ Other primarily consists of gains/(losses) on receivablesfrom customers and counterparties, deposits and othersecured financings.
39 Goldman Sachs June 2017 Form 10-Q
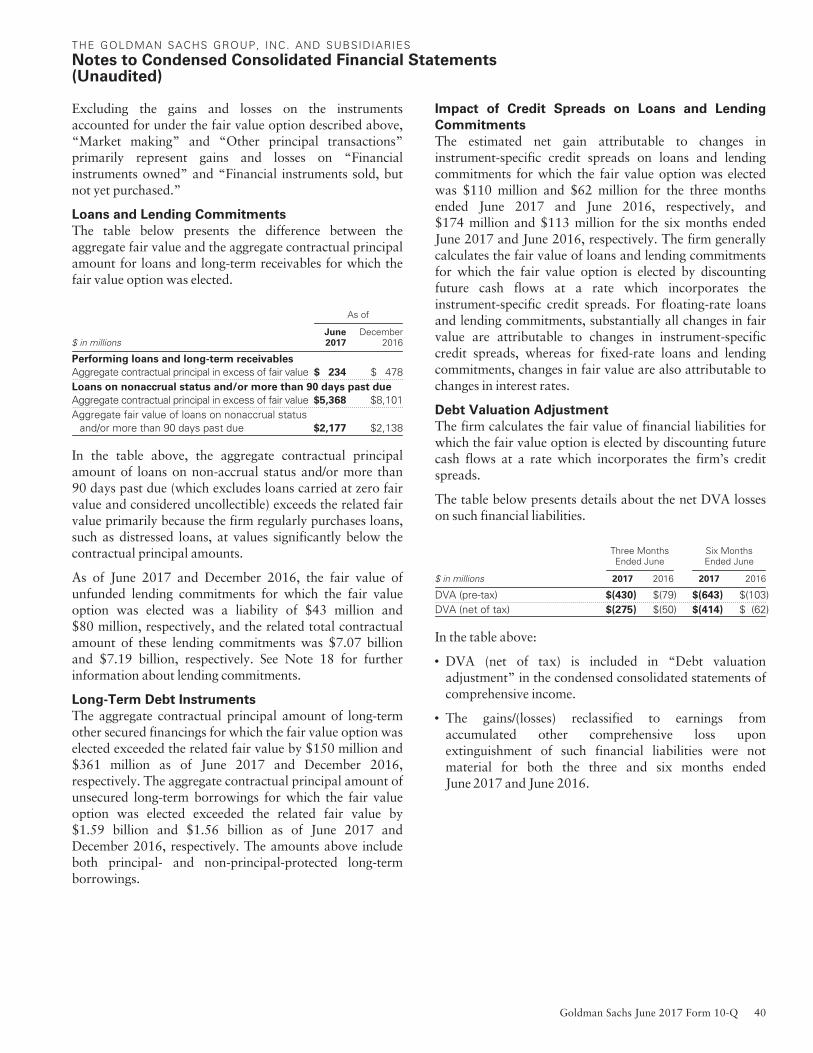
THE GOLDMAN SACHS GROUP, INC. AND SUBSIDIARIES
Notes to Condensed Consolidated Financial Statements(Unaudited)
Excluding the gains and losses on the instrumentsaccounted for under the fair value option described above,“Market making” and “Other principal transactions”primarily represent gains and losses on “Financialinstruments owned” and “Financial instruments sold, butnot yet purchased.”
Loans and Lending Commitments
The table below presents the difference between theaggregate fair value and the aggregate contractual principalamount for loans and long-term receivables for which thefair value option was elected.
As of
$ in millionsJune2017
December2016
Performing loans and long-term receivables
Aggregate contractual principal in excess of fair value $ 234 $ 478Loans on nonaccrual status and/or more than 90 days past due
Aggregate contractual principal in excess of fair value $5,368 $8,101Aggregate fair value of loans on nonaccrual status
and/or more than 90 days past due $2,177 $2,138
In the table above, the aggregate contractual principalamount of loans on non-accrual status and/or more than90 days past due (which excludes loans carried at zero fairvalue and considered uncollectible) exceeds the related fairvalue primarily because the firm regularly purchases loans,such as distressed loans, at values significantly below thecontractual principal amounts.
As of June 2017 and December 2016, the fair value ofunfunded lending commitments for which the fair valueoption was elected was a liability of $43 million and$80 million, respectively, and the related total contractualamount of these lending commitments was $7.07 billionand $7.19 billion, respectively. See Note 18 for furtherinformation about lending commitments.
Long-Term Debt Instruments
The aggregate contractual principal amount of long-termother secured financings for which the fair value option waselected exceeded the related fair value by $150 million and$361 million as of June 2017 and December 2016,respectively. The aggregate contractual principal amount ofunsecured long-term borrowings for which the fair valueoption was elected exceeded the related fair value by$1.59 billion and $1.56 billion as of June 2017 andDecember 2016, respectively. The amounts above includeboth principal- and non-principal-protected long-termborrowings.
Impact of Credit Spreads on Loans and Lending
Commitments
The estimated net gain attributable to changes ininstrument-specific credit spreads on loans and lendingcommitments for which the fair value option was electedwas $110 million and $62 million for the three monthsended June 2017 and June 2016, respectively, and$174 million and $113 million for the six months endedJune 2017 and June 2016, respectively. The firm generallycalculates the fair value of loans and lending commitmentsfor which the fair value option is elected by discountingfuture cash flows at a rate which incorporates theinstrument-specific credit spreads. For floating-rate loansand lending commitments, substantially all changes in fairvalue are attributable to changes in instrument-specificcredit spreads, whereas for fixed-rate loans and lendingcommitments, changes in fair value are also attributable tochanges in interest rates.
Debt Valuation Adjustment
The firm calculates the fair value of financial liabilities forwhich the fair value option is elected by discounting futurecash flows at a rate which incorporates the firm’s creditspreads.
The table below presents details about the net DVA losseson such financial liabilities.
Three MonthsEnded June
Six MonthsEnded June
$ in millions 2017 2016 2017 2016
DVA (pre-tax) $(430) $(79) $(643) $(103)DVA (net of tax) $(275) $(50) $(414) $ (62)
In the table above:
‰ DVA (net of tax) is included in “Debt valuationadjustment” in the condensed consolidated statements ofcomprehensive income.
‰ The gains/(losses) reclassified to earnings fromaccumulated other comprehensive loss uponextinguishment of such financial liabilities were notmaterial for both the three and six months endedJune 2017 and June 2016.
Goldman Sachs June 2017 Form 10-Q 40

THE GOLDMAN SACHS GROUP, INC. AND SUBSIDIARIES
Notes to Condensed Consolidated Financial Statements(Unaudited)
Note 9.
Loans Receivable
Loans receivable is comprised of loans held for investmentthat are accounted for at amortized cost net of allowancefor loan losses. Interest on loans receivable is recognizedover the life of the loan and is recorded on an accrual basis.
The table below presents details about loans receivable.
As of
$ in millionsJune2017
December2016
Corporate loans $25,890 $24,837Loans to private wealth management clients 13,539 13,828Loans backed by commercial real estate 6,230 4,761Loans backed by residential real estate 4,828 3,865Other loans 4,182 2,890Total loans receivable, gross 54,669 50,181Allowance for loan losses (717) (509)Total loans receivable $53,952 $49,672
As of June 2017 and December 2016, the fair value of loansreceivable was $54.29 billion and $49.80 billion,respectively. As of June 2017, had these loans been carriedat fair value and included in the fair value hierarchy,$32.33 billion and $21.96 billion would have beenclassified in level 2 and level 3, respectively. As ofDecember 2016, had these loans been carried at fair valueand included in the fair value hierarchy, $28.40 billion and$21.40 billion would have been classified in level 2 andlevel 3, respectively.
The firm also extends lending commitments that are heldfor investment and accounted for on an accrual basis. As ofJune 2017 and December 2016, such lending commitmentswere $110.16 billion and $98.05 billion, respectively.Substantially all of these commitments were extended tocorporate borrowers and were primarily related to thefirm’s relationship lending activities. The carrying valueand the estimated fair value of such lending commitmentswere liabilities of $381 million and $2.35 billion,respectively, as of June 2017, and $327 million and$2.55 billion, respectively, as of December 2016. As ofJune 2017, had these lending commitments been carried atfair value and included in the fair value hierarchy,$915 million and $1.43 billion would have been classifiedin level 2 and level 3, respectively. As of December 2016,had these lending commitments been carried at fair valueand included in the fair value hierarchy, $1.10 billion and$1.45 billion would have been classified in level 2 andlevel 3, respectively.
The following is a description of the captions in the tableabove:
‰ Corporate Loans. Corporate loans includes term loans,revolving lines of credit, letter of credit facilities andbridge loans, and are principally used for operatingliquidity and general corporate purposes, or inconnection with acquisitions. Corporate loans may besecured or unsecured, depending on the loan purpose, therisk profile of the borrower and other factors. Loansreceivable related to the firm’s relationship lendingactivities are reported within corporate loans.
‰ Loans to Private Wealth Management Clients. Loansto private wealth management clients includes loans usedby clients to finance private asset purchases, employleverage for strategic investments in real or financialassets, bridge cash flow timing gaps or provide liquidityfor other needs. Such loans are primarily secured bysecurities or other assets.
‰ Loans Backed by Commercial Real Estate. Loansbacked by commercial real estate includes loans extendedby the firm that are directly or indirectly secured byhotels, retail stores, multifamily housing complexes andcommercial and industrial properties. Loans backed bycommercial real estate also includes loans purchased bythe firm.
‰ Loans Backed by Residential Real Estate. Loansbacked by residential real estate includes loans extendedby the firm to clients who warehouse assets that aredirectly or indirectly secured by residential real estate.Loans backed by residential real estate also includes loanspurchased by the firm.
‰ Other Loans. Other loans primarily includes loansextended to clients who warehouse assets that are directlyor indirectly secured by consumer loans, including autoloans, and private student loans and other assets. Otherloans also includes unsecured loans to individuals madethrough the firm’s online platform.
41 Goldman Sachs June 2017 Form 10-Q

THE GOLDMAN SACHS GROUP, INC. AND SUBSIDIARIES
Notes to Condensed Consolidated Financial Statements(Unaudited)
Purchased Credit Impaired (PCI) Loans
Loans receivable includes PCI loans, which representacquired loans or pools of loans with evidence of creditdeterioration subsequent to their origination and where it isprobable, at acquisition, that the firm will not be able tocollect all contractually required payments. Loans acquiredwithin the same reporting period, which have at least twocommon risk characteristics, one of which relates to theircredit risk, are eligible to be pooled together and considereda single unit of account. PCI loans are initially recorded atacquisition price and the difference between the acquisitionprice and the expected cash flows (accretable yield) isrecognized as interest income over the life of such loans orpools of loans on an effective yield method. Expected cashflows on PCI loans are determined using various inputs andassumptions, including default rates, loss severities,recoveries, amount and timing of prepayments and othermacroeconomic indicators. The table below presents detailsabout PCI loans.
As of
$ in millionsJune2017
December2016
Loans backed by commercial real estate $1,421 $1,444Loans backed by residential real estate 3,190 2,508Other loans 14 18Total gross carrying value $4,625 $3,970
Total outstanding principal balance $9,601 $8,515Total accretable yield $ 647 $ 526
The table below presents details about PCI loans at the timeof acquisition.
Three MonthsEnded June
Six MonthsEnded June
$ in millions 2017 2016 2017 2016
Fair value $ 826 $ 643 $1,088 $ 857Expected cash flows $ 914 $ 740 $1,210 $ 993Contractually required cash flows $2,176 $1,711 $2,808 $2,237
Credit Quality
The firm’s risk assessment process includes evaluating thecredit quality of its loans receivable. For loans receivable(excluding PCI loans), the firm performs credit reviewswhich include initial and ongoing analyses of its borrowers.A credit review is an independent analysis of the capacityand willingness of a borrower to meet its financialobligations, resulting in an internal credit rating. Thedetermination of internal credit ratings also incorporatesassumptions with respect to the nature of and outlook forthe borrower’s industry, and the economic environment.The firm also assigns a regulatory risk rating to such loansbased on the definitions provided by the U.S. federal bankregulatory agencies.
The table below presents gross loans receivable (excludingPCI loans of $4.63 billion and $3.97 billion as of June 2017and December 2016, respectively, which are not assigned acredit rating equivalent) and related lending commitmentsby the firm’s internally determined public rating agencyequivalent and by regulatory risk rating.
$ in millions LoansLending
Commitments Total
Credit Rating Equivalent
As of June 2017
Investment-grade $19,065 $ 78,936 $ 98,001
Non-investment-grade 30,979 31,220 62,199
Total $50,044 $110,156 $160,200
As of December 2016Investment-grade $18,434 $ 72,323 $ 90,757Non-investment-grade 27,777 25,722 53,499Total $46,211 $ 98,045 $144,256
Regulatory Risk Rating
As of June 2017
Non-criticized/pass $46,287 $106,659 $152,946
Criticized 3,757 3,497 7,254
Total $50,044 $110,156 $160,200
As of December 2016Non-criticized/pass $43,146 $ 94,966 $138,112Criticized 3,065 3,079 6,144Total $46,211 $ 98,045 $144,256
In the table above, non-criticized/pass loans and lendingcommitments represent loans and lending commitmentsthat are performing and/or do not demonstrate adversecharacteristics that are likely to result in a credit loss.
Goldman Sachs June 2017 Form 10-Q 42
THE GOLDMAN SACHS GROUP, INC. AND SUBSIDIARIES
Notes to Condensed Consolidated Financial Statements(Unaudited)
The firm enters into economic hedges to mitigate credit riskon certain loans receivable and commercial lendingcommitments (both of which are held for investment)related to the firm’s relationship lending activities. Suchhedges are accounted for at fair value. See Note 18 forfurther information about commercial lendingcommitments and associated hedges.
Loans receivable (excluding PCI loans) are determined to beimpaired when it is probable that the firm will not be ableto collect all principal and interest due under thecontractual terms of the loan. At that time, loans aregenerally placed on non-accrual status and all accrued butuncollected interest is reversed against interest income, andinterest subsequently collected is recognized on a cash basisto the extent the loan balance is deemed collectible.Otherwise, all cash received is used to reduce theoutstanding loan balance. In certain circumstances, the firmmay also modify the original terms of a loan agreement bygranting a concession to a borrower experiencing financialdifficulty. Such modifications are considered troubled debtrestructurings and typically include interest rate reductions,payment extensions, and modification of loan covenants.Loans modified in a troubled debt restructuring areconsidered impaired and are subject to specific loan-levelreserves.
As of June 2017 and December 2016, the gross carryingvalue of impaired loans receivable (excluding PCI loans) onnon-accrual status was $738 million and $404 million,respectively. As of June 2017 and December 2016, suchloans included $210 million and $142 million, respectively,of corporate loans that were modified in a troubled debtrestructuring. The firm’s lending commitments related tothese loans were $127 million and $144 million, as ofJune 2017 and December 2016, respectively.
For PCI loans, the firm’s risk assessment process includesreviewing certain key metrics, such as delinquency status,collateral values, credit scores and other risk factors. Whenit is determined that the firm cannot reasonably estimateexpected cash flows on the PCI loans or pools of loans, suchloans are placed on non-accrual status.
Allowance for Losses on Loans and Lending
Commitments
The firm’s allowance for loan losses is comprised of specificloan-level reserves, portfolio level reserves, and reserves onPCI loans as described below:
‰ Specific loan-level reserves are determined on loans(excluding PCI loans) that exhibit credit quality weaknessand are therefore individually evaluated for impairment.
‰ Portfolio level reserves are determined on loans(excluding PCI loans) not deemed impaired byaggregating groups of loans with similar riskcharacteristics and estimating the probable loss inherentin the portfolio.
‰ Reserves on PCI loans are recorded when it is determinedthat the expected cash flows, which are reassessed on aquarterly basis, will be lower than those used to establishthe current effective yield for such loans or pools of loans.If the expected cash flows are determined to besignificantly higher than those used to establish thecurrent effective yield, such increases are initiallyrecognized as a reduction to any previously recordedallowances for loan losses and any remaining increasesare recognized as interest income prospectively over thelife of the loan or pools of loans as an increase to theeffective yield.
The allowance for loan losses is determined using variousinputs, including industry default and loss data, currentmacroeconomic indicators, borrower’s capacity to meet itsfinancial obligations, borrower’s country of risk, loanseniority and collateral type. Management’s estimate ofloan losses entails judgment about loan collectability at thereporting dates, and there are uncertainties inherent inthose judgments. While management uses the bestinformation available to determine this estimate, futureadjustments to the allowance may be necessary based on,among other things, changes in the economic environmentor variances between actual results and the originalassumptions used. Loans are charged off against theallowance for loan losses when deemed to be uncollectible.As of June 2017 and December 2016, substantially all ofthe firm’s loans receivable were evaluated for impairment atthe portfolio level.
The firm also records an allowance for losses on lendingcommitments that are held for investment and accountedfor on an accrual basis. Such allowance is determined usingthe same methodology as the allowance for loan losses,while also taking into consideration the probability ofdrawdowns or funding, and is included in “Other liabilitiesand accrued expenses.” As of June 2017 andDecember 2016, substantially all of such lendingcommitments were evaluated for impairment at theportfolio level.
43 Goldman Sachs June 2017 Form 10-Q

THE GOLDMAN SACHS GROUP, INC. AND SUBSIDIARIES
Notes to Condensed Consolidated Financial Statements(Unaudited)
The table below presents changes in the allowance for loanlosses and the allowance for losses on lendingcommitments.
$ in millionsSix Months Ended
June 2017Year Ended
December 2016
Allowance for loan losses
Beginning balance $509 $414Charge-offs (13) (8)Provision 236 138Other (15) (35)Ending balance $717 $509Allowance for losses on lending commitments
Beginning balance $212 $188Provision 67 44Other (21) (20)Ending balance $258 $212
In the table above:
‰ The provision for losses on loans and lendingcommitments is included in “Other principaltransactions,” and was primarily related to corporateloans and corporate lending commitments.
‰ Other represents the reduction to the allowance related toloans and lending commitments transferred to held forsale.
‰ Portfolio level reserves included in the allowance for loanlosses were $416 million and $370 million, as ofJune 2017 and December 2016, respectively, and wereprimarily related to corporate loans.
‰ Specific loan-level reserves included in the allowance forloan losses were $201 million and $127 million, as ofJune 2017 and December 2016, respectively, and weresubstantially all related to corporate loans.
‰ Reserves on PCI loans included in the allowance for loanlosses were $100 million and $12 million, as of June 2017and December 2016, respectively, and were related toloans backed by real estate.
‰ As of June 2017 and December 2016, substantially all ofthe allowance for losses on lending commitments wererelated to corporate lending commitments and wereprimarily determined at the portfolio level.
Note 10.
Collateralized Agreements and Financings
Collateralized agreements are securities purchased underagreements to resell (resale agreements) and securitiesborrowed. Collateralized financings are securities soldunder agreements to repurchase (repurchase agreements),securities loaned and other secured financings. The firmenters into these transactions in order to, among otherthings, facilitate client activities, invest excess cash, acquiresecurities to cover short positions and finance certain firmactivities.
Collateralized agreements and financings are presented on anet-by-counterparty basis when a legal right of setoff exists.Interest on collateralized agreements and collateralizedfinancings is recognized over the life of the transaction andincluded in “Interest income” and “Interest expense,”respectively. See Note 23 for further information aboutinterest income and interest expense.
The table below presents the carrying value of resale andrepurchase agreements and securities borrowed and loanedtransactions.
As of
$ in millionsJune2017
December2016
Securities purchased under agreements to resell $115,553 $116,925Securities borrowed $178,301 $184,600Securities sold under agreements to repurchase $ 83,635 $ 71,816Securities loaned $ 12,005 $ 7,524
In the table above:
‰ Substantially all resale agreements and all repurchaseagreements are carried at fair value under the fair valueoption. See Note 8 for further information about thevaluation techniques and significant inputs used todetermine fair value.
‰ As of June 2017 and December 2016, $70.30 billion and$82.40 billion of securities borrowed, and $4.75 billionand $2.65 billion of securities loaned were at fair value,respectively.
Goldman Sachs June 2017 Form 10-Q 44

THE GOLDMAN SACHS GROUP, INC. AND SUBSIDIARIES
Notes to Condensed Consolidated Financial Statements(Unaudited)
Resale and Repurchase Agreements
A resale agreement is a transaction in which the firmpurchases financial instruments from a seller, typically inexchange for cash, and simultaneously enters into anagreement to resell the same or substantially the samefinancial instruments to the seller at a stated price plusaccrued interest at a future date.
A repurchase agreement is a transaction in which the firmsells financial instruments to a buyer, typically in exchangefor cash, and simultaneously enters into an agreement torepurchase the same or substantially the same financialinstruments from the buyer at a stated price plus accruedinterest at a future date.
Even though repurchase and resale agreements (including“repos- and reverses-to-maturity”) involve the legaltransfer of ownership of financial instruments, they areaccounted for as financing arrangements because theyrequire the financial instruments to be repurchased orresold before or at the maturity of the agreement. Thefinancial instruments purchased or sold in resale andrepurchase agreements typically include U.S. governmentand agency, and investment-grade sovereign obligations.
The firm receives financial instruments purchased underresale agreements and makes delivery of financialinstruments sold under repurchase agreements. To mitigatecredit exposure, the firm monitors the market value of thesefinancial instruments on a daily basis, and delivers orobtains additional collateral due to changes in the marketvalue of the financial instruments, as appropriate. Forresale agreements, the firm typically requires collateral witha fair value approximately equal to the carrying value of therelevant assets in the condensed consolidated statements offinancial condition.
Securities Borrowed and Loaned Transactions
In a securities borrowed transaction, the firm borrowssecurities from a counterparty in exchange for cash orsecurities. When the firm returns the securities, thecounterparty returns the cash or securities. Interest isgenerally paid periodically over the life of the transaction.
In a securities loaned transaction, the firm lends securitiesto a counterparty in exchange for cash or securities. Whenthe counterparty returns the securities, the firm returns thecash or securities posted as collateral. Interest is generallypaid periodically over the life of the transaction.
The firm receives securities borrowed and makes delivery ofsecurities loaned. To mitigate credit exposure, the firmmonitors the market value of these securities on a daily basis,and delivers or obtains additional collateral due to changes inthe market value of the securities, as appropriate. Forsecurities borrowed transactions, the firm typically requirescollateral with a fair value approximately equal to thecarrying value of the securities borrowed transaction.
Securities borrowed and loaned within FICC ClientExecution are recorded at fair value under the fair valueoption. See Note 8 for further information about securitiesborrowed and loaned accounted for at fair value.
Securities borrowed and loaned within Securities Servicesare recorded based on the amount of cash collateraladvanced or received plus accrued interest. As theseagreements generally can be terminated on demand, theyexhibit little, if any, sensitivity to changes in interest rates.Therefore, the carrying value of such agreementsapproximates fair value. While these agreements arecarried at amounts that approximate fair value, they arenot accounted for at fair value under the fair value optionor at fair value in accordance with other U.S. GAAP andtherefore are not included in the firm’s fair value hierarchyin Notes 6 through 8. Had these agreements been includedin the firm’s fair value hierarchy, they would have beenclassified in level 2 as of June 2017 and December 2016.
Offsetting Arrangements
The table below presents the gross and net resale andrepurchase agreements and securities borrowed and loanedtransactions, and the related amount of counterparty nettingincluded in the condensed consolidated statements offinancial condition as well as the amounts of counterpartynetting and cash and securities collateral, not offset in thecondensed consolidated statements of financial condition.
Assets Liabilities
$ in millionsResale
agreementsSecuritiesborrowed
Repurchaseagreements
Securitiesloaned
As of June 2017
Included in condensed consolidated statements of financial condition
Gross carrying value $ 183,970 $ 183,199 $152,052 $16,903
Counterparty netting (68,417) (4,898) (68,417) (4,898)
Total 115,553 178,301 83,635 12,005
Amounts not offset
Counterparty netting (8,775) (4,731) (8,775) (4,731)
Collateral (104,653) (163,978) (71,516) (6,765)
Total $ 2,125 $ 9,592 $ 3,344 $ 509
As of December 2016Included in condensed consolidated statements of financial condition
Gross carrying value $ 173,561 $ 189,571 $128,452 $12,495Counterparty netting (56,636) (4,971) (56,636) (4,971)Total 116,925 184,600 71,816 7,524Amounts not offset
Counterparty netting (8,319) (4,045) (8,319) (4,045)Collateral (107,148) (170,625) (62,081) (3,087)Total $ 1,458 $ 9,930 $ 1,416 $ 392
45 Goldman Sachs June 2017 Form 10-Q

THE GOLDMAN SACHS GROUP, INC. AND SUBSIDIARIES
Notes to Condensed Consolidated Financial Statements(Unaudited)
In the table above:
‰ Substantially all of the gross carrying values of thesearrangements are subject to enforceable nettingagreements.
‰ Where the firm has received or posted collateral undercredit support agreements, but has not yet determinedsuch agreements are enforceable, the related collateral hasnot been netted.
‰ Amounts not offset includes counterparty netting that doesnot meet the criteria for netting under U.S. GAAP and thefair value of cash or securities collateral received or postedsubject to enforceable credit support agreements.
Gross Carrying Value of Repurchase Agreements
and Securities Loaned
The table below presents the gross carrying value ofrepurchase agreements and securities loaned by class ofcollateral pledged.
$ in millionsRepurchaseagreements
Securitiesloaned
As of June 2017
Money market instruments $ 392 $ —
U.S. government and agency obligations 48,443 —
Non-U.S. government and agency obligations 77,935 2,497
Securities backed by commercial real estate 29 —
Securities backed by residential real estate 490 —
Corporate loans and debt securities 9,344 1,171
State and municipal obligations 219 —
Other debt obligations 4 —
Equity securities 15,196 13,235
Total $152,052 $16,903
As of December 2016Money market instruments $ 317 $ —U.S. government and agency obligations 47,207 115Non-U.S. government and agency obligations 56,156 1,846Securities backed by commercial real estate 208 —Securities backed by residential real estate 122 —Corporate loans and debt securities 8,297 39State and municipal obligations 831 —Other debt obligations 286 —Equity securities 15,028 10,495Total $128,452 $12,495
The table below presents the gross carrying value ofrepurchase agreements and securities loaned by maturitydate.
As of June 2017
$ in millionsRepurchaseagreements
Securitiesloaned
No stated maturity and overnight $ 44,387 $ 9,167
2 - 30 days 49,586 3,000
31 - 90 days 21,182 500
91 days - 1 year 22,997 2,950
Greater than 1 year 13,900 1,286
Total $152,052 $16,903
In the table above:
‰ Repurchase agreements and securities loaned that arerepayable prior to maturity at the option of the firm arereflected at their contractual maturity dates.
‰ Repurchase agreements and securities loaned that areredeemable prior to maturity at the option of the holderare reflected at the earliest dates such options becomeexercisable.
Other Secured Financings
In addition to repurchase agreements and securities loanedtransactions, the firm funds certain assets through the use ofother secured financings and pledges financial instrumentsand other assets as collateral in these transactions. Theseother secured financings consist of:
‰ Liabilities of consolidated VIEs;
‰ Transfers of assets accounted for as financings rather thansales (primarily collateralized central bank financings,pledged commodities, bank loans and mortgage wholeloans); and
‰ Other structured financing arrangements.
Other secured financings includes arrangements that arenonrecourse. As of June 2017 and December 2016,nonrecourse other secured financings were $2.95 billionand $2.54 billion, respectively.
The firm has elected to apply the fair value option tosubstantially all other secured financings because the use offair value eliminates non-economic volatility in earningsthat would arise from using different measurementattributes. See Note 8 for further information about othersecured financings that are accounted for at fair value.
Other secured financings that are not recorded at fair valueare recorded based on the amount of cash received plusaccrued interest, which generally approximates fair value.While these financings are carried at amounts thatapproximate fair value, they are not accounted for at fairvalue under the fair value option or at fair value inaccordance with other U.S. GAAP and therefore are notincluded in the firm’s fair value hierarchy in Notes 6through 8. Had these financings been included in the firm’sfair value hierarchy, they would have been primarilyclassified in level 2 as of June 2017 and December 2016.
Goldman Sachs June 2017 Form 10-Q 46

THE GOLDMAN SACHS GROUP, INC. AND SUBSIDIARIES
Notes to Condensed Consolidated Financial Statements(Unaudited)
The table below presents information about other securedfinancings.
$ in millionsU.S.
DollarNon-U.S.
Dollar Total
As of June 2017
Other secured financings (short-term):At fair value $ 5,194 $ 4,467 $ 9,661
At amortized cost $ 100 $ 326 $ 426
Weighted average interest rates 3.61% 2.27%
Other secured financings (long-term):At fair value $ 7,032 $ 5,274 $12,306
At amortized cost $ 40 $ — $ 40
Weighted average interest rates 5.24% —%
Total $12,366 $10,067 $22,433
Other secured financings collateralized by:Financial instruments $10,827 $ 8,895 $19,722
Other assets $ 1,539 $ 1,172 $ 2,711
As of December 2016
Other secured financings (short-term):At fair value $ 9,380 $ 3,738 $13,118At amortized cost $ — $ — $ —
Weighted average interest rates —% —%Other secured financings (long-term):
At fair value $ 5,562 $ 2,393 $ 7,955At amortized cost $ 145 $ 305 $ 450
Weighted average interest rates 4.06% 2.16%Total $15,087 $ 6,436 $21,523
Other secured financings collateralized by:Financial instruments $13,858 $ 5,974 $19,832Other assets $ 1,229 $ 462 $ 1,691
In the table above:
‰ Short-term other secured financings includes financingsmaturing within one year of the financial statement dateand financings that are redeemable within one year of thefinancial statement date at the option of the holder.
‰ Weighted average interest rates excludes other securedfinancings at fair value and includes the effect of hedgingactivities. See Note 7 for further information abouthedging activities.
‰ Total other secured financings included $269 million and$285 million related to transfers of financial assetsaccounted for as financings rather than sales as ofJune 2017 and December 2016, respectively. Suchfinancings were collateralized by financial assets of$269 million and $285 million as of June 2017 andDecember 2016, respectively, primarily included in“Financial instruments owned.”
‰ Other secured financings collateralized by financialinstruments included $10.20 billion and $13.65 billion ofother secured financings collateralized by financialinstruments owned as of June 2017 and December 2016,respectively, and $9.52 billion and $6.18 billion of othersecured financings collateralized by financial instrumentsreceived as collateral and repledged as of June 2017 andDecember 2016, respectively.
The table below presents other secured financings bymaturity date.
$ in millionsAs of
June 2017
Other secured financings (short-term) $10,087
Other secured financings (long-term):2018 6,403
2019 1,765
2020 1,264
2021 519
2022 1,662
2023 - thereafter 733
Total other secured financings (long-term) 12,346
Total other secured financings $22,433
In the table above:
‰ Long-term other secured financings that are repayableprior to maturity at the option of the firm are reflected attheir contractual maturity dates.
‰ Long-term other secured financings that are redeemableprior to maturity at the option of the holder are reflectedat the earliest dates such options become exercisable.
Collateral Received and Pledged
The firm receives cash and securities (e.g., U.S. governmentand agency, other sovereign and corporate obligations, aswell as equity securities) as collateral, primarily inconnection with resale agreements, securities borrowed,derivative transactions and customer margin loans. Thefirm obtains cash and securities as collateral on an upfrontor contingent basis for derivative instruments andcollateralized agreements to reduce its credit exposure toindividual counterparties.
In many cases, the firm is permitted to deliver or repledgefinancial instruments received as collateral when enteringinto repurchase agreements and securities loanedtransactions, primarily in connection with secured clientfinancing activities. The firm is also permitted to deliver orrepledge these financial instruments in connection withother secured financings, collateralized derivativetransactions and firm or customer settlement requirements.
The firm also pledges certain financial instruments ownedin connection with repurchase agreements, securities loanedtransactions and other secured financings, and other assets(substantially all real estate and cash) in connection withother secured financings to counterparties who may or maynot have the right to deliver or repledge them.
47 Goldman Sachs June 2017 Form 10-Q

THE GOLDMAN SACHS GROUP, INC. AND SUBSIDIARIES
Notes to Condensed Consolidated Financial Statements(Unaudited)
The table below presents financial instruments at fair valuereceived as collateral that were available to be delivered orrepledged and were delivered or repledged by the firm.
As of
$ in millionsJune2017
December2016
Collateral available to be delivered or repledged $680,833 $634,609Collateral that was delivered or repledged $551,628 $495,717
In the table above, as of June 2017 and December 2016,collateral available to be delivered or repledged excludes$5.13 billion and $15.47 billion, respectively, of securitiesreceived under resale agreements and securities borrowedtransactions that contractually had the right to be deliveredor repledged, but were segregated for regulatory and otherpurposes.
The table below presents information about assets pledged.
As of
$ in millionsJune2017
December2016
Financial instruments owned pledged to counterparties that:Had the right to deliver or repledge $52,773 $51,278Did not have the right to deliver or repledge $79,376 $61,099
Other assets pledged to counterparties that didnot have the right to deliver or repledge $ 4,665 $ 3,287
The firm also segregated $13.30 billion and $15.29 billionof securities included in “Financial instruments owned” asof June 2017 and December 2016, respectively, forregulatory and other purposes. See Note 3 for informationabout segregated cash.
Note 11.
Securitization Activities
The firm securitizes residential and commercial mortgages,corporate bonds, loans and other types of financial assetsby selling these assets to securitization vehicles (e.g., trusts,corporate entities and limited liability companies) orthrough a resecuritization. The firm acts as underwriter ofthe beneficial interests that are sold to investors. The firm’sresidential mortgage securitizations are primarily inconnection with government agency securitizations.
Beneficial interests issued by securitization entities are debtor equity interests that give the investors rights to receive allor portions of specified cash inflows to a securitizationvehicle and include senior and subordinated interests inprincipal, interest and/or other cash inflows. The proceedsfrom the sale of beneficial interests are used to pay thetransferor for the financial assets sold to the securitizationvehicle or to purchase securities which serve as collateral.
The firm accounts for a securitization as a sale when it hasrelinquished control over the transferred financial assets.Prior to securitization, the firm accounts for assets pendingtransfer at fair value and therefore does not typicallyrecognize significant gains or losses upon the transfer ofassets. Net revenues from underwriting activities arerecognized in connection with the sales of the underlyingbeneficial interests to investors.
For transfers of financial assets that are not accounted foras sales, the assets remain in “Financial instrumentsowned” and the transfer is accounted for as a collateralizedfinancing, with the related interest expense recognized overthe life of the transaction. See Notes 10 and 23 for furtherinformation about collateralized financings and interestexpense, respectively.
The firm generally receives cash in exchange for thetransferred assets but may also have continuinginvolvement with the transferred financial assets, includingownership of beneficial interests in securitized financialassets, primarily in the form of senior or subordinatedsecurities. The firm may also purchase senior orsubordinated securities issued by securitization vehicles(which are typically VIEs) in connection with secondarymarket-making activities.
The primary risks included in beneficial interests and otherinterests from the firm’s continuing involvement withsecuritization vehicles are the performance of theunderlying collateral, the position of the firm’s investmentin the capital structure of the securitization vehicle and themarket yield for the security. These interests are primarilyaccounted for at fair value and are classified in level 2 of thefair value hierarchy. Beneficial interests and other interestsnot accounted for at fair value are carried at amounts thatapproximate fair value. See Notes 5 through 8 for furtherinformation about fair value measurements.
The table below presents the amount of financial assetssecuritized and the cash flows received on retained interestsin securitization entities in which the firm had continuinginvolvement as of the end of the period.
Three MonthsEnded June
Six MonthsEnded June
$ in millions 2017 2016 2017 2016
Residential mortgages $6,625 $6,826 $ 9,568 $7,395Commercial mortgages 1,892 750 2,954 926Other financial assets 395 — 395 —Total $8,912 $7,576 $12,917 $8,321
Retained interests cash flows $ 81 $1,239 $ 142 $1,257
Goldman Sachs June 2017 Form 10-Q 48

THE GOLDMAN SACHS GROUP, INC. AND SUBSIDIARIES
Notes to Condensed Consolidated Financial Statements(Unaudited)
The table below presents the firm’s continuing involvementin nonconsolidated securitization entities to which the firmsold assets, as well as the total outstanding principalamount of transferred assets in which the firm hascontinuing involvement.
$ in millions
OutstandingPrincipalAmount
RetainedInterests
PurchasedInterests
As of June 2017
U.S. government agency-issuedcollateralized mortgage obligations $22,969 $ 932 $19
Other residential mortgage-backed 6,108 529 25
Other commercial mortgage-backed 3,320 94 6
CDOs, CLOs and other 2,425 52 4
Total $34,822 $1,607 $54
As of December 2016U.S. government agency-issued
collateralized mortgage obligations $25,140 $ 953 $24Other residential mortgage-backed 3,261 540 6Other commercial mortgage-backed 357 15 —CDOs, CLOs and other 2,284 56 6Total $31,042 $1,564 $36
In the table above:
‰ The outstanding principal amount is presented for thepurpose of providing information about the size of thesecuritization entities and is not representative of thefirm’s risk of loss.
‰ The firm’s risk of loss from retained or purchasedinterests is limited to the carrying value of these interests.
‰ Purchased interests represent senior and subordinatedinterests, purchased in connection with secondarymarket-making activities, in securitization entities inwhich the firm also holds retained interests.
‰ Substantially all of the total outstanding principal amountand total retained interests relate to securitizations during2012 and thereafter.
‰ The fair value of retained interests was $1.64 billion and$1.58 billion as of June 2017 and December 2016,respectively.
In addition to the interests in the table above, the firm hadother continuing involvement in the form of derivativetransactions and commitments with certainnonconsolidated VIEs. The carrying value of thesederivatives and commitments was a net asset of $77 millionand $48 million as of June 2017 and December 2016,respectively. The notional amounts of these derivatives andcommitments are included in maximum exposure to loss inthe nonconsolidated VIE table in Note 12.
The table below presents the weighted average keyeconomic assumptions used in measuring the fair value ofmortgage-backed retained interests and the sensitivity ofthis fair value to immediate adverse changes of 10% and20% in those assumptions.
As of
$ in millionsJune2017
December2016
Fair value of retained interests $1,587 $1,519Weighted average life (years) 7.4 7.5Constant prepayment rate 8.9% 8.1%Impact of 10% adverse change $ (15) $ (14)Impact of 20% adverse change $ (28) $ (28)Discount rate 4.4% 5.3%Impact of 10% adverse change $ (36) $ (37)Impact of 20% adverse change $ (70) $ (71)
In the table above:
‰ Amounts do not reflect the benefit of other financialinstruments that are held to mitigate risks inherent inthese retained interests.
‰ Changes in fair value based on an adverse variation inassumptions generally cannot be extrapolated because therelationship of the change in assumptions to the change infair value is not usually linear.
‰ The impact of a change in a particular assumption iscalculated independently of changes in any otherassumption. In practice, simultaneous changes inassumptions might magnify or counteract the sensitivitiesdisclosed above.
‰ The constant prepayment rate is included only forpositions for which it is a key assumption in thedetermination of fair value.
‰ The discount rate for retained interests that relate to U.S.government agency-issued collateralized mortgageobligations does not include any credit loss. Expectedcredit loss assumptions are reflected in the discount ratefor the remainder of retained interests.
The firm has other retained interests not reflected in thetable above with a fair value of $52 million and a weightedaverage life of 4.3 years as of June 2017, and a fair value of$56 million and a weighted average life of 3.5 years as ofDecember 2016. Due to the nature and fair value of certainof these retained interests, the weighted averageassumptions for constant prepayment and discount ratesand the related sensitivity to adverse changes are notmeaningful as of June 2017 and December 2016. The firm’smaximum exposure to adverse changes in the value of theseinterests is the carrying value of $52 million and$56 million as of June 2017 and December 2016,respectively.
49 Goldman Sachs June 2017 Form 10-Q

THE GOLDMAN SACHS GROUP, INC. AND SUBSIDIARIES
Notes to Condensed Consolidated Financial Statements(Unaudited)
Note 12.
Variable Interest Entities
A variable interest in a VIE is an investment (e.g., debt orequity securities) or other interest (e.g., derivatives or loansand lending commitments) that will absorb portions of theVIE’s expected losses and/or receive portions of the VIE’sexpected residual returns.
The firm’s variable interests in VIEs include senior andsubordinated debt; loans and lending commitments; limitedand general partnership interests; preferred and commonequity; derivatives that may include foreign currency,equity and/or credit risk; guarantees; and certain of the feesthe firm receives from investment funds. Certain interestrate, foreign currency and credit derivatives the firm entersinto with VIEs are not variable interests because theycreate, rather than absorb, risk.
VIEs generally finance the purchase of assets by issuing debtand equity securities that are either collateralized by orindexed to the assets held by the VIE. The debt and equitysecurities issued by a VIE may include tranches of varyinglevels of subordination. The firm’s involvement with VIEsincludes securitization of financial assets, as described inNote 11, and investments in and loans to other types ofVIEs, as described below. See Note 11 for additionalinformation about securitization activities, including thedefinition of beneficial interests. See Note 3 for the firm’sconsolidation policies, including the definition of a VIE.
VIE Consolidation Analysis
The enterprise with a controlling financial interest in a VIEis known as the primary beneficiary and consolidates theVIE. The firm determines whether it is the primarybeneficiary of a VIE by performing an analysis thatprincipally considers:
‰ Which variable interest holder has the power to direct theactivities of the VIE that most significantly impact theVIE’s economic performance;
‰ Which variable interest holder has the obligation toabsorb losses or the right to receive benefits from the VIEthat could potentially be significant to the VIE;
‰ The VIE’s purpose and design, including the risks the VIEwas designed to create and pass through to its variableinterest holders;
‰ The VIE’s capital structure;
‰ The terms between the VIE and its variable interestholders and other parties involved with the VIE; and
‰ Related-party relationships.
The firm reassesses its evaluation of whether an entity is aVIE when certain reconsideration events occur. The firmreassesses its determination of whether it is the primarybeneficiary of a VIE on an ongoing basis based on currentfacts and circumstances.
VIE Activities
The firm is principally involved with VIEs through thefollowing business activities:
Mortgage-Backed VIEs and Corporate CDO and CLO
VIEs. The firm sells residential and commercial mortgageloans and securities to mortgage-backed VIEs andcorporate bonds and loans to corporate CDO and CLOVIEs and may retain beneficial interests in the assets sold tothese VIEs. The firm purchases and sells beneficial interestsissued by mortgage-backed and corporate CDO and CLOVIEs in connection with market-making activities. Inaddition, the firm may enter into derivatives with certain ofthese VIEs, primarily interest rate swaps, which aretypically not variable interests. The firm generally entersinto derivatives with other counterparties to mitigate itsrisk from derivatives with these VIEs.
Certain mortgage-backed and corporate CDO and CLOVIEs, usually referred to as synthetic CDOs or credit-linkednote VIEs, synthetically create the exposure for thebeneficial interests they issue by entering into creditderivatives, rather than purchasing the underlying assets.These credit derivatives may reference a single asset, anindex, or a portfolio/basket of assets or indices. See Note 7for further information about credit derivatives. These VIEsuse the funds from the sale of beneficial interests and thepremiums received from credit derivative counterparties topurchase securities which serve as collateral for thebeneficial interest holders and/or the credit derivativecounterparty. These VIEs may enter into other derivatives,primarily interest rate swaps, which are typically notvariable interests. The firm may be a counterparty toderivatives with these VIEs and generally enters intoderivatives with other counterparties to mitigate its risk.
Goldman Sachs June 2017 Form 10-Q 50

THE GOLDMAN SACHS GROUP, INC. AND SUBSIDIARIES
Notes to Condensed Consolidated Financial Statements(Unaudited)
Real Estate, Credit-Related and Other Investing VIEs.
The firm purchases equity and debt securities issued by andmakes loans to VIEs that hold real estate, performing andnonperforming debt, distressed loans and equity securities.The firm typically does not sell assets to, or enter intoderivatives with, these VIEs.
Other Asset-Backed VIEs. The firm structures VIEs thatissue notes to clients, and purchases and sells beneficialinterests issued by other asset-backed VIEs in connectionwith market-making activities. In addition, the firm mayenter into derivatives with certain other asset-backed VIEs,primarily total return swaps on the collateral assets held bythese VIEs under which the firm pays the VIE the return dueto the note holders and receives the return on the collateralassets owned by the VIE. The firm generally can beremoved as the total return swap counterparty. The firmgenerally enters into derivatives with other counterpartiesto mitigate its risk from derivatives with these VIEs. Thefirm typically does not sell assets to the other asset-backedVIEs it structures.
Principal-Protected Note VIEs. The firm structures VIEsthat issue principal-protected notes to clients. These VIEsown portfolios of assets, principally with exposure to hedgefunds. Substantially all of the principal protection on thenotes issued by these VIEs is provided by the asset portfoliorebalancing that is required under the terms of the notes.The firm enters into total return swaps with these VIEsunder which the firm pays the VIE the return due to theprincipal-protected note holders and receives the return onthe assets owned by the VIE. The firm may enter intoderivatives with other counterparties to mitigate the risk ithas from the derivatives it enters into with these VIEs. Thefirm also obtains funding through these VIEs.
Investments in Funds and Other VIEs. The firm makesequity investments in certain of the investment fund VIEs itmanages and is entitled to receive fees from these VIEs. Thefirm typically does not sell assets to, or enter intoderivatives with, these VIEs. Other VIEs primarily includesnonconsolidated power-related VIEs. The firm purchasesdebt and equity securities issued by VIEs that hold power-related assets and may provide commitments to these VIEs.
Adoption of ASU No. 2015-02
The firm adopted ASU No. 2015-02 as of January 1, 2016.Upon adoption, certain of the firm’s investments in entitiesthat were previously classified as voting interest entities arenow classified as VIEs. These include investments in certainlimited partnership entities that have been deconsolidatedupon adoption as certain fee interests are not consideredsignificant interests under the guidance, and the firm is nolonger deemed to have a controlling financial interest insuch entities. See Note 3 for further information about theadoption of ASU No. 2015-02.
Nonconsolidated VIEs. As a result of adoption as ofJanuary 1, 2016, “Investments in funds and other”nonconsolidated VIEs included $10.70 billion in “Assets inVIEs,” $543 million in “Carrying value of variableinterests — assets” and $559 million in “Maximumexposure to loss” related to investments in limitedpartnership entities that were previously classified asnonconsolidated voting interest entities.
Consolidated VIEs. As a result of adoption as ofJanuary 1, 2016, “Real estate, credit-related and otherinvesting” consolidated VIEs included $302 million ofassets, substantially all included in “Financial instrumentsowned,” and $122 million of liabilities, included in “Otherliabilities and accrued expenses” primarily related toinvestments in limited partnership entities that werepreviously classified as consolidated voting interest entities.
51 Goldman Sachs June 2017 Form 10-Q
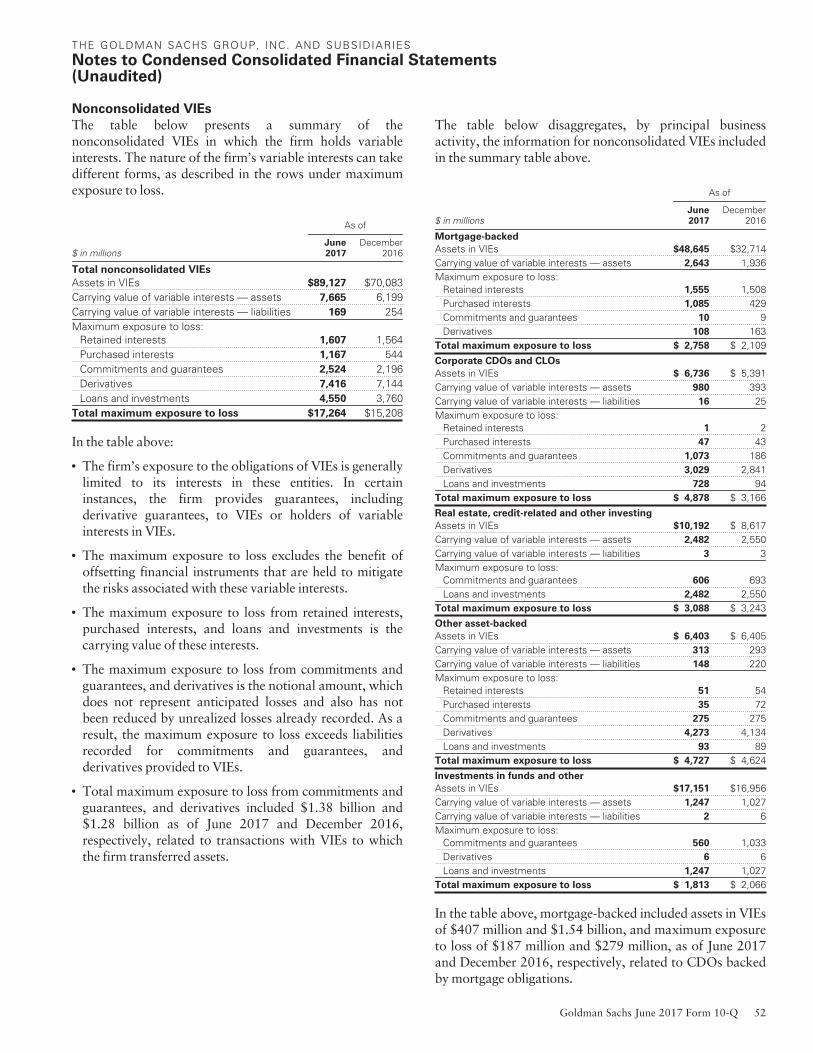
THE GOLDMAN SACHS GROUP, INC. AND SUBSIDIARIES
Notes to Condensed Consolidated Financial Statements(Unaudited)
Nonconsolidated VIEs
The table below presents a summary of thenonconsolidated VIEs in which the firm holds variableinterests. The nature of the firm’s variable interests can takedifferent forms, as described in the rows under maximumexposure to loss.
As of
$ in millionsJune2017
December2016
Total nonconsolidated VIEs
Assets in VIEs $89,127 $70,083Carrying value of variable interests — assets 7,665 6,199Carrying value of variable interests — liabilities 169 254Maximum exposure to loss:
Retained interests 1,607 1,564Purchased interests 1,167 544Commitments and guarantees 2,524 2,196Derivatives 7,416 7,144Loans and investments 4,550 3,760
Total maximum exposure to loss $17,264 $15,208
In the table above:
‰ The firm’s exposure to the obligations of VIEs is generallylimited to its interests in these entities. In certaininstances, the firm provides guarantees, includingderivative guarantees, to VIEs or holders of variableinterests in VIEs.
‰ The maximum exposure to loss excludes the benefit ofoffsetting financial instruments that are held to mitigatethe risks associated with these variable interests.
‰ The maximum exposure to loss from retained interests,purchased interests, and loans and investments is thecarrying value of these interests.
‰ The maximum exposure to loss from commitments andguarantees, and derivatives is the notional amount, whichdoes not represent anticipated losses and also has notbeen reduced by unrealized losses already recorded. As aresult, the maximum exposure to loss exceeds liabilitiesrecorded for commitments and guarantees, andderivatives provided to VIEs.
‰ Total maximum exposure to loss from commitments andguarantees, and derivatives included $1.38 billion and$1.28 billion as of June 2017 and December 2016,respectively, related to transactions with VIEs to whichthe firm transferred assets.
The table below disaggregates, by principal businessactivity, the information for nonconsolidated VIEs includedin the summary table above.
As of
$ in millionsJune2017
December2016
Mortgage-backed
Assets in VIEs $48,645 $32,714Carrying value of variable interests — assets 2,643 1,936Maximum exposure to loss:
Retained interests 1,555 1,508Purchased interests 1,085 429Commitments and guarantees 10 9Derivatives 108 163
Total maximum exposure to loss $ 2,758 $ 2,109
Corporate CDOs and CLOs
Assets in VIEs $ 6,736 $ 5,391Carrying value of variable interests — assets 980 393Carrying value of variable interests — liabilities 16 25Maximum exposure to loss:
Retained interests 1 2Purchased interests 47 43Commitments and guarantees 1,073 186Derivatives 3,029 2,841Loans and investments 728 94
Total maximum exposure to loss $ 4,878 $ 3,166
Real estate, credit-related and other investing
Assets in VIEs $10,192 $ 8,617Carrying value of variable interests — assets 2,482 2,550Carrying value of variable interests — liabilities 3 3Maximum exposure to loss:
Commitments and guarantees 606 693Loans and investments 2,482 2,550
Total maximum exposure to loss $ 3,088 $ 3,243
Other asset-backed
Assets in VIEs $ 6,403 $ 6,405Carrying value of variable interests — assets 313 293Carrying value of variable interests — liabilities 148 220Maximum exposure to loss:
Retained interests 51 54Purchased interests 35 72Commitments and guarantees 275 275Derivatives 4,273 4,134Loans and investments 93 89
Total maximum exposure to loss $ 4,727 $ 4,624
Investments in funds and other
Assets in VIEs $17,151 $16,956Carrying value of variable interests — assets 1,247 1,027Carrying value of variable interests — liabilities 2 6Maximum exposure to loss:
Commitments and guarantees 560 1,033Derivatives 6 6Loans and investments 1,247 1,027
Total maximum exposure to loss $ 1,813 $ 2,066
In the table above, mortgage-backed included assets in VIEsof $407 million and $1.54 billion, and maximum exposureto loss of $187 million and $279 million, as of June 2017and December 2016, respectively, related to CDOs backedby mortgage obligations.
Goldman Sachs June 2017 Form 10-Q 52

THE GOLDMAN SACHS GROUP, INC. AND SUBSIDIARIES
Notes to Condensed Consolidated Financial Statements(Unaudited)
As of both June 2017 and December 2016, the carryingvalues of the firm’s variable interests in nonconsolidatedVIEs are included in the condensed consolidated statementsof financial condition as follows:
‰ Mortgage-backed: Assets were primarily included in“Financial instruments owned.”
‰ Corporate CDOs and CLOs: Assets were included in“Financial instruments owned” and liabilities wereincluded in “Financial instruments sold, but not yetpurchased.”
‰ Real estate, credit-related and other investing: Assets wereprimarily included in “Financial instruments owned” andliabilities were primarily included in “Other liabilities andaccrued expenses.”
‰ Other asset-backed: Substantially all assets were includedin “Financial instruments owned” and liabilities wereincluded in “Financial instruments sold, but not yetpurchased.”
‰ Investments in funds and other: Substantially all assetswere included in “Financial instruments owned” andliabilities were included in “Financial instruments sold,but not yet purchased.”
Consolidated VIEs
The table below presents a summary of the carrying valueand classification of assets and liabilities in consolidatedVIEs.
As of
$ in millionsJune2017
December2016
Total consolidated VIEs
AssetsCash and cash equivalents $1,144 $ 300Loans receivable 464 603Financial instruments owned 1,248 2,047Other assets 611 682Total $3,467 $3,632LiabilitiesOther secured financings $1,625 $ 854Payables to brokers, dealers and clearing
organizations — 1Financial instruments sold, but not yet purchased 17 7Unsecured short-term borrowings 198 197Unsecured long-term borrowings 276 334Other liabilities and accrued expenses 178 803Total $2,294 $2,196
In the table above:
‰ Assets and liabilities are presented net of intercompanyeliminations and exclude the benefit of offsetting financialinstruments that are held to mitigate the risks associatedwith the firm’s variable interests.
‰ VIEs in which the firm holds a majority voting interest areexcluded if (i) the VIE meets the definition of a businessand (ii) the VIE’s assets can be used for purposes otherthan the settlement of its obligations.
‰ Substantially all assets can only be used to settleobligations of the VIE.
The table below disaggregates, by principal businessactivity, the information for consolidated VIEs included inthe summary table above.
As of
$ in millionsJune2017
December2016
Real estate, credit-related and other investing
AssetsCash and cash equivalents $ 479 $ 300Loans receivable 464 603Financial instruments owned 890 1,708Other assets 601 680Total $2,434 $3,291LiabilitiesOther secured financings $ 338 $ 284Payables to brokers, dealers and clearing
organizations — 1Financial instruments sold, but not yet purchased 17 7Other liabilities and accrued expenses 178 803Total $ 533 $1,095CDOs, mortgage-backed and other asset-backed
AssetsCash and cash equivalents $ 665 $ —Financial instruments owned 256 253Other assets 10 2Total $ 931 $ 255LiabilitiesOther secured financings $ 828 $ 139Total $ 828 $ 139Principal-protected notes
AssetsFinancial instruments owned $ 102 $ 86Total $ 102 $ 86LiabilitiesOther secured financings $ 459 $ 431Unsecured short-term borrowings 198 197Unsecured long-term borrowings 276 334Total $ 933 $ 962
In the table above:
‰ The majority of the assets in principal-protected notesVIEs are intercompany and are eliminated inconsolidation.
‰ Creditors and beneficial interest holders of real estate,credit-related and other investing VIEs, and CDOs,mortgage-backed and other asset-backed VIEs do nothave recourse to the general credit of the firm.
53 Goldman Sachs June 2017 Form 10-Q

THE GOLDMAN SACHS GROUP, INC. AND SUBSIDIARIES
Notes to Condensed Consolidated Financial Statements(Unaudited)
Note 13.
Other Assets
Other assets are generally less liquid, nonfinancial assets.The table below presents other assets by type.
As of
$ in millionsJune2017
December2016
Property, leasehold improvements and equipment $13,978 $12,070Goodwill and identifiable intangible assets 4,080 4,095Income tax-related assets 5,538 5,550Equity-method investments 242 219Miscellaneous receivables and other 4,612 3,547Total $28,450 $25,481
In the table above:
‰ Equity-method investments exclude investmentsaccounted for at fair value under the fair value optionwhere the firm would otherwise apply the equity methodof accounting of $8.37 billion and $7.92 billion as ofJune 2017 and December 2016, respectively, all of whichare included in “Financial instruments owned.” The firmhas generally elected the fair value option for suchinvestments acquired after the fair value option becameavailable.
‰ Miscellaneous receivables and other included$706 million and $682 million of investments in qualifiedaffordable housing projects as of June 2017 andDecember 2016, respectively.
‰ Miscellaneous receivables and other included$706 million and $87 million of debt securities accountedfor as held-to-maturity as of June 2017 andDecember 2016, respectively. As of both June 2017 andDecember 2016, these securities were backed byresidential real estate and had maturities of greater thanten years. These securities are carried at amortized costand the carrying value of these securities approximatedfair value as of June 2017 and December 2016. As thesesecurities are not accounted for at fair value under the fairvalue option or at fair value in accordance with other U.S.GAAP, their fair value is not included in the firm’s fairvalue hierarchy in Notes 6 through 8. Had these securitiesbeen included in the firm’s fair value hierarchy, theywould have been primarily classified in level 2 as ofJune 2017 and December 2016.
Property, Leasehold Improvements and Equipment
Property, leasehold improvements and equipment in thetable above is net of accumulated depreciation andamortization of $8.21 billion and $7.68 billion as ofJune 2017 and December 2016, respectively. Property,leasehold improvements and equipment included$5.81 billion and $5.96 billion as of June 2017 andDecember 2016, respectively, related to property, leaseholdimprovements and equipment that the firm uses inconnection with its operations. The remainder is held byinvestment entities, including VIEs, consolidated by thefirm. Substantially all property and equipment isdepreciated on a straight-line basis over the useful life of theasset. Leasehold improvements are amortized on a straight-line basis over the useful life of the improvement or the termof the lease, whichever is shorter. Capitalized costs ofsoftware developed or obtained for internal use areamortized on a straight-line basis over three years.
Goodwill and Identifiable Intangible Assets
The table below presents the carrying value of goodwill.
As of
$ in millionsJune2017
December2016
Investment Banking:Financial Advisory $ 98 $ 98Underwriting 183 183
Institutional Client Services:FICC Client Execution 269 269Equities client execution 2,403 2,403Securities Services 105 105
Investing & Lending 2 2Investment Management 608 606Total $3,668 $3,666
The table below presents the carrying value of identifiableintangible assets.
As of
$ in millionsJune2017
December2016
Institutional Client Services:FICC Client Execution $ 42 $ 65Equities client execution 115 141
Investing & Lending 125 105Investment Management 130 118Total $ 412 $ 429
Goldman Sachs June 2017 Form 10-Q 54
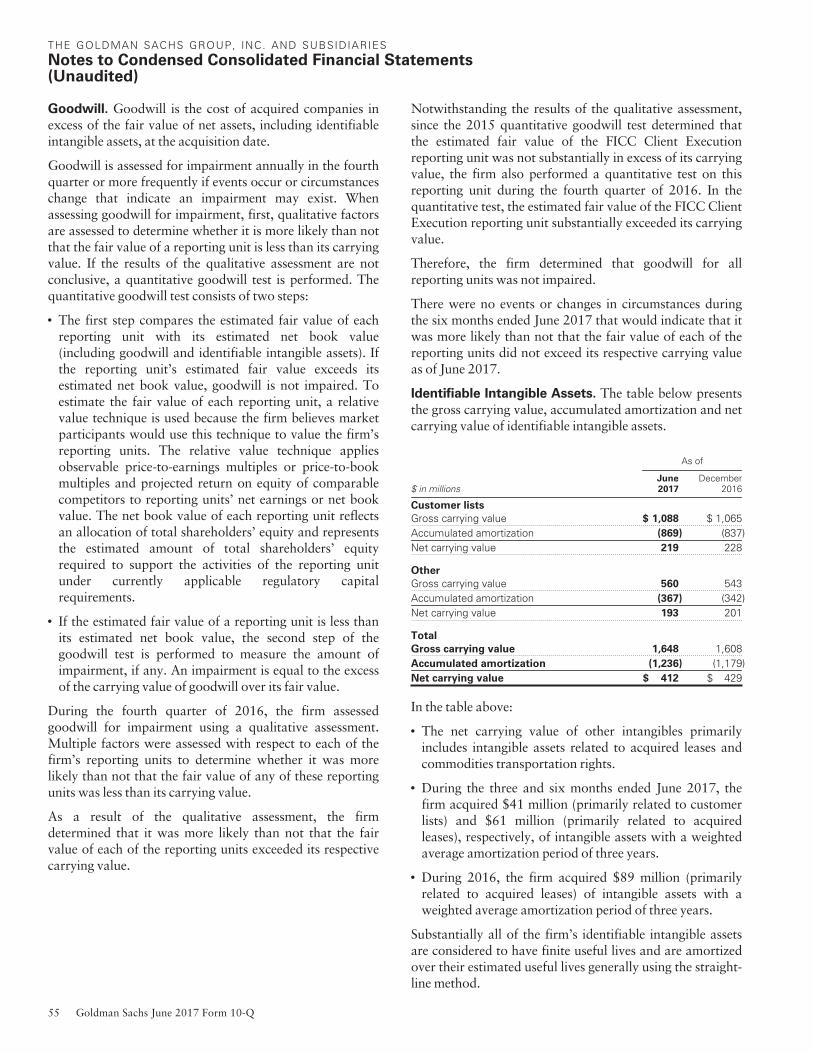
THE GOLDMAN SACHS GROUP, INC. AND SUBSIDIARIES
Notes to Condensed Consolidated Financial Statements(Unaudited)
Goodwill. Goodwill is the cost of acquired companies inexcess of the fair value of net assets, including identifiableintangible assets, at the acquisition date.
Goodwill is assessed for impairment annually in the fourthquarter or more frequently if events occur or circumstanceschange that indicate an impairment may exist. Whenassessing goodwill for impairment, first, qualitative factorsare assessed to determine whether it is more likely than notthat the fair value of a reporting unit is less than its carryingvalue. If the results of the qualitative assessment are notconclusive, a quantitative goodwill test is performed. Thequantitative goodwill test consists of two steps:
‰ The first step compares the estimated fair value of eachreporting unit with its estimated net book value(including goodwill and identifiable intangible assets). Ifthe reporting unit’s estimated fair value exceeds itsestimated net book value, goodwill is not impaired. Toestimate the fair value of each reporting unit, a relativevalue technique is used because the firm believes marketparticipants would use this technique to value the firm’sreporting units. The relative value technique appliesobservable price-to-earnings multiples or price-to-bookmultiples and projected return on equity of comparablecompetitors to reporting units’ net earnings or net bookvalue. The net book value of each reporting unit reflectsan allocation of total shareholders’ equity and representsthe estimated amount of total shareholders’ equityrequired to support the activities of the reporting unitunder currently applicable regulatory capitalrequirements.
‰ If the estimated fair value of a reporting unit is less thanits estimated net book value, the second step of thegoodwill test is performed to measure the amount ofimpairment, if any. An impairment is equal to the excessof the carrying value of goodwill over its fair value.
During the fourth quarter of 2016, the firm assessedgoodwill for impairment using a qualitative assessment.Multiple factors were assessed with respect to each of thefirm’s reporting units to determine whether it was morelikely than not that the fair value of any of these reportingunits was less than its carrying value.
As a result of the qualitative assessment, the firmdetermined that it was more likely than not that the fairvalue of each of the reporting units exceeded its respectivecarrying value.
Notwithstanding the results of the qualitative assessment,since the 2015 quantitative goodwill test determined thatthe estimated fair value of the FICC Client Executionreporting unit was not substantially in excess of its carryingvalue, the firm also performed a quantitative test on thisreporting unit during the fourth quarter of 2016. In thequantitative test, the estimated fair value of the FICC ClientExecution reporting unit substantially exceeded its carryingvalue.
Therefore, the firm determined that goodwill for allreporting units was not impaired.
There were no events or changes in circumstances duringthe six months ended June 2017 that would indicate that itwas more likely than not that the fair value of each of thereporting units did not exceed its respective carrying valueas of June 2017.
Identifiable Intangible Assets. The table below presentsthe gross carrying value, accumulated amortization and netcarrying value of identifiable intangible assets.
As of
$ in millionsJune2017
December2016
Customer lists
Gross carrying value $ 1,088 $ 1,065Accumulated amortization (869) (837)Net carrying value 219 228
Other
Gross carrying value 560 543Accumulated amortization (367) (342)Net carrying value 193 201
Total
Gross carrying value 1,648 1,608Accumulated amortization (1,236) (1,179)Net carrying value $ 412 $ 429
In the table above:
‰ The net carrying value of other intangibles primarilyincludes intangible assets related to acquired leases andcommodities transportation rights.
‰ During the three and six months ended June 2017, thefirm acquired $41 million (primarily related to customerlists) and $61 million (primarily related to acquiredleases), respectively, of intangible assets with a weightedaverage amortization period of three years.
‰ During 2016, the firm acquired $89 million (primarilyrelated to acquired leases) of intangible assets with aweighted average amortization period of three years.
Substantially all of the firm’s identifiable intangible assetsare considered to have finite useful lives and are amortizedover their estimated useful lives generally using the straight-line method.
55 Goldman Sachs June 2017 Form 10-Q
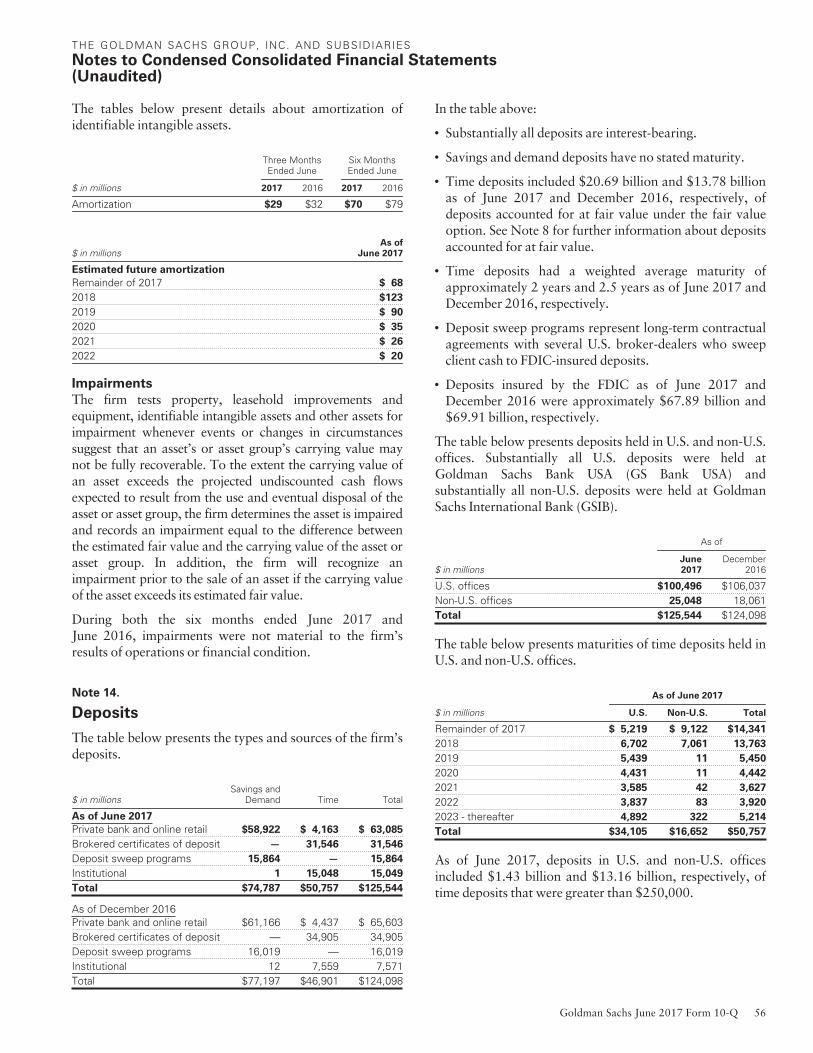
THE GOLDMAN SACHS GROUP, INC. AND SUBSIDIARIES
Notes to Condensed Consolidated Financial Statements(Unaudited)
The tables below present details about amortization ofidentifiable intangible assets.
Three MonthsEnded June
Six MonthsEnded June
$ in millions 2017 2016 2017 2016
Amortization $29 $32 $70 $79
$ in millionsAs of
June 2017
Estimated future amortization
Remainder of 2017 $ 68
2018 $123
2019 $ 90
2020 $ 35
2021 $ 26
2022 $ 20
Impairments
The firm tests property, leasehold improvements andequipment, identifiable intangible assets and other assets forimpairment whenever events or changes in circumstancessuggest that an asset’s or asset group’s carrying value maynot be fully recoverable. To the extent the carrying value ofan asset exceeds the projected undiscounted cash flowsexpected to result from the use and eventual disposal of theasset or asset group, the firm determines the asset is impairedand records an impairment equal to the difference betweenthe estimated fair value and the carrying value of the asset orasset group. In addition, the firm will recognize animpairment prior to the sale of an asset if the carrying valueof the asset exceeds its estimated fair value.
During both the six months ended June 2017 andJune 2016, impairments were not material to the firm’sresults of operations or financial condition.
Note 14.
Deposits
The table below presents the types and sources of the firm’sdeposits.
$ in millionsSavings and
Demand Time Total
As of June 2017
Private bank and online retail $58,922 $ 4,163 $ 63,085
Brokered certificates of deposit — 31,546 31,546
Deposit sweep programs 15,864 — 15,864
Institutional 1 15,048 15,049
Total $74,787 $50,757 $125,544
As of December 2016Private bank and online retail $61,166 $ 4,437 $ 65,603Brokered certificates of deposit — 34,905 34,905Deposit sweep programs 16,019 — 16,019Institutional 12 7,559 7,571Total $77,197 $46,901 $124,098
In the table above:
‰ Substantially all deposits are interest-bearing.
‰ Savings and demand deposits have no stated maturity.
‰ Time deposits included $20.69 billion and $13.78 billionas of June 2017 and December 2016, respectively, ofdeposits accounted for at fair value under the fair valueoption. See Note 8 for further information about depositsaccounted for at fair value.
‰ Time deposits had a weighted average maturity ofapproximately 2 years and 2.5 years as of June 2017 andDecember 2016, respectively.
‰ Deposit sweep programs represent long-term contractualagreements with several U.S. broker-dealers who sweepclient cash to FDIC-insured deposits.
‰ Deposits insured by the FDIC as of June 2017 andDecember 2016 were approximately $67.89 billion and$69.91 billion, respectively.
The table below presents deposits held in U.S. and non-U.S.offices. Substantially all U.S. deposits were held atGoldman Sachs Bank USA (GS Bank USA) andsubstantially all non-U.S. deposits were held at GoldmanSachs International Bank (GSIB).
As of
$ in millionsJune2017
December2016
U.S. offices $100,496 $106,037Non-U.S. offices 25,048 18,061Total $125,544 $124,098
The table below presents maturities of time deposits held inU.S. and non-U.S. offices.
As of June 2017
$ in millions U.S. Non-U.S. Total
Remainder of 2017 $ 5,219 $ 9,122 $14,341
2018 6,702 7,061 13,763
2019 5,439 11 5,450
2020 4,431 11 4,442
2021 3,585 42 3,627
2022 3,837 83 3,920
2023 - thereafter 4,892 322 5,214
Total $34,105 $16,652 $50,757
As of June 2017, deposits in U.S. and non-U.S. officesincluded $1.43 billion and $13.16 billion, respectively, oftime deposits that were greater than $250,000.
Goldman Sachs June 2017 Form 10-Q 56

THE GOLDMAN SACHS GROUP, INC. AND SUBSIDIARIES
Notes to Condensed Consolidated Financial Statements(Unaudited)
The firm’s savings and demand deposits are recorded basedon the amount of cash received plus accrued interest, whichapproximates fair value. In addition, the firm designatescertain derivatives as fair value hedges to convert a majorityof its time deposits not accounted for at fair value fromfixed-rate obligations into floating-rate obligations.Accordingly, the carrying value of time depositsapproximated fair value as of June 2017 andDecember 2016. While these savings and demand depositsand time deposits are carried at amounts that approximatefair value, they are not accounted for at fair value under thefair value option or at fair value in accordance with otherU.S. GAAP and therefore are not included in the firm’s fairvalue hierarchy in Notes 6 through 8. Had these depositsbeen included in the firm’s fair value hierarchy, they wouldhave been classified in level 2 as of June 2017 andDecember 2016.
Note 15.
Short-Term Borrowings
The table below presents details about the firm’s short-termborrowings.
As of
$ in millionsJune2017
December2016
Other secured financings (short-term) $10,087 $13,118Unsecured short-term borrowings 42,966 39,265Total $53,053 $52,383
See Note 10 for information about other securedfinancings.
Unsecured short-term borrowings includes the portion ofunsecured long-term borrowings maturing within one yearof the financial statement date and unsecured long-termborrowings that are redeemable within one year of thefinancial statement date at the option of the holder.
The firm accounts for certain hybrid financial instrumentsat fair value under the fair value option. See Note 8 forfurther information about unsecured short-termborrowings that are accounted for at fair value. Thecarrying value of unsecured short-term borrowings that arenot recorded at fair value generally approximates fair valuedue to the short-term nature of the obligations. While theseunsecured short-term borrowings are carried at amountsthat approximate fair value, they are not accounted for atfair value under the fair value option or at fair value inaccordance with other U.S. GAAP and therefore are notincluded in the firm’s fair value hierarchy in Notes 6through 8. Had these borrowings been included in thefirm’s fair value hierarchy, substantially all would havebeen classified in level 2 as of June 2017 andDecember 2016.
The table below presents details about the firm’s unsecuredshort-term borrowings.
As of
$ in millionsJune2017
December2016
Current portion of unsecured long-term borrowings $26,011 $23,528Hybrid financial instruments 12,918 11,700Other unsecured short-term borrowings 4,037 4,037Total $42,966 $39,265
Weighted average interest rate 2.24% 1.68%
In the table above, the weighted average interest rates forthese borrowings include the effect of hedging activities andexclude financial instruments accounted for at fair valueunder the fair value option. See Note 7 for furtherinformation about hedging activities.
Note 16.
Long-Term Borrowings
The table below presents details about the firm’s long-termborrowings.
As of
$ in millionsJune2017
December2016
Other secured financings (long-term) $ 12,346 $ 8,405Unsecured long-term borrowings 203,647 189,086Total $215,993 $197,491
See Note 10 for information about other secured financings.
The table below presents unsecured long-term borrowingsextending through 2057, which consists principally ofsenior borrowings.
$ in millionsU.S.
DollarNon-U.S.
Dollar Total
As of June 2017
Fixed-rate obligations $ 96,460 $34,575 $131,035
Floating-rate obligations 41,366 31,246 72,612
Total $137,826 $65,821 $203,647
As of December 2016Fixed-rate obligations $ 96,113 $32,159 $128,272Floating-rate obligations 36,748 24,066 60,814Total $132,861 $56,225 $189,086
In the table above:
‰ Floating interest rates are generally based on LIBOR orOvernight Index Swap Rate. Equity-linked and indexedinstruments are included in floating-rate obligations.
‰ Interest rates on U.S. dollar-denominated debt ranged from1.60% to 10.04% (with a weighted average rate of 4.33%)and 1.60% to 10.04% (with a weighted average rate of4.57%) as of June 2017 and December 2016, respectively.
57 Goldman Sachs June 2017 Form 10-Q

THE GOLDMAN SACHS GROUP, INC. AND SUBSIDIARIES
Notes to Condensed Consolidated Financial Statements(Unaudited)
‰ Interest rates on non-U.S. dollar-denominated debtranged from 0.07% to 13.00% (with a weighted averagerate of 2.71%) and 0.02% to 13.00% (with a weightedaverage rate of 3.05%) as of June 2017 andDecember 2016, respectively.
The table below presents unsecured long-term borrowingsby maturity date.
$ in millionsAs of
June 2017
2018 $ 12,430
2019 27,210
2020 22,398
2021 21,368
2022 18,010
2023 - thereafter 102,231
Total $203,647
In the table above:
‰ Unsecured long-term borrowings maturing within oneyear of the financial statement date and unsecured long-term borrowings that are redeemable within one year ofthe financial statement date at the option of the holder areexcluded as they are included in “Unsecured short-termborrowings.”
‰ Unsecured long-term borrowings that are repayable priorto maturity at the option of the firm are reflected at theircontractual maturity dates.
‰ Unsecured long-term borrowings that are redeemableprior to maturity at the option of the holder are reflectedat the earliest dates such options become exercisable.
‰ Unsecured long-term borrowings included $6.42 billionof adjustments to the carrying value of certain unsecuredlong-term borrowings resulting from the application ofhedge accounting by year of maturity as follows:$11 million in 2018, $253 million in 2019, $296 millionin 2020, $533 million in 2021, $39 million in 2022, and$5.29 billion in 2023 and thereafter.
The firm designates certain derivatives as fair value hedgesto convert a portion of its fixed-rate unsecured long-termborrowings not accounted for at fair value into floating-rate obligations. See Note 7 for further information abouthedging activities.
The table below presents unsecured long-term borrowings,after giving effect to such hedging activities.
As of
$ in millionsJune2017
December2016
Fixed-rate obligations:At fair value $ 145 $ 150At amortized cost 83,052 74,718
Floating-rate obligations:At fair value 33,615 29,260At amortized cost 86,835 84,958
Total $203,647 $189,086
In the table above, the weighted average interest rates onthe aggregate amounts were 2.70% (3.62% related tofixed-rate obligations and 1.79% related to floating-rateobligations) and 2.87% (3.90% related to fixed-rateobligations and 1.97% related to floating-rate obligations)as of June 2017 and December 2016, respectively. Theserates exclude financial instruments accounted for at fairvalue under the fair value option.
As of June 2017 and December 2016, the carrying value ofunsecured long-term borrowings for which the firm did notelect the fair value option approximated fair value. As theseborrowings are not accounted for at fair value under thefair value option or at fair value in accordance with otherU.S. GAAP, their fair value is not included in the firm’s fairvalue hierarchy in Notes 6 through 8. Had theseborrowings been included in the firm’s fair value hierarchy,substantially all would have been classified in level 2 as ofJune 2017 and December 2016.
Subordinated Borrowings
Unsecured long-term borrowings includes subordinateddebt and junior subordinated debt. Junior subordinateddebt is junior in right of payment to other subordinatedborrowings, which are junior to senior borrowings. As ofboth June 2017 and December 2016, subordinated debthad maturities ranging from 2018 to 2045. Subordinateddebt that matures within one year of the financial statementdate is included in “Unsecured short-term borrowings.”
The table below presents details about the firm’ssubordinated borrowings.
$ in millionsPar
AmountCarryingAmount Rate
As of June 2017
Subordinated debt $14,011 $16,188 4.29%
Junior subordinated debt 1,309 1,736 5.68%
Total $15,320 $17,924 4.41%
As of December 2016Subordinated debt $15,058 $17,604 4.29%Junior subordinated debt 1,360 1,809 5.70%Total $16,418 $19,413 4.41%
Goldman Sachs June 2017 Form 10-Q 58

THE GOLDMAN SACHS GROUP, INC. AND SUBSIDIARIES
Notes to Condensed Consolidated Financial Statements(Unaudited)
In the table above, the rate is the weighted average interestrate for these borrowings, including the effect of fair valuehedges used to convert these fixed-rate obligations intofloating-rate obligations. See Note 7 for furtherinformation about hedging activities. The rates excludefinancial instruments accounted for at fair value under thefair value option.
During the three and six months ended June 2017, the firmrepurchased or redeemed subordinated debt with a paramount of $1.37 billion (carrying value of $1.73 billion) for$1.62 billion. As a result, such debt was extinguished.
Junior Subordinated Debt
Junior Subordinated Debt Held by Trusts. In 2012, theVesey Street Investment Trust I (Vesey Street Trust) and theMurray Street Investment Trust I (Murray Street Trust)issued an aggregate of $2.25 billion of senior guaranteedtrust securities to third parties, the proceeds of which wereused to purchase junior subordinated debt issued by GroupInc. from Goldman Sachs Capital II and Goldman SachsCapital III (APEX Trusts). The APEX Trusts used theproceeds to purchase shares of Group Inc.’s PerpetualNon-Cumulative Preferred Stock, Series E (Series EPreferred Stock) and Perpetual Non-Cumulative PreferredStock, Series F (Series F Preferred Stock). The seniorguaranteed trust securities issued by the Vesey Street Trustand Murray Street Trust and the related juniorsubordinated debt matured during the third quarter of2016 and the first quarter of 2017, respectively. As ofDecember 2016, $1.45 billion of senior guaranteed trustsecurities issued by the Murray Street Trust and the relatedjunior subordinated debt were outstanding.
The APEX Trusts are Delaware statutory trusts sponsoredby the firm and wholly-owned finance subsidiaries of thefirm for regulatory and legal purposes but are notconsolidated for accounting purposes.
The firm has covenanted in favor of the holders of GroupInc.’s 6.345% junior subordinated debt dueFebruary 15, 2034, that, subject to certain exceptions, thefirm will not redeem or purchase the capital securitiesissued by the APEX Trusts, shares of Group Inc.’s Series Eor Series F Preferred Stock or shares of Group Inc.’sSeries O Perpetual Non-Cumulative Preferred Stock if theredemption or purchase results in less than $253 millionaggregate liquidation preference outstanding, prior tospecified dates in 2022 for a price that exceeds a maximumamount determined by reference to the net cash proceedsthat the firm has received from the sale of qualifyingsecurities. During 2016, the firm exchanged a par amountof $1.32 billion (of which $672 million was exchanged inthe first quarter of 2016) of APEX issued by the APEXTrusts for a corresponding redemption value of the Series Eand Series F Preferred Stock, which was permitted underthe covenants referenced above.
Junior Subordinated Debt Issued in Connection with
Trust Preferred Securities. Group Inc. issued$2.84 billion of junior subordinated debt in 2004 toGoldman Sachs Capital I (Trust), a Delaware statutorytrust. The Trust issued $2.75 billion of guaranteedpreferred beneficial interests (Trust Preferred Securities) tothird parties and $85 million of common beneficial intereststo Group Inc. and used the proceeds from the issuances topurchase the junior subordinated debt from Group Inc. Asof June 2017, the outstanding par amount of juniorsubordinated debt held by the Trust was $1.31 billion andthe outstanding par amount of Trust Preferred Securitiesand common beneficial interests issued by the Trust was$1.27 billion and $39.3 million, respectively. During thethree and six months ended June 2017, the firm purchased$50 million (par amount) of Trust Preferred Securities anddelivered these securities, along with $1.5 million ofcommon beneficial interests, to the Trust in exchange for acorresponding par amount of the junior subordinated debt.Following the exchanges, these Trust Preferred Securities,common beneficial interests and junior subordinated debtwere extinguished. As of December 2016, the outstandingpar amount of junior subordinated debt held by the Trustwas $1.36 billion and the outstanding par amount of TrustPreferred Securities and common beneficial interests issuedby the Trust was $1.32 billion and $40.8 million,respectively. The Trust is a wholly-owned financesubsidiary of the firm for regulatory and legal purposes butis not consolidated for accounting purposes.
The firm pays interest semi-annually on the juniorsubordinated debt at an annual rate of 6.345% and thedebt matures on February 15, 2034. The coupon rate andthe payment dates applicable to the beneficial interests arethe same as the interest rate and payment dates for thejunior subordinated debt. The firm has the right, from timeto time, to defer payment of interest on the juniorsubordinated debt, and therefore cause payment on theTrust’s preferred beneficial interests to be deferred, in eachcase up to ten consecutive semi-annual periods. During anysuch deferral period, the firm will not be permitted to,among other things, pay dividends on or make certainrepurchases of its common stock. The Trust is notpermitted to pay any distributions on the commonbeneficial interests held by Group Inc. unless all dividendspayable on the preferred beneficial interests have been paidin full.
59 Goldman Sachs June 2017 Form 10-Q

THE GOLDMAN SACHS GROUP, INC. AND SUBSIDIARIES
Notes to Condensed Consolidated Financial Statements(Unaudited)
Note 17.
Other Liabilities and Accrued Expenses
The table below presents other liabilities and accruedexpenses by type.
As of
$ in millionsJune2017
December2016
Compensation and benefits $ 5,008 $ 7,181Noncontrolling interests 522 506Income tax-related liabilities 1,610 1,794Employee interests in consolidated funds 220 77Subordinated liabilities of consolidated VIEs 21 584Accrued expenses and other 4,691 4,220Total $ 12,072 $ 14,362
Note 18.
Commitments, Contingencies and Guarantees
Commitments
The table below presents the firm’s commitments by type.
As of
$ in millionsJune2017
December2016
Commitments to extend creditCommercial lending:
Investment-grade $ 79,092 $ 73,664Non-investment-grade 41,440 34,878
Warehouse financing 4,557 3,514Total commitments to extend credit 125,089 112,056Contingent and forward starting collateralized
agreements 59,795 25,348Forward starting collateralized financings 23,651 8,939Letters of credit 377 373Investment commitments 8,909 8,444Other 5,012 6,014Total commitments $222,833 $161,174
The table below presents the firm’s commitments by periodof expiration.
As of June 2017
$ in millionsRemainder
of 20172018 -
20192020 -
20212022 -
Thereafter
Commitments to extend creditCommercial lending:
Investment-grade $ 5,533 $27,371 $33,318 $12,870
Non-investment-grade 638 7,788 18,130 14,884
Warehouse financing 61 2,167 1,533 796
Total commitments to extendcredit 6,232 37,326 52,981 28,550
Contingent and forward startingcollateralized agreements 59,792 3 — —
Forward starting collateralizedfinancings 23,651 — — —
Letters of credit 131 206 — 40
Investment commitments 6,072 891 112 1,834
Other 4,640 313 16 43
Total commitments $100,518 $38,739 $53,109 $30,467
Commitments to Extend Credit
The firm’s commitments to extend credit are agreements tolend with fixed termination dates and depend on thesatisfaction of all contractual conditions to borrowing.These commitments are presented net of amountssyndicated to third parties. The total commitment amountdoes not necessarily reflect actual future cash flows becausethe firm may syndicate all or substantial additional portionsof these commitments. In addition, commitments canexpire unused or be reduced or cancelled at thecounterparty’s request.
As of June 2017 and December 2016, $110.16 billion and$98.05 billion, respectively, of the firm’s lendingcommitments were held for investment and were accountedfor on an accrual basis. See Note 9 for further informationabout such commitments. In addition, as of June 2017 andDecember 2016, $8.25 billion and $6.87 billion,respectively, of the firm’s lending commitments were heldfor sale and were accounted for at the lower of cost or fairvalue.
The firm accounts for the remaining commitments toextend credit at fair value. Losses, if any, are generallyrecorded, net of any fees in “Other principal transactions.”
Goldman Sachs June 2017 Form 10-Q 60
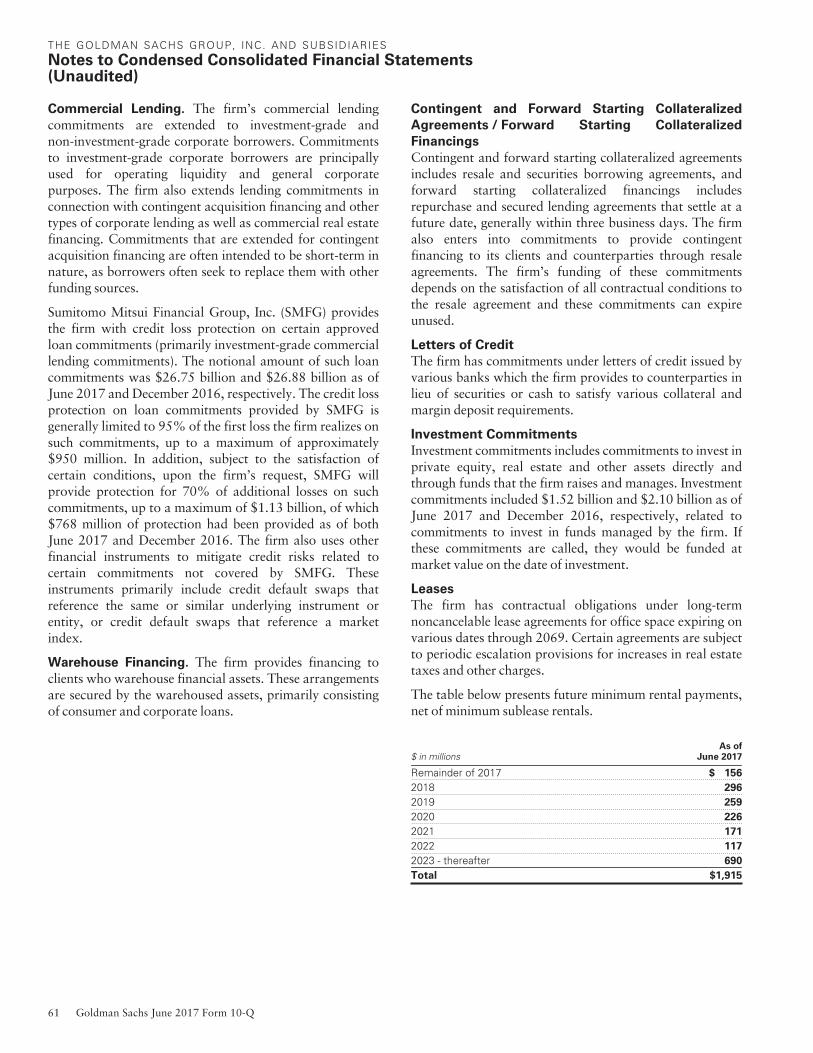
THE GOLDMAN SACHS GROUP, INC. AND SUBSIDIARIES
Notes to Condensed Consolidated Financial Statements(Unaudited)
Commercial Lending. The firm’s commercial lendingcommitments are extended to investment-grade andnon-investment-grade corporate borrowers. Commitmentsto investment-grade corporate borrowers are principallyused for operating liquidity and general corporatepurposes. The firm also extends lending commitments inconnection with contingent acquisition financing and othertypes of corporate lending as well as commercial real estatefinancing. Commitments that are extended for contingentacquisition financing are often intended to be short-term innature, as borrowers often seek to replace them with otherfunding sources.
Sumitomo Mitsui Financial Group, Inc. (SMFG) providesthe firm with credit loss protection on certain approvedloan commitments (primarily investment-grade commerciallending commitments). The notional amount of such loancommitments was $26.75 billion and $26.88 billion as ofJune 2017 and December 2016, respectively. The credit lossprotection on loan commitments provided by SMFG isgenerally limited to 95% of the first loss the firm realizes onsuch commitments, up to a maximum of approximately$950 million. In addition, subject to the satisfaction ofcertain conditions, upon the firm’s request, SMFG willprovide protection for 70% of additional losses on suchcommitments, up to a maximum of $1.13 billion, of which$768 million of protection had been provided as of bothJune 2017 and December 2016. The firm also uses otherfinancial instruments to mitigate credit risks related tocertain commitments not covered by SMFG. Theseinstruments primarily include credit default swaps thatreference the same or similar underlying instrument orentity, or credit default swaps that reference a marketindex.
Warehouse Financing. The firm provides financing toclients who warehouse financial assets. These arrangementsare secured by the warehoused assets, primarily consistingof consumer and corporate loans.
Contingent and Forward Starting Collateralized
Agreements / Forward Starting Collateralized
Financings
Contingent and forward starting collateralized agreementsincludes resale and securities borrowing agreements, andforward starting collateralized financings includesrepurchase and secured lending agreements that settle at afuture date, generally within three business days. The firmalso enters into commitments to provide contingentfinancing to its clients and counterparties through resaleagreements. The firm’s funding of these commitmentsdepends on the satisfaction of all contractual conditions tothe resale agreement and these commitments can expireunused.
Letters of Credit
The firm has commitments under letters of credit issued byvarious banks which the firm provides to counterparties inlieu of securities or cash to satisfy various collateral andmargin deposit requirements.
Investment Commitments
Investment commitments includes commitments to invest inprivate equity, real estate and other assets directly andthrough funds that the firm raises and manages. Investmentcommitments included $1.52 billion and $2.10 billion as ofJune 2017 and December 2016, respectively, related tocommitments to invest in funds managed by the firm. Ifthese commitments are called, they would be funded atmarket value on the date of investment.
Leases
The firm has contractual obligations under long-termnoncancelable lease agreements for office space expiring onvarious dates through 2069. Certain agreements are subjectto periodic escalation provisions for increases in real estatetaxes and other charges.
The table below presents future minimum rental payments,net of minimum sublease rentals.
$ in millionsAs of
June 2017
Remainder of 2017 $ 156
2018 296
2019 259
2020 226
2021 171
2022 117
2023 - thereafter 690
Total $1,915
61 Goldman Sachs June 2017 Form 10-Q

THE GOLDMAN SACHS GROUP, INC. AND SUBSIDIARIES
Notes to Condensed Consolidated Financial Statements(Unaudited)
Rent charged to operating expense was $75 million and$60 million for the three months ended June 2017 andJune 2016, respectively, and $145 million and $122 millionfor the six months ended June 2017 and June 2016,respectively.
Operating leases include office space held in excess ofcurrent requirements. Rent expense relating to space heldfor growth is included in “Occupancy.” The firm records aliability, based on the fair value of the remaining leaserentals reduced by any potential or existing subleaserentals, for leases where the firm has ceased using the spaceand management has concluded that the firm will notderive any future economic benefits. Costs to terminate alease before the end of its term are recognized and measuredat fair value on termination.
Contingencies
Legal Proceedings. See Note 27 for information aboutlegal proceedings, including certain mortgage-relatedmatters, and agreements the firm has entered into to toll thestatute of limitations.
Certain Mortgage-Related Contingencies. There aremultiple areas of focus by regulators, governmentalagencies and others within the mortgage market that mayimpact originators, issuers, servicers and investors. Thereremains significant uncertainty surrounding the nature andextent of any potential exposure for participants in thismarket.
The firm has not been a significant originator of residentialmortgage loans. The firm did purchase loans originated byothers and generally received loan-level representations.During the period 2005 through 2008, the firm soldapproximately $10 billion of loans to government-sponsored enterprises and approximately $11 billion ofloans to other third parties. In addition, the firm transferred$125 billion of loans to trusts and other mortgagesecuritization vehicles. In connection with both sales ofloans and securitizations, the firm provided loan-levelrepresentations and/or assigned the loan-levelrepresentations from the party from whom the firmpurchased the loans.
The firm’s exposure to claims for repurchase of residentialmortgage loans based on alleged breaches ofrepresentations will depend on a number of factors such asthe extent to which these claims are made within the statuteof limitations, taking into consideration the agreements totoll the statute of limitations the firm has entered into withtrustees representing certain trusts. Based upon the largenumber of defaults in residential mortgages, including thosesold or securitized by the firm, there is a potential forrepurchase claims. However, the firm is not in a position tomake a meaningful estimate of that exposure at this time.
Other Contingencies. In connection with the sale ofMetro International Trade Services (Metro), the firmagreed to provide indemnities to the buyer, which primarilyrelate to fundamental representations and warranties, andpotential liabilities for legal or regulatory proceedingsarising out of the conduct of Metro’s business while thefirm owned it.
In connection with the settlement agreement with theResidential Mortgage-Backed Securities Working Group ofthe U.S. Financial Fraud Enforcement Task Force, the firmagreed to provide $1.80 billion in consumer relief in theform of principal forgiveness for underwater homeownersand distressed borrowers; financing for construction,rehabilitation and preservation of affordable housing; andsupport for debt restructuring, foreclosure prevention andhousing quality improvement programs, as well as landbanks.
Guarantees
The table below presents information about certainderivatives that meet the definition of a guarantee, securitieslending indemnifications and certain other guarantees.
$ in millions Derivatives
Securitieslending
indemnifications
Otherfinancial
guarantees
As of June 2017
Carrying Value of Net Liability $ 6,767 $ — $ 51
Maximum Payout/Notional Amount by Period of Expiration
Remainder of 2017 $ 616,936 $37,666 $ 758
2018 - 2019 802,994 — 689
2020 - 2021 103,842 — 2,039
2022 - thereafter 97,421 — 313
Total $1,621,193 $37,666 $3,799
As of December 2016Carrying Value of Net Liability $ 8,873 $ — $ 50Maximum Payout/Notional Amount by Period of Expiration
2017 $ 432,328 $33,403 $1,0642018 - 2019 261,676 — 7632020 - 2021 71,264 — 1,6622022 - thereafter 51,506 — 173Total $ 816,774 $33,403 $3,662
In the table above:
‰ The maximum payout is based on the notional amount ofthe contract and does not represent anticipated losses.
‰ Amounts exclude certain commitments to issue standbyletters of credit that are included in “Commitments toextend credit.” See the tables in “Commitments” abovefor a summary of the firm’s commitments.
Goldman Sachs June 2017 Form 10-Q 62
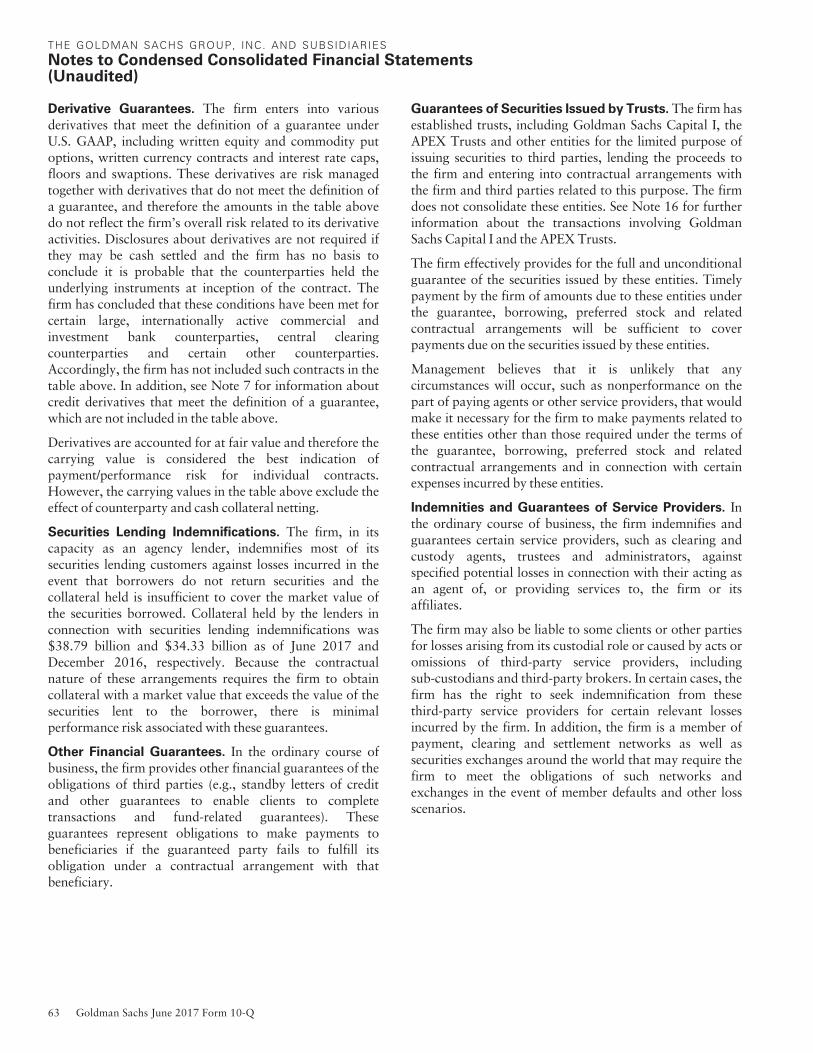
THE GOLDMAN SACHS GROUP, INC. AND SUBSIDIARIES
Notes to Condensed Consolidated Financial Statements(Unaudited)
Derivative Guarantees. The firm enters into variousderivatives that meet the definition of a guarantee underU.S. GAAP, including written equity and commodity putoptions, written currency contracts and interest rate caps,floors and swaptions. These derivatives are risk managedtogether with derivatives that do not meet the definition ofa guarantee, and therefore the amounts in the table abovedo not reflect the firm’s overall risk related to its derivativeactivities. Disclosures about derivatives are not required ifthey may be cash settled and the firm has no basis toconclude it is probable that the counterparties held theunderlying instruments at inception of the contract. Thefirm has concluded that these conditions have been met forcertain large, internationally active commercial andinvestment bank counterparties, central clearingcounterparties and certain other counterparties.Accordingly, the firm has not included such contracts in thetable above. In addition, see Note 7 for information aboutcredit derivatives that meet the definition of a guarantee,which are not included in the table above.
Derivatives are accounted for at fair value and therefore thecarrying value is considered the best indication ofpayment/performance risk for individual contracts.However, the carrying values in the table above exclude theeffect of counterparty and cash collateral netting.
Securities Lending Indemnifications. The firm, in itscapacity as an agency lender, indemnifies most of itssecurities lending customers against losses incurred in theevent that borrowers do not return securities and thecollateral held is insufficient to cover the market value ofthe securities borrowed. Collateral held by the lenders inconnection with securities lending indemnifications was$38.79 billion and $34.33 billion as of June 2017 andDecember 2016, respectively. Because the contractualnature of these arrangements requires the firm to obtaincollateral with a market value that exceeds the value of thesecurities lent to the borrower, there is minimalperformance risk associated with these guarantees.
Other Financial Guarantees. In the ordinary course ofbusiness, the firm provides other financial guarantees of theobligations of third parties (e.g., standby letters of creditand other guarantees to enable clients to completetransactions and fund-related guarantees). Theseguarantees represent obligations to make payments tobeneficiaries if the guaranteed party fails to fulfill itsobligation under a contractual arrangement with thatbeneficiary.
Guarantees of Securities Issued by Trusts. The firm hasestablished trusts, including Goldman Sachs Capital I, theAPEX Trusts and other entities for the limited purpose ofissuing securities to third parties, lending the proceeds tothe firm and entering into contractual arrangements withthe firm and third parties related to this purpose. The firmdoes not consolidate these entities. See Note 16 for furtherinformation about the transactions involving GoldmanSachs Capital I and the APEX Trusts.
The firm effectively provides for the full and unconditionalguarantee of the securities issued by these entities. Timelypayment by the firm of amounts due to these entities underthe guarantee, borrowing, preferred stock and relatedcontractual arrangements will be sufficient to coverpayments due on the securities issued by these entities.
Management believes that it is unlikely that anycircumstances will occur, such as nonperformance on thepart of paying agents or other service providers, that wouldmake it necessary for the firm to make payments related tothese entities other than those required under the terms ofthe guarantee, borrowing, preferred stock and relatedcontractual arrangements and in connection with certainexpenses incurred by these entities.
Indemnities and Guarantees of Service Providers. Inthe ordinary course of business, the firm indemnifies andguarantees certain service providers, such as clearing andcustody agents, trustees and administrators, againstspecified potential losses in connection with their acting asan agent of, or providing services to, the firm or itsaffiliates.
The firm may also be liable to some clients or other partiesfor losses arising from its custodial role or caused by acts oromissions of third-party service providers, includingsub-custodians and third-party brokers. In certain cases, thefirm has the right to seek indemnification from thesethird-party service providers for certain relevant lossesincurred by the firm. In addition, the firm is a member ofpayment, clearing and settlement networks as well assecurities exchanges around the world that may require thefirm to meet the obligations of such networks andexchanges in the event of member defaults and other lossscenarios.
63 Goldman Sachs June 2017 Form 10-Q

THE GOLDMAN SACHS GROUP, INC. AND SUBSIDIARIES
Notes to Condensed Consolidated Financial Statements(Unaudited)
In connection with the firm’s prime brokerage and clearingbusinesses, the firm agrees to clear and settle on behalf of itsclients the transactions entered into by them with otherbrokerage firms. The firm’s obligations in respect of suchtransactions are secured by the assets in the client’s accountas well as any proceeds received from the transactionscleared and settled by the firm on behalf of the client. Inconnection with joint venture investments, the firm mayissue loan guarantees under which it may be liable in theevent of fraud, misappropriation, environmental liabilitiesand certain other matters involving the borrower.
The firm is unable to develop an estimate of the maximumpayout under these guarantees and indemnifications.However, management believes that it is unlikely the firmwill have to make any material payments under thesearrangements, and no material liabilities related to theseguarantees and indemnifications have been recognized inthe condensed consolidated statements of financialcondition as of June 2017 and December 2016.
Other Representations, Warranties and
Indemnifications. The firm provides representations andwarranties to counterparties in connection with a variety ofcommercial transactions and occasionally indemnifies themagainst potential losses caused by the breach of thoserepresentations and warranties. The firm may also provideindemnifications protecting against changes in or adverseapplication of certain U.S. tax laws in connection withordinary-course transactions such as securities issuances,borrowings or derivatives.
In addition, the firm may provide indemnifications to somecounterparties to protect them in the event additional taxesare owed or payments are withheld, due either to a changein or an adverse application of certain non-U.S. tax laws.
These indemnifications generally are standard contractualterms and are entered into in the ordinary course ofbusiness. Generally, there are no stated or notionalamounts included in these indemnifications, and thecontingencies triggering the obligation to indemnify are notexpected to occur. The firm is unable to develop an estimateof the maximum payout under these guarantees andindemnifications. However, management believes that it isunlikely the firm will have to make any material paymentsunder these arrangements, and no material liabilities relatedto these arrangements have been recognized in thecondensed consolidated statements of financial condition asof June 2017 and December 2016.
Guarantees of Subsidiaries. Group Inc. fully andunconditionally guarantees the securities issued by GSFinance Corp., a wholly-owned finance subsidiary of thefirm. Group Inc. has guaranteed the payment obligations ofGoldman Sachs & Co. LLC (GS&Co.) and GS Bank USA,subject to certain exceptions.
In addition, Group Inc. guarantees many of the obligationsof its other consolidated subsidiaries on atransaction-by-transaction basis, as negotiated withcounterparties. Group Inc. is unable to develop an estimateof the maximum payout under its subsidiary guarantees;however, because these guaranteed obligations are alsoobligations of consolidated subsidiaries, Group Inc.’sliabilities as guarantor are not separately disclosed.
Note 19.
Shareholders’ Equity
Common Equity
On July 17, 2017, the Board of Directors of Group Inc.(Board) declared a dividend of $0.75 per common share tobe paid on September 28, 2017 to common shareholders ofrecord on August 31, 2017.
The firm’s share repurchase program is intended to helpmaintain the appropriate level of common equity. Theshare repurchase program is effected primarily throughregular open-market purchases (which may includerepurchase plans designed to comply with Rule 10b5-1),the amounts and timing of which are determined primarilyby the firm’s current and projected capital position, butwhich may also be influenced by general market conditionsand the prevailing price and trading volumes of the firm’scommon stock. Prior to repurchasing common stock, thefirm must receive confirmation that the Federal ReserveBoard does not object to such capital action.
The table below presents the amount of common stockrepurchased by the firm under the share repurchaseprogram.
June 2017
in millions, except per share amountsThree Months
EndedSix Months
Ended
Common share repurchases 6.6 12.8
Average cost per share $221.92 $232.21
Total cost of common share repurchases $ 1,466 $ 2,966
Goldman Sachs June 2017 Form 10-Q 64

THE GOLDMAN SACHS GROUP, INC. AND SUBSIDIARIES
Notes to Condensed Consolidated Financial Statements(Unaudited)
Pursuant to the terms of certain share-based compensationplans, employees may remit shares to the firm or the firmmay cancel RSUs or stock options to satisfy minimumstatutory employee tax withholding requirements and theexercise price of stock options. Under these plans, duringthe six months ended June 2017, 12,165 shares wereremitted with a total value of $3 million, and the firmcancelled 5.7 million of RSUs with a total value of$1.32 billion and 2.7 million of stock options with a totalvalue of $647 million.
Preferred Equity
The tables below present details about the perpetualpreferred stock issued and outstanding as of June 2017.
SeriesShares
AuthorizedSharesIssued
SharesOutstanding
Depositary SharesPer Share
A 50,000 30,000 29,999 1,000B 50,000 32,000 32,000 1,000C 25,000 8,000 8,000 1,000D 60,000 54,000 53,999 1,000E 17,500 7,667 7,667 N/AF 5,000 1,615 1,615 N/AI 34,500 34,000 34,000 1,000J 46,000 40,000 40,000 1,000K 32,200 28,000 28,000 1,000L 52,000 52,000 52,000 25M 80,000 80,000 80,000 25N 31,050 27,000 27,000 1,000O 26,000 26,000 26,000 25Total 509,250 420,282 420,280
Series Earliest Redemption DateLiquidationPreference
RedemptionValue
($ in millions)
A Currently redeemable $ 25,000 $ 750
B Currently redeemable $ 25,000 800
C Currently redeemable $ 25,000 200
D Currently redeemable $ 25,000 1,350
E Currently redeemable $100,000 767
F Currently redeemable $100,000 161
I November 10, 2017 $ 25,000 850
J May 10, 2023 $ 25,000 1,000
K May 10, 2024 $ 25,000 700
L May 10, 2019 $ 25,000 1,300
M May 10, 2020 $ 25,000 2,000
N May 10, 2021 $ 25,000 675
O November 10, 2026 $ 25,000 650
Total $11,203
In the tables above:
‰ All shares have a par value of $0.01 per share and, whereapplicable, each share is represented by the specifiednumber of depositary shares.
‰ The earliest redemption date represents the date on whicheach share of non-cumulative Preferred Stock isredeemable at the firm’s option.
‰ Prior to redeeming preferred stock, the firm must receiveconfirmation that the Federal Reserve Board does notobject to such capital action.
‰ The redemption price per share for Series A through FPreferred Stock is the liquidation preference plus declaredand unpaid dividends. The redemption price per share forSeries I through O Preferred Stock is the liquidationpreference plus accrued and unpaid dividends. Each shareof non-cumulative Series E and Series F Preferred Stockissued and outstanding is redeemable at the firm’s option,subject to certain covenant restrictions governing thefirm’s ability to redeem the preferred stock withoutissuing common stock or other instruments withequity-like characteristics. See Note 16 for informationabout the replacement capital covenants applicable to theSeries E and Series F Preferred Stock.
‰ All series of preferred stock are pari passu and have apreference over the firm’s common stock on liquidation.
‰ Dividends on each series of preferred stock, excludingSeries L, Series M and Series O Preferred Stock, ifdeclared, are payable quarterly in arrears. Dividends onSeries L, Series M and Series O Preferred Stock, ifdeclared, are payable semi-annually in arrears from theissuance date to, but excluding, May 10, 2019,May 10, 2020 and November 10, 2026, respectively, andquarterly thereafter.
‰ The firm’s ability to declare or pay dividends on, orpurchase, redeem or otherwise acquire, its common stockis subject to certain restrictions in the event that the firmfails to pay or set aside full dividends on the preferredstock for the latest completed dividend period.
65 Goldman Sachs June 2017 Form 10-Q
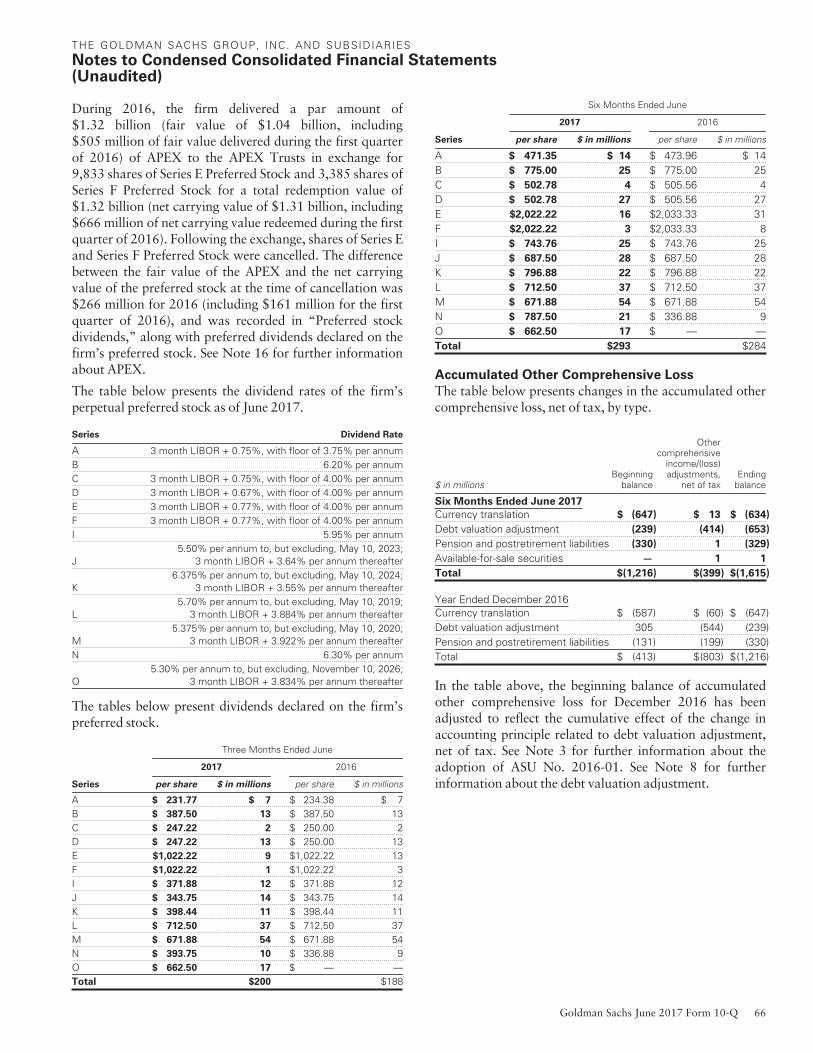
THE GOLDMAN SACHS GROUP, INC. AND SUBSIDIARIES
Notes to Condensed Consolidated Financial Statements(Unaudited)
During 2016, the firm delivered a par amount of$1.32 billion (fair value of $1.04 billion, including$505 million of fair value delivered during the first quarterof 2016) of APEX to the APEX Trusts in exchange for9,833 shares of Series E Preferred Stock and 3,385 shares ofSeries F Preferred Stock for a total redemption value of$1.32 billion (net carrying value of $1.31 billion, including$666 million of net carrying value redeemed during the firstquarter of 2016). Following the exchange, shares of Series Eand Series F Preferred Stock were cancelled. The differencebetween the fair value of the APEX and the net carryingvalue of the preferred stock at the time of cancellation was$266 million for 2016 (including $161 million for the firstquarter of 2016), and was recorded in “Preferred stockdividends,” along with preferred dividends declared on thefirm’s preferred stock. See Note 16 for further informationabout APEX.
The table below presents the dividend rates of the firm’sperpetual preferred stock as of June 2017.
Series Dividend Rate
A 3 month LIBOR + 0.75%, with floor of 3.75% per annumB 6.20% per annumC 3 month LIBOR + 0.75%, with floor of 4.00% per annumD 3 month LIBOR + 0.67%, with floor of 4.00% per annumE 3 month LIBOR + 0.77%, with floor of 4.00% per annumF 3 month LIBOR + 0.77%, with floor of 4.00% per annumI 5.95% per annum
J5.50% per annum to, but excluding, May 10, 2023;
3 month LIBOR + 3.64% per annum thereafter
K6.375% per annum to, but excluding, May 10, 2024;
3 month LIBOR + 3.55% per annum thereafter
L5.70% per annum to, but excluding, May 10, 2019;
3 month LIBOR + 3.884% per annum thereafter
M5.375% per annum to, but excluding, May 10, 2020;
3 month LIBOR + 3.922% per annum thereafterN 6.30% per annum
O5.30% per annum to, but excluding, November 10, 2026;
3 month LIBOR + 3.834% per annum thereafter
The tables below present dividends declared on the firm’spreferred stock.
Three Months Ended June
2017 2016
Series per share $ in millions per share $ in millions
A $ 231.77 $ 7 $ 234.38 $ 7B $ 387.50 13 $ 387.50 13C $ 247.22 2 $ 250.00 2D $ 247.22 13 $ 250.00 13E $1,022.22 9 $1,022.22 13F $1,022.22 1 $1,022.22 3I $ 371.88 12 $ 371.88 12J $ 343.75 14 $ 343.75 14K $ 398.44 11 $ 398.44 11L $ 712.50 37 $ 712.50 37M $ 671.88 54 $ 671.88 54N $ 393.75 10 $ 336.88 9O $ 662.50 17 $ — —Total $200 $188
Six Months Ended June
2017 2016
Series per share $ in millions per share $ in millions
A $ 471.35 $ 14 $ 473.96 $ 14B $ 775.00 25 $ 775.00 25C $ 502.78 4 $ 505.56 4D $ 502.78 27 $ 505.56 27E $2,022.22 16 $2,033.33 31F $2,022.22 3 $2,033.33 8I $ 743.76 25 $ 743.76 25J $ 687.50 28 $ 687.50 28K $ 796.88 22 $ 796.88 22L $ 712.50 37 $ 712.50 37M $ 671.88 54 $ 671.88 54N $ 787.50 21 $ 336.88 9O $ 662.50 17 $ — —Total $293 $284
Accumulated Other Comprehensive Loss
The table below presents changes in the accumulated othercomprehensive loss, net of tax, by type.
$ in millionsBeginning
balance
Othercomprehensive
income/(loss)adjustments,
net of taxEnding
balance
Six Months Ended June 2017
Currency translation $ (647) $ 13 $ (634)
Debt valuation adjustment (239) (414) (653)
Pension and postretirement liabilities (330) 1 (329)
Available-for-sale securities — 1 1
Total $(1,216) $(399) $(1,615)
Year Ended December 2016Currency translation $ (587) $ (60) $ (647)Debt valuation adjustment 305 (544) (239)Pension and postretirement liabilities (131) (199) (330)Total $ (413) $(803) $(1,216)
In the table above, the beginning balance of accumulatedother comprehensive loss for December 2016 has beenadjusted to reflect the cumulative effect of the change inaccounting principle related to debt valuation adjustment,net of tax. See Note 3 for further information about theadoption of ASU No. 2016-01. See Note 8 for furtherinformation about the debt valuation adjustment.
Goldman Sachs June 2017 Form 10-Q 66

THE GOLDMAN SACHS GROUP, INC. AND SUBSIDIARIES
Notes to Condensed Consolidated Financial Statements(Unaudited)
Note 20.
Regulation and Capital Adequacy
The Federal Reserve Board is the primary regulator ofGroup Inc., a bank holding company under the BankHolding Company Act of 1956 and a financial holdingcompany under amendments to this Act. As a bank holdingcompany, the firm is subject to consolidated regulatorycapital requirements which are calculated in accordancewith the revised risk-based capital and leverage regulationsof the Federal Reserve Board, subject to certain transitionalprovisions (Revised Capital Framework).
The risk-based capital requirements are expressed as capitalratios that compare measures of regulatory capital to risk-weighted assets (RWAs). Failure to comply with thesecapital requirements could result in restrictions beingimposed by the firm’s regulators. The firm’s capital levelsare also subject to qualitative judgments by the regulatorsabout components of capital, risk weightings and otherfactors. Furthermore, certain of the firm’s subsidiaries aresubject to separate regulations and capital requirements asdescribed below.
Capital Framework
The regulations under the Revised Capital Framework arelargely based on the Basel Committee on BankingSupervision’s (Basel Committee) capital framework forstrengthening international capital standards (Basel III) andalso implement certain provisions of the Dodd-Frank Act.Under the Revised Capital Framework, the firm is an“Advanced approach” banking organization.
The firm calculates its Common Equity Tier 1 (CET1),Tier 1 capital and Total capital ratios in accordance with(i) the Standardized approach and market risk rules set outin the Revised Capital Framework (together, theStandardized Capital Rules) and (ii) the Advancedapproach and market risk rules set out in the RevisedCapital Framework (together, the Basel III AdvancedRules). The lower of each ratio calculated in (i) and (ii) isthe ratio against which the firm’s compliance with itsminimum ratio requirements is assessed. Each of the ratioscalculated in accordance with the Basel III Advanced Ruleswas lower than that calculated in accordance with theStandardized Capital Rules and therefore the Basel IIIAdvanced ratios were the ratios that applied to the firm asof June 2017 and December 2016. The capital ratios thatapply to the firm can change in future reporting periods as aresult of these regulatory requirements.
Regulatory Capital and Capital Ratios. The table belowpresents the minimum ratios required for the firm.
As of
June2017
December2016
CET1 ratio 7.000% 5.875%Tier 1 capital ratio 8.500% 7.375%Total capital ratio 10.500% 9.375%Tier 1 leverage ratio 4.000% 4.000%
In the table above:
‰ The minimum capital ratios as of June 2017 reflect (i) the50% phase-in of the capital conservation buffer of 2.5%,(ii) the 50% phase-in of the Global SystemicallyImportant Bank (G-SIB) buffer of 2.5% (based on 2015financial data), and (iii) the countercyclical capital bufferof zero percent, each described below.
‰ The minimum capital ratios as of December 2016 reflect(i) the 25% phase-in of the capital conservation buffer of2.5%, (ii) the 25% phase-in of the G-SIB buffer of 3%(based on 2014 financial data), and (iii) thecountercyclical capital buffer of zero percent, eachdescribed below.
‰ Tier 1 leverage ratio is defined as Tier 1 capital divided byquarterly average adjusted total assets (which includesadjustments for goodwill and identifiable intangibleassets, and certain investments in nonconsolidatedfinancial institutions).
Certain aspects of the Revised Capital Framework’srequirements phase in over time (transitional provisions).These include capital buffers and certain deductions fromregulatory capital (such as investments in nonconsolidatedfinancial institutions). These deductions from regulatorycapital are required to be phased in ratably per year from2014 to 2018, with residual amounts not deducted duringthe transitional period subject to risk weighting. Inaddition, junior subordinated debt issued to trusts is beingphased out of regulatory capital. The minimum CET1,Tier 1 and Total capital ratios that apply to the firm willincrease as the capital buffers are phased in.
The capital conservation buffer, which consists entirely ofcapital that qualifies as CET1, began to phase in onJanuary 1, 2016 and will continue to do so in increments of0.625% per year until it reaches 2.5% of RWAs onJanuary 1, 2019.
67 Goldman Sachs June 2017 Form 10-Q

THE GOLDMAN SACHS GROUP, INC. AND SUBSIDIARIES
Notes to Condensed Consolidated Financial Statements(Unaudited)
The G-SIB buffer, which is an extension of the capitalconservation buffer, phases in ratably, beginning onJanuary 1, 2016, becoming fully effective onJanuary 1, 2019, and must consist entirely of capital thatqualifies as CET1. The buffer must be calculated using twomethodologies, the higher of which is reflected in the firm’sminimum risk-based capital ratios. The first calculation isbased upon the Basel Committee’s methodology which,among other factors, relies upon measures of the size,activity and complexity of each G-SIB. The secondcalculation uses similar inputs, but it includes a measure ofreliance on short-term wholesale funding. The firm’s G-SIBbuffer will be updated annually based on financial datafrom the prior year, and will be generally applicable for thefollowing year.
The Revised Capital Framework also provides for acountercyclical capital buffer, which is an extension of thecapital conservation buffer, of up to 2.5% (consistingentirely of CET1) intended to counteract systemicvulnerabilities. As of June 2017, the Federal Reserve Boardhas set the countercyclical capital buffer at zero percent.
Failure to meet the capital levels inclusive of the bufferscould limit the firm’s ability to distribute capital, includingshare repurchases and dividend payments, and to makecertain discretionary compensation payments.
Definition of Risk-Weighted Assets. RWAs are calculatedin accordance with both the Standardized Capital Rules andthe Basel III Advanced Rules. The following is a comparisonof RWA calculations under these rules:
‰ RWAs for credit risk in accordance with the StandardizedCapital Rules are calculated in a different manner thanthe Basel III Advanced Rules. The primary difference isthat the Standardized Capital Rules do not contemplatethe use of internal models to compute exposure for creditrisk on derivatives and securities financing transactions,whereas the Basel III Advanced Rules permit the use ofsuch models, subject to supervisory approval. In addition,credit RWAs calculated in accordance with theStandardized Capital Rules utilize prescribed risk-weightswhich depend largely on the type of counterparty, ratherthan on internal assessments of the creditworthiness ofsuch counterparties;
‰ RWAs for market risk in accordance with theStandardized Capital Rules and the Basel III AdvancedRules are generally consistent; and
‰ RWAs for operational risk are not required by theStandardized Capital Rules, whereas the Basel IIIAdvanced Rules do include such a requirement.
Credit Risk
Credit RWAs are calculated based upon measures ofexposure, which are then risk weighted. The following is adescription of the calculation of credit RWAs in accordancewith the Standardized Capital Rules and the Basel IIIAdvanced Rules:
‰ For credit RWAs calculated in accordance with theStandardized Capital Rules, the firm utilizes prescribedrisk-weights which depend largely on the type ofcounterparty (e.g., whether the counterparty is asovereign, bank, broker-dealer or other entity). Theexposure measure for derivatives is based on acombination of positive net current exposure and apercentage of the notional amount of each derivative. Theexposure measure for securities financing transactions iscalculated to reflect adjustments for potential pricevolatility, the size of which depends on factors such as thetype and maturity of the security, and whether it isdenominated in the same currency as the other side of thefinancing transaction. The firm utilizes specific requiredformulaic approaches to measure exposure forsecuritizations and equities; and
‰ For credit RWAs calculated in accordance with theBasel III Advanced Rules, the firm has been givenpermission by its regulators to compute risk-weights forwholesale and retail credit exposures in accordance withthe Advanced Internal Ratings-Based approach. Thisapproach is based on internal assessments of thecreditworthiness of counterparties, with key inputs beingthe probability of default, loss given default and theeffective maturity. The firm utilizes internal models tomeasure exposure for derivatives, securities financingtransactions and eligible margin loans. The RevisedCapital Framework requires that a bank holdingcompany obtain prior written agreement from itsregulators before using internal models for such purposes.The firm utilizes specific required formulaic approachesto measure exposure for securitizations and equities.
Goldman Sachs June 2017 Form 10-Q 68

THE GOLDMAN SACHS GROUP, INC. AND SUBSIDIARIES
Notes to Condensed Consolidated Financial Statements(Unaudited)
Market Risk
Market RWAs are calculated based on measures ofexposure which include Value-at-Risk (VaR), stressed VaR,incremental risk and comprehensive risk based on internalmodels, and a standardized measurement method forspecific risk. The market risk regulatory capital rulesrequire that a bank holding company obtain prior writtenagreement from its regulators before using any internalmodel to calculate its risk-based capital requirement. Thefollowing is further information regarding the measures ofexposure for market RWAs calculated in accordance withthe Standardized Capital Rules and Basel III AdvancedRules:
‰ VaR is the potential loss in value of inventory positions,as well as certain other financial assets and financialliabilities, due to adverse market movements over adefined time horizon with a specified confidence level. Forboth risk management purposes and regulatory capitalcalculations the firm uses a single VaR model whichcaptures risks including those related to interest rates,equity prices, currency rates and commodity prices.However, VaR used for regulatory capital requirements(regulatory VaR) differs from risk management VaR dueto different time horizons and confidence levels (10-dayand 99% for regulatory VaR vs. one-day and 95% forrisk management VaR), as well as differences in the scopeof positions on which VaR is calculated. In addition, thedaily net revenues used to determine risk managementVaR exceptions (i.e., comparing the daily net revenues tothe VaR measure calculated as of the end of the priorbusiness day) include intraday activity, whereas theFederal Reserve Board’s regulatory capital rules requirethat intraday activity be excluded from daily net revenueswhen calculating regulatory VaR exceptions. Intradayactivity includes bid/offer net revenues, which are morelikely than not to be positive by their nature. As a result,there may be differences in the number of VaR exceptionsand the amount of daily net revenues calculated forregulatory VaR compared to the amounts calculated forrisk management VaR. The firm’s positional lossesobserved on a single day did not exceed its 99% one-dayregulatory VaR during the six months ended June 2017and exceeded its 99% one-day regulatory VaR on twooccasions during the year ended December 2016. Therewas no change in the VaR multiplier used to calculateMarket RWAs;
‰ Stressed VaR is the potential loss in value of inventorypositions, as well as certain other financial assets andfinancial liabilities, during a period of significant marketstress;
‰ Incremental risk is the potential loss in value ofnon-securitized inventory positions due to the default orcredit migration of issuers of financial instruments over aone-year time horizon;
‰ Comprehensive risk is the potential loss in value, due toprice risk and defaults, within the firm’s credit correlationpositions; and
‰ Specific risk is the risk of loss on a position that couldresult from factors other than broad market movements,including event risk, default risk and idiosyncratic risk.The standardized measurement method is used todetermine specific risk RWAs, by applying supervisorydefined risk-weighting factors after applicable netting isperformed.
Operational Risk
Operational RWAs are only required to be included underthe Basel III Advanced Rules. The firm has been givenpermission by its regulators to calculate operational RWAsin accordance with the “Advanced MeasurementApproach,” and therefore utilizes an internal risk-basedmodel to quantify Operational RWAs.
Consolidated Regulatory Capital Ratios
Capital Ratios and RWAs. Each of the ratios calculated inaccordance with the Basel III Advanced Rules was lowerthan that calculated in accordance with the StandardizedRules as of June 2017 and December 2016, and thereforesuch lower ratios applied to the firm as of these dates.
69 Goldman Sachs June 2017 Form 10-Q

THE GOLDMAN SACHS GROUP, INC. AND SUBSIDIARIES
Notes to Condensed Consolidated Financial Statements(Unaudited)
The table below presents the ratios calculated in accordancewith both the Standardized and Basel III Advanced Rules.
As of
$ in millionsJune2017
December2016
Common shareholders’ equity $ 75,472 $ 75,690Deductions for goodwill and identifiable intangible
assets, net of deferred tax liabilities (2,943) (2,874)Deductions for investments in nonconsolidated
financial institutions — (424)Other adjustments (361) (346)Common Equity Tier 1 72,168 72,046Preferred stock 11,203 11,203Deduction for investments in covered funds (242) (445)Other adjustments (128) (364)Tier 1 capital $ 83,001 $ 82,440
Standardized Tier 2 and Total capital
Tier 1 capital $ 83,001 $ 82,440Qualifying subordinated debt 13,514 14,566Junior subordinated debt issued to trusts 635 792Allowance for losses on loans and lending
commitments 976 722Other adjustments (27) (6)Standardized Tier 2 capital 15,098 16,074Standardized Total capital $ 98,099 $ 98,514
Basel III Advanced Tier 2 and Total capital
Tier 1 capital $ 83,001 $ 82,440Standardized Tier 2 capital 15,098 16,074Allowance for losses on loans and lending
commitments (976) (722)Basel III Advanced Tier 2 capital 14,122 15,352Basel III Advanced Total capital $ 97,123 $ 97,792
RWAs
Standardized $521,043 $496,676Basel III Advanced $575,762 $549,650
CET1 ratio
Standardized 13.9% 14.5%Basel III Advanced 12.5% 13.1%
Tier 1 capital ratio
Standardized 15.9% 16.6%Basel III Advanced 14.4% 15.0%
Total capital ratio
Standardized 18.8% 19.8%Basel III Advanced 16.9% 17.8%
Tier 1 leverage ratio 9.3% 9.4%
In the table above:
‰ Deductions for goodwill and identifiable intangibleassets, net of deferred tax liabilities, includes goodwill of$3.67 billion as of both June 2017 and December 2016,and identifiable intangible assets of $330 million (80% of$412 million) and $257 million (60% of $429 million) asof June 2017 and December 2016, respectively, net ofassociated deferred tax liabilities of $1.06 billion and$1.05 billion as of June 2017 and December 2016,respectively. Goodwill is fully deducted from CET1,while the deduction for identifiable intangible assets isrequired to be phased into CET1 ratably over five yearsfrom 2014 to 2018. The balance that is not deductedduring the transitional period is risk weighted.
‰ Deductions for investments in nonconsolidated financialinstitutions represents the amount by which the firm’sinvestments in the capital of nonconsolidated financialinstitutions exceed certain prescribed thresholds. Thededuction for such investments is required to be phasedinto CET1 ratably over five years from 2014 to 2018. Asof June 2017 and December 2016, CET1 reflects 80%and 60% of the deduction, respectively. The balance thatis not deducted during the transitional period is riskweighted.
‰ Deductions for investments in covered funds representsthe firm’s aggregate investments in applicable coveredfunds, as permitted by the Volcker Rule, that werepurchased after December 2013. Substantially all of theseinvestments in covered funds were purchased inconnection with the firm’s market-making activities. Thisdeduction was not subject to a transition period. SeeNote 6 for further information about the Volcker Rule.
‰ Other adjustments within CET1 and Tier 1 capitalprimarily includes accumulated other comprehensive loss,credit valuation adjustments on derivative liabilities, theoverfunded portion of the firm’s defined benefit pensionplan obligation net of associated deferred tax liabilities,disallowed deferred tax assets and other required creditrisk-based deductions. The deductions for such items aregenerally required to be phased into CET1 ratably overfive years from 2014 to 2018. As of June 2017 andDecember 2016, CET1 reflects 80% and 60% of suchdeductions, respectively. The balance that is not deductedfrom CET1 during the transitional period is generallydeducted from Tier 1 capital within other adjustments.
‰ As of June 2017, junior subordinated debt issued to trustswas fully phased out of Tier 1 capital, with 50% includedin Tier 2 capital and 50% fully phased out of regulatorycapital. As of December 2016, junior subordinated debtissued to trusts was fully phased out of Tier 1 capital,with 60% included in Tier 2 capital and 40% fullyphased out of regulatory capital. Junior subordinateddebt issued to trusts is reduced by the amount of trustpreferred securities purchased by the firm and will be fullyphased out of Tier 2 capital by 2022 at a rate of 10% peryear. See Note 16 for additional information about thefirm’s junior subordinated debt issued to trusts and trustpreferred securities purchased by the firm.
‰ Qualifying subordinated debt is subordinated debt issuedby Group Inc. with an original maturity of five years orgreater. The outstanding amount of subordinated debtqualifying for Tier 2 capital is reduced upon reaching aremaining maturity of five years. See Note 16 foradditional information about the firm’s subordinateddebt.
Goldman Sachs June 2017 Form 10-Q 70

THE GOLDMAN SACHS GROUP, INC. AND SUBSIDIARIES
Notes to Condensed Consolidated Financial Statements(Unaudited)
The tables below present changes in CET1, Tier 1 capitaland Tier 2 capital.
Six Months EndedJune 2017
$ in millions StandardizedBasel III
Advanced
Common Equity Tier 1
Beginning balance $72,046 $72,046
Change in common shareholders’ equity (218) (218)
Change in deductions for:Transitional provisions (426) (426)
Goodwill and identifiable intangibleassets, net of deferred tax liabilities 2 2
Investments in nonconsolidatedfinancial institutions 586 586
Change in other adjustments 178 178
Ending balance $72,168 $72,168
Tier 1 capital
Beginning balance $82,440 $82,440
Change in deductions for:Transitional provisions (274) (274)
Investments in covered funds 203 203
Other net increase in CET1 548 548
Change in other adjustments 84 84
Ending balance 83,001 83,001
Tier 2 capital
Beginning balance 16,074 15,352
Change in qualifying subordinated debt (1,052) (1,052)
Redesignation of junior subordinated debtissued to trusts (157) (157)
Change in the allowance for losses on loansand lending commitments 254 —
Change in other adjustments (21) (21)
Ending balance 15,098 14,122
Total capital $98,099 $97,123
Year EndedDecember 2016
$ in millions StandardizedBasel III
Advanced
Common Equity Tier 1
Beginning balance $71,363 $71,363Change in common shareholders’ equity 162 162Change in deductions for:
Transitional provisions (839) (839)Goodwill and identifiable intangible
assets, net of deferred tax liabilities 16 16Investments in nonconsolidated financial
institutions 895 895Change in other adjustments 449 449Ending balance $72,046 $72,046Tier 1 capital
Beginning balance $81,511 $81,511Change in deductions for:
Transitional provisions (558) (558)Investments in covered funds (32) (32)
Other net increase in CET1 1,522 1,522Redesignation of junior subordinated debt
issued to trusts (330) (330)Change in preferred stock 3 3Change in other adjustments 324 324Ending balance 82,440 82,440Tier 2 capital
Beginning balance 16,705 16,103Change in qualifying subordinated debt (566) (566)Redesignation of junior subordinated debt
issued to trusts (198) (198)Change in the allowance for losses on loans
and lending commitments 120 —Change in other adjustments 13 13Ending balance 16,074 15,352Total capital $98,514 $97,792
In the tables above, the change in deductions fortransitional provisions represent the increased phase-in ofdeductions from 60% to 80% (effective January 1, 2017)for the six months ended June 2017 and from 40% to 60%(effective January 1, 2016) for the year endedDecember 2016.
71 Goldman Sachs June 2017 Form 10-Q

THE GOLDMAN SACHS GROUP, INC. AND SUBSIDIARIES
Notes to Condensed Consolidated Financial Statements(Unaudited)
The tables below present the components of RWAscalculated in accordance with the Standardized andBasel III Advanced Rules.
Standardized Capital Rules as of
$ in millionsJune2017
December2016
Credit RWAs
Derivatives $122,820 $124,286Commitments, guarantees and loans 123,003 115,744Securities financing transactions 79,306 71,319Equity investments 44,868 41,428Other 66,782 58,636Total Credit RWAs 436,779 411,413Market RWAs
Regulatory VaR 7,650 9,750Stressed VaR 24,888 22,475Incremental risk 9,825 7,875Comprehensive risk 4,075 5,338Specific risk 37,826 39,825Total Market RWAs 84,264 85,263Total RWAs $521,043 $496,676
Basel III Advanced Rules as of
$ in millionsJune2017
December2016
Credit RWAs
Derivatives $ 96,880 $105,096Commitments, guarantees and loans 138,499 122,792Securities financing transactions 21,499 14,673Equity investments 48,006 44,095Other 71,964 63,431Total Credit RWAs 376,848 350,087Market RWAs
Regulatory VaR 7,650 9,750Stressed VaR 24,888 22,475Incremental risk 9,825 7,875Comprehensive risk 3,475 4,550Specific risk 37,826 39,825Total Market RWAs 83,664 84,475Total Operational RWAs 115,250 115,088Total RWAs $575,762 $549,650
In the tables above:
‰ Securities financing transactions represent resale andrepurchase agreements and securities borrowed andloaned transactions.
‰ Other primarily includes receivables, other assets, andcash and cash equivalents.
The table below presents changes in RWAs calculated inaccordance with the Standardized and Basel III AdvancedRules.
Six Months EndedJune 2017
$ in millions StandardizedBasel III
Advanced
Risk-Weighted Assets
Beginning balance $496,676 $549,650
Credit RWAs
Change in:Deductions for transitional provisions (233) (233)
Derivatives (1,466) (8,216)
Commitments, guarantees and loans 7,259 15,707
Securities financing transactions 7,987 6,826
Equity investments 3,602 4,073
Other 8,217 8,604
Change in Credit RWAs 25,366 26,761
Market RWAs
Change in:Regulatory VaR (2,100) (2,100)
Stressed VaR 2,413 2,413
Incremental risk 1,950 1,950
Comprehensive risk (1,263) (1,075)
Specific risk (1,999) (1,999)
Change in Market RWAs (999) (811)
Operational RWAs
Change in operational risk — 162
Change in Operational RWAs — 162
Ending balance $521,043 $575,762
In the table above, the increased deductions for transitionalprovisions represent the increased phase-in of deductionsfrom 60% to 80%, effective January 1, 2017.
Standardized Credit RWAs as of June 2017 increased by$25.37 billion compared with December 2016, primarilyreflecting an increase in securities financing transactions,principally due to increased exposures, and commitments,guarantees and loans, principally due to increased lendingactivity. Standardized Market RWAs as of June 2017decreased by $999 million compared with December 2016,primarily reflecting a decrease in regulatory VaR, andspecific risk as a result of changes in risk exposures,partially offset by an increase in stressed VaR.
Basel III Advanced Credit RWAs as of June 2017 increasedby $26.76 billion compared with December 2016,primarily reflecting an increase in commitments, guaranteesand loans, principally due to increased lending activity.Basel III Advanced Market RWAs as of June 2017decreased by $811 million compared with December 2016,primarily reflecting a decrease in regulatory VaR, andspecific risk as a result of changes in risk exposures,partially offset by an increase in stressed VaR. Basel IIIAdvanced Operational RWAs as of June 2017 wereessentially unchanged compared with December 2016.
Goldman Sachs June 2017 Form 10-Q 72

THE GOLDMAN SACHS GROUP, INC. AND SUBSIDIARIES
Notes to Condensed Consolidated Financial Statements(Unaudited)
The table below presents changes in RWAs calculated inaccordance with the Standardized and Basel III AdvancedRules.
Year EndedDecember 2016
$ in millions StandardizedBasel III
Advanced
Risk-Weighted Assets
Beginning balance $524,107 $577,651Credit RWAs
Change in:Deductions for transitional provisions (531) (531)Derivatives (12,555) (8,575)Commitments, guarantees and loans 4,353 8,269Securities financing transactions (73) (228)Equity investments 4,196 4,440Other (4,095) 2,630
Change in Credit RWAs (8,705) 6,005Market RWAs
Change in:Regulatory VaR (2,250) (2,250)Stressed VaR 737 737Incremental risk (1,638) (1,638)Comprehensive risk (387) (167)Specific risk (15,188) (15,188)
Change in Market RWAs (18,726) (18,506)Operational RWAs
Change in operational risk — (15,500)Change in Operational RWAs — (15,500)Ending balance $496,676 $549,650
In the table above, the increased deductions for transitionalprovisions represent the increased phase-in of deductionsfrom 40% to 60%, effective January 1, 2016.
Standardized Credit RWAs as of December 2016 decreasedby $8.71 billion compared with December 2015, primarilyreflecting a decrease in derivatives, principally due toreduced exposures, and a decrease in receivables included inother credit RWAs reflecting the impact of firm and clientactivity. This decrease was partially offset by increases incommitments, guarantees and loans principally due toincreased lending activity, and equity investments,principally due to increased exposures and the impact ofmarket movements. Standardized Market RWAs as ofDecember 2016 decreased by $18.73 billion compared withDecember 2015, primarily reflecting a decrease in specificrisk as a result of reduced risk exposures.
Basel III Advanced Credit RWAs as of December 2016increased by $6.01 billion compared with December 2015,primarily reflecting an increase in commitments, guaranteesand loans principally due to increased lending activity, andan increase in equity investments, principally due toincreased exposures and the impact of market movements.These increases were partially offset by a decrease inderivatives, principally due to lower counterparty creditrisk and reduced exposure. Basel III Advanced MarketRWAs as of December 2016 decreased by $18.51 billioncompared with December 2015, primarily reflecting adecrease in specific risk as a result of reduced riskexposures. Basel III Advanced Operational RWAs as ofDecember 2016 decreased by $15.50 billion compared withDecember 2015, reflecting a decrease in the frequency ofcertain events incorporated within the firm’s risk-basedmodel.
See “Definition of Risk-Weighted Assets” above for adescription of the calculations of Credit RWAs, MarketRWAs and Operational RWAs, including the differences inthe calculation of Credit RWAs under each of theStandardized Capital Rules and the Basel III AdvancedRules.
Bank Subsidiaries
Regulatory Capital Ratios. GS Bank USA, an FDIC-insured, New York State-chartered bank and a member ofthe Federal Reserve System, is supervised and regulated bythe Federal Reserve Board, the FDIC, the New York StateDepartment of Financial Services and the ConsumerFinancial Protection Bureau, and is subject to regulatorycapital requirements that are calculated in substantially thesame manner as those applicable to bank holdingcompanies. For purposes of assessing the adequacy of itscapital, GS Bank USA calculates its capital ratios inaccordance with the risk-based capital and leveragerequirements applicable to state member banks. Thoserequirements are based on the Revised Capital Frameworkdescribed above. GS Bank USA is an Advanced approachbanking organization under the Revised CapitalFramework.
73 Goldman Sachs June 2017 Form 10-Q

THE GOLDMAN SACHS GROUP, INC. AND SUBSIDIARIES
Notes to Condensed Consolidated Financial Statements(Unaudited)
Under the regulatory framework for prompt correctiveaction applicable to GS Bank USA, in order to meet thequantitative requirements for being a “well-capitalized”depository institution, GS Bank USA must meet higherminimum requirements than the minimum ratios in thetable below. The table below presents the minimum ratiosand the “well-capitalized” minimum ratios required for GSBank USA.
Minimum Ratio as of
June2017
December2016
“Well-capitalized”Minimum Ratio
CET1 ratio 5.750% 5.125% 6.5%
Tier 1 capital ratio 7.250% 6.625% 8.0%
Total capital ratio 9.250% 8.625% 10.0%
Tier 1 leverage ratio 4.000% 4.000% 5.0%
GS Bank USA was in compliance with its minimum capitalrequirements and the “well-capitalized” minimum ratios asof June 2017 and December 2016. In the table above, theminimum capital ratios as of June 2017 reflect the 50%phase-in of the capital conservation buffer of 2.5% and thecountercyclical capital buffer described above (0%). Theminimum capital ratios as of December 2016 reflect the25% phase-in of the capital conservation buffer of 2.5%and the countercyclical capital buffer described above(0%). GS Bank USA’s capital levels and prompt correctiveaction classification are also subject to qualitativejudgments by the regulators about components of capital,risk weightings and other factors. Failure to comply withthese capital requirements, including a breach of the buffersdiscussed above, could result in restrictions being imposedby GS Bank USA’s regulators.
Similar to the firm, GS Bank USA is required to calculateeach of the CET1, Tier 1 capital and Total capital ratios inaccordance with both the Standardized Capital Rules andBasel III Advanced Rules. The lower of each ratio calculatedin accordance with the Standardized Capital Rules andBasel III Advanced Rules is the ratio against which GS BankUSA’s compliance with its minimum ratio requirements isassessed. Each of the ratios calculated in accordance withthe Standardized Capital Rules was lower than thatcalculated in accordance with the Basel III Advanced Rulesand therefore the Standardized Capital ratios were theratios that applied to GS Bank USA as of June 2017 andDecember 2016. The capital ratios that apply to GS BankUSA can change in future reporting periods as a result ofthese regulatory requirements.
The table below presents the ratios for GS Bank USAcalculated in accordance with both the Standardized andBasel III Advanced Rules.
As of
$ in millionsJune2017
December2016
Standardized
Common Equity Tier 1 $ 24,659 $ 24,485
Tier 1 capital 24,659 24,485Tier 2 capital 2,466 2,382Total capital $ 27,125 $ 26,867
Basel III Advanced
Common Equity Tier 1 $ 24,659 $ 24,485
Tier 1 capital 24,659 24,485Standardized Tier 2 capital 2,466 2,382Allowance for losses on loans and lending
commitments (466) (382)Tier 2 capital 2,000 2,000Total capital $ 26,659 $ 26,485
RWAs
Standardized $213,904 $204,232Basel III Advanced $143,099 $131,051
CET1 ratio
Standardized 11.5% 12.0%Basel III Advanced 17.2% 18.7%
Tier 1 capital ratio
Standardized 11.5% 12.0%Basel III Advanced 17.2% 18.7%
Total capital ratio
Standardized 12.7% 13.2%Basel III Advanced 18.6% 20.2%
Tier 1 leverage ratio 15.7% 14.4%
The decrease in GS Bank USA’s Standardized and Basel IIIAdvanced capital ratios from December 2016 to June 2017is primarily due to an increase in credit RWAs, principallydue to an increase in lending activity.
The firm’s principal non-U.S. bank subsidiary, GSIB, is awholly-owned credit institution, regulated by thePrudential Regulation Authority (PRA) and the FinancialConduct Authority (FCA) and is subject to minimumcapital requirements. As of June 2017 and December 2016,GSIB was in compliance with all regulatory capitalrequirements.
Goldman Sachs June 2017 Form 10-Q 74

THE GOLDMAN SACHS GROUP, INC. AND SUBSIDIARIES
Notes to Condensed Consolidated Financial Statements(Unaudited)
Broker-Dealer Subsidiaries
U.S. Regulated Broker-Dealer Subsidiaries. GS&Co. isthe firm’s primary U.S. regulated broker-dealer subsidiaryand is subject to regulatory capital requirements includingthose imposed by the SEC and the Financial IndustryRegulatory Authority, Inc. In addition, GS&Co. is aregistered futures commission merchant and is subject toregulatory capital requirements imposed by the CFTC, theChicago Mercantile Exchange and the National FuturesAssociation. Rule 15c3-1 of the SEC and Rule 1.17 of theCFTC specify uniform minimum net capital requirements,as defined, for their registrants, and also effectively requirethat a significant part of the registrants’ assets be kept inrelatively liquid form. GS&Co. has elected to calculate itsminimum capital requirements in accordance with the“Alternative Net Capital Requirement” as permitted byRule 15c3-1.
As of June 2017 and December 2016, GS&Co. hadregulatory net capital, as defined by Rule 15c3-1, of$17.70 billion and $17.17 billion, respectively, whichexceeded the amount required by $15.29 billion and$14.66 billion, respectively. In addition to its alternativeminimum net capital requirements, GS&Co. is alsorequired to hold tentative net capital in excess of $1 billionand net capital in excess of $500 million in accordance withthe market and credit risk standards of Appendix E ofRule 15c3-1. GS&Co. is also required to notify the SEC inthe event that its tentative net capital is less than $5 billion.As of June 2017 and December 2016, GS&Co. hadtentative net capital and net capital in excess of both theminimum and the notification requirements.
Non-U.S. Regulated Broker-Dealer Subsidiaries. Thefirm’s principal non-U.S. regulated broker-dealersubsidiaries include Goldman Sachs International (GSI) andGoldman Sachs Japan Co., Ltd. (GSJCL). GSI, the firm’sU.K. broker-dealer, is regulated by the PRA and the FCA.GSJCL, the firm’s Japanese broker-dealer, is regulated byJapan’s Financial Services Agency. These and certain othernon-U.S. subsidiaries of the firm are also subject to capitaladequacy requirements promulgated by authorities of thecountries in which they operate. As of June 2017 andDecember 2016, these subsidiaries were in compliance withtheir local capital adequacy requirements.
Restrictions on Payments
Group Inc.’s ability to withdraw capital from its regulatedsubsidiaries is limited by minimum equity capitalrequirements applicable to those subsidiaries, provisions ofapplicable law and regulations and other regulatoryrestrictions that limit the ability of those subsidiaries todeclare and pay dividends without prior regulatoryapproval (e.g., the amount of dividends that may be paid byGS Bank USA is limited to the lesser of the amountscalculated under a recent earnings test and an undividedprofits test) even if the relevant subsidiary would satisfy theequity capital requirements applicable to it after givingeffect to the dividend. For example, the Federal ReserveBoard, the FDIC and the New York State Department ofFinancial Services have authority to prohibit or to limit thepayment of dividends by the banking organizations theysupervise (including GS Bank USA) if, in the relevantregulator’s opinion, payment of a dividend wouldconstitute an unsafe or unsound practice in the light of thefinancial condition of the banking organization.
As of June 2017 and December 2016, Group Inc. wasrequired to maintain $52.38 billion and $46.49 billion,respectively, of minimum equity capital in its regulatedsubsidiaries in order to satisfy the regulatory requirementsof such subsidiaries.
Other
The deposits of GS Bank USA are insured by the FDIC tothe extent provided by law. The Federal Reserve Boardrequires that GS Bank USA maintain cash reserves with theFederal Reserve Bank of New York. The amount depositedby GS Bank USA at the Federal Reserve Bank of New Yorkwas $41.59 billion and $74.24 billion as of June 2017 andDecember 2016, respectively, which exceeded requiredreserve amounts by $41.43 billion and $74.09 billion as ofJune 2017 and December 2016, respectively.
75 Goldman Sachs June 2017 Form 10-Q
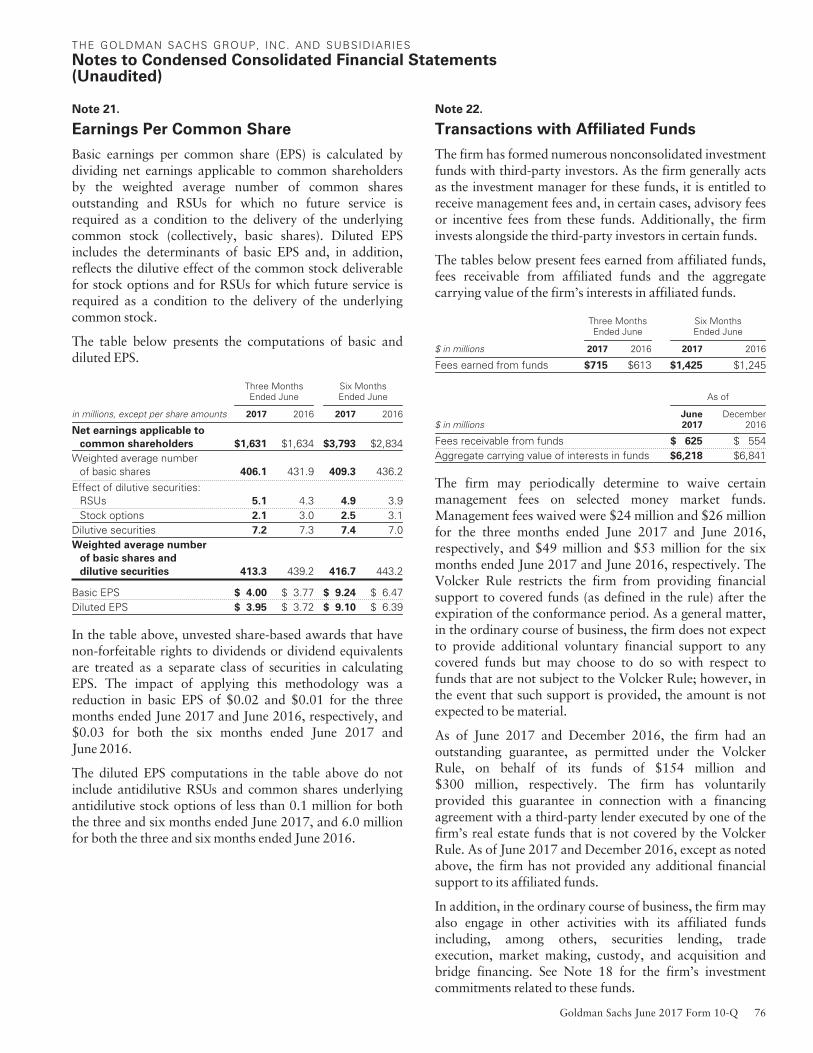
THE GOLDMAN SACHS GROUP, INC. AND SUBSIDIARIES
Notes to Condensed Consolidated Financial Statements(Unaudited)
Note 21.
Earnings Per Common Share
Basic earnings per common share (EPS) is calculated bydividing net earnings applicable to common shareholdersby the weighted average number of common sharesoutstanding and RSUs for which no future service isrequired as a condition to the delivery of the underlyingcommon stock (collectively, basic shares). Diluted EPSincludes the determinants of basic EPS and, in addition,reflects the dilutive effect of the common stock deliverablefor stock options and for RSUs for which future service isrequired as a condition to the delivery of the underlyingcommon stock.
The table below presents the computations of basic anddiluted EPS.
Three MonthsEnded June
Six MonthsEnded June
in millions, except per share amounts 2017 2016 2017 2016
Net earnings applicable to
common shareholders $1,631 $1,634 $3,793 $2,834Weighted average number
of basic shares 406.1 431.9 409.3 436.2Effect of dilutive securities:
RSUs 5.1 4.3 4.9 3.9Stock options 2.1 3.0 2.5 3.1
Dilutive securities 7.2 7.3 7.4 7.0Weighted average number
of basic shares and
dilutive securities 413.3 439.2 416.7 443.2
Basic EPS $ 4.00 $ 3.77 $ 9.24 $ 6.47Diluted EPS $ 3.95 $ 3.72 $ 9.10 $ 6.39
In the table above, unvested share-based awards that havenon-forfeitable rights to dividends or dividend equivalentsare treated as a separate class of securities in calculatingEPS. The impact of applying this methodology was areduction in basic EPS of $0.02 and $0.01 for the threemonths ended June 2017 and June 2016, respectively, and$0.03 for both the six months ended June 2017 andJune 2016.
The diluted EPS computations in the table above do notinclude antidilutive RSUs and common shares underlyingantidilutive stock options of less than 0.1 million for boththe three and six months ended June 2017, and 6.0 millionfor both the three and six months ended June 2016.
Note 22.
Transactions with Affiliated Funds
The firm has formed numerous nonconsolidated investmentfunds with third-party investors. As the firm generally actsas the investment manager for these funds, it is entitled toreceive management fees and, in certain cases, advisory feesor incentive fees from these funds. Additionally, the firminvests alongside the third-party investors in certain funds.
The tables below present fees earned from affiliated funds,fees receivable from affiliated funds and the aggregatecarrying value of the firm’s interests in affiliated funds.
Three MonthsEnded June
Six MonthsEnded June
$ in millions 2017 2016 2017 2016
Fees earned from funds $715 $613 $1,425 $1,245
As of
$ in millionsJune2017
December2016
Fees receivable from funds $ 625 $ 554Aggregate carrying value of interests in funds $6,218 $6,841
The firm may periodically determine to waive certainmanagement fees on selected money market funds.Management fees waived were $24 million and $26 millionfor the three months ended June 2017 and June 2016,respectively, and $49 million and $53 million for the sixmonths ended June 2017 and June 2016, respectively. TheVolcker Rule restricts the firm from providing financialsupport to covered funds (as defined in the rule) after theexpiration of the conformance period. As a general matter,in the ordinary course of business, the firm does not expectto provide additional voluntary financial support to anycovered funds but may choose to do so with respect tofunds that are not subject to the Volcker Rule; however, inthe event that such support is provided, the amount is notexpected to be material.
As of June 2017 and December 2016, the firm had anoutstanding guarantee, as permitted under the VolckerRule, on behalf of its funds of $154 million and$300 million, respectively. The firm has voluntarilyprovided this guarantee in connection with a financingagreement with a third-party lender executed by one of thefirm’s real estate funds that is not covered by the VolckerRule. As of June 2017 and December 2016, except as notedabove, the firm has not provided any additional financialsupport to its affiliated funds.
In addition, in the ordinary course of business, the firm mayalso engage in other activities with its affiliated fundsincluding, among others, securities lending, tradeexecution, market making, custody, and acquisition andbridge financing. See Note 18 for the firm’s investmentcommitments related to these funds.
Goldman Sachs June 2017 Form 10-Q 76

THE GOLDMAN SACHS GROUP, INC. AND SUBSIDIARIES
Notes to Condensed Consolidated Financial Statements(Unaudited)
Note 23.
Interest Income and Interest Expense
Interest is recorded over the life of the instrument on anaccrual basis based on contractual interest rates. The tablebelow presents the firm’s sources of interest income andinterest expense.
Three MonthsEnded June
Six MonthsEnded June
$ in millions 2017 2016 2017 2016
Interest income
Deposits with banks $ 193 $ 113 $ 355 $ 204Collateralized agreements 397 209 678 318Financial instruments owned 1,493 1,454 2,844 2,872Loans receivable 635 432 1,200 844Other interest 502 322 889 640Total interest income 3,220 2,530 5,966 4,878Interest expense
Deposits 315 225 589 394Collateralized financings 212 124 348 242Financial instruments sold, but
not yet purchased 369 317 705 631Short-term secured and
unsecured borrowings 191 109 312 236Long-term secured and
unsecured borrowings 1,124 1,020 2,300 1,885Other interest 221 (19) 408 (147)Total interest expense 2,432 1,776 4,662 3,241Net interest income $ 788 $ 754 $1,304 $1,637
In the table above:
‰ Collateralized agreements includes rebates paid andinterest income on securities borrowed.
‰ Other interest income includes interest income oncustomer debit balances and other interest-earning assets.
‰ Other interest expense includes rebates received on otherinterest-bearing liabilities and interest expense oncustomer credit balances.
Note 24.
Income Taxes
Provision for Income Taxes
Income taxes are provided for using the asset and liabilitymethod under which deferred tax assets and liabilities arerecognized for temporary differences between the financialreporting and tax bases of assets and liabilities. The firmreports interest expense related to income tax matters in“Provision for taxes” and income tax penalties in “Otherexpenses.”
Deferred Income Taxes
Deferred income taxes reflect the net tax effects oftemporary differences between the financial reporting andtax bases of assets and liabilities. These temporarydifferences result in taxable or deductible amounts in futureyears and are measured using the tax rates and laws thatwill be in effect when such differences are expected toreverse. Valuation allowances are established to reducedeferred tax assets to the amount that more likely than notwill be realized and primarily relate to the ability to utilizelosses in various tax jurisdictions. Tax assets and liabilitiesare presented as a component of “Other assets” and “Otherliabilities and accrued expenses,” respectively.
Unrecognized Tax Benefits
The firm recognizes tax positions in the condensedconsolidated financial statements only when it is morelikely than not that the position will be sustained onexamination by the relevant taxing authority based on thetechnical merits of the position. A position that meets thisstandard is measured at the largest amount of benefit thatwill more likely than not be realized on settlement. Aliability is established for differences between positionstaken in a tax return and amounts recognized in thecondensed consolidated financial statements.
Regulatory Tax Examinations
The firm is subject to examination by the U.S. InternalRevenue Service and other taxing authorities injurisdictions where the firm has significant businessoperations, such as the United Kingdom, Japan, HongKong and various states, such as New York. The tax yearsunder examination vary by jurisdiction. The firm does notexpect completion of these audits to have a material impacton the firm’s financial condition but it may be material tooperating results for a particular period, depending, in part,on the operating results for that period.
77 Goldman Sachs June 2017 Form 10-Q

THE GOLDMAN SACHS GROUP, INC. AND SUBSIDIARIES
Notes to Condensed Consolidated Financial Statements(Unaudited)
The table below presents the earliest tax years that remainsubject to examination by major jurisdiction.
JurisdictionAs of
June 2017
U.S. Federal 2011
New York State and City 2007
United Kingdom 2014
Japan 2014
Hong Kong 2011
U.S. Federal examinations of 2011 and 2012 began in2013. The firm has been accepted into the ComplianceAssurance Process program by the U.S. Internal RevenueService for each of the tax years from 2013 through 2017.This program allows the firm to work with the U.S. InternalRevenue Service to identify and resolve potential U.S.federal tax issues before the filing of tax returns. The 2013through 2015 tax years remain subject to post-filing review.
New York State and City examinations for the firm(excluding GS Bank USA) of fiscal 2007 through calendar2010 are ongoing. New York State and City examinationsfor GS Bank USA have been completed through 2014.
During the first quarter of 2017, the firm concludedexaminations with the Hong Kong tax authorities related to2007 through 2015, with 2011 through 2015 subject tofinal review. The completion of these examinations did nothave a material impact on the firm’s effective income taxrate.
All years including and subsequent to the years in the tableabove remain open to examination by the taxingauthorities. The firm believes that the liability forunrecognized tax benefits it has established is adequate inrelation to the potential for additional assessments.
Note 25.
Business Segments
The firm reports its activities in the following four businesssegments: Investment Banking, Institutional Client Services,Investing & Lending and Investment Management.
Basis of Presentation
In reporting segments, certain of the firm’s business lineshave been aggregated where they have similar economiccharacteristics and are similar in each of the followingareas: (i) the nature of the services they provide, (ii) theirmethods of distribution, (iii) the types of clients they serveand (iv) the regulatory environments in which they operate.
The cost drivers of the firm taken as a whole,compensation, headcount and levels of business activity,are broadly similar in each of the firm’s business segments.Compensation and benefits expenses in the firm’s segmentsreflect, among other factors, the overall performance of thefirm, as well as the performance of individual businesses.Consequently, pre-tax margins in one segment of the firm’sbusiness may be significantly affected by the performanceof the firm’s other business segments.
The firm allocates assets (including allocations of globalcore liquid assets and cash, secured client financing andother assets), revenues and expenses among the fourbusiness segments. Due to the integrated nature of thesesegments, estimates and judgments are made in allocatingcertain assets, revenues and expenses. The allocationprocess is based on the manner in which managementcurrently views the performance of the segments.Transactions between segments are based on specificcriteria or approximate third-party rates.
Goldman Sachs June 2017 Form 10-Q 78

THE GOLDMAN SACHS GROUP, INC. AND SUBSIDIARIES
Notes to Condensed Consolidated Financial Statements(Unaudited)
The table below presents the firm’s net revenues, pre-taxearnings and total assets by segment. Management believesthat this information provides a reasonable representationof each segment’s contribution to consolidated pre-taxearnings and total assets.
Three MonthsEnded or as of June
Six MonthsEnded June
$ in millions 2017 2016 2017 2016
Investment Banking
Financial Advisory $ 749 $ 794 $ 1,505 $ 1,565
Equity underwriting 260 269 571 452Debt underwriting 721 724 1,357 1,233Total Underwriting 981 993 1,928 1,685Total net revenues 1,730 1,787 3,433 3,250Operating expenses 984 1,095 1,959 1,857Pre-tax earnings $ 746 $ 692 $ 1,474 $ 1,393
Segment assets $ 2,076 $ 2,389
Institutional Client Services
FICC Client Execution $ 1,159 $ 1,927 $ 2,844 $ 3,590
Equities client execution 687 587 1,239 1,057Commissions and fees 764 745 1,502 1,623Securities services 441 422 825 854Total Equities 1,892 1,754 3,566 3,534Total net revenues 3,051 3,681 6,410 7,124Operating expenses 2,401 2,702 4,945 5,123Pre-tax earnings $ 650 $ 979 $ 1,465 $ 2,001
Segment assets $688,864 $687,130
Investing & Lending
Equity securities $ 1,180 $ 626 $ 1,978 $ 626Debt securities and loans 396 485 1,062 572Total net revenues 1,576 1,111 3,040 1,198Operating expenses 763 581 1,513 1,024Pre-tax earnings $ 813 $ 530 $ 1,527 $ 174
Segment assets $202,613 $191,346
Investment Management
Management and other fees $ 1,284 $ 1,181 $ 2,503 $ 2,346Incentive fees 81 37 202 83Transaction revenues 165 135 325 269Total net revenues 1,530 1,353 3,030 2,698Operating expenses 1,230 1,091 2,448 2,227Pre-tax earnings $ 300 $ 262 $ 582 $ 471
Segment assets $ 12,965 $ 15,978
Total net revenues $ 7,887 $ 7,932 $15,913 $14,270Total operating expenses 5,378 5,469 10,865 10,231Total pre-tax earnings $ 2,509 $ 2,463 $ 5,048 $ 4,039
Total assets $906,518 $896,843
In the table above:
‰ Revenues and expenses directly associated with eachsegment are included in determining pre-tax earnings.
‰ Net revenues in the firm’s segments include allocations ofinterest income and interest expense to specific securities,commodities and other positions in relation to the cashgenerated by, or funding requirements of, suchunderlying positions. Net interest is included in segmentnet revenues as it is consistent with the way in whichmanagement assesses segment performance.
‰ Overhead expenses not directly allocable to specificsegments are allocated ratably based on direct segmentexpenses.
The table below presents the amounts of net interest incomeby segment included in net revenues.
Three MonthsEnded June
Six MonthsEnded June
$ in millions 2017 2016 2017 2016
Investment Banking $ — $ — $ — $ —Institutional Client Services 372 446 575 1,149Investing & Lending 349 247 592 383Investment Management 67 61 137 105Total net interest income $788 $754 $1,304 $1,637
The table below presents the amounts of depreciation andamortization expense by segment included in pre-taxearnings.
Three MonthsEnded June
Six MonthsEnded June
$ in millions 2017 2016 2017 2016
Investment Banking $ 33 $ 32 $ 66 $ 63Institutional Client Services 123 114 245 228Investing & Lending 64 59 121 113Investment Management 45 40 90 80Total depreciation and amortization $265 $245 $ 522 $ 484
79 Goldman Sachs June 2017 Form 10-Q

THE GOLDMAN SACHS GROUP, INC. AND SUBSIDIARIES
Notes to Condensed Consolidated Financial Statements(Unaudited)
Geographic Information
Due to the highly integrated nature of internationalfinancial markets, the firm manages its businesses based onthe profitability of the enterprise as a whole. Themethodology for allocating profitability to geographicregions is dependent on estimates and managementjudgment because a significant portion of the firm’sactivities require cross-border coordination in order tofacilitate the needs of the firm’s clients.
Geographic results are generally allocated as follows:
‰ Investment Banking: location of the client and investmentbanking team.
‰ Institutional Client Services: FICC Client Execution, andEquities (excluding Securities Services): location of themarket-making desk; Securities Services: location of theprimary market for the underlying security.
‰ Investing & Lending: Investing: location of theinvestment; Lending: location of the client.
‰ Investment Management: location of the sales team.
The tables below present the total net revenues and pre-taxearnings of the firm by geographic region allocated basedon the methodology referred to above, as well as thepercentage of total net revenues and pre-tax earnings foreach geographic region.
Three Months Ended June
$ in millions 2017 2016
Net revenues
Americas $ 4,841 61% $ 4,837 61%EMEA 2,100 27% 2,198 28%Asia 946 12% 897 11%Total net revenues $ 7,887 100% $ 7,932 100%Pre-tax earnings
Americas $ 1,566 63% $ 1,503 61%EMEA 710 28% 746 30%Asia 233 9% 214 9%Total pre-tax earnings $ 2,509 100% $ 2,463 100%
Six Months Ended June
$ in millions 2017 2016
Net revenues
Americas $ 9,733 61% $ 8,700 61%EMEA 4,019 25% 3,858 27%Asia 2,161 14% 1,712 12%Total net revenues $15,913 100% $14,270 100%Pre-tax earnings
Americas $ 3,090 62% $ 2,490 62%EMEA 1,332 26% 1,145 28%Asia 626 12% 404 10%Total pre-tax earnings $ 5,048 100% $ 4,039 100%
In the tables above:
‰ Substantially all of the amounts in Americas wereattributable to the U.S.
‰ EMEA represents Europe, Middle East and Africa.
‰ Asia includes Australia and New Zealand.
Note 26.
Credit Concentrations
Credit concentrations may arise from market making, clientfacilitation, investing, underwriting, lending andcollateralized transactions and may be impacted by changesin economic, industry or political factors. The firm seeks tomitigate credit risk by actively monitoring exposures andobtaining collateral from counterparties as deemedappropriate.
While the firm’s activities expose it to many differentindustries and counterparties, the firm routinely executes ahigh volume of transactions with asset managers,investment funds, commercial banks, brokers and dealers,clearing houses and exchanges, which results in significantcredit concentrations.
In the ordinary course of business, the firm may also besubject to a concentration of credit risk to a particularcounterparty, borrower or issuer, including sovereignissuers, or to a particular clearing house or exchange.
The table below presents the credit concentrations in cashinstruments held by the firm.
As of
$ in millionsJune2017
December2016
U.S. government and agency obligations $74,238 $57,657% of total assets 8.2% 6.7%Non-U.S. government and agency obligations $35,011 $29,381% of total assets 3.9% 3.4%
Amounts in the table above are included in “Financialinstruments owned.” As of June 2017 and December 2016,the firm did not have credit exposure to any othercounterparty that exceeded 2% of total assets.
Goldman Sachs June 2017 Form 10-Q 80

THE GOLDMAN SACHS GROUP, INC. AND SUBSIDIARIES
Notes to Condensed Consolidated Financial Statements(Unaudited)
To reduce credit exposures, the firm may enter intoagreements with counterparties that permit the firm tooffset receivables and payables with such counterpartiesand/or enable the firm to obtain collateral on an upfront orcontingent basis. Collateral obtained by the firm related toderivative assets is principally cash and is held by the firmor a third-party custodian. Collateral obtained by the firmrelated to resale agreements and securities borrowedtransactions is primarily U.S. government and agencyobligations and non-U.S. government and agencyobligations. See Note 10 for further information aboutcollateralized agreements and financings.
The table below presents U.S. government and agencyobligations and non-U.S. government and agencyobligations that collateralize resale agreements andsecurities borrowed transactions.
As of
$ in millionsJune2017
December2016
U.S. government and agency obligations $76,060 $89,721Non-U.S. government and agency obligations $84,573 $80,234
In the table above:
‰ Non-U.S. government and agency obligations primarilyconsist of securities issued by the governments of Japan,France, the U.K. and Germany.
‰ Given that the firm’s primary credit exposure on suchtransactions is to the counterparty to the transaction, thefirm would be exposed to the collateral issuer only in theevent of counterparty default.
Note 27.
Legal Proceedings
The firm is involved in a number of judicial, regulatory andarbitration proceedings (including those described below)concerning matters arising in connection with the conductof the firm’s businesses. Many of these proceedings are inearly stages, and many of these cases seek an indeterminateamount of damages.
Under ASC 450, an event is “reasonably possible” if “thechance of the future event or events occurring is more thanremote but less than likely” and an event is “remote” if “thechance of the future event or events occurring is slight.”Thus, references to the upper end of the range of reasonablypossible loss for cases in which the firm is able to estimate arange of reasonably possible loss mean the upper end of therange of loss for cases for which the firm believes the risk ofloss is more than slight.
With respect to matters described below for whichmanagement has been able to estimate a range ofreasonably possible loss where (i) actual or potentialplaintiffs have claimed an amount of money damages,(ii) the firm is being, or threatened to be, sued by purchasersin a securities offering and is not being indemnified by aparty that the firm believes will pay the full amount of anyjudgment, or (iii) the purchasers are demanding that thefirm repurchase securities, management has estimated theupper end of the range of reasonably possible loss as beingequal to (a) in the case of (i), the amount of money damagesclaimed, (b) in the case of (ii), the difference between theinitial sales price of the securities that the firm sold in suchoffering and the estimated lowest subsequent price of suchsecurities prior to the action being commenced and (c) inthe case of (iii), the price that purchasers paid for thesecurities less the estimated value, if any, as of June 2017 ofthe relevant securities, in each of cases (i), (ii) and (iii),taking into account any other factors believed to be relevantto the particular matter or matters of that type. As of thedate hereof, the firm has estimated the upper end of therange of reasonably possible aggregate loss for such mattersand for any other matters described below wheremanagement has been able to estimate a range ofreasonably possible aggregate loss to be approximately$1.5 billion in excess of the aggregate reserves for suchmatters.
81 Goldman Sachs June 2017 Form 10-Q

THE GOLDMAN SACHS GROUP, INC. AND SUBSIDIARIES
Notes to Condensed Consolidated Financial Statements(Unaudited)
Management is generally unable to estimate a range ofreasonably possible loss for matters other than thoseincluded in the estimate above, including where (i) actual orpotential plaintiffs have not claimed an amount of moneydamages, except in those instances where management canotherwise determine an appropriate amount, (ii) mattersare in early stages, (iii) matters relate to regulatoryinvestigations or reviews, except in those instances wheremanagement can otherwise determine an appropriateamount, (iv) there is uncertainty as to the likelihood of aclass being certified or the ultimate size of the class, (v) thereis uncertainty as to the outcome of pending appeals ormotions, (vi) there are significant factual issues to beresolved, and/or (vii) there are novel legal issues presented.For example, the firm’s potential liabilities with respect tofuture mortgage-related “put-back” claims described belowmay ultimately result in an increase in the firm’s liabilities,but are not included in management’s estimate ofreasonably possible loss. As another example, the firm’spotential liabilities with respect to the investigations andreviews described below in “Regulatory Investigations andReviews and Related Litigation” also generally are notincluded in management’s estimate of reasonably possibleloss. However, management does not believe, based oncurrently available information, that the outcomes of suchother matters will have a material adverse effect on thefirm’s financial condition, though the outcomes could bematerial to the firm’s operating results for any particularperiod, depending, in part, upon the operating results forsuch period. See Note 18 for further information aboutmortgage-related contingencies.
Mortgage-Related Matters
Beginning in April 2010, a number of purported securitieslaw class actions were filed in the U.S. District Court for theSouthern District of New York challenging the adequacy ofGroup Inc.’s public disclosure of, among other things, thefirm’s activities in the CDO market, the firm’s conflict ofinterest management, and the SEC investigation that led toGS&Co. entering into a consent agreement with the SEC,settling all claims made against GS&Co. by the SEC inconnection with the ABACUS 2007-AC1 CDO offering(ABACUS 2007-AC1 transaction), pursuant to whichGS&Co. paid $550 million of disgorgement and civilpenalties.
The consolidated amended complaint filed onJuly 25, 2011, which names as defendants Group Inc. andcertain current and former officers and employees of GroupInc. and its affiliates, generally alleges violations of Sections10(b) and 20(a) of the Exchange Act and seeks unspecifieddamages. On June 21, 2012, the district court dismissed theclaims based on Group Inc.’s not disclosing that it hadreceived a “Wells” notice from the staff of the SEC relatedto the ABACUS 2007-AC1 transaction, but permitted theplaintiffs’ other claims to proceed. The district courtgranted class certification on September 24, 2015, but theappellate court granted defendants’ petition for review onJanuary 26, 2016. On February 1, 2016, the district courtstayed proceedings in the district court pending theappellate court’s decision.
In June 2012, the Board received a demand from ashareholder that the Board investigate and take actionrelating to the firm’s mortgage-related activities and tostock sales by certain directors and executives of the firm.On February 15, 2013, this shareholder filed a putativeshareholder derivative action in New York Supreme Court,New York County, against Group Inc. and certain currentor former directors and employees, based on these activitiesand stock sales. The derivative complaint includesallegations of breach of fiduciary duty, unjust enrichment,abuse of control, gross mismanagement and corporatewaste, and seeks, among other things, unspecified monetarydamages, disgorgement of profits and certain corporategovernance and disclosure reforms. On May 28, 2013,Group Inc. informed the shareholder that the Boardcompleted its investigation and determined to refuse thedemand. On June 20, 2013, the shareholder made a booksand records demand requesting materials relating to theBoard’s determination. The parties have agreed to stayproceedings in the putative derivative action pendingresolution of the books and records demand.
In addition, the Board has received books and recordsdemands from several shareholders for materials relatingto, among other subjects, the firm’s mortgage servicing andforeclosure activities, participation in federal programsproviding assistance to financial institutions andhomeowners, loan sales to Fannie Mae and Freddie Mac,mortgage-related activities and conflicts management.
Goldman Sachs June 2017 Form 10-Q 82

THE GOLDMAN SACHS GROUP, INC. AND SUBSIDIARIES
Notes to Condensed Consolidated Financial Statements(Unaudited)
Various alleged purchasers of mortgage pass-throughcertificates and other mortgage-related products (includingMassachusetts Mutual Life Insurance Company and theFDIC (as receiver for Guaranty Bank)) have filedcomplaints in federal court against firm affiliates, generallyalleging that the offering documents for the securities thatthey purchased contained untrue statements of material factand material omissions and generally seeking rescissionand/or damages. Certain of these complaints name otherfirms as defendants.
As of the date hereof, the aggregate amount of mortgage-related securities sold to plaintiffs in active cases describedin the preceding paragraph where those plaintiffs areseeking rescission of such securities was approximately$261 million (which does not reflect adjustment for anysubsequent paydowns or distributions or any residual valueof such securities, statutory interest or any otheradjustments that may be claimed). This amount does notinclude the potential claims by these or other purchasers inthe same or other mortgage-related offerings that have notbeen described above, or claims that have been dismissed.
The firm has entered into agreements with Deutsche BankNational Trust Company and U.S. Bank NationalAssociation to toll the relevant statute of limitations withrespect to claims for repurchase of residential mortgageloans based on alleged breaches of representations relatedto $11.1 billion original notional face amount ofsecuritizations issued by trusts for which they act astrustees.
The firm has received subpoenas or requests forinformation from, and is engaged in discussions with,certain regulators and law enforcement agencies with whichit has not entered into settlement agreements as part ofinquiries or investigations relating to mortgage-relatedmatters.
Director Compensation-Related Litigation
On May 9, 2017, Group Inc. and certain of its current andformer directors were named as defendants in a purporteddirect and derivative shareholder action in the Court ofChancery of the State of Delaware (a similar purportedderivative action, filed in June 2015, alleging excessivedirector compensation over the period 2012 to 2014 wasvoluntarily dismissed without prejudice inDecember 2016). The new complaint alleges that excessivecompensation has been paid to the non-employee directordefendants since 2015, and that certain disclosures inconnection with soliciting stockholder approval of thestock incentive plans were deficient. The complaint assertsclaims for breaches of fiduciary duties and seeks, amongother things, rescission or in some cases rescissory damages,disgorgement, and shareholder votes on several matters.Defendants moved to dismiss on July 28, 2017.
SunEdison Bankruptcy Litigation
GS Bank USA is among the defendants named in anadversary proceeding filed on October 20, 2016 in the U.S.Bankruptcy Court for the Southern District of New Yorkarising from the bankruptcy of SunEdison, Inc.(SunEdison). The complaint alleges that amountstransferred and liens granted by SunEdison to its securedcreditors, including GS Bank USA, prior to filing forbankruptcy were fraudulent and preferential transfers.Plaintiffs seek to recoup those transfers, avoid those liensand disallow certain claims of the secured creditors. GSBank USA received pre-filing payments from SunEdisonaggregating $169 million that are subject to the recoupmentclaims and post-filing payments of $40 million that aresubject to the avoidance and disallowance claims. OnJuly 25, 2017, the court approved a settlement, which willresolve the litigation without any contribution by GS BankUSA, subject to consummation of the reorganization plan.
Currencies-Related Litigation
GS&Co. and Group Inc. are among the defendants namedin putative class actions filed in the U.S. District Court forthe Southern District of New York beginning inSeptember 2016 on behalf of putative indirect purchasers offoreign exchange instruments. The consolidated amendedcomplaint, filed on June 30, 2017, generally alleges aconspiracy to manipulate the foreign currency exchangemarkets and asserts claims under federal and state antitrustlaws and state consumer protection laws and seeksinjunctive relief, as well as treble damages in an unspecifiedamount.
On July 12, 2017, GS&Co. and Group Inc. were named asdefendants in a putative class action filed in the U.S. DistrictCourt for the Southern District of New York alleging thatthe defendants improperly delayed and cancelled ordersplaced on certain electronic currency trading platformsthrough a functionality referred to as “last look.” Thecomplaint asserts claims under state common law forbreach of contract and unjust enrichment and seeksinjunctive relief, as well as punitive damages and restitutionin unspecified amounts.
Financial Advisory Services
Group Inc. and certain of its affiliates are from time to timeparties to various civil litigation and arbitrationproceedings and other disputes with clients and thirdparties relating to the firm’s financial advisory activities.These claims generally seek, among other things,compensatory damages and, in some cases, punitivedamages, and in certain cases allege that the firm did notappropriately disclose or deal with conflicts of interest.
83 Goldman Sachs June 2017 Form 10-Q

THE GOLDMAN SACHS GROUP, INC. AND SUBSIDIARIES
Notes to Condensed Consolidated Financial Statements(Unaudited)
Underwriting Litigation
Firm affiliates are among the defendants in a number ofproceedings in connection with securities offerings. In theseproceedings, including those described below, the plaintiffsassert class action or individual claims under federal andstate securities laws and in some cases other applicablelaws, allege that the offering documents for the securitiesthat they purchased contained material misstatements andomissions, and generally seek compensatory and rescissorydamages in unspecified amounts. Certain of theseproceedings involve additional allegations.
Cobalt International Energy. Cobalt InternationalEnergy, Inc. (Cobalt), certain of its officers and directors(including employees of affiliates of Group Inc. who servedas directors of Cobalt), affiliates of shareholders of Cobalt(including Group Inc.) and the underwriters (includingGS&Co.) for certain offerings of Cobalt’s securities aredefendants in a putative securities class action filed onNovember 30, 2014 in the U.S. District Court for theSouthern District of Texas. The second consolidatedamended complaint, filed on March 15, 2017, relates to a$1.67 billion February 2012 offering of Cobalt commonstock, a $1.38 billion December 2012 offering of Cobalt’sconvertible notes, a $1.00 billion January 2013 offering ofCobalt’s common stock, a $1.33 billion May 2013 offeringof Cobalt’s common stock, and a $1.30 billion May 2014offering of Cobalt’s convertible notes.
The consolidated amended complaint alleges that, amongothers, Group Inc. and GS&Co. are liable as controllingpersons with respect to all five offerings, and that theshareholder affiliates (including Group Inc.) are liable forthe sale of Cobalt common stock on the basis of insideinformation. The consolidated amended complaint alsoseeks damages from GS&Co. in connection with its actingas an underwriter of 14,430,000 shares of common stockrepresenting an aggregate offering price of approximately$465 million, $690 million principal amount of convertiblenotes, and approximately $508 million principal amount ofconvertible notes in the February 2012, December 2012and May 2014 offerings, respectively, for an aggregateoffering price of approximately $1.66 billion.
On January 19, 2016, the court granted, with leave toreplead, the underwriter defendants’ motions to dismiss asto claims by plaintiffs who purchased Cobalt securities afterApril 30, 2013, but denied the motions to dismiss in allother respects. On June 15, 2017, the court granted theplaintiffs’ motion for class certification and denied certainof the shareholder affiliates’ motions (including Group Inc.)to dismiss the claim alleging sales based on insideinformation. On June 29, 2017, the defendants petitionedthe U.S. Court of Appeals for the Fifth Circuit for leave toappeal the class certification order. On July 13, 2017, thedefendants moved for reconsideration of certain aspects ofthe court’s class certification order and for a stay ofdiscovery pending resolution of the Fifth Circuitproceeding.
Cobalt, certain of its officers and directors (includingemployees of affiliates of Group Inc. who served asdirectors of Cobalt), certain shareholders of Cobalt(including funds affiliated with Group Inc.), and affiliatesof these shareholders (including Group Inc.) are defendantsin putative shareholder derivative actions filed onMay 6, 2016 and November 29, 2016 in Texas DistrictCourt, Harris County. As to the director and officerdefendants (including employees of affiliates of Group Inc.who served as directors of Cobalt), the petitions generallyallege that they breached their fiduciary duties under statelaw by making materially false and misleading statementsconcerning Cobalt. As to the shareholder defendants andtheir affiliates (including Group Inc. and several affiliatedfunds), the original petition also alleges that they breachedtheir fiduciary duties by selling Cobalt securities in thecommon stock offerings described above on the basis ofinside information. The petitions seek, among other things,unspecified monetary damages and disgorgement ofproceeds from the sale of Cobalt common stock. OnMarch 6, 2017, the court denied defendants’ motion todismiss the May petition as to the shareholder defendantsand their affiliates (including Group Inc. and its affiliatedfunds). Defendants moved to dismiss the Novemberpetition on January 30, 2017.
Goldman Sachs June 2017 Form 10-Q 84

THE GOLDMAN SACHS GROUP, INC. AND SUBSIDIARIES
Notes to Condensed Consolidated Financial Statements(Unaudited)
Adeptus Health. GS&Co. is among the underwritersnamed as defendants in several putative securities classactions, filed beginning in October 2016 and consolidatedin the U.S. District Court for the Eastern District of Texas.In addition to the underwriters, the defendants includeAdeptus Health Inc. (Adeptus), its sponsor, and certaindirectors and officers of Adeptus. As to the underwriters,the complaints relate to the $124 million June 2014 initialpublic offering, the $154 million May 2015 secondaryequity offering, the $411 million July 2015 secondaryequity offering, and the $175 million June 2016 secondaryequity offering. GS&Co. underwrote 1.69 million shares ofcommon stock in the June 2014 initial public offeringrepresenting an aggregate offering price of approximately$37 million, 962,378 shares of common stock in theMay 2015 offering representing an aggregate offering priceof approximately $61 million, 1.76 million shares ofcommon stock in the July 2015 offering representing anaggregate offering price of approximately $184 million,and all the shares of common stock in the June 2016offering representing an aggregate offering price ofapproximately $175 million. On April 19, 2017, Adeptusfiled for Chapter 11 bankruptcy.
TerraForm Global and SunEdison. GS&Co. is amongthe underwriters, placement agents and initial purchasersnamed as defendants in several putative class actions andindividual actions filed beginning in October 2015 relatingto the $675 million July 2015 initial public offering of thecommon stock of TerraForm Global, Inc. (TerraFormGlobal), the August 2015 public offering of $650 million ofSunEdison convertible preferred stock, the June 2015private placement of $335 million of TerraForm GlobalClass D units, and the August 2015 Rule 144A offering of$810 million principal amount of TerraForm Global seniornotes. SunEdison is TerraForm Global’s controllingshareholder and sponsor. Beginning in October 2016, thepending cases were transferred to the U.S. District Court forthe Southern District of New York.
On January 16, 2017, certain plaintiffs filed a consolidatedamended complaint relating to TerraForm Global’s initialpublic offering, and, on March 17, 2017, certain plaintiffsfiled a second amended complaint relating to SunEdison’sconvertible preferred stock offering. The defendants alsoinclude TerraForm Global, SunEdison and certain of theirdirectors and officers. Defendants moved to dismiss theclass action complaints on June 9, 2017.
TerraForm Global sold 154,800 Class D units, representingan aggregate offering price of approximately $155 million,to the individual plaintiffs. GS&Co., as underwriter, sold138,890 shares of SunEdison convertible preferred stock inthe offering, representing an aggregate offering price ofapproximately $139 million and sold 2,340,000 shares ofTerraForm Global common stock in the initial publicoffering representing an aggregate offering price ofapproximately $35 million. GS&Co., as initial purchaser,sold approximately $49 million principal amount ofTerraForm Global senior notes in the Rule 144A offering.On April 21, 2016, SunEdison filed for Chapter 11bankruptcy.
Valeant Pharmaceuticals International. GS&Co. andGoldman Sachs Canada Inc. (GS Canada) are among theunderwriters and initial purchasers named as defendants ina putative class action filed on March 2, 2016 in theSuperior Court of Quebec, Canada. In addition to theunderwriters and initial purchasers, the defendants includeValeant Pharmaceuticals International, Inc. (Valeant),certain directors and officers of Valeant and Valeant’sauditor. As to GS&Co. and GS Canada, the complaintrelates to the June 2013 public offering of $2.3 billion ofcommon stock, the June 2013 Rule 144A offering of$3.2 billion principal amount of senior notes, and theNovember 2013 Rule 144A offering of $900 millionprincipal amount of senior notes. The complaint assertsclaims under the Quebec Securities Act and the Civil Codeof Quebec. The plaintiffs have moved for class certificationand the parties have agreed to limit the proposed class byexcluding U.S. purchasers in the offerings.
85 Goldman Sachs June 2017 Form 10-Q

THE GOLDMAN SACHS GROUP, INC. AND SUBSIDIARIES
Notes to Condensed Consolidated Financial Statements(Unaudited)
GS&Co. is among the initial purchasers named asdefendants in a putative class action filed on June 24, 2016in the U.S. District Court for the District of New Jersey. Inaddition to the initial purchasers for Valeant’s Rule 144Adebt offerings, the defendants include Valeant, certaindirectors and officers of Valeant, Valeant’s auditor and theunderwriters for a common stock offering in whichGS&Co. did not participate. As to GS&Co., the complaintrelates to the June 2013 and November 2013 Rule 144Aofferings described above. On April 28, 2017, the courtdismissed all claims arising from the Rule 144A offerings asto which GS&Co. was an initial purchaser.
GS&Co. and GS Canada, as sole underwriters, sold27,058,824 shares of common stock in the June 2013offering representing an aggregate offering price ofapproximately $2.3 billion (of which 5,334,897 sharesrepresenting an aggregate offering price of approximately$453 million were sold to non-U.S. purchasers) and, asinitial purchasers, sold approximately $1.3 billion and$293 million in principal amount of senior notes in theJune 2013 and November 2013 Rule 144A offerings,respectively (with their proportional share of sales tonon-U.S. purchasers being approximately CAD14.2 millionin both offerings).
Snap Inc. GS&Co. is among the underwriters named asdefendants in putative securities class actions filed inCalifornia Superior Court, County of Los Angeles and theU.S. District Court for the Central District of Californiabeginning in May 2017, relating to Snap Inc.’s $3.91 billionMarch 2017 initial public offering. In addition to theunderwriters, the defendants include Snap Inc. and certainof its officers and directors. GS&Co. underwrote57,040,000 shares of common stock representing anaggregate offering price of approximately $970 million.
Investment Management Services
Group Inc. and certain of its affiliates are parties to variouscivil litigation and arbitration proceedings and otherdisputes with clients relating to losses allegedly sustained asa result of the firm’s investment management services.These claims generally seek, among other things, restitutionor other compensatory damages and, in some cases,punitive damages.
Interest Rate Swap Antitrust Litigation
Group Inc., GS&Co., GSI, GS Bank USA and GoldmanSachs Financial Markets, L.P. (GSFM) are among thedefendants named in putative antitrust class actions relatingto the trading of interest rate swaps, filed beginning inNovember 2015 and consolidated in the U.S. District Courtfor the Southern District of New York. The secondconsolidated amended complaint filed onDecember 9, 2016 generally alleges a conspiracy among thedefendants since at least January 1, 2007 to precludeexchange trading of interest rate swaps. The complaintseeks declaratory and injunctive relief, as well as trebledamages in an unspecified amount. Defendants moved todismiss on January 20, 2017.
Group Inc., GS&Co., GSI, GS Bank USA and GSFM areamong the defendants named in antitrust actions relating tothe trading of interest rate swaps filed in the U.S. DistrictCourt for the Southern District of New York beginning inApril 2016 by two operators of swap execution facilitiesand certain of their affiliates. These actions have beenconsolidated with the class action described above forpretrial proceedings. The second consolidated amendedcomplaint filed on December 9, 2016 generally assertsclaims under federal and state antitrust laws and statecommon law in connection with an alleged conspiracyamong the defendants to preclude trading of interest rateswaps on the plaintiffs’ respective swap execution facilitiesand seeks declaratory and injunctive relief, as well as trebledamages in an unspecified amount. Defendants moved todismiss on January 20, 2017.
Goldman Sachs June 2017 Form 10-Q 86

THE GOLDMAN SACHS GROUP, INC. AND SUBSIDIARIES
Notes to Condensed Consolidated Financial Statements(Unaudited)
Credit Default Swap Antitrust Litigation
Group Inc., GS&Co., GSI, GS Bank USA and GSFM areamong the defendants named in an antitrust action relatingto the trading of credit default swaps filed in the U.S.District Court for the Southern District of New York onJune 8, 2017 by the operator of a swap execution facilityand certain of its affiliates. The complaint generally assertsclaims under federal and state antitrust laws and statecommon law in connection with an alleged conspiracyamong the defendants to preclude trading of credit defaultswaps on the plaintiffs’ swap execution facility. Thecomplaint seeks declaratory and injunctive relief, as well astreble damages in an unspecified amount.
Commodities-Related Litigation
GSI is among the defendants named in putative classactions relating to trading in platinum and palladium, filedbeginning on November 25, 2014 and most recentlyamended on May 15, 2017, in the U.S. District Court forthe Southern District of New York. The third consolidatedamended complaint generally alleges that the defendantsviolated federal antitrust laws and the CommodityExchange Act in connection with an alleged conspiracy tomanipulate a benchmark for physical platinum andpalladium prices and seek declaratory and injunctive relief,as well as treble damages in an unspecified amount.Defendants moved to dismiss the third consolidatedamended complaint on July 21, 2017.
U.S. Treasury Securities Litigation
GS&Co. is among the primary dealers named as defendantsin several putative class actions relating to the market forU.S. Treasury securities, filed beginning in July 2015 andconsolidated in the U.S. District Court for the SouthernDistrict of New York. The complaints generally allege thatthe defendants violated the federal antitrust laws and theCommodity Exchange Act in connection with an allegedconspiracy to manipulate the when-issued market andauctions for U.S. Treasury securities, as well as relatedfutures and options, and seek declaratory and injunctiverelief, treble damages in an unspecified amount andrestitution.
Employment-Related Matters
On September 15, 2010, a putative class action was filed inthe U.S. District Court for the Southern District of NewYork by three female former employees alleging that GroupInc. and GS&Co. have systematically discriminated againstfemale employees in respect of compensation, promotion,assignments, mentoring and performance evaluations. Thecomplaint alleges a class consisting of all female employeesemployed at specified levels in specified areas by Group Inc.and GS&Co. since July 2002, and asserts claims underfederal and New York City discrimination laws. Thecomplaint seeks class action status, injunctive relief andunspecified amounts of compensatory, punitive and otherdamages. On July 17, 2012, the district court issued adecision granting in part Group Inc.’s and GS&Co.’smotion to strike certain of plaintiffs’ class allegations on theground that plaintiffs lacked standing to pursue certainequitable remedies and denying Group Inc.’s and GS&Co.’smotion to strike plaintiffs’ class allegations in their entiretyas premature. On March 21, 2013, the U.S. Court ofAppeals for the Second Circuit held that arbitration shouldbe compelled with one of the named plaintiffs, who as amanaging director was a party to an arbitration agreementwith the firm. On March 10, 2015, the magistrate judge towhom the district judge assigned the remaining plaintiffs’May 2014 motion for class certification recommended thatthe motion be denied in all respects. On August 3, 2015, themagistrate judge denied plaintiffs’ motion forreconsideration of that recommendation and granted theplaintiffs’ motion to intervene two female individuals, oneof whom was employed by the firm as of September 2010and the other of whom ceased to be an employee of the firmsubsequent to the magistrate judge’s decision. OnJune 6, 2016, the district court affirmed the magistratejudge’s decision on intervention. On April 12, 2017, thedistrict court denied defendants’ motion to dismiss theclaims of the intervenors for lack of standing and mootness,which the court has certified for an interlocutory appeal,subject to acceptance by the appellate court.
87 Goldman Sachs June 2017 Form 10-Q

THE GOLDMAN SACHS GROUP, INC. AND SUBSIDIARIES
Notes to Condensed Consolidated Financial Statements(Unaudited)
Regulatory Investigations and Reviews and Related
Litigation
Group Inc. and certain of its affiliates are subject to anumber of other investigations and reviews by, and in somecases have received subpoenas and requests for documentsand information from, various governmental andregulatory bodies and self-regulatory organizations andlitigation and shareholder requests relating to variousmatters relating to the firm’s businesses and operations,including:
‰ The 2008 financial crisis;
‰ The public offering process;
‰ The firm’s investment management and financialadvisory services;
‰ Conflicts of interest;
‰ Research practices, including research independence andinteractions between research analysts and other firmpersonnel, including investment banking personnel, aswell as third parties;
‰ Transactions involving government-related financingsand other matters, including those related to 1MalaysiaDevelopment Berhad (1MDB), a sovereign wealth fund inMalaysia, municipal securities, including wall-crossprocedures and conflict of interest disclosure with respectto state and municipal clients, the trading and structuringof municipal derivative instruments in connection withmunicipal offerings, political contribution rules,municipal advisory services and the possible impact ofcredit default swap transactions on municipal issuers;
‰ The offering, auction, sales, trading and clearance ofcorporate and government securities, currencies,commodities and other financial products and relatedsales and other communications and activities, as well asthe firm’s supervision and controls relating to suchactivities, including compliance with the SEC’s short salerule, algorithmic, high-frequency and quantitativetrading, the firm’s U.S. alternative trading system (darkpool), futures trading, options trading, when-issuedtrading, transaction reporting, technology systems andcontrols, securities lending practices, trading andclearance of credit derivative instruments and interest rateswaps, commodities activities and metals storage, privateplacement practices, allocations of and trading insecurities, and trading activities and communications inconnection with the establishment of benchmark rates,such as currency rates;
‰ Compliance with the U.S. Foreign Corrupt Practices Act;
‰ The firm’s hiring and compensation practices;
‰ The firm’s system of risk management and controls; and
‰ Insider trading, the potential misuse and dissemination ofmaterial nonpublic information regarding corporate andgovernmental developments and the effectiveness of thefirm’s insider trading controls and information barriers.
The firm is cooperating with all such governmental andregulatory investigations and reviews.
Goldman Sachs June 2017 Form 10-Q 88

Report of Independent Registered PublicAccounting Firm
To the Board of Directors and the Shareholders ofThe Goldman Sachs Group, Inc.:
We have reviewed the accompanying condensedconsolidated statement of financial condition of TheGoldman Sachs Group, Inc. and its subsidiaries (theCompany) as of June 30, 2017, the related condensedconsolidated statements of earnings for the three and sixmonths ended June 30, 2017 and 2016, the condensedconsolidated statements of comprehensive income for thethree and six months ended June 30, 2017 and 2016, thecondensed consolidated statement of changes inshareholders’ equity for the six months endedJune 30, 2017, and the condensed consolidated statementsof cash flows for the six months ended June 30, 2017 and2016. These condensed consolidated interim financialstatements are the responsibility of the Company’smanagement.
We conducted our review in accordance with the standardsof the Public Company Accounting Oversight Board(United States). A review of interim financial informationconsists principally of applying analytical procedures andmaking inquiries of persons responsible for financial andaccounting matters. It is substantially less in scope than anaudit conducted in accordance with the standards of thePublic Company Accounting Oversight Board (UnitedStates), the objective of which is the expression of anopinion regarding the financial statements taken as awhole. Accordingly, we do not express such an opinion.
Based on our review, we are not aware of any materialmodifications that should be made to the accompanyingcondensed consolidated interim financial statements forthem to be in conformity with accounting principlesgenerally accepted in the United States of America.
We previously audited, in accordance with the standards ofthe Public Company Accounting Oversight Board (UnitedStates), the consolidated statement of financial condition asof December 31, 2016, and the related consolidatedstatements of earnings, comprehensive income, changes inshareholders’ equity and cash flows for the year then ended(not presented herein), and in our report datedFebruary 24, 2017, we expressed an unqualified opinion onthose consolidated financial statements. In our opinion, theinformation set forth in the accompanying condensedconsolidated statement of financial condition as ofDecember 31, 2016, and the condensed consolidatedstatement of changes in shareholders’ equity for the yearended December 31, 2016, is fairly stated in all materialrespects in relation to the consolidated financial statementsfrom which it has been derived.
/s/ PRICEWATERHOUSECOOPERS LLP
New York, New YorkAugust 3, 2017
89 Goldman Sachs June 2017 Form 10-Q

THE GOLDMAN SACHS GROUP, INC. AND SUBSIDIARIES
Statistical Disclosures
Distribution of Assets, Liabilities and Shareholders’
Equity
The tables below present a summary of average balances,interest and interest rates.
Average Balance for the
Three MonthsEnded June
Six MonthsEnded June
$ in millions 2017 2016 2017 2016
Assets
U.S. $ 66,480 $ 73,159 $ 70,340 $ 65,155Non-U.S. 37,485 33,936 34,848 32,701Total deposits with banks 103,965 107,095 105,188 97,856U.S. 165,046 183,599 164,818 186,593Non-U.S. 124,804 132,619 127,557 130,462Total collateralized agreements 289,850 316,218 292,375 317,055U.S. 166,961 143,524 159,711 150,418Non-U.S. 109,850 102,775 107,341 100,238Total financial instruments owned 276,811 246,299 267,052 250,656U.S. 47,930 42,674 46,793 42,559Non-U.S. 4,328 5,189 4,385 4,907Total loans receivable 52,258 47,863 51,178 47,466U.S. 40,635 37,549 37,547 36,071Non-U.S. 40,815 30,530 39,806 32,108Total other interest-earning assets 81,450 68,079 77,353 68,179Total interest-earning assets 804,334 785,554 793,146 781,212Cash and due from banks 11,935 16,205 11,700 15,183Other non-interest-earning assets 83,100 90,658 82,131 91,845Total assets $899,369 $892,417 $886,977 $888,240Liabilities
U.S. $ 98,527 $ 98,642 $100,168 $ 90,827Non-U.S. 23,740 17,857 21,262 17,028Total interest-bearing deposits 122,267 116,499 121,430 107,855U.S. 58,747 51,559 54,818 54,564Non-U.S. 39,052 34,436 37,445 32,038Total collateralized financings 97,799 85,995 92,263 86,602U.S. 31,538 37,083 33,016 37,645Non-U.S. 41,973 36,597 40,001 36,012Total financial instruments sold,
but not yet purchased 73,511 73,680 73,017 73,657U.S. 36,322 45,330 36,447 44,640Non-U.S. 12,480 14,951 12,898 14,391Total short-term borrowings 48,802 60,281 49,345 59,031U.S. 198,197 182,786 193,556 180,804Non-U.S. 13,696 10,331 12,897 9,666Total long-term borrowings 211,893 193,117 206,453 190,470U.S. 135,454 147,059 135,101 149,826Non-U.S. 61,712 61,359 60,153 61,801Total other interest-bearing
liabilities 197,166 208,418 195,254 211,627Total interest-bearing liabilities 751,438 737,990 737,762 729,242Non-interest-bearing deposits 3,621 2,830 3,517 2,664Other non-interest-bearing liabilities 57,710 65,177 59,022 69,686Total liabilities 812,769 805,997 800,301 801,592Shareholders’ equity
Preferred stock 11,203 11,203 11,203 11,298Common stock 75,397 75,217 75,473 75,350Total shareholders’ equity 86,600 86,420 86,676 86,648Total liabilities and
shareholders’ equity $899,369 $892,417 $886,977 $888,240Percentage of interest-earning assets and interest-bearing liabilities
attributable to non-U.S. operations
Assets 39.45% 38.83% 39.58% 38.46%Liabilities 25.64% 23.79% 25.03% 23.44%
Interest for the
Three MonthsEnded June
Six MonthsEnded June
$ in millions 2017 2016 2017 2016
Assets
U.S. $ 178 $ 94 $ 327 $ 165Non-U.S. 15 19 28 39Total deposits with banks 193 113 355 204U.S. 340 91 573 118Non-U.S. 57 118 105 200Total collateralized agreements 397 209 678 318U.S. 1,013 993 1,943 1,983Non-U.S. 480 461 901 889Total financial instruments owned 1,493 1,454 2,844 2,872U.S. 564 377 1,064 739Non-U.S. 71 55 136 105Total loans receivable 635 432 1,200 844U.S. 377 227 667 455Non-U.S. 125 95 222 185Total other interest-earning assets 502 322 889 640Total interest-earning assets $3,220 $2,530 $5,966 $4,878
Liabilities
U.S. $ 270 $ 203 $ 511 $ 349Non-U.S. 45 22 78 45Total interest-bearing deposits 315 225 589 394U.S. 177 85 291 172Non-U.S. 35 39 57 70Total collateralized financings 212 124 348 242U.S. 160 141 328 309Non-U.S. 209 176 377 322Total financial instruments sold, but not
yet purchased 369 317 705 631U.S. 182 94 295 210Non-U.S. 9 15 17 26Total short-term borrowings 191 109 312 236U.S. 1,111 995 2,272 1,851Non-U.S. 13 25 28 34Total long-term borrowings 1,124 1,020 2,300 1,885U.S. 139 (174) 176 (437)Non-U.S. 82 155 232 290Total other interest-bearing liabilities 221 (19) 408 (147)Total interest-bearing liabilities 2,432 1,776 4,662 3,241
Net interest income
U.S. $ 433 $ 438 $ 701 $1,006Non-U.S. 355 316 603 631Net interest income $ 788 $ 754 $1,304 $1,637
Goldman Sachs June 2017 Form 10-Q 90
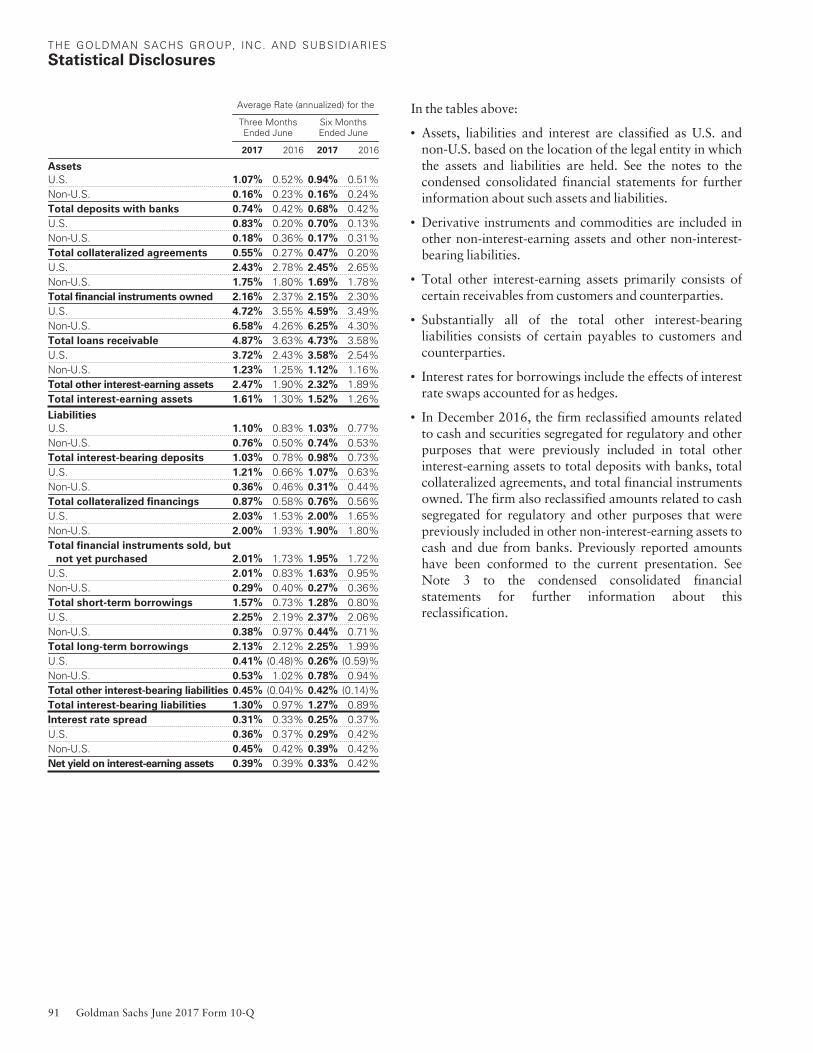
THE GOLDMAN SACHS GROUP, INC. AND SUBSIDIARIES
Statistical Disclosures
Average Rate (annualized) for the
Three MonthsEnded June
Six MonthsEnded June
2017 2016 2017 2016
Assets
U.S. 1.07% 0.52% 0.94% 0.51%Non-U.S. 0.16% 0.23% 0.16% 0.24%Total deposits with banks 0.74% 0.42% 0.68% 0.42%U.S. 0.83% 0.20% 0.70% 0.13%Non-U.S. 0.18% 0.36% 0.17% 0.31%Total collateralized agreements 0.55% 0.27% 0.47% 0.20%U.S. 2.43% 2.78% 2.45% 2.65%Non-U.S. 1.75% 1.80% 1.69% 1.78%Total financial instruments owned 2.16% 2.37% 2.15% 2.30%U.S. 4.72% 3.55% 4.59% 3.49%Non-U.S. 6.58% 4.26% 6.25% 4.30%Total loans receivable 4.87% 3.63% 4.73% 3.58%U.S. 3.72% 2.43% 3.58% 2.54%Non-U.S. 1.23% 1.25% 1.12% 1.16%Total other interest-earning assets 2.47% 1.90% 2.32% 1.89%Total interest-earning assets 1.61% 1.30% 1.52% 1.26%Liabilities
U.S. 1.10% 0.83% 1.03% 0.77%Non-U.S. 0.76% 0.50% 0.74% 0.53%Total interest-bearing deposits 1.03% 0.78% 0.98% 0.73%U.S. 1.21% 0.66% 1.07% 0.63%Non-U.S. 0.36% 0.46% 0.31% 0.44%Total collateralized financings 0.87% 0.58% 0.76% 0.56%U.S. 2.03% 1.53% 2.00% 1.65%Non-U.S. 2.00% 1.93% 1.90% 1.80%Total financial instruments sold, but
not yet purchased 2.01% 1.73% 1.95% 1.72%U.S. 2.01% 0.83% 1.63% 0.95%Non-U.S. 0.29% 0.40% 0.27% 0.36%Total short-term borrowings 1.57% 0.73% 1.28% 0.80%U.S. 2.25% 2.19% 2.37% 2.06%Non-U.S. 0.38% 0.97% 0.44% 0.71%Total long-term borrowings 2.13% 2.12% 2.25% 1.99%U.S. 0.41% (0.48)% 0.26% (0.59)%Non-U.S. 0.53% 1.02% 0.78% 0.94%Total other interest-bearing liabilities 0.45% (0.04)% 0.42% (0.14)%Total interest-bearing liabilities 1.30% 0.97% 1.27% 0.89%Interest rate spread 0.31% 0.33% 0.25% 0.37%U.S. 0.36% 0.37% 0.29% 0.42%Non-U.S. 0.45% 0.42% 0.39% 0.42%Net yield on interest-earning assets 0.39% 0.39% 0.33% 0.42%
In the tables above:
‰ Assets, liabilities and interest are classified as U.S. andnon-U.S. based on the location of the legal entity in whichthe assets and liabilities are held. See the notes to thecondensed consolidated financial statements for furtherinformation about such assets and liabilities.
‰ Derivative instruments and commodities are included inother non-interest-earning assets and other non-interest-bearing liabilities.
‰ Total other interest-earning assets primarily consists ofcertain receivables from customers and counterparties.
‰ Substantially all of the total other interest-bearingliabilities consists of certain payables to customers andcounterparties.
‰ Interest rates for borrowings include the effects of interestrate swaps accounted for as hedges.
‰ In December 2016, the firm reclassified amounts relatedto cash and securities segregated for regulatory and otherpurposes that were previously included in total otherinterest-earning assets to total deposits with banks, totalcollateralized agreements, and total financial instrumentsowned. The firm also reclassified amounts related to cashsegregated for regulatory and other purposes that werepreviously included in other non-interest-earning assets tocash and due from banks. Previously reported amountshave been conformed to the current presentation. SeeNote 3 to the condensed consolidated financialstatements for further information about thisreclassification.
91 Goldman Sachs June 2017 Form 10-Q

THE GOLDMAN SACHS GROUP, INC. AND SUBSIDIARIES
Item 2. Management’s Discussionand Analysis of Financial Conditionand Results of Operations
Introduction
The Goldman Sachs Group, Inc. (Group Inc. or parentcompany), a Delaware corporation, together with itsconsolidated subsidiaries, is a leading global investmentbanking, securities and investment management firm thatprovides a wide range of financial services to a substantialand diversified client base that includes corporations,financial institutions, governments and individuals. Foundedin 1869, we are headquartered in New York and maintainoffices in all major financial centers around the world.
When we use the terms “the firm,” “we,” “us” and “our,”we mean Group Inc. and its consolidated subsidiaries. Wereport our activities in four business segments: InvestmentBanking, Institutional Client Services, Investing & Lendingand Investment Management. See “Results of Operations”below for further information about our business segments.
This Management’s Discussion and Analysis of FinancialCondition and Results of Operations should be read inconjunction with our Annual Report on Form 10-K for theyear ended December 31, 2016. References to “the 2016Form 10-K” are to our Annual Report on Form 10-K for theyear ended December 31, 2016. References to “thisForm 10-Q” are to our Quarterly Report on Form 10-Q forthe quarterly period ended June 30, 2017. All references to“the condensed consolidated financial statements” or“Statistical Disclosures” are to Part I, Item 1 of thisForm 10-Q. All references to June 2017, March 2017 andJune 2016 refer to our periods ended, or the dates, as thecontext requires, June 30, 2017, March 31, 2017 andJune 30, 2016, respectively. All references to December 2016refer to the date December 31, 2016. Any reference to afuture year refers to a year ending on December 31 of thatyear. Certain reclassifications have been made to previouslyreported amounts to conform to the current presentation.
Executive Overview
Three Months Ended June 2017 versus June 2016. Wegenerated net earnings of $1.83 billion and diluted earningsper common share of $3.95 for the second quarter of 2017,essentially unchanged and an increase of 6%, respectively,compared with $1.82 billion and $3.72 per share for thesecond quarter of 2016. Annualized return on averagecommon shareholders’ equity was 8.7% for the secondquarter of 2017, unchanged compared with the secondquarter of 2016. Book value per common share was$187.32 as of June 2017, 1.3% higher compared withMarch 2017.
Net revenues were $7.89 billion for the second quarter of2017, essentially unchanged compared with the secondquarter of 2016, as lower net revenues in InstitutionalClient Services, reflecting significantly lower net revenues inFixed Income, Currency and Commodities ClientExecution (FICC Client Execution), and slightly lower netrevenues in Investment Banking were offset by significantlyhigher net revenues in Investing & Lending and higher netrevenues in Investment Management.
Operating expenses were $5.38 billion for the secondquarter of 2017, 2% lower than the second quarter of2016, due to slightly lower compensation and benefitsexpenses. Non-compensation expenses were essentiallyunchanged.
We maintained strong capital ratios and liquidity. OurCommon Equity Tier 1 (CET1) ratio as calculated inaccordance with the Standardized approach and theBasel III Advanced approach, in each case reflecting theapplicable transitional provisions, was 13.9% and 12.5%,respectively, and our global core liquid assets were$221 billion, all as of June 2017. See Note 20 to thecondensed consolidated financial statements for furtherinformation about our capital ratios. See “RiskManagement — Liquidity Risk Management” below forfurther information about our global core liquid assets.
Six Months Ended June 2017 versus June 2016. Wegenerated net earnings of $4.09 billion and diluted earningsper common share of $9.10 for the first half of 2017, anincrease of 38% and 42%, respectively, compared with$2.96 billion and $6.39 per share for the first half of 2016.Annualized return on average common shareholders’ equitywas 10.1% for the first half of 2017, compared with 7.5%for the first half of 2016.
In the first quarter of 2017, as required, we adopted ASUNo. 2016-09, “Compensation — Stock Compensation(Topic 718) — Improvements to Employee Share-BasedPayment Accounting.” The impact from adoption in thefirst half of 2017 was a reduction to our provision for taxesof $485 million, which increased diluted earnings percommon share by $1.16 and annualized return on averagecommon shareholders’ equity by 1.3 percentage points. SeeNote 3 to the condensed consolidated financial statementsfor further information about this ASU.
Goldman Sachs June 2017 Form 10-Q 92
THE GOLDMAN SACHS GROUP, INC. AND SUBSIDIARIES
Management’s Discussion and Analysis
Net revenues were $15.91 billion for the first half of 2017,12% higher than the first half of 2016, due to significantlyhigher net revenues in Investing & Lending and higher netrevenues in both Investment Management and InvestmentBanking. These results were partially offset by lower netrevenues in Institutional Client Services, reflectingsignificantly lower net revenues in FICC Client Execution.
Operating expenses were $10.87 billion for the first half of2017, 6% higher than the first half of 2016, due to highercompensation and benefits expenses, reflecting an increasein net revenues, and slightly higher non-compensationexpenses.
Business Environment
Global
During the second quarter of 2017, global economicgrowth appeared to improve modestly compared with theprevious quarter, as real gross domestic product (GDP)growth increased in the U.S., the Euro area and the U.K.and appeared to increase in Japan. Similar to the firstquarter of 2017, global macroeconomic data remainedstrong throughout the second quarter, and volatility inequity, fixed income, currency and commodity marketsremained low. France held a presidential election inMay 2017 and the U.K. held a general election inJune 2017, but neither resulted in a significant increase involatility across markets. Major central banks continued togradually tighten their stance on monetary policy, as theU.S. Federal Reserve increased its target federal funds ratein June 2017, and the European Central Bank decreased thepace of its monthly asset purchases beginning inApril 2017. The price of crude oil (WTI) ended the quarterat approximately $46 per barrel, a decrease of 9% from theend of the first quarter. In investment banking, industry-wide announced and completed mergers and acquisitionsvolumes increased compared with the first quarter of 2017.Industry-wide equity underwriting offerings improvedduring the second quarter of 2017 and industry-wide debtunderwriting offerings remained solid, but decreasedcompared with the first quarter of 2017.
United States
In the U.S., real GDP growth increased compared with theprevious quarter, reflecting an increase in consumerspending growth. Measures of consumer confidencedeclined modestly, but remained high, and the pace ofhousing starts and home sales slowed, compared with thefirst quarter of 2017. The unemployment rate was 4.4% asof June 2017, slightly lower than the end of the firstquarter, and measures of inflation decreased. Following arate increase of 25 basis points in March 2017, the U.S.Federal Reserve increased its target rate for the federalfunds rate again in June by 25 basis points to a range of1.00% to 1.25%. The yield on the 10-year U.S. Treasurynote ended the quarter at 2.30%, 9 basis points lowercompared with the end of the first quarter. In equitymarkets, the NASDAQ Composite Index, the S&P 500Index and the Dow Jones Industrial Average increased by4%, 3% and 3%, respectively, compared with the end ofthe first quarter of 2017.
Europe
In the Euro area, real GDP growth increased comparedwith the first quarter of 2017, while measures of inflationwere mixed. The European Central Bank maintained itsmain refinancing operations rate at 0.00% and its depositrate at (0.40)%. In addition, the European Central Bankreduced the pace of its monthly asset purchases from€80 billion to €60 billion beginning in April 2017.Measures of unemployment remained high, but continuedto decline, and the Euro appreciated by 7% against the U.S.dollar in the second quarter. In the U.K., real GDP growthincreased compared with the previous quarter. The Bank ofEngland maintained its official bank rate at 0.25%, and theBritish pound appreciated by 4% against the U.S. dollar.Yields on 10-year government bonds increased in Germanyand the U.K., but decreased in France and Italy. In equitymarkets, the DAX Index, CAC 40 Index and FTSE 100Index all ended the second quarter essentially unchangedcompared with the end of the first quarter while the EuroStoxx 50 Index decreased by 2%.
93 Goldman Sachs June 2017 Form 10-Q

THE GOLDMAN SACHS GROUP, INC. AND SUBSIDIARIES
Management’s Discussion and Analysis
Asia
In Japan, real GDP growth appeared to increase comparedwith the first quarter of 2017. The Bank of Japan maintainedits asset purchase program and continued to target a yield on10-year Japanese government bonds of approximately 0%.The yield on 10-year Japanese government bonds roseslightly, the U.S. dollar appreciated by 1% against theJapanese yen, and the Nikkei 225 Index increased by 6% inthe second quarter. In China, real GDP growth remainedstable during the quarter and measures of inflation increased.The People’s Bank of China maintained a neutral monetarypolicy stance in the second quarter. The U.S. dollardepreciated by 1% against the Chinese yuan compared withthe end of the first quarter, and in equity markets, the HangSeng Index increased by 7% while the Shanghai CompositeIndex decreased by 1%. In India, economic growth appearedto increase compared with the previous quarter. The U.S.dollar was essentially unchanged against the Indian rupee,and the BSE Sensex Index increased by 4% compared withthe end of the first quarter of 2017.
Critical Accounting Policies
Fair Value
Fair Value Hierarchy. Financial instruments owned andFinancial instruments sold, but not yet purchased (i.e.,inventory), as well as certain other financial assets andfinancial liabilities, are reflected in our condensedconsolidated statements of financial condition at fair value(i.e., marked-to-market), with related gains or lossesgenerally recognized in our condensed consolidatedstatements of earnings. The use of fair value to measurefinancial instruments is fundamental to our risk managementpractices and is our most critical accounting policy.
The fair value of a financial instrument is the amount thatwould be received to sell an asset or paid to transfer aliability in an orderly transaction between marketparticipants at the measurement date. We measure certainfinancial assets and financial liabilities as a portfolio (i.e.,based on its net exposure to market and/or credit risks). Indetermining fair value, the hierarchy under U.S. generallyaccepted accounting principles (U.S. GAAP) gives (i) thehighest priority to unadjusted quoted prices in activemarkets for identical, unrestricted assets or liabilities(level 1 inputs), (ii) the next priority to inputs other thanlevel 1 inputs that are observable, either directly orindirectly (level 2 inputs), and (iii) the lowest priority toinputs that cannot be observed in market activity (level 3inputs). In evaluating the significance of a valuation input,we consider, among other factors, a portfolio’s net riskexposure to that input. Assets and liabilities are classified intheir entirety based on the lowest level of input that issignificant to their fair value measurement.
The fair values for substantially all of our financial assetsand financial liabilities are based on observable prices andinputs and are classified in levels 1 and 2 of the fair valuehierarchy. Certain level 2 and level 3 financial assets andfinancial liabilities may require appropriate valuationadjustments that a market participant would require toarrive at fair value for factors such as counterparty and ourcredit quality, funding risk, transfer restrictions, liquidityand bid/offer spreads.
Instruments classified in level 3 of the fair value hierarchy arethose which require one or more significant inputs that arenot observable. As of June 2017, March 2017 andDecember 2016, level 3 financial assets represented 2.3%,2.6% and 2.7%, respectively, of our total assets. See Notes 5through 8 to the condensed consolidated financial statementsfor further information about level 3 financial assets,including changes in level 3 financial assets and related fairvalue measurements. Absent evidence to the contrary,instruments classified in level 3 of the fair value hierarchy areinitially valued at transaction price, which is considered to bethe best initial estimate of fair value. Subsequent to thetransaction date, we use other methodologies to determinefair value, which vary based on the type of instrument.Estimating the fair value of level 3 financial instrumentsrequires judgments to be made. These judgments include:
‰ Determining the appropriate valuation methodologyand/or model for each type of level 3 financial instrument;
‰ Determining model inputs based on an evaluation of allrelevant empirical market data, including pricesevidenced by market transactions, interest rates, creditspreads, volatilities and correlations; and
‰ Determining appropriate valuation adjustments,including those related to illiquidity or counterpartycredit quality.
Regardless of the methodology, valuation inputs andassumptions are only changed when corroborated bysubstantive evidence.
Controls Over Valuation of Financial Instruments.
Market makers and investment professionals in ourrevenue-producing units are responsible for pricing ourfinancial instruments. Our control infrastructure isindependent of the revenue-producing units and isfundamental to ensuring that all of our financialinstruments are appropriately valued at market-clearinglevels. In the event that there is a difference of opinion insituations where estimating the fair value of financialinstruments requires judgment (e.g., calibration to marketcomparables or trade comparison, as described below), thefinal valuation decision is made by senior managers incontrol and support functions. This independent priceverification is critical to ensuring that our financialinstruments are properly valued.
Goldman Sachs June 2017 Form 10-Q 94
THE GOLDMAN SACHS GROUP, INC. AND SUBSIDIARIES
Management’s Discussion and Analysis
Price Verification. All financial instruments at fair valueclassified in levels 1, 2 and 3 of the fair value hierarchy aresubject to our independent price verification process. Theobjective of price verification is to have an informed andindependent opinion with regard to the valuation offinancial instruments under review. Instruments that haveone or more significant inputs which cannot becorroborated by external market data are classified inlevel 3 of the fair value hierarchy. Price verificationstrategies utilized by our independent control and supportfunctions include:
‰ Trade Comparison. Analysis of trade data (both internaland external where available) is used to determine themost relevant pricing inputs and valuations.
‰ External Price Comparison. Valuations and prices arecompared to pricing data obtained from third parties(e.g., brokers or dealers, Markit, Bloomberg, IDC,TRACE). Data obtained from various sources iscompared to ensure consistency and validity. Whenbroker or dealer quotations or third-party pricingvendors are used for valuation or price verification,greater priority is generally given to executablequotations.
‰ Calibration to Market Comparables. Market-basedtransactions are used to corroborate the valuation ofpositions with similar characteristics, risks andcomponents.
‰ Relative Value Analyses. Market-based transactionsare analyzed to determine the similarity, measured interms of risk, liquidity and return, of one instrumentrelative to another or, for a given instrument, of onematurity relative to another.
‰ Collateral Analyses. Margin calls on derivatives areanalyzed to determine implied values which are used tocorroborate our valuations.
‰ Execution of Trades. Where appropriate, trading desksare instructed to execute trades in order to provideevidence of market-clearing levels.
‰ Backtesting. Valuations are corroborated bycomparison to values realized upon sales.
See Notes 5 through 8 to the condensed consolidatedfinancial statements for further information about fairvalue measurements.
Review of Net Revenues. Independent control andsupport functions ensure adherence to our pricing policythrough a combination of daily procedures, including theexplanation and attribution of net revenues based on theunderlying factors. Through this process we independentlyvalidate net revenues, identify and resolve potential fairvalue or trade booking issues on a timely basis and seek toensure that risks are being properly categorized andquantified.
Review of Valuation Models. Our independent modelrisk management group (Model Risk Management),consisting of quantitative professionals who are separatefrom model developers, performs an independent modelreview and validation process of our valuation models.New or changed models are reviewed and approved priorto being put into use. Models are evaluated andre-approved annually to assess the impact of any changes inthe product or market and any market developments inpricing theories. See “Risk Management — Model RiskManagement” for further information about the reviewand validation of our valuation models.
Goodwill and Identifiable Intangible Assets
Goodwill. Goodwill is the cost of acquired companies inexcess of the fair value of net assets, including identifiableintangible assets, at the acquisition date.
Goodwill is assessed for impairment annually in the fourthquarter or more frequently if events occur or circumstanceschange that indicate an impairment may exist. Whenassessing goodwill for impairment, first, qualitative factorsare assessed to determine whether it is more likely than notthat the fair value of a reporting unit is less than its carryingvalue. If the results of the qualitative assessment are notconclusive, a quantitative goodwill test is performed bycomparing the estimated fair value of each reporting unitwith its carrying value.
During the fourth quarter of 2016, we determined thatgoodwill for all reporting units was not impaired. Therewere no events or changes in circumstances during the sixmonths ended June 2017 that would indicate that it wasmore likely than not that the fair value of each of thereporting units did not exceed its respective carrying valueas of June 2017. See Note 13 to the condensed consolidatedfinancial statements for further information about ourgoodwill.
Estimating the fair value of our reporting units requiresmanagement to make judgments. Critical inputs to the fairvalue estimates include projected earnings and attributedequity. There is inherent uncertainty in the projectedearnings. The net book value of each reporting unit reflectsan allocation of total shareholders’ equity and representsthe estimated amount of total shareholders’ equity requiredto support the activities of the reporting unit undercurrently applicable regulatory capital requirements. See“Equity Capital Management and Regulatory Capital” forfurther information about our capital requirements.
95 Goldman Sachs June 2017 Form 10-Q

THE GOLDMAN SACHS GROUP, INC. AND SUBSIDIARIES
Management’s Discussion and Analysis
If we experience a prolonged or severe period of weaknessin the business environment or financial markets, oradditional increases in capital requirements, our goodwillcould be impaired in the future. In addition, significantchanges to other inputs of the quantitative goodwill testcould cause the estimated fair value of our reporting unitsto decline, which could result in an impairment of goodwillin the future.
Identifiable Intangible Assets. We amortize ouridentifiable intangible assets over their estimated usefullives generally using the straight-line method. Identifiableintangible assets are tested for impairment whenever eventsor changes in circumstances suggest that an asset’s or assetgroup’s carrying value may not be fully recoverable.
A prolonged or severe period of market weakness, orsignificant changes in regulation, could adversely impactour businesses and impair the value of our identifiableintangible assets. In addition, certain events could indicate apotential impairment of our identifiable intangible assets,including weaker business performance resulting in adecrease in our customer base and decreases in revenuesfrom customer contracts and relationships. Managementjudgment is required to evaluate whether indications ofpotential impairment have occurred, and to test intangibleassets for impairment if required.
An impairment, generally calculated as the differencebetween the estimated fair value and the carrying value ofan asset or asset group, is recognized if the total of theestimated undiscounted cash flows relating to the asset orasset group is less than the corresponding carrying value.
See Note 13 to the condensed consolidated financialstatements for further information about our identifiableintangible assets.
Recent Accounting Developments
See Note 3 to the condensed consolidated financialstatements for information about Recent AccountingDevelopments.
Use of Estimates
U.S. GAAP requires management to make certain estimatesand assumptions. In addition to the estimates we make inconnection with fair value measurements, the accountingfor goodwill and identifiable intangible assets, anddiscretionary compensation accruals, the use of estimatesand assumptions is also important in determiningprovisions for losses that may arise from litigation,regulatory proceedings (including governmentalinvestigations) and tax audits, and the allowance for losseson loans receivable and lending commitments held forinvestment.
A substantial portion of our compensation and benefitsrepresents discretionary compensation, which is finalized atyear-end. We believe the most appropriate way to allocateestimated annual discretionary compensation amonginterim periods is in proportion to the net revenues earnedin such periods. In addition to the level of net revenues, ouroverall compensation expense in any given year is alsoinfluenced by, among other factors, overall financialperformance, prevailing labor markets, business mix, thestructure of our share-based compensation programs andthe external environment. See “Results of Operations —Financial Overview — Operating Expenses” below forinformation about our ratio of compensation and benefitsto net revenues.
We estimate and provide for potential losses that may ariseout of litigation and regulatory proceedings to the extentthat such losses are probable and can be reasonablyestimated. In addition, we estimate the upper end of therange of reasonably possible aggregate loss in excess of therelated reserves for litigation and regulatory proceedingswhere we believe the risk of loss is more than slight. SeeNotes 18 and 27 to the condensed consolidated financialstatements for information about certain judicial, litigationand regulatory proceedings.
Significant judgment is required in making these estimatesand our final liabilities may ultimately be materiallydifferent. Our total estimated liability in respect of litigationand regulatory proceedings is determined on a case-by-casebasis and represents an estimate of probable losses afterconsidering, among other factors, the progress of each case,proceeding or investigation, our experience and theexperience of others in similar cases, proceedings orinvestigations, and the opinions and views of legal counsel.
In accounting for income taxes, we recognize tax positionsin the financial statements only when it is more likely thannot that the position will be sustained on examination bythe relevant taxing authority based on the technical meritsof the position. See Note 24 to the condensed consolidatedfinancial statements for further information aboutaccounting for income taxes.
We also estimate and record an allowance for losses relatedto our loans receivable and lending commitments held forinvestment. Management’s estimate of loan losses entailsjudgment about loan collectability at the reporting dates,and there are uncertainties inherent in those judgments. SeeNote 9 to the condensed consolidated financial statementsfor further information about the allowance for losses onloans receivable and lending commitments held forinvestment.
Goldman Sachs June 2017 Form 10-Q 96

THE GOLDMAN SACHS GROUP, INC. AND SUBSIDIARIES
Management’s Discussion and Analysis
Results of Operations
The composition of our net revenues has varied over time asfinancial markets and the scope of our operations havechanged. The composition of net revenues can also varyover the shorter term due to fluctuations in U.S. and globaleconomic and market conditions. See “Risk Factors” inPart I, Item 1A of the 2016 Form 10-K for furtherinformation about the impact of economic and marketconditions on our results of operations.
Financial Overview
The table below presents an overview of our financialresults and selected financial ratios.
Three MonthsEnded June
Six MonthsEnded June
$ in millions, except per share amounts 2017 2016 2017 2016
Net revenues $ 7,887 $ 7,932 $15,913 $14,270Pre-tax earnings $ 2,509 $ 2,463 $ 5,048 $ 4,039Net earnings $ 1,831 $ 1,822 $ 4,086 $ 2,957Net earnings applicable to
common shareholders $ 1,631 $ 1,634 $ 3,793 $ 2,834
Diluted earnings per common share $ 3.95 $ 3.72 $ 9.10 $ 6.39Annualized return on average
common shareholders’ equity 8.7% 8.7% 10.1% 7.5%Annualized net earnings to
average assets 0.8% 0.8% 0.9% 0.7%Annualized return on average total
shareholders’ equity 8.5% 8.4% 9.4% 6.8%Total average equity to average
assets 9.6% 9.7% 9.8% 9.8%
Dividend payout ratio 19.0% 17.5% 15.4% 20.3%
In the table above:
‰ Net earnings applicable to common shareholders for thesix months ended June 2016 includes a benefit of$161 million, reflected in preferred stock dividends,related to the exchange of APEX for shares of Series E andSeries F Preferred Stock. See Note 19 to the condensedconsolidated financial statements for further information.
‰ Annualized return on average common shareholders’equity is calculated by dividing annualized net earningsapplicable to common shareholders by average monthlycommon shareholders’ equity. Annualized return onaverage total shareholders’ equity is calculated bydividing annualized net earnings by average monthly totalshareholders’ equity. The table below presents ouraverage common and total shareholders’ equity.
Average for the
Three MonthsEnded June
Six MonthsEnded June
$ in millions 2017 2016 2017 2016
Total shareholders’ equity $ 86,600 $ 86,420 $ 86,676 $ 86,648Preferred stock (11,203) (11,203) (11,203) (11,298)Common shareholders’ equity $ 75,397 $ 75,217 $ 75,473 $ 75,350
‰ Dividend payout ratio is calculated by dividing dividendsdeclared per common share by diluted earnings percommon share.
Net Revenues
The table below presents our net revenues by line item inthe condensed consolidated statements of earnings.
Three MonthsEnded June
Six MonthsEnded June
$ in millions 2017 2016 2017 2016
Investment banking $1,730 $1,787 $ 3,433 $ 3,250Investment management 1,433 1,260 2,830 2,522Commissions and fees 794 777 1,565 1,694Market making 1,915 2,490 4,333 4,352Other principal transactions 1,227 864 2,448 815Total non-interest revenues 7,099 7,178 14,609 12,633Interest income 3,220 2,530 5,966 4,878Interest expense 2,432 1,776 4,662 3,241Net interest income 788 754 1,304 1,637Total net revenues $7,887 $7,932 $15,913 $14,270
In the table above:
‰ Investment banking is comprised of revenues (excludingnet interest) from financial advisory and underwritingassignments, as well as derivative transactions directlyrelated to these assignments. These activities are includedin our Investment Banking segment.
‰ Investment management is comprised of revenues(excluding net interest) from providing investmentmanagement services to a diverse set of clients, as well aswealth advisory services and certain transaction servicesto high-net-worth individuals and families. Theseactivities are included in our Investment Managementsegment.
‰ Commissions and fees is comprised of revenues fromexecuting and clearing client transactions on major stock,options and futures exchanges worldwide, as well asover-the-counter (OTC) transactions. These activities areincluded in our Institutional Client Services andInvestment Management segments.
‰ Market making is comprised of revenues (excluding netinterest) from client execution activities related to makingmarkets in interest rate products, credit products,mortgages, currencies, commodities and equity products.These activities are included in our Institutional ClientServices segment.
‰ Other principal transactions is comprised of revenues(excluding net interest) from our investing activities andthe origination of loans to provide financing to clients. Inaddition, Other principal transactions includes revenuesrelated to our consolidated investments. These activitiesare included in our Investing & Lending segment.
97 Goldman Sachs June 2017 Form 10-Q
THE GOLDMAN SACHS GROUP, INC. AND SUBSIDIARIES
Management’s Discussion and Analysis
Operating Environment. During the first half of 2017,generally higher asset prices and tighter credit spreads weresupportive of industry-wide underwriting activities,investment management performance and other principaltransactions. However, low levels of volatility in equity,fixed income, currency and commodity markets, combinedwith low client conviction to transact, continued tonegatively affect our market-making activities, particularlyin fixed income, currency and commodity products. Inaddition, oil and natural gas prices further declined fromalready low levels in the first quarter of 2017.
If the trend of low volatility continues over the long termand market-making activity levels continue to decline, or ifinvestment banking activity levels decline, or if asset pricesdecline, or if assets under supervision decline, net revenueswould likely be negatively impacted. See “SegmentOperating Results” below for further information aboutthe operating environment and material trends anduncertainties that may impact our results of operations.
Three Months Ended June 2017 versus June 2016
Net revenues in the condensed consolidated statements ofearnings were $7.89 billion for the second quarter of 2017,essentially unchanged compared with the second quarter of2016, as significantly lower market making revenues andslightly lower investment banking revenues were offset bysignificantly higher other principal transactions revenues,higher investment management revenues and slightly highernet interest income and commissions and fees.
Non-Interest Revenues. Investment banking revenues inthe condensed consolidated statements of earnings were$1.73 billion for the second quarter of 2017, 3% lowerthan the second quarter of 2016. Revenues in financialadvisory were lower compared with the second quarter of2016, reflecting a decrease in industry-wide completedmergers and acquisitions. Revenues in underwriting wereessentially unchanged compared with the second quarter of2016. Revenues in debt underwriting were essentiallyunchanged compared with a strong prior year period.Revenues in equity underwriting were slightly lower,reflecting lower revenues from convertible offerings.
Investment management revenues in the condensedconsolidated statements of earnings were $1.43 billion forthe second quarter of 2017, 14% higher than the secondquarter of 2016, due to higher management and other fees,primarily reflecting higher average assets under supervision,as well as higher incentive fees and transaction revenues.
Commissions and fees in the condensed consolidatedstatements of earnings were $794 million for the secondquarter of 2017, 2% higher than the second quarter of2016, as global futures volumes for both us and the marketincreased.
Market making revenues in the condensed consolidatedstatements of earnings were $1.92 billion for the secondquarter of 2017, 23% lower than the second quarter of2016, due to significantly lower revenues in interest rateproducts, commodities, credit products and currencies andlower revenues in equity derivative products. These resultswere partially offset by significantly higher revenues inequity cash products and improved results in mortgages.
Other principal transactions revenues in the condensedconsolidated statements of earnings were $1.23 billion forthe second quarter of 2017, 42% higher than the secondquarter of 2016, primarily reflecting a significant increasein net gains from private equities, which were positivelyimpacted by corporate performance and company-specificevents. These results were partially offset by significantlylower revenues in debt securities and loans, primarilyreflecting lower net gains from investments in debtinstruments.
Net Interest Income. Net interest income in thecondensed consolidated statements of earnings was$788 million for the second quarter of 2017, 5% higherthan the second quarter of 2016, reflecting an increase ininterest income primarily due to higher interest incomefrom loans receivable due to higher yields and an increase intotal average loans receivable, the impact of higher interestrates on collateralized agreements, other interest-earningassets and deposits with banks, and an increase in totalaverage other interest-earning assets. The increase ininterest income was partially offset by higher interestexpense primarily due to the impact of higher interest rateson other interest-bearing liabilities, short-term borrowings,interest-bearing deposits and collateralized financings, aswell as an increase in total average long-term borrowings.See “Statistical Disclosures — Distribution of Assets,Liabilities and Shareholders’ Equity” for furtherinformation about our sources of net interest income.
Six Months Ended June 2017 versus June 2016
Net revenues in the condensed consolidated statements ofearnings were $15.91 billion for the first half of 2017, 12%higher than the first half of 2016, due to significantly higherother principal transactions revenues and higher investmentmanagement revenues and investment banking revenues.These results were partially offset by significantly lower netinterest income and lower commissions and fees. Marketmaking revenues were essentially unchanged.
Goldman Sachs June 2017 Form 10-Q 98

THE GOLDMAN SACHS GROUP, INC. AND SUBSIDIARIES
Management’s Discussion and Analysis
Non-Interest Revenues. Investment banking revenues inthe condensed consolidated statements of earnings were$3.43 billion for the first half of 2017, 6% higher than thefirst half of 2016. Revenues in financial advisory wereslightly lower compared with the first half of 2016.Industry-wide completed mergers and acquisitions declinedcompared with the same prior year period. Revenues inunderwriting were higher compared with the first half of2016, due to higher revenues in debt underwriting,primarily reflecting an increase in industry-wide leveragedfinance activity, and significantly higher revenues in equityunderwriting, reflecting an increase in industry-wideofferings.
Investment management revenues in the condensedconsolidated statements of earnings were $2.83 billion forthe first half of 2017, 12% higher than the first half of2016, due to higher management and other fees, primarilyreflecting higher average assets under supervision, as well ashigher incentive fees and transaction revenues.
Commissions and fees in the condensed consolidatedstatements of earnings were $1.57 billion for the first half of2017, 8% lower than the first half of 2016, reflecting adecline in our listed cash equity volumes in the U.S.,consistent with market volumes in the region.
Market making revenues in the condensed consolidatedstatements of earnings were $4.33 billion for the first half of2017, essentially unchanged compared with the first half of2016, as significantly lower revenues in both commoditiesand credit products and lower revenues in both interest rateproducts and currencies were offset by significantly higherrevenues in both mortgages and equity cash products andhigher revenues in equity derivative products.
Other principal transactions revenues in the condensedconsolidated statements of earnings were $2.45 billion forthe first half of 2017, significantly higher compared withthe first half of 2016, primarily due to a significant increasein revenues in equities securities. This increase primarilyreflected a significant increase in net gains from privateequities, which were positively impacted by corporateperformance and company-specific events. In addition, netgains from public equities were also significantly higher, asglobal equity prices generally increased during the first halfof 2017. Revenues in debt securities and loans were alsosignificantly higher compared with the first half of 2016,primarily reflecting higher net gains from investments indebt instruments.
Net Interest Income. Net interest income in thecondensed consolidated statements of earnings was$1.30 billion for the first half of 2017, 20% lower than thefirst half of 2016, reflecting an increase in interest expenseprimarily due to the impact of higher interest rates on otherinterest-bearing liabilities, long-term borrowings andinterest-bearing deposits, as well as increases in totalaverage long-term borrowings, interest-bearing depositsand collateralized financings. The increase in interestexpense was partially offset by higher interest incomeprimarily due to the impact of higher interest rates oncollateralized agreements and higher interest income fromloans receivable, due to higher yields and an increase intotal average loans receivable, and other interest-earningassets, due to the impact of higher interest rates and anincrease in total average other interest-earning assets. See“Statistical Disclosures — Distribution of Assets, Liabilitiesand Shareholders’ Equity” for further information aboutour sources of net interest income.
Operating Expenses
Our operating expenses are primarily influenced bycompensation, headcount and levels of business activity.Compensation and benefits includes salaries, estimatedyear-end discretionary compensation, amortization ofequity awards and other items such as benefits.Discretionary compensation is significantly impacted by,among other factors, the level of net revenues, overallfinancial performance, prevailing labor markets, businessmix, the structure of our share-based compensationprograms and the external environment. In addition, see“Use of Estimates” for further information about expensesthat may arise from compensation and benefits, andlitigation and regulatory proceedings.
The table below presents our operating expenses and totalstaff (including employees, consultants and temporarystaff).
Three MonthsEnded June
Six MonthsEnded June
$ in millions 2017 2016 2017 2016
Compensation and benefits $ 3,233 $ 3,331 $ 6,524 $ 5,993
Brokerage, clearing, exchangeand distribution fees 663 625 1,278 1,316
Market development 141 112 275 234Communications and technology 224 205 447 402Depreciation and amortization 265 245 522 484Occupancy 190 181 366 364Professional fees 229 231 434 451Other expenses 433 539 1,019 987Total non-compensation expenses 2,145 2,138 4,341 4,238Total operating expenses $ 5,378 $ 5,469 $10,865 $10,231
Total staff at period-end 34,100 34,800
99 Goldman Sachs June 2017 Form 10-Q
THE GOLDMAN SACHS GROUP, INC. AND SUBSIDIARIES
Management’s Discussion and Analysis
Three Months Ended June 2017 versus June 2016.
Operating expenses in the condensed consolidatedstatements of earnings were $5.38 billion for the secondquarter of 2017, 2% lower than the second quarter of2016. The accrual for compensation and benefits expensesin the condensed consolidated statements of earnings was$3.23 billion for the second quarter of 2017, 3% lowerthan the second quarter of 2016.
Non-compensation expenses in the condensed consolidatedstatements of earnings were $2.15 billion for the secondquarter of 2017, essentially unchanged compared with thesecond quarter of 2016, as higher brokerage, clearing,exchange and distribution fees, higher market developmentexpenses and higher depreciation and amortizationexpenses were offset by lower other expenses, reflectinglower net provisions for litigation and regulatoryproceedings. Net provisions for litigation and regulatoryproceedings for the second quarter of 2017 were$22 million compared with $126 million for the secondquarter of 2016.
As of June 2017, total staff was unchanged compared withMarch 2017.
Six Months Ended June 2017 versus June 2016.
Operating expenses in the condensed consolidatedstatements of earnings were $10.87 billion for the first halfof 2017, 6% higher than the first half of 2016. The accrualfor compensation and benefits expenses in the condensedconsolidated statements of earnings was $6.52 billion forthe first half of 2017, 9% higher than the first half of 2016,reflecting an increase in net revenues. The ratio ofcompensation and benefits to net revenues for the first halfof 2017 was 41.0% compared with 42.0% for the first halfof 2016.
Non-compensation expenses in the condensed consolidatedstatements of earnings were $4.34 billion for the first half of2017, 2% higher than the first half of 2016, reflectinghigher communications and technology expenses, highermarket development expenses and higher depreciation andamortization expenses, partially offset by lower brokerage,clearing, exchange and distribution fees. Net provisions forlitigation and regulatory proceedings for the first half of2017 were $161 million compared with $203 million forthe first half of 2016.
As of June 2017, total staff was essentially unchangedcompared with December 2016.
Provision for Taxes
The effective income tax rate for the first half of 2017 was19.1%. The decrease compared with the full year effectiveincome tax rate of 28.2% for 2016 was primarily due to taxbenefits on the settlement of employee share-based awardsin accordance with ASU No. 2016-09. The impact of thesesettlements in the first half of 2017 was a reduction to ourprovision for taxes of $485 million (including $475 millionin the first quarter of 2017) and a reduction in our effectiveincome tax rate of 9.6 percentage points. See Note 3 to thecondensed consolidated financial statements for furtherinformation about this ASU. The increase compared withthe effective income tax rate of 11.2% for the first quarterof 2017 was primarily due to a decrease in the impact of taxbenefits from the settlement of employee share-basedawards in the first half of 2017 compared with the firstquarter of 2017.
Segment Operating Results
The table below presents the net revenues, operatingexpenses and pre-tax earnings of our segments.
Three MonthsEnded June
Six MonthsEnded June
$ in millions 2017 2016 2017 2016
Investment BankingNet revenues $1,730 $1,787 $ 3,433 $ 3,250Operating expenses 984 1,095 1,959 1,857Pre-tax earnings $ 746 $ 692 $ 1,474 $ 1,393
Institutional Client ServicesNet revenues $3,051 $3,681 $ 6,410 $ 7,124Operating expenses 2,401 2,702 4,945 5,123Pre-tax earnings $ 650 $ 979 $ 1,465 $ 2,001
Investing & LendingNet revenues $1,576 $1,111 $ 3,040 $ 1,198Operating expenses 763 581 1,513 1,024Pre-tax earnings $ 813 $ 530 $ 1,527 $ 174
Investment ManagementNet revenues $1,530 $1,353 $ 3,030 $ 2,698Operating expenses 1,230 1,091 2,448 2,227Pre-tax earnings $ 300 $ 262 $ 582 $ 471
Total net revenues $7,887 $7,932 $15,913 $14,270Total operating expenses 5,378 5,469 10,865 10,231Total pre-tax earnings $2,509 $2,463 $ 5,048 $ 4,039
Net revenues in our segments include allocations of interestincome and interest expense to specific securities,commodities and other positions in relation to the cashgenerated by, or funding requirements of, such underlyingpositions. See Note 25 to the condensed consolidatedfinancial statements for further information about ourbusiness segments.
Goldman Sachs June 2017 Form 10-Q 100

THE GOLDMAN SACHS GROUP, INC. AND SUBSIDIARIES
Management’s Discussion and Analysis
Our cost drivers taken as a whole, compensation,headcount and levels of business activity, are broadlysimilar in each of our business segments. Compensationand benefits expenses within our segments reflect, amongother factors, our overall performance, as well as theperformance of individual businesses. Consequently,pre-tax margins in one segment of our business may besignificantly affected by the performance of our otherbusiness segments. A description of segment operatingresults follows.
Investment Banking
Our Investment Banking segment is comprised of:
Financial Advisory. Includes strategic advisory assignmentswith respect to mergers and acquisitions, divestitures,corporate defense activities, restructurings, spin-offs, riskmanagement and derivative transactions directly related tothese client advisory assignments.
Underwriting. Includes public offerings and privateplacements, including local and cross-border transactionsand acquisition financing, of a wide range of securities andother financial instruments, including loans, and derivativetransactions directly related to these client underwritingactivities.
The table below presents the operating results of ourInvestment Banking segment.
Three MonthsEnded June
Six MonthsEnded June
$ in millions 2017 2016 2017 2016
Financial Advisory $ 749 $ 794 $1,505 $1,565
Equity underwriting 260 269 571 452Debt underwriting 721 724 1,357 1,233Total Underwriting 981 993 1,928 1,685Total net revenues 1,730 1,787 3,433 3,250Operating expenses 984 1,095 1,959 1,857Pre-tax earnings $ 746 $ 692 $1,474 $1,393
The table below presents our financial advisory andunderwriting transaction volumes.
Three MonthsEnded June
Six MonthsEnded June
$ in billions 2017 2016 2017 2016
Announced mergers and acquisitions $ 202 $ 206 $ 360 $ 401Completed mergers and acquisitions $ 201 $ 356 $ 411 $ 619Equity and equity-related offerings $ 14 $ 10 $ 31 $ 21Debt offerings $ 73 $ 71 $ 154 $ 144
In the table above:
‰ Volumes are per Dealogic. Prior periods have beenconformed to reflect volumes per Dealogic.
‰ Announced and completed mergers and acquisitionsvolumes are based on full credit to each of the advisors ina transaction. Equity and equity-related offerings anddebt offerings are based on full credit for single bookmanagers and equal credit for joint book managers.Transaction volumes may not be indicative of netrevenues in a given period. In addition, transactionvolumes for prior periods may vary from amountspreviously reported due to the subsequent withdrawal ora change in the value of a transaction.
‰ Equity and equity-related offerings includes Rule 144Aand public common stock offerings, convertible offeringsand rights offerings.
‰ Debt offerings includes non-convertible preferred stock,mortgage-backed securities, asset-backed securities andtaxable municipal debt. Includes publicly registered andRule 144A issues. Excludes leveraged loans.
Operating Environment. During the second quarter of2017, industry-wide announced and completed mergersand acquisitions volumes increased compared with the firstquarter of 2017, but remained lower than the robust levelof volumes during 2016, as the operating environment,including uncertainty about potential policy changes in theU.S., weighed on activity. In underwriting, generally higherequity prices and tighter credit spreads during the secondquarter of 2017 continued to contribute to a relativelyfavorable financing environment in the first half of 2017.As a result, industry-wide equity underwriting offeringsimproved during the first half of 2017 from the low levels ofactivity during 2016, which began with a challenging firstquarter. In addition, industry-wide debt underwritingofferings, particularly investment-grade and leveragedfinanced activity, remained solid during the second quarterof 2017, but decreased compared with the first quarter of2017. In the future, if industry-wide activity levels inmergers and acquisitions or equity underwriting decline orif industry-wide activity levels in debt underwritingcontinue the downward trend, net revenues in InvestmentBanking would likely be negatively impacted.
Three Months Ended June 2017 versus June 2016. Netrevenues in Investment Banking were $1.73 billion for thesecond quarter of 2017, 3% lower than the second quarterof 2016.
Net revenues in Financial Advisory were $749 million, 6%lower than the second quarter of 2016, reflecting a decreasein industry-wide completed mergers and acquisitions. Netrevenues in Underwriting were $981 million, essentiallyunchanged compared with the second quarter of 2016. Netrevenues in debt underwriting were essentially unchangedcompared with a strong prior year period. Net revenues inequity underwriting were slightly lower, reflecting lowernet revenues from convertible offerings.
101 Goldman Sachs June 2017 Form 10-Q

THE GOLDMAN SACHS GROUP, INC. AND SUBSIDIARIES
Management’s Discussion and Analysis
Operating expenses were $984 million for the secondquarter of 2017, 10% lower than the second quarter of2016, primarily due to decreased compensation andbenefits expenses, reflecting lower net revenues. Pre-taxearnings were $746 million in the second quarter of 2017,8% higher than the second quarter of 2016.
As of June 2017, our investment banking transactionbacklog increased compared with March 2017. Thisincrease was due to significantly higher estimated netrevenues from potential underwriting transactions,primarily reflecting an increase in acquisition-relatedfinancing. Estimated net revenues from potential debt andequity underwriting transactions both increased. Estimatednet revenues from potential advisory transactions wereessentially unchanged.
Our investment banking transaction backlog represents anestimate of our future net revenues from investmentbanking transactions where we believe that future revenuerealization is more likely than not. We believe changes inour investment banking transaction backlog may be auseful indicator of client activity levels which, over the longterm, impact our net revenues. However, the time frame forcompletion and corresponding revenue recognition oftransactions in our backlog varies based on the nature ofthe assignment, as certain transactions may remain in ourbacklog for longer periods of time and others may enter andleave within the same reporting period. In addition, ourtransaction backlog is subject to certain limitations, such asassumptions about the likelihood that individual clienttransactions will occur in the future. Transactions may becancelled or modified, and transactions not included in theestimate may also occur.
Six Months Ended June 2017 versus June 2016. Netrevenues in Investment Banking were $3.43 billion for thefirst half of 2017, 6% higher than the first half of 2016.
Net revenues in Financial Advisory were $1.51 billion, 4%lower than the first half of 2016. Industry-wide completedmergers and acquisitions declined compared with the sameprior year period. Net revenues in Underwriting were$1.93 billion, 14% higher than the first half of 2016, due tohigher net revenues in debt underwriting, primarilyreflecting an increase in industry-wide leveraged financeactivity, and significantly higher net revenues in equityunderwriting, reflecting an increase in industry-wideofferings.
Operating expenses were $1.96 billion for the first half of2017, 5% higher than the first half of 2016, due toincreased compensation and benefits expenses, reflectinghigher net revenues. Pre-tax earnings were $1.47 billion inthe first half of 2017, 6% higher than the first half of 2016.
As of June 2017, our investment banking transactionbacklog increased compared with December 2016. Thisincrease was due to significantly higher estimated netrevenues from potential underwriting transactions,primarily reflecting an increase in acquisition-relatedfinancing. Estimated net revenues from potential debt andequity underwriting transactions both increased. Theseincreases were partially offset by lower estimated netrevenues from potential advisory transactions, principallyrelated to mergers and acquisitions.
Institutional Client Services
Our Institutional Client Services segment is comprised of:
Fixed Income, Currency and Commodities Client
Execution. Includes client execution activities related tomaking markets in both cash and derivative instruments forinterest rate products, credit products, mortgages,currencies and commodities.
‰ Interest Rate Products. Government bonds (includinginflation-linked securities) across maturities, othergovernment-backed securities, repurchase agreements,and interest rate swaps, options and other derivatives.
‰ Credit Products. Investment-grade corporate securities,high-yield securities, credit derivatives, exchange-tradedfunds, bank and bridge loans, municipal securities,emerging market and distressed debt, and trade claims.
‰ Mortgages. Commercial mortgage-related securities,loans and derivatives, residential mortgage-relatedsecurities, loans and derivatives (including U.S.government agency-issued collateralized mortgageobligations and other securities and loans), and otherasset-backed securities, loans and derivatives.
‰ Currencies. Currency options, spot/forwards and otherderivatives on G-10 currencies and emerging-marketproducts.
‰ Commodities. Commodity derivatives and, to a lesserextent, physical commodities, involving crude oil andpetroleum products, natural gas, base, precious and othermetals, electricity, coal, agricultural and othercommodity products.
Equities. Includes client execution activities related tomaking markets in equity products and commissions andfees from executing and clearing institutional clienttransactions on major stock, options and futures exchangesworldwide, as well as OTC transactions. Equities alsoincludes our securities services business, which providesfinancing, securities lending and other prime brokerageservices to institutional clients, including hedge funds,mutual funds, pension funds and foundations, andgenerates revenues primarily in the form of interest ratespreads or fees.
Goldman Sachs June 2017 Form 10-Q 102
THE GOLDMAN SACHS GROUP, INC. AND SUBSIDIARIES
Management’s Discussion and Analysis
Market-Making Activities
As a market maker, we facilitate transactions in both liquidand less liquid markets, primarily for institutional clients,such as corporations, financial institutions, investmentfunds and governments, to assist clients in meeting theirinvestment objectives and in managing their risks. In thisrole, we seek to earn the difference between the price atwhich a market participant is willing to sell an instrumentto us and the price at which another market participant iswilling to buy it from us, and vice versa (i.e., bid/offerspread). In addition, we maintain inventory, typically for ashort period of time, in response to, or in anticipation of,client demand. We also hold inventory to actively manageour risk exposures that arise from these market-makingactivities. Our market-making inventory is recorded infinancial instruments owned (long positions) or financialinstruments sold, but not yet purchased (short positions) inour condensed consolidated statements of financialcondition.
Our results are influenced by a combination ofinterconnected drivers, including (i) client activity levels andtransactional bid/offer spreads (collectively, client activity),and (ii) changes in the fair value of our inventory andinterest income and interest expense related to the holding,hedging and funding of our inventory (collectively, market-making inventory changes). Due to the integrated nature ofour market-making activities, disaggregation of netrevenues into client activity and market-making inventorychanges is judgmental and has inherent complexities andlimitations.
The amount and composition of our net revenues vary overtime as these drivers are impacted by multiple interrelatedfactors affecting economic and market conditions,including volatility and liquidity in the market, changes ininterest rates, currency exchange rates, credit spreads,equity prices and commodity prices, investor confidence,and other macroeconomic concerns and uncertainties.
In general, assuming all other market-making conditionsremain constant, increases in client activity levels or bid/offer spreads tend to result in increases in net revenues, anddecreases tend to have the opposite effect. However,changes in market-making conditions can materially impactclient activity levels and bid/offer spreads, as well as the fairvalue of our inventory. For example, a decrease in liquidityin the market could have the impact of (i) increasing ourbid/offer spread, (ii) decreasing investor confidence andthereby decreasing client activity levels, and (iii) widercredit spreads on our inventory positions.
The table below presents the operating results of ourInstitutional Client Services segment.
Three MonthsEnded June
Six MonthsEnded June
$ in millions 2017 2016 2017 2016
FICC Client Execution $1,159 $1,927 $2,844 $3,590
Equities client execution 687 587 1,239 1,057Commissions and fees 764 745 1,502 1,623Securities services 441 422 825 854Total Equities 1,892 1,754 3,566 3,534Total net revenues 3,051 3,681 6,410 7,124Operating expenses 2,401 2,702 4,945 5,123Pre-tax earnings $ 650 $ 979 $1,465 $2,001
The table below presents net revenues of our InstitutionalClient Services segment by line item in the condensedconsolidated statements of earnings. See “Net Revenues”above for further information about market makingrevenues, commissions and fees and net interest income.
$ in millionsFICC Client
ExecutionTotal
Equities
InstitutionalClient
Services
Three Months Ended June 2017
Market making $ 902 $1,013 $1,915
Commissions and fees — 764 764
Net interest income 257 115 372
Total net revenues $1,159 $1,892 $3,051
Three Months Ended June 2016Market making $1,675 $ 815 $2,490Commissions and fees — 745 745Net interest income 252 194 446Total net revenues $1,927 $1,754 $3,681
Six Months Ended June 2017
Market making $2,559 $1,774 $4,333
Commissions and fees — 1,502 1,502
Net interest income 285 290 575
Total net revenues $2,844 $3,566 $6,410
Six Months Ended June 2016Market making $2,883 $1,469 $4,352Commissions and fees — 1,623 1,623Net interest income 707 442 1,149Total net revenues $3,590 $3,534 $7,124
In the table above:
‰ The difference between commissions and fees and thosein the condensed consolidated statements of earningsrepresents commissions and fees included in ourInvestment Management segment.
‰ See Note 25 to the condensed consolidated financialstatements for net interest income by business segment.
‰ The primary driver of net revenues for FICC ClientExecution, for the periods in the table above, was clientactivity.
103 Goldman Sachs June 2017 Form 10-Q

THE GOLDMAN SACHS GROUP, INC. AND SUBSIDIARIES
Management’s Discussion and Analysis
Operating Environment. Many of the themes thatimpacted the operating environment for Institutional ClientServices in the first quarter of 2017 continued into thesecond quarter of 2017 as volatility levels in equity, fixedincome, currency and commodity markets remained low.This, combined with low client conviction to transact,continued to negatively affect client activity acrossbusinesses, particularly in FICC Client Execution. Inaddition, oil and natural gas prices further declined fromtheir already low levels in the first quarter of 2017 toapproximately $46 per barrel (WTI) and $3.04 per millionBritish thermal units, respectively. However, global equitymarkets continued to generally increase during both thefirst and second quarters of 2017 (with the MSCI WorldIndex up 10% in the first half of 2017). In credit markets,spreads generally tightened during the first half of 2017.
If the trend of low volatility continues over the long termand activity levels continue to decline, net revenues inInstitutional Client Services would likely continue to benegatively impacted. See “Business Environment” above forfurther information about economic and market conditionsin the global operating environment during the quarter.
Three Months Ended June 2017 versus June 2016. Netrevenues in Institutional Client Services were $3.05 billionfor the second quarter of 2017, 17% lower than the secondquarter of 2016.
Net revenues in FICC Client Execution were $1.16 billionfor the second quarter of 2017, 40% lower than the secondquarter of 2016, primarily reflecting significantly lowerclient activity.
The following provides details of our FICC ClientExecution net revenues by business, compared with resultsin the second quarter of 2016:
‰ Net revenues in interest rate products, credit products andcurrencies were all significantly lower, primarilyreflecting lower client activity.
‰ Net revenues in commodities were also significantlylower and our lowest quarterly results. This decreasereflected the impact of challenging market-makingconditions on our inventory, particularly in energyproducts, and lower client activity.
‰ Net revenues in mortgages were higher, reflectingfavorable market-making conditions including generallytighter spreads.
Net revenues in Equities were $1.89 billion for the secondquarter of 2017, 8% higher than the second quarter of2016, primarily due to higher net revenues in equities clientexecution, reflecting higher results in both cash productsand derivatives. Net revenues from securities services wereslightly higher compared with the second quarter of 2016.Commissions and fees were also slightly higher, as globalfutures volumes for both us and the market increased.
Operating expenses were $2.40 billion for the secondquarter of 2017, 11% lower than the second quarter of2016, due to decreased compensation and benefitsexpenses, reflecting lower net revenues. This decrease waspartially offset by higher brokerage, clearing, exchange anddistribution fees. Pre-tax earnings were $650 million in thesecond quarter of 2017, 34% lower than the second quarterof 2016.
Six Months Ended June 2017 versus June 2016. Netrevenues in Institutional Client Services were $6.41 billionfor the first half of 2017, 10% lower than the first half of2016.
Net revenues in FICC Client Execution were $2.84 billionfor the first half of 2017, 21% lower than the first half of2016, primarily reflecting significantly lower client activity.
The following provides details of our FICC ClientExecution net revenues by business, compared with resultsin the first half of 2016:
‰ Net revenues in commodities were significantly lower,reflecting challenging market-making conditions,particularly during the second quarter of 2017, and lowerclient activity.
‰ Net revenues in interest rate products were lower,reflecting lower client activity, partially offset byimproved market-making conditions.
‰ Net revenues in currencies were significantly lower due tolower client activity.
‰ Net revenues in credit products were significantly lower,reflecting lower client activity, partially offset byimproved market-making conditions, including generallytighter credit spreads.
‰ Net revenues in mortgages were significantly higher,reflecting favorable market-making conditions includinggenerally tighter spreads, compared with a challengingfirst half of 2016.
Goldman Sachs June 2017 Form 10-Q 104

THE GOLDMAN SACHS GROUP, INC. AND SUBSIDIARIES
Management’s Discussion and Analysis
Net revenues in Equities were $3.57 billion for the first halfof 2017, essentially unchanged compared with the first halfof 2016, as higher net revenues in equities client execution,reflecting significantly higher results in derivatives andslightly higher net revenues in cash products, were offset bylower commissions and fees and slightly lower net revenuesin securities services. The decrease in commissions and feesreflected a decline in our listed cash equity volumes in theU.S., consistent with market volumes in the region.
Operating expenses were $4.95 billion for the first half of2017, 3% lower than the first half of 2016, due todecreased compensation and benefits expenses, reflectinglower net revenues, and lower brokerage, clearing,exchange and distribution fees. These decreases werepartially offset by higher communications and technologyexpenses. Pre-tax earnings were $1.47 billion in the firsthalf of 2017, 27% lower than the first half of 2016.
Investing & Lending
Investing & Lending includes our investing activities andthe origination of loans, including our relationship lendingactivities, to provide financing to clients. These investmentsand loans are typically longer-term in nature. We makeinvestments, some of which are consolidated, directly andindirectly through funds that we manage, in debt securitiesand loans, public and private equity securities,infrastructure and real estate entities. We also makeunsecured loans to individuals through our online platform.
The table below presents the operating results of ourInvesting & Lending segment.
Three MonthsEnded June
Six MonthsEnded June
$ in millions 2017 2016 2017 2016
Equity securities $1,180 $ 626 $1,978 $ 626Debt securities and loans 396 485 1,062 572Total net revenues 1,576 1,111 3,040 1,198Operating expenses 763 581 1,513 1,024Pre-tax earnings $ 813 $ 530 $1,527 $ 174
Operating Environment. During the first half of 2017,generally higher global equity prices and tighter creditspreads contributed to a favorable environment for ourequity and debt investments. Results also reflected net gainsfrom corporate performance and company-specific events,including sales. This environment contrasts with the firsthalf of 2016, where, in the first quarter of 2016, marketconditions were difficult and corporate performance,particularly in the energy sector, was impacted by achallenging macroeconomic environment. Ifmacroeconomic concerns negatively affect corporateperformance or company-specific events, or if global equitymarkets decline or credit spreads widen, net revenues inInvesting & Lending would likely be negatively impacted.
Three Months Ended June 2017 versus June 2016. Netrevenues in Investing & Lending were $1.58 billion for thesecond quarter of 2017, 42% higher than the secondquarter of 2016. Net revenues in equity securities were$1.18 billion, 88% higher than the second quarter of 2016,primarily reflecting a significant increase in net gains fromprivate equities, which were positively impacted bycorporate performance and company-specific events. Netrevenues in debt securities and loans were $396 million,18% lower than the second quarter of 2016, primarilyreflecting lower net gains from investments in debtinstruments, partially offset by higher net interest income.
Operating expenses were $763 million for the secondquarter of 2017, 31% higher than the second quarter of2016, due to increased compensation and benefitsexpenses, reflecting higher net revenues, and higher marketdevelopment expenses. Pre-tax earnings were $813 millionin the second quarter of 2017, 53% higher than the secondquarter of 2016.
Six Months Ended June 2017 versus June 2016. Netrevenues in Investing & Lending were $3.04 billion for thefirst half of 2017 compared with $1.20 billion for the firsthalf of 2016. Net revenues in equity securities were$1.98 billion for the first half of 2017 compared with$626 million for the first half of 2016, primarily reflecting asignificant increase in net gains from private equities, whichwere positively impacted by corporate performance andcompany-specific events. In addition, net gains from publicequities were also significantly higher, as global equityprices generally increased during the first half of 2017. Netrevenues in debt securities and loans were $1.06 billion,86% higher than the first half of 2016, primarily reflectingsignificantly higher net interest income and higher net gainsfrom investments in debt instruments.
Operating expenses were $1.51 billion for the first half of2017, 48% higher than the second half of 2016, primarilydue to higher compensation and benefits expenses,reflecting higher net revenues, and higher marketdevelopment expenses. Pre-tax earnings were $1.53 billionin the first half of 2017, compared with pre-tax earnings of$174 million in the first half of 2016.
105 Goldman Sachs June 2017 Form 10-Q

THE GOLDMAN SACHS GROUP, INC. AND SUBSIDIARIES
Management’s Discussion and Analysis
Investment Management
Investment Management provides investment managementservices and offers investment products (primarily throughseparately managed accounts and commingled vehicles,such as mutual funds and private investment funds) acrossall major asset classes to a diverse set of institutional andindividual clients. Investment Management also offerswealth advisory services, including portfolio managementand financial counseling, and brokerage and othertransaction services to high-net-worth individuals andfamilies.
Assets under supervision (AUS) include client assets wherewe earn a fee for managing assets on a discretionary basis.This includes net assets in our mutual funds, hedge funds,credit funds and private equity funds (including real estatefunds), and separately managed accounts for institutionaland individual investors. Assets under supervision alsoinclude client assets invested with third-party managers,bank deposits and advisory relationships where we earn afee for advisory and other services, but do not haveinvestment discretion. Assets under supervision do notinclude the self-directed brokerage assets of our clients.Long-term assets under supervision represent assets undersupervision excluding liquidity products. Liquidityproducts represent money market and bank deposit assets.
Assets under supervision typically generate fees as apercentage of net asset value, which vary by asset class anddistribution channel and are affected by investmentperformance as well as asset inflows and redemptions.Asset classes such as alternative investment and equityassets typically generate higher fees relative to fixed incomeand liquidity product assets. The average effectivemanagement fee (which excludes non-asset-based fees) weearned on our assets under supervision was 35 basis pointsfor each of the three and six months ended June 2017 andJune 2016.
In certain circumstances, we are also entitled to receiveincentive fees based on a percentage of a fund’s or aseparately managed account’s return, or when the returnexceeds a specified benchmark or other performancetargets. Incentive fees are recognized only when all materialcontingencies are resolved.
The table below presents the operating results of ourInvestment Management segment.
Three MonthsEnded June
Six MonthsEnded June
$ in millions 2017 2016 2017 2016
Management and other fees $1,284 $1,181 $2,503 $2,346Incentive fees 81 37 202 83Transaction revenues 165 135 325 269Total net revenues 1,530 1,353 3,030 2,698Operating expenses 1,230 1,091 2,448 2,227Pre-tax earnings $ 300 $ 262 $ 582 $ 471
The table below presents our period-end assets undersupervision by asset class.
As of June
$ in billions 2017 2016
Alternative investments $ 165 $ 150Equity 293 254Fixed income 634 581Total long-term assets under supervision 1,092 985Liquidity products 314 325Total assets under supervision $1,406 $1,310
In the table above, alternative investments primarilyincludes hedge funds, credit funds, private equity, realestate, currencies, commodities and asset allocationstrategies.
The table below presents our period-end assets undersupervision by distribution channel.
As of June
$ in billions 2017 2016
Institutional $ 549 $ 489High-net-worth individuals 435 391Third-party distributed 422 430Total $1,406 $1,310
The table below presents a summary of the changes in ourassets under supervision.
Three MonthsEnded June
Six MonthsEnded June
$ in billions 2017 2016 2017 2016
Beginning balance $1,373 $1,287 $1,379 $1,252Net inflows/(outflows):
Alternative investments 13 2 15 3Equity 5 (4) 2 —Fixed income 7 3 13 8
Total long-term AUS net inflows/(outflows) 25 1 30 11Liquidity products (9) 3 (44) 19Total AUS net inflows/(outflows) 16 4 (14) 30Net market appreciation/(depreciation) 17 19 41 28Ending balance $1,406 $1,310 $1,406 $1,310
In the table above:
‰ Total AUS net inflows/(outflows) for the three and sixmonths ended June 2017 includes $23 billion of inflows($20 billion in total long-term AUS and $3 billion inliquidity products) in connection with the acquisition of aportion of Verus Investors’ outsourced chief investmentofficer business (Verus acquisition) in June 2017.
‰ Total AUS net inflows/(outflows) for the six monthsended June 2017 includes $5 billion of equity assetoutflows in connection with the divestiture of our localAustralian-focused investment capabilities and fundplatform (Australian divestiture).
Goldman Sachs June 2017 Form 10-Q 106

THE GOLDMAN SACHS GROUP, INC. AND SUBSIDIARIES
Management’s Discussion and Analysis
The table below presents our average monthly assets undersupervision by asset class.
Average for the
Three MonthsEnded June
Six MonthsEnded June
$ in billions 2017 2016 2017 2016
Alternative investments $ 159 $ 148 $ 157 $ 147Equity 285 255 278 249Fixed income 622 572 617 563Total long-term assets under
supervision 1,066 975 1,052 959Liquidity products 320 323 330 317Total assets under supervision $1,386 $1,298 $1,382 $1,276
Operating Environment. During the first half of 2017,Investment Management operated in an environmentcharacterized by generally higher asset prices, resulting inappreciation in our client assets in both equity and fixedincome assets. In addition, our long-term assets undersupervision benefited from net inflows primarily inalternative and fixed income assets. These increases werepartially offset by net outflows in liquidity products,primarily driven by seasonal net outflows during the firstquarter of 2017. As a result, the mix of average assets undersupervision during the first half of 2017 shifted slightlyfrom liquidity products to long-term assets undersupervision, as compared to the mix towards the end of theprior year. In the future, if asset prices decline, or investorsfavor assets that typically generate lower fees or investorscontinue to withdraw their assets, net revenues inInvestment Management would likely be negativelyimpacted.
Three Months Ended June 2017 versus June 2016. Netrevenues in Investment Management were $1.53 billion forthe second quarter of 2017, 13% higher than the secondquarter of 2016, due to higher management and other fees,primarily reflecting higher average assets under supervision,as well as higher incentive fees and transaction revenues.During the quarter, total assets under supervision increased$33 billion to $1.41 trillion. Long-term assets undersupervision increased $42 billion, including net inflows of$25 billion (which includes $20 billion of inflows inconnection with the Verus acquisition), spread across allasset classes, and net market appreciation of $17 billion,primarily in fixed income and equity assets. Liquidityproducts decreased $9 billion (which includes $3 billion ofinflows in connection with the Verus acquisition).
Operating expenses were $1.23 billion for the secondquarter of 2017, 13% higher than the second quarter of2016, primarily due to increased compensation and benefitsexpenses, reflecting higher net revenues. Pre-tax earningswere $300 million in the second quarter of 2017, 15%higher than the second quarter of 2016.
Six Months Ended June 2017 versus June 2016. Netrevenues in Investment Management were $3.03 billion forthe first half of 2017, 12% higher than the first half of2016, due to higher management and other fees, primarilyreflecting higher average assets under supervision, as well ashigher incentive fees and transaction revenues. During thefirst half of 2017, total assets under supervision increased$27 billion to $1.41 trillion. Long-term assets undersupervision increased $71 billion, including net marketappreciation of $41 billion, primarily in equity and fixedincome assets, and net inflows of $30 billion (whichincludes $20 billion of inflows in connection with the Verusacquisition and $5 billion of equity asset outflows inconnection with the Australian divestiture), primarily inalternative investment and fixed income assets. Liquidityproducts decreased $44 billion (which includes $3 billion ofinflows in connection with the Verus acquisition).
Operating expenses were $2.45 billion for the first half of2017, 10% higher than the first half of 2016, primarily dueto increased compensation and benefits expenses, reflectinghigher net revenues. Pre-tax earnings were $582 million inthe first half of 2017, 24% higher than the first half of2016.
Geographic Data
See Note 25 to the condensed consolidated financialstatements for a summary of our total net revenues andpre-tax earnings by geographic region.
107 Goldman Sachs June 2017 Form 10-Q

THE GOLDMAN SACHS GROUP, INC. AND SUBSIDIARIES
Management’s Discussion and Analysis
Balance Sheet and Funding Sources
Balance Sheet Management
One of our risk management disciplines is our ability tomanage the size and composition of our balance sheet.While our asset base changes due to client activity, marketfluctuations and business opportunities, the size andcomposition of our balance sheet also reflects factorsincluding (i) our overall risk tolerance, (ii) the amount ofequity capital we hold and (iii) our funding profile, amongother factors. See “Equity Capital Management andRegulatory Capital — Equity Capital Management” forinformation about our equity capital management process.
Although our balance sheet fluctuates on a day-to-daybasis, our total assets at quarter-end and year-end dates aregenerally not materially different from those occurringwithin our reporting periods.
In order to ensure appropriate risk management, we seek tomaintain a sufficiently liquid balance sheet and haveprocesses in place to dynamically manage our assets andliabilities which include (i) balance sheet planning,(ii) business-specific limits, (iii) monitoring of key metricsand (iv) scenario analyses.
Balance Sheet Planning. We prepare a balance sheet planthat combines our projected total assets and composition ofassets with our expected funding sources over a one-yeartime horizon. This plan is reviewed semi-annually and maybe adjusted in response to changing business needs ormarket conditions. The objectives of this planning processare:
‰ To develop our balance sheet projections, taking intoaccount the general state of the financial markets andexpected business activity levels, as well as regulatoryrequirements;
‰ To allow business risk managers and managers from ourindependent control and support functions to objectivelyevaluate balance sheet limit requests from businessmanagers in the context of our overall balance sheetconstraints, including our liability profile and equitycapital levels, and key metrics; and
‰ To inform the target amount, tenor and type of funding toraise, based on our projected assets and contractualmaturities.
Business risk managers and managers from ourindependent control and support functions along withbusiness managers review current and prior periodinformation and expectations for the year to prepare ourbalance sheet plan. The specific information reviewedincludes asset and liability size and composition, limitutilization, risk and performance measures, and capitalusage.
Our consolidated balance sheet plan, including our balancesheets by business, funding projections, and projected keymetrics, is reviewed and approved by the Firmwide FinanceCommittee. See “Overview and Structure of RiskManagement” for an overview of our risk managementstructure.
Business-Specific Limits. The Firmwide FinanceCommittee sets asset and liability limits for each business.These limits are set at levels which are close to actualoperating levels, rather than at levels which reflect ourmaximum risk appetite, in order to ensure promptescalation and discussion among business managers andmanagers in our independent control and support functionson a routine basis. The Firmwide Finance Committeereviews and approves balance sheet limits on a semi-annualbasis and may also approve changes in limits on a morefrequent basis in response to changing business needs ormarket conditions. In addition, the Risk GovernanceCommittee sets aged inventory limits for certain financialinstruments as a disincentive to hold inventory over longerperiods of time. Requests for changes in limits are evaluatedafter giving consideration to their impact on our keymetrics. Compliance with limits is monitored on a dailybasis by business risk managers, as well as managers in ourindependent control and support functions.
Monitoring of Key Metrics. We monitor key balancesheet metrics daily both by business and on a consolidatedbasis, including asset and liability size and composition,limit utilization and risk measures. We allocate assets tobusinesses and review and analyze movements resultingfrom new business activity as well as market fluctuations.
Scenario Analyses. We conduct various scenario analysesincluding as part of the Comprehensive Capital Analysisand Review (CCAR) and U.S. Dodd-Frank Wall StreetReform and Consumer Protection Act (Dodd-Frank Act)Stress Tests (DFAST), as well as our resolution andrecovery planning. See “Equity Capital Management andRegulatory Capital — Equity Capital Management” belowfor further information about these scenario analyses.These scenarios cover short-term and long-term timehorizons using various macroeconomic and firm-specificassumptions, based on a range of economic scenarios. Weuse these analyses to assist us in developing our longer-termbalance sheet management strategy, including the level andcomposition of assets, funding and equity capital.Additionally, these analyses help us develop approaches formaintaining appropriate funding, liquidity and capitalacross a variety of situations, including a severely stressedenvironment.
Goldman Sachs June 2017 Form 10-Q 108

THE GOLDMAN SACHS GROUP, INC. AND SUBSIDIARIES
Management’s Discussion and Analysis
Balance Sheet Allocation
In addition to preparing our condensed consolidatedstatements of financial condition in accordance with U.S.GAAP, we prepare a balance sheet that generally allocatesassets to our businesses, which is a non-GAAP presentationand may not be comparable to similar non-GAAPpresentations used by other companies. We believe thatpresenting our assets on this basis is meaningful because it isconsistent with the way management views and managesrisks associated with our assets and better enables investorsto assess the liquidity of our assets.
The table below presents our balance sheet allocation.
As of
$ in millionsJune2017
December2016
Global Core Liquid Assets (GCLA) $221,066 $226,066Other cash 10,491 9,088GCLA and cash 231,557 235,154
Secured client financing 191,015 199,387
Inventory 223,931 206,988Secured financing agreements 74,968 65,606Receivables 50,400 29,592Institutional Client Services 349,299 302,186
Public equity 2,439 3,224Private equity 19,644 18,224Debt 22,922 21,675Loans receivable 53,952 49,672Other 7,240 5,162Investing & Lending 106,197 97,957
Total inventory and related assets 455,496 400,143
Other assets 28,450 25,481Total assets $906,518 $860,165
The following is a description of the captions in the tableabove:
‰ Global Core Liquid Assets and Cash. We maintainliquidity to meet a broad range of potential cash outflowsand collateral needs in a stressed environment. See“Liquidity Risk Management” below for details on thecomposition and sizing of our GCLA. In addition to ourGCLA, we maintain other unrestricted operating cashbalances, primarily for use in specific currencies, entities,or jurisdictions where we do not have immediate access toparent company liquidity.
‰ Secured Client Financing. We provide collateralizedfinancing for client positions, including margin loanssecured by client collateral, securities borrowed, andresale agreements primarily collateralized by governmentobligations. We segregate cash and securities forregulatory and other purposes related to client activity.Securities are segregated from our own inventory as wellas from collateral obtained through securities borrowedor resale agreements. Our secured client financingarrangements, which are generally short-term, areaccounted for at fair value or at amounts thatapproximate fair value, and include daily marginrequirements to mitigate counterparty credit risk.
‰ Institutional Client Services. In Institutional ClientServices, we maintain inventory positions to facilitatemarket making in fixed income, equity, currency andcommodity products. Additionally, as part of market-making activities, we enter into resale or securitiesborrowing arrangements to obtain securities or use ourown inventory to cover transactions in which we or ourclients have sold securities that have not yet beenpurchased. The receivables in Institutional Client Servicesprimarily relate to securities transactions.
‰ Investing & Lending. In Investing & Lending, we makeinvestments and originate loans to provide financing toclients. These investments and loans are typically longer-term in nature. We make investments, directly andindirectly through funds that we manage, in debtsecurities, loans, public and private equity securities,infrastructure, real estate entities and other investments.We also make unsecured loans to individuals through ouronline platform. Debt included $14.59 billion and$14.23 billion as of June 2017 and December 2016,respectively, of direct loans primarily extended tocorporate and private wealth management clients that areaccounted for at fair value. Loans receivable is comprisedof loans held for investment that are accounted for atamortized cost net of allowance for loan losses. SeeNote 9 to the condensed consolidated financialstatements for further information about loansreceivable.
‰ Other Assets. Other assets are generally less liquid,nonfinancial assets, including property, leaseholdimprovements and equipment, goodwill and identifiableintangible assets, income tax-related receivables, equity-method investments, assets classified as held for sale andmiscellaneous receivables.
109 Goldman Sachs June 2017 Form 10-Q

THE GOLDMAN SACHS GROUP, INC. AND SUBSIDIARIES
Management’s Discussion and Analysis
The table below presents the reconciliation of this balancesheet allocation to our U.S. GAAP balance sheet.
$ in millions
GCLAand
Cash
SecuredClient
Financing
InstitutionalClient
Services
Investing&
Lending Total
As of June 2017
Cash and cashequivalents $ 92,251 $ 18,637 $ — $ — $110,888
Securities purchasedunder agreementsto resell and federalfunds sold 58,688 33,117 23,081 667 115,553
Securities borrowed 35,641 90,773 51,887 — 178,301
Receivables frombrokers, dealers andclearing organizations — 6,493 25,794 4 32,291
Receivables fromcustomers andcounterparties — 28,695 24,606 6,042 59,343
Loans receivable — — — 53,952 53,952
Financial instrumentsowned 44,977 13,300 223,931 45,532 327,740
Subtotal $231,557 $191,015 $349,299 $106,197 $878,068
Other assets 28,450
Total assets $906,518
As of December 2016Cash and cash
equivalents $107,066 $ 14,645 $ — $ — $121,711Securities purchased
under agreementsto resell and federalfunds sold 56,583 40,436 18,844 1,062 116,925
Securities borrowed 41,652 96,186 46,762 — 184,600Receivables from
brokers, dealers andclearing organizations — 6,540 11,504 — 18,044
Receivables fromcustomers andcounterparties — 26,286 18,088 3,406 47,780
Loans receivable — — — 49,672 49,672Financial instruments
owned 29,853 15,294 206,988 43,817 295,952Subtotal $235,154 $199,387 $302,186 $ 97,957 $834,684Other assets 25,481Total assets $860,165
In the table above:
‰ Total assets for Institutional Client Services andInvesting & Lending represent inventory and relatedassets. These amounts differ from total assets by businesssegment disclosed in Note 25 to the condensedconsolidated financial statements because total assetsdisclosed in Note 25 include allocations of our GCLA andcash, secured client financing and other assets.
‰ See “Balance Sheet Analysis and Metrics” forexplanations on the changes in our balance sheet fromDecember 2016 to June 2017.
Balance Sheet Analysis and Metrics
As of June 2017, total assets in our condensed consolidatedstatements of financial condition were $906.52 billion, anincrease of $46.35 billion from December 2016, reflectingincreases in financial instruments owned of $31.79 billion,receivables from brokers, dealers and clearingorganizations of $14.25 billion, and receivables fromcustomers and counterparties of $11.56 billion, partiallyoffset by a decrease in cash and cash equivalents of$10.82 billion. The increase in financial instruments ownedprimarily reflected increases in U.S. government and agencyobligations and equity securities related to client activity.The increases in receivables from brokers, dealers andclearing organizations and receivables from customers andcounterparties reflected client activity. The decrease in cashand cash equivalents reflected the impact of firm and clientactivity.
As of June 2017, total liabilities in our condensedconsolidated statements of financial condition were$819.84 billion, an increase of $46.57 billion fromDecember 2016, primarily reflecting increases incollateralized financings of $17.21 billion, unsecured long-term borrowings of $14.56 billion, payables to brokers,dealers and clearing organizations of $6.22 billion, andpayables to customers and counterparties of $4.89 billion.The increase in collateralized financings reflected theimpact of firm and client activity. The increase in unsecuredlong-term borrowings was primarily due to net newissuances. The increase in payables to brokers, dealers andclearing organizations, and payables to customers andcounterparties reflected client activity.
As of June 2017 and December 2016, our total securitiessold under agreements to repurchase, accounted for ascollateralized financings, were $83.64 billion and$71.82 billion, respectively, which were both 5% lowercompared with the daily average amount of repurchaseagreements over the respective quarters. As of June 2017,the decrease in our repurchase agreements relative to thedaily average during the quarter resulted from the impact offirm and client activity at the end of the period.
The level of our repurchase agreements fluctuates betweenand within periods, primarily due to providing clients withaccess to highly liquid collateral, such as U.S. governmentand agency, and investment-grade sovereign obligationsthrough collateralized financing activities.
Goldman Sachs June 2017 Form 10-Q 110
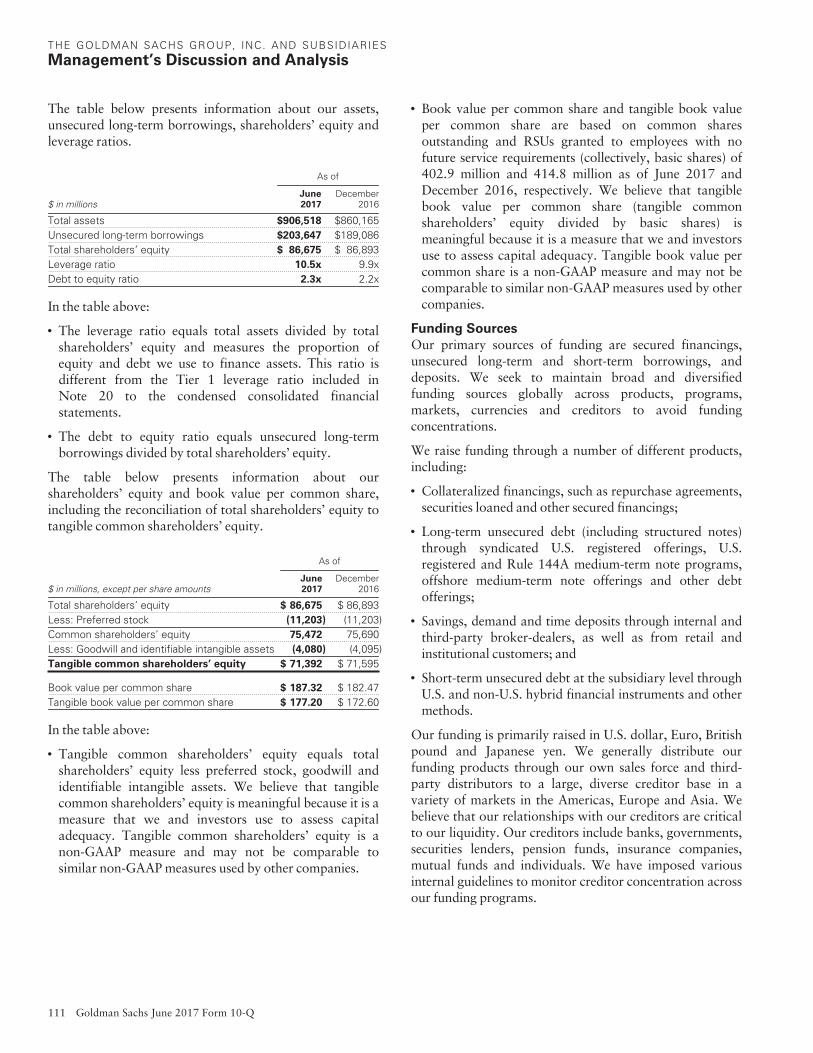
THE GOLDMAN SACHS GROUP, INC. AND SUBSIDIARIES
Management’s Discussion and Analysis
The table below presents information about our assets,unsecured long-term borrowings, shareholders’ equity andleverage ratios.
As of
$ in millionsJune2017
December2016
Total assets $906,518 $860,165Unsecured long-term borrowings $203,647 $189,086Total shareholders’ equity $ 86,675 $ 86,893Leverage ratio 10.5x 9.9xDebt to equity ratio 2.3x 2.2x
In the table above:
‰ The leverage ratio equals total assets divided by totalshareholders’ equity and measures the proportion ofequity and debt we use to finance assets. This ratio isdifferent from the Tier 1 leverage ratio included inNote 20 to the condensed consolidated financialstatements.
‰ The debt to equity ratio equals unsecured long-termborrowings divided by total shareholders’ equity.
The table below presents information about ourshareholders’ equity and book value per common share,including the reconciliation of total shareholders’ equity totangible common shareholders’ equity.
As of
$ in millions, except per share amountsJune2017
December2016
Total shareholders’ equity $ 86,675 $ 86,893Less: Preferred stock (11,203) (11,203)Common shareholders’ equity 75,472 75,690Less: Goodwill and identifiable intangible assets (4,080) (4,095)Tangible common shareholders’ equity $ 71,392 $ 71,595
Book value per common share $ 187.32 $ 182.47Tangible book value per common share $ 177.20 $ 172.60
In the table above:
‰ Tangible common shareholders’ equity equals totalshareholders’ equity less preferred stock, goodwill andidentifiable intangible assets. We believe that tangiblecommon shareholders’ equity is meaningful because it is ameasure that we and investors use to assess capitaladequacy. Tangible common shareholders’ equity is anon-GAAP measure and may not be comparable tosimilar non-GAAP measures used by other companies.
‰ Book value per common share and tangible book valueper common share are based on common sharesoutstanding and RSUs granted to employees with nofuture service requirements (collectively, basic shares) of402.9 million and 414.8 million as of June 2017 andDecember 2016, respectively. We believe that tangiblebook value per common share (tangible commonshareholders’ equity divided by basic shares) ismeaningful because it is a measure that we and investorsuse to assess capital adequacy. Tangible book value percommon share is a non-GAAP measure and may not becomparable to similar non-GAAP measures used by othercompanies.
Funding Sources
Our primary sources of funding are secured financings,unsecured long-term and short-term borrowings, anddeposits. We seek to maintain broad and diversifiedfunding sources globally across products, programs,markets, currencies and creditors to avoid fundingconcentrations.
We raise funding through a number of different products,including:
‰ Collateralized financings, such as repurchase agreements,securities loaned and other secured financings;
‰ Long-term unsecured debt (including structured notes)through syndicated U.S. registered offerings, U.S.registered and Rule 144A medium-term note programs,offshore medium-term note offerings and other debtofferings;
‰ Savings, demand and time deposits through internal andthird-party broker-dealers, as well as from retail andinstitutional customers; and
‰ Short-term unsecured debt at the subsidiary level throughU.S. and non-U.S. hybrid financial instruments and othermethods.
Our funding is primarily raised in U.S. dollar, Euro, Britishpound and Japanese yen. We generally distribute ourfunding products through our own sales force and third-party distributors to a large, diverse creditor base in avariety of markets in the Americas, Europe and Asia. Webelieve that our relationships with our creditors are criticalto our liquidity. Our creditors include banks, governments,securities lenders, pension funds, insurance companies,mutual funds and individuals. We have imposed variousinternal guidelines to monitor creditor concentration acrossour funding programs.
111 Goldman Sachs June 2017 Form 10-Q
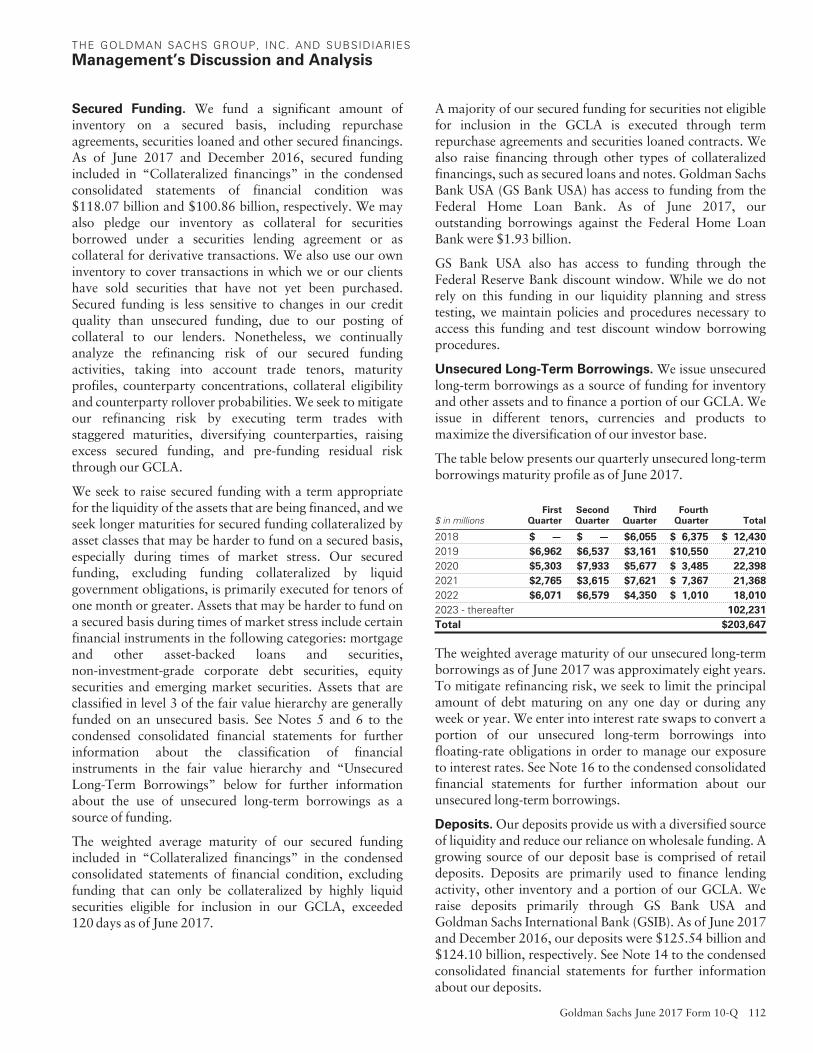
THE GOLDMAN SACHS GROUP, INC. AND SUBSIDIARIES
Management’s Discussion and Analysis
Secured Funding. We fund a significant amount ofinventory on a secured basis, including repurchaseagreements, securities loaned and other secured financings.As of June 2017 and December 2016, secured fundingincluded in “Collateralized financings” in the condensedconsolidated statements of financial condition was$118.07 billion and $100.86 billion, respectively. We mayalso pledge our inventory as collateral for securitiesborrowed under a securities lending agreement or ascollateral for derivative transactions. We also use our owninventory to cover transactions in which we or our clientshave sold securities that have not yet been purchased.Secured funding is less sensitive to changes in our creditquality than unsecured funding, due to our posting ofcollateral to our lenders. Nonetheless, we continuallyanalyze the refinancing risk of our secured fundingactivities, taking into account trade tenors, maturityprofiles, counterparty concentrations, collateral eligibilityand counterparty rollover probabilities. We seek to mitigateour refinancing risk by executing term trades withstaggered maturities, diversifying counterparties, raisingexcess secured funding, and pre-funding residual riskthrough our GCLA.
We seek to raise secured funding with a term appropriatefor the liquidity of the assets that are being financed, and weseek longer maturities for secured funding collateralized byasset classes that may be harder to fund on a secured basis,especially during times of market stress. Our securedfunding, excluding funding collateralized by liquidgovernment obligations, is primarily executed for tenors ofone month or greater. Assets that may be harder to fund ona secured basis during times of market stress include certainfinancial instruments in the following categories: mortgageand other asset-backed loans and securities,non-investment-grade corporate debt securities, equitysecurities and emerging market securities. Assets that areclassified in level 3 of the fair value hierarchy are generallyfunded on an unsecured basis. See Notes 5 and 6 to thecondensed consolidated financial statements for furtherinformation about the classification of financialinstruments in the fair value hierarchy and “UnsecuredLong-Term Borrowings” below for further informationabout the use of unsecured long-term borrowings as asource of funding.
The weighted average maturity of our secured fundingincluded in “Collateralized financings” in the condensedconsolidated statements of financial condition, excludingfunding that can only be collateralized by highly liquidsecurities eligible for inclusion in our GCLA, exceeded120 days as of June 2017.
A majority of our secured funding for securities not eligiblefor inclusion in the GCLA is executed through termrepurchase agreements and securities loaned contracts. Wealso raise financing through other types of collateralizedfinancings, such as secured loans and notes. Goldman SachsBank USA (GS Bank USA) has access to funding from theFederal Home Loan Bank. As of June 2017, ouroutstanding borrowings against the Federal Home LoanBank were $1.93 billion.
GS Bank USA also has access to funding through theFederal Reserve Bank discount window. While we do notrely on this funding in our liquidity planning and stresstesting, we maintain policies and procedures necessary toaccess this funding and test discount window borrowingprocedures.
Unsecured Long-Term Borrowings. We issue unsecuredlong-term borrowings as a source of funding for inventoryand other assets and to finance a portion of our GCLA. Weissue in different tenors, currencies and products tomaximize the diversification of our investor base.
The table below presents our quarterly unsecured long-termborrowings maturity profile as of June 2017.
$ in millionsFirst
QuarterSecondQuarter
ThirdQuarter
FourthQuarter Total
2018 $ — $ — $6,055 $ 6,375 $ 12,430
2019 $6,962 $6,537 $3,161 $10,550 27,210
2020 $5,303 $7,933 $5,677 $ 3,485 22,398
2021 $2,765 $3,615 $7,621 $ 7,367 21,368
2022 $6,071 $6,579 $4,350 $ 1,010 18,010
2023 - thereafter 102,231
Total $203,647
The weighted average maturity of our unsecured long-termborrowings as of June 2017 was approximately eight years.To mitigate refinancing risk, we seek to limit the principalamount of debt maturing on any one day or during anyweek or year. We enter into interest rate swaps to convert aportion of our unsecured long-term borrowings intofloating-rate obligations in order to manage our exposureto interest rates. See Note 16 to the condensed consolidatedfinancial statements for further information about ourunsecured long-term borrowings.
Deposits. Our deposits provide us with a diversified sourceof liquidity and reduce our reliance on wholesale funding. Agrowing source of our deposit base is comprised of retaildeposits. Deposits are primarily used to finance lendingactivity, other inventory and a portion of our GCLA. Weraise deposits primarily through GS Bank USA andGoldman Sachs International Bank (GSIB). As of June 2017and December 2016, our deposits were $125.54 billion and$124.10 billion, respectively. See Note 14 to the condensedconsolidated financial statements for further informationabout our deposits.
Goldman Sachs June 2017 Form 10-Q 112

THE GOLDMAN SACHS GROUP, INC. AND SUBSIDIARIES
Management’s Discussion and Analysis
Unsecured Short-Term Borrowings. A significantportion of our unsecured short-term borrowings wasoriginally long-term debt that is scheduled to mature withinone year of the reporting date. We use unsecured short-termborrowings, including hybrid financial instruments, tofinance liquid assets and for other cash managementpurposes. In light of regulatory developments, Group Inc.no longer issues debt with an original maturity of less thanone year, other than to its subsidiaries.
As of June 2017 and December 2016, our unsecured short-term borrowings, including the current portion ofunsecured long-term borrowings, were $42.97 billion and$39.27 billion, respectively. See Note 15 to the condensedconsolidated financial statements for further informationabout our unsecured short-term borrowings.
Equity Capital Management and RegulatoryCapital
Capital adequacy is of critical importance to us. We have inplace a comprehensive capital management policy thatprovides a framework, defines objectives and establishesguidelines to assist us in maintaining the appropriate leveland composition of capital in both business-as-usual andstressed conditions.
Equity Capital Management
We determine the appropriate level and composition of ourequity capital by considering multiple factors including ourcurrent and future consolidated regulatory capitalrequirements, the results of our capital planning and stresstesting process, resolution capital models and other factors,such as rating agency guidelines, subsidiary capitalrequirements, the business environment and conditions inthe financial markets. We manage our capital requirementsand the levels of our capital usage principally by settinglimits on balance sheet assets and/or limits on risk, in eachcase at both the consolidated and business levels.
We principally manage the level and composition of ourequity capital through issuances and repurchases of ourcommon stock. We may also, from time to time, issue orrepurchase our preferred stock, junior subordinated debtissued to trusts, and other subordinated debt or other formsof capital as business conditions warrant. Prior to anyrepurchases, we must receive confirmation that the Boardof Governors of the Federal Reserve System (FederalReserve Board) does not object to such capital action. SeeNotes 16 and 19 to the condensed consolidated financialstatements for further information about our preferredstock, junior subordinated debt issued to trusts and othersubordinated debt.
Capital Planning and Stress Testing Process. As part ofcapital planning, we project sources and uses of capitalgiven a range of business environments, including stressedconditions. Our stress testing process is designed to identifyand measure material risks associated with our businessactivities including market risk, credit risk and operationalrisk, as well as our ability to generate revenues.
The following is a description of our capital planning andstress testing process:
‰ Capital Planning. Our capital planning processincorporates an internal capital adequacy assessmentwith the objective of ensuring that we are appropriatelycapitalized relative to the risks in our business. Weincorporate stress scenarios into our capital planningprocess with a goal of holding sufficient capital to ensurewe remain adequately capitalized after experiencing asevere stress event. Our assessment of capital adequacy isviewed in tandem with our assessment of liquidityadequacy and is integrated into our overall riskmanagement structure, governance and policyframework.
Our capital planning process also includes an internalrisk-based capital assessment. This assessmentincorporates market risk, credit risk and operational risk.Market risk is calculated by using Value-at-Risk (VaR)calculations supplemented by risk-based add-ons whichinclude risks related to rare events (tail risks). Credit riskutilizes assumptions about our counterparties’probability of default and the size of our losses in theevent of a default. Operational risk is calculated based onscenarios incorporating multiple types of operationalfailures as well as considering internal and external actualloss experience. Backtesting for market risk and creditrisk is used to gauge the effectiveness of models atcapturing and measuring relevant risks.
‰ Stress Testing. Our stress tests incorporate ourinternally designed stress scenarios, including ourinternally developed severely adverse scenario, and thoserequired under CCAR and DFAST, and are designed tocapture our specific vulnerabilities and risks. We providefurther information about our stress test processes and asummary of the results on our website as described in“Available Information” below.
As required by the Federal Reserve Board’s annual CCARrules, we submit a capital plan for review by the FederalReserve Board. The purpose of the Federal Reserve Board’sreview is to ensure that we have a robust, forward-lookingcapital planning process that accounts for our unique risksand that permits continued operation during times ofeconomic and financial stress.
113 Goldman Sachs June 2017 Form 10-Q

THE GOLDMAN SACHS GROUP, INC. AND SUBSIDIARIES
Management’s Discussion and Analysis
The Federal Reserve Board evaluates us based, in part, onwhether we have the capital necessary to continueoperating under the baseline and stress scenarios providedby the Federal Reserve Board and those developedinternally. This evaluation also takes into account ourprocess for identifying risk, our controls and governancefor capital planning, and our guidelines for making capitalplanning decisions. In addition, the Federal Reserve Boardevaluates our plan to make capital distributions (i.e.,dividend payments and repurchases or redemptions ofstock, subordinated debt or other capital securities) andissue capital, across a range of macroeconomic scenariosand firm-specific assumptions.
In addition, the DFAST rules require us to conduct stresstests on a semi-annual basis and publish a summary ofcertain results. The Federal Reserve Board also conducts itsown annual stress tests and publishes a summary of certainresults.
With respect to our 2017 CCAR submission, the FederalReserve Board informed us that it did not object to ourcapital actions, which allows us to repurchase outstandingcommon stock, increase our common stock dividend andissue and redeem other capital securities over the twelve-month period beginning July 2017. We published asummary of our annual DFAST results in June 2017. See“Available Information” below.
In addition, the rules adopted by the Federal Reserve Boardunder the Dodd-Frank Act require GS Bank USA toconduct stress tests on an annual basis and publish asummary of certain results. GS Bank USA submitted its2017 annual DFAST results to the Federal Reserve Board inApril 2017 and published a summary of its annual DFASTresults in June 2017. See “Available Information” below.
Goldman Sachs International (GSI) also has its own capitalplanning and stress testing process, which incorporatesinternally designed stress tests and those required under thePrudential Regulation Authority’s (PRA) Internal CapitalAdequacy Assessment Process.
Contingency Capital Plan. As part of our comprehensivecapital management policy, we maintain a contingencycapital plan. Our contingency capital plan provides aframework for analyzing and responding to a perceived oractual capital deficiency, including, but not limited to,identification of drivers of a capital deficiency, as well asmitigants and potential actions. It outlines the appropriatecommunication procedures to follow during a crisis period,including internal dissemination of information as well astimely communication with external stakeholders.
Capital Attribution. We assess each of our businesses’capital usage based upon our internal assessment of risks,which incorporates an attribution of all of our relevantregulatory capital requirements. These regulatory capitalrequirements are allocated using our attributed equityframework, which takes into consideration our bindingcapital constraints. We also attribute risk-weighted assets(RWAs) to our business segments. As of June 2017,approximately 60% of RWAs calculated in accordancewith the Standardized Capital Rules and the Basel IIIAdvanced Rules, subject to transitional provisions, wereattributed to our Institutional Client Services segment andsubstantially all of the remaining RWAs were attributed toour Investing & Lending segment. We manage the levels ofour capital usage based upon balance sheet and risk limits,as well as capital return analyses of our businesses based onour capital attribution.
Share Repurchase Program. We use our sharerepurchase program to help maintain the appropriate levelof common equity. The repurchase program is effectedprimarily through regular open-market purchases (whichmay include repurchase plans designed to comply withRule 10b5-1), the amounts and timing of which aredetermined primarily by our current and projected capitalposition and our capital plan submitted to the FederalReserve Board as part of CCAR. The amounts and timingof the repurchases may also be influenced by generalmarket conditions and the prevailing price and tradingvolumes of our common stock.
On April 17, 2017, the Board of Directors of Group Inc.(Board) authorized the repurchase of an additional50 million shares of common stock pursuant to the firm’sexisting share repurchase program; however, we are onlypermitted to make repurchases to the extent that suchrepurchases have not been objected to by the FederalReserve Board. As of June 2017, the remaining shareauthorization under our existing repurchase program was63.8 million shares. See “Unregistered Sales of EquitySecurities and Use of Proceeds” in Part II, Item 2 of thisForm 10-Q and Note 19 to the condensed consolidatedfinancial statements for further information about ourshare repurchase program and see above for informationabout our capital planning and stress testing process.
Goldman Sachs June 2017 Form 10-Q 114

THE GOLDMAN SACHS GROUP, INC. AND SUBSIDIARIES
Management’s Discussion and Analysis
Resolution Capital Models. In connection with ourresolution planning efforts, we have established aResolution Capital Adequacy and Positioning (RCAP)framework, which is designed to ensure that our majorsubsidiaries (GS Bank USA, Goldman Sachs & Co. LLC(GS&Co.), GSI, GSIB, Goldman Sachs Japan Co., Ltd.(GSJCL), Goldman Sachs Asset Management, L.P. andGoldman Sachs Asset Management International) haveaccess to sufficient loss-absorbing capacity (in the form ofequity, subordinated debt and unsecured senior debt) sothat they are able to wind-down following a Group Inc.bankruptcy filing in accordance with our preferredresolution strategy. See “Regulatory Matters andDevelopments — Resolution and Recovery Plans” forfurther information.
Rating Agency Guidelines
The credit rating agencies assign credit ratings to theobligations of Group Inc., which directly issues orguarantees substantially all of our senior unsecuredobligations. GS&Co. and GSI have been assigned long- andshort-term issuer ratings by certain credit rating agencies.GS Bank USA and GSIB have also been assigned long- andshort-term issuer ratings, as well as ratings on their long-term and short-term bank deposits. In addition, creditrating agencies have assigned ratings to debt obligations ofcertain other subsidiaries of Group Inc.
The level and composition of our equity capital are amongthe many factors considered in determining our creditratings. Each agency has its own definition of eligiblecapital and methodology for evaluating capital adequacy,and assessments are generally based on a combination offactors rather than a single calculation. See “Liquidity RiskManagement — Credit Ratings” for further informationabout credit ratings of Group Inc., GS Bank USA, GSIB,GS&Co. and GSI.
Consolidated Regulatory Capital
We are subject to the Federal Reserve Board’s revised risk-based capital and leverage regulations, subject to certaintransitional provisions (Revised Capital Framework). Theseregulations are largely based on the Basel Committee onBanking Supervision’s (Basel Committee) capitalframework for strengthening international capitalstandards (Basel III) and also implement certain provisionsof the Dodd-Frank Act. Under the Revised CapitalFramework, we are an “Advanced approach” bankingorganization.
We calculate our CET1, Tier 1 capital and Total capital ratiosin accordance with (i) the Standardized approach and marketrisk rules set out in the Revised Capital Framework (together,the Standardized Capital Rules) and (ii) the Advancedapproach and market risk rules set out in the Revised CapitalFramework (together, the Basel III Advanced Rules) asdescribed in Note 20 to the condensed consolidated financialstatements. The lower of each ratio calculated in (i) and (ii) isthe ratio against which our compliance with minimum ratiorequirements is assessed. Each of the ratios calculated inaccordance with the Basel III Advanced Rules was lower thanthat calculated in accordance with the Standardized CapitalRules and therefore the Basel III Advanced ratios were theratios that applied to us as of June 2017 and December 2016.
See Note 20 to the condensed consolidated financialstatements for further information about our capital ratiosas of June 2017 and December 2016, and for furtherinformation about the Revised Capital Framework.
Minimum Capital Ratios and Capital Buffers
The table below presents our minimum required ratios as ofJune 2017.
June 2017Minimum Ratio
CET1 ratio 7.000%
Tier 1 capital ratio 8.500%
Total capital ratio 10.500%
Tier 1 leverage ratio 4.000%
In the table above:
‰ The minimum capital ratios as of June 2017 reflect (i) the50% phase-in of the capital conservation buffer of 2.5%,(ii) the 50% phase-in of the Global Systemically ImportantBank (G-SIB) buffer of 2.5% (based on 2015 financial data)and (iii) the countercyclical capital buffer of zero percent.
‰ Tier 1 leverage ratio is defined as Tier 1 capital divided byquarterly average adjusted total assets (which includesadjustments for goodwill and identifiable intangibleassets, and certain investments in nonconsolidatedfinancial institutions).
The minimum capital ratios applicable to us as ofJanuary 2019 will reflect the fully phased-in capitalconservation buffer, the countercyclical capital bufferdetermined by the Federal Reserve Board and the fullyphased-in G-SIB buffer. The G-SIB buffer applicable to usas of January 2019 will be finalized based on financial datafor the year ended December 2017. Based on financial datafor the six months ended June 2017, our current estimate isthat we are slightly above the threshold for the 3.0% G-SIBbuffer (as compared with the G-SIB buffer of 2.5%currently applicable to us). The largest driver of the increasewas growth in the notional amount of short-term derivativecontracts. The G-SIB and countercyclical buffers in thefuture may differ due to additional guidance from ourregulators and/or positional changes.
115 Goldman Sachs June 2017 Form 10-Q

THE GOLDMAN SACHS GROUP, INC. AND SUBSIDIARIES
Management’s Discussion and Analysis
Our minimum required supplementary leverage ratio willbe 5.0% on January 1, 2018. See “Supplementary LeverageRatio” below for further information.
See Note 20 to the condensed consolidated financialstatements for information about the capital conservationbuffer, the current G-SIB buffer and the countercyclicalcapital buffer.
Fully Phased-in Capital Ratios
The table below presents our capital ratios calculated inaccordance with the Standardized Capital Rules and theBasel III Advanced Rules on a fully phased-in basis.
As of
$ in millionsJune2017
December2016
Common shareholders’ equity $ 75,472 $ 75,690Deductions for goodwill and identifiable intangible
assets, net of deferred tax liabilities (3,012) (3,015)Deductions for investments in nonconsolidated
financial institutions — (765)Other adjustments (507) (799)Total Common Equity Tier 1 71,953 71,111Preferred stock 11,203 11,203Deduction for investments in covered funds (242) (445)Other adjustments (47) (61)Tier 1 capital $ 82,867 $ 81,808
Standardized Tier 2 and Total capital
Tier 1 capital $ 82,867 $ 81,808Qualifying subordinated debt 13,514 14,566Allowance for losses on loans and lending
commitments 976 722Other adjustments (1) (6)Standardized Tier 2 capital 14,489 15,282Standardized Total capital $ 97,356 $ 97,090
Basel III Advanced Tier 2 and Total capital
Tier 1 capital $ 82,867 $ 81,808Standardized Tier 2 capital 14,489 15,282Allowance for losses on loans and lending
commitments (976) (722)Basel III Advanced Tier 2 capital 13,513 14,560Basel III Advanced Total capital $ 96,380 $ 96,368
Risk-Weighted Assets
Credit RWAs $450,255 $422,544Market RWAs 84,264 85,263Standardized RWAs $534,519 $507,807Credit RWAs $390,637 $361,223Market RWAs 83,664 84,475Operational RWAs 115,250 115,088Basel III Advanced RWAs $589,551 $560,786
CET1 ratioStandardized 13.5% 14.0%Basel III Advanced 12.2% 12.7%
Tier 1 capital ratioStandardized 15.5% 16.1%Basel III Advanced 14.1% 14.6%
Total capital ratioStandardized 18.2% 19.1%Basel III Advanced 16.3% 17.2%
Although the deductions from and adjustments toregulatory capital in the table above will not be fullyphased-in until 2018, we believe that the fully phased-incapital ratios are meaningful because they are measures thatwe, our regulators and investors use to assess our ability tomeet future regulatory capital requirements. These fullyphased-in capital ratios are non-GAAP measures and maynot be comparable to similar non-GAAP measures used byother companies. These ratios are based on our currentinterpretation, expectations and understanding of theRevised Capital Framework and may evolve as we discussthe interpretation and application of this framework withour regulators.
In the table above:
‰ Deductions for goodwill and identifiable intangibleassets, net of deferred tax liabilities, included goodwill of$3.67 billion as of both June 2017 and December 2016,and identifiable intangible assets of $412 million and$429 million as of June 2017 and December 2016,respectively, net of associated deferred tax liabilities of$1.07 billion and $1.08 billion as of June 2017 andDecember 2016, respectively.
‰ Deductions for investments in nonconsolidated financialinstitutions represents the amount by which ourinvestments in the capital of nonconsolidated financialinstitutions exceed certain prescribed thresholds. Thedecrease from December 2016 to June 2017 primarilyreflects reductions in our fund investments.
‰ Deduction for investments in covered funds representsour aggregate investments in applicable covered funds, aspermitted by the Volcker Rule, that were purchased afterDecember 2013. Substantially all of these investments incovered funds were purchased in connection with ourmarket-making activities. This deduction was not subjectto a transition period. See “Regulatory Matters andDevelopments” below for further information about theVolcker Rule.
‰ Other adjustments within CET1 primarily include theoverfunded portion of our defined benefit pension planobligation net of associated deferred tax liabilities,disallowed deferred tax assets, credit valuationadjustments on derivative liabilities, debt valuationadjustments and other required credit risk-baseddeductions.
‰ Qualifying subordinated debt is subordinated debt issuedby Group Inc. with an original maturity of five years orgreater. The outstanding amount of subordinated debtqualifying for Tier 2 capital is reduced upon reaching aremaining maturity of five years. See Note 16 to thecondensed consolidated financial statements for furtherinformation about our subordinated debt.
Goldman Sachs June 2017 Form 10-Q 116
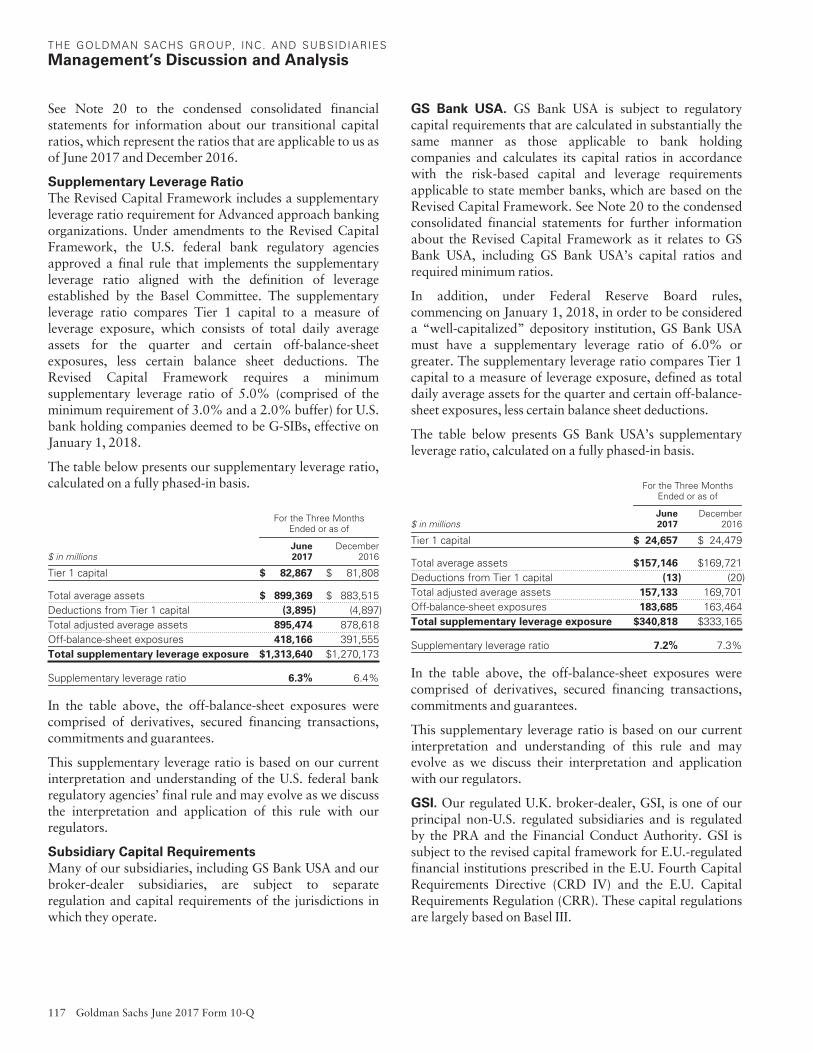
THE GOLDMAN SACHS GROUP, INC. AND SUBSIDIARIES
Management’s Discussion and Analysis
See Note 20 to the condensed consolidated financialstatements for information about our transitional capitalratios, which represent the ratios that are applicable to us asof June 2017 and December 2016.
Supplementary Leverage Ratio
The Revised Capital Framework includes a supplementaryleverage ratio requirement for Advanced approach bankingorganizations. Under amendments to the Revised CapitalFramework, the U.S. federal bank regulatory agenciesapproved a final rule that implements the supplementaryleverage ratio aligned with the definition of leverageestablished by the Basel Committee. The supplementaryleverage ratio compares Tier 1 capital to a measure ofleverage exposure, which consists of total daily averageassets for the quarter and certain off-balance-sheetexposures, less certain balance sheet deductions. TheRevised Capital Framework requires a minimumsupplementary leverage ratio of 5.0% (comprised of theminimum requirement of 3.0% and a 2.0% buffer) for U.S.bank holding companies deemed to be G-SIBs, effective onJanuary 1, 2018.
The table below presents our supplementary leverage ratio,calculated on a fully phased-in basis.
For the Three MonthsEnded or as of
$ in millionsJune2017
December2016
Tier 1 capital $ 82,867 $ 81,808
Total average assets $ 899,369 $ 883,515Deductions from Tier 1 capital (3,895) (4,897)Total adjusted average assets 895,474 878,618Off-balance-sheet exposures 418,166 391,555Total supplementary leverage exposure $1,313,640 $1,270,173
Supplementary leverage ratio 6.3% 6.4%
In the table above, the off-balance-sheet exposures werecomprised of derivatives, secured financing transactions,commitments and guarantees.
This supplementary leverage ratio is based on our currentinterpretation and understanding of the U.S. federal bankregulatory agencies’ final rule and may evolve as we discussthe interpretation and application of this rule with ourregulators.
Subsidiary Capital Requirements
Many of our subsidiaries, including GS Bank USA and ourbroker-dealer subsidiaries, are subject to separateregulation and capital requirements of the jurisdictions inwhich they operate.
GS Bank USA. GS Bank USA is subject to regulatorycapital requirements that are calculated in substantially thesame manner as those applicable to bank holdingcompanies and calculates its capital ratios in accordancewith the risk-based capital and leverage requirementsapplicable to state member banks, which are based on theRevised Capital Framework. See Note 20 to the condensedconsolidated financial statements for further informationabout the Revised Capital Framework as it relates to GSBank USA, including GS Bank USA’s capital ratios andrequired minimum ratios.
In addition, under Federal Reserve Board rules,commencing on January 1, 2018, in order to be considereda “well-capitalized” depository institution, GS Bank USAmust have a supplementary leverage ratio of 6.0% orgreater. The supplementary leverage ratio compares Tier 1capital to a measure of leverage exposure, defined as totaldaily average assets for the quarter and certain off-balance-sheet exposures, less certain balance sheet deductions.
The table below presents GS Bank USA’s supplementaryleverage ratio, calculated on a fully phased-in basis.
For the Three MonthsEnded or as of
$ in millionsJune2017
December2016
Tier 1 capital $ 24,657 $ 24,479
Total average assets $157,146 $169,721Deductions from Tier 1 capital (13) (20)Total adjusted average assets 157,133 169,701Off-balance-sheet exposures 183,685 163,464Total supplementary leverage exposure $340,818 $333,165
Supplementary leverage ratio 7.2% 7.3%
In the table above, the off-balance-sheet exposures werecomprised of derivatives, secured financing transactions,commitments and guarantees.
This supplementary leverage ratio is based on our currentinterpretation and understanding of this rule and mayevolve as we discuss their interpretation and applicationwith our regulators.
GSI. Our regulated U.K. broker-dealer, GSI, is one of ourprincipal non-U.S. regulated subsidiaries and is regulatedby the PRA and the Financial Conduct Authority. GSI issubject to the revised capital framework for E.U.-regulatedfinancial institutions prescribed in the E.U. Fourth CapitalRequirements Directive (CRD IV) and the E.U. CapitalRequirements Regulation (CRR). These capital regulationsare largely based on Basel III.
117 Goldman Sachs June 2017 Form 10-Q

THE GOLDMAN SACHS GROUP, INC. AND SUBSIDIARIES
Management’s Discussion and Analysis
The table below presents GSI’s minimum required ratios.
June 2017Minimum Ratio
December 2016Minimum Ratio
CET1 ratio 7.161% 6.549%Tier 1 capital ratio 9.137% 8.530%Total capital ratio 11.764% 11.163%
The minimum ratios in the table above incorporate capitalguidance received from the PRA and could change in thefuture. GSI’s future capital requirements may also beimpacted by developments such as the introduction ofcapital buffers as described above in “Minimum CapitalRatios and Capital Buffers.”
As of June 2017, GSI had a CET1 ratio of 10.3%, a Tier 1capital ratio of 12.8% and a Total capital ratio of 14.9%.Each of these ratios includes approximately 31 basis pointsattributable to profit for the six months ended June 2017.These ratios will be finalized upon the completion of GSI’s2017 financial statements. As of December 2016, GSI had aCET1 ratio of 12.9%, a Tier 1 capital ratio of 12.9% and aTotal capital ratio of 17.2%.
In November 2016, the European Commission proposedamendments to the CRR to implement a 3% minimumleverage ratio requirement for certain E.U. financialinstitutions. This leverage ratio compares the CRR’sdefinition of Tier 1 capital to a measure of leverageexposure, defined as the sum of assets plus certainoff-balance-sheet exposures (which include a measure ofderivatives exposures, securities financing transactions andcommitments), less Tier 1 capital deductions. Any requiredminimum ratio is expected to become effective for GSI noearlier than January 1, 2018. As of June 2017 andDecember 2016, GSI had a leverage ratio of 4.0% and3.8%, respectively. The ratio as of June 2017 includesapproximately 9 basis points attributable to profit for thesix months ended June 2017. This ratio will be finalizedupon the completion of GSI’s 2017 financial statements.This leverage ratio is based on our current interpretationand understanding of this rule and may evolve as we discussthe interpretation and application of this rule with GSI’sregulators.
Other Subsidiaries. The capital requirements of several ofour subsidiaries may increase in the future due to thevarious developments arising from the Basel Committee,the Dodd-Frank Act, and other governmental entities andregulators. See Note 20 to the condensed consolidatedfinancial statements for information about the capitalrequirements of our other regulated subsidiaries.
Subsidiaries not subject to separate regulatory capitalrequirements may hold capital to satisfy local tax and legalguidelines, rating agency requirements (for entities withassigned credit ratings) or internal policies, includingpolicies concerning the minimum amount of capital asubsidiary should hold based on its underlying level of risk.In certain instances, Group Inc. may be limited in its abilityto access capital held at certain subsidiaries as a result ofregulatory, tax or other constraints. As of June 2017 andDecember 2016, Group Inc.’s equity investment insubsidiaries was $94.87 billion and $92.77 billion,respectively, compared with its total shareholders’ equity of$86.68 billion and $86.89 billion, respectively.
Our capital invested in non-U.S. subsidiaries is generallyexposed to foreign exchange risk, substantially all of whichis managed through a combination of derivatives andnon-U.S. denominated debt. See Note 7 to the condensedconsolidated financial statements for information aboutour net investment hedges, which are used to hedge thisrisk.
Guarantees of Subsidiaries. Group Inc. has guaranteedthe payment obligations of GS&Co. and GS Bank USA, ineach case subject to certain exceptions.
Regulatory Matters and Developments
Our businesses are subject to significant and evolvingregulation. The Dodd-Frank Act, enacted in July 2010,significantly altered the financial regulatory regime withinwhich we operate. In addition, other reforms have beenadopted or are being considered by regulators and policymakers worldwide. Given that many of the new andproposed rules are highly complex, the full impact ofregulatory reform will not be known until the rules areimplemented and market practices develop under the finalregulations.
There has been increased regulation of, and limitations on,our activities, including the Dodd-Frank Act prohibition on“proprietary trading” and the limitation on the sponsorshipof, and investment in, “covered funds” (as defined in theVolcker Rule). In addition, there is increased regulation of,and restrictions on, OTC derivatives markets andtransactions, particularly related to swaps and security-based swaps.
See “Business — Regulation” in Part I, Item 1 of the 2016Form 10-K for more information about the laws, rules andregulations and proposed laws, rules and regulations thatapply to us and our operations. In addition, see Note 20 tothe condensed consolidated financial statements forinformation about regulatory developments as they relateto our regulatory capital and leverage ratios.
Goldman Sachs June 2017 Form 10-Q 118

THE GOLDMAN SACHS GROUP, INC. AND SUBSIDIARIES
Management’s Discussion and Analysis
Volcker Rule
The provisions of the Dodd-Frank Act referred to as the“Volcker Rule” became effective in July 2015 (subject to aconformance period, as applicable). The Volcker Ruleprohibits “proprietary trading,” but permits activities suchas underwriting, market making and risk-mitigationhedging, requires an extensive compliance program andincludes additional reporting and record-keepingrequirements.
In addition to the prohibition on proprietary trading, theVolcker Rule limits the sponsorship of, and investment in,covered funds by banking entities, including Group Inc. andits subsidiaries. It also limits certain types of transactionsbetween us and our sponsored funds, similar to thelimitations on transactions between depository institutionsand their affiliates as described in “Business — Regulation”in Part I, Item 1 of the 2016 Form 10-K. Covered fundsinclude our private equity funds, certain of our credit andreal estate funds, our hedge funds and certain otherinvestment structures. The limitation on investments incovered funds requires us to reduce our investment in eachsuch fund to 3% or less of the fund’s net asset value, and toreduce our aggregate investment in all such funds to 3% orless of our Tier 1 capital.
Our investments in applicable covered funds purchasedafter December 2013 are required to be deducted fromTier 1 capital. See “Equity Capital Management andRegulatory Capital — Fully Phased-in Capital Ratios” forfurther information about our Tier 1 capital and thededuction for investments in covered funds.
As of June 2017, our investments in funds measured at netasset value (NAV) were $5.91 billion. See Note 6 to thecondensed consolidated financial statements for furtherinformation about our investments in funds at NAV andthe extended conformance period under the Volcker Rulefor legacy “illiquid covered funds” (as defined by theVolcker Rule).
We will continue to manage and conform our existinginterests in such funds, taking into account the extendedconformance period under the Volcker Rule. We plan tocontinue to conduct our investing and lending activities inways that are permissible under the Volcker Rule.
Although our net revenues from our interests in privateequity, credit, real estate and hedge funds may vary fromperiod to period, our aggregate net revenues from theseinvestments were approximately 3% and 5% of ouraggregate total net revenues over the last 10 years and5 years, respectively.
Resolution and Recovery Plans
We are required by the Federal Reserve Board and the FDICto submit a periodic plan that describes our strategy for arapid and orderly resolution in the event of materialfinancial distress or failure (resolution plan). We are alsorequired by the Federal Reserve Board to submit and havesubmitted, on a periodic basis, a global recovery plan thatoutlines the steps that management could take to reducerisk, maintain sufficient liquidity, and conserve capital intimes of prolonged stress.
In April 2016, the Federal Reserve Board and the FDICprovided feedback on the 2015 resolution plans of eightsystemically important domestic banking institutions andprovided guidance related to the 2017 resolution plansubmissions. While our 2015 resolution plan was notjointly found to be deficient (i.e., non-credible or to notfacilitate an orderly resolution under the U.S. BankruptcyCode), the FDIC identified deficiencies and both the FDICand Federal Reserve Board also identified certainshortcomings. In response to the feedback received, inSeptember 2016, we submitted a status report on ouractions to address these shortcomings and in June 2017, wesubmitted our 2017 resolution plan. See “AvailableInformation” below.
Our preferred resolution strategy is a variation on a singlepoint of entry strategy in which, in resolution, Group Inc.would enter bankruptcy proceedings but our majorsubsidiaries would be recapitalized and receive additionalliquidity, as necessary, and wind down (or in the case ofasset management entities, be sold) outside of resolutionproceedings in an orderly manner.
To facilitate the execution of our preferred resolutionstrategy, we formed Goldman Sachs Funding LLC (FundingIHC), a wholly-owned, direct subsidiary of Group Inc. Inexchange for an unsecured subordinated funding note andequity interest, Group Inc. has transferred certainintercompany receivables and substantially all of its GCLAto Funding IHC, and has agreed to transfer additionalGCLA above prescribed thresholds.
119 Goldman Sachs June 2017 Form 10-Q

THE GOLDMAN SACHS GROUP, INC. AND SUBSIDIARIES
Management’s Discussion and Analysis
We also put in place a Capital and Liquidity SupportAgreement (CLSA) among Group Inc., Funding IHC and ourmajor subsidiaries. Under the CLSA, Funding IHC hasprovided Group Inc. with a committed line of credit thatallows Group Inc. to draw sufficient funds to meet its cashneeds during the ordinary course of business. In addition, ifour financial resources deteriorate so severely that resolutionmay be imminent, (i) the committed line of credit willautomatically terminate and the unsecured subordinatedfunding note will automatically be forgiven, (ii) allintercompany receivables owed by the major subsidiaries toGroup Inc. will be transferred to Funding IHC or theirmaturities will be extended to five years, (iii) Group Inc. willbe obligated to transfer substantially all of its remainingintercompany receivables and GCLA (other than an amountto fund anticipated bankruptcy expenses) to Funding IHC,and (iv) Funding IHC will be obligated to provide capital andliquidity support to the major subsidiaries. Group Inc.’s andFunding IHC’s obligations under the CLSA are securedpursuant to a related security agreement. Such actions wouldmaterially and adversely affect Group Inc.’s liquidity. As aresult, during a period of severe stress, Group Inc. mightcommence bankruptcy proceedings at an earlier time than itotherwise would if the CLSA and related security agreementhad not been implemented.
As part of our resolution planning efforts, we have alsoestablished RCAP, Resolution Liquidity Adequacy andPositioning (RLAP), and triggers and alerts frameworks.
The RCAP framework is designed to ensure that Group Inc.maintains sufficient loss-absorbing capacity (in the form ofequity, subordinated debt and unsecured senior debt) sothat the major subsidiaries would be in a position toexecute our preferred resolution strategy. It also informsour decisions about the amount of loss-absorbing capacityat those subsidiaries.
The RLAP framework is designed to ensure that wemaintain sufficient GCLA so that the major subsidiariescould continue to meet their outflows and operatingrequirements in a stressed environment. It also informs ourdecisions about the amount of GCLA to be held at thosesubsidiaries.
The triggers and alerts framework is designed to ensure thatthe Board would consider commencing bankruptcyproceedings for Group Inc. before our financial resourcesbecome so depleted that the major subsidiaries are nolonger in a position to execute our preferred resolutionstrategy. It also is designed to ensure that, in the event thatGroup Inc. files for bankruptcy, sufficient amounts of loss-absorbing capacity and liquidity would be available tothose subsidiaries so they could execute our preferredresolution strategy.
In addition, GS Bank USA is required to submit periodicresolution plans to the FDIC. In June 2017, GS Bank USAreceived notification from the FDIC that its resolution plansubmission date was extended to July 1, 2018, and the2016 and 2017 resolution plan requirement will be satisfiedby the submission of the 2018 resolution plan.
Total Loss-Absorbing Capacity
In December 2016, the Federal Reserve Board adopted afinal rule, which establishes new total loss-absorbingcapacity (TLAC) and related requirements for U.S. bankholding companies designated as G-SIBs. The rule will beeffective in January 2019, with no phase-in period, and hasbeen designed so that, in the event of a G-SIB’s failure, therewill be sufficient external loss-absorbing capacity availablein order for authorities to implement an orderly resolutionof the G-SIB. The rule (i) establishes minimum TLACrequirements, (ii) establishes minimum eligible long-termdebt requirements, (iii) prohibits certain holding companytransactions and (iv) caps the amount of G-SIB liabilitiesthat are not eligible long-term debt.
We expect that we will be compliant with the TLACrequirements by the effective date. See “Business —Regulation” in Part I, Item 1 of the 2016 Form 10-K forfurther information about the Federal Reserve Board’sTLAC rule.
Other Regulatory Developments
In September 2016, the final margin rules issued by the U.S.federal bank regulatory agencies and the CFTC foruncleared swaps became effective. These rules wereeffective for variation margin requirements in March 2017and will phase in through September 2020 for initialmargin requirements depending on the level of swaps,security-based swaps and/or exempt foreign exchangederivative transaction activity of the swap dealer and therelevant counterparty. The final rules of the U.S. federalbank regulatory agencies generally apply to inter-affiliatetransactions, with limited relief available from initialmargin requirements for affiliates.
Under the CFTC final rules, inter-affiliate transactions areexempt from initial margin requirements with certainexceptions but variation margin requirements still apply.We expect that our margin requirements will continue toincrease as the rules phase in. Japanese regulators haveimplemented broadly similar rules and regulators in othermajor jurisdictions are expected to do so over the nextseveral quarters.
See “Business — Regulation” in Part I, Item 1 of the 2016Form 10-K for further information about regulations thatmay impact us in the future.
Goldman Sachs June 2017 Form 10-Q 120

THE GOLDMAN SACHS GROUP, INC. AND SUBSIDIARIES
Management’s Discussion and Analysis
Off-Balance-Sheet Arrangements andContractual Obligations
Off-Balance-Sheet Arrangements
We have various types of off-balance-sheet arrangementsthat we enter into in the ordinary course of business. Ourinvolvement in these arrangements can take many differentforms, including:
‰ Purchasing or retaining residual and other interests inspecial purpose entities such as mortgage-backed andother asset-backed securitization vehicles;
‰ Holding senior and subordinated debt, interests in limitedand general partnerships, and preferred and commonstock in other nonconsolidated vehicles;
‰ Entering into interest rate, foreign currency, equity,commodity and credit derivatives, including total returnswaps;
‰ Entering into operating leases; and
‰ Providing guarantees, indemnifications, commitments,letters of credit and representations and warranties.
We enter into these arrangements for a variety of businesspurposes, including securitizations. The securitizationvehicles that purchase mortgages, corporate bonds, andother types of financial assets are critical to the functioningof several significant investor markets, including themortgage-backed and other asset-backed securitiesmarkets, since they offer investors access to specific cashflows and risks created through the securitization process.
We also enter into these arrangements to underwrite clientsecuritization transactions; provide secondary marketliquidity; make investments in performing andnonperforming debt, equity, real estate and other assets;provide investors with credit-linked and asset-repackagednotes; and receive or provide letters of credit to satisfymargin requirements and to facilitate the clearance andsettlement process.
Our financial interests in, and derivative transactions with,such nonconsolidated entities are generally accounted for atfair value, in the same manner as our other financialinstruments, except in cases where we apply the equitymethod of accounting.
The table below presents where information about ourvarious off-balance-sheet arrangements may be found inthis Form 10-Q. In addition, see Note 3 to the condensedconsolidated financial statements for information aboutour consolidation policies.
Type of Off-Balance-Sheet
Arrangement Disclosure in Form 10-Q
Variable interests and otherobligations, including contingentobligations, arising from variableinterests in nonconsolidated VIEs
See Note 12 to the condensedconsolidated financial statements.
Leases, letters of credit, andlending and other commitments
See “Contractual Obligations”below and Note 18 to thecondensed consolidated financialstatements.
Guarantees See “Contractual Obligations”below and Note 18 to thecondensed consolidated financialstatements.
Derivatives See “Credit Risk Management —Credit Exposures — OTCDerivatives” below and Notes 4,5, 7 and 18 to the condensedconsolidated financial statements.
Contractual Obligations
We have certain contractual obligations which require us tomake future cash payments. These contractual obligationsinclude our unsecured long-term borrowings, secured long-term financings, time deposits and contractual interestpayments, all of which are included in our condensedconsolidated statements of financial condition.
Our obligations to make future cash payments also includecertain off-balance-sheet contractual obligations such aspurchase obligations, minimum rental payments undernoncancelable leases and commitments and guarantees.
121 Goldman Sachs June 2017 Form 10-Q

THE GOLDMAN SACHS GROUP, INC. AND SUBSIDIARIES
Management’s Discussion and Analysis
The table below presents our contractual obligations,commitments and guarantees by type.
As of
$ in millionsJune2017
December2016
Amounts related to on-balance-sheet obligations
Time deposits $ 27,341 $ 27,394Secured long-term financings $ 12,346 $ 8,405Unsecured long-term borrowings $ 203,647 $189,086Contractual interest payments $ 54,827 $ 54,552Subordinated liabilities of consolidated VIEs $ 21 $ 584Amounts related to off-balance-sheet arrangements
Commitments to extend credit $ 125,089 $112,056Contingent and forward starting collateralized
agreements $ 59,795 $ 25,348Forward starting collateralized financings $ 23,651 $ 8,939Letters of credit $ 377 $ 373Investment commitments $ 8,909 $ 8,444Other commitments $ 5,012 $ 6,014Minimum rental payments $ 1,915 $ 1,941Derivative guarantees $1,621,193 $816,774Securities lending indemnifications $ 37,666 $ 33,403Other financial guarantees $ 3,799 $ 3,662
The table below presents our contractual obligations,commitments and guarantees by period of expiration.
As of June 2017
$ in millionsRemainder
of 20172018 -
20192020 -
20212022 -
Thereafter
Amounts related to on-balance-sheet obligations
Time deposits $ — $ 10,138 $ 8,069 $ 9,134
Secured long-termfinancings $ — $ 8,168 $ 1,783 $ 2,395
Unsecured long-termborrowings $ — $ 39,640 $ 43,766 $120,241
Contractual interestpayments $ 3,610 $ 12,340 $ 9,167 $ 29,710
Subordinated liabilities ofconsolidated VIEs $ — $ — $ — $ 21
Amounts related to off-balance-sheet arrangements
Commitments to extendcredit $ 6,232 $ 37,326 $ 52,981 $ 28,550
Contingent and forwardstarting collateralizedagreements $ 59,792 $ 3 $ — $ —
Forward startingcollateralized financings $ 23,651 $ — $ — $ —
Letters of credit $ 131 $ 206 $ — $ 40
Investment commitments $ 6,072 $ 891 $ 112 $ 1,834
Other commitments $ 4,640 $ 313 $ 16 $ 43
Minimum rental payments $ 156 $ 555 $ 397 $ 807
Derivative guarantees $616,936 $802,994 $103,842 $ 97,421
Securities lendingindemnifications $ 37,666 $ — $ — $ —
Other financial guarantees $ 758 $ 689 $ 2,039 $ 313
In the table above:
‰ Obligations maturing within one year of our financialstatement date or redeemable within one year of ourfinancial statement date at the option of the holders areexcluded as they are treated as short-term obligations.
‰ Obligations that are repayable prior to maturity at ouroption are reflected at their contractual maturity datesand obligations that are redeemable prior to maturity atthe option of the holders are reflected at the earliest datessuch options become exercisable.
‰ Amounts included in the table do not necessarily reflectthe actual future cash flow requirements for thesearrangements because commitments and guaranteesrepresent notional amounts and may expire unused or bereduced or cancelled at the counterparty’s request.
‰ Due to the uncertainty of the timing and amounts thatwill ultimately be paid, our liability for unrecognized taxbenefits has been excluded. See Note 24 to the condensedconsolidated financial statements for further informationabout our unrecognized tax benefits.
‰ As of June 2017, unsecured long-term borrowingsincluded $6.42 billion of adjustments to the carryingvalue of certain unsecured long-term borrowingsresulting from the application of hedge accounting.
‰ As of June 2017, the aggregate contractual principalamount of secured long-term financings and unsecuredlong-term borrowings for which the fair value option waselected exceeded the related fair value by $150 millionand $1.59 billion, respectively.
‰ Contractual interest payments represents estimated futureinterest payments related to unsecured long-termborrowings, secured long-term financings and timedeposits based on applicable interest rates as ofJune 2017, and includes stated coupons, if any, onstructured notes.
‰ Contingent and forward starting collateralizedagreements include resale and securities borrowingagreements, and forward starting collateralizedfinancings include repurchase and secured lendingagreements that settle at a future date, generally withinthree business days.
See Notes 15 and 18 to the condensed consolidatedfinancial statements for further information about ourshort-term borrowings, and commitments and guarantees,respectively.
Goldman Sachs June 2017 Form 10-Q 122

THE GOLDMAN SACHS GROUP, INC. AND SUBSIDIARIES
Management’s Discussion and Analysis
As of June 2017, our unsecured long-term borrowings were$203.65 billion, with maturities extending to 2057, andconsisted principally of senior borrowings. See Note 16 tothe condensed consolidated financial statements for furtherinformation about our unsecured long-term borrowings.
As of June 2017, our future minimum rental payments, netof minimum sublease rentals under noncancelable leases,were $1.92 billion. These lease commitments for officespace expire on various dates through 2069. Certainagreements are subject to periodic escalation provisions forincreases in real estate taxes and other charges. See Note 18to the condensed consolidated financial statements forfurther information about our leases.
Our occupancy expenses include costs associated withoffice space held in excess of our current requirements. Thisexcess space, the cost of which is charged to earnings asincurred, is being held for potential growth or to replacecurrently occupied space that we may exit in the future. Weregularly evaluate our current and future space capacity inrelation to current and projected staffing levels. During thethree and six months ended June 2017, total occupancyexpenses for space held in excess of our currentrequirements and exit costs related to our office space werenot material. We may incur exit costs in the future to theextent we (i) reduce our space capacity or (ii) commit to, oroccupy, new properties in the locations in which we operateand, consequently, dispose of existing space that had beenheld for potential growth. These exit costs may be materialto our results of operations in a given period.
Risk Management
Risks are inherent in our business and include liquidity,market, credit, operational, model, legal, regulatory andreputational risks. For further information about our riskmanagement processes, see “— Overview and Structure ofRisk Management” below. Our risks include the risksacross our risk categories, regions or global businesses, aswell as those which have uncertain outcomes and have thepotential to materially impact our financial results, ourliquidity and our reputation. For further information aboutour areas of risk, see “— Liquidity Risk Management,” “—Market Risk Management,” “— Credit RiskManagement,” “— Operational Risk Management” and“— Model Risk Management” below and “Risk Factors”in Part I, Item 1A of the 2016 Form 10-K.
Overview and Structure of Risk Management
Overview
We believe that effective risk management is of primaryimportance to our success. Accordingly, we havecomprehensive risk management processes through whichwe monitor, evaluate and manage the risks we assume inconducting our activities. These include liquidity, market,credit, operational, model, legal, compliance, regulatoryand reputational risk exposures. Our risk managementframework is built around three core components:governance, processes and people.
Governance. Risk management governance starts with theBoard, which plays an important role in reviewing andapproving risk management policies and practices, bothdirectly and through its committees, including its RiskCommittee. The Board also receives regular briefings onfirmwide risks, including market risk, liquidity risk, creditrisk, operational risk and model risk from our independentcontrol and support functions, including the chief riskofficer, and on compliance risk from the head ofCompliance, on legal and regulatory matters from thegeneral counsel, and on other matters impacting ourreputation from the chair of our Firmwide Client andBusiness Standards Committee. The chief risk officer, aspart of the review of the firmwide risk portfolio, regularlyadvises the Risk Committee of the Board of relevant riskmetrics and material exposures. Next, at our most seniorlevels, our leaders are experienced risk managers, with asophisticated and detailed understanding of the risks wetake. Our senior management, and senior managers in ourrevenue-producing units and independent control andsupport functions, lead and participate in risk-orientedcommittees. Independent control and support functionsinclude Compliance, the Conflicts Resolution Group(Conflicts), Controllers, Credit Risk Management andAdvisory (Credit Risk Management), Human CapitalManagement, Legal, Liquidity Risk Management andAnalysis (Liquidity Risk Management), Market RiskManagement and Analysis (Market Risk Management),Model Risk Management, Operations, Operational RiskManagement and Analysis (Operational RiskManagement), Tax, Technology and Treasury.
Our governance structure provides the protocol andresponsibility for decision-making on risk managementissues and ensures implementation of those decisions. Wemake extensive use of risk-related committees that meetregularly and serve as an important means to facilitate andfoster ongoing discussions to identify, manage and mitigaterisks.
123 Goldman Sachs June 2017 Form 10-Q

THE GOLDMAN SACHS GROUP, INC. AND SUBSIDIARIES
Management’s Discussion and Analysis
We maintain strong communication about risk and we havea culture of collaboration in decision-making among therevenue-producing units, independent control and supportfunctions, committees and senior management. While webelieve that the first line of defense in managing risk restswith the managers in our revenue-producing units, wededicate extensive resources to independent control andsupport functions in order to ensure a strong oversightstructure and an appropriate segregation of duties. Weregularly reinforce our strong culture of escalation andaccountability across all divisions and functions.
Processes. We maintain various processes and proceduresthat are critical components of our risk management. Firstand foremost is our daily discipline of markingsubstantially all of our inventory to current market levels.We carry our inventory at fair value, with changes invaluation reflected immediately in our risk managementsystems and in net revenues. We do so because we believethis discipline is one of the most effective tools for assessingand managing risk and that it provides transparent andrealistic insight into our financial exposures.
We also apply a rigorous framework of limits to control riskacross transactions, products, businesses and markets. Thisincludes approval of limits at firmwide, business and productlevels by the Risk Committee of the Board. In addition, theFirmwide Risk Committee is responsible for approving ourrisk limits framework, subject to the overall limits approvedby the Risk Committee of the Board, at a variety of levels andmonitoring these limits on a daily basis. The RiskGovernance Committee (through delegated authority fromthe Firmwide Risk Committee) is responsible for approvinglimits at firmwide, business and product levels. Certain limitsmay be set at levels that will require periodic adjustment,rather than at levels which reflect our maximum riskappetite. This fosters an ongoing dialogue on risk amongrevenue-producing units, independent control and supportfunctions, committees and senior management, as well asrapid escalation of risk-related matters. See “Liquidity RiskManagement,” “Market Risk Management” and “CreditRisk Management” for further information about our risklimits.
Active management of our positions is another importantprocess. Proactive mitigation of our market and creditexposures minimizes the risk that we will be required totake outsized actions during periods of stress.
We also focus on the rigor and effectiveness of our risksystems. The goal of our risk management technology is toget the right information to the right people at the righttime, which requires systems that are comprehensive,reliable and timely. We devote significant time andresources to our risk management technology to ensure thatit consistently provides us with complete, accurate andtimely information.
People. Even the best technology serves only as a tool forhelping to make informed decisions in real time about therisks we are taking. Ultimately, effective risk managementrequires our people to interpret our risk data on an ongoingand timely basis and adjust risk positions accordingly. Inboth our revenue-producing units and our independentcontrol and support functions, the experience of ourprofessionals, and their understanding of the nuances andlimitations of each risk measure, guide us in assessingexposures and maintaining them within prudent levels.
We reinforce a culture of effective risk management in ourtraining and development programs as well as the way weevaluate performance, and recognize and reward ourpeople. Our training and development programs, includingcertain sessions led by our most senior leaders, are focusedon the importance of risk management, client relationshipsand reputational excellence. As part of our annualperformance review process, we assess reputationalexcellence including how an employee exercises good riskmanagement and reputational judgment, and adheres toour code of conduct and compliance policies. Our reviewand reward processes are designed to communicate andreinforce to our professionals the link between behaviorand how people are recognized, the need to focus on ourclients and our reputation, and the need to always act inaccordance with our highest standards.
Structure
Ultimate oversight of risk is the responsibility of our Board.The Board oversees risk both directly and through itscommittees, including its Risk Committee. We have a seriesof committees with specific risk management mandates thathave oversight or decision-making responsibilities for riskmanagement activities. Committee membership generallyconsists of senior managers from both our revenue-producing units and our independent control and supportfunctions. We have established procedures for thesecommittees to ensure that appropriate information barriersare in place. Our primary risk committees, most of whichalso have additional sub-committees or working groups,are described below. In addition to these committees, wehave other risk-oriented committees which provideoversight for different businesses, activities, products,regions and legal entities. All of our firmwide, regional anddivisional committees have responsibility for consideringthe impact of transactions and activities which they overseeon our reputation.
Membership of our risk committees is reviewed regularlyand updated to reflect changes in the responsibilities of thecommittee members. Accordingly, the length of time thatmembers serve on the respective committees varies asdetermined by the committee chairs and based on theresponsibilities of the members.
Goldman Sachs June 2017 Form 10-Q 124

THE GOLDMAN SACHS GROUP, INC. AND SUBSIDIARIES
Management’s Discussion and Analysis
In addition, independent control and support functions,which report to the chief executive officer, the presidentsand co-chief operating officers, the chief financial officer orthe chief risk officer, are responsible for day-to-dayoversight or monitoring of risk, as illustrated in the chartbelow and as described in greater detail in the followingsections. Internal Audit, which reports to the AuditCommittee of the Board and includes professionals with abroad range of audit and industry experience, including riskmanagement expertise, is responsible for independentlyassessing and validating key controls within the riskmanagement framework.
The chart below presents an overview of our riskmanagement governance structure, including the reportingrelationships of our independent control and supportfunctions.
Independent Control and
Support Functions
Corporate Oversight
Board of Directors
Board Committees
Revenue-Producing Units
Compliance
Management Committee
Presidents/Co-Chief Operating Officers
Chief Financial Officer
Chief Executive Officer
Chief Risk Officer
Firmwide Client and Business
Standards Committee
Internal Audit
Firmwide Enterprise Risk
Committee
Senior Management Oversight
Chief Executive Officer
Presidents/Co-Chief Operating Officers
Chief Financial Officer
Committee Oversight
Chief Risk Officer
Conflicts Human Capital Management
Credit Risk Management
Market Risk Management
Operational Risk Management
Model Risk Management
Liquidity Risk Management
Controllers Operations
Technology
Tax
Treasury
Legal
Firmwide Risk
Committee
Management Committee. The Management Committeeoversees our global activities, including all of ourindependent control and support functions. It provides thisoversight directly and through authority delegated tocommittees it has established. This committee is comprisedof our most senior leaders, and is chaired by our chiefexecutive officer. Most members of the ManagementCommittee are also members of other firmwide, divisionaland regional committees. The following are the committeesthat are principally involved in firmwide risk management.
Firmwide Client and Business Standards Committee.
The Firmwide Client and Business Standards Committeeassesses and makes determinations regarding businessstandards and practices, reputational risk management,client relationships and client service, is chaired by one ofour presidents and co-chief operating officers (who isappointed as chair by the chief executive officer), andreports to the Management Committee. This committeealso has responsibility for overseeing recommendations ofthe Business Standards Committee. This committeeperiodically updates and receives guidance from the PublicResponsibilities Committee of the Board. This committeehas also established certain committees that report to it,including divisional Client and Business StandardsCommittees and risk-related committees. The following arethe risk-related committees that report to the FirmwideClient and Business Standards Committee:
‰ Firmwide Reputational Risk Committee. TheFirmwide Reputational Risk Committee is responsible forassessing reputational risks arising from transactions thathave been identified as requiring mandatory escalation tothe Firmwide Reputational Risk Committee or thatotherwise have potential heightened reputational risk.This committee is chaired by one of our presidents andco-chief operating officers (who is appointed as chair bythe chief executive officer), and the vice-chairs are thehead of Compliance and the head of the ConflictsResolution Group, who are appointed as vice-chairs bythe chair of the Firmwide Client and Business StandardsCommittee.
‰ Firmwide Suitability Committee. The FirmwideSuitability Committee is responsible for setting standardsand policies for product, transaction and client suitabilityand providing a forum for consistency across divisions,regions and products on suitability assessments. Thiscommittee also reviews suitability matters escalated fromother committees. This committee is co-chaired by thedeputy head of Compliance, and the chief strategy officerof the Securities Division and co-head of Fixed Income,Currency and Commodities Sales, who are appointed asco-chairs by the chair of the Firmwide Client and BusinessStandards Committee.
Firmwide Risk Committee. The Firmwide RiskCommittee is globally responsible for the ongoingmonitoring and management of our financial risks. TheFirmwide Risk Committee approves our financial risklimits framework, metrics and methodologies, and reviewsresults of stress tests and scenario analyses. This committeeis co-chaired by our chief financial officer and our chief riskofficer (who are appointed as co-chairs by the chiefexecutive officer), and reports to the ManagementCommittee. The following are the primary committees thatreport to the Firmwide Risk Committee:
125 Goldman Sachs June 2017 Form 10-Q

THE GOLDMAN SACHS GROUP, INC. AND SUBSIDIARIES
Management’s Discussion and Analysis
‰ Credit Policy Committee. The Credit Policy Committeeestablishes and reviews broad firmwide credit policiesand parameters that are implemented by Credit RiskManagement. This committee is co-chaired by a deputychief risk officer and the chief risk officer of GS BankUSA, who are appointed as co-chairs by our chief riskofficer.
‰ Firmwide Finance Committee. The Firmwide FinanceCommittee has oversight responsibility for liquidity risk,the size and composition of our balance sheet and capitalbase, and credit ratings. This committee regularly reviewsour liquidity, balance sheet, funding position andcapitalization, approves related policies, and makesrecommendations as to any adjustments to be made inlight of current events, risks, exposures and regulatoryrequirements. As a part of such oversight, among otherthings, this committee reviews and approves balancesheet limits and the size of our GCLA. This committee isco-chaired by our chief risk officer and our globaltreasurer, who are appointed as co-chairs by theFirmwide Risk Committee.
‰ Firmwide Investment Policy Committee. TheFirmwide Investment Policy Committee reviews,approves, sets policies, and provides oversight for certainilliquid principal investments, including review of riskmanagement and controls for these types of investments.This committee is co-chaired by the head of our MerchantBanking Division, a co-head of our Securities Divisionand a deputy general counsel, who are appointed asco-chairs by our presidents and co-chief operating officersand our chief financial officer.
‰ Firmwide Volcker Oversight Committee. TheFirmwide Volcker Oversight Committee is responsible forthe oversight and periodic review of the implementationof our Volcker Rule compliance program, as approved bythe Board, and other Volcker Rule-related matters. Thiscommittee is co-chaired by a deputy chief risk officer andthe deputy head of Compliance, who are appointed asco-chairs by the co-chairs of the Firmwide RiskCommittee.
‰ Risk Governance Committee. The Risk GovernanceCommittee (through delegated authority from theFirmwide Risk Committee) is globally responsible for theongoing approval and monitoring of risk frameworks,policies, parameters and limits, at firmwide, business andproduct levels. This committee is chaired by our chief riskofficer, who is appointed as chair by the co-chairs of theFirmwide Risk Committee.
The following committees report jointly to the FirmwideRisk Committee and the Firmwide Client and BusinessStandards Committee:
‰ Firmwide Capital Committee. The Firmwide CapitalCommittee provides approval and oversight of debt-related transactions, including principal commitments ofour capital. This committee aims to ensure that businessand reputational standards for underwritings and capitalcommitments are maintained on a global basis. Thiscommittee is co-chaired by the head of Credit RiskManagement for our Investment Banking Division,Investment Management Division and Merchant BankingDivision, and the head of the Europe, Middle East andAfrica (EMEA) Financing Group. The co-chairs of theFirmwide Capital Committee are appointed by theco-chairs of the Firmwide Risk Committee.
‰ Firmwide Commitments Committee. The FirmwideCommitments Committee reviews our underwriting anddistribution activities with respect to equity and equity-related product offerings, and sets and maintains policiesand procedures designed to ensure that legal,reputational, regulatory and business standards aremaintained on a global basis. In addition to reviewingspecific transactions, this committee periodicallyconducts general strategic reviews of sectors and productsand establishes policies in connection with transactionpractices. This committee is co-chaired by the chairmanof the Financial Institutions Group in our InvestmentBanking Division, the co-head of the Industrials group inour Investment Banking Division, our chief underwritingofficer, and a managing director in Risk Management,who are appointed as co-chairs by the chair of theFirmwide Client and Business Standards Committee.
Firmwide Enterprise Risk Committee. The FirmwideEnterprise Risk Committee is responsible for establishing acomprehensive risk framework for the ongoing monitoringof our aggregate financial and nonfinancial risks. Thiscommittee is co-chaired by one of our presidents andco-chief operating officers and our chief risk officer (whoare appointed as co-chairs by our chief executive officer),and reports to the Management Committee. The followingare the primary committees that report to the FirmwideEnterprise Risk Committee:
Goldman Sachs June 2017 Form 10-Q 126
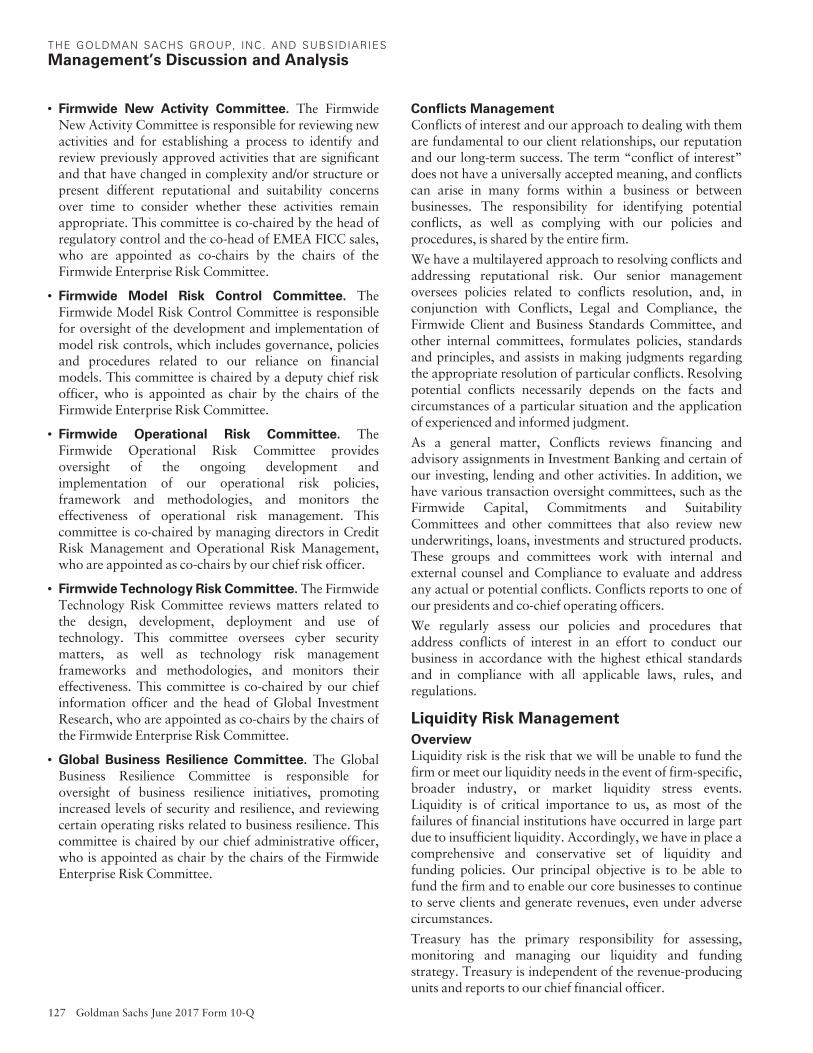
THE GOLDMAN SACHS GROUP, INC. AND SUBSIDIARIES
Management’s Discussion and Analysis
‰ Firmwide New Activity Committee. The FirmwideNew Activity Committee is responsible for reviewing newactivities and for establishing a process to identify andreview previously approved activities that are significantand that have changed in complexity and/or structure orpresent different reputational and suitability concernsover time to consider whether these activities remainappropriate. This committee is co-chaired by the head ofregulatory control and the co-head of EMEA FICC sales,who are appointed as co-chairs by the chairs of theFirmwide Enterprise Risk Committee.
‰ Firmwide Model Risk Control Committee. TheFirmwide Model Risk Control Committee is responsiblefor oversight of the development and implementation ofmodel risk controls, which includes governance, policiesand procedures related to our reliance on financialmodels. This committee is chaired by a deputy chief riskofficer, who is appointed as chair by the chairs of theFirmwide Enterprise Risk Committee.
‰ Firmwide Operational Risk Committee. TheFirmwide Operational Risk Committee providesoversight of the ongoing development andimplementation of our operational risk policies,framework and methodologies, and monitors theeffectiveness of operational risk management. Thiscommittee is co-chaired by managing directors in CreditRisk Management and Operational Risk Management,who are appointed as co-chairs by our chief risk officer.
‰ Firmwide Technology Risk Committee. The FirmwideTechnology Risk Committee reviews matters related tothe design, development, deployment and use oftechnology. This committee oversees cyber securitymatters, as well as technology risk managementframeworks and methodologies, and monitors theireffectiveness. This committee is co-chaired by our chiefinformation officer and the head of Global InvestmentResearch, who are appointed as co-chairs by the chairs ofthe Firmwide Enterprise Risk Committee.
‰ Global Business Resilience Committee. The GlobalBusiness Resilience Committee is responsible foroversight of business resilience initiatives, promotingincreased levels of security and resilience, and reviewingcertain operating risks related to business resilience. Thiscommittee is chaired by our chief administrative officer,who is appointed as chair by the chairs of the FirmwideEnterprise Risk Committee.
Conflicts Management
Conflicts of interest and our approach to dealing with themare fundamental to our client relationships, our reputationand our long-term success. The term “conflict of interest”does not have a universally accepted meaning, and conflictscan arise in many forms within a business or betweenbusinesses. The responsibility for identifying potentialconflicts, as well as complying with our policies andprocedures, is shared by the entire firm.
We have a multilayered approach to resolving conflicts andaddressing reputational risk. Our senior managementoversees policies related to conflicts resolution, and, inconjunction with Conflicts, Legal and Compliance, theFirmwide Client and Business Standards Committee, andother internal committees, formulates policies, standardsand principles, and assists in making judgments regardingthe appropriate resolution of particular conflicts. Resolvingpotential conflicts necessarily depends on the facts andcircumstances of a particular situation and the applicationof experienced and informed judgment.
As a general matter, Conflicts reviews financing andadvisory assignments in Investment Banking and certain ofour investing, lending and other activities. In addition, wehave various transaction oversight committees, such as theFirmwide Capital, Commitments and SuitabilityCommittees and other committees that also review newunderwritings, loans, investments and structured products.These groups and committees work with internal andexternal counsel and Compliance to evaluate and addressany actual or potential conflicts. Conflicts reports to one ofour presidents and co-chief operating officers.
We regularly assess our policies and procedures thataddress conflicts of interest in an effort to conduct ourbusiness in accordance with the highest ethical standardsand in compliance with all applicable laws, rules, andregulations.
Liquidity Risk Management
Overview
Liquidity risk is the risk that we will be unable to fund thefirm or meet our liquidity needs in the event of firm-specific,broader industry, or market liquidity stress events.Liquidity is of critical importance to us, as most of thefailures of financial institutions have occurred in large partdue to insufficient liquidity. Accordingly, we have in place acomprehensive and conservative set of liquidity andfunding policies. Our principal objective is to be able tofund the firm and to enable our core businesses to continueto serve clients and generate revenues, even under adversecircumstances.
Treasury has the primary responsibility for assessing,monitoring and managing our liquidity and fundingstrategy. Treasury is independent of the revenue-producingunits and reports to our chief financial officer.
127 Goldman Sachs June 2017 Form 10-Q

THE GOLDMAN SACHS GROUP, INC. AND SUBSIDIARIES
Management’s Discussion and Analysis
Liquidity Risk Management is an independent riskmanagement function responsible for control and oversightof our liquidity risk management framework, includingstress testing and limit governance. Liquidity RiskManagement is independent of the revenue-producing unitsand Treasury, and reports to our chief risk officer.
Liquidity Risk Management Principles
We manage liquidity risk according to three principles(i) hold sufficient excess liquidity in the form of GCLA tocover outflows during a stressed period, (ii) maintainappropriate Asset-Liability Management and (iii) maintaina viable Contingency Funding Plan.
Global Core Liquid Assets. GCLA is liquidity that wemaintain to meet a broad range of potential cash outflowsand collateral needs in a stressed environment. Our mostimportant liquidity policy is to pre-fund our estimatedpotential cash and collateral needs during a liquidity crisisand hold this liquidity in the form of unencumbered, highlyliquid securities and cash. We believe that the securities heldin our GCLA would be readily convertible to cash in amatter of days, through liquidation, by entering intorepurchase agreements or from maturities of resaleagreements, and that this cash would allow us to meetimmediate obligations without needing to sell other assetsor depend on additional funding from credit-sensitivemarkets.
Our GCLA reflects the following principles:
‰ The first days or weeks of a liquidity crisis are the mostcritical to a company’s survival;
‰ Focus must be maintained on all potential cash andcollateral outflows, not just disruptions to financingflows. Our businesses are diverse, and our liquidity needsare determined by many factors, including marketmovements, collateral requirements and clientcommitments, all of which can change dramatically in adifficult funding environment;
‰ During a liquidity crisis, credit-sensitive funding,including unsecured debt and some types of securedfinancing agreements, may be unavailable, and the terms(e.g., interest rates, collateral provisions and tenor) oravailability of other types of secured financing maychange; and
‰ As a result of our policy to pre-fund liquidity that weestimate may be needed in a crisis, we hold moreunencumbered securities and have larger debt balancesthan our businesses would otherwise require. We believethat our liquidity is stronger with greater balances ofhighly liquid unencumbered securities, even though itincreases our total assets and our funding costs.
We maintain our GCLA across Group Inc., Funding IHCand Group Inc.’s major broker-dealer and banksubsidiaries, asset types, and clearing agents to provide uswith sufficient operating liquidity to ensure timelysettlement in all major markets, even in a difficult fundingenvironment. In addition to the GCLA, we maintain cashbalances and securities in several of our other entities,primarily for use in specific currencies, entities, orjurisdictions where we do not have immediate access toparent company liquidity.
We believe that our GCLA provides us with a resilientsource of funds that would be available in advance ofpotential cash and collateral outflows and gives ussignificant flexibility in managing through a difficultfunding environment.
Asset-Liability Management. Our liquidity riskmanagement policies are designed to ensure we have asufficient amount of financing, even when funding marketsexperience persistent stress. We manage the maturities anddiversity of our funding across markets, products andcounterparties, and seek to maintain a diversified fundingprofile with an appropriate tenor, taking into considerationthe characteristics and liquidity profile of our assets.
Our approach to asset-liability management includes:
‰ Conservatively managing the overall characteristics ofour funding book, with a focus on maintaining long-term,diversified sources of funding in excess of our currentrequirements. See “Balance Sheet and Funding Sources —Funding Sources” for additional details;
‰ Actively managing and monitoring our asset base, withparticular focus on the liquidity, holding period and ourability to fund assets on a secured basis. We assess ourfunding requirements and our ability to liquidate assets ina stressed environment while appropriately managingrisk. This enables us to determine the most appropriatefunding products and tenors. See “Balance Sheet andFunding Sources — Balance Sheet Management” formore detail on our balance sheet management processand “— Funding Sources — Secured Funding” for moredetail on asset classes that may be harder to fund on asecured basis; and
‰ Raising secured and unsecured financing that has a longtenor relative to the liquidity profile of our assets. Thisreduces the risk that our liabilities will come due inadvance of our ability to generate liquidity from the saleof our assets. Because we maintain a highly liquid balancesheet, the holding period of certain of our assets may bematerially shorter than their contractual maturity dates.
Goldman Sachs June 2017 Form 10-Q 128
THE GOLDMAN SACHS GROUP, INC. AND SUBSIDIARIES
Management’s Discussion and Analysis
Our goal is to ensure that we maintain sufficient liquidity tofund our assets and meet our contractual and contingentobligations in normal times as well as during periods ofmarket stress. Through our dynamic balance sheetmanagement process, we use actual and projected assetbalances to determine secured and unsecured fundingrequirements. Funding plans are reviewed and approved bythe Firmwide Finance Committee on a quarterly basis. Inaddition, senior managers in our independent control andsupport functions regularly analyze, and the FirmwideFinance Committee reviews, our consolidated total capitalposition (unsecured long-term borrowings plus totalshareholders’ equity) so that we maintain a level of long-term funding that is sufficient to meet our long-termfinancing requirements. In a liquidity crisis, we would firstuse our GCLA in order to avoid reliance on asset sales(other than our GCLA). However, we recognize thatorderly asset sales may be prudent or necessary in a severeor persistent liquidity crisis.
Subsidiary Funding Policies
The majority of our unsecured funding is raised by GroupInc. which lends the necessary funds to Funding IHC andother subsidiaries, some of which are regulated, to meettheir asset financing, liquidity and capital requirements. Inaddition, Group Inc. provides its regulated subsidiarieswith the necessary capital to meet their regulatoryrequirements. The benefits of this approach to subsidiaryfunding are enhanced control and greater flexibility to meetthe funding requirements of our subsidiaries. Funding isalso raised at the subsidiary level through a variety ofproducts, including secured funding, unsecured borrowingsand deposits.
Our intercompany funding policies assume that, unlesslegally provided for, a subsidiary’s funds or securities arenot freely available to its parent, Funding IHC or othersubsidiaries. In particular, many of our subsidiaries aresubject to laws that authorize regulatory bodies to block orreduce the flow of funds from those subsidiaries to GroupInc. or Funding IHC. Regulatory action of that kind couldimpede access to funds that Group Inc. needs to makepayments on its obligations. Accordingly, we assume thatthe capital provided to our regulated subsidiaries is notavailable to Group Inc. or other subsidiaries and any otherfinancing provided to our regulated subsidiaries is notavailable to Group Inc. or Funding IHC until the maturityof such financing.
Group Inc. has provided substantial amounts of equity andsubordinated indebtedness, directly or indirectly, to itsregulated subsidiaries. For example, as of June 2017,Group Inc. had $31.00 billion of equity and subordinatedindebtedness invested in GS&Co., its principal U.S.registered broker-dealer; $36.49 billion invested in GSI, aregulated U.K. broker-dealer; $2.57 billion invested inGSJCL, a regulated Japanese broker-dealer; $26.85 billioninvested in GS Bank USA, a regulated New York State-chartered bank; and $3.81 billion invested in GSIB, aregulated U.K. bank. Group Inc. also provided, directly orindirectly, $111.86 billion of unsubordinated loans(including secured loans of $36.80 billion), and$13.22 billion of collateral and cash deposits to theseentities, substantially all of which was to GS&Co., GSI,GSJCL and GS Bank USA, as of June 2017. In addition, asof June 2017, Group Inc. had significant amounts of capitalinvested in and loans to its other regulated subsidiaries.
Contingency Funding Plan. We maintain a contingencyfunding plan to provide a framework for analyzing andresponding to a liquidity crisis situation or periods ofmarket stress. Our contingency funding plan outlines a listof potential risk factors, key reports and metrics that arereviewed on an ongoing basis to assist in assessing theseverity of, and managing through, a liquidity crisis and/ormarket dislocation. The contingency funding plan alsodescribes in detail our potential responses if ourassessments indicate that we have entered a liquidity crisis,which include pre-funding for what we estimate will be ourpotential cash and collateral needs as well as utilizingsecondary sources of liquidity. Mitigants and action itemsto address specific risks which may arise are also describedand assigned to individuals responsible for execution.
The contingency funding plan identifies key groups ofindividuals to foster effective coordination, control anddistribution of information, all of which are critical in themanagement of a crisis or period of market stress. Thecontingency funding plan also details the responsibilities ofthese groups and individuals, which include making anddisseminating key decisions, coordinating all contingencyactivities throughout the duration of the crisis or period ofmarket stress, implementing liquidity maintenanceactivities and managing internal and externalcommunication.
129 Goldman Sachs June 2017 Form 10-Q

THE GOLDMAN SACHS GROUP, INC. AND SUBSIDIARIES
Management’s Discussion and Analysis
Liquidity Stress Tests
In order to determine the appropriate size of our GCLA, weuse an internal liquidity model, referred to as the ModeledLiquidity Outflow, which captures and quantifies ourliquidity risks. We also consider other factors including, butnot limited to, an assessment of our potential intradayliquidity needs through an additional internal liquiditymodel, referred to as the Intraday Liquidity Model, theresults of our long-term stress testing models, ourresolution liquidity models and other applicable regulatoryrequirements and a qualitative assessment of our conditionas well as the financial markets. The results of the ModeledLiquidity Outflow, the Intraday Liquidity Model, the long-term stress testing models and the resolution liquiditymodels are reported to senior management on a regularbasis.
Modeled Liquidity Outflow. Our Modeled LiquidityOutflow is based on conducting multiple scenarios thatinclude combinations of market-wide and firm-specificstress. These scenarios are characterized by the followingqualitative elements:
‰ Severely challenged market environments, including lowconsumer and corporate confidence, financial andpolitical instability, adverse changes in market values,including potential declines in equity markets andwidening of credit spreads; and
‰ A firm-specific crisis potentially triggered by materiallosses, reputational damage, litigation, executivedeparture, and/or a ratings downgrade.
The following are the critical modeling parameters of theModeled Liquidity Outflow:
‰ Liquidity needs over a 30-day scenario;
‰ A two-notch downgrade of our long-term seniorunsecured credit ratings;
‰ A combination of contractual outflows, such asupcoming maturities of unsecured debt, and contingentoutflows (e.g., actions though not contractually required,we may deem necessary in a crisis). We assume that mostcontingent outflows will occur within the initial days andweeks of a crisis;
‰ No issuance of equity or unsecured debt;
‰ No support from additional government fundingfacilities. Although we have access to various central bankfunding programs, we do not assume reliance onadditional sources of funding in a liquidity crisis; and
‰ No asset liquidation, other than the GCLA.
The potential contractual and contingent cash andcollateral outflows covered in our Modeled LiquidityOutflow include:
Unsecured Funding
‰ Contractual: All upcoming maturities of unsecured long-term debt, commercial paper, and other unsecuredfunding products. We assume that we will be unable toissue new unsecured debt or rollover any maturing debt.
‰ Contingent: Repurchases of our outstanding long-termdebt, commercial paper and hybrid financial instrumentsin the ordinary course of business as a market maker.
Deposits
‰ Contractual: All upcoming maturities of term deposits.We assume that we will be unable to raise new termdeposits or rollover any maturing term deposits.
‰ Contingent: Partial withdrawals of deposits that have nocontractual maturity. The withdrawal assumptionsreflect, among other factors, the type of deposit, whetherthe deposit is insured or uninsured, and our relationshipwith the depositor.
Secured Funding
‰ Contractual: A portion of upcoming contractualmaturities of secured funding due to either the inability torefinance or the ability to refinance only at wider haircuts(i.e., on terms which require us to post additionalcollateral). Our assumptions reflect, among other factors,the quality of the underlying collateral, counterparty rollprobabilities (our assessment of the counterparty’slikelihood of continuing to provide funding on a securedbasis at the maturity of the trade) and counterpartyconcentration.
‰ Contingent: Adverse changes in the value of financialassets pledged as collateral for financing transactions,which would necessitate additional collateral postingsunder those transactions.
OTC Derivatives
‰ Contingent: Collateral postings to counterparties due toadverse changes in the value of our OTC derivatives,excluding those that are cleared and settled throughcentral counterparties (OTC-cleared).
‰ Contingent: Other outflows of cash or collateral relatedto OTC derivatives, excluding OTC-cleared, includingthe impact of trade terminations, collateral substitutions,collateral disputes, loss of rehypothecation rights,collateral calls or termination payments required by atwo-notch downgrade in our credit ratings, and collateralthat has not been called by counterparties, but is availableto them.
Goldman Sachs June 2017 Form 10-Q 130
THE GOLDMAN SACHS GROUP, INC. AND SUBSIDIARIES
Management’s Discussion and Analysis
Exchange-Traded and OTC-cleared Derivatives
‰ Contingent: Variation margin postings required due toadverse changes in the value of our outstandingexchange-traded and OTC-cleared derivatives.
‰ Contingent: An increase in initial margin and guarantyfund requirements by derivative clearing houses.
Customer Cash and Securities
‰ Contingent: Liquidity outflows associated with our primebrokerage business, including withdrawals of customercredit balances, and a reduction in customer shortpositions, which may serve as a funding source for longpositions.
Securities
‰ Contingent: Liquidity outflows associated with areduction or composition change in our short positions,which may serve as a funding source for long positions.
Unfunded Commitments
‰ Contingent: Draws on our unfunded commitments. Drawassumptions reflect, among other things, the type ofcommitment and counterparty.
Other
‰ Other upcoming large cash outflows, such as taxpayments.
Intraday Liquidity Model. Our Intraday Liquidity Modelmeasures our intraday liquidity needs using a scenarioanalysis characterized by the same qualitative elements asour Modeled Liquidity Outflow. The model assesses therisk of increased intraday liquidity requirements during ascenario where access to sources of intraday liquidity maybecome constrained.
The following are key modeling elements of the IntradayLiquidity Model:
‰ Liquidity needs over a one-day settlement period;
‰ Delays in receipt of counterparty cash payments;
‰ A reduction in the availability of intraday credit lines atour third-party clearing agents; and
‰ Higher settlement volumes due to an increase in activity.
Long-Term Stress Testing. We utilize longer-term stresstests to take a forward view on our liquidity positionthrough prolonged stress periods in which we experience asevere liquidity stress and recover in an environment thatcontinues to be challenging. We are focused on ensuringconservative asset-liability management to prepare for aprolonged period of potential stress, seeking to maintain adiversified funding profile with an appropriate tenor,taking into consideration the characteristics and liquidityprofile of our assets.
We also perform stress tests on a regular basis as part of ourroutine risk management processes and conduct tailoredstress tests on an ad hoc or product-specific basis inresponse to market developments.
Resolution Liquidity Models. In connection with ourresolution planning efforts, we have established an RLAPframework, which estimates liquidity needs of our majorsubsidiaries in a stressed environment. The liquidity needsof such subsidiaries are measured using our ModeledLiquidity Outflow assumptions and include certainadditional inter-affiliate exposures. We have alsoestablished a Resolution Liquidity Execution Need (RLEN)framework, which measures the liquidity needs of ourmajor subsidiaries to stabilize and wind-down following aGroup Inc. bankruptcy filing in accordance with ourpreferred resolution strategy. See “Regulatory Matters andDevelopments — Resolution and Recovery Plans” forfurther information.
Model Review and Validation
Treasury regularly refines our Modeled Liquidity Outflow,Intraday Liquidity Model and our other stress testingmodels to reflect changes in market or economic conditionsand our business mix. Any changes, including modelassumptions, are assessed and approved by Liquidity RiskManagement.
Model Risk Management is responsible for the independentreview and validation of our liquidity models. See “ModelRisk Management” for further information about thereview and validation of these models.
Limits
We use liquidity limits at various levels and across liquidityrisk types to manage the size of our liquidity exposures.Limits are measured relative to acceptable levels of riskgiven our liquidity risk tolerance. The purpose of thefirmwide limits is to assist senior management inmonitoring and controlling our overall liquidity profile.
The Risk Committee of the Board and the FirmwideFinance Committee approve liquidity risk limits at thefirmwide level. Limits are reviewed frequently andamended, with required approvals, on a permanent andtemporary basis, as appropriate, to reflect changing marketor business conditions.
Our liquidity risk limits are monitored by Treasury andLiquidity Risk Management. Treasury is responsible foridentifying and escalating, on a timely basis, instanceswhere limits have been exceeded.
131 Goldman Sachs June 2017 Form 10-Q

THE GOLDMAN SACHS GROUP, INC. AND SUBSIDIARIES
Management’s Discussion and Analysis
GCLA and Unencumbered Metrics
GCLA. Based on the results of our internal liquidity riskmodels, described above, as well as our consideration ofother factors including, but not limited to, an assessment ofour potential intraday liquidity needs and a qualitativeassessment of our condition as well as the financialmarkets, we believe our liquidity position as of bothJune 2017 and December 2016 was appropriate. As ofJune 2017 and December 2016, the fair value of thesecurities and certain overnight cash deposits included inour GCLA totaled $221.07 billion and $226.07 billion,respectively. We strictly limit our GCLA to a narrowlydefined list of securities and cash because they are highlyliquid, even in a difficult funding environment. We do notinclude other potential sources of excess liquidity in ourGCLA, such as less liquid unencumbered securities orcommitted credit facilities. The fair value of our GCLAaveraged $213.86 billion and $217.84 billion for the threemonths ended June 2017 and March 2017, respectively.
The table below presents the average fair value of thesecurities and certain overnight cash deposits that areincluded in our GCLA.
Average for theThree Months Ended
$ in millionsJune2017
March2017
U.S. dollar-denominated $154,005 $162,559Non-U.S. dollar-denominated 59,856 55,283Total $213,861 $217,842
The table below presents the average fair value of ourGCLA by asset class.
Average for theThree Months Ended
$ in millionsJune2017
March2017
Overnight cash deposits $ 90,528 $ 93,449U.S. government obligations 72,655 74,327U.S. agency obligations 12,889 13,047Non-U.S. government obligations 37,789 37,019Total $213,861 $217,842
In the tables above:
‰ The U.S. dollar-denominated GCLA is composed of(i) unencumbered U.S. government and agencyobligations (including highly liquid U.S. agencymortgage-backed obligations), all of which are eligible ascollateral in Federal Reserve open market operations and(ii) certain overnight U.S. dollar cash deposits.
‰ The non-U.S. dollar-denominated GCLA is composed ofnon-U.S. government obligations (only unencumberedGerman, French, Japanese and U.K. governmentobligations) and certain overnight cash deposits in highlyliquid currencies.
The table below presents the average GCLA of Group Inc.and Funding IHC, and Group Inc.’s major broker-dealerand bank subsidiaries.
Average for theThree Months Ended
$ in millionsJune2017
March2017
Group Inc. and Funding IHC $ 34,888 $ 40,053Major broker-dealer subsidiaries 95,800 88,829Major bank subsidiaries 83,173 88,960Total $213,861 $217,842
We maintain our GCLA to enable us to meet current andpotential liquidity requirements of our parent company,Group Inc., and its subsidiaries. Our Modeled LiquidityOutflow and Intraday Liquidity Model incorporate aconsolidated requirement for Group Inc. as well as astandalone requirement for each of our major broker-dealerand bank subsidiaries. During the second quarter of 2017,in connection with our resolution plan, Group Inc.transferred substantially all of its GCLA to Funding IHC.Funding IHC is required to provide the necessary liquidityto Group Inc. during the ordinary course of business, and isalso obligated to provide capital and liquidity support tomajor subsidiaries in the event of our material financialdistress or failure. Liquidity held directly in each of ourmajor broker-dealer and bank subsidiaries is intended foruse only by that subsidiary to meet its liquidityrequirements and is assumed not to be available to GroupInc. or Funding IHC unless (i) legally provided for and(ii) there are no additional regulatory, tax or otherrestrictions. In addition, the Modeled Liquidity Outflowand Intraday Liquidity Model also incorporate a broaderassessment of standalone liquidity requirements for othersubsidiaries and we hold a portion of our GCLA directly atGroup Inc. or Funding IHC to support such requirements.
Other Unencumbered Assets. In addition to our GCLA,we have a significant amount of other unencumbered cashand financial instruments, including other governmentobligations, high-grade money market securities, corporateobligations, marginable equities, loans and cash depositsnot included in our GCLA. The fair value of ourunencumbered assets averaged $153.66 billion and$146.93 billion for the three months ended June 2017 andMarch 2017, respectively. We do not consider these assetsliquid enough to be eligible for our GCLA.
Goldman Sachs June 2017 Form 10-Q 132

THE GOLDMAN SACHS GROUP, INC. AND SUBSIDIARIES
Management’s Discussion and Analysis
Liquidity Regulatory Framework
The final rules on minimum liquidity standards approvedby the U.S. federal bank regulatory agencies call for aliquidity coverage ratio (LCR) designed to ensure thatbanking organizations maintain an adequate level ofunencumbered high-quality liquid assets (HQLA) based onexpected net cash outflows under an acute short-termliquidity stress scenario. The firm is required to maintain aminimum LCR of 100%. For the three months endedJune 2017, our average LCR exceeded the minimumrequirement.
In addition, in the second quarter of 2016, the U.S. federalbank regulatory agencies issued a proposed rule that callsfor a net stable funding ratio (NSFR) for large U.S. bankingorganizations. The proposal would require bankingorganizations to ensure they have access to stable fundingover a one-year time horizon. The proposed NSFRrequirement has an effective date of January 1, 2018,including quarterly disclosure of the ratio, as well as adescription of the banking organization’s stable fundingsources. We expect that we will be compliant with theNSFR requirement by the effective date.
The following is information on our subsidiary liquidityregulatory requirements:
‰ GS Bank USA. GS Bank USA is subject to minimumliquidity standards under the LCR rule approved by theU.S. federal bank regulatory agencies. The U.S. federalbank regulatory agencies’ proposed rule on the NSFRdescribed above would also apply to GS Bank USA.
‰ GSI. The LCR rule issued by the U.K. regulatoryauthorities became effective in the U.K. onOctober 1, 2015, with a phase-in period whereby certainfinancial institutions, including GSI, were required tohave an 80% minimum ratio initially, increasing to 90%on January 1, 2017 and 100% on January 1, 2018.
‰ Other Subsidiaries. We monitor the local regulatoryliquidity requirements of our subsidiaries to ensurecompliance. For many of our subsidiaries, theserequirements either have changed or are likely to changein the future due to the implementation of the BaselCommittee’s framework for liquidity risk measurement,standards and monitoring, as well as other regulatorydevelopments.
The implementation of these rules, and any amendmentsadopted by the applicable regulatory authorities, couldimpact our liquidity and funding requirements andpractices in the future.
Credit Ratings
We rely on the short-term and long-term debt capitalmarkets to fund a significant portion of our day-to-dayoperations and the cost and availability of debt financing isinfluenced by our credit ratings. Credit ratings are alsoimportant when we are competing in certain markets, suchas OTC derivatives, and when we seek to engage in longer-term transactions. See “Risk Factors” in Part I, Item 1A ofthe 2016 Form 10-K for information about the risksassociated with a reduction in our credit ratings.
The table below presents the unsecured credit ratings andoutlook of Group Inc. by DBRS, Inc. (DBRS), Fitch, Inc.(Fitch), Moody’s Investors Service (Moody’s), Rating andInvestment Information, Inc. (R&I), and Standard &Poor’s Ratings Services (S&P).
As of June 2017
DBRS Fitch Moody’s R&I S&P
Short-term Debt R-1 (middle) F1 P-2 a-1 A-2
Long-term Debt A (high) A A3 A BBB+
Subordinated Debt A A- Baa2 A- BBB-
Trust Preferred A BBB- Baa3 N/A BB
Preferred Stock BBB (high) BB+ Ba1 N/A BB
Ratings Outlook Stable Stable Stable Stable Stable
In the table above:
‰ The ratings for Trust Preferred relate to the guaranteedpreferred beneficial interests issued by Goldman SachsCapital I.
‰ The DBRS, Fitch, Moody’s and S&P ratings for PreferredStock include the APEX issued by Goldman SachsCapital II and Goldman Sachs Capital III.
133 Goldman Sachs June 2017 Form 10-Q

THE GOLDMAN SACHS GROUP, INC. AND SUBSIDIARIES
Management’s Discussion and Analysis
The table below presents the unsecured credit ratings andoutlook of GS Bank USA, GSIB, GS&Co. and GSI, byFitch, Moody’s and S&P.
As of June 2017
Fitch Moody’s S&P
GS Bank USA
Short-term Debt F1 P-1 A-1
Long-term Debt A+ A1 A+
Short-term Bank Deposits F1+ P-1 N/A
Long-term Bank Deposits AA- A1 N/A
Ratings Outlook Stable Stable Stable
GSIB
Short-term Debt F1 P-1 A-1
Long-term Debt A A1 A+
Short-term Bank Deposits F1 P-1 N/A
Long-term Bank Deposits A A1 N/A
Ratings Outlook Stable Stable Stable
GS&Co.
Short-term Debt F1 N/A A-1
Long-term Debt A+ N/A A+
Ratings Outlook Stable N/A Stable
GSI
Short-term Debt F1 P-1 A-1
Long-term Debt A A1 A+
Ratings Outlook Stable Stable Stable
We believe our credit ratings are primarily based on thecredit rating agencies’ assessment of:
‰ Our liquidity, market, credit and operational riskmanagement practices;
‰ The level and variability of our earnings;
‰ Our capital base;
‰ Our franchise, reputation and management;
‰ Our corporate governance; and
‰ The external operating and economic environment,including, in some cases, the assumed level of governmentsupport or other systemic considerations, such aspotential resolution.
Certain of our derivatives have been transacted underbilateral agreements with counterparties who may requireus to post collateral or terminate the transactions based onchanges in our credit ratings. We assess the impact of thesebilateral agreements by determining the collateral ortermination payments that would occur assuming adowngrade by all rating agencies. A downgrade by any onerating agency, depending on the agency’s relative ratings ofus at the time of the downgrade, may have an impact,which is comparable to the impact of a downgrade by allrating agencies.
We manage our GCLA to ensure we would, among otherpotential requirements, be able to make the additionalcollateral or termination payments that may be required inthe event of a two-notch reduction in our long-term creditratings, as well as collateral that has not been called bycounterparties, but is available to them.
The table below presents the additional collateral ortermination payments related to our net derivativeliabilities under bilateral agreements that could have beencalled by counterparties in the event of a one-notch andtwo-notch downgrade in our credit ratings.
As of
$ in millionsJune2017
December2016
Additional collateral or termination payments:One-notch downgrade $ 374 $ 677Two-notch downgrade $1,385 $2,216
Cash Flows
As a global financial institution, our cash flows are complexand bear little relation to our net earnings and net assets.Consequently, we believe that traditional cash flow analysisis less meaningful in evaluating our liquidity position thanthe liquidity and asset-liability management policiesdescribed above. Cash flow analysis may, however, behelpful in highlighting certain macro trends and strategicinitiatives in our businesses.
Six Months Ended June 2017. Our cash and cashequivalents decreased by $10.82 billion to $110.89 billionat the end of the second quarter of 2017. We used$13.85 billion in net cash for operating activities, primarilyrelated to an increase in financial instruments owned andreceivables, partially offset by a decrease in collateralizedtransactions. We used $6.94 billion in net cash for investingactivities, primarily to fund loans receivable. We generated$9.97 billion in net cash from financing activities, primarilyfrom net issuances of unsecured long-term borrowings.
Six Months Ended June 2016. Our cash and cashequivalents increased by $29.08 billion to $122.52 billionat the end of the second quarter of 2016. We generated$12.82 billion in net cash from investing activities,primarily from net cash acquired in business acquisitions.We generated $8.72 billion in net cash from financingactivities, primarily from increases in deposits and from netissuances of unsecured long-term borrowings. Wegenerated $7.54 billion in net cash from operatingactivities, primarily related to a decrease in financialinstruments owned, partially offset by an increase incollateralized transactions.
Goldman Sachs June 2017 Form 10-Q 134

THE GOLDMAN SACHS GROUP, INC. AND SUBSIDIARIES
Management’s Discussion and Analysis
Market Risk Management
Overview
Market risk is the risk of loss in the value of our inventory,as well as certain other financial assets and financialliabilities, due to changes in market conditions. We employa variety of risk measures, each described in the respectivesections below, to monitor market risk. We hold inventoryprimarily for market making for our clients and for ourinvesting and lending activities. Our inventory thereforechanges based on client demands and our investmentopportunities. Our inventory is accounted for at fair valueand therefore fluctuates on a daily basis, with the relatedgains and losses included in “Market making” and “Otherprincipal transactions.” Categories of market risk includethe following:
‰ Interest rate risk: results from exposures to changes in thelevel, slope and curvature of yield curves, the volatilitiesof interest rates, prepayment speeds and credit spreads;
‰ Equity price risk: results from exposures to changes inprices and volatilities of individual equities, baskets ofequities and equity indices;
‰ Currency rate risk: results from exposures to changes inspot prices, forward prices and volatilities of currencyrates; and
‰ Commodity price risk: results from exposures to changesin spot prices, forward prices and volatilities ofcommodities, such as crude oil, petroleum products,natural gas, electricity, and precious and base metals.
Market Risk Management, which is independent of therevenue-producing units and reports to our chief riskofficer, has primary responsibility for assessing, monitoringand managing our market risk. We monitor and controlrisks through strong firmwide oversight and independentcontrol and support functions across our global businesses.
Managers in revenue-producing units and Market RiskManagement discuss market information, positions andestimated risk and loss scenarios on an ongoing basis.Managers in revenue-producing units are accountable formanaging risk within prescribed limits. These managershave in-depth knowledge of their positions, markets andthe instruments available to hedge their exposures.
Market Risk Management Process
We manage our market risk by diversifying exposures,controlling position sizes and establishing economic hedgesin related securities or derivatives. This process includes:
‰ Accurate and timely exposure information incorporatingmultiple risk metrics;
‰ A dynamic limit setting framework; and
‰ Constant communication among revenue-producingunits, risk managers and senior management.
Risk Measures
Market Risk Management produces risk measures andmonitors them against established market risk limits. Thesemeasures reflect an extensive range of scenarios and theresults are aggregated at product, business and firmwidelevels.
We use a variety of risk measures to estimate the size ofpotential losses for both moderate and more extrememarket moves over both short-term and long-term timehorizons. Our primary risk measures are VaR, which isused for shorter-term periods, and stress tests. Our riskreports detail key risks, drivers and changes for each deskand business, and are distributed daily to seniormanagement of both our revenue-producing units and ourindependent control and support functions.
Value-at-Risk. VaR is the potential loss in value due toadverse market movements over a defined time horizonwith a specified confidence level. For assets and liabilitiesincluded in VaR, see “Financial Statement Linkages toMarket Risk Measures.” We typically employ a one-daytime horizon with a 95% confidence level. We use a singleVaR model which captures risks including interest rates,equity prices, currency rates and commodity prices. Assuch, VaR facilitates comparison across portfolios ofdifferent risk characteristics. VaR also captures thediversification of aggregated risk at the firmwide level.
We are aware of the inherent limitations to VaR andtherefore use a variety of risk measures in our market riskmanagement process. Inherent limitations to VaR include:
‰ VaR does not estimate potential losses over longer timehorizons where moves may be extreme;
‰ VaR does not take account of the relative liquidity ofdifferent risk positions; and
‰ Previous moves in market risk factors may not produceaccurate predictions of all future market moves.
When calculating VaR, we use historical simulations withfull valuation of approximately 70,000 market factors.VaR is calculated at a position level based onsimultaneously shocking the relevant market risk factorsfor that position. We sample from five years of historicaldata to generate the scenarios for our VaR calculation. Thehistorical data is weighted so that the relative importance ofthe data reduces over time. This gives greater importance tomore recent observations and reflects current assetvolatilities, which improves the accuracy of our estimates ofpotential loss. As a result, even if our positions included inVaR were unchanged, our VaR would increase withincreasing market volatility and vice versa.
135 Goldman Sachs June 2017 Form 10-Q

THE GOLDMAN SACHS GROUP, INC. AND SUBSIDIARIES
Management’s Discussion and Analysis
Given its reliance on historical data, VaR is most effective inestimating risk exposures in markets in which there are nosudden fundamental changes or shifts in market conditions.
Our VaR measure does not include:
‰ Positions that are best measured and monitored usingsensitivity measures; and
‰ The impact of changes in counterparty and our owncredit spreads on derivatives, as well as changes in ourown credit spreads on unsecured borrowings for whichthe fair value option was elected.
We perform daily backtesting of our VaR model (i.e.,comparing daily net revenues for positions included in VaRto the VaR measure calculated as of the prior business day)at the firmwide level and for each of our businesses andmajor regulated subsidiaries.
Stress Testing. Stress testing is a method of determiningthe effect of various hypothetical stress scenarios. We usestress testing to examine risks of specific portfolios as wellas the potential impact of our significant risk exposures. Weuse a variety of stress testing techniques to calculate thepotential loss from a wide range of market moves on ourportfolios, including sensitivity analysis, scenario analysisand firmwide stress tests. The results of our various stresstests are analyzed together for risk management purposes.
Sensitivity analysis is used to quantify the impact of amarket move in a single risk factor across all positions (e.g.,equity prices or credit spreads) using a variety of definedmarket shocks, ranging from those that could be expectedover a one-day time horizon up to those that could takemany months to occur. We also use sensitivity analysis toquantify the impact of the default of any single entity,which captures the risk of large or concentrated exposures.
Scenario analysis is used to quantify the impact of aspecified event, including how the event impacts multiplerisk factors simultaneously. For example, for sovereignstress testing we calculate potential direct exposureassociated with our sovereign inventory as well as thecorresponding debt, equity and currency exposuresassociated with our non-sovereign inventory that may beimpacted by the sovereign distress. When conductingscenario analysis, we typically consider a number ofpossible outcomes for each scenario, ranging frommoderate to severely adverse market impacts. In addition,these stress tests are constructed using both historical eventsand forward-looking hypothetical scenarios.
Firmwide stress testing combines market, credit,operational and liquidity risks into a single combinedscenario. Firmwide stress tests are primarily used to assesscapital adequacy as part of our capital planning and stresstesting process; however, we also ensure that firmwidestress testing is integrated into our risk governanceframework. This includes selecting appropriate scenarios touse for our capital planning and stress testing process. See“Equity Capital Management and Regulatory Capital —Equity Capital Management” above for furtherinformation.
Unlike VaR measures, which have an implied probabilitybecause they are calculated at a specified confidence level,there is generally no implied probability that our stress testscenarios will occur. Instead, stress tests are used to modelboth moderate and more extreme moves in underlyingmarket factors. When estimating potential loss, wegenerally assume that our positions cannot be reduced orhedged (although experience demonstrates that we aregenerally able to do so).
Stress test scenarios are conducted on a regular basis as partof our routine risk management process and on an ad hocbasis in response to market events or concerns. Stresstesting is an important part of our risk management processbecause it allows us to quantify our exposure to tail risks,highlight potential loss concentrations, undertake risk/reward analysis, and assess and mitigate our risk positions.
Limits. We use risk limits at various levels (includingfirmwide, business and product) to govern risk appetite bycontrolling the size of our exposures to market risk. Limitsare set based on VaR and on a range of stress tests relevantto our exposures. Limits are reviewed frequently andamended on a permanent or temporary basis to reflectchanging market conditions, business conditions ortolerance for risk.
The Risk Committee of the Board and the Risk GovernanceCommittee (through delegated authority from theFirmwide Risk Committee) approve market risk limits andsub-limits at firmwide, business and product levels,consistent with our risk appetite. In addition, Market RiskManagement (through delegated authority from the RiskGovernance Committee) sets market risk limits andsub-limits at certain product and desk levels.
Goldman Sachs June 2017 Form 10-Q 136

THE GOLDMAN SACHS GROUP, INC. AND SUBSIDIARIES
Management’s Discussion and Analysis
The purpose of the firmwide limits is to assist seniormanagement in controlling our overall risk profile.Sub-limits are set below the approved level of risk limits.Sub-limits set the desired maximum amount of exposurethat may be managed by any particular business on aday-to-day basis without additional levels of seniormanagement approval, effectively leaving day-to-daydecisions to individual desk managers and traders.Accordingly, sub-limits are a management tool designed toensure appropriate escalation rather than to establishmaximum risk tolerance. Sub-limits also distribute riskamong various businesses in a manner that is consistentwith their level of activity and client demand, taking intoaccount the relative performance of each area.
Our market risk limits are monitored daily by Market RiskManagement, which is responsible for identifying andescalating, on a timely basis, instances where limits havebeen exceeded.
When a risk limit has been exceeded (e.g., due to positionalchanges or changes in market conditions, such as increasedvolatilities or changes in correlations), it is escalated tosenior managers in Market Risk Management and/or theappropriate risk committee. Such instances are remediatedby an inventory reduction and/or a temporary orpermanent increase to the risk limit.
Model Review and Validation
Our VaR and stress testing models are regularly reviewedby Market Risk Management and enhanced in order toincorporate changes in the composition of positionsincluded in our market risk measures, as well as variationsin market conditions. Prior to implementing significantchanges to our assumptions and/or models, Model RiskManagement performs model validations. Significantchanges to our VaR and stress testing models are reviewedwith our chief risk officer and chief financial officer, andapproved by the Firmwide Risk Committee.
See “Model Risk Management” for further informationabout the review and validation of these models.
Systems
We have made a significant investment in technology tomonitor market risk including:
‰ An independent calculation of VaR and stress measures;
‰ Risk measures calculated at individual position levels;
‰ Attribution of risk measures to individual risk factors ofeach position;
‰ The ability to report many different views of the riskmeasures (e.g., by desk, business, product type or legalentity); and
‰ The ability to produce ad hoc analyses in a timely manner.
Metrics
We analyze VaR at the firmwide level and a variety of moredetailed levels, including by risk category, business, andregion. The tables below present average daily VaR andperiod-end VaR, as well as the high and low VaR for theperiod. Diversification effect in the tables below representsthe difference between total VaR and the sum of the VaRsfor the four risk categories. This effect arises because thefour market risk categories are not perfectly correlated.
The table below presents average daily VaR by risk category.
Three Months EndedSix MonthsEnded June
$ in millionsJune2017
March2017
June2016 2017 2016
Interest rates $ 40 $ 44 $ 45 $ 42 $ 49Equity prices 23 26 27 25 26Currency rates 10 19 17 15 23Commodity prices 17 18 20 18 18Diversification effect (39) (43) (47) (42) (49)Total $ 51 $ 64 $ 62 $ 58 $ 67
In the table above:
‰ Our average daily VaR decreased to $51 million for thesecond quarter of 2017 from $64 million for the firstquarter of 2017, primarily due to lower levels of volatilityacross all risk categories and, to a lesser extent, due toreduced exposures principally driven by the currencyrates category. The decrease was partially offset by adecrease in the diversification benefit across riskcategories.
‰ Our average daily VaR decreased to $51 million for thesecond quarter of 2017 from $62 million for the secondquarter of 2016, primarily due to lower levels of volatilityacross all risk categories and, to a lesser extent, due toreduced exposures principally driven by the currencyrates category. The decrease was partially offset by adecrease in the diversification benefit across riskcategories.
‰ Our average daily VaR decreased to $58 million for thesix months ended June 2017 from $67 million for the sixmonths ended June 2016, primarily due to lower levels ofvolatility across all risk categories and, to a lesser extent,due to reduced exposures principally driven by thecurrency rates category. The decrease was partially offsetby a decrease in the diversification benefit across riskcategories.
137 Goldman Sachs June 2017 Form 10-Q

THE GOLDMAN SACHS GROUP, INC. AND SUBSIDIARIES
Management’s Discussion and Analysis
The table below presents period-end VaR by risk category.
As of
$ in millionsJune2017
March2017
June2016
Interest rates $ 39 $ 43 $ 39Equity prices 23 27 22Currency rates 11 11 27Commodity prices 11 22 22Diversification effect (33) (49) (50)Total $ 51 $ 54 $ 60
In the table above:
‰ Our daily VaR decreased to $51 million as of June 2017from $54 million as of March 2017, primarily due tolower levels of volatility, principally driven by the interestrates category and, to a lesser extent, due to reducedexposures driven by the commodity prices and equityprices categories. The decrease was partially offset by adecrease in the diversification benefit across riskcategories.
‰ Our daily VaR decreased to $51 million as of June 2017from $60 million as of June 2016, primarily due to lowerlevels of volatility across all risk categories and, to a lesserextent, due to reduced exposures principally driven by thecurrency rates and commodity prices categories, partiallyoffset by increased exposures in the interest rates andequity prices categories. The decrease was partially offsetby a decrease in the diversification benefit across riskcategories.
During the second quarter of 2017, the firmwide VaR risklimit was not exceeded, raised or reduced.
The table below presents high and low VaR by risk category.
Three Months EndedJune 2017
$ in millions High Low
Interest rates $ 52 $ 35
Equity prices $ 35 $ 17
Currency rates $ 16 $ 8
Commodity prices $ 27 $ 8
The high and low total VaR was $62 million and$44 million, respectively, for the three months endedJune 2017.
The chart below reflects our daily VaR over the last fourquarters.
120
100
80
60
40
20
0Third Quarter
2016Fourth Quarter
2016First Quarter
2017Second Quarter
2017
Dai
ly V
aR($
in m
illio
ns)
The chart below presents the frequency distribution of ourdaily net revenues for positions included in VaR for thequarter ended June 2017.
Nu
mb
er
of
Da
ys
0
5
25
15
30
35
<(100) (100)-(75) (75)-(50) (50)-(25) (25)-0 0-25 25-50 50-75 75-100 >100
Daily Net Revenues($ in millions)
0 0 0
5
1
9
15
52
26
20
10
Daily net revenues for positions included in VaR arecompared with VaR calculated as of the end of the priorbusiness day. Net losses incurred on a single day for suchpositions did not exceed our 95% one-day VaR during thesecond quarter of 2017 (i.e., a VaR exception).
During periods in which we have significantly more positivenet revenue days than net revenue loss days, we expect tohave fewer VaR exceptions because, under normalconditions, our business model generally produces positivenet revenues. In periods in which our franchise revenues areadversely affected, we generally have more loss days,resulting in more VaR exceptions. The daily net revenuesfor positions included in VaR used to determine VaRexceptions reflect the impact of any intraday activity,including bid/offer net revenues, which are more likely thannot to be positive by their nature.
Sensitivity Measures
Certain portfolios and individual positions are not includedin VaR because VaR is not the most appropriate riskmeasure. Other sensitivity measures we use to analyzemarket risk are described below.
Goldman Sachs June 2017 Form 10-Q 138

THE GOLDMAN SACHS GROUP, INC. AND SUBSIDIARIES
Management’s Discussion and Analysis
10% Sensitivity Measures. The table below presentsmarket risk for positions, accounted for at fair value, thatare not included in VaR by asset category. The market riskof these positions is determined by estimating the potentialreduction in net revenues of a 10% decline in the value ofthese positions.
As of
$ in millionsJune2017
March2017
June2016
Equity $2,199 $2,116 $2,031Debt 1,664 1,653 1,677Total $3,863 $3,769 $3,708
In the table above:
‰ Equity positions relate to private and restricted publicequity securities, including interests in funds that invest incorporate equities and real estate and interests in hedgefunds.
‰ Debt positions include interests in funds that invest incorporate mezzanine and senior debt instruments, loansbacked by commercial and residential real estate,corporate bank loans and other corporate debt, includingacquired portfolios of distressed loans.
‰ Equity and debt funded positions are reflected in ourcondensed consolidated statements of financial conditionin “Financial instruments owned.” See Note 6 to thecondensed consolidated financial statements for furtherinformation about cash instruments.
‰ These measures do not reflect diversification benefitsacross asset categories or across other market riskmeasures.
Credit Spread Sensitivity on Derivatives and Financial
Liabilities. VaR excludes the impact of changes incounterparty and our own credit spreads on derivatives aswell as changes in our own credit spreads (debt valuationadjustment) on financial liabilities for which the fair valueoption was elected. The estimated sensitivity to a one basispoint increase in credit spreads (counterparty and our own)on derivatives was a gain of $3 million and $2 million(including hedges) as of June 2017 and March 2017,respectively. In addition, the estimated sensitivity to a onebasis point increase in our own credit spreads on financialliabilities for which the fair value option was elected was again of $28 million as of both June 2017 and March 2017.However, the actual net impact of a change in our owncredit spreads is also affected by the liquidity, duration andconvexity (as the sensitivity is not linear to changes inyields) of those financial liabilities for which the fair valueoption was elected, as well as the relative performance ofany hedges undertaken.
Interest Rate Sensitivity. “Loans receivable” as ofJune 2017 and March 2017 were $53.95 billion and$50.39 billion, respectively, substantially all of which hadfloating interest rates. As of June 2017 and March 2017,the estimated sensitivity to a 100 basis point increase ininterest rates on such loans was $424 million and$397 million, respectively, of additional interest incomeover a twelve-month period, which does not take intoaccount the potential impact of an increase in costs to fundsuch loans. See Note 9 to the condensed consolidatedfinancial statements for further information about loansreceivable.
Other Market Risk Considerations
As of June 2017 and March 2017, we had commitmentsand held loans for which we have obtained credit lossprotection from Sumitomo Mitsui Financial Group, Inc. SeeNote 18 to the condensed consolidated financial statementsfor further information about such lending commitments.
In addition, we make investments accounted for under theequity method and we also make direct investments in realestate, both of which are included in “Other assets.” Directinvestments in real estate are accounted for at cost lessaccumulated depreciation. See Note 13 to the condensedconsolidated financial statements for further informationabout “Other assets.”
Financial Statement Linkages to Market Risk
Measures
We employ a variety of risk measures, each described in therespective sections above, to monitor market risk across thecondensed consolidated statements of financial conditionand condensed consolidated statements of earnings. Therelated gains and losses on these positions are included in“Market making,” “Other principal transactions,”“Interest income” and “Interest expense” in the condensedconsolidated statements of earnings, and “Debt valuationadjustment” in the condensed consolidated statements ofcomprehensive income.
The table below presents certain categories in ourcondensed consolidated statements of financial conditionand the market risk measures used to assess those assets andliabilities. Certain categories on the condensed consolidatedstatements of financial condition are incorporated in morethan one risk measure.
139 Goldman Sachs June 2017 Form 10-Q

THE GOLDMAN SACHS GROUP, INC. AND SUBSIDIARIES
Management’s Discussion and Analysis
Categories on the Condensed Consolidated
Statements of Financial Condition included
in Market Risk Measures Market Risk Measures
Collateralized agreements
Securities purchased under agreements toresell, at fair value VaR
Securities borrowed, at fair value VaR
Receivables
Certain secured loans, at fair value VaRLoans receivable Interest Rate Sensitivity
Financial instruments owned VaR10% Sensitivity MeasuresCredit Spread Sensitivity —Derivatives
Deposits, at fair value Credit Spread Sensitivity —Financial Liabilities
Collateralized financings
Securities sold under agreements torepurchase, at fair value VaR
Securities loaned, at fair value VaROther secured financings, at fair value VaR
Financial instruments sold, but not yet
purchased
VaRCredit Spread Sensitivity —Derivatives
Unsecured short-term borrowings and
unsecured long-term borrowings, at fair
value
VaR
Credit Spread Sensitivity —Financial Liabilities
Credit Risk Management
Overview
Credit risk represents the potential for loss due to thedefault or deterioration in credit quality of a counterparty(e.g., an OTC derivatives counterparty or a borrower) or anissuer of securities or other instruments we hold. Ourexposure to credit risk comes mostly from clienttransactions in OTC derivatives and loans and lendingcommitments. Credit risk also comes from cash placed withbanks, securities financing transactions (i.e., resale andrepurchase agreements and securities borrowing andlending activities) and receivables from brokers, dealers,clearing organizations, customers and counterparties.
Credit Risk Management, which is independent of therevenue-producing units and reports to our chief riskofficer, has primary responsibility for assessing, monitoringand managing credit risk. The Credit Policy Committee andthe Firmwide Risk Committee establish and review creditpolicies and parameters. In addition, we hold otherpositions that give rise to credit risk (e.g., bonds held in ourinventory and secondary bank loans). These credit risks arecaptured as a component of market risk measures, whichare monitored and managed by Market Risk Management,consistent with other inventory positions. We also enterinto derivatives to manage market risk exposures. Suchderivatives also give rise to credit risk, which is monitoredand managed by Credit Risk Management.
Credit Risk Management Process
Effective management of credit risk requires accurate andtimely information, a high level of communication andknowledge of customers, countries, industries andproducts. Our process for managing credit risk includes:
‰ Approving transactions and setting and communicatingcredit exposure limits;
‰ Establishing or approving underwriting standards;
‰ Monitoring compliance with established credit exposurelimits;
‰ Assessing the likelihood that a counterparty will defaulton its payment obligations;
‰ Measuring our current and potential credit exposure andlosses resulting from counterparty default;
‰ Reporting of credit exposures to senior management, theBoard and regulators;
‰ Using credit risk mitigants, including collateral andhedging; and
‰ Communicating and collaborating with otherindependent control and support functions such asoperations, legal and compliance.
Goldman Sachs June 2017 Form 10-Q 140
THE GOLDMAN SACHS GROUP, INC. AND SUBSIDIARIES
Management’s Discussion and Analysis
As part of the risk assessment process, Credit RiskManagement performs credit reviews, which include initialand ongoing analyses of our counterparties. Forsubstantially all of our credit exposures, the core of ourprocess is an annual counterparty credit review. A creditreview is an independent analysis of the capacity andwillingness of a counterparty to meet its financialobligations, resulting in an internal credit rating. Thedetermination of internal credit ratings also incorporatesassumptions with respect to the nature of and outlook forthe counterparty’s industry, and the economicenvironment. Senior personnel within Credit RiskManagement, with expertise in specific industries, inspectand approve credit reviews and internal credit ratings.
Our risk assessment process may also include, whereapplicable, reviewing certain key metrics, such asdelinquency status, collateral values, credit scores and otherrisk factors.
Our global credit risk management systems capture creditexposure to individual counterparties and on an aggregatebasis to counterparties and their subsidiaries (economicgroups). These systems also provide management withcomprehensive information on our aggregate credit risk byproduct, internal credit rating, industry, country andregion.
Risk Measures and Limits
We measure our credit risk based on the potential loss in theevent of non-payment by a counterparty using current andpotential exposure. For derivatives and securities financingtransactions, current exposure represents the amountpresently owed to us after taking into account applicablenetting and collateral arrangements while potentialexposure represents our estimate of the future exposurethat could arise over the life of a transaction based onmarket movements within a specified confidence level.Potential exposure also takes into account netting andcollateral arrangements. For loans and lendingcommitments, the primary measure is a function of thenotional amount of the position.
We use credit limits at various levels (e.g., counterparty,economic group, industry and country) as well asunderwriting standards to control the size and nature of ourcredit exposures. Limits for counterparties and economicgroups are reviewed regularly and revised to reflectchanging risk appetites for a given counterparty or group ofcounterparties. Limits for industries and countries arebased on our risk tolerance and are designed to allow forregular monitoring, review, escalation and management ofcredit risk concentrations.
The Risk Committee of the Board and the Risk GovernanceCommittee (through delegated authority from theFirmwide Risk Committee) approve credit risk limits atfirmwide, business and product levels. Credit RiskManagement (through delegated authority from the RiskGovernance Committee) sets credit limits for individualcounterparties, economic groups, industries and countries.Policies authorized by the Firmwide Risk Committee, theRisk Governance Committee and the Credit PolicyCommittee prescribe the level of formal approval requiredfor us to assume credit exposure to a counterparty across allproduct areas, taking into account any applicable nettingprovisions, collateral or other credit risk mitigants.
Stress Tests
We use regular stress tests to calculate the credit exposures,including potential concentrations that would result fromapplying shocks to counterparty credit ratings or credit riskfactors (e.g., currency rates, interest rates, equity prices).These shocks include a wide range of moderate and moreextreme market movements. Some of our stress testsinclude shocks to multiple risk factors, consistent with theoccurrence of a severe market or economic event. In thecase of sovereign default, we estimate the direct impact ofthe default on our sovereign credit exposures, changes toour credit exposures arising from potential market moves inresponse to the default, and the impact of credit marketdeterioration on corporate borrowers and counterpartiesthat may result from the sovereign default. Unlike potentialexposure, which is calculated within a specified confidencelevel, with a stress test there is generally no assumedprobability of these events occurring.
We perform stress tests on a regular basis as part of ourroutine risk management processes and conduct tailoredstress tests on an ad hoc basis in response to marketdevelopments. Stress tests are conducted jointly with ourmarket and liquidity risk functions.
Model Review and Validation
Our potential credit exposure and stress testing models, andany changes to such models or assumptions, are reviewedby Model Risk Management. See “Model RiskManagement” for further information about the reviewand validation of these models.
141 Goldman Sachs June 2017 Form 10-Q

THE GOLDMAN SACHS GROUP, INC. AND SUBSIDIARIES
Management’s Discussion and Analysis
Risk Mitigants
To reduce our credit exposures on derivatives and securitiesfinancing transactions, we may enter into nettingagreements with counterparties that permit us to offsetreceivables and payables with such counterparties. We mayalso reduce credit risk with counterparties by entering intoagreements that enable us to obtain collateral from them onan upfront or contingent basis and/or to terminatetransactions if the counterparty’s credit rating falls below aspecified level. We monitor the fair value of the collateralon a daily basis to ensure that our credit exposures areappropriately collateralized. We seek to minimizeexposures where there is a significant positive correlationbetween the creditworthiness of our counterparties and themarket value of collateral we receive.
For loans and lending commitments, depending on thecredit quality of the borrower and other characteristics ofthe transaction, we employ a variety of potential riskmitigants. Risk mitigants include collateral provisions,guarantees, covenants, structural seniority of the bank loanclaims and, for certain lending commitments, provisions inthe legal documentation that allow us to adjust loanamounts, pricing, structure and other terms as marketconditions change. The type and structure of risk mitigantsemployed can significantly influence the degree of creditrisk involved in a loan or lending commitment.
When we do not have sufficient visibility into acounterparty’s financial strength or when we believe acounterparty requires support from its parent, we mayobtain third-party guarantees of the counterparty’sobligations. We may also mitigate our credit risk usingcredit derivatives or participation agreements.
Credit Exposures
As of June 2017, our aggregate credit exposure wasessentially unchanged as compared with December 2016.The percentage of our credit exposures arising fromnon-investment-grade counterparties (based on ourinternally determined public rating agency equivalents)increased as compared with December 2016, reflecting anincrease in non-investment-grade loans and lendingcommitments. During the six months ended June 2017, thenumber of counterparty defaults decreased as comparedwith the same prior year period, and such defaults occurredwithin loans and lending commitments. The total numberof counterparty defaults remained low, representing lessthan 0.5% of all counterparties. Estimated losses associatedwith counterparty defaults were lower compared with thesame prior year period and were not material. Our creditexposures are described further below.
Cash and Cash Equivalents. Our credit exposure on cashand cash equivalents arises from our unrestricted cash, andincludes both interest-bearing and non-interest-bearingdeposits. To mitigate the risk of credit loss, we placesubstantially all of our deposits with highly-rated banksand central banks. Unrestricted cash was $92.25 billion and$107.06 billion as of June 2017 and December 2016,respectively, and excludes cash segregated for regulatoryand other purposes of $18.64 billion and $14.65 billion asof June 2017 and December 2016, respectively.
OTC Derivatives. Our credit exposure on OTC derivativesarises primarily from our market-making activities. As amarket maker, we enter into derivative transactions toprovide liquidity to clients and to facilitate the transfer andhedging of their risks. We also enter into derivatives tomanage market risk exposures. We manage our creditexposure on OTC derivatives using the credit risk process,measures, limits and risk mitigants described above.
Derivatives are reported on a net-by-counterparty basis (i.e.,the net payable or receivable for derivative assets and liabilitiesfor a given counterparty) when a legal right of setoff existsunder an enforceable netting agreement. Derivatives areaccounted for at fair value, net of cash collateral received orposted under enforceable credit support agreements. Wegenerally enter into OTC derivatives transactions underbilateral collateral arrangements that require the dailyexchange of collateral. As credit risk is an essential componentof fair value, we include a credit valuation adjustment (CVA)in the fair value of derivatives to reflect counterparty creditrisk, as described in Note 7 to the condensed consolidatedfinancial statements. CVA is a function of the present value ofexpected exposure, the probability of counterparty default andthe assumed recovery upon default.
The table below presents the distribution of our exposure toOTC derivatives by tenor, both before and after the effectof collateral and netting agreements.
$ in millionsInvestment-
GradeNon-Investment-Grade / Unrated Total
As of June 2017
Less than 1 year $ 18,322 $ 4,642 $ 22,964
1 - 5 years 28,627 3,985 32,612
Greater than 5 years 82,702 4,541 87,243
Total 129,651 13,168 142,819
Netting (90,414) (5,944) (96,358)
OTC derivative assets $ 39,237 $ 7,224 $ 46,461
Net credit exposure $ 24,456 $ 6,329 $ 30,785
As of December 2016Less than 1 year $ 24,840 $ 3,983 $ 28,8231 - 5 years 30,801 3,676 34,477Greater than 5 years 85,951 4,599 90,550Total 141,592 12,258 153,850Netting (96,493) (6,232) (102,725)OTC derivative assets $ 45,099 $ 6,026 $ 51,125
Net credit exposure $ 28,879 $ 4,922 $ 33,801
Goldman Sachs June 2017 Form 10-Q 142

THE GOLDMAN SACHS GROUP, INC. AND SUBSIDIARIES
Management’s Discussion and Analysis
In the table above:
‰ Tenor is based on expected duration for mortgage-relatedcredit derivatives and generally on remaining contractualmaturity for other derivatives.
‰ Receivable and payable balances with the samecounterparty in the same tenor category are netted withinsuch tenor category.
‰ Receivable and payable balances for the same counterpartyacross tenor categories are netted under enforceable nettingagreements, and cash collateral received is netted underenforceable credit support agreements.
‰ Net credit exposure represents OTC derivative assets,included in “Financial instruments owned,” less cashcollateral and the fair value of securities collateral,primarily U.S. government and agency obligations andnon-U.S. government and agency obligations, receivedunder credit support agreements, which managementconsiders when determining credit risk, but suchcollateral is not eligible for netting under U.S. GAAP.
The tables below present the distribution of our exposure toOTC derivatives by tenor and our internally determinedpublic rating agency equivalents.
Investment-Grade
$ in millions AAA AA A BBB Total
As of June 2017
Less than 1 year $ 156 $ 4,491 $ 8,630 $ 5,045 $ 18,322
1 - 5 years 1,084 8,460 12,927 6,156 28,627
Greater than 5 years 3,263 39,283 21,910 18,246 82,702
Total 4,503 52,234 43,467 29,447 129,651
Netting (2,086) (37,539) (32,111) (18,678) (90,414)
OTC derivative assets $ 2,417 $ 14,695 $ 11,356 $ 10,769 $ 39,237
Net credit exposure $ 2,206 $ 9,377 $ 6,204 $ 6,669 $ 24,456
As of December 2016Less than 1 year $ 332 $ 4,907 $ 12,595 $ 7,006 $ 24,8401 - 5 years 862 6,898 12,814 10,227 30,801Greater than 5 years 3,182 42,400 19,682 20,687 85,951Total 4,376 54,205 45,091 37,920 141,592Netting (1,860) (40,095) (31,644) (22,894) (96,493)OTC derivative assets $ 2,516 $ 14,110 $ 13,447 $ 15,026 $ 45,099
Net credit exposure $ 2,283 $ 8,366 $ 8,401 $ 9,829 $ 28,879
Non-Investment-Grade / Unrated
$ in millions BB or lower Unrated Total
As of June 2017
Less than 1 year $ 4,180 $ 462 $ 4,642
1 - 5 years 3,979 6 3,985
Greater than 5 years 4,504 37 4,541
Total 12,663 505 13,168
Netting (5,886) (58) (5,944)
OTC derivative assets $ 6,777 $ 447 $ 7,224
Net credit exposure $ 5,982 $ 347 $ 6,329
As of December 2016Less than 1 year $ 3,661 $ 322 $ 3,9831 - 5 years 3,653 23 3,676Greater than 5 years 4,437 162 4,599Total 11,751 507 12,258Netting (6,207) (25) (6,232)OTC derivative assets $ 5,544 $ 482 $ 6,026
Net credit exposure $ 4,569 $ 353 $ 4,922
Lending and Financing Activities. We manage ourlending and financing activities using the credit risk process,measures, limits and risk mitigants described above. Otherlending positions, including secondary trading positions,are risk-managed as a component of market risk.
‰ Lending Activities. Our lending activities includelending to investment-grade and non-investment-gradecorporate borrowers. Loans and lending commitmentsassociated with these activities are principally used foroperating liquidity and general corporate purposes or inconnection with contingent acquisitions. Corporate loansmay be secured or unsecured, depending on the loanpurpose, the risk profile of the borrower and otherfactors. Our lending activities also include extendingloans to borrowers that are secured by commercial andother real estate. See the tables below for furtherinformation about our credit exposures associated withthese lending activities.
‰ Securities Financing Transactions. We enter intosecurities financing transactions in order to, among otherthings, facilitate client activities, invest excess cash,acquire securities to cover short positions and financecertain activities. We bear credit risk related to resaleagreements and securities borrowed only to the extentthat cash advanced or the value of securities pledged ordelivered to the counterparty exceeds the value of thecollateral received. We also have credit exposure onrepurchase agreements and securities loaned to the extentthat the value of securities pledged or delivered to thecounterparty for these transactions exceeds the amount ofcash or collateral received. Securities collateral obtainedfor securities financing transactions primarily includesU.S. government and agency obligations and non-U.S.government and agency obligations. As of both June2017 and December 2016, we had approximately $29billion of credit exposure related to securities financingtransactions reflecting both netting agreements andcollateral that management considers when determiningcredit risk. As of both June 2017 and December 2016,substantially all of our credit exposure related tosecurities financing transactions was with investment-grade financial institutions, funds and governments,primarily located in the Americas and EMEA.
143 Goldman Sachs June 2017 Form 10-Q

THE GOLDMAN SACHS GROUP, INC. AND SUBSIDIARIES
Management’s Discussion and Analysis
‰ Other Credit Exposures. We are exposed to credit riskfrom our receivables from brokers, dealers and clearingorganizations and customers and counterparties.Receivables from brokers, dealers and clearingorganizations are primarily comprised of initial marginplaced with clearing organizations and receivables relatedto sales of securities which have traded, but not yetsettled. These receivables generally have minimal creditrisk due to the low probability of clearing organizationdefault and the short-term nature of receivables related tosecurities settlements. Receivables from customers andcounterparties are generally comprised of collateralizedreceivables related to customer securities transactions andgenerally have minimal credit risk due to both the value ofthe collateral received and the short-term nature of thesereceivables. Our net credit exposure related to theseactivities was approximately $33 billion and $31 billionas of June 2017 and December 2016, respectively, andwas primarily comprised of initial margin (both cash andsecurities) placed with investment-grade clearingorganizations. The regional breakdown of our net creditexposure related to these activities was approximately39% and 44% in the Americas, approximately 49% and42% in EMEA, and approximately 12% and 14% in Asiaas of June 2017 and December 2016, respectively.
In addition, we extend other loans and lendingcommitments to our private wealth management clientsthat are primarily secured by residential real estate,securities or other assets, as well as purchase performingand distressed loans backed by residential real estate andconsumer loans. The fair value of the collateral receivedagainst such loans and lending commitments generallyexceeds their carrying value. We also extend unsecuredloans to individuals through our online platform. Thegross exposure related to the loans and lendingcommitments described above was approximately$30 billion and $28 billion as of June 2017 andDecember 2016, respectively. The regional breakdown ofour net credit exposure related to these activities wasapproximately 87% and 90% in the Americas,approximately 11% and 8% in EMEA, andapproximately 2% and 2% in Asia as of June 2017 andDecember 2016, respectively.
Credit Exposure by Industry, Region and Credit
Quality
The tables below present our credit exposure related tocash, OTC derivatives, and loans and lending commitments(excluding credit exposures described above in “SecuritiesFinancing Transactions” and “Other Credit Exposures”)broken down by industry, region and credit quality.
Cash as of
$ in millionsJune2017
December2016
Credit Exposure by Industry
Funds $ — $ 138Financial Institutions 15,039 11,836Sovereign 77,213 95,092Total $92,252 $107,066Credit Exposure by Region
Americas $49,429 $ 80,381EMEA 31,397 16,099Asia 11,426 10,586Total $92,252 $107,066Credit Exposure by Credit Quality (Credit Rating Equivalent)
AAA $59,896 $ 83,899AA 15,936 8,784A 14,782 13,344BBB 1,508 971BB or lower 130 68Total $92,252 $107,066
OTC Derivatives as of
$ in millionsJune2017
December2016
Credit Exposure by Industry
Funds $12,436 $ 13,294Financial Institutions 12,428 14,116Consumer, Retail & Healthcare 1,072 773Sovereign 7,602 7,019Municipalities & Nonprofit 3,069 2,959Natural Resources & Utilities 2,899 3,707Real Estate 197 85Technology, Media & Telecommunications 1,598 4,188Diversified Industrials 2,723 2,529Other (including Special Purpose Vehicles) 2,437 2,455Total $46,461 $ 51,125Credit Exposure by Region
Americas $15,585 $ 19,629EMEA 26,585 26,536Asia 4,291 4,960Total $46,461 $ 51,125Credit Exposure by Credit Quality (Credit Rating Equivalent)
AAA $ 2,417 $ 2,516AA 14,695 14,110A 11,356 13,447BBB 10,769 15,026BB or lower 6,777 5,544Unrated 447 482Total $46,461 $ 51,125
Goldman Sachs June 2017 Form 10-Q 144

THE GOLDMAN SACHS GROUP, INC. AND SUBSIDIARIES
Management’s Discussion and Analysis
Loans and LendingCommitments as of
$ in millionsJune2017
December2016
Credit Exposure by Industry
Funds $ 4,673 $ 3,854Financial Institutions 12,228 13,630Consumer, Retail & Healthcare 42,876 30,007Sovereign 507 902Municipalities & Nonprofit 663 709Natural Resources & Utilities 24,657 25,694Real Estate 15,179 13,034Technology, Media & Telecommunications 30,777 33,232Diversified Industrials 23,162 20,847Other (including Special Purpose Vehicles) 15,604 12,301Total $170,326 $154,210Credit Exposure by Region
Americas $128,801 $115,145EMEA 36,378 35,044Asia 5,147 4,021Total $170,326 $154,210Credit Exposure by Credit Quality (Credit Rating Equivalent)
AAA $ 2,980 $ 3,135AA 8,947 8,375A 28,835 29,227BBB 50,505 43,151BB or lower 78,842 69,745Unrated 217 577Total $170,326 $154,210
Selected Exposures
Credit exposure represents the potential for loss due to thedefault or deterioration in credit quality of a counterpartyor borrower. Market exposure represents the potential forloss in value of our long and short inventory due to changesin market prices. The section below provides informationabout our credit and market exposure to certain countriesthat have had heightened focus due to recent events andbroad market concerns.
Current levels of oil prices continue to raise concerns aboutVenezuela and its sovereign debt. The political situation inIraq has led to ongoing concerns about its economicstability. The debt crisis in Mozambique has resulted in thesuspension of its funding by the International MonetaryFund and the World Bank, as well as credit ratingdowngrades.
Our total credit and market exposure to each of Iraq,Venezuela, and Mozambique as of June 2017 was notmaterial.
We have a comprehensive framework to monitor, measureand assess our country exposures and to determine our riskappetite. We determine the country of risk by the locationof the counterparty, issuer or underlier’s assets, where theygenerate revenue, the country in which they areheadquartered, the jurisdiction where a claim against themcould be enforced, and/or the government whose policiesaffect their ability to repay their obligations. We monitorour credit exposure to a specific country both at theindividual counterparty level as well as at the aggregatecountry level.
We use regular stress tests, described above, to calculate thecredit exposures, including potential concentrations thatwould result from applying shocks to counterparty creditratings or credit risk factors. To supplement these regularstress tests, we also conduct tailored stress tests on an adhoc basis in response to specific market events that we deemsignificant. These stress tests are designed to estimate thedirect impact of the event on our credit and marketexposures resulting from shocks to risk factors including,but not limited to, currency rates, interest rates, and equityprices. We also utilize these stress tests to estimate theindirect impact of certain hypothetical events on ourcountry exposures, such as the impact of credit marketdeterioration on corporate borrowers and counterpartiesalong with the shocks to the risk factors described above.The parameters of these shocks vary based on the scenarioreflected in each stress test. We review estimated lossesproduced by the stress tests in order to understand theirmagnitude, highlight potential loss concentrations, andassess and mitigate our exposures where necessary.
See “Stress Tests” above, “Liquidity Risk Management —Liquidity Stress Tests” and “Market Risk Management —Market Risk Management Process — Stress Testing” forfurther information about stress tests.
145 Goldman Sachs June 2017 Form 10-Q

THE GOLDMAN SACHS GROUP, INC. AND SUBSIDIARIES
Management’s Discussion and Analysis
Operational Risk Management
Overview
Operational risk is the risk of loss resulting frominadequate or failed internal processes, people and systemsor from external events. Our exposure to operational riskarises from routine processing errors as well asextraordinary incidents, such as major systems failures orlegal and regulatory matters.
Potential types of loss events related to internal and externaloperational risk include:
‰ Clients, products and business practices;
‰ Execution, delivery and process management;
‰ Business disruption and system failures;
‰ Employment practices and workplace safety;
‰ Damage to physical assets;
‰ Internal fraud; and
‰ External fraud.
We maintain a comprehensive control framework designedto provide a well-controlled environment to minimizeoperational risks. The Firmwide Operational RiskCommittee provides oversight of the ongoing developmentand implementation of our operational risk policies andframework. Operational Risk Management is a riskmanagement function independent of our revenue-producing units, reports to our chief risk officer, and isresponsible for developing and implementing policies,methodologies and a formalized framework for operationalrisk management with the goal of maintaining our exposureto operational risk at levels that are within our risk appetite.
Operational Risk Management Process
Managing operational risk requires timely and accurateinformation as well as a strong control culture. We seek tomanage our operational risk through:
‰ Training, supervision and development of our people;
‰ Active participation of senior management in identifyingand mitigating our key operational risks;
‰ Independent control and support functions that monitoroperational risk on a daily basis, and implementation ofextensive policies and procedures, and controls designedto prevent the occurrence of operational risk events;
‰ Proactive communication between our revenue producingunits and our independent control and support functions;and
‰ A network of systems to facilitate the collection of dataused to analyze and assess our operational risk exposure.
We combine top-down and bottom-up approaches tomanage and measure operational risk. From a top-downperspective, our senior management assesses firmwide andbusiness-level operational risk profiles. From a bottom-upperspective, revenue-producing units and independentcontrol and support functions are responsible for riskidentification and risk management on a day-to-day basis,including escalating operational risks to seniormanagement.
Our operational risk management framework is in partdesigned to comply with the operational risk measurementrules under the Revised Capital Framework and hasevolved based on the changing needs of our businesses andregulatory guidance.
Our operational risk management framework comprisesthe following practices:
‰ Risk identification and assessment;
‰ Risk measurement; and
‰ Risk monitoring and reporting.
Internal Audit performs an independent review of ouroperational risk management framework, including our keycontrols, processes and applications, on an annual basis toassess the effectiveness of our framework.
Risk Identification and Assessment
The core of our operational risk management framework isrisk identification and assessment. We have acomprehensive data collection process, including firmwidepolicies and procedures, for operational risk events.
We have established policies that require our revenue-producing units and our independent control and supportfunctions to report and escalate operational risk events.When operational risk events are identified, our policiesrequire that the events be documented and analyzed todetermine whether changes are required in our systems and/or processes to further mitigate the risk of future events.
Goldman Sachs June 2017 Form 10-Q 146

THE GOLDMAN SACHS GROUP, INC. AND SUBSIDIARIES
Management’s Discussion and Analysis
In addition, our systems capture internal operational riskevent data, key metrics such as transaction volumes, andstatistical information such as performance trends. We usean internally developed operational risk managementapplication to aggregate and organize this information.One of our key risk identification and assessment tools is anoperational risk and control self-assessment process, whichis performed by managers from both revenue-producingunits and independent control and support functions. Thisprocess consists of the identification and rating ofoperational risks, on a forward-looking basis, and therelated controls. The results from this process are analyzedto evaluate operational risk exposures and identifybusinesses, activities or products with heightened levels ofoperational risk.
Risk Measurement
We measure our operational risk exposure over a twelve-month time horizon using both statistical modeling andscenario analyses, which involve qualitative assessments ofthe potential frequency and extent of potential operationalrisk losses, for each of our businesses. Operational riskmeasurement incorporates qualitative and quantitativeassessments of factors including:
‰ Internal and external operational risk event data;
‰ Assessments of our internal controls;
‰ Evaluations of the complexity of our business activities;
‰ The degree of and potential for automation in ourprocesses;
‰ New activity information;
‰ The legal and regulatory environment;
‰ Changes in the markets for our products and services,including the diversity and sophistication of ourcustomers and counterparties; and
‰ Liquidity of the capital markets and the reliability of theinfrastructure that supports the capital markets.
The results from these scenario analyses are used tomonitor changes in operational risk and to determinebusiness lines that may have heightened exposure tooperational risk. These analyses ultimately are used in thedetermination of the appropriate level of operational riskcapital to hold.
Risk Monitoring and Reporting
We evaluate changes in our operational risk profile and ourbusinesses, including changes in business mix orjurisdictions in which we operate, by monitoring the factorsnoted above at a firmwide level. We have both preventiveand detective internal controls, which are designed toreduce the frequency and severity of operational risk lossesand the probability of operational risk events. We monitorthe results of assessments and independent internal auditsof these internal controls.
We also provide periodic operational risk reports to seniormanagement, risk committees and the Board. In addition,we have established thresholds to monitor the impact of anoperational risk event, including single loss events andcumulative losses over a twelve-month period, as well asescalation protocols. We also provide periodic operationalrisk reports, which include incidents that breach escalationthresholds, to senior management, firmwide and divisionalrisk committees and the Risk Committee of the Board.
Model Review and Validation
The statistical models utilized by Operational RiskManagement are subject to independent review andvalidation by Model Risk Management. See “Model RiskManagement” for further information about the reviewand validation of these models.
Model Risk Management
Overview
Model risk is the potential for adverse consequences fromdecisions made based on model outputs that may beincorrect or used inappropriately. We rely on quantitativemodels across our business activities primarily to valuecertain financial assets and liabilities, to monitor andmanage our risk, and to measure and monitor ourregulatory capital.
Our model risk management framework is managedthrough a governance structure and risk managementcontrols, which encompass standards designed to ensure wemaintain a comprehensive model inventory, including riskassessment and classification, sound model developmentpractices, independent review and model-specific usagecontrols. The Firmwide Enterprise Risk Committee and theFirmwide Model Risk Control Committee oversee ourmodel risk management framework. Model RiskManagement, which is independent of model developers,model owners and model users, reports to our chief riskofficer, is responsible for identifying and reportingsignificant risks associated with models, and providesperiodic updates to senior management, risk committeesand the Risk Committee of the Board.
147 Goldman Sachs June 2017 Form 10-Q

THE GOLDMAN SACHS GROUP, INC. AND SUBSIDIARIES
Management’s Discussion and Analysis
Model Review and Validation
Model Risk Management consists of quantitativeprofessionals who perform an independent review,validation and approval of our models. This reviewincludes an analysis of the model documentation,independent testing, an assessment of the appropriatenessof the methodology used, and verification of compliancewith model development and implementation standards.Model Risk Management reviews all existing models on anannual basis, as well as new models or significant changesto models.
The model validation process incorporates a review ofmodels and trade and risk parameters across a broad rangeof scenarios (including extreme conditions) in order tocritically evaluate and verify:
‰ The model’s conceptual soundness, including thereasonableness of model assumptions, and suitability forintended use;
‰ The testing strategy utilized by the model developers toensure that the models function as intended;
‰ The suitability of the calculation techniques incorporatedin the model;
‰ The model’s accuracy in reflecting the characteristics ofthe related product and its significant risks;
‰ The model’s consistency with models for similarproducts; and
‰ The model’s sensitivity to input parameters andassumptions.
See “Critical Accounting Policies — Fair Value — Reviewof Valuation Models,” “Liquidity Risk Management,”“Market Risk Management,” “Credit Risk Management”and “Operational Risk Management” for furtherinformation about our use of models within these areas.
Available Information
Our internet address is www.gs.com and the investorrelations section of our website is located at www.gs.com/shareholders. We make available free of charge through theinvestor relations section of our website, annual reports onForm 10-K, quarterly reports on Form 10-Q and currentreports on Form 8-K and amendments to those reports filedor furnished pursuant to Section 13(a) or 15(d) of the U.S.Securities Exchange Act of 1934 (Exchange Act), as well asproxy statements, as soon as reasonably practicable afterwe electronically file such material with, or furnish it to, theSEC. Also posted on our website, and available in printupon request of any shareholder to our Investor RelationsDepartment, are our certificate of incorporation andby-laws, charters for our Audit Committee, RiskCommittee, Compensation Committee, CorporateGovernance and Nominating Committee, and PublicResponsibilities Committee, our Policy Regarding DirectorIndependence Determinations, our Policy on Reporting ofConcerns Regarding Accounting and Other Matters, ourCorporate Governance Guidelines and our Code ofBusiness Conduct and Ethics governing our directors,officers and employees. Within the time period required bythe SEC, we will post on our website any amendment to theCode of Business Conduct and Ethics and any waiverapplicable to any executive officer, director or seniorfinancial officer.
In addition, our website includes information concerning:
‰ Purchases and sales of our equity securities by ourexecutive officers and directors;
‰ Disclosure relating to certain non-GAAP financialmeasures (as defined in the SEC’s Regulation G) that wemay make public orally, telephonically, by webcast, bybroadcast or by other means from time to time;
‰ DFAST results;
‰ The public portion of our resolution plan submission; and
‰ Our risk management practices and regulatory capitalratios, as required under the disclosure-related provisionsof the Revised Capital Framework, which are based onthe third pillar of Basel III.
Our Investor Relations Department can be contacted atThe Goldman Sachs Group, Inc., 200 West Street,29th Floor, New York, New York 10282, Attn:Investor Relations, telephone: 212-902-0300, e-mail:[email protected].
Goldman Sachs June 2017 Form 10-Q 148

THE GOLDMAN SACHS GROUP, INC. AND SUBSIDIARIES
Management’s Discussion and Analysis
Cautionary Statement Pursuant to the U.S.Private Securities Litigation Reform Act of1995
We have included or incorporated by reference in thisForm 10-Q, and from time to time our management maymake, statements that may constitute “forward-lookingstatements” within the meaning of the safe harborprovisions of the U.S. Private Securities Litigation ReformAct of 1995. Forward-looking statements are not historicalfacts, but instead represent only our beliefs regarding futureevents, many of which, by their nature, are inherentlyuncertain and outside our control. These statements includestatements other than historical information or statementsof current conditions and may relate to our future plans andobjectives and results, among other things, and may alsoinclude statements about the effect of changes to the capital,leverage, liquidity, long-term debt and total loss-absorbingcapacity rules applicable to banks and bank holdingcompanies, the impact of the Dodd-Frank Act on ourbusinesses and operations, and various legal proceedings,governmental investigations or mortgage-relatedcontingencies as set forth in Notes 27 and 18, respectively,to the condensed consolidated financial statements, as wellas statements about the results of our Dodd-Frank Act andfirm stress tests, statements about the objectives andeffectiveness of our business continuity plan, informationsecurity program, risk management and liquidity policies,statements about our resolution plan and resolutionstrategy and their implications for our debtholders andother stakeholders, statements about the design andeffectiveness of our resolution capital and liquidity modelsand our triggers and alerts frameworks, statements abouttrends in or growth opportunities for our businesses,statements about our future status, activities or reportingunder U.S. or non-U.S. banking and financial regulationand statements about our investment banking transactionbacklog. By identifying these statements for you in thismanner, we are alerting you to the possibility that ouractual results and financial condition may differ, possiblymaterially, from the anticipated results and financialcondition indicated in these forward-looking statements.Important factors that could cause our actual results andfinancial condition to differ from those indicated in theforward-looking statements include, among others, thosedescribed below and in “Risk Factors” in Part I, Item 1A ofthe 2016 Form 10-K.
Statements about our investment banking transactionbacklog are subject to the risk that the terms of thesetransactions may be modified or that they may not becompleted at all; therefore, the net revenues, if any, that weactually earn from these transactions may differ, possiblymaterially, from those currently expected. Importantfactors that could result in a modification of the terms of atransaction or a transaction not being completed include, inthe case of underwriting transactions, a decline orcontinued weakness in general economic conditions,outbreak of hostilities, volatility in the securities marketsgenerally or an adverse development with respect to theissuer of the securities and, in the case of financial advisorytransactions, a decline in the securities markets, an inabilityto obtain adequate financing, an adverse development withrespect to a party to the transaction or a failure to obtain arequired regulatory approval. For information about otherimportant factors that could adversely affect ourinvestment banking transactions, see “Risk Factors” inPart I, Item 1A of the 2016 Form 10-K.
We have provided in this filing information regarding ourcapital, liquidity and leverage ratios, including the CET1ratios under the Advanced and Standardized approaches ona fully phased-in basis, as well as our NSFR, and thesupplementary leverage ratios for us and GS Bank USA.The statements with respect to these ratios are forward-looking statements, based on our current interpretation,expectations and understandings of the relevant regulatoryrules, guidance and proposals, and reflect significantassumptions concerning the treatment of various assets andliabilities and the manner in which the ratios are calculated.As a result, the methods used to calculate these ratios maydiffer, possibly materially, from those used in calculatingour and, where applicable, GS Bank USA’s capital, liquidityand leverage ratios for any future disclosures. The ultimatemethods of calculating the ratios will depend on, amongother things, implementation guidance or furtherrulemaking from the U.S. federal bank regulatory agenciesand the development of market practices and standards.
149 Goldman Sachs June 2017 Form 10-Q

Item 3. Quantitative and QualitativeDisclosures About Market Risk
Quantitative and qualitative disclosures about market riskare set forth in “Management’s Discussion and Analysis ofFinancial Condition and Results of Operations — RiskManagement — Market Risk Management” in Part I,Item 2 of this Form 10-Q.
Item 4. Controls and Procedures
As of the end of the period covered by this report, anevaluation was carried out by our management, with theparticipation of our Chief Executive Officer and ChiefFinancial Officer, of the effectiveness of our disclosurecontrols and procedures (as defined in Rule 13a-15(e)under the Securities Exchange Act of 1934 (Exchange Act)).Based upon that evaluation, our Chief Executive Officerand Chief Financial Officer concluded that these disclosurecontrols and procedures were effective as of the end of theperiod covered by this report. In addition, no change in ourinternal control over financial reporting (as defined inRule 13a-15(f) under the Exchange Act) occurred duringthe quarter ended June 30, 2017 that has materiallyaffected, or is reasonably likely to materially affect, ourinternal control over financial reporting.
PART II. OTHER INFORMATION
Item 1. Legal Proceedings
We are involved in a number of judicial, regulatory andarbitration proceedings concerning matters arising inconnection with the conduct of our businesses. Many ofthese proceedings are in early stages, and many of thesecases seek an indeterminate amount of damages. However,we believe, based on currently available information, thatthe results of such proceedings, in the aggregate, will nothave a material adverse effect on our financial condition,but may be material to our operating results for anyparticular period, depending, in part, upon the operatingresults for such period. Given the range of litigation andinvestigations presently under way, our litigation expensescan be expected to remain high. See “Management’sDiscussion and Analysis of Financial Condition and Resultsof Operations — Use of Estimates” in Part I, Item 2 of thisForm 10-Q. See Notes 18 and 27 to the condensedconsolidated financial statements in Part I, Item 1 of thisForm 10-Q for information about certain judicial,regulatory and legal proceedings.
Item 2. Unregistered Sales of EquitySecurities and Use of Proceeds
The table below presents purchases made by or on behalf ofThe Goldman Sachs Group, Inc. (Group Inc.) or any“affiliated purchaser” (as defined in Rule 10b-18(a)(3)under the Securities Exchange Act of 1934) of our commonstock during the three months ended June 30, 2017.
TotalShares
Purchased
AveragePrice
Paid PerShare
TotalShares
Purchasedas Part ofa Publicly
AnnouncedProgram
MaximumShares
That MayYet Be
PurchasedUnder the
Program
April 2017 1,786,032 $224.07 1,786,032 68,659,263
May 2017 2,676,701 1 $221.77 2,676,672 65,982,591
June 2017 2,143,204 $220.32 2,143,204 63,839,387
Total 6,605,937 6,605,908
1. Includes 29 shares remitted to satisfy minimum statutory withholding taxeson the delivery of equity-based awards during May 2017.
On April 17, 2017, the Board of Directors of Group Inc.(Board) authorized the repurchase of an additional50 million shares of common stock pursuant to the firm’sexisting share repurchase program. Since March 2000, theBoard has approved a repurchase program authorizingrepurchases of up to 555 million shares of our commonstock. The repurchase program is effected primarilythrough regular open-market purchases (which may includerepurchase plans designed to comply with Rule 10b5-1),the amounts and timing of which are determined primarilyby our current and projected capital position, but whichmay also be influenced by general market conditions andthe prevailing price and trading volumes of our commonstock. The repurchase program has no set expiration ortermination date. Prior to repurchasing common stock, wemust receive confirmation that the Board of Governors ofthe Federal Reserve System does not object to such capitalaction.
Goldman Sachs June 2017 Form 10-Q 150

Item 6. Exhibits
Exhibits
12.1 Statement re: Computation of Ratios ofEarnings to Fixed Charges and Ratios ofEarnings to Combined Fixed Charges andPreferred Stock Dividends.
15.1 Letter re: Unaudited Interim FinancialInformation.
31.1 Rule 13a-14(a) Certifications.
32.1 Section 1350 Certifications (This informationis furnished and not filed for purposes ofSections 11 and 12 of the Securities Act of1933 and Section 18 of the SecuritiesExchange Act of 1934).
101 Interactive data files pursuant to Rule 405 ofRegulation S-T: (i) the CondensedConsolidated Statements of Earnings for thethree and six months ended June 30, 2017 andJune 30, 2016, (ii) the CondensedConsolidated Statements of ComprehensiveIncome for the three and six months endedJune 30, 2017 and June 30, 2016, (iii) theCondensed Consolidated Statements ofFinancial Condition as of June 30, 2017 andDecember 31, 2016, (iv) the CondensedConsolidated Statements of Changes inShareholders’ Equity for the six months endedJune 30, 2017 and year endedDecember 31, 2016, (v) the CondensedConsolidated Statements of Cash Flows for thesix months ended June 30, 2017 andJune 30, 2016, and (vi) the notes to theCondensed Consolidated Financial Statements.
SIGNATURES
Pursuant to the requirements of the Securities Exchange Actof 1934, the registrant has duly caused this report to besigned on its behalf by the undersigned thereunto dulyauthorized.
THE GOLDMAN SACHS GROUP, INC.
By: /s/ R. Martin ChavezName: R. Martin ChavezTitle: Chief Financial OfficerDate: August 3, 2017
By: /s/ Brian J. LeeName: Brian J. LeeTitle: Principal Accounting OfficerDate: August 3, 2017
151 Goldman Sachs June 2017 Form 10-Q

EXHIBIT 12.1
THE GOLDMAN SACHS GROUP, INC. AND SUBSIDIARIES
COMPUTATION OF RATIOS OF EARNINGS TO FIXED CHARGES AND RATIOS OF EARNINGS
TO COMBINED FIXED CHARGES AND PREFERRED STOCK DIVIDENDS
Six MonthsEnded June Year Ended December
$ in millions 2017 2016 2015 2014 2013 2012
Net earnings $4,086 $ 7,398 $ 6,083 $ 8,477 $ 8,040 $ 7,475Add:
Provision for taxes 962 2,906 2,695 3,880 3,697 3,732Portion of rents representative of an interest factor 48 81 83 103 108 125Interest expense on all indebtedness 4,662 7,104 5,388 5,557 6,668 7,501
Pre-tax earnings, as adjusted $9,758 $17,489 $14,249 $18,017 $18,513 $18,833
Fixed charges 1:Portion of rents representative of an interest factor $ 48 $ 81 $ 83 $ 103 $ 108 $ 125Interest expense on all indebtedness 4,681 7,127 5,403 5,569 6,672 7,509
Total fixed charges $4,729 $ 7,208 $ 5,486 $ 5,672 $ 6,780 $ 7,634
Preferred stock dividend requirements 362 804 743 583 458 274Total combined fixed charges and preferred stock dividends $5,091 $ 8,012 $ 6,229 $ 6,255 $ 7,238 $ 7,908
Ratio of earnings to fixed charges 2.06x 2.43x 2.60x 3.18x 2.73x 2.47x
Ratio of earnings to combined fixed charges and preferred stock
dividends 1.92x 2.18x 2.29x 2.88x 2.56x 2.38x
1. Fixed charges include capitalized interest of $19 million for the six months ended June 2017, $23 million for 2016, $15 million for 2015, $12 million for 2014,$4 million for 2013 and $8 million for 2012.
EXHIBIT 15.1
August 3, 2017
Securities and Exchange Commission100 F Street N.E.Washington, D.C. 20549
Re: The Goldman Sachs Group, Inc.Registration Statements on Form S-8(No. 333-80839)(No. 333-42068)(No. 333-106430)(No. 333-120802)
Registration Statements on Form S-3(No. 333-219206)
Commissioners:
We are aware that our report dated August 3, 2017, on our review of the condensed consolidated statement of financialcondition of The Goldman Sachs Group, Inc. and subsidiaries (the “Company”) as of June 30, 2017, the related condensedconsolidated statements of earnings for the three and six months ended June 30, 2017 and 2016, the condensed consolidatedstatements of comprehensive income for the three and six months ended June 30, 2017 and 2016, the condensed consolidatedstatement of changes in shareholders’ equity for the six months ended June 30, 2017, and the condensed consolidatedstatements of cash flows for the six months ended June 30, 2017 and 2016 included in the Company’s quarterly report onForm 10-Q for the quarter ended June 30, 2017, is incorporated by reference in the registration statements referred to above.Pursuant to Rule 436(c) under the Securities Act of 1933 (the “Act”), such report should not be considered a part of suchregistration statements, and is not a report within the meaning of Sections 7 and 11 of the Act.
Very truly yours,
/s/ PRICEWATERHOUSECOOPERS LLP

EXHIBIT 31.1
CERTIFICATIONS
I, Lloyd C. Blankfein, certify that:
1. I have reviewed this Quarterly Report on Form 10-Q for the quarter ended June 30, 2017 of The Goldman SachsGroup, Inc.;
2. Based on my knowledge, this report does not contain any untrue statement of a material fact or omit to state amaterial fact necessary to make the statements made, in light of the circumstances under which such statements weremade, not misleading with respect to the period covered by this report;
3. Based on my knowledge, the financial statements, and other financial information included in this report, fairlypresent in all material respects the financial condition, results of operations and cash flows of the registrant as of, andfor, the periods presented in this report;
4. The registrant’s other certifying officer(s) and I are responsible for establishing and maintaining disclosure controlsand procedures (as defined in Exchange Act Rules 13a-15(e) and 15d-15(e)) and internal control over financialreporting (as defined in Exchange Act Rules 13a-15(f) and 15d-15(f)) for the registrant and have:
a) Designed such disclosure controls and procedures, or caused such disclosure controls and procedures to bedesigned under our supervision, to ensure that material information relating to the registrant, including itsconsolidated subsidiaries, is made known to us by others within those entities, particularly during the period inwhich this report is being prepared;
b) Designed such internal control over financial reporting, or caused such internal control over financial reporting tobe designed under our supervision, to provide reasonable assurance regarding the reliability of financial reportingand the preparation of financial statements for external purposes in accordance with generally acceptedaccounting principles;
c) Evaluated the effectiveness of the registrant’s disclosure controls and procedures and presented in this report ourconclusions about the effectiveness of the disclosure controls and procedures, as of the end of the period coveredby this report based on such evaluation; and
d) Disclosed in this report any change in the registrant’s internal control over financial reporting that occurredduring the registrant’s most recent fiscal quarter (the registrant’s fourth fiscal quarter in the case of an annualreport) that has materially affected, or is reasonably likely to materially affect, the registrant’s internal controlover financial reporting; and
5. The registrant’s other certifying officer(s) and I have disclosed, based on our most recent evaluation of internal controlover financial reporting, to the registrant’s auditors and the audit committee of the registrant’s board of directors (orpersons performing the equivalent functions):
a) All significant deficiencies and material weaknesses in the design or operation of internal control over financialreporting which are reasonably likely to adversely affect the registrant’s ability to record, process, summarize andreport financial information; and
b) Any fraud, whether or not material, that involves management or other employees who have a significant role inthe registrant’s internal control over financial reporting.
Date: August 3, 2017 /s/ Lloyd C. Blankfein
Name: Lloyd C. BlankfeinTitle: Chief Executive Officer

CERTIFICATIONS
I, R. Martin Chavez, certify that:
1. I have reviewed this Quarterly Report on Form 10-Q for the quarter ended June 30, 2017 of The Goldman SachsGroup, Inc.;
2. Based on my knowledge, this report does not contain any untrue statement of a material fact or omit to state amaterial fact necessary to make the statements made, in light of the circumstances under which such statements weremade, not misleading with respect to the period covered by this report;
3. Based on my knowledge, the financial statements, and other financial information included in this report, fairlypresent in all material respects the financial condition, results of operations and cash flows of the registrant as of, andfor, the periods presented in this report;
4. The registrant’s other certifying officer(s) and I are responsible for establishing and maintaining disclosure controlsand procedures (as defined in Exchange Act Rules 13a-15(e) and 15d-15(e)) and internal control over financialreporting (as defined in Exchange Act Rules 13a-15(f) and 15d-15(f)) for the registrant and have:
a) Designed such disclosure controls and procedures, or caused such disclosure controls and procedures to bedesigned under our supervision, to ensure that material information relating to the registrant, including itsconsolidated subsidiaries, is made known to us by others within those entities, particularly during the period inwhich this report is being prepared;
b) Designed such internal control over financial reporting, or caused such internal control over financial reporting tobe designed under our supervision, to provide reasonable assurance regarding the reliability of financial reportingand the preparation of financial statements for external purposes in accordance with generally acceptedaccounting principles;
c) Evaluated the effectiveness of the registrant’s disclosure controls and procedures and presented in this report ourconclusions about the effectiveness of the disclosure controls and procedures, as of the end of the period coveredby this report based on such evaluation; and
d) Disclosed in this report any change in the registrant’s internal control over financial reporting that occurredduring the registrant’s most recent fiscal quarter (the registrant’s fourth fiscal quarter in the case of an annualreport) that has materially affected, or is reasonably likely to materially affect, the registrant’s internal controlover financial reporting; and
5. The registrant’s other certifying officer(s) and I have disclosed, based on our most recent evaluation of internal controlover financial reporting, to the registrant’s auditors and the audit committee of the registrant’s board of directors (orpersons performing the equivalent functions):
a) All significant deficiencies and material weaknesses in the design or operation of internal control over financialreporting which are reasonably likely to adversely affect the registrant’s ability to record, process, summarize andreport financial information; and
b) Any fraud, whether or not material, that involves management or other employees who have a significant role inthe registrant’s internal control over financial reporting.
Date: August 3, 2017 /s/ R. Martin Chavez
Name: R. Martin ChavezTitle: Chief Financial Officer

EXHIBIT 32.1
CERTIFICATION
Pursuant to 18 U.S.C. § 1350, the undersigned officer of The Goldman Sachs Group, Inc. (the “Company”) hereby certifiesthat the Company’s Quarterly Report on Form 10-Q for the quarter ended June 30, 2017 (the “Report”) fully complies withthe requirements of Section 13(a) or 15(d), as applicable, of the Securities Exchange Act of 1934 and that the informationcontained in the Report fairly presents, in all material respects, the financial condition and results of operations of theCompany.
Dated: August 3, 2017 /s/ Lloyd C. Blankfein
Name: Lloyd C. BlankfeinTitle: Chief Executive Officer
The foregoing certification is being furnished solely pursuant to 18 U.S.C. § 1350 and is not being filed as part of the Reportor as a separate disclosure document.
CERTIFICATION
Pursuant to 18 U.S.C. § 1350, the undersigned officer of The Goldman Sachs Group, Inc. (the “Company”) hereby certifiesthat the Company’s Quarterly Report on Form 10-Q for the quarter ended June 30, 2017 (the “Report”) fully complies withthe requirements of Section 13(a) or 15(d), as applicable, of the Securities Exchange Act of 1934 and that the informationcontained in the Report fairly presents, in all material respects, the financial condition and results of operations of theCompany.
Dated: August 3, 2017 /s/ R. Martin Chavez
Name: R. Martin ChavezTitle: Chief Financial Officer
The foregoing certification is being furnished solely pursuant to 18 U.S.C. § 1350 and is not being filed as part of the Reportor as a separate disclosure document.