Embed Size (px)
Citation preview

2019
Fort Lauderdale Edition
TM
W A V E S O F T H E F U T U R E

01
C O N T E N T S
MIAMI REPORT 2018
FEATURED STORY
02 - 09
NEW CONDO CONSTRUCTION
10 - 13
MARKET ANALYSIS
14 - 19
TRANSPORTATION
20 - 23
POPULATION
24 – 27
CULTURAL & ECONOMIC GROWTH
28 – 35
LANDSCAPE OF THE FUTURE
36 - 37
FORT LAUDERDALE OF TOMORROW
38 - 41
ON THE GROUND
42
C E OCraig Studnicky
P R E S I D E N TMichael Ambrosio
P R E S I D E N T , R E L A T E D I S G I N T ' L R E A L T YAlex Vidal
C H I E F M A R K E T I N G O F F I C E RVeronica Escobedo Gorson
C R E A T I V E D I R E C T O REdward Trelles
D I R E C T O R O F M A R K E T R E S E A R C H Athena Rossano
M A R K E T I N G D I R E C T O R Rowena Luna
E D I T O R I A LRebecca Stella
Senior Marketing & Communications Associate
D E S I G N E R SEmiliana ZelkowiczGraphic Designer
Maria LatorreGraphic Designer
Chrystal LozanoMarketing Assistant
C O N T R I B U T O R SRebecca Batterman, Mariana Perez, Fany Mendez and Robert Esposito
M I A M I R E P O R T TM
The Miami ReportTM is produced for general interest only. It is not definitive and is not intended to give advice. Although high standards have been used in the preparation of the information, analysis and views presented in the Miami Report,
no responsibility or liability whatsoever can be accepted by ISGWorld for the contents. We make no express or implied guarantee of the accuracy of any of the contents. As far as applicable laws allow, we do not accept responsibility for
errors, inaccuracies or omissions, nor for loss or damage that may result directly or indirectly from reliance on or use of its contents. Readers should not take or refrain from taking any action as a result of information in the Miami Report.
MIAMI REPORT 2018

TRANSFORMATIVE TIMES
Over the past 20 years, Fort Lauderdale has
transformed. Once known almost exclusively
as a spring break and vacation hotspot,
today’s Fort Lauderdale is booming with
development, both on the beach and in the
city’s downtown and urban cores. With the
addition of significant luxury offerings, from
residential real estate and hospitality, to
dining, culture and entertainment,
Fort Lauderdale is becoming more and more
compatible with Miami and Palm Beach.
02 03

$1.5BIL in new construction in Fort Lauderdale
MIAMI REPORT 2018 MIAMI REPORT 2018
04
South Florida’s next upscale beach town has arrived
05
*Average price per square foot
2013
2018
$0$1.5 BILLION
NEW CONSTRUCTION VALUE COMPARISON
2013
70% of Oceanfront New Construction Condos Sold
FORT LAUDER DALE BEACH
The Wave on BayshoreAvg. Price $1.1M / 78% SOLD
Adagio Fort LauderdaleAvg. Price $2.4M / 40% SOLD
Gale Hotel & Residences Fort Lauderdale
Avg. Price $1,052,000 / SOLD OUT
Paramount Residences Fort LauderdaleAvg. Price $2.4M SOLD OUT Four Seasons
Private ResidencesAvg. Price $4.9M / 50% SOLD
The Ocean Resort Residences at ConradAvg. Price $1.2M / 60% SOLD
W Residences Fort LauderdaleAvg. Price $1M / 65% SOLD
The Residences at The Ritz Carlton
Avg. Price $2.5M / SOLD OUT
321 at Water’s EdgeAvg. Price $4.9M / 50% SOLD
Auberge Beach ResidencesAvg. Price $3M / South Tower 81% SOLD / North Tower SOLD OUT
FEATU
RED
STOR
Y

06 07
Fort Lauderdale Beach and South Beach/Miami Beach - 20-Year Historical Condo Pricing ComparisonCondos built since 1998
MIAMI REPORT 2018 - FORT LAUDERDALE MIAMI REPORT 2018 - FORT LAUDERDALE
FEATU
RED
STOR
Y
M E T H O D O L O G Y
*Projected
RelatedISG’s in-house Market Research Division completed an extensive analysis of 71 condominium buildings that have been developed in South Florida from 1998 through 2018 with projections through 2020 for Fort Lauderdale Beach and South Beach/ Miami Beach. The total number of condominium units in the 71 condo buildings in our study contained a total of 10,650 transactions.
Our methodology relied upon recording the sales prices for every sale in those 71 buildings, both original and resale, pulled from county records. Analyzing every one of these transactions enabled ISG to track the changes in selling prices within these buildings from 1998 through 2018. This exercise allowed us to create a database that we used to determine the actual appreciation for condos over the past 20 years and the historical pricing difference between Fort Lauderdale Beach and South Beach /Miami Beach. The graphic below summarizes our findings:
1998 20182008
36%DIFFERENCE
IN PRICE
47%DIFFERENCE
IN PRICE
192%DIFFERENCE
IN PRICE
36%*DIFFERENCE
IN PRICE$4.5M
$4M
$3.5M
$3M
$2.5M
$2M
$1.5M
$1M
$500K
$0
2020*
FORT LAUDERDALE BEACH - APPRECIATION ANALYSIS
SOUTH BEACH/MIAMI BEACH - APPRECIATION ANALYSIS
$671,000
$491,000
$4,100,000
$3,000,000
Source: Broward County Tax Records
$1,198,500
$811,000
$3,900,000
$1,333,314
PROJECTED CLOSED SALES IN
LUXURY DEVELOPMENT
Four Seasons Private Residences
Auberge Beach Residences
W Residences Fort Lauderdale
0 0
2
0* 0*
2012 2013 2014 2015 2016 2017 2018 2019*Projected
2020*Projected
25
24
23
22
21
20
19
18
17
16
15
14
13
12
11
10
9
8
7
6
5
4
3
2
1
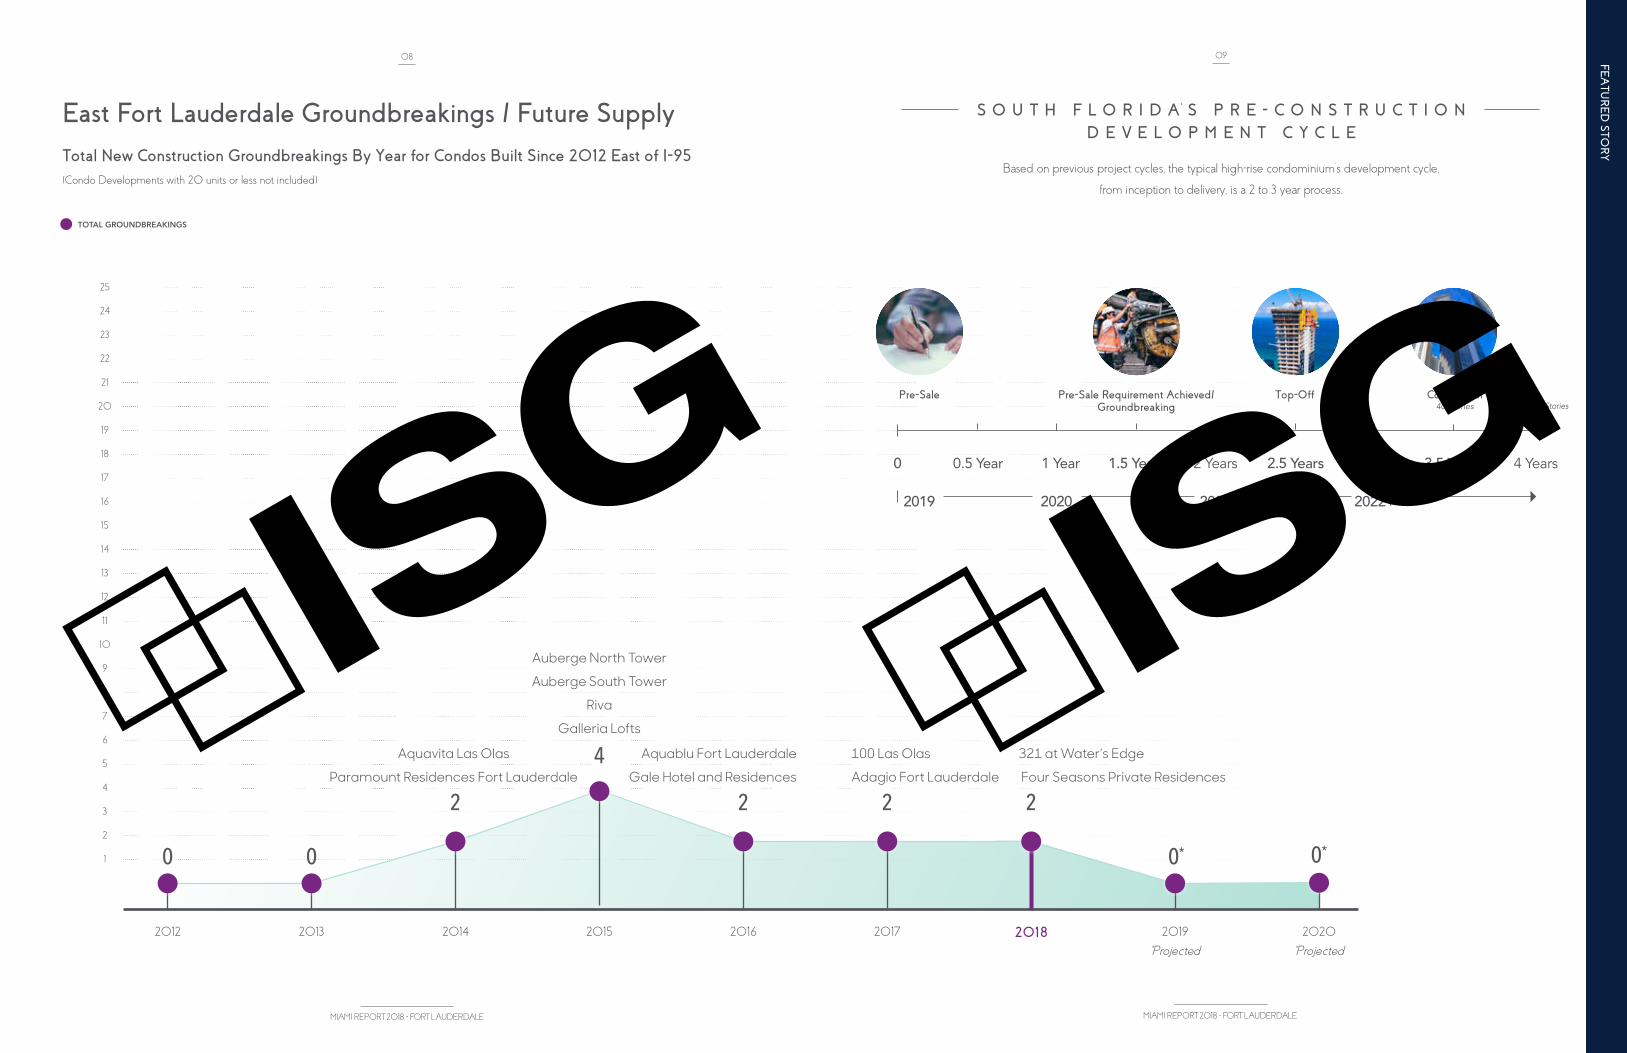
East Fort Lauderdale Groundbreakings / Future SupplyTotal New Construction Groundbreakings By Year for Condos Built Since 2012 East of I-95(Condo Developments with 20 units or less not included)
2
4
2 2
08
MIAMI REPORT 2018 - FORT LAUDERDALE MIAMI REPORT 2018 - FORT LAUDERDALE
FEATU
RED
STOR
Y
TOTAL GROUNDBREAKINGS
09
S O U T H F L O R I D A’S P R E - C O N S T R U C T I O ND E V E L O P M E N T C Y C L E
Based on previous project cycles, the typical high-rise condominium’s development cycle, from inception to delivery, is a 2 to 3 year process.
Pre-Sale Top-Off Completion40 Stories More than 40 Stories
Pre-Sale Requirement Achieved/Groundbreaking
2019 2020 2022+2021
0 0.5 Year 1 Year 1.5 Years 2 Years 2.5 Years 4 Years3.5 Years
Aquavita Las Olas
Paramount Residences Fort Lauderdale
Auberge North Tower
Auberge South Tower
Riva
Galleria Lofts
Aquablu Fort Lauderdale
Gale Hotel and Residences
100 Las Olas
Adagio Fort Lauderdale
321 at Water’s Edge
Four Seasons Private Residences
3 Years

Photo Credit: Paul Morris Photography
NEW CONDO CONSTRUCTION

PARAMOUNT FORT LAUDERDALE 95 TOTAL UNITS100% SOLDD
W RESIDENCES FORT LAUDERDALE 171 TOTAL UNITS65% SOLDR
975 Sold Units
70% SOLDAS OF NOVEMBER 2018
TOTAL DEVELOPER UNITS SOLD DEVELOPER UNITS UNSOLD DEVELOPER UNITS
MIAMI REPORT 2018
12
428Unsold Units
1,403Total Units
New Condo Construction SummaryTotal new construction condo units to be built, sold and currently available for sale in East Fort Lauderdale
13
MIAMI REPORT 2018
SOLD DEVELOPER UNITS UNSOLD DEVELOPER UNITS
D RECENTLY DELIVERED U UNDER CONSTRUCTION P PRE-CONSTRUCTION
Fort Lauderdale: 1,403 Total Units / 975 Sold Units (70%) / 428 Unsold Units
AQUABLU FORT LAUDERDALE 35 TOTAL UNITS80% SOLDD
33 INTRACOASTAL 11 TOTAL UNITS64% SOLDD
ADAGIO ON THE BAY 12 TOTAL UNITS100% SOLDD
ADAGIO FORT LAUDERDALE BEACH 31 TOTAL UNITS40% SOLDU
AQUAVITA LAS OLAS 22 TOTAL UNITS100% SOLDD
AUBERGE BEACH NORTH TOWER 57 TOTAL UNITS100% SOLDD
AUBERGE BEACH SOUTH TOWER 114 TOTAL UNITS81% SOLDD
FOUR SEASONS PRIVATE RESIDENCES* 50% SOLD 90 TOTAL UNITSU
GALE HOTEL & RESIDENCES 129 TOTAL UNITS100% SOLDD
RIVA 100 TOTAL UNITS70% SOLDD
321 AT WATER’S EDGE 23 TOTAL UNITS55% SOLDU
AQUALUNA LAS OLAS 16 TOTAL UNITS100% SOLDD
AQUAVUE LAS OLAS 8 TOTAL UNITS75% SOLDD
100 LAS OLAS 113 TOTAL UNITS30% SOLDU
GALLERIA LOFTS 48 TOTAL UNITS75% SOLDD
Total new construction condo units available for sale since mid-2011
New Condo Construction Summary
AQUAMAR LAS OLAS 20 TOTAL UNITS100% SOLDD
WAVE 18 TOTAL UNITS78% SOLDU
R NEWLY RENOVATED
THE OCEAN RESORT & RESIDENCES AT CONRAD 290 TOTAL UNITS
R 60% SOLD
NEW
CO
ND
O C
ON
STRU
CTIO
N
*Est. % Sold - Project won’t release the information
OCE
AN
FRO
NT
NO
N-O
CEA
NFR
ON
T
NEW
CO
ND
O C
ON
STRU
CTIO
N
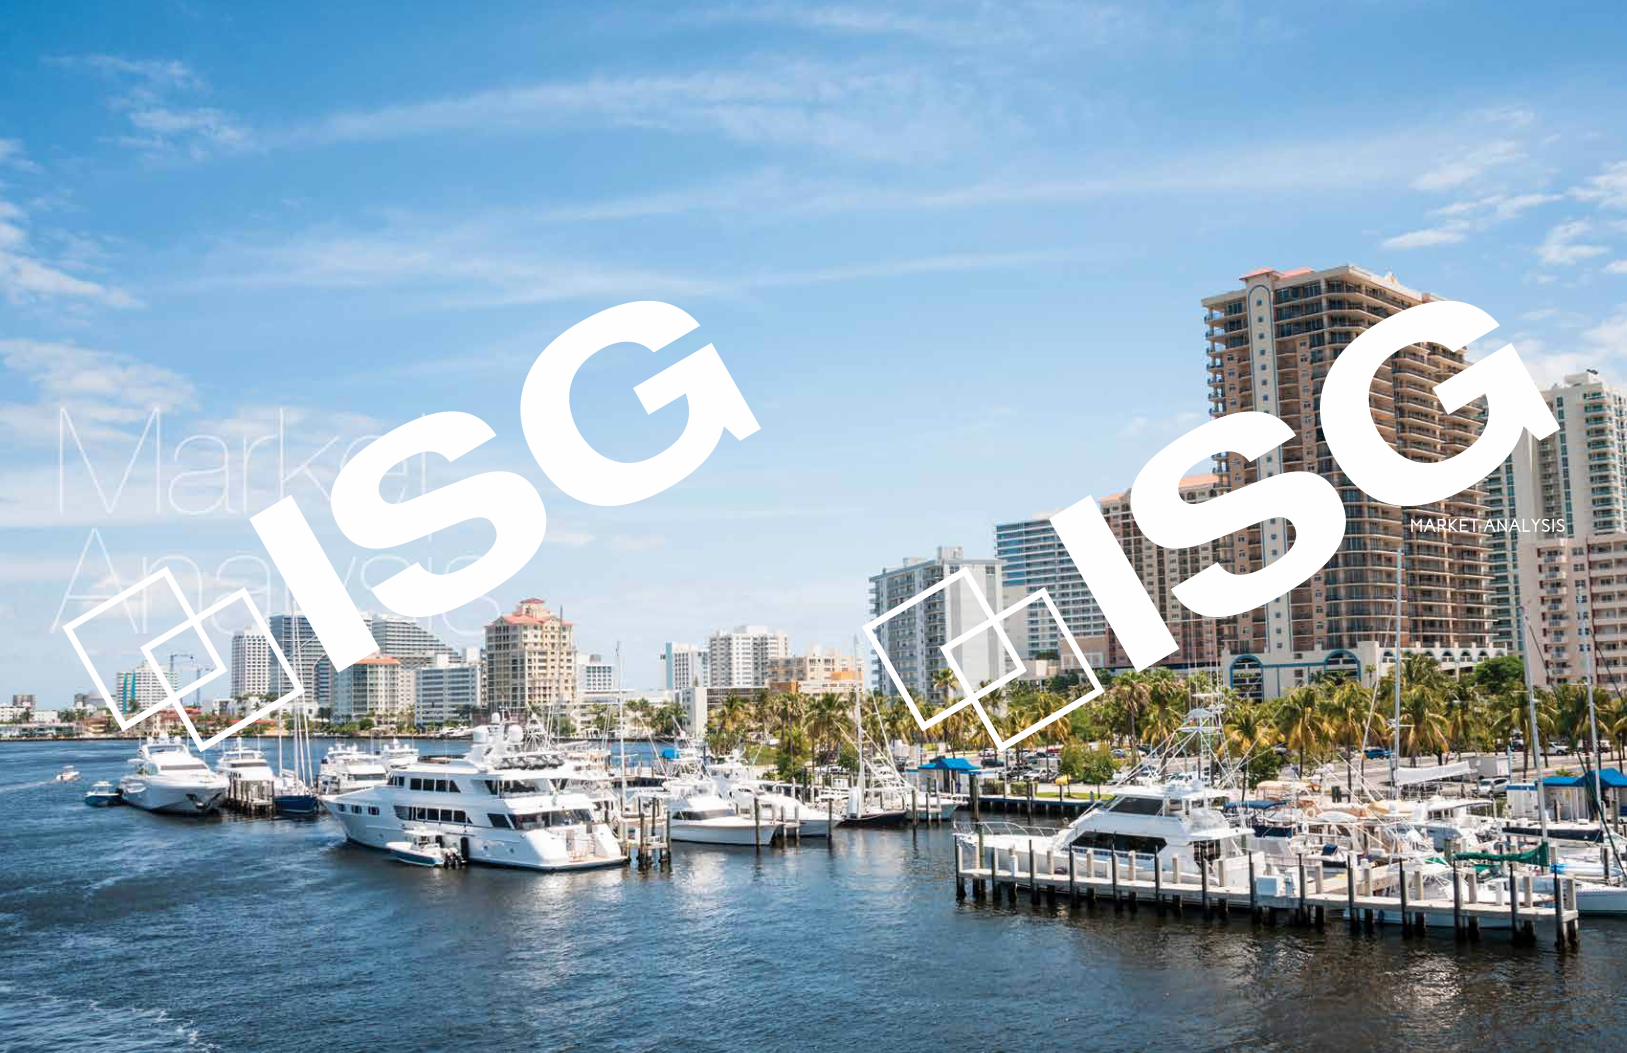
MARKET ANALYSIS

Real Estate Rule of Thumb
5% of inventory on the market or below = a seller's market10% of inventory on the market or above = a buyer's market.
MIAMI REPORT 2018
16
Broward County Residential SnapshotSingle-Family Home, Townhomes, Condos and Rental Units available on the MLS
What is Total Housing Units?
Total single family homes, townhomes, condos and apartments for rent that have been delivered in
Miami-Dade and Broward County
BROWARD COUNTY
TOTAL HOUSING INVENTORY 823,602 LOW INVENTORY
ONLY 2.16%of total housing units are available for sale or rent
in Broward County (as of November 2018)
2.16%97.84%(unavailable) Total Active Single-Family Homes .......................................5,786 0.70%
Total Active Condos / Townhomes ......................................7,307 0.88%
Total Active Rentals .................................................................................4,721 0.57%
TOTAL ACTIVE LISTINGS .............................................17,814 2.16%
Percentage of Total Housing Units Available For Sale on the MLS in Miami-Dade & Broward County from 2010 - 2018
2010 2011 2012 2013 2014 2015 2016 2017 2018
7%
6%
5%
4%
3%
2%
1%
% OF INVENTORY (BROWARD COUNTY)
2.16%available of 810,388 Total Housing Units
2.16%available of 823,602 Total Housing Units
Stable for the last
8 years
17
MIAMI REPORT 2018
Sub Market Total Active Listings % of Condos Listed Avg. 3 Year Absorption in MLS (2015-2017)
Brickell 1,516 12.14% 515
Downtown Miami 576 12.80% 278
Biscayne Corridor 683 8.87% 337
Miami Beach 486 14.53% 210
Sunny Isles Beach 642 20.40% 158
Aventura 324 15.31% 115
Hallandale/Hollywood 450 18.48% 184
East Fort Lauderdale 266 5.7% 164
TOTALS 4,943 13.52% 1,961
Total Resale Condo Units Listed for Sale on the MLS in Condos Built Since 2006
East Fort Lauderdale Resale Market AnalysisNew condos built since 2006 and available for sale since 18 months ago, 12 months ago, 6 months ago and currently active
AVG. LIST PRICEACTIVE LISTINGS
$1.6M
$1.5M
$1.4M
$1.3M
$1.2M
$1.1M
$1M
500
400
300
200
100
018 Months Ago 6 Months Ago Currently Active12 Months Ago
$1.29M$1.25M
603
518
451
266
$1.44M
$1.52M
MA
RK
ET AN
ALYSIS
Source: MLS and U.S. Census Bureau

Multi-Family Transforming Downtown Fort LauderdaleThe burst of new, under-construction and planned apartments, mainly in Fort Lauderdale’s downtown core, is creating a true “live-work-play” atmosphere that is appealing to a population of young and creative professionals. Comprised of a mix of luxury projects as well as more affordable developments, like those featuring micro-units, the more than 10,000 new residences are attracting those seeking a different pace from Miami.
TOTAL NEW MULTI-FAMILY RESIDENTIAL UNITS IN DOWNTOWN FORT LAUDERDALE
COMPARED TO 4,200 TOTAL MULTI-FAMILY RESIDENTIAL UNITS BUILT IN DOWNTOWN MIAMI, EDGEWATER AND THE BISCAYNE CORRIDOR SINCE 2003
1,288Under Review
5,647Approved
3,287Under
Construction
10,222Total Multi-FamilyResidential Units
DOWNTOWN FORT LAUDERDALE MULTI-FAMILY TRENDS
MIAMI REPORT 2018 MIAMI REPORT 2018
18 19
Inventory has grown nearly
50% since 2012
Rental rates have increased
37% since 2012
Source: Costar, Colliers International
$2.50
$2.00
$1.50
$1.00
$0.50
$0.0020132012 2015 2017 YTD 20182014
Effe
ctiv
e Re
nt P
SF
2016
12%
10%
8%
6%
4%
2%
0%
Vacancy
VACANCYEFFECTIVE RENT PSF
37% increase
since 2012
Year Inventory Effective Vacancy (Units) Rent PSF Rate
2012 6,152 $1.56 7.0%
2013 6,119 $1.73 5.0%
2014 6,996 $1.88 8.7%
2015 7,736 $2.10 5.8%
2016 7,960 $2.10 5.8%
2017 8,809 $2.13 9.7%
YTD 2018 9,125 $2.13 9.8%
Effective rents are expected to grow within the next year by 3.4%, driven by the influx of millennials seeking a live-work-play lifestyle.
- Colliers International Fort Lauderdale Market Pulse Q2 2018 Overview
X Las Olas
The Main Las Olas
4 West Las Olas
FATcity
A sampling of future Fort Lauderdale multi-family projects
MA
RK
ET AN
ALYSIS

TRANSPORTATION

Brightline
22
MIAMI REPORT 2018
Fort Lauderdale-Hollywood International Airport
MIAMI REPORT 2018
23
This year, Fort Lauderdale-Hollywood International Airport was named the fastest-growing airport by aviation statistic and analysis firm OAG. The significant growth is mostly due to its partnership with its top three carriers, Southwest, Spirit and JetBlue. Together, the three airlines, which continue to expand their route schedules, account for two-thirds of domestic and international passenger traffic out of the airport. Additionally, FLL’s massive renovation to each terminal continues and is scheduled to be complete by 2020.
Fort Lauderdale-Hollywood International Airport
#2Fort Lauderdale-Hollywood
International Airport
#3San Francisco Airport
#1Los Angeles International
Airport
AIRPORTS RANKED BY ANNUAL PASSENGER INCREASE (2010 - 2017)
2018
2017
2016
2015
2014
2013
2012
2011
2010
TOTAL ANNUAL PASSENGERS
36,400,000
32,500,000
29,200,000
26,900,000
24,600,000
23,500,000
23,500,000
23,300,000
22,400,000
12%
2018
2017
2016
2015
2014
2013
2012
2011
2010
TOTAL ANNUAL INTERNATIONAL PASSENGERS
8,539,200
7,200,000
6,100,000
5,480,000
4,650,000
3,700,000
3,590,000
3,610,000
3,447,393
18.6%
FORT LAUDERDALE’S RANKING AMONG BUSIEST U.S. AIRPORTS - (SINCE 2010)
2010 2013 2015 2018
#19#22
#33
#43
MIAMICENTRALOpen
FORT LAUDERDALEOpen
WEST PALM BEACHOpen
ORLANDOScheduled 2021
The popular link connecting Fort Lauderdale to Miami and West Palm Beach continues to grow in passenger traffic and revenue. In June, Brightline announced it is exploring an extension of service into the Tampa Bay market, following the launch of service to Orlando scheduled for 2021.
BRIGHTLINE TOTAL PASSENGER GROWTH Q1-Q3 2018
200K
175K
150K
125K
100K
75K
50K
25K
0
Total Passengers as of Q1
Total Passengers as of Q3
Total Passengers as of Q2
74,780106,090
180,870
TOTAL PASSENGERS
BRIGHTLINE TOTAL REVENUE GROWTH Q1-Q3 2018
$2.5M
$2M
$1.5M
$1M
$500K
$0
Total Revenue asas of Q1
Total Revenue asof Q3
Total Revenue asof Q2
$663,667
$1,540,000
$2,200,000
TOTAL REVENUE
TBD
T A M P A
19th Busiest Airport in the
U.S.
TRA
NSP
OR
TATIO
N

POPULATION

Source: Demographics for the Bureau of Economics and Business
45%of Florida’s daily migration
is in South Florida
25%Miami-Dade
8%Palm Beach
12%Broward
(Fort Lauderdale)
55%rest of state
900people per day
Source: U.S. Census Bureau
STATES WITH THE LARGEST DAILY POPULATION INCREASE (2016 - 2017)
PEOPLE TOTAL RANK STATE PER DAY POPULATION
1 Texas 1,095 28.3M
2 Florida 900 20.6M
3 California 658 39.5M
30 New York 36 19.8M
“More people are planning a move to Florida over any other state, according to a new study by LendingTree.”November 2017
8 of the top 15 fastest-growing cities by population, employment and wages of 2017 are
in Florida.
February 2017
FORT LAUDERDALE
Of the 900 people that move to Florida each day, 45 percent of them make Miami-Dade, Broward and Palm Beach counties their home.
Florida Daily Population Growth
MIAMI REPORT 2018
27 PO
PU
LATIO
N
IN POPULATION GROWTH(2014-2017)
#2 NATIONALLY
1914 1967 2008 2018 2020* 2040* 2051* 1914 1967 2008 2018 2020* 2040* 2051*
U.S. POPULATION GROWTH
500M
450M
400M
350M
300M
250M
200M
150M
100M
50M
326,8M
400M*
WORLD POPULATION GROWTH
10B
9B
8B
7B
6B
5B
4B
3B
2B
1B
Source: U.S. Census Bureau
= 1 MILLION
21.2M2020*
18.53M2008
6.6M1967
882K1914
26M2040*
FLORIDA POPULATION GROWTH
20,9M2018
*Projected Source: WorldPopulation.com *Projected Source: WorldPopulation.com
7,7B
9.8B*
*Projected Source: U.S. Census Bureau
Population As the second-fastest-growing state in population, Florida’s daily increase of residents is very much in line with the rapidly growing U.S. and world populations.
Scan the QR code for a real-time look at the population of the U.S. and the world.
MIAMI REPORT 2018
26M
ILL
ION
S
BIL
LIO
NS

CULTURAL & ECONOMIC GROWTH
Photo courtesy of W Residences Fort Lauderdale

MIAMI REPORT 2018
31
DEMAND IS NOW OUTPACING SUPPLY
Fort Lauderdale Market Supply/Demand Percentage Change
Demand is outpacing supply growth for the overall hotel industry, which is most noticeable in the upscale and upper-upscale segments,
according to data from STR, parent company of Hotel News.
W Fort Lauderdale
Four Seasons Hotel Fort Lauderdale The Ritz-Carlton, Fort Lauderdale
Hospitality
30
MIAMI REPORT 2018
An industry that was always strong for Fort Lauderdale, the hospitality sector is very much a part of the city’s recent development boom. A wave of brand-name hotels ranging from “affordable chic” brands to luxury, upscale boutique and mixed-use developments are making their way to downtown Fort Lauderdale and Fort Lauderdale Beach. The demand is driven by residential growth in the urban core, a saturated office market and a thriving tourism industry.
#2BROWARD COUNTY, FL
#3NYC Boroughs, NY
#1Charlotte, NC
EMERGING HOSPITALITY TRENDS2017 TOP HOSPITALITY MARKET RANKINGS
FORT LAUDERDALE HOTEL MARKET OVERVIEW (JULY 2017-JULY 2018)
Fort Lauderdale Performance: Strong ADR Drives RevPar
Supply Demand ADR RevPar RevenueOccupancy
+2.1% +2.6%
+0.5%
+7.8% +8.3%
+10.5%So
urce
: STR
Rep
ort
SUPPLY DEMAND
4
3
2
1
0
-1
-2
2015 2016 2017 2018
2.6
2.1
PERC
ENTA
GE
POIN
TS
CU
LTUR
AL & EC
ON
OM
IC G
RO
WTH
The Dalmar/Element Hotel Tru/Home2 Suites by Hilton
Broward County ranked #2 hospitality market in the US based on the largest percentage increase in transaction volume year-over-year.

Annual Events
MIAMI REPORT 2018
33
• Art Fort Lauderdale
• Beach Volleyball Major Series
• Pride Fort Lauderdale
• FLL Fashion Week
• Las Olas Wine & Food Festival
• Tortuga Music Festival
• Fort Lauderdale Air Show
• Las Olas Art Fair
• OUTshine Film Festival
• Fort Lauderdale International Film Festival
• Fort Lauderdale International Boat Show
• The Seminole Hard Rock Winterfest Boat Parade
Fort Lauderdale is home to some of South Florida’s largest and most popular events, from world-renowned sporting events and shows, to arts & cultural festivals, parades, conventions, live music events and more.
Las Olas Wine & Food Festival
FLL Fashion Week
Art Fort Lauderdale
Tortuga Music Festival
Pride Fort Lauderdale
Fort Lauderdale Air Show
Beach Volleyball Major Series
Fort Lauderdale International Boat Show
32
MIAMI REPORT 2018
It’s only fitting that the Yachting Capital of the World be home to the largest boat show in the world. Each fall, over 1,500 boats, billions of dollars worth of marine products and thousands of boating, yachting and fishing aficionados pour into Fort Lauderdale for the annual event that has a greater economic impact on the region than that of a Super Bowl.
WORLD’S LARGEST BOAT SHOWS
#1Fort Lauderdale
International Boat Show
#3Miami International
Boat Show
#2Düsseldorf International
Boat Show
The Fort Lauderdale International Boat Show has a larger economic impact on South Florida than the Super Bowl.
$1M
$900K
$800K
$700K
$600K
$500K
$400K
$300K
$200K
$100K
$0
Super Bowl Miami InternationalBoat Show
Düsseldorf International Boat Show
Fort Lauderdale International Boat Show
$854,000,000 $856,000,000$875,000,000
$350,000,000
TOTAL ECONOMIC IMPACTSUPER BOWL VS. WORLD’S LARGEST BOAT SHOWS
CU
LTUR
AL & EC
ON
OM
IC G
RO
WTH

MIAMI REPORT 2018
35
F.A.T. VILLAGE & M.A.S.S. DISTRICT
The cultural hubs of the newly revived and trendy Flagler Village, F.A.T. Village and M.A.S.S. District are transforming the arts and culture scene in Fort Lauderdale. The neighboring districts serve as the home for local artists, techies and creative professionals, as well as the area’s newest bars and cafes.
“It is an organic environment that continues to create and evolve. Art and technology are the perfect ingredients for discovering new ways to design and create.”
Doug McCrawFounder of F,A,T, Village
LAST SATURDAYS ARTWALKOpen galleries showcasing new art exhibits, local artists and artisans selling gifts and goods, and a variety of food and entertainment draw thousands of people on the last Saturday of each month.
THE ARTISTS, CREATIVES & TECHIESThe city’s trendy new arts districts have appealed to creatives and businesses that want community and economic development of Fort Lauderdale through the arts. The young, collaborative entrepreneurs that call F.A.T. Village and M.A.S.S. District home are drawn by the area’s eclectic vibe and proximity to downtown.
EXHIBITIONS, GALLERY SPACES AND MUSIC VENUES
Warehouse spaces in both districts showcase contemporary art and play host to live music events, often pushing the envelope with experimentation in their cultural productions.
Museum of Discovery and Science NSU Art Museum Fort Lauderdale IMAX 3D Theater
BB&T Center
Arts & Entertainment
34
MIAMI REPORT 2018
Fort Lauderdale offers locals and visitors alike countless ways to play and enjoy the arts. A diverse selection of arts districts, museums and performance venues creates a cultural landscape that few cities can rival.
Hamilton comes to Fort Lauderdale
This year, mega-hit show Hamilton will join the ranks of the top Broadway shows that have come to the Broward Center for the Performing Arts. Described by South-Florida.com as the hottest ticket of this century, the Tony Award-winning musical will play the Center in an unprecedent-ed 5-week run for a Broadway season in South Florida.
CU
LTUR
AL & EC
ON
OM
IC G
RO
WTH
Canvas Films
ArtsUP! Concepts

Thousands of new residential and hotel units coming to downtown, the recently launched Brightline service, a burgeoning creative, arts and nightlife district and a wave of new luxury oceanfront condos and hotels on Fort Lauderdale Beach are some of the key pieces that are shaping the Fort Lauderdale of tomorrow.
36
MIAMI REPORT 2018
Flagler Village/F.A.T. Village
X Las Olas
100 Las Olas
FATcity
The Dalmar/ Element hotel
RiverwalkIcon Las Olas
The Main Las Olas
Landscape of the Future
100 Las Olas
New Downtown DevelopmentDriving Fort Lauderdale’s urban renaissance is the surge of new and soon-to-come apartments, condos, hotels and offices. All located in the downtown district, the new landscape enables downtown residents, visitors and workers to get around without a car, creating a true live-work-play environment.
This hip neighborhood known for its monthly art walk, artist studios, galleries and creative businesses has attracted a mostly
millennial population that has given the area a new vibrancy and energy. A slew of new residential developments, cafes, bars and
breweries have transformed the district into a center for urban living that continues to flourish.
AT
LA
NT
IC
OC
EA
N
N
MIAMI REPORT 2018
37 CU
LTUR
AL & EC
ON
OM
IC G
RO
WTH
Auberge Beach Residences
Conrad Fort Lauderdale Beach
Four Seasons Hotel and Private Residences
Downtown Fort Lauderdale to Fort Lauderdale Beach 10 min.
Brightline Station30 min. to Miami
30 min. to West Palm BeachW Residences Fort Lauderdale
Rooftop@ 1WLOIcon Las Olas The Main Las Olas FATcity
X Las Olas
W Residences Fort Lauderdale
Conrad Fort Lauderdale Beach Four Seasons Private Residences Auberge Beach Residences
Fort Lauderdale BeachSignificant luxury development in its residential and
hospitality offerings have evolved Fort Lauderdale Beach, which has caught the eye of the world’s most
affluent investors and visitors. Located just minutes from downtown and Las Olas Boulevard,
oceanfront condominium and hotel developments feature world-renowned brands and include some of
the city’s trendiest dining options.
The Whitney
MarinaLofts
1st Avenue Residences
New River Central
488 Residences
The Rise
Aloft Hotel
FlaglerVillage
FORT LAUDERDALE BEACH TO LAS OLAS 8 min. by car | 13 min. by bike
East Las Olas Boulevard
FORT LAUDERDALE OF TOMORROW

Four Seasons Private Residences (Nadim Ash & Fort Partners) - 90 Units
The Ocean Resort Residences at Conrad (Kolter Group) - 290 Units
Paramount Residences Fort Lauderdale (Encore Housing and Kodsi) - 95 Units
AquaBlu Fort Lauderdale (Roy & Eisinger) - 35 Units
Galleria Lofts (Peak Seven) - 48 Units
Adagio on the Bay (Grupo Alco, Garcia Stromberg + GS4 Studio Architects) - 12 Units
RIVA (Premier) - 14 Stories / 100 Units
Auberge Beach Residences (Related) - Two Towers - 171 Units
33 Intracoastal (Thirty Third LLC) - 11 Units
The Wave on Bayshore - 18 Units
14 1816
13 15 17
19
20
*Amounts are an estimate.
Images provided by:
41
11
12
13
16
15
14
20
17
18
19
Fort Lauderdale$3 billion* in new development
AquaLuna Las Olas (Roy & Eisinger) - Two Towers / 16 Units
AquaVita Las Olas (Roy & Eisinger) - Two Towers / 22 Units
AquaMar Las Olas (Roy & Eisinger) - Three Towers / 20 Units
AquaVue Las Olas (Roy & Eisinger) - 8 Units
321 at Water’s Edge (Sobelco) - 23 Units
100 Las Olas (Kolter Group) - 113 Units
ICON Las Olas (Related) - 272 Units
W Residences Fort Lauderdale (Related Companies) - 171 Units
Gale Hotel & Residences Fort Lauderdale (Neward Development & Menin Hospitality) - 129 Units
Adagio Fort Lauderdale (ALCO Group International) - 31 Units
1
2
3
6
5
4
10
7
8
9
1 7
8 10
125
3 4 6
9
11
2
40
MIAMI REPORT 2018 MIAMI REPORT 2018

On the GroundEXPERT INSIGHTS ON THE SOUTH FLORIDA REAL ESTATE LANDSCAPE
Alex VidalPresidentRelatedISG International Realty
Q: You’ve interviewed quite a few leaders from various industries through your Inquiring Minds Want to Know series. What would you say is the common thread between these leaders?
A: Through these interviews, all of which are very unique and interesting, I’ve found that there is a common denominator among these leaders. Every one of them has a plan in place; nothing they’ve achieved has happened out of coincidence. They are always planning, evaluating and re-evaluating as they go. They treat risks as opportunities, and look for a way to maximize them. In terms of habits, they all share the practice of preparing for and reviewing their schedules for the day ahead. This exercise ensures that they are tackling specific items that get them closer to their goal each and every day. Another commonality amongst these leaders is the main driver behind why they do what they do. Across the board, they’ve expressed that they are motivated, not by financial success or status, but by an internal passion for what they do and by the goal of inspiring and growing the great people they work with.
Q: What are you seeing in terms of residential real estate inventory in Fort Lauderdale?
A: There are two main categories of inventory, residences that are “for rent” and residences that are “for sale.” South Florida real estate is experiencing a very active rental market, both for single-family homes as well as for condos. The growing population is causing very low vacancies and steadily climbing rental rates across Miami-Dade, Broward, and Palm Beach counties.
The “for sale” market is beginning to see shrinking single-family home inventory in all 3 counties. Well-priced houses naturally sell quickly, however, prices are climbing in this sector as inventory continues to sell. Condo inven-tory offers a bigger selection compared to single-family homes. We are seeing well-priced condos selling fast, especially in coastal neighborhoods. Most developers have priced condos very competitively, and I see 2019 being a year with great buying opportunities for condos.
Q: What reasons do you give clients for why they should invest in Fort Lauderdale?
A: Miami real estate has been a hot investment for quite some time, and data shows that Fort Lauderdale is right on Miami’s heels. The amount of new development taking place in Fort Lauderdale, on the beach and in downtown, is incredible. From all of the new residential projects, to F.A.T. Village, to Brightline, if you’re an investor or a young professional looking for that live, work, play lifestyle, Fort Lauderdale is now a serious consideration. On the beach, we’re seeing high-net-worth individuals purchasing at luxury oceanfront condos like Auberge, Four Seasons and the W. Fort Lauderdale has become a choice location for buyers who realize the value of oceanfront property on Fort Lauderdale Beach, especially compared to Miami Beach and Palm Beach.
42

HEADQUARTERSInternational Sales Group, LLCTurnberry Plaza2875 Northeast 191st Street • 2nd FloorAventura, FL 33180305.931.6511 | isgworld.com
LOCAL OFFICESAventura | Brickell | Coral Gables | Edgewater | Fort Lauderdale | Weston