Embed Size (px)
Citation preview
FORSKNING/STUDIE
Droughts and wildfires in Sweden
past variation and future projection

2
Faktaruta
Torka och skogsbränder i Sverige: Tidigare variation och framtida projektion
2015-2017
Göteborgs Universitet
Tinghai Ou
Projektet har gett inblick i den historiska variationen av brandfrekvens och brunnen yta i samband med skogsbrand. Sambanden mellan torrperioder, brandfrekvens och brunnen areal har också studerat samt framtida förändringar i torra perioder och brandrisk.
MSB:s kontaktpersoner:
Ulrika Postgård, 010-240 50 33
Foto: Leif Sandahl, MSB
Publikationsnummer MSB1112 – June 2017
ISBN 978-91-7383-757-6
MSB har beställt och finansierat genomförandet av denna forskningsrapport. Författaren är ensam
ansvarig för rapportens innehåll.

3
Foreword
This report provides a summary of a two-year (2015.5-2017.4) research project
funded by the Swedish Civil Contingencies Agency (Myndigheten för
samhällsskydd och beredskap: MSB). Wildfires in Sweden are not common or
widespread, but the wildfires can be severe. The wildfires in Sweden are largely
influenced by human activities, but changes in the climate, i.e. the drought
condition, can also affect the fire activities and the fire size (burnt area of a
fire). The idea of this project is to support municipalities and county
administrative boards in the ongoing climate adaptation work, in relation to
the changes in the drought condition and fire activities. Historical changes in
the fire frequency and burnt area, and the role played by the drought condition
on the changes, are investigated. Future projection of the drought condition
and related fire activities is also explored in this project. I hope that the results
of this project can provide useful methods and new knowledge in supporting of
climate change adaptation.
The report has been developed based on the work conducted at the University
of Gothenburg during the past two years. Deliang Chen from the University of
Gothenburg and Veiko Lehsten from the Lund University have participated in
the project's reference group and have contributed to the development of the
project. Mikael Malmqvist from MSB has prepared the project the daily fire
records for entire Sweden during the period 1998-2014. The project has
received help and support from Åsa Fritzon, Bodil Lundberg and Björn Kerlin
from MSB. Ulrika Postgård from MSB has provided much advice for
implementation and reporting. I would like to thank all of you.
Finally, I would like to express my special thanks to Deliang Chen who has
provided many good suggestions on the project work.
Tinghai Ou
Project leader
Gothenburg, May 2017

4
Contents
Foreword .................................................................................... 3
Contents ..................................................................................... 4
Summary .................................................................................... 5
1. Introduction ........................................................................... 6
1.1 Background ......................................................................... 6
1.2 Purpose and objective ........................................................... 7
2. Historical variation of forest fires in Sweden .......................... 8
2.1 Historical records of forest fires .............................................. 8
2.2 Statistics of historical forest fires ............................................ 8
2.2.1 Statistics of whole Sweden ..................................................................... 8
2.2.2 Statistics for three regions of Sweden ................................................... 9
2.3 Human effects on forest fires ............................................... 11
3. Droughts and forest fires in Sweden ..................................... 13
3.1 Definition of droughts ......................................................... 13
3.2 Link between droughts and forest fires .................................. 13
3.2.1 Weather and fire ................................................................................... 13
3.2.2 Long-term drought condition and forest fires burnt area ................. 14
3.3 Projected change of drought in Sweden and forest fire risk ...... 17
4. Conclusions .......................................................................... 19

5
Summary
The fire risk is expected to increase with the increase in the temperature. The
overall objective of the project is to improve our understanding of the past
changes in droughts and wildfires and to develop a set of future scenarios for
droughts and wildfires in Sweden. Wildfires in Sweden are strongly affected by
climate and weather condition, and human activities. A large part of the fires is
ignited by human activities, and only about 7% of the fires are ignited by
lightning. Changes in the human activities have impacts on the fire activities,
weekend activities in the non-summer season which have led to more fires in
the weekend compare to that during the working days. However, the weekly
cycle cannot be found in the summer season. Human activities also influence
the fire size. There have been more fires with fire size less than 0.1ha since the
1960s.
Both drought condition on a daily scale, associated with fire weather, and on
seasonal to annual scale has effects on the fire frequency. Severe drought year
is generally associated with a large annual burnt area. In a historical aspect,
there are few years with severe drought condition in Sweden during the past
few decades, but the mean condition is not that severe compare to the severe
period around the 1970s over the past 80 years.
Drought condition in northern of Sweden is projected to be less severe with low
fire risk of a large annual burnt area, but there could be few years with severe
drought condition with high fire risk. The drought condition in the southern
Sweden could be severe with more severe drought years, especially in the end
of 21 century.
Finally, short-term drought, with a dry condition in the upper layer of the
forest, is enough for a fire to be ignited and possibly spread with proper
weather condition. There could be large area burnt even if the projected long-
term drought is not severe. A monitoring system as well as an assessing system,
which could provide a potential fire size, is needed for rescue agency. The
information can help to decide how much and what kind of efforts is needed to
control the fires.
6
1. Introduction
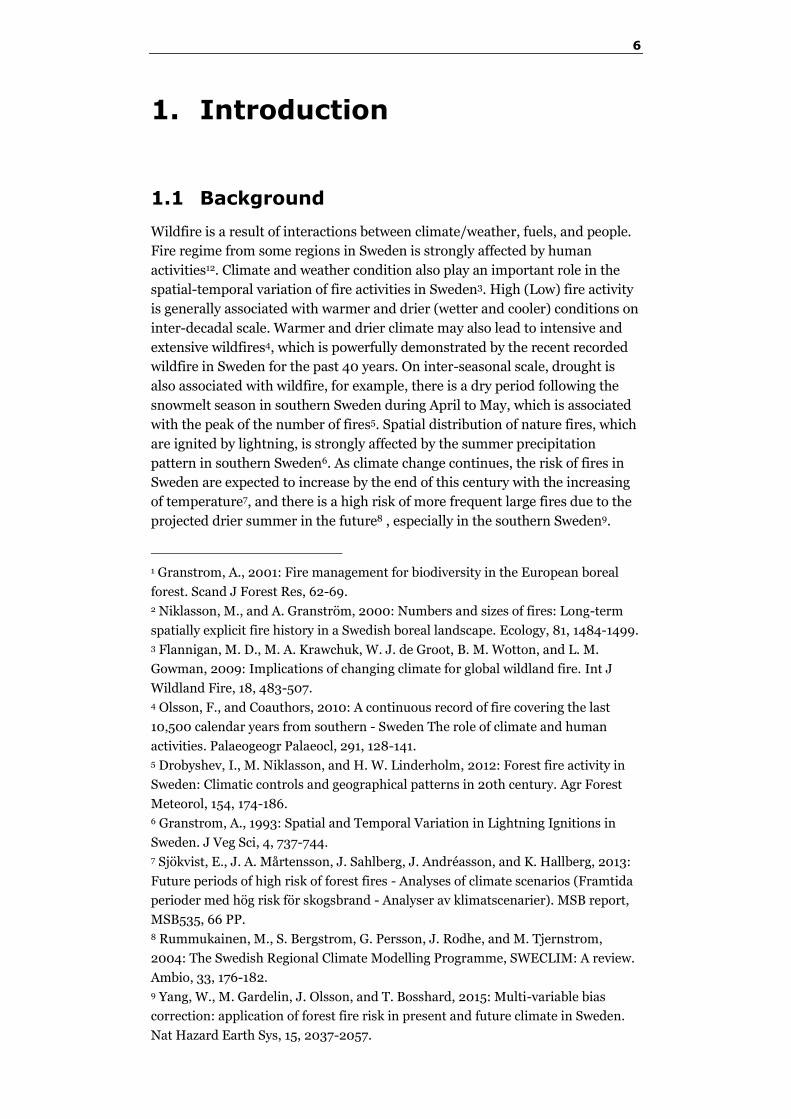
1.1 Background
Wildfire is a result of interactions between climate/weather, fuels, and people.
Fire regime from some regions in Sweden is strongly affected by human
activities12. Climate and weather condition also play an important role in the
spatial-temporal variation of fire activities in Sweden3. High (Low) fire activity
is generally associated with warmer and drier (wetter and cooler) conditions on
inter-decadal scale. Warmer and drier climate may also lead to intensive and
extensive wildfires4, which is powerfully demonstrated by the recent recorded
wildfire in Sweden for the past 40 years. On inter-seasonal scale, drought is
also associated with wildfire, for example, there is a dry period following the
snowmelt season in southern Sweden during April to May, which is associated
with the peak of the number of fires5. Spatial distribution of nature fires, which
are ignited by lightning, is strongly affected by the summer precipitation
pattern in southern Sweden6. As climate change continues, the risk of fires in
Sweden are expected to increase by the end of this century with the increasing
of temperature7, and there is a high risk of more frequent large fires due to the
projected drier summer in the future8 , especially in the southern Sweden9.
1 Granstrom, A., 2001: Fire management for biodiversity in the European boreal
forest. Scand J Forest Res, 62-69. 2 Niklasson, M., and A. Granström, 2000: Numbers and sizes of fires: Long-term
spatially explicit fire history in a Swedish boreal landscape. Ecology, 81, 1484-1499. 3 Flannigan, M. D., M. A. Krawchuk, W. J. de Groot, B. M. Wotton, and L. M.
Gowman, 2009: Implications of changing climate for global wildland fire. Int J
Wildland Fire, 18, 483-507. 4 Olsson, F., and Coauthors, 2010: A continuous record of fire covering the last
10,500 calendar years from southern - Sweden The role of climate and human
activities. Palaeogeogr Palaeocl, 291, 128-141. 5 Drobyshev, I., M. Niklasson, and H. W. Linderholm, 2012: Forest fire activity in
Sweden: Climatic controls and geographical patterns in 20th century. Agr Forest
Meteorol, 154, 174-186. 6 Granstrom, A., 1993: Spatial and Temporal Variation in Lightning Ignitions in
Sweden. J Veg Sci, 4, 737-744. 7 Sjökvist, E., J. A. Mårtensson, J. Sahlberg, J. Andréasson, and K. Hallberg, 2013:
Future periods of high risk of forest fires - Analyses of climate scenarios (Framtida
perioder med hög risk för skogsbrand - Analyser av klimatscenarier). MSB report,
MSB535, 66 PP. 8 Rummukainen, M., S. Bergstrom, G. Persson, J. Rodhe, and M. Tjernstrom,
2004: The Swedish Regional Climate Modelling Programme, SWECLIM: A review.
Ambio, 33, 176-182. 9 Yang, W., M. Gardelin, J. Olsson, and T. Bosshard, 2015: Multi-variable bias
correction: application of forest fire risk in present and future climate in Sweden.
Nat Hazard Earth Sys, 15, 2037-2057.

7
In general, wildfires are not common or widespread in Sweden. Based on
interviews and a survey of literature, Leandersson and Lillienberg (2011)10
pointed out that the preparedness for future fire risk in Sweden today is
insufficient to handle larger wildland fires. For example, the severe wildfire in
Västmanland, Sweden, which broke out on the afternoon of 31 July 2014,
affected over 15,000 hectares; over one thousand people were forced to
evacuate from their homes and one man was confirmed to be killed by the fire11.
A better understanding of the past changes in fires and droughts and their
linkages, as well as early information about the droughts and fires in the future,
would benefit the government policy maker, rescue agency and local resident.
This postdoctoral project, Droughts and wildfires in Sweden: past variation and
future projection, started in May 2015, and has last for two years. The overall
aim of this project is to improve our understanding of the past changes in
droughts and wildfires and to develop a set of future scenarios for droughts and
fires in Sweden. Statistics of historic fire records in Sweden will be presented in
Chapter 2. Chapter 3 will show the historical link between drought and wildfire
and their future projection.
1.2 Purpose and objective
This project aims to study the variations of wildfires and droughts in Sweden
since 1944. The possible relationship between the two will be identified using
historic data, which would increase our understanding of the statistics of the
past fires and droughts, as well as the role played by the drought in
determining the fire statistics. This knowledge will then be used to explore the
future droughts projected by global climate models used by IPCC Fifth
Assessment Report (AR5) as well as the fire risk, which provides useful
information to national agencies and local governments in Sweden in their
planning relating to droughts and fires.
The primary objective of the project is to improve our understanding of the
past changes in droughts and fires and to develop a set of future scenarios for
droughts and fires in Sweden. This includes: selecting one drought index which
is best suited for fire related drought study in Sweden; analyzing the historic
variation of droughts and fires; understanding the relationship between the
droughts and fires; obtaining the information of the future change in the
regional climate from global climate models; projecting future change in
droughts and fires. Based on this set of information and associated methods
and datasets, we will provide support to government policy maker in
developing relevant protection and adaptation strategies.
10 Leandersson, A., and D. Lillienberg, 2011: Nationell beredskap mot skogsbränder
vid eventuellt förändrat klimat, Lunds tekniska högskola and Lunds universitet,
Report 5371. 11 Source from
http://en.wikipedia.org/wiki/2014_V%C3%A4stmanland_wildfire#cite_note-
OneKilled-3

8
2. Historical variation of forest
fires in Sweden
2.1 Historical records of forest fires
Annual frequency and burnt area of forest fire during the period 1944-1979 are
extracted from the Statistical Yearbook of Swedish Forest Agency12. Annual fire
frequency and burnt area of each county, with causes, are available during the
period 1944-1969. Fire frequency with burnt area less than 0.1 hectare (ha) is
also available during 1944-1975. From 1998 to 2014, daily fire record has been
archived by the Swedish Civil Contingencies Agency13. Even if there are
wildfires other than forest fires recorded in the daily fire records during the
period 1998-2014, however, there are only forest fire records available during
the period 1944-1979. Only forest fires are examined in this project in order to
compare the statistics of fires for the two different periods.
2.2 Statistics of historical forest fires
2.2.1 Statistics of whole Sweden
The cause of a fire is very difficult to detect. The causes of a large part of the
historical fire records cannot be detected, for example, 41% and 34% of the
causes of the fires are unknown for the period 1998-2014 and 1957-1969
respectively (Fig. 1). Among all the recorded fires, nature fire (ignited by
lightning) is only about 7% for both periods 1998-2014 and 1957-1969. During
the two periods, the cause categories of the fires are similar, which can be
compared.
Figure 1. Causes of the fires for the period a) 1998-2014 and b) 1957-1969
The frequency (burnt area) of total fires is highly correlated with the frequency
(burnt area) of fires ignited by lightning. The correlation coefficient between
12 Skogsstyrelsen: Skogsstatistisk årsbok
(http://www.skogsstyrelsen.se/Myndigheten/Statistik/Skogsstatistisk-
Arsbok/Skogsstatistiska-arsbocker/) 13 Myndigheten för samhällsskydd och beredskap, MSB (https://www.msb.se/)

9
the frequency of the total and the lightning ignited fires is 0.77 during the
period 1944-2014. During the same time period, the correlation coefficient is
0.71 between burnt area of total and lightning ignited fires (see Fig. 2). The fire
frequency is also highly correlated to the burnt area. The correlation coefficient
is 0.60 for all the fires and 0.82 for lightning ignited fires during the period
1944-2014 (missing data has been excluded).
Figure 2. Annual variation the frequency and burnt area of forest fires for
whole Sweden during the period 1944-2014
2.2.2 Statistics for three regions of Sweden
There is a distinct geographical pattern in the fire frequency of the forest fires
as shown in Figure 3. Most of the fires have been ignited over the southern part
of Sweden. A large part of the nature fires, ignited by lightning, locate over the
Southeast of Sweden similar to the results in the earlier period 1953-1975,
which is affected by the spatial pattern of available water (the difference
between precipitation and evapotranspiration)14. In the present work, fire
statistics of the traditional three regions of Sweden, Norrland, Svealand, and
Götaland, are used to assess the regional characteristic of the fires in Sweden.
Norrland is the northernmost region that consists of five counties. Svealand is
the historical core region of Sweden that consists of seven counties. Götaland is
the southernmost region that consists of nine counties.
Figure 3. Spatial distribution of fire frequency for 21 counties of Sweden during
1998-2014 for all fires (lightning ignited excluded) (left) and the fires ignited by
lightning only (right)
14 Granstrom, A., 1993: Spatial and Temporal Variation in Lightning Ignitions in
Sweden. J Veg Sci, 4, 737-744.
1950 1960 1970 1980 1990 2000 2010Year
0
2000
4000
6000
8000
To
tal
0
200
400
600
800
Lig
htn
ing
Total
Ignited by lightning
1950 1960 1970 1980 1990 2000 2010Year
0
3000
6000
9000
12000
15000
To
tal
0
1000
2000
3000
4000
Lig
htn
ing
a) Fire frequency b) Burnt area
10
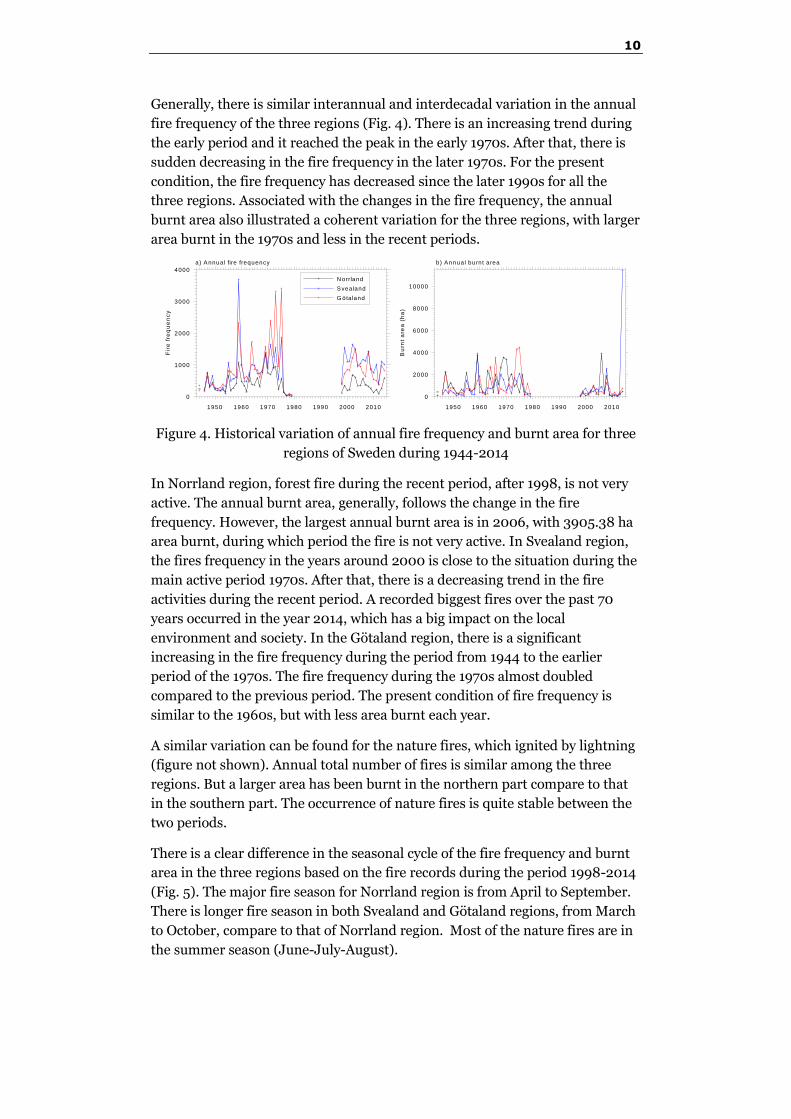
Generally, there is similar interannual and interdecadal variation in the annual
fire frequency of the three regions (Fig. 4). There is an increasing trend during
the early period and it reached the peak in the early 1970s. After that, there is
sudden decreasing in the fire frequency in the later 1970s. For the present
condition, the fire frequency has decreased since the later 1990s for all the
three regions. Associated with the changes in the fire frequency, the annual
burnt area also illustrated a coherent variation for the three regions, with larger
area burnt in the 1970s and less in the recent periods.
Figure 4. Historical variation of annual fire frequency and burnt area for three
regions of Sweden during 1944-2014
In Norrland region, forest fire during the recent period, after 1998, is not very
active. The annual burnt area, generally, follows the change in the fire
frequency. However, the largest annual burnt area is in 2006, with 3905.38 ha
area burnt, during which period the fire is not very active. In Svealand region,
the fires frequency in the years around 2000 is close to the situation during the
main active period 1970s. After that, there is a decreasing trend in the fire
activities during the recent period. A recorded biggest fires over the past 70
years occurred in the year 2014, which has a big impact on the local
environment and society. In the Götaland region, there is a significant
increasing in the fire frequency during the period from 1944 to the earlier
period of the 1970s. The fire frequency during the 1970s almost doubled
compared to the previous period. The present condition of fire frequency is
similar to the 1960s, but with less area burnt each year.
A similar variation can be found for the nature fires, which ignited by lightning
(figure not shown). Annual total number of fires is similar among the three
regions. But a larger area has been burnt in the northern part compare to that
in the southern part. The occurrence of nature fires is quite stable between the
two periods.
There is a clear difference in the seasonal cycle of the fire frequency and burnt
area in the three regions based on the fire records during the period 1998-2014
(Fig. 5). The major fire season for Norrland region is from April to September.
There is longer fire season in both Svealand and Götaland regions, from March
to October, compare to that of Norrland region. Most of the nature fires are in
the summer season (June-July-August).
1950 1960 1970 1980 1990 2000 2010
0
1000
2000
3000
4000
Fir
e f
req
ue
nc
y
N orrland
Svealand
G ötaland
1950 1960 1970 1980 1990 2000 2010
0
2000
4000
6000
8000
10000
Bu
rnt
are
a (
ha
)
a ) Annual fire frequency b) Annual burnt area

11
Figure 5. Seasonal variation of fire frequency for three regions of Sweden based
on fires records during 1998-2014
For Norrland region, most of the area has been burnt between May and August
(Fig. 6). The annual total burnt area is highly correlated with the area burnt in
summer (June-July-August, in Table 1), which indicates that the importance in
the summer burning to the total burnt area in this region. Similar results can be
found for the Svealand region. The summer season will be a focus later for the
two regions when we study the link between drought condition and fire burnt
area. There is a long fire season for the Götaland region. Both spring and
summer seasons are important when investigation the annual total burnt area
of Götaland region. The burnt area from April to August can explain the most
variation of the annual total burnt area in the Götaland region, which period
will be a focus for later analysis.
Figure 6. Same as Figure 5, but for burnt area
Table 1. Correlation coefficient between seasonal burnt area and annual total
burnt area during 1998-2014 for three regions of Sweden
Name All fires Nature fires
MAM JJA MJJA AMJJA MAM JJA MJJA AMJJA
Norrland 0.35 0.94 1.00 1.00 -0.12 1.00 1.00 1.00
Svealand -0.04 1.00 1.00 1.00 0.01 0.98 1.00 1.00
Götaland 0.57 0.76 0.75 0.99 0.01 1.00 1.00 1.00
2.3 Human effects on forest fires
Changes in the human activities will affect the fire frequency in Sweden since
most of the fires are ignited by human activities. On the interannual and
interdecadal scale, there is a sharp increasing in the percentage of small fires,
fires with burnt area less than 0.1 ha, in the 1950s for all the three regions (Fig.
1 2 3 4 5 6 7 8 9 10 11 12
0
100
200
300
400
500
600
Fir
e f
req
ue
nc
y
1 2 3 4 5 6 7 8 9 10 11 12
0
1000
2000
3000
4000
Fir
e f
req
ue
nc
y
N orrland
Svealand
G ötaland
a) A ll fires b) L ightn ing ign ited fires
1 2 3 4 5 6 7 8 9 10 11 12
0
200
400
600
800
Bu
rnt
are
a (
ha
)
1 2 3 4 5 6 7 8 9 10 11 12
0
4000
8000
12000
Bu
rnt
are
a (
ha
)
N orrland
Svealand
G öta land
a) A ll fires b) L ightn ing ign ited fires

12
7). The situation during the 1960s and early 1970s is similar to the present
condition during which period the percentage of small fires is around 80% for
Svealand and Götaland and 70% for the Norrland, which is almost doubled
compared to the condition during the 1940s and early 1950s. This indicates
that there is a strong effect of human actives on the burnt area of the fires
under current condition.
Figure 7. Percentage of the number of fires with fire size less than 0.1ha to the
total number of fires for three regions of Sweden during 1946-2014
On the weekly scale, a clear increasing in the fire frequency during weekends
can also be found in the fire records during 1998-2014 (Fig. 8). The weekly
cycle of fires in Sweden has a clear seasonal variation. No weekend effects on
the fire frequency can be found in the summer season (June-July-August), with
a slightly higher frequency of fires in the working week than in the weekend.
However, there are more fires in the weekend days compare to the working
days in the non-summer season. The results are reasonable which indicate a
change in the human activities between summer and non-summer season.
During the non-summer season, people tends to stay outside in the weekend,
for example, there are more fires ignited by landscaped with intent, children
play with fire and burning of grass in the weekend. However, people use to take
their vacation at home and children are also out of school during the summer
season, during which period no weekend effects are found. One special case is
fire ignited by grilling and campfire, in which there are weekend effects both in
summer and non-summer season. The weekend effect is not found for the
burnt area, which indicates that there are some other factors which control the
fire size.
Figure 8. Weekly variation of fire frequency and burnt area for whole Sweden
during 1998-2014
1950 1960 1970 1980 1990 2000 2010
20
30
40
50
60
70
80
90
Pe
rce
nta
ge
(%
)
Norrland
Svealand
Götaland
Sunday
Monday
Tuesday
Wednesday
ThursdayFrid
ay
Saturday
2100
2400
2700
3000
3300
3600
3900
Fire
fre
que
ncy
Non-Summer season
Summer season
Sunday
Monday
Tuesday
Wednesday
ThursdayFrid
ay
Saturday
0
4000
8000
12000
16000
Bu
rnt
Are
a (
ha)
13
3. Droughts and forest fires in
Sweden
3.1 Definition of droughts
Drought refers to a temporary decline in water availability, due mainly to
changes in hydro-climatological variables such as precipitation and
temperature15, e.g. rainfall deficiency. Drought is a gradually developing event,
so a precise determination of its onset and end is difficult. Dracup et al.
(1980)16 and Wilhite and Glantz (1985)17 present different definitions of
drought. According to its impact in a particular sector, drought can be classified
as meteorological, hydrological, agricultural or socio-economic18. The most
common type, meteorological drought, is defined as a natural water shortage
resulting from a decrease in the amount of precipitation during a prolonged
period, such as a season or a year19.
3.2 Link between droughts and forest fires
3.2.1 Weather and fire
3.2.1.1 Fire Weather Index (FWI) system
Canadian Forest Fire Weather Index (FWI) System has been widely used in the
world and in Sweden to examine the effects of fuel moisture and wind on fire
behavior. The FWI system has six components20. The Fine Fuel Moisture Code
(FFMC) is a numeric rating of the moisture content of litter and other cured
fine fuels from 0 to 1.2 cm depth in the forest floor, which plays a significant
role in ignition probability and spread. The Duff Moisture Code (DMC) is a
numerical rating of the average moisture content of loosely compacted organic
layers from 1.2 to 7 cm depth in the forest floor, which contributes to lightning
receptivity and over all fire intensity. The Drought Code (DC) is a numerical
rating of the average moisture content of deep, compact, organic layers below
7cm depth in the forest floor, which contributes to the depth of burn, intensity,
and suppression difficulty. Three fire indices have been constructed based on
15 Kundzewicz, Z. W., 2009: Adaptation to floods and droughts in the Baltic Sea
basin under climate change. Boreal Environ Res, 14, 193-203. 16 Dracup, J. A., K. S. Lee, and E. G. Paulson, 1980: On the Definition of Droughts.
Water Resour Res, 16, 297-302. 17 Wilhite, D., and M. Glantz, 1985: Understanding: the Drought Phenomenon: The
Role of Definitions. Water Int, 10, 111-120. 18 Gathara, S., L. G. Gringof, E. Mersha, K. C. Sinha Ray, and P. Spasov, 2006:
Impacts of desertification and drought and of other extreme meteorological events.
CAgM Report No. 101, WMO/TD No. 1343, Geneva, Switzerland, 85 pp. 19 Mishra, A. K., and V. P. Singh, 2010: A review of drought concepts. J Hydrol,
391, 204-216. 20 Canadian Wildland Fire Information System, http://cwfis.cfs.nrcan.gc.ca/

14
the three indices and wind speed, namely Initial Spread Index (ISI), Build-Up
Index (BUI) and Fire Weather Index (FWI). The ISI is a numeric rating of the
expected rate of fire spread. The BUI is a numeric rating of the total amount of
fuel available for combustion. The FWI is a numeric rating of fire intensity.
3.2.1.2 Link between mean FWI and fire frequency
Gridded FWI from the Global Fire WEather Database (GFWED) (available
from http://data.giss.nasa.gov/impacts/gfwed/)21 is utilized. Monthly mean
FWI and the temperature (T2m), relative humidity (RH), wind speed
(WindSpd) at local time 12:00 and 24-hour rainfall (Precip) are averaged for
each county. The correlation coefficient between the monthly time series of the
selected indices and the fire frequency is calculated for each county during the
period 1998-2014. Results are shown in Figure 9. The fire frequency is
negatively correlated with Precip and RH, and is positively correlated with
T2m. WindSpd is not important for the statistic of fire frequency. Among the
three fuel moisture codes, DMC is higher correlated with the fire frequency
compare to the other two. This indicates the importance of moisture content in
the upper forest layer (above 7 cm) for fire ignition.
Figure 9. Correlation coefficient between the fire frequency and indices for the
21 counties
3.2.2 Long-term drought condition and forest fires burnt
area
In the present work, three different drought indices are assessed against the
fire statistics. They are the Self-calibrating Palmer Drought Severity Index
(scPDSI)22, the Standardised Precipitation Index (SPI)23, and the Standardised
Precipitation-Evapotranspiration Index (SPEI)24 indices. Only the scPDSI
index is calculated with fixed temporal scale (between 9 and 12 months) due to
which the values of the index can be affected by the condition up to four years
21 Field, R. D., and Coauthors, 2015: Development of a Global Fire Weather
Database. Nat Hazard Earth Sys, 15, 1407-1423. 22 Wells, N., Goddard, S. and Hayes, M. J., 2004: A Self-Calibrating Palmer
Drought Severity Index, J. Climate 17, 2335-2351. 23 Guttman, N. B., 1999: Accepting the Standardized Precipitation Index: A
calculation algorithm. J. Amer. Water Resour. Assoc., 35(2), 311-322. 24 Vicente-Serrano S.M., Santiago Beguería, Juan I. López-Moreno, (2010) A Multi-
scalar drought index sensitive to global warming: The Standardized Precipitation
Evapotranspiration Index – SPEI. Journal of Climate 23: 1696-1718.
-0.8
-0.4
0
0.4
0.8
Co
rre
latio
n c
oe
ffic
ien
t
Pre
cip
RH
T2m
Win
dS
pd
BU
I
DC
DM
C
FFM
C ISI
FW
I
DS
R
-0.8
-0.4
0
0.4
0.8
Co
rre
latio
n c
oe
ffic
ient
Pre
cip
RH
T2m
Win
dS
pd
BU
I
DC
DM
C
FFM
C ISI
FW
I
DS
R
Non lightning ignition (March - October) Lightning ignition (May - September)

15
in the past25. Both the SPI and SPEI indices can be calculated on different time
since drought is a multi-scalar phenomenon. The SPI index is based on
monthly precipitation only, while both precipitation and temperature
(evapotranspiration) is considered in the SPEI index. The scPDSI index is
calculated based on the 0.5 x 0.5 degree (longitude x latitude) resolution
Climatic Research Unit (CRU)26 data TS3.2527 during the period 1901-2015.
The SPI and SPEI indices are calculated based on the CRU TS3.2428 which is
similar to the version TS 3.25.
The link between the annual burnt area and the drought indices on different
scales is examined for the 21 counties for two time periods (Fig. 10). Generally,
the link between scPDSI and the annual burnt area is lower compared to that of
SPI and SPEI indices with temporal scale smaller than 9 months, which
indicates that the importance of short scale drought condition on the burnt
area in Sweden. This is due to that the scPDSI has fixed temporal scale
(between 9 and 12 months). The correlation coefficient between annual burnt
area and SPEI is generally higher than that with SPI. For this case, SPEI index
is one good candidate when monitoring the fire related drought condition on
the monthly and seasonal scale for the Swedish counties.
Figure 10. Box plots show the correlation coefficient between different drought
indices for April-August and annual burnt area for 21 counties a) 1946-1979
and b) 1998-2014 (scPDSI, SPI1m and SPEI1m is calculated for the mean from
April to August, value for the other multi-scale SPI and SPEI indices is
retrieved on August, for example SPEI3m indicates the 3 month scale SPEI
index on August which cover the drought condition from June to August)
As discussed before that the burnt area in June-July-August covers the most
information of the interannual and interdecadal variation of annual burnt are
for Norrland and Svealand. There is longer fire season for Götaland than the
other two regions when looking at the burnt area, information from April to
25 Guttman, N.B., 1998: Comparing the Palmer drought index and the Standardized
Precipitation Index. Journal of the American Water Resources Association 34, 113-
121. 26 http://www.cru.uea.ac.uk/ 27 van der Schrier G, Barichivich J, Briffa KR and Jones PD (2013) A scPDSI-based
global data set of dry and wet spells for 1901-2009. J. Geophys. Res. Atmos. 118,
4025-4048 28 Harris, I., Jones, P.D., Osborn, T.J. and Lister, D.H., 2014: Updated high-
resolution grids of monthly climatic observations – the CRU TS3.10 Dataset. Int. J.
Climatol., 34: 623-642.
-0.8
-0.4
0
0.4
scPDSI
SPI1
m
SPEI1
m
SPI2
m
SPEI2
m
SPI3
m
SPEI3
m
SPI4
m
SPEI4
m
SPI5
m
SPEI5
m
SPI6
m
SPEI6
m
SPI9
m
SPEI9
m
SPI1
2m
SPEI1
2m
SPI1
8m
SPEI1
8m
-0.8
-0.4
0
0.4
scPDSI
SPI1
m
SPEI1
m
SPI2
m
SPEI2
m
SPI3
m
SPEI3
m
SPI4
m
SPEI4
m
SPI5
m
SPEI5
m
SPI6
m
SPEI6
m
SPI9
m
SPEI9
m
SPI1
2m
SPEI1
2m
SPI1
8m
SPEI1
8m
a) 1946-1979 b) 1998-2014

16
August is required. Then the year with the annual burnt area available is
selected and the linkage between the annual burnt area and mean SPEI index is
illustrated in Figure 11. The annual burnt area for all fires and the lightning
ignited only fires are assessed separately. There is an exponential linkage
between annual burnt area and the mean SPEI index. The results are consistent
between two periods, 1946-1979 and 1998-2014. The year tends to have a large
burnt area when the mean SPEI index below some kind of threshold. The
threshold can be determined with a given value of the burnt area based on the
fitted exponential function. In this work, the year with the annual burnt area
larger than 1000ha is regarded as a year with severe fires for the three regions.
Then the threshold of the regional mean SPEI index linked with a large burnt
area can be retrieved. The annual burnt area tends to be larger than 1000ha
when the regional mean SPEI index during summer is less than -0.459 for
Norrland. The annual burnt area tends to be larger than 1000ha when the
mean SPEI index from April to August is less than -0.377. The threshold of
1000ha burnt area for Svealand is -0.817 for regional mean SPEI index during
summer. But there are years with large burnt areas which is associated with
mean SPEI index bigger than -0.817. The threshold could be too strong for the
Svealand region. For this case, similar thresholds of regional mean summer
mean SPEI (-0.459) as for the Norrland region is chosen for Svealand to
illustrate the years with severe drought, which has potential with a large area to
be burnt.
Figure 11. Link between seasonal mean SPEI indices and burnt area for all fires
(upper) and lightning ignited fires (lower) of three regions of Sweden (June-
August for Norrland and Svealand, and April-August for Götaland) (Fitted by
Exponential function)
-1.5 -1 -0.5 0 0.5 1 1.5SPEI (June - August)
0
1000
2000
3000
4000
An
nu
al b
urn
t a
rea
(h
a)
EFit: 1946-2014
EFit: 1946-1979
EFit: 1998-2014
-1.5 -1 -0.5 0 0.5 1 1.5SPEI (June - August)
0
4000
8000
12000
An
nu
al b
urn
t a
rea
(h
a)
-1.5 -1 -0.5 0 0.5 1 1.5SPEI (April - August)
0
1000
2000
3000
4000
5000
An
nu
al b
urn
t a
rea
(h
a)
-1.5 -1 -0.5 0 0.5 1 1.5SPEI (June - August)
0
400
800
1200
1600
An
nu
al b
urn
t a
rea
(h
a)
-1.5 -1 -0.5 0 0.5 1 1.5SPEI (June - August)
0
400
800
1200
1600
An
nu
al b
urn
t a
rea
(h
a)
-1.5 -1 -0.5 0 0.5 1 1.5SPEI (April - August)
0
100
200
300
400
500
An
nu
al b
urn
t a
rea
(h
a)
All
fire
sL
igh
tnin
g ign
ite
d
Norrland Svealand Gotaland
R2=0.40, 0.42, 0.60
R2=0.34, 0.35, 0.33R2=0.44, 0.37, 0.61
R2=0.37, 0.40, 0.53 R2=0.38, 0.41, 0.34 R2=0.31, 0.26, 0.41

17
3.3 Projected change of drought in Sweden
and forest fire risk
Based on the threshold of mean SPEI index, the year which tends to have large
burnt area can be selected. This can also be done for the future change in the
SPEI index to investigate the future change in the fire potential. For this
purpose, 8 global climate model (GCMs) which participated in the Coupled
Model Intercomparison Project Phase 5 (CMIP5)29 with both stabilization of
radiative forcing (RCP4.5)30 and comparatively high greenhouse gas emissions
(RCP8.5)31 available are selected. Information of the 8 GCMs can be found in
Table 2. Historical simulation and future projections during 1951-2100 are
downscaled to 44km horizontal resolution using the Rossby Centre regional
atmospheric model (RCA4)32. The horizontal resolution is close to the 0.5 x 0.5
degree (longitude x latitude) resolution which used to calculate the observed
drought indices. Mean SPEI index for from June to August (JJA) are calculated
for Norrland and Svealand regions, while the mean SPEI index from April to
August (AMJJA) is calculated for Götaland region.
Table 2. Information of global models used in the Regional Downscaling
Experiments by Rossby Centre regional atmospheric model (RCA4)
Modeling Center Model Atmosphere resolution
(longitude × latitude in degrees)
CCCma CanESM2 2.8125 × 2.7906
CNRM-CERFACS CNRM-CM5 1.4063 × 1.4008
CSIRO-QCCCE CSIRO-Mk3-6-0 1.8750 × 1.8653
IPSL IPSL-CM5A-MR 2.5000 × 1.2676
MIROC MIROC5 1.4063 × 1.4008
MPI-M MPI-ESM-LR 1.8750 × 1.8653
NCC NorESM1-M 2.5000 × 1.8947
NOAA-GFDL GFDL-ESM2M 2.5000 × 2.0225
The years with JJA SPEI are less than -0.459 are chosen, which indicate the
severe drought year, for Norrland and Svealand regions. Number of severe
drought years within a 31-year period is counted and the mean SPEI index of
the selected years is also calculated. Similar work has been done for Götaland,
but with AMJJA SPEI index less than -0.377. Results from both observation
and model simulation are illustrated in Figure 12. We can see that the historical
model simulation generally agrees with observation during the period 1951-
2010 for the regions, during which period number of the server drought years
decreased and the drought intensity of the selected years weakened for all the
29 Taylor, K. E., R. J. Stouffer, and G. A. Meehl, 2012: An Overview of CMIP5 and
the Experiment Design. B Am Meteorol Soc, 93, 485-498. 30 Thomson, A. M., and Coauthors, 2011: RCP4.5: a pathway for stabilization of
radiative forcing by 2100. Climatic Change, 109, 77-94. 31 Riahi, K., and Coauthors, 2011: RCP 8.5-A scenario of comparatively high
greenhouse gas emissions. Climatic Change, 109, 33-57. 32 https://www.smhi.se/en/research/research-departments/climate-research-
rossby-centre2-552/climate-scenario-data-from-the-rossby-centre-1.34020

18
three regions. The number of server drought years will continue decreasing till
the middle of 21 century for both RCP4.5 and RCP 8.5 projection. After that,
the number increases a little but still less than the peak period in the 1970s.
This agrees with the results of by Yang et al (2015)33, in which the number of
high fire risk days project to decrease in the northern part of Sweden. There is
no clear trend in the drought intensity of the selected year. There may be some
years with server drought condition at the end of 21 century under RCP4.5
projection, but there is large uncertainty between different models.
The number of server drought years in Svealand is projected to decrease under
the RCP4.5 scenario. The results from RCP8.5 is different with that under
RCP4.5, in which the number of severe drought years tends to increase until
the end of 21 century compare to the condition around 2020. Changes in the
intensity of selected years are similar between the two projections, with a
decrease from 1951 till the 2020s and then increase until the end of 21 century.
For Götaland, there is a large uncertainty in the projected changes in the
drought condition. The number of server drought years continuously decrease
from 1951 to the end of 21 century under RCP4.5 projection, with no clear
change in the intensity. But there is projected to be more server drought years
under RCP8.5 projection in the end of 21 century, with strengthened drought
intensity. This indicates that the fire risk might be high in the end of 21 century
under RCP8.5 projection.
Figure 12: Historical variation and projected change of the drought year
frequency for every 31 years and the mean SPEI of the selected drought years
for three regions of Sweden based on RCP4.5 and RCP8.5 scenarios during
1951-2100 (uncertainty included), results from observation are also included
33 Yang, W., M. Gardelin, J. Olsson, and T. Bosshard, 2015: Multi-variable bias
correction: application of forest fire risk in present and future climate in Sweden.
Nat Hazard Earth Sys, 15, 2037-2057.
1900 1940 1980 2020 2060 2100
2
4
6
8
10
1900 1940 1980 2020 2060 2100
2
4
6
8
10
12
Observation
His + RCP4.5 (±0.5SD)
His + RCP8.5 (±0.5SD)
1900 1940 1980 2020 2060 2100
0
4
8
12
16
1900 1940 1980 2020 2060 2100
-0.8
-0.75
-0.7
-0.65
-0.6
-0.55
-0.5
1900 1940 1980 2020 2060 2100
-0.9
-0.8
-0.7
-0.6
-0.5
1900 1940 1980 2020 2060 2100
-1.4
-1.2
-1
-0.8
-0.6
-0.4
a) Dry year frequency (Norrland)
c) Dry year frequency (Svealand)
e) Dry year frequency (Gotaland)
b) Mean SPEI of selected dry years (Norrland)
d) Mean SPEI of selected dry years (Svealand)
f) Mean SPEI of selected dry years (Gotaland)
19
4. Conclusions
The project has provided detailed insight into the historical variation in the fire
frequency and burnt area of forest fires in Sweden, as well as the link between
drought condition and forest fires frequency and burnt area. Projected changes
in the drought condition and fire risk have also been explored. The following
conclusions summarize the main results of the project:
There is longer fire season with higher fire frequency in the southern
part of Sweden compare to that in the northern part.
A large part of the fires in Sweden is ignited by human activities. Fire
frequency in Sweden is strongly affected by human activities on both
daily and seasonal to annual scale. Higher fire frequency is found
during the weekend for the non-summer season, but no weekly cycle
can be found in the summer season. On interannual to interdecadal
scale, the percentage of small fires, fire size less than 0.1 ha, has
increased since late 1950s which might be due to the impact of human
activities.
Both drought condition on the daily scale, associated with fire weather,
and on seasonal to annual scale has effects on the fire frequency.
SPEI index, in which both precipitation and temperature condition is
considered, is one good candidate when monitoring the fire related
drought condition on the monthly and seasonal scale for the Swedish
counties.
Severe drought years, indicated by strong negative SPEI index, are
generally associated with a large burnt area.
The drought condition for the past few decades in Sweden is not that
severe compared to the severe period around the 1970s over the past 80
years.
Drought condition in northern Sweden is projected to be less severe
with low fire risk of a large annual burnt area. While the drought
condition in the southern Sweden could be severe with more severe
drought years, especially in the end of 21 century.

20
Myndigheten för samhällsskydd och beredskap
651 81 Karlstad Tel 0771-240 240 www.msb.se
Publ.nr MSB1112 - June 2017 ISBN 978-91-7383-757-6