Embed Size (px)
Citation preview
A Forrester Total Economic Impacttrade Study Prepared For Oracle
Total Economic Impact of Oracle Real-Time Decisions Project Director Jonathan W Lipsitz
Contributors Paul Devine
July 2011
Forrester Consulting
Total Economic Impact Of Oracle Real-Time Decisions
TABLE OF CONTENTS Executive Summary 2
RTD Significantly Increases Revenue By Improving Closure Rates And Transaction Values 2
Factors Affecting Benefits And Costs 4
Disclosures 5
TEI Framework And Methodology 6
Analysis 7
Interview Highlights 7
Costs 9
Benefits 13
Flexibility18
Risk19
Financial Summary21
Oracle Real-Time Decisions Overview23
Appendix A Total Economic Impacttrade Overview 23
Appendix B Glossary24
Appendix C Supplemental Material25
Appendix D Endnotes25
copy 2011 Forrester Research Inc All rights reserved Unauthorized reproduction is strictly prohibited Information is based on best available resources Opinions reflect judgment at the time and are subject to change Forresterreg Technographicsreg Forrester Wave RoleView TechRadar and Total Economic Impact are trademarks of Forrester Research Inc All other trademarks are the property of their respective companies For additional information go to wwwforrestercom
About Forrester Consulting Forrester Consulting provides independent and objective research-based consulting to help leaders succeed in their organizations Ranging in scope from a short strategy session to custom projects Forresterrsquos Consulting services connect you directly with research analysts who apply expert insight to your specific business challenges For more information visit wwwforrestercomconsulting
Page 1
Forrester Consulting
Total Economic Impact Of Oracle Real-Time Decisions
Executive Summary
In April 2011 Oracle commissioned Forrester Consulting to examine the total economic impact and potential return on investment (ROI) enterprises may realize by deploying Oracle Real-Time Decisions (RTD) The RTD platform combines both rules and predictive analytics to power solutions for real-time enterprise decision management enabling real-time intelligence to be instilled into any type of business process or customer interaction The purpose of this study is to provide readers with a framework to evaluate the potential financial impact of RTD on their organizations
RTD Significantly Increases Revenue By Improving Closure Rates And Transaction Values Our interview with one existing RTD customer in the financial services industry and subsequent financial analysis found that the company experienced the risk-adjusted ROI costs and benefits shown in Table 1 The company has operations in all 50 states and more than 20000 employees It has completed several initiatives using RTD including
1 Shopping cart abandonment rate reduction mdash online and call center channels
2 Post abandonment follow-up email campaign
3 Optional program enrollment ie electronic funds transfer (EFT) paperless statements etc
4 Retention event identification and resolution strategies
The benefits and costs associated with the first two projects are included in the ROI analysis The company was unable to share metrics related to the latter two projects because they are considered trade secrets Therefore benefits associated with these two projects are not included in the ROI analysis but they are described in qualitative terms
Table 1 Three-Year Risk-Adjusted ROI1
ROI Payback period
Total benefits (PV)
Total costs (PV)
Net present value
986 3 Months $109819439 ($10107894) $99711545
Source Forrester Research Inc
bull Benefits The organization we interviewed is meticulous in defining test procedures to accurately identify and quantify the benefits derived from RTD as well as all other initiatives These procedures include using control groups and blind testing of hypotheses Following these procedures the company identified the following benefits
Page 2
Forrester Consulting
Total Economic Impact Of Oracle Real-Time Decisions
o Increased closure rate revenue The initial projectrsquos objective to reduce shopping cart abandonment resulted in approximately a one percentage point lift in the closure rate during the original sales cycle This equates to roughly $544 million in additional revenue over three years
o Incremental deal size revenue The initial project also looked at ways to increase the average financial services product price by suggesting additional options to the basic offering This increase applies to all new sales not just those attributable to the use of RTD and is additive to the increased closure rate benefit This results in more than $411 million over the life of the study
o Post cart abandonment follow-up campaign revenue The second project created personalized follow-up emails to potential customers who asked for a quote but did not buy (abandoned their cart) This resulted in approximately a one percentage point lift in the conversion rate compared with a control group consisting of a single static message This totals $564 million over three years
o Greater customer retention and lifetime value (non-quantified) Through a variety of RTD initiatives customer retention rates were improved This increases the total lifetime value for these customers and reduces the cost of finding new customers to replace the losses Due to confidentiality issues this information could not be provided by the interviewed customer
o Better business intelligence (non-quantified) RTD helped the organization learn more about its own value proposition and what motivates customersrsquo purchasing behaviors than could otherwise be learned This contributes to the process of continual improvement and identifying new profit maximizing opportunities
o Improved customer experiences (non-quantified) RTD shows what customers really want through observed behavior which is more accurate than relying on what customers say The result is greater customer satisfaction and the ability to better differentiate in the highly regulated financial services industry
bull Costs Some of the costs described in this study have been updated from what the interviewed organization actually paid to better reflect what a new customer can expect The objective is to provide readers with the latest information in order to best understand the potential financial impact to their organizations The company we interviewed experienced the following costs
o Internal implementation labor The customer followed a process similar to Oraclersquos Quick Start methodology for RTD implementations Each project lasted approximately six months mdash from inception through refinement in pilot The total labor costs for the two projects included in the ROI analysis are $260000
o Professional services The customer utilized a professional services company for assistance in implementing both RTD projects each lasting six months These costs should decrease with subsequent projects once the RTD infrastructure is established and in-house skills are developed Professional service fees for individual projects can range from $200000 to more than $400000 The study includes $600000 in professional service fees split between the two projects
o Hardware Servers are required for development testing and production For the projects included in the cost benefit analysis 16 blade servers were used This totals $320000 in purchase costs and maintenance
Page 3
Forrester Consulting
Total Economic Impact Of Oracle Real-Time Decisions
o RTD licenses and support RTD licenses can either be on a per-CPU basis or part of a Universal License Agreement (ULA) The licenses costs depicted in this study are based on the interviewed customerrsquos number of CPUs but applying current licensing costs License acquisition and support costs total more than $9 million over three years
o Ongoing campaign management labor Each RTD project is run by a campaign manager permanently assigned for the ongoing operation analysis and refinement of an RTD campaign This totaled $650000 over three years
Figure 1 Summary Financial Results Risk-Adjusted
$90000000
$70000000
$50000000
$30000000
$10000000
($10000000) ($3782100)
$10517896
$45570448
$99711545
Initial Year 1 Year 2 Year 3
Costs (PV) Benefits (PV) Cumulative cash flow (NPV)
Source Forrester Research Inc
Factors Affecting Benefits And Costs Table 1 illustrates the risk-adjusted financial results that were achieved by the organization The risk-adjusted values take into account any potential uncertainty or variance that exists in estimating the costs and benefits which produces more conservative estimates The following factors may affect the financial results that an organization may experience
bull Existing revenuessize of the organization In absolute terms organizations with greater existing total sales should see larger benefits from RTD This is because an equal percentage improvement from a large base is by definition greater than from a smaller base However smaller organizations should still expect to see ROIs broadly in alignment with the one shown in this study
Page 4
Forrester Consulting
Total Economic Impact Of Oracle Real-Time Decisions
bull Complexity of decisionsproblems RTD is addressing RTD is especially valuable in high involvement decision-making such as selecting financial service products While simpler tasks can also benefit from RTD the corresponding financial benefits may not be as high
bull Number of projects utilizing RTD The interviewed customer is using RTD in many scenarios and is always looking for new areas to use RTD for improving financial results Each new project brings a whole set of benefits that improves the overall ROI Readers are encouraged to think about all of the ways that a tool like RTD can be deployed in their organization
Disclosures The reader should be aware of the following
bull The study is commissioned by Oracle and delivered by the Forrester Consulting group
bull Forrester makes no assumptions as to the potential return on investment that other organizations will receive Forrester strongly advises that readers should use their own estimates within the framework provided in the report to determine the appropriateness of an investment in Oracle Real-Time Decisions
bull Oracle reviewed and provided feedback to Forrester but Forrester maintains editorial control over the study and its findings and does not accept changes to the study that contradict Forresterrsquos findings or obscure the meaning of the study
bull The customer name for the interview was provided by Oracle
Page 5
Forrester Consulting
Total Economic Impact Of Oracle Real-Time Decisions
TEI Framework And Methodology
Introduction From the information provided in the interviews Forrester has constructed a Total Economic Impacttrade framework for those organizations considering implementing Oracle Real-Time Decisions The objective of the framework is to identify the cost benefit flexibility and risk factors that affect the investment decision
Approach And Methodology Forrester took a multistep approach to evaluate the impact that Oracle Real-Time Decisions can have on an organization (see Figure 2) Specifically we
bull Interviewed Oracle marketing and sales personnel and Forrester analysts to gather data relative to RTD and the marketplace for real-time recommendation engines
bull Interviewed one organization currently using RTD to obtain data with respect to costs benefits and risks
bull Constructed a financial model representative of the interviews using the TEI methodology The financial model is populated with the cost and benefit data obtained from the interviews as applied to the composite organization
Figure 2 TEI Approach
Construct financial model using TEI
framework
Write case study
Perform due diligence
Conduct customer interviews
Source Forrester Research Inc
Forrester employed four fundamental elements of TEI in modeling RTD
1 Costs
2 Benefits to the entire organization
3 Flexibility
4 Risk
Given the increasing sophistication that enterprises have regarding ROI analyses related to IT investments Forresterrsquos TEI methodology serves the purpose of providing a complete picture of the total economic impact of purchase decisions Please see Appendix A for additional information on the TEI methodology
Page 6
Forrester Consulting
Total Economic Impact Of Oracle Real-Time Decisions
Analysis
Interview Highlights The customer interviewed for this study is a financial services provider The company has operations across the United States and more than 20000 employees A significant portion of revenues come via online channels
The individual interviewed for the study is a member of the companywide technology leadership team and describes himself as ldquoa steward of the technology innovation processrdquo He said his job responsibility is to ldquocultivate a strategic vision of how technology can help the business and how disruptive technologies can help achieve quantum leaps in competitiveness RTD has been one of the gems in my total body of work hererdquo
The interview uncovered the following salient points
bull RTD fundamentally altered how the organization understands its value proposition to customers RTD has builtshyinautomated learning capabilities using behavioral observations
o ldquoRTD taught us in two months that we were sub-optimizing our sales Customers didnrsquot want the lowest cost overall they wanted the best fit solution at the lowest cost for that fit No rules engine would ever detect that or fix our cultural biasrdquo
o ldquoDecades of accumulated culture processes and training were based on the premise that we needed to be a low cost provider We were ecstatic and surprised when RTD discovered that was not entirely the caserdquo
bull Having a decision support engine that operates in real-time is critical to achieving the financial benefits
o ldquoAny time there is a customer interaction nothing beats real-time analysis and heuristicsrdquo
o ldquoIf we tried to do everything with a traditional business rules based solution it would be very cumbersome and difficult to maintainrdquo
bull RTD is very useful in formulating and testing hypotheses to improve sales and competitive differentiation
o ldquoWe are a metrics driven organization We can assign a value to every eCommerce widget We are also a testing organization we operate under the presumption that in order to exploit hidden value we have to constantly experiment with customer experiences RTD make this process much more effectiverdquo
o ldquoHistorically we could only test one hypothesis at a time which was very time consuming By the time we thought we figured it all out the opportunity may have already passed RTD has sped this process up considerably resulting in new revenue opportunitiesrdquo
o ldquoWe hypothesized some unusual use cases That is when we brought Oracle in to explore if RTD would be of value and it wasrdquo
bull Properly modeling business hypotheses is critical to success and finding the right integration partner makes this possible
Page 7
Forrester Consulting
Total Economic Impact Of Oracle Real-Time Decisions
o ldquoThere were two or three really difficult nuts to crack It helps to have someone around who has done this before That is why it was important to get the right consulting company involvedrdquo
o ldquoWe were very careful in how we modeled the hypotheses for testing We ran half of the quoting process in RTD and half business as usual Getting the number of transactions between the various control groups to equal was a challenge It was important to get this right since the benefits were so dramatic we had to show that the study was well designedrdquo
bull The company created stringent criteria for evaluating the various decision support solution options
o ldquoWe were looking for a generalized platform for customer experience and business process optimizationrdquo
o ldquoRTD was the first product we encountered that had what we were looking for We then looked at other platforms that alleged to have similar capabilities There were some fundamental differences that made RTD the preferred choicerdquo
Rules versus data mining mdash ldquoA rules only solution would not solve our business challenges Classic business intelligence solutions would not scalerdquo
Website versus all channel optimization mdash ldquoWe looked at several campaign management solutions that were only relevant for e-commerce We need something that addressed online channels and call centersrdquo
CRM versus decision analytics solution mdash ldquoWe did not want to buy a whole CRM system just to get the real-time decisions solution we needed Most of the solutions we looked at that might meet our needs were intelligence layers on top of a full blown CRM solutionrdquo
bull The customer has undertaken a series of projects each designed to address a unique business challenge and generate additional revenue
o ldquoThe initial pilot looked at ways to reduce shopping cart abandonment and to improve the sales funnel The initial objective was to increase sales by changing how we position our offerings to potential customersrdquo This was expanded from the online channel to call centers and went live in December 2007 It also looked for opportunities to up-sell additional services
o ldquoOur second project was to follow up with potential customers who register as part of the new quote generation process but do not complete the purchase We use information we gathered online to customize a follow-up email inviting them to come back and continue the process We can customize the tone theme and content of the emailrdquo
o ldquoThe third project was focused on getting existing customers to enroll in services that increase loyalty and reduce churn These services include electronic funds transfer (EFT) paperless statements automatic credit card processing etcrdquo RTD helped identify which theme to use to improve adoption ie green cost savings etc
Page 8
Forrester Consulting
Total Economic Impact Of Oracle Real-Time Decisions
o ldquoThe project currently under way is designed to predict retention events and take proactive steps to reduce customer churnrdquo
Framework Assumptions Table 2 provides the model assumptions that Forrester used in this analysis
Table 2 Model Assumptions
Ref Metric Value
A1 Annual fully burdened compensationdagger per internal resource $130000
daggerIncludes salary variable compensation and all direct benefits (eg disability insurance)
Source Forrester Research Inc
The discount rate used in the PV and NPV calculations is 10 and time horizon used for the financial modeling is three years Organizations typically use discount rates between 8 and 16 based on their current environment Readers are urged to consult with their respective companyrsquos finance department to determine the most appropriate discount rate to use within their own organizations
Some values in the study are rounded to the nearest dollar Therefore some calculation results shown in the tables may be off by up to a few dollars
Costs This section describes the direct costs of implementing Oracle RTD projects and the ongoing management costs Some of the costs in this section reflect Forresterrsquos best estimates of what a new customer should expect to pay and may not be what the interviewed customer actually spent
The majority of the effort and costs were incurred in the initial period and in Year 2 when the two projects were undertaken The incremental costs shown in Year 2 are because of an increase in scope mdash the second project mdash and not an increase in complexity
Internal Implementation Labor The interviewed customer followed a process similar to Oraclersquos Rapid Start methodology For each new project a similar timeline was followed mdash three months of development followed by three months of pilot The development activities include formulating hypotheses defining the interaction optimization model and rules and defining the test protocols installing additional hardware and the RTD system as needed configuring and testing RTD settings and scripts and integrating into other required backend systems eg databases CRM marketing campaign systems etc
Page 9
Forrester Consulting
Total Economic Impact Of Oracle Real-Time Decisions
Once the development effort was completed three months was spent monitoring analyzing and fine-tuning the campaign
The interviewee said that he ldquoalways felt a well defined pilot with clearly defined targets and end criteria is essential for success Close collaboration between ourselves Oracle and our integration partner was necessary to make this happenrdquo
For the initial project three FTEs spent three months working on development This effort was split between project management business analysts and system developers During the pilot one business analyst spent three months analyzing and fine-tuning the campaign criteria and testing protocols within RTD Three months of development x three FTEs and three months in pilot x 1 FTE all at $10833 per month is equal to a total internal labor cost of $130000 for the initial project A similar delivery process was followed for the second project in Year 2
Table 3 Internal Implementation Labor
Ref Metric Calculation Initial Year 1 Year 2 Year 3 Total
B1 Number of months - development 3 3
B2 Number of FTEs - development 3 3
B3 Number of months - pilot 3 3
B4 Number of FTEs - pilot 1 1
B5 Monthly fully burdened cost A112 $10833 $10833
Bt Internal implementation labor ((B1B2)+(B3B4))B5 $130000 $130000 $260000
Source Forrester Research Inc
Professional Services The interviewed customer repeatedly said that having the right integration partner is critical to successfully implementing RTD and creating valuable campaigns The integration partner was used for each new project to define the campaigns and set up the RTD system Projects were designed so that ongoing management was fully in the hands of internal resources lowering ongoing operating costs
Forrester estimates that professional service costs will be higher for the first project because of the added time for setting up the systems and knowledge transfer
Page 10
Forrester Consulting
Total Economic Impact Of Oracle Real-Time Decisions
Table 4 Professional Services
Ref Metric Calculation Initial Year 1 Year 2 Year 3 Total
C1 Development phase $300000 $150000
C2 Pilot phase $100000 $50000
Ct Professional services C1+C2 $400000 $200000 $600000
Source Forrester Research Inc
Hardware The interviewed customer set up the RTD solution in development testing and production environments This can vary from customer to customer depending on how intensively they are using RTD and the nature of their RTD license model mdash per processor versus ULA Additional hardware was added for each new project because of the need for greater computing power and because some of the projects were for different parts of the organization and being run completely independent
Readers are encouraged to work with Oracle or an integration partner to properly scope out their hardware requirements
Table 5 Hardware
Ref Metric Calculation Initial Year 1 Year 2 Year 3 Total
D1 Number of blade servers added
8 0 8 0
D2 Cost per blade $16000 $16000 $16000 $16000
D3 Total purchase costs D1D2 $128000 $0 $128000 $0
D4 Maintenance D3[through current year]10 $0 $12800 $25600 $25600
Dt Hardware D3+D4 $128000 $12800 $153600 $25600 $320000
Source Forrester Research Inc
Page 11
Forrester Consulting
Total Economic Impact Of Oracle Real-Time Decisions
RTD Licenses And Support RTD license costs can be based on a per dual-core CPU basis or as part of an Oracle ULA Often a customer will begin with a per-CPU license model and then transition to a ULA when the economics make sense That is the model the interviewed customer followed
The per-CPU license cost varies based on the number of years contracted as well as volume discounts Standard RTD license costs are published on the Oracle website Annual support is charged at 22 of the acquisition price The licenses costs presented are Forresterrsquos estimate of what a new customer should expect to pay in licenses for an installation similar in size and scope to that of the interviewed customer
Additional licenses were added in Year 2 to accommodate the new project
Table 6 RTD Licenses And Support
Ref Metric Calculation Initial Year 1 Year 2 Year 3 Total
E1 Number of dual-core CPUs added
E1 4 CPUs per blade
32 0 32 0
E2 Licenses cost per CPU (perpetual usage)
$92000 $92000 $92000 $92000
E3 Total license costs E1E2 $2944000 $0 $2944000 $0
E4 Software update and support
E3[through current year]22
$647680 $1295360 $1295360
Et RTD licenses and support E3+E5 $2944000 $647680 $4239360 $1295360 $9126400
Source Forrester Research Inc
Ongoing Campaign Management Labor Each RTD projectcampaign should be closely managed on an ongoing basis to analyze results and refine business logic RTD campaigns are all about continual improvement through observation experimentation and analysis A company may want to organize a centralized group with RTD skills or may choose to disperse these resources across the various relevant parts of the organization This will depend more on how the readerrsquos organization generally structures itself
For the interviewee the RTD business analysts were initially spread across the marketing organizations Based on the now widespread use of RTD there is a reorganization effort under way to create a centralized RTD decision management team
Page 12
Forrester Consulting
Total Economic Impact Of Oracle Real-Time Decisions
Table 7 Ongoing Campaign Management Labor
Ref Metric Calculation Initial Year 1 Year 2 Year 3 Total
F1 Number of FTEs 1 FTE per campaignproject
1 2 2
F2 Annual fully burdened cost A1 $130000 $130000 $130000
Ft Ongoing campaign management labor
F1F2 $130000 $260000 $260000 $650000
Source Forrester Research Inc
Total Costs Table 8 summarizes the costs for the implementation and ongoing campaign management for two RTD projects The increased costs in Year 2 are attributable to the completion of a second RTD project
Table 8 Total Costs
Ref Costs Initial Year 1 Year 2 Year 3 Total
Bt Internal implementation labor ($130000) ($130000) ($260000)
Ct Professional services ($400000) ($200000) ($600000)
Dt Hardware ($128000) ($12800) ($153600) ($25600) ($320000)
Et RTD licenses and support ($2944000) ($647680) ($4239360) ($1295360) ($9126400)
Ft Ongoing campaign management labor
($130000) ($260000) ($260000) ($650000)
Total ($3602000) ($790480) ($4982960) ($1580960) ($10956400)
Source Forrester Research Inc
Benefits The first half of this section details the quantitative benefits included in the ROI The second half describes qualitative benefits that the interviewed customer described but could not be quantified for this study They are not part of the ROI
Page 13
Forrester Consulting
Total Economic Impact Of Oracle Real-Time Decisions
analysis Readers should take the qualitative benefits into consideration when analyzing the total benefits their organization may realize by utilizing the RTD solution
Increased Closure Rate Revenue The first benefit that the interviewed company was seeking to achieve with RTD was to improve the conversion rates from quote requests to actually buying Stated another way the company wanted to reduce shopping cart abandonment Even a small improvement in this area could have huge impacts in terms of additional revenue The interviewee said ldquoWe have a rather mature highly tuned online platform All of the low hanging fruit has long been picked So anything approaching a 1 point lift in closure rate is considered quite spectacular The various RTD-driven optimizations in place have no doubt contributed to this outcomerdquo
The number of new sales because of RTD is directly related to the number of quote requests received mdash both through the online and call center channels Over the life of the study the number of overall quote requests decreased year-onshyyear for a variety of reasons not related to RTD The result is fewer new sales each year even though the closure rate continued to improve because of RTD
In the first year of the study approximately 08 point more quote requests were converted into sales This increased to 10 beginning in Year 2 This improvement is attributable to the self-learning capabilities of RTD as well as the ongoing hypothesis testing and campaign refinement work completed by the decision management team The interviewee was not able to share the baseline closure rates because it is considered highly confidential By example if the original close rate was 400 of all quote requests in Year 0 it would be 408 in Year 1 and 410 in years 2 and 3 Once a new sale is made that revenue continues year after year unless the customer leaves mdash customer churn Forrester assumed a 25 annual churn rate based on industry averages
Readers are encouraged to think about opportunities to reduce cart abandonment or otherwise improve the sales funnel using a tool like RTD and calculate what the potential upside can be
Page 14
Forrester Consulting
Total Economic Impact Of Oracle Real-Time Decisions
Table 9 Increase Closure Rate Revenue
Ref Metric Calculation Year 1 Year 2 Year 3 Total
G1 Percentage point closure rate lift
08 10 10
G2 Incremental of new sales from RTD
14400 13600 12500
G3 Estimated churn rate Forrester assumption 25 25 25
G4 Cumulative of incremental sales from RTD
(G4[previous year](1shyG5))+G2[current year]
14400 24400 32020
G5 Average annual sale price $740 $740 $740
Gt Improved closure rate revenue
G4G5 $10656000 $18056000 $23694800 $52406800
Source Forrester Research Inc
Incremental Deal Size Revenue Table 9 shows an average sale price of $740 As part of the initial project the company also looked at way to increase the average price This was done by targeting additional services based on real-time observed behaviors and assumptions based on past experiences ldquoIf the RTD predictive models discovered that informing specific prospects about additional options could jeopardize the sale it wouldnrsquot be offered For those customers that the closure rate would not be affected we would educate them on those optionsrdquo
The result was a $10 increase in the average price for all sales in Year 1 not just for those closed because of RTD This increased to $12 in years 2 and 3 This improvement is attributable to the self-learning and predictive modeling capabilities of RTD along with the ongoing efforts of the decision management team to identify new areas for improvement
Page 15
Forrester Consulting
Total Economic Impact Of Oracle Real-Time Decisions
Table 10 Incremental Deal Size Revenue
Ref Metric Calculation Year 1 Year 2 Year 3 Total
H1 Incremental of new sales from RTD G2 14400 13600 12500
H2 of new ldquobusiness as usual sales
720000 680000 624000
H3 Total annual of new sales H1+H2 734400 693600 636500
H4 Cumulative of new sales
(H4[previous year](1shyG3))+H3[current year]
734400 1244400 1569800
H5 Average increase in sale price
$10 $12 $12
Ht Incremental deal size revenue
H4H5 $7344000 $14932800 $18837600 $41114400
Source Forrester Research Inc
Post Cart Abandonment Follow-Up Campaign Revenue A subsequent project was looking at the potential customers who initiated the quote process online but still did not purchase Using information captured during the registration and quoting process the company used RTD to identify highly personalized content to include in follow-up emails as part of a campaign to win this business These emails could be highly targeted in terms of tone theme (green vs dollar savings) color scheme subject line etc
This outbound campaign was highly successful The company estimates that they ldquorealized approximately a 1 point lift from that campaign We were able to close more business than without RTD and that results in tens of thousands of new sales every yearrdquo Once again the interviewee was not able to share the existing closure rates in order to show the full calculation This benefit is calculated using the improved sale price described earlier
Page 16
Forrester Consulting
Total Economic Impact Of Oracle Real-Time Decisions
Table 11 Post Cart Abandonment Follow-Up Campaign Revenue
Ref Metric Calculation Year 1 Year 2 Year 3 Total
I1 Number of additional sales 0 25000 50000
I2 Cumulative of additional sales (I2[previous year](1shyG3))+I1[current year]
0 25000 68750
I3 Average annual price G5+H5 $750 $752 $752
It Post cart abandonment follow-up campaign revenue
I1I2 $0 $18800000 $37600000 $56400000
Source Forrester Research Inc
Total Benefits Table 12 summarizes the total quantified benefits the interviewed company realized through RTD projects
Table 12 Total Quantified Benefits
Ref Benefits Year 1 Year 2 Year 3 Total
Gt Improved closure rate revenue $10656000 $18056000 $23694800 $52406800
Ht Incremental sale price revenue $7344000 $14932800 $18837600 $41114400
It Post cart abandonment follow-up campaign revenue
$18800000 $37600000 $56400000
Total $18000000 $51788800 $80132400 $149921200
Source Forrester Research Inc
Qualitative Benefits
Greater Customer Retention And Lifetime Value
The benefits quantified earlier show the financial contribution for the first three years In reality these benefits will continue as long as the individual remains a customer A third project was undertaken to increase customer loyalty RTD is being used to target messages to improve enrollment customers in paperless billing ETF and other programs
Page 17
Forrester Consulting
Total Economic Impact Of Oracle Real-Time Decisions
that have been shown to increase customer loyalty Enrollment has improved because of RTD ldquoI can say with some certainty that our retention rate has improved over the last two consecutive years Each one-tenth of one percent improvement in retention is worth a lot to the bottom line If we can keep a customer for three years we can keep them for liferdquo This benefit was not included in the ROI analysis because the information is kept highly confidential by the interviewed company
Another benefit of improved retention is cost avoidance for having to acquire new customers It costs the interviewed company five times more to acquire a new customer compared with retaining an existing customer Reducing customer churn reduces overall customer acquisition costs
Better Business Intelligence
As discussed earlier the organization interviewed places a heavy value on business analysis and continual improvement RTD has helped in understanding the business fundamentals and customersrsquo wants
ldquoWe have changed how we approach customers in terms of what we say when we contact them etc Some emails go out at different times of day based on when there is an increased likelihood of it being read People will usually say what they think is the correct answer but if you observe their behavior they canrsquot lie We learn a lot more about who our customers really are and what they really wantrdquo
RTD also allows the company to better structure customer analytics and research projects It can easily change weighting and factors to determine what works best RTD also allows for multiple experiments to be run at the same time with the ability to control for each experiment individually These experiments can also be completed more quickly and the outcomes put into general use This results in additional revenues because previous analysis methods would often discover the opportunities too late to be monetized
Improved Customer Experiences
The financial services industry is highly regulated which limits the extent to which providers can compete on price Therefore improving customer service is extremely important in attracting and retaining customers Enhanced personalization and predictive modeling makes for an overall more valuable customer experience
ldquoWe want to easily give customers what they want when they want it We can be predictive based on IP address search words average demographics past histories etc This can be used to tailor the landing page and all aspects of the online and call center experience The goal is to deliver relevance to each visitor We also learn more using RTD than we otherwise could Without RTD I donrsquot know how we would do any o f this as effectively Since sales price and fundamental product structure is largely regulated we focus on the long tail of customer experience as our differentiatorrdquo
Flexibility Flexibility as defined by TEI represents an investment in additional capacity or capability that could be turned into business benefit for some future additional investment This provides an organization with the ldquorightrdquo or the ability to engage in future initiatives but not the obligation to do so There are multiple scenarios in which a customer might choose to implement RTD and later realize additional uses and business opportunities Flexibility would also be quantified when evaluated as part of a specific project (described in more detail in Appendix A)
Page 18
Forrester Consulting
Total Economic Impact Of Oracle Real-Time Decisions
The RTD platform is very flexible in terms of quickly initiating and running multiple campaigns targeted at different areas of the value chain It can also enable an organization to do more with fewer people resources The interviewee said that with RTD they can be ldquomore efficient faster and more agilerdquo New projects can be completed faster at a lower incremental cost
To a large extent the uses of RTD are only limited by the imagination for the interviewed customer They ldquosee a lot of opportunity to be more strategic in the use of the platform for customer touch projectsrdquo A project recently launched is looking at real-time customer analysis during a phone call to identify potential upcoming retention events and make suggestions to the agent to improve retention
For each new project there may be an incremental investment in licenses (depending on if a ULA is in place) hardware internal labor and professional services For the projects already completed by this RTD customer the ROI for each project has been significant No future flexibility benefits have been included in the ROI analysis
Risk Forrester defines two types of risk associated with this analysis implementation risk and impact risk ldquoImplementation riskrdquo is the risk that a proposed investment in RTD may deviate from the original or expected requirements resulting in higher costs than anticipated ldquoImpact riskrdquo refers to the risk that the business or technology needs of the organization may not be met by the investment in RTD resulting in lower overall total benefits The greater the uncertainty the wider the potential range of outcomes for cost and benefit estimates
Quantitatively capturing investment and impact risk by directly adjusting the financial estimates results in more meaningful and accurate estimates and a more accurate projection of the ROI In general risks affect costs by raising the original estimates and they affect benefits by reducing the original estimates The risk-adjusted numbers should be taken as ldquorealisticrdquo expectations since they represent the expected values considering risk
The following implementation risks that affect costs are identified as part of this analysis
bull The implementation project could go longer than expected or fail due to technical complexities of integrating RTD with other backend systems ie CRM DBMS etc This risk can be largely mitigated by engaging with a system integrator that has previous relevant experiences implementing RTD
bull Understanding the Oracle licensing model is also important for avoiding cost overruns Readers should consider their likely usage in order to identify the best initial model and constantly be looking to determine if it makes sense to move between a ULA and per CPU license
The following impact risks that affect benefits are identified as part of the analysis
bull RTD involves experimentation with actual customers In all likelihood not all experiments will deliver the desired results This could result in lost revenue for a segment of customers The interviewee described this as the ldquocost of experimentationrdquo This risk along with the risk of other unintended consequences being introduced into production can be mitigated by architecting the solution so that turning off RTD will revert the underlying systems to their original state That way if the RTD goes down or needs to be taken off line the other systems and business logic all remain intact This was described as a best practice by the interviewee
Page 19
Forrester Consulting
Total Economic Impact Of Oracle Real-Time Decisions
bull There is also the risk of suboptimal results because of the lack of expertise to build score and iterate RTD campaigns This can be mitigated by engaging with an experienced integration partner and providing the necessary training to internal resources
bull RTD requires a certain level of trust from employees ie call center staff if they are to follow the system recommendations This requires adequate training to ensure that all parties are comfortable with the system and understand how it changes peoplersquos daily responsibilities
Table 13 shows the values used to adjust for risk and uncertainty in the cost and benefit estimates The TEI model uses a triangular distribution method to calculate risk-adjusted values To construct the distribution it is necessary to first estimate the low most likely and high values that could occur within the current environment The risk-adjusted value is the mean of the distribution of those points Readers are urged to apply their own risk ranges based on their own degree of confidence in the cost and benefit estimates
Table 13 Cost And Benefit Risk Adjustments
Costs Low Most likely High Mean
Internal implementation labor (medium risk) 100 100 115 105
Professional services (medium risk) 100 100 115 105
Hardware (medium risk) 100 100 115 105
RTD licenses and support (medium risk) 100 100 115 105
Ongoing campaign management labor (medium risk) 100 100 115 105
Benefits Low Most likely High Mean
Improved closure rate revenue (medium risk) 80 100 95 92
Incremental deal size revenue (medium risk) 80 100 95 92
Post cart abandonment follow-up campaign revenue (medium risk)
80 100 95 92
Source Forrester Research Inc
Page 20
mdash
mdash
Forrester Consulting
Total Economic Impact Of Oracle Real-Time Decisions
Financial Summary
The financial results calculated in the Costs and Benefits sections can be used to determine the return on investment net present value and payback period for the organizationrsquos investment in Oracle Real-Time Decisions The financial results are based on rigorous testing methodologies followed by the customer These include using control groups and blind testing of hypotheses These are shown in Table 14 below
Table 14 Cash Flow mdash Non-Risk-Adjusted
Cash flow Original estimates
Initial Year 1 Year 2 Year 3 Total Present value
Costs ($3602000) ($790480) ($4982960) ($1580960) ($10956400) ($9626566)
Benefits $18000000 $51788800 $80132400 $149921200 $119368956
Net benefits ($3602000) $17209520 $46805840 $78551440 $138964800 $109742390
ROI 1140
Payback period 2 Months
Source Forrester Research Inc
Table 15 below shows the risk-adjusted ROI NPV and payback period values These values are determined by applying the risk-adjustment values from Table 13 in the Risk section to the cost and benefits numbers in Tables 8 and 12
Table 15 Cash Flow mdash Risk-Adjusted
Cash flow Risk-adjusted estimates
Initial Year 1 Year 2 Year 3 Total Present value
Costs ($3782100) ($830004) ($5232108) ($1660008) ($11504220) ($10107894)
Benefits $16560000 $47645696 $73721808 $137927504 $109819439
Net benefits ($3782100) $15729996 $42413588 $72061800 $126423284 $99711545
ROI 986
Payback period 3 Months
Source Forrester Research Inc
Page 21
Forrester Consulting
Total Economic Impact Of Oracle Real-Time Decisions
Figure 3 Summary Financial Results Risk-Adjusted
$90000000
$70000000
$50000000
$30000000
$10000000
($10000000) ($3782100)
$10517896
$45570448
$99711545
Initial Year 1 Year 2 Year 3
Costs (PV) Benefits (PV) Cumulative cash flow (NPV)
Source Forrester Research Inc
Page 22
Forrester Consulting
Total Economic Impact Of Oracle Real-Time Decisions
Oracle Real-Time Decisions Overview
According to Oracle Oraclersquos Real-Time Decisions (RTD) platform combines both rules and predictive analytics to power solutions for real-time enterprise decision management It enables real-time intelligence to be instilled into any type of business process or customer interaction A high-performance transactional server delivers real-time decisions and recommendations This server automatically renders decisions within a business process and reveals insights creating actionable intelligence from data flowing through the process in real time
Appendix A Total Economic Impacttrade Overview
Total Economic Impact is a methodology developed by Forrester Research that enhances a companyrsquos technology decision-making processes and assists vendors in communicating the value proposition of their products and services to clients The TEI methodology helps companies demonstrate justify and realize the tangible value of IT initiatives to both senior management and other key business stakeholders
The TEI methodology consists of four components to evaluate investment value benefits costs risks and flexibility
Benefits Benefits represent the value delivered to the user organization mdash IT andor business units mdash by the proposed product or project Often product or project justification exercises focus just on IT cost and cost reduction leaving little room to analyze the effect of the technology on the entire organization The TEI methodology and the resulting financial model place equal weight on the measure of benefits and the measure of costs allowing for a full examination of the effect of the technology on the entire organization Calculation of benefit estimates involves a clear dialogue with the user organization to understand the specific value that is created In addition Forrester also requires that there be a clear line of accountability established between the measurement and justification of benefit estimates after the project has been completed This ensures that benefit estimates tie back directly to the bottom line
Costs Costs represent the investment necessary to capture the value or benefits of the proposed project IT or the business units may incur costs in the form of fully burdened labor subcontractors or materials Costs consider all the investments and expenses necessary to deliver the proposed value In addition the cost category within TEI captures any incremental costs over the existing environment for ongoing costs associated with the solution All costs must be tied to the benefits that are created
Risk Risk measures the uncertainty of benefit and cost estimates contained within the investment Uncertainty is measured in two ways 1) the likelihood that the cost and benefit estimates will meet the original projections and 2) the likelihood that the estimates will be measured and tracked over time TEI applies a probability density function known as ldquotriangular distributionrdquo to the values entered At minimum three values are calculated to estimate the underlying range around each cost and benefit
Page 23
Forrester Consulting
Total Economic Impact Of Oracle Real-Time Decisions
Flexibility Within the TEI methodology direct benefits represent one part of the investment value While direct benefits can typically be the primary way to justify a project Forrester believes that organizations should be able to measure the strategic value of an investment Flexibility represents the value that can be obtained for some future additional investment building on top of the initial investment already made For instance an investment in an enterprisewide upgrade of an office productivity suite can potentially increase standardization (to increase efficiency) and reduce licensing costs However an embedded collaboration feature may translate to greater worker productivity if activated The collaboration can only be used with additional investment in training at some future point in time However having the ability to capture that benefit has a present value that can be estimated The flexibility component of TEI captures that value
Appendix B Glossary
Discount rate The interest rate used in cash flow analysis to take into account the time value of money Although the Federal Reserve Bank sets a discount rate companies often set a discount rate based on their business and investment environment Forrester assumes a yearly discount rate of 10 for this analysis Organizations typically use discount rates between 8 and 16 based on their current environment Readers are urged to consult their respective organization to determine the most appropriate discount rate to use in their own environment
Net present value (NPV) The present or current value of (discounted) future net cash flows given an interest rate (the discount rate) A positive project NPV normally indicates that the investment should be made unless other projects have higher NPVs
Present value (PV) The present or current value of (discounted) cost and benefit estimates given at an interest rate (the discount rate) The PV of costs and benefits feed into the total net present value of cash flows
Payback period The breakeven point for an investment The point in time at which net benefits (benefits minus costs) equal initial investment or cost
Return on investment (ROI) A measure of a projectrsquos expected return in percentage terms ROI is calculated by dividing net benefits (benefits minus costs) by costs
A Note On Cash Flow Tables The following is a note on the cash flow tables used in this study (see the example table below) The initial investment column contains costs incurred at ldquotime 0rdquo or at the beginning of Year 1 Those costs are not discounted All other cash flows in Years 1 through 3 are discounted using the discount rate (shown in Framework Assumptions section) at the end of the year Present value (PV) calculations are calculated for each total cost and benefit estimate Net present value (NPV) calculations are not calculated until the summary tables and are the sum of the initial investment and the discounted cash flows in each year
Page 24
Forrester Consulting
Total Economic Impact Of Oracle Real-Time Decisions
Table [Example] Example Table
Ref Category Calculation Initial cost Year 1 Year 2 Year 3 Total
Source Forrester Research Inc
Appendix C Supplemental Material
Related Forrester Research ldquoDefining The Online Marketing Suiterdquo Forrester Research Inc October 17 2007
Appendix D Endnotes
1 Forrester risk-adjusts the summary financial metrics to take into account the potential uncertainty of the cost and benefit estimates
Page 25

Forrester Consulting
Total Economic Impact Of Oracle Real-Time Decisions
TABLE OF CONTENTS Executive Summary 2
RTD Significantly Increases Revenue By Improving Closure Rates And Transaction Values 2
Factors Affecting Benefits And Costs 4
Disclosures 5
TEI Framework And Methodology 6
Analysis 7
Interview Highlights 7
Costs 9
Benefits 13
Flexibility18
Risk19
Financial Summary21
Oracle Real-Time Decisions Overview23
Appendix A Total Economic Impacttrade Overview 23
Appendix B Glossary24
Appendix C Supplemental Material25
Appendix D Endnotes25
copy 2011 Forrester Research Inc All rights reserved Unauthorized reproduction is strictly prohibited Information is based on best available resources Opinions reflect judgment at the time and are subject to change Forresterreg Technographicsreg Forrester Wave RoleView TechRadar and Total Economic Impact are trademarks of Forrester Research Inc All other trademarks are the property of their respective companies For additional information go to wwwforrestercom
About Forrester Consulting Forrester Consulting provides independent and objective research-based consulting to help leaders succeed in their organizations Ranging in scope from a short strategy session to custom projects Forresterrsquos Consulting services connect you directly with research analysts who apply expert insight to your specific business challenges For more information visit wwwforrestercomconsulting
Page 1
Forrester Consulting
Total Economic Impact Of Oracle Real-Time Decisions
Executive Summary
In April 2011 Oracle commissioned Forrester Consulting to examine the total economic impact and potential return on investment (ROI) enterprises may realize by deploying Oracle Real-Time Decisions (RTD) The RTD platform combines both rules and predictive analytics to power solutions for real-time enterprise decision management enabling real-time intelligence to be instilled into any type of business process or customer interaction The purpose of this study is to provide readers with a framework to evaluate the potential financial impact of RTD on their organizations
RTD Significantly Increases Revenue By Improving Closure Rates And Transaction Values Our interview with one existing RTD customer in the financial services industry and subsequent financial analysis found that the company experienced the risk-adjusted ROI costs and benefits shown in Table 1 The company has operations in all 50 states and more than 20000 employees It has completed several initiatives using RTD including
1 Shopping cart abandonment rate reduction mdash online and call center channels
2 Post abandonment follow-up email campaign
3 Optional program enrollment ie electronic funds transfer (EFT) paperless statements etc
4 Retention event identification and resolution strategies
The benefits and costs associated with the first two projects are included in the ROI analysis The company was unable to share metrics related to the latter two projects because they are considered trade secrets Therefore benefits associated with these two projects are not included in the ROI analysis but they are described in qualitative terms
Table 1 Three-Year Risk-Adjusted ROI1
ROI Payback period
Total benefits (PV)
Total costs (PV)
Net present value
986 3 Months $109819439 ($10107894) $99711545
Source Forrester Research Inc
bull Benefits The organization we interviewed is meticulous in defining test procedures to accurately identify and quantify the benefits derived from RTD as well as all other initiatives These procedures include using control groups and blind testing of hypotheses Following these procedures the company identified the following benefits
Page 2
Forrester Consulting
Total Economic Impact Of Oracle Real-Time Decisions
o Increased closure rate revenue The initial projectrsquos objective to reduce shopping cart abandonment resulted in approximately a one percentage point lift in the closure rate during the original sales cycle This equates to roughly $544 million in additional revenue over three years
o Incremental deal size revenue The initial project also looked at ways to increase the average financial services product price by suggesting additional options to the basic offering This increase applies to all new sales not just those attributable to the use of RTD and is additive to the increased closure rate benefit This results in more than $411 million over the life of the study
o Post cart abandonment follow-up campaign revenue The second project created personalized follow-up emails to potential customers who asked for a quote but did not buy (abandoned their cart) This resulted in approximately a one percentage point lift in the conversion rate compared with a control group consisting of a single static message This totals $564 million over three years
o Greater customer retention and lifetime value (non-quantified) Through a variety of RTD initiatives customer retention rates were improved This increases the total lifetime value for these customers and reduces the cost of finding new customers to replace the losses Due to confidentiality issues this information could not be provided by the interviewed customer
o Better business intelligence (non-quantified) RTD helped the organization learn more about its own value proposition and what motivates customersrsquo purchasing behaviors than could otherwise be learned This contributes to the process of continual improvement and identifying new profit maximizing opportunities
o Improved customer experiences (non-quantified) RTD shows what customers really want through observed behavior which is more accurate than relying on what customers say The result is greater customer satisfaction and the ability to better differentiate in the highly regulated financial services industry
bull Costs Some of the costs described in this study have been updated from what the interviewed organization actually paid to better reflect what a new customer can expect The objective is to provide readers with the latest information in order to best understand the potential financial impact to their organizations The company we interviewed experienced the following costs
o Internal implementation labor The customer followed a process similar to Oraclersquos Quick Start methodology for RTD implementations Each project lasted approximately six months mdash from inception through refinement in pilot The total labor costs for the two projects included in the ROI analysis are $260000
o Professional services The customer utilized a professional services company for assistance in implementing both RTD projects each lasting six months These costs should decrease with subsequent projects once the RTD infrastructure is established and in-house skills are developed Professional service fees for individual projects can range from $200000 to more than $400000 The study includes $600000 in professional service fees split between the two projects
o Hardware Servers are required for development testing and production For the projects included in the cost benefit analysis 16 blade servers were used This totals $320000 in purchase costs and maintenance
Page 3
Forrester Consulting
Total Economic Impact Of Oracle Real-Time Decisions
o RTD licenses and support RTD licenses can either be on a per-CPU basis or part of a Universal License Agreement (ULA) The licenses costs depicted in this study are based on the interviewed customerrsquos number of CPUs but applying current licensing costs License acquisition and support costs total more than $9 million over three years
o Ongoing campaign management labor Each RTD project is run by a campaign manager permanently assigned for the ongoing operation analysis and refinement of an RTD campaign This totaled $650000 over three years
Figure 1 Summary Financial Results Risk-Adjusted
$90000000
$70000000
$50000000
$30000000
$10000000
($10000000) ($3782100)
$10517896
$45570448
$99711545
Initial Year 1 Year 2 Year 3
Costs (PV) Benefits (PV) Cumulative cash flow (NPV)
Source Forrester Research Inc
Factors Affecting Benefits And Costs Table 1 illustrates the risk-adjusted financial results that were achieved by the organization The risk-adjusted values take into account any potential uncertainty or variance that exists in estimating the costs and benefits which produces more conservative estimates The following factors may affect the financial results that an organization may experience
bull Existing revenuessize of the organization In absolute terms organizations with greater existing total sales should see larger benefits from RTD This is because an equal percentage improvement from a large base is by definition greater than from a smaller base However smaller organizations should still expect to see ROIs broadly in alignment with the one shown in this study
Page 4
Forrester Consulting
Total Economic Impact Of Oracle Real-Time Decisions
bull Complexity of decisionsproblems RTD is addressing RTD is especially valuable in high involvement decision-making such as selecting financial service products While simpler tasks can also benefit from RTD the corresponding financial benefits may not be as high
bull Number of projects utilizing RTD The interviewed customer is using RTD in many scenarios and is always looking for new areas to use RTD for improving financial results Each new project brings a whole set of benefits that improves the overall ROI Readers are encouraged to think about all of the ways that a tool like RTD can be deployed in their organization
Disclosures The reader should be aware of the following
bull The study is commissioned by Oracle and delivered by the Forrester Consulting group
bull Forrester makes no assumptions as to the potential return on investment that other organizations will receive Forrester strongly advises that readers should use their own estimates within the framework provided in the report to determine the appropriateness of an investment in Oracle Real-Time Decisions
bull Oracle reviewed and provided feedback to Forrester but Forrester maintains editorial control over the study and its findings and does not accept changes to the study that contradict Forresterrsquos findings or obscure the meaning of the study
bull The customer name for the interview was provided by Oracle
Page 5
Forrester Consulting
Total Economic Impact Of Oracle Real-Time Decisions
TEI Framework And Methodology
Introduction From the information provided in the interviews Forrester has constructed a Total Economic Impacttrade framework for those organizations considering implementing Oracle Real-Time Decisions The objective of the framework is to identify the cost benefit flexibility and risk factors that affect the investment decision
Approach And Methodology Forrester took a multistep approach to evaluate the impact that Oracle Real-Time Decisions can have on an organization (see Figure 2) Specifically we
bull Interviewed Oracle marketing and sales personnel and Forrester analysts to gather data relative to RTD and the marketplace for real-time recommendation engines
bull Interviewed one organization currently using RTD to obtain data with respect to costs benefits and risks
bull Constructed a financial model representative of the interviews using the TEI methodology The financial model is populated with the cost and benefit data obtained from the interviews as applied to the composite organization
Figure 2 TEI Approach
Construct financial model using TEI
framework
Write case study
Perform due diligence
Conduct customer interviews
Source Forrester Research Inc
Forrester employed four fundamental elements of TEI in modeling RTD
1 Costs
2 Benefits to the entire organization
3 Flexibility
4 Risk
Given the increasing sophistication that enterprises have regarding ROI analyses related to IT investments Forresterrsquos TEI methodology serves the purpose of providing a complete picture of the total economic impact of purchase decisions Please see Appendix A for additional information on the TEI methodology
Page 6
Forrester Consulting
Total Economic Impact Of Oracle Real-Time Decisions
Analysis
Interview Highlights The customer interviewed for this study is a financial services provider The company has operations across the United States and more than 20000 employees A significant portion of revenues come via online channels
The individual interviewed for the study is a member of the companywide technology leadership team and describes himself as ldquoa steward of the technology innovation processrdquo He said his job responsibility is to ldquocultivate a strategic vision of how technology can help the business and how disruptive technologies can help achieve quantum leaps in competitiveness RTD has been one of the gems in my total body of work hererdquo
The interview uncovered the following salient points
bull RTD fundamentally altered how the organization understands its value proposition to customers RTD has builtshyinautomated learning capabilities using behavioral observations
o ldquoRTD taught us in two months that we were sub-optimizing our sales Customers didnrsquot want the lowest cost overall they wanted the best fit solution at the lowest cost for that fit No rules engine would ever detect that or fix our cultural biasrdquo
o ldquoDecades of accumulated culture processes and training were based on the premise that we needed to be a low cost provider We were ecstatic and surprised when RTD discovered that was not entirely the caserdquo
bull Having a decision support engine that operates in real-time is critical to achieving the financial benefits
o ldquoAny time there is a customer interaction nothing beats real-time analysis and heuristicsrdquo
o ldquoIf we tried to do everything with a traditional business rules based solution it would be very cumbersome and difficult to maintainrdquo
bull RTD is very useful in formulating and testing hypotheses to improve sales and competitive differentiation
o ldquoWe are a metrics driven organization We can assign a value to every eCommerce widget We are also a testing organization we operate under the presumption that in order to exploit hidden value we have to constantly experiment with customer experiences RTD make this process much more effectiverdquo
o ldquoHistorically we could only test one hypothesis at a time which was very time consuming By the time we thought we figured it all out the opportunity may have already passed RTD has sped this process up considerably resulting in new revenue opportunitiesrdquo
o ldquoWe hypothesized some unusual use cases That is when we brought Oracle in to explore if RTD would be of value and it wasrdquo
bull Properly modeling business hypotheses is critical to success and finding the right integration partner makes this possible
Page 7
Forrester Consulting
Total Economic Impact Of Oracle Real-Time Decisions
o ldquoThere were two or three really difficult nuts to crack It helps to have someone around who has done this before That is why it was important to get the right consulting company involvedrdquo
o ldquoWe were very careful in how we modeled the hypotheses for testing We ran half of the quoting process in RTD and half business as usual Getting the number of transactions between the various control groups to equal was a challenge It was important to get this right since the benefits were so dramatic we had to show that the study was well designedrdquo
bull The company created stringent criteria for evaluating the various decision support solution options
o ldquoWe were looking for a generalized platform for customer experience and business process optimizationrdquo
o ldquoRTD was the first product we encountered that had what we were looking for We then looked at other platforms that alleged to have similar capabilities There were some fundamental differences that made RTD the preferred choicerdquo
Rules versus data mining mdash ldquoA rules only solution would not solve our business challenges Classic business intelligence solutions would not scalerdquo
Website versus all channel optimization mdash ldquoWe looked at several campaign management solutions that were only relevant for e-commerce We need something that addressed online channels and call centersrdquo
CRM versus decision analytics solution mdash ldquoWe did not want to buy a whole CRM system just to get the real-time decisions solution we needed Most of the solutions we looked at that might meet our needs were intelligence layers on top of a full blown CRM solutionrdquo
bull The customer has undertaken a series of projects each designed to address a unique business challenge and generate additional revenue
o ldquoThe initial pilot looked at ways to reduce shopping cart abandonment and to improve the sales funnel The initial objective was to increase sales by changing how we position our offerings to potential customersrdquo This was expanded from the online channel to call centers and went live in December 2007 It also looked for opportunities to up-sell additional services
o ldquoOur second project was to follow up with potential customers who register as part of the new quote generation process but do not complete the purchase We use information we gathered online to customize a follow-up email inviting them to come back and continue the process We can customize the tone theme and content of the emailrdquo
o ldquoThe third project was focused on getting existing customers to enroll in services that increase loyalty and reduce churn These services include electronic funds transfer (EFT) paperless statements automatic credit card processing etcrdquo RTD helped identify which theme to use to improve adoption ie green cost savings etc
Page 8
Forrester Consulting
Total Economic Impact Of Oracle Real-Time Decisions
o ldquoThe project currently under way is designed to predict retention events and take proactive steps to reduce customer churnrdquo
Framework Assumptions Table 2 provides the model assumptions that Forrester used in this analysis
Table 2 Model Assumptions
Ref Metric Value
A1 Annual fully burdened compensationdagger per internal resource $130000
daggerIncludes salary variable compensation and all direct benefits (eg disability insurance)
Source Forrester Research Inc
The discount rate used in the PV and NPV calculations is 10 and time horizon used for the financial modeling is three years Organizations typically use discount rates between 8 and 16 based on their current environment Readers are urged to consult with their respective companyrsquos finance department to determine the most appropriate discount rate to use within their own organizations
Some values in the study are rounded to the nearest dollar Therefore some calculation results shown in the tables may be off by up to a few dollars
Costs This section describes the direct costs of implementing Oracle RTD projects and the ongoing management costs Some of the costs in this section reflect Forresterrsquos best estimates of what a new customer should expect to pay and may not be what the interviewed customer actually spent
The majority of the effort and costs were incurred in the initial period and in Year 2 when the two projects were undertaken The incremental costs shown in Year 2 are because of an increase in scope mdash the second project mdash and not an increase in complexity
Internal Implementation Labor The interviewed customer followed a process similar to Oraclersquos Rapid Start methodology For each new project a similar timeline was followed mdash three months of development followed by three months of pilot The development activities include formulating hypotheses defining the interaction optimization model and rules and defining the test protocols installing additional hardware and the RTD system as needed configuring and testing RTD settings and scripts and integrating into other required backend systems eg databases CRM marketing campaign systems etc
Page 9
Forrester Consulting
Total Economic Impact Of Oracle Real-Time Decisions
Once the development effort was completed three months was spent monitoring analyzing and fine-tuning the campaign
The interviewee said that he ldquoalways felt a well defined pilot with clearly defined targets and end criteria is essential for success Close collaboration between ourselves Oracle and our integration partner was necessary to make this happenrdquo
For the initial project three FTEs spent three months working on development This effort was split between project management business analysts and system developers During the pilot one business analyst spent three months analyzing and fine-tuning the campaign criteria and testing protocols within RTD Three months of development x three FTEs and three months in pilot x 1 FTE all at $10833 per month is equal to a total internal labor cost of $130000 for the initial project A similar delivery process was followed for the second project in Year 2
Table 3 Internal Implementation Labor
Ref Metric Calculation Initial Year 1 Year 2 Year 3 Total
B1 Number of months - development 3 3
B2 Number of FTEs - development 3 3
B3 Number of months - pilot 3 3
B4 Number of FTEs - pilot 1 1
B5 Monthly fully burdened cost A112 $10833 $10833
Bt Internal implementation labor ((B1B2)+(B3B4))B5 $130000 $130000 $260000
Source Forrester Research Inc
Professional Services The interviewed customer repeatedly said that having the right integration partner is critical to successfully implementing RTD and creating valuable campaigns The integration partner was used for each new project to define the campaigns and set up the RTD system Projects were designed so that ongoing management was fully in the hands of internal resources lowering ongoing operating costs
Forrester estimates that professional service costs will be higher for the first project because of the added time for setting up the systems and knowledge transfer
Page 10
Forrester Consulting
Total Economic Impact Of Oracle Real-Time Decisions
Table 4 Professional Services
Ref Metric Calculation Initial Year 1 Year 2 Year 3 Total
C1 Development phase $300000 $150000
C2 Pilot phase $100000 $50000
Ct Professional services C1+C2 $400000 $200000 $600000
Source Forrester Research Inc
Hardware The interviewed customer set up the RTD solution in development testing and production environments This can vary from customer to customer depending on how intensively they are using RTD and the nature of their RTD license model mdash per processor versus ULA Additional hardware was added for each new project because of the need for greater computing power and because some of the projects were for different parts of the organization and being run completely independent
Readers are encouraged to work with Oracle or an integration partner to properly scope out their hardware requirements
Table 5 Hardware
Ref Metric Calculation Initial Year 1 Year 2 Year 3 Total
D1 Number of blade servers added
8 0 8 0
D2 Cost per blade $16000 $16000 $16000 $16000
D3 Total purchase costs D1D2 $128000 $0 $128000 $0
D4 Maintenance D3[through current year]10 $0 $12800 $25600 $25600
Dt Hardware D3+D4 $128000 $12800 $153600 $25600 $320000
Source Forrester Research Inc
Page 11
Forrester Consulting
Total Economic Impact Of Oracle Real-Time Decisions
RTD Licenses And Support RTD license costs can be based on a per dual-core CPU basis or as part of an Oracle ULA Often a customer will begin with a per-CPU license model and then transition to a ULA when the economics make sense That is the model the interviewed customer followed
The per-CPU license cost varies based on the number of years contracted as well as volume discounts Standard RTD license costs are published on the Oracle website Annual support is charged at 22 of the acquisition price The licenses costs presented are Forresterrsquos estimate of what a new customer should expect to pay in licenses for an installation similar in size and scope to that of the interviewed customer
Additional licenses were added in Year 2 to accommodate the new project
Table 6 RTD Licenses And Support
Ref Metric Calculation Initial Year 1 Year 2 Year 3 Total
E1 Number of dual-core CPUs added
E1 4 CPUs per blade
32 0 32 0
E2 Licenses cost per CPU (perpetual usage)
$92000 $92000 $92000 $92000
E3 Total license costs E1E2 $2944000 $0 $2944000 $0
E4 Software update and support
E3[through current year]22
$647680 $1295360 $1295360
Et RTD licenses and support E3+E5 $2944000 $647680 $4239360 $1295360 $9126400
Source Forrester Research Inc
Ongoing Campaign Management Labor Each RTD projectcampaign should be closely managed on an ongoing basis to analyze results and refine business logic RTD campaigns are all about continual improvement through observation experimentation and analysis A company may want to organize a centralized group with RTD skills or may choose to disperse these resources across the various relevant parts of the organization This will depend more on how the readerrsquos organization generally structures itself
For the interviewee the RTD business analysts were initially spread across the marketing organizations Based on the now widespread use of RTD there is a reorganization effort under way to create a centralized RTD decision management team
Page 12
Forrester Consulting
Total Economic Impact Of Oracle Real-Time Decisions
Table 7 Ongoing Campaign Management Labor
Ref Metric Calculation Initial Year 1 Year 2 Year 3 Total
F1 Number of FTEs 1 FTE per campaignproject
1 2 2
F2 Annual fully burdened cost A1 $130000 $130000 $130000
Ft Ongoing campaign management labor
F1F2 $130000 $260000 $260000 $650000
Source Forrester Research Inc
Total Costs Table 8 summarizes the costs for the implementation and ongoing campaign management for two RTD projects The increased costs in Year 2 are attributable to the completion of a second RTD project
Table 8 Total Costs
Ref Costs Initial Year 1 Year 2 Year 3 Total
Bt Internal implementation labor ($130000) ($130000) ($260000)
Ct Professional services ($400000) ($200000) ($600000)
Dt Hardware ($128000) ($12800) ($153600) ($25600) ($320000)
Et RTD licenses and support ($2944000) ($647680) ($4239360) ($1295360) ($9126400)
Ft Ongoing campaign management labor
($130000) ($260000) ($260000) ($650000)
Total ($3602000) ($790480) ($4982960) ($1580960) ($10956400)
Source Forrester Research Inc
Benefits The first half of this section details the quantitative benefits included in the ROI The second half describes qualitative benefits that the interviewed customer described but could not be quantified for this study They are not part of the ROI
Page 13
Forrester Consulting
Total Economic Impact Of Oracle Real-Time Decisions
analysis Readers should take the qualitative benefits into consideration when analyzing the total benefits their organization may realize by utilizing the RTD solution
Increased Closure Rate Revenue The first benefit that the interviewed company was seeking to achieve with RTD was to improve the conversion rates from quote requests to actually buying Stated another way the company wanted to reduce shopping cart abandonment Even a small improvement in this area could have huge impacts in terms of additional revenue The interviewee said ldquoWe have a rather mature highly tuned online platform All of the low hanging fruit has long been picked So anything approaching a 1 point lift in closure rate is considered quite spectacular The various RTD-driven optimizations in place have no doubt contributed to this outcomerdquo
The number of new sales because of RTD is directly related to the number of quote requests received mdash both through the online and call center channels Over the life of the study the number of overall quote requests decreased year-onshyyear for a variety of reasons not related to RTD The result is fewer new sales each year even though the closure rate continued to improve because of RTD
In the first year of the study approximately 08 point more quote requests were converted into sales This increased to 10 beginning in Year 2 This improvement is attributable to the self-learning capabilities of RTD as well as the ongoing hypothesis testing and campaign refinement work completed by the decision management team The interviewee was not able to share the baseline closure rates because it is considered highly confidential By example if the original close rate was 400 of all quote requests in Year 0 it would be 408 in Year 1 and 410 in years 2 and 3 Once a new sale is made that revenue continues year after year unless the customer leaves mdash customer churn Forrester assumed a 25 annual churn rate based on industry averages
Readers are encouraged to think about opportunities to reduce cart abandonment or otherwise improve the sales funnel using a tool like RTD and calculate what the potential upside can be
Page 14
Forrester Consulting
Total Economic Impact Of Oracle Real-Time Decisions
Table 9 Increase Closure Rate Revenue
Ref Metric Calculation Year 1 Year 2 Year 3 Total
G1 Percentage point closure rate lift
08 10 10
G2 Incremental of new sales from RTD
14400 13600 12500
G3 Estimated churn rate Forrester assumption 25 25 25
G4 Cumulative of incremental sales from RTD
(G4[previous year](1shyG5))+G2[current year]
14400 24400 32020
G5 Average annual sale price $740 $740 $740
Gt Improved closure rate revenue
G4G5 $10656000 $18056000 $23694800 $52406800
Source Forrester Research Inc
Incremental Deal Size Revenue Table 9 shows an average sale price of $740 As part of the initial project the company also looked at way to increase the average price This was done by targeting additional services based on real-time observed behaviors and assumptions based on past experiences ldquoIf the RTD predictive models discovered that informing specific prospects about additional options could jeopardize the sale it wouldnrsquot be offered For those customers that the closure rate would not be affected we would educate them on those optionsrdquo
The result was a $10 increase in the average price for all sales in Year 1 not just for those closed because of RTD This increased to $12 in years 2 and 3 This improvement is attributable to the self-learning and predictive modeling capabilities of RTD along with the ongoing efforts of the decision management team to identify new areas for improvement
Page 15
Forrester Consulting
Total Economic Impact Of Oracle Real-Time Decisions
Table 10 Incremental Deal Size Revenue
Ref Metric Calculation Year 1 Year 2 Year 3 Total
H1 Incremental of new sales from RTD G2 14400 13600 12500
H2 of new ldquobusiness as usual sales
720000 680000 624000
H3 Total annual of new sales H1+H2 734400 693600 636500
H4 Cumulative of new sales
(H4[previous year](1shyG3))+H3[current year]
734400 1244400 1569800
H5 Average increase in sale price
$10 $12 $12
Ht Incremental deal size revenue
H4H5 $7344000 $14932800 $18837600 $41114400
Source Forrester Research Inc
Post Cart Abandonment Follow-Up Campaign Revenue A subsequent project was looking at the potential customers who initiated the quote process online but still did not purchase Using information captured during the registration and quoting process the company used RTD to identify highly personalized content to include in follow-up emails as part of a campaign to win this business These emails could be highly targeted in terms of tone theme (green vs dollar savings) color scheme subject line etc
This outbound campaign was highly successful The company estimates that they ldquorealized approximately a 1 point lift from that campaign We were able to close more business than without RTD and that results in tens of thousands of new sales every yearrdquo Once again the interviewee was not able to share the existing closure rates in order to show the full calculation This benefit is calculated using the improved sale price described earlier
Page 16
Forrester Consulting
Total Economic Impact Of Oracle Real-Time Decisions
Table 11 Post Cart Abandonment Follow-Up Campaign Revenue
Ref Metric Calculation Year 1 Year 2 Year 3 Total
I1 Number of additional sales 0 25000 50000
I2 Cumulative of additional sales (I2[previous year](1shyG3))+I1[current year]
0 25000 68750
I3 Average annual price G5+H5 $750 $752 $752
It Post cart abandonment follow-up campaign revenue
I1I2 $0 $18800000 $37600000 $56400000
Source Forrester Research Inc
Total Benefits Table 12 summarizes the total quantified benefits the interviewed company realized through RTD projects
Table 12 Total Quantified Benefits
Ref Benefits Year 1 Year 2 Year 3 Total
Gt Improved closure rate revenue $10656000 $18056000 $23694800 $52406800
Ht Incremental sale price revenue $7344000 $14932800 $18837600 $41114400
It Post cart abandonment follow-up campaign revenue
$18800000 $37600000 $56400000
Total $18000000 $51788800 $80132400 $149921200
Source Forrester Research Inc
Qualitative Benefits
Greater Customer Retention And Lifetime Value
The benefits quantified earlier show the financial contribution for the first three years In reality these benefits will continue as long as the individual remains a customer A third project was undertaken to increase customer loyalty RTD is being used to target messages to improve enrollment customers in paperless billing ETF and other programs
Page 17
Forrester Consulting
Total Economic Impact Of Oracle Real-Time Decisions
that have been shown to increase customer loyalty Enrollment has improved because of RTD ldquoI can say with some certainty that our retention rate has improved over the last two consecutive years Each one-tenth of one percent improvement in retention is worth a lot to the bottom line If we can keep a customer for three years we can keep them for liferdquo This benefit was not included in the ROI analysis because the information is kept highly confidential by the interviewed company
Another benefit of improved retention is cost avoidance for having to acquire new customers It costs the interviewed company five times more to acquire a new customer compared with retaining an existing customer Reducing customer churn reduces overall customer acquisition costs
Better Business Intelligence
As discussed earlier the organization interviewed places a heavy value on business analysis and continual improvement RTD has helped in understanding the business fundamentals and customersrsquo wants
ldquoWe have changed how we approach customers in terms of what we say when we contact them etc Some emails go out at different times of day based on when there is an increased likelihood of it being read People will usually say what they think is the correct answer but if you observe their behavior they canrsquot lie We learn a lot more about who our customers really are and what they really wantrdquo
RTD also allows the company to better structure customer analytics and research projects It can easily change weighting and factors to determine what works best RTD also allows for multiple experiments to be run at the same time with the ability to control for each experiment individually These experiments can also be completed more quickly and the outcomes put into general use This results in additional revenues because previous analysis methods would often discover the opportunities too late to be monetized
Improved Customer Experiences
The financial services industry is highly regulated which limits the extent to which providers can compete on price Therefore improving customer service is extremely important in attracting and retaining customers Enhanced personalization and predictive modeling makes for an overall more valuable customer experience
ldquoWe want to easily give customers what they want when they want it We can be predictive based on IP address search words average demographics past histories etc This can be used to tailor the landing page and all aspects of the online and call center experience The goal is to deliver relevance to each visitor We also learn more using RTD than we otherwise could Without RTD I donrsquot know how we would do any o f this as effectively Since sales price and fundamental product structure is largely regulated we focus on the long tail of customer experience as our differentiatorrdquo
Flexibility Flexibility as defined by TEI represents an investment in additional capacity or capability that could be turned into business benefit for some future additional investment This provides an organization with the ldquorightrdquo or the ability to engage in future initiatives but not the obligation to do so There are multiple scenarios in which a customer might choose to implement RTD and later realize additional uses and business opportunities Flexibility would also be quantified when evaluated as part of a specific project (described in more detail in Appendix A)
Page 18
Forrester Consulting
Total Economic Impact Of Oracle Real-Time Decisions
The RTD platform is very flexible in terms of quickly initiating and running multiple campaigns targeted at different areas of the value chain It can also enable an organization to do more with fewer people resources The interviewee said that with RTD they can be ldquomore efficient faster and more agilerdquo New projects can be completed faster at a lower incremental cost
To a large extent the uses of RTD are only limited by the imagination for the interviewed customer They ldquosee a lot of opportunity to be more strategic in the use of the platform for customer touch projectsrdquo A project recently launched is looking at real-time customer analysis during a phone call to identify potential upcoming retention events and make suggestions to the agent to improve retention
For each new project there may be an incremental investment in licenses (depending on if a ULA is in place) hardware internal labor and professional services For the projects already completed by this RTD customer the ROI for each project has been significant No future flexibility benefits have been included in the ROI analysis
Risk Forrester defines two types of risk associated with this analysis implementation risk and impact risk ldquoImplementation riskrdquo is the risk that a proposed investment in RTD may deviate from the original or expected requirements resulting in higher costs than anticipated ldquoImpact riskrdquo refers to the risk that the business or technology needs of the organization may not be met by the investment in RTD resulting in lower overall total benefits The greater the uncertainty the wider the potential range of outcomes for cost and benefit estimates
Quantitatively capturing investment and impact risk by directly adjusting the financial estimates results in more meaningful and accurate estimates and a more accurate projection of the ROI In general risks affect costs by raising the original estimates and they affect benefits by reducing the original estimates The risk-adjusted numbers should be taken as ldquorealisticrdquo expectations since they represent the expected values considering risk
The following implementation risks that affect costs are identified as part of this analysis
bull The implementation project could go longer than expected or fail due to technical complexities of integrating RTD with other backend systems ie CRM DBMS etc This risk can be largely mitigated by engaging with a system integrator that has previous relevant experiences implementing RTD
bull Understanding the Oracle licensing model is also important for avoiding cost overruns Readers should consider their likely usage in order to identify the best initial model and constantly be looking to determine if it makes sense to move between a ULA and per CPU license
The following impact risks that affect benefits are identified as part of the analysis
bull RTD involves experimentation with actual customers In all likelihood not all experiments will deliver the desired results This could result in lost revenue for a segment of customers The interviewee described this as the ldquocost of experimentationrdquo This risk along with the risk of other unintended consequences being introduced into production can be mitigated by architecting the solution so that turning off RTD will revert the underlying systems to their original state That way if the RTD goes down or needs to be taken off line the other systems and business logic all remain intact This was described as a best practice by the interviewee
Page 19
Forrester Consulting
Total Economic Impact Of Oracle Real-Time Decisions
bull There is also the risk of suboptimal results because of the lack of expertise to build score and iterate RTD campaigns This can be mitigated by engaging with an experienced integration partner and providing the necessary training to internal resources
bull RTD requires a certain level of trust from employees ie call center staff if they are to follow the system recommendations This requires adequate training to ensure that all parties are comfortable with the system and understand how it changes peoplersquos daily responsibilities
Table 13 shows the values used to adjust for risk and uncertainty in the cost and benefit estimates The TEI model uses a triangular distribution method to calculate risk-adjusted values To construct the distribution it is necessary to first estimate the low most likely and high values that could occur within the current environment The risk-adjusted value is the mean of the distribution of those points Readers are urged to apply their own risk ranges based on their own degree of confidence in the cost and benefit estimates
Table 13 Cost And Benefit Risk Adjustments
Costs Low Most likely High Mean
Internal implementation labor (medium risk) 100 100 115 105
Professional services (medium risk) 100 100 115 105
Hardware (medium risk) 100 100 115 105
RTD licenses and support (medium risk) 100 100 115 105
Ongoing campaign management labor (medium risk) 100 100 115 105
Benefits Low Most likely High Mean
Improved closure rate revenue (medium risk) 80 100 95 92
Incremental deal size revenue (medium risk) 80 100 95 92
Post cart abandonment follow-up campaign revenue (medium risk)
80 100 95 92
Source Forrester Research Inc
Page 20
mdash
mdash
Forrester Consulting
Total Economic Impact Of Oracle Real-Time Decisions
Financial Summary
The financial results calculated in the Costs and Benefits sections can be used to determine the return on investment net present value and payback period for the organizationrsquos investment in Oracle Real-Time Decisions The financial results are based on rigorous testing methodologies followed by the customer These include using control groups and blind testing of hypotheses These are shown in Table 14 below
Table 14 Cash Flow mdash Non-Risk-Adjusted
Cash flow Original estimates
Initial Year 1 Year 2 Year 3 Total Present value
Costs ($3602000) ($790480) ($4982960) ($1580960) ($10956400) ($9626566)
Benefits $18000000 $51788800 $80132400 $149921200 $119368956
Net benefits ($3602000) $17209520 $46805840 $78551440 $138964800 $109742390
ROI 1140
Payback period 2 Months
Source Forrester Research Inc
Table 15 below shows the risk-adjusted ROI NPV and payback period values These values are determined by applying the risk-adjustment values from Table 13 in the Risk section to the cost and benefits numbers in Tables 8 and 12
Table 15 Cash Flow mdash Risk-Adjusted
Cash flow Risk-adjusted estimates
Initial Year 1 Year 2 Year 3 Total Present value
Costs ($3782100) ($830004) ($5232108) ($1660008) ($11504220) ($10107894)
Benefits $16560000 $47645696 $73721808 $137927504 $109819439
Net benefits ($3782100) $15729996 $42413588 $72061800 $126423284 $99711545
ROI 986
Payback period 3 Months
Source Forrester Research Inc
Page 21
Forrester Consulting
Total Economic Impact Of Oracle Real-Time Decisions
Figure 3 Summary Financial Results Risk-Adjusted
$90000000
$70000000
$50000000
$30000000
$10000000
($10000000) ($3782100)
$10517896
$45570448
$99711545
Initial Year 1 Year 2 Year 3
Costs (PV) Benefits (PV) Cumulative cash flow (NPV)
Source Forrester Research Inc
Page 22
Forrester Consulting
Total Economic Impact Of Oracle Real-Time Decisions
Oracle Real-Time Decisions Overview
According to Oracle Oraclersquos Real-Time Decisions (RTD) platform combines both rules and predictive analytics to power solutions for real-time enterprise decision management It enables real-time intelligence to be instilled into any type of business process or customer interaction A high-performance transactional server delivers real-time decisions and recommendations This server automatically renders decisions within a business process and reveals insights creating actionable intelligence from data flowing through the process in real time
Appendix A Total Economic Impacttrade Overview
Total Economic Impact is a methodology developed by Forrester Research that enhances a companyrsquos technology decision-making processes and assists vendors in communicating the value proposition of their products and services to clients The TEI methodology helps companies demonstrate justify and realize the tangible value of IT initiatives to both senior management and other key business stakeholders
The TEI methodology consists of four components to evaluate investment value benefits costs risks and flexibility
Benefits Benefits represent the value delivered to the user organization mdash IT andor business units mdash by the proposed product or project Often product or project justification exercises focus just on IT cost and cost reduction leaving little room to analyze the effect of the technology on the entire organization The TEI methodology and the resulting financial model place equal weight on the measure of benefits and the measure of costs allowing for a full examination of the effect of the technology on the entire organization Calculation of benefit estimates involves a clear dialogue with the user organization to understand the specific value that is created In addition Forrester also requires that there be a clear line of accountability established between the measurement and justification of benefit estimates after the project has been completed This ensures that benefit estimates tie back directly to the bottom line
Costs Costs represent the investment necessary to capture the value or benefits of the proposed project IT or the business units may incur costs in the form of fully burdened labor subcontractors or materials Costs consider all the investments and expenses necessary to deliver the proposed value In addition the cost category within TEI captures any incremental costs over the existing environment for ongoing costs associated with the solution All costs must be tied to the benefits that are created
Risk Risk measures the uncertainty of benefit and cost estimates contained within the investment Uncertainty is measured in two ways 1) the likelihood that the cost and benefit estimates will meet the original projections and 2) the likelihood that the estimates will be measured and tracked over time TEI applies a probability density function known as ldquotriangular distributionrdquo to the values entered At minimum three values are calculated to estimate the underlying range around each cost and benefit
Page 23
Forrester Consulting
Total Economic Impact Of Oracle Real-Time Decisions
Flexibility Within the TEI methodology direct benefits represent one part of the investment value While direct benefits can typically be the primary way to justify a project Forrester believes that organizations should be able to measure the strategic value of an investment Flexibility represents the value that can be obtained for some future additional investment building on top of the initial investment already made For instance an investment in an enterprisewide upgrade of an office productivity suite can potentially increase standardization (to increase efficiency) and reduce licensing costs However an embedded collaboration feature may translate to greater worker productivity if activated The collaboration can only be used with additional investment in training at some future point in time However having the ability to capture that benefit has a present value that can be estimated The flexibility component of TEI captures that value
Appendix B Glossary
Discount rate The interest rate used in cash flow analysis to take into account the time value of money Although the Federal Reserve Bank sets a discount rate companies often set a discount rate based on their business and investment environment Forrester assumes a yearly discount rate of 10 for this analysis Organizations typically use discount rates between 8 and 16 based on their current environment Readers are urged to consult their respective organization to determine the most appropriate discount rate to use in their own environment
Net present value (NPV) The present or current value of (discounted) future net cash flows given an interest rate (the discount rate) A positive project NPV normally indicates that the investment should be made unless other projects have higher NPVs
Present value (PV) The present or current value of (discounted) cost and benefit estimates given at an interest rate (the discount rate) The PV of costs and benefits feed into the total net present value of cash flows
Payback period The breakeven point for an investment The point in time at which net benefits (benefits minus costs) equal initial investment or cost
Return on investment (ROI) A measure of a projectrsquos expected return in percentage terms ROI is calculated by dividing net benefits (benefits minus costs) by costs
A Note On Cash Flow Tables The following is a note on the cash flow tables used in this study (see the example table below) The initial investment column contains costs incurred at ldquotime 0rdquo or at the beginning of Year 1 Those costs are not discounted All other cash flows in Years 1 through 3 are discounted using the discount rate (shown in Framework Assumptions section) at the end of the year Present value (PV) calculations are calculated for each total cost and benefit estimate Net present value (NPV) calculations are not calculated until the summary tables and are the sum of the initial investment and the discounted cash flows in each year
Page 24
Forrester Consulting
Total Economic Impact Of Oracle Real-Time Decisions
Table [Example] Example Table
Ref Category Calculation Initial cost Year 1 Year 2 Year 3 Total
Source Forrester Research Inc
Appendix C Supplemental Material
Related Forrester Research ldquoDefining The Online Marketing Suiterdquo Forrester Research Inc October 17 2007
Appendix D Endnotes
1 Forrester risk-adjusts the summary financial metrics to take into account the potential uncertainty of the cost and benefit estimates
Page 25
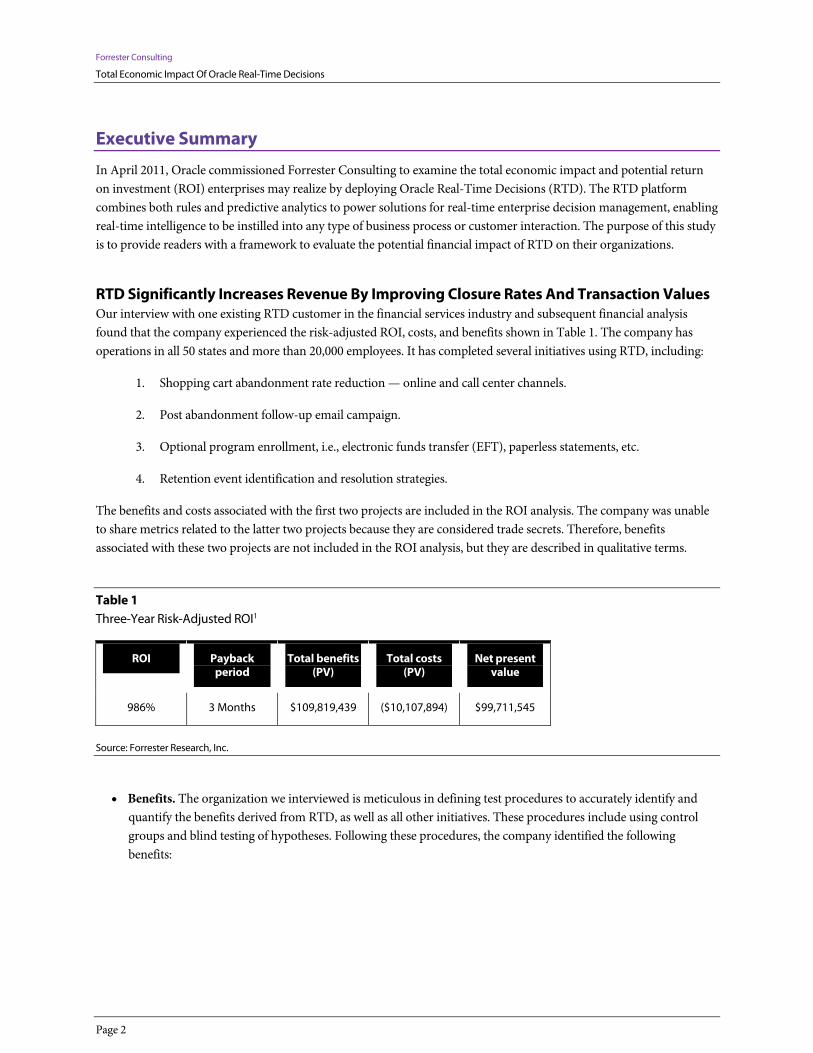
Forrester Consulting
Total Economic Impact Of Oracle Real-Time Decisions
Once the development effort was completed three months was spent monitoring analyzing and fine-tuning the campaign
The interviewee said that he ldquoalways felt a well defined pilot with clearly defined targets and end criteria is essential for success Close collaboration between ourselves Oracle and our integration partner was necessary to make this happenrdquo
For the initial project three FTEs spent three months working on development This effort was split between project management business analysts and system developers During the pilot one business analyst spent three months analyzing and fine-tuning the campaign criteria and testing protocols within RTD Three months of development x three FTEs and three months in pilot x 1 FTE all at $10833 per month is equal to a total internal labor cost of $130000 for the initial project A similar delivery process was followed for the second project in Year 2
Table 3 Internal Implementation Labor
Ref Metric Calculation Initial Year 1 Year 2 Year 3 Total
B1 Number of months - development 3 3
B2 Number of FTEs - development 3 3
B3 Number of months - pilot 3 3
B4 Number of FTEs - pilot 1 1
B5 Monthly fully burdened cost A112 $10833 $10833
Bt Internal implementation labor ((B1B2)+(B3B4))B5 $130000 $130000 $260000
Source Forrester Research Inc
Professional Services The interviewed customer repeatedly said that having the right integration partner is critical to successfully implementing RTD and creating valuable campaigns The integration partner was used for each new project to define the campaigns and set up the RTD system Projects were designed so that ongoing management was fully in the hands of internal resources lowering ongoing operating costs
Forrester estimates that professional service costs will be higher for the first project because of the added time for setting up the systems and knowledge transfer
Page 10
Forrester Consulting
Total Economic Impact Of Oracle Real-Time Decisions
Table 4 Professional Services
Ref Metric Calculation Initial Year 1 Year 2 Year 3 Total
C1 Development phase $300000 $150000
C2 Pilot phase $100000 $50000
Ct Professional services C1+C2 $400000 $200000 $600000
Source Forrester Research Inc
Hardware The interviewed customer set up the RTD solution in development testing and production environments This can vary from customer to customer depending on how intensively they are using RTD and the nature of their RTD license model mdash per processor versus ULA Additional hardware was added for each new project because of the need for greater computing power and because some of the projects were for different parts of the organization and being run completely independent
Readers are encouraged to work with Oracle or an integration partner to properly scope out their hardware requirements
Table 5 Hardware
Ref Metric Calculation Initial Year 1 Year 2 Year 3 Total
D1 Number of blade servers added
8 0 8 0
D2 Cost per blade $16000 $16000 $16000 $16000
D3 Total purchase costs D1D2 $128000 $0 $128000 $0
D4 Maintenance D3[through current year]10 $0 $12800 $25600 $25600
Dt Hardware D3+D4 $128000 $12800 $153600 $25600 $320000
Source Forrester Research Inc
Page 11
Forrester Consulting
Total Economic Impact Of Oracle Real-Time Decisions
RTD Licenses And Support RTD license costs can be based on a per dual-core CPU basis or as part of an Oracle ULA Often a customer will begin with a per-CPU license model and then transition to a ULA when the economics make sense That is the model the interviewed customer followed
The per-CPU license cost varies based on the number of years contracted as well as volume discounts Standard RTD license costs are published on the Oracle website Annual support is charged at 22 of the acquisition price The licenses costs presented are Forresterrsquos estimate of what a new customer should expect to pay in licenses for an installation similar in size and scope to that of the interviewed customer
Additional licenses were added in Year 2 to accommodate the new project
Table 6 RTD Licenses And Support
Ref Metric Calculation Initial Year 1 Year 2 Year 3 Total
E1 Number of dual-core CPUs added
E1 4 CPUs per blade
32 0 32 0
E2 Licenses cost per CPU (perpetual usage)
$92000 $92000 $92000 $92000
E3 Total license costs E1E2 $2944000 $0 $2944000 $0
E4 Software update and support
E3[through current year]22
$647680 $1295360 $1295360
Et RTD licenses and support E3+E5 $2944000 $647680 $4239360 $1295360 $9126400
Source Forrester Research Inc
Ongoing Campaign Management Labor Each RTD projectcampaign should be closely managed on an ongoing basis to analyze results and refine business logic RTD campaigns are all about continual improvement through observation experimentation and analysis A company may want to organize a centralized group with RTD skills or may choose to disperse these resources across the various relevant parts of the organization This will depend more on how the readerrsquos organization generally structures itself
For the interviewee the RTD business analysts were initially spread across the marketing organizations Based on the now widespread use of RTD there is a reorganization effort under way to create a centralized RTD decision management team
Page 12
Forrester Consulting
Total Economic Impact Of Oracle Real-Time Decisions
Table 7 Ongoing Campaign Management Labor
Ref Metric Calculation Initial Year 1 Year 2 Year 3 Total
F1 Number of FTEs 1 FTE per campaignproject
1 2 2
F2 Annual fully burdened cost A1 $130000 $130000 $130000
Ft Ongoing campaign management labor
F1F2 $130000 $260000 $260000 $650000
Source Forrester Research Inc
Total Costs Table 8 summarizes the costs for the implementation and ongoing campaign management for two RTD projects The increased costs in Year 2 are attributable to the completion of a second RTD project
Table 8 Total Costs
Ref Costs Initial Year 1 Year 2 Year 3 Total
Bt Internal implementation labor ($130000) ($130000) ($260000)
Ct Professional services ($400000) ($200000) ($600000)
Dt Hardware ($128000) ($12800) ($153600) ($25600) ($320000)
Et RTD licenses and support ($2944000) ($647680) ($4239360) ($1295360) ($9126400)
Ft Ongoing campaign management labor
($130000) ($260000) ($260000) ($650000)
Total ($3602000) ($790480) ($4982960) ($1580960) ($10956400)
Source Forrester Research Inc
Benefits The first half of this section details the quantitative benefits included in the ROI The second half describes qualitative benefits that the interviewed customer described but could not be quantified for this study They are not part of the ROI
Page 13
Forrester Consulting
Total Economic Impact Of Oracle Real-Time Decisions
analysis Readers should take the qualitative benefits into consideration when analyzing the total benefits their organization may realize by utilizing the RTD solution
Increased Closure Rate Revenue The first benefit that the interviewed company was seeking to achieve with RTD was to improve the conversion rates from quote requests to actually buying Stated another way the company wanted to reduce shopping cart abandonment Even a small improvement in this area could have huge impacts in terms of additional revenue The interviewee said ldquoWe have a rather mature highly tuned online platform All of the low hanging fruit has long been picked So anything approaching a 1 point lift in closure rate is considered quite spectacular The various RTD-driven optimizations in place have no doubt contributed to this outcomerdquo
The number of new sales because of RTD is directly related to the number of quote requests received mdash both through the online and call center channels Over the life of the study the number of overall quote requests decreased year-onshyyear for a variety of reasons not related to RTD The result is fewer new sales each year even though the closure rate continued to improve because of RTD
In the first year of the study approximately 08 point more quote requests were converted into sales This increased to 10 beginning in Year 2 This improvement is attributable to the self-learning capabilities of RTD as well as the ongoing hypothesis testing and campaign refinement work completed by the decision management team The interviewee was not able to share the baseline closure rates because it is considered highly confidential By example if the original close rate was 400 of all quote requests in Year 0 it would be 408 in Year 1 and 410 in years 2 and 3 Once a new sale is made that revenue continues year after year unless the customer leaves mdash customer churn Forrester assumed a 25 annual churn rate based on industry averages
Readers are encouraged to think about opportunities to reduce cart abandonment or otherwise improve the sales funnel using a tool like RTD and calculate what the potential upside can be
Page 14
Forrester Consulting
Total Economic Impact Of Oracle Real-Time Decisions
Table 9 Increase Closure Rate Revenue
Ref Metric Calculation Year 1 Year 2 Year 3 Total
G1 Percentage point closure rate lift
08 10 10
G2 Incremental of new sales from RTD
14400 13600 12500
G3 Estimated churn rate Forrester assumption 25 25 25
G4 Cumulative of incremental sales from RTD
(G4[previous year](1shyG5))+G2[current year]
14400 24400 32020
G5 Average annual sale price $740 $740 $740
Gt Improved closure rate revenue
G4G5 $10656000 $18056000 $23694800 $52406800
Source Forrester Research Inc
Incremental Deal Size Revenue Table 9 shows an average sale price of $740 As part of the initial project the company also looked at way to increase the average price This was done by targeting additional services based on real-time observed behaviors and assumptions based on past experiences ldquoIf the RTD predictive models discovered that informing specific prospects about additional options could jeopardize the sale it wouldnrsquot be offered For those customers that the closure rate would not be affected we would educate them on those optionsrdquo
The result was a $10 increase in the average price for all sales in Year 1 not just for those closed because of RTD This increased to $12 in years 2 and 3 This improvement is attributable to the self-learning and predictive modeling capabilities of RTD along with the ongoing efforts of the decision management team to identify new areas for improvement
Page 15
Forrester Consulting
Total Economic Impact Of Oracle Real-Time Decisions
Table 10 Incremental Deal Size Revenue
Ref Metric Calculation Year 1 Year 2 Year 3 Total
H1 Incremental of new sales from RTD G2 14400 13600 12500
H2 of new ldquobusiness as usual sales
720000 680000 624000
H3 Total annual of new sales H1+H2 734400 693600 636500
H4 Cumulative of new sales
(H4[previous year](1shyG3))+H3[current year]
734400 1244400 1569800
H5 Average increase in sale price
$10 $12 $12
Ht Incremental deal size revenue
H4H5 $7344000 $14932800 $18837600 $41114400
Source Forrester Research Inc
Post Cart Abandonment Follow-Up Campaign Revenue A subsequent project was looking at the potential customers who initiated the quote process online but still did not purchase Using information captured during the registration and quoting process the company used RTD to identify highly personalized content to include in follow-up emails as part of a campaign to win this business These emails could be highly targeted in terms of tone theme (green vs dollar savings) color scheme subject line etc
This outbound campaign was highly successful The company estimates that they ldquorealized approximately a 1 point lift from that campaign We were able to close more business than without RTD and that results in tens of thousands of new sales every yearrdquo Once again the interviewee was not able to share the existing closure rates in order to show the full calculation This benefit is calculated using the improved sale price described earlier
Page 16
Forrester Consulting
Total Economic Impact Of Oracle Real-Time Decisions
Table 11 Post Cart Abandonment Follow-Up Campaign Revenue
Ref Metric Calculation Year 1 Year 2 Year 3 Total
I1 Number of additional sales 0 25000 50000
I2 Cumulative of additional sales (I2[previous year](1shyG3))+I1[current year]
0 25000 68750
I3 Average annual price G5+H5 $750 $752 $752
It Post cart abandonment follow-up campaign revenue
I1I2 $0 $18800000 $37600000 $56400000
Source Forrester Research Inc
Total Benefits Table 12 summarizes the total quantified benefits the interviewed company realized through RTD projects
Table 12 Total Quantified Benefits
Ref Benefits Year 1 Year 2 Year 3 Total
Gt Improved closure rate revenue $10656000 $18056000 $23694800 $52406800
Ht Incremental sale price revenue $7344000 $14932800 $18837600 $41114400
It Post cart abandonment follow-up campaign revenue
$18800000 $37600000 $56400000
Total $18000000 $51788800 $80132400 $149921200
Source Forrester Research Inc
Qualitative Benefits
Greater Customer Retention And Lifetime Value
The benefits quantified earlier show the financial contribution for the first three years In reality these benefits will continue as long as the individual remains a customer A third project was undertaken to increase customer loyalty RTD is being used to target messages to improve enrollment customers in paperless billing ETF and other programs
Page 17
Forrester Consulting
Total Economic Impact Of Oracle Real-Time Decisions
that have been shown to increase customer loyalty Enrollment has improved because of RTD ldquoI can say with some certainty that our retention rate has improved over the last two consecutive years Each one-tenth of one percent improvement in retention is worth a lot to the bottom line If we can keep a customer for three years we can keep them for liferdquo This benefit was not included in the ROI analysis because the information is kept highly confidential by the interviewed company
Another benefit of improved retention is cost avoidance for having to acquire new customers It costs the interviewed company five times more to acquire a new customer compared with retaining an existing customer Reducing customer churn reduces overall customer acquisition costs
Better Business Intelligence
As discussed earlier the organization interviewed places a heavy value on business analysis and continual improvement RTD has helped in understanding the business fundamentals and customersrsquo wants
ldquoWe have changed how we approach customers in terms of what we say when we contact them etc Some emails go out at different times of day based on when there is an increased likelihood of it being read People will usually say what they think is the correct answer but if you observe their behavior they canrsquot lie We learn a lot more about who our customers really are and what they really wantrdquo
RTD also allows the company to better structure customer analytics and research projects It can easily change weighting and factors to determine what works best RTD also allows for multiple experiments to be run at the same time with the ability to control for each experiment individually These experiments can also be completed more quickly and the outcomes put into general use This results in additional revenues because previous analysis methods would often discover the opportunities too late to be monetized
Improved Customer Experiences
The financial services industry is highly regulated which limits the extent to which providers can compete on price Therefore improving customer service is extremely important in attracting and retaining customers Enhanced personalization and predictive modeling makes for an overall more valuable customer experience
ldquoWe want to easily give customers what they want when they want it We can be predictive based on IP address search words average demographics past histories etc This can be used to tailor the landing page and all aspects of the online and call center experience The goal is to deliver relevance to each visitor We also learn more using RTD than we otherwise could Without RTD I donrsquot know how we would do any o f this as effectively Since sales price and fundamental product structure is largely regulated we focus on the long tail of customer experience as our differentiatorrdquo
Flexibility Flexibility as defined by TEI represents an investment in additional capacity or capability that could be turned into business benefit for some future additional investment This provides an organization with the ldquorightrdquo or the ability to engage in future initiatives but not the obligation to do so There are multiple scenarios in which a customer might choose to implement RTD and later realize additional uses and business opportunities Flexibility would also be quantified when evaluated as part of a specific project (described in more detail in Appendix A)
Page 18
Forrester Consulting
Total Economic Impact Of Oracle Real-Time Decisions
The RTD platform is very flexible in terms of quickly initiating and running multiple campaigns targeted at different areas of the value chain It can also enable an organization to do more with fewer people resources The interviewee said that with RTD they can be ldquomore efficient faster and more agilerdquo New projects can be completed faster at a lower incremental cost
To a large extent the uses of RTD are only limited by the imagination for the interviewed customer They ldquosee a lot of opportunity to be more strategic in the use of the platform for customer touch projectsrdquo A project recently launched is looking at real-time customer analysis during a phone call to identify potential upcoming retention events and make suggestions to the agent to improve retention
For each new project there may be an incremental investment in licenses (depending on if a ULA is in place) hardware internal labor and professional services For the projects already completed by this RTD customer the ROI for each project has been significant No future flexibility benefits have been included in the ROI analysis
Risk Forrester defines two types of risk associated with this analysis implementation risk and impact risk ldquoImplementation riskrdquo is the risk that a proposed investment in RTD may deviate from the original or expected requirements resulting in higher costs than anticipated ldquoImpact riskrdquo refers to the risk that the business or technology needs of the organization may not be met by the investment in RTD resulting in lower overall total benefits The greater the uncertainty the wider the potential range of outcomes for cost and benefit estimates
Quantitatively capturing investment and impact risk by directly adjusting the financial estimates results in more meaningful and accurate estimates and a more accurate projection of the ROI In general risks affect costs by raising the original estimates and they affect benefits by reducing the original estimates The risk-adjusted numbers should be taken as ldquorealisticrdquo expectations since they represent the expected values considering risk
The following implementation risks that affect costs are identified as part of this analysis
bull The implementation project could go longer than expected or fail due to technical complexities of integrating RTD with other backend systems ie CRM DBMS etc This risk can be largely mitigated by engaging with a system integrator that has previous relevant experiences implementing RTD
bull Understanding the Oracle licensing model is also important for avoiding cost overruns Readers should consider their likely usage in order to identify the best initial model and constantly be looking to determine if it makes sense to move between a ULA and per CPU license
The following impact risks that affect benefits are identified as part of the analysis
bull RTD involves experimentation with actual customers In all likelihood not all experiments will deliver the desired results This could result in lost revenue for a segment of customers The interviewee described this as the ldquocost of experimentationrdquo This risk along with the risk of other unintended consequences being introduced into production can be mitigated by architecting the solution so that turning off RTD will revert the underlying systems to their original state That way if the RTD goes down or needs to be taken off line the other systems and business logic all remain intact This was described as a best practice by the interviewee
Page 19
Forrester Consulting
Total Economic Impact Of Oracle Real-Time Decisions
bull There is also the risk of suboptimal results because of the lack of expertise to build score and iterate RTD campaigns This can be mitigated by engaging with an experienced integration partner and providing the necessary training to internal resources
bull RTD requires a certain level of trust from employees ie call center staff if they are to follow the system recommendations This requires adequate training to ensure that all parties are comfortable with the system and understand how it changes peoplersquos daily responsibilities
Table 13 shows the values used to adjust for risk and uncertainty in the cost and benefit estimates The TEI model uses a triangular distribution method to calculate risk-adjusted values To construct the distribution it is necessary to first estimate the low most likely and high values that could occur within the current environment The risk-adjusted value is the mean of the distribution of those points Readers are urged to apply their own risk ranges based on their own degree of confidence in the cost and benefit estimates
Table 13 Cost And Benefit Risk Adjustments
Costs Low Most likely High Mean
Internal implementation labor (medium risk) 100 100 115 105
Professional services (medium risk) 100 100 115 105
Hardware (medium risk) 100 100 115 105
RTD licenses and support (medium risk) 100 100 115 105
Ongoing campaign management labor (medium risk) 100 100 115 105
Benefits Low Most likely High Mean
Improved closure rate revenue (medium risk) 80 100 95 92
Incremental deal size revenue (medium risk) 80 100 95 92
Post cart abandonment follow-up campaign revenue (medium risk)
80 100 95 92
Source Forrester Research Inc
Page 20
mdash
mdash
Forrester Consulting
Total Economic Impact Of Oracle Real-Time Decisions
Financial Summary
The financial results calculated in the Costs and Benefits sections can be used to determine the return on investment net present value and payback period for the organizationrsquos investment in Oracle Real-Time Decisions The financial results are based on rigorous testing methodologies followed by the customer These include using control groups and blind testing of hypotheses These are shown in Table 14 below
Table 14 Cash Flow mdash Non-Risk-Adjusted
Cash flow Original estimates
Initial Year 1 Year 2 Year 3 Total Present value
Costs ($3602000) ($790480) ($4982960) ($1580960) ($10956400) ($9626566)
Benefits $18000000 $51788800 $80132400 $149921200 $119368956
Net benefits ($3602000) $17209520 $46805840 $78551440 $138964800 $109742390
ROI 1140
Payback period 2 Months
Source Forrester Research Inc
Table 15 below shows the risk-adjusted ROI NPV and payback period values These values are determined by applying the risk-adjustment values from Table 13 in the Risk section to the cost and benefits numbers in Tables 8 and 12
Table 15 Cash Flow mdash Risk-Adjusted
Cash flow Risk-adjusted estimates
Initial Year 1 Year 2 Year 3 Total Present value
Costs ($3782100) ($830004) ($5232108) ($1660008) ($11504220) ($10107894)
Benefits $16560000 $47645696 $73721808 $137927504 $109819439
Net benefits ($3782100) $15729996 $42413588 $72061800 $126423284 $99711545
ROI 986
Payback period 3 Months
Source Forrester Research Inc
Page 21
Forrester Consulting
Total Economic Impact Of Oracle Real-Time Decisions
Figure 3 Summary Financial Results Risk-Adjusted
$90000000
$70000000
$50000000
$30000000
$10000000
($10000000) ($3782100)
$10517896
$45570448
$99711545
Initial Year 1 Year 2 Year 3
Costs (PV) Benefits (PV) Cumulative cash flow (NPV)
Source Forrester Research Inc
Page 22
Forrester Consulting
Total Economic Impact Of Oracle Real-Time Decisions
Oracle Real-Time Decisions Overview
According to Oracle Oraclersquos Real-Time Decisions (RTD) platform combines both rules and predictive analytics to power solutions for real-time enterprise decision management It enables real-time intelligence to be instilled into any type of business process or customer interaction A high-performance transactional server delivers real-time decisions and recommendations This server automatically renders decisions within a business process and reveals insights creating actionable intelligence from data flowing through the process in real time
Appendix A Total Economic Impacttrade Overview
Total Economic Impact is a methodology developed by Forrester Research that enhances a companyrsquos technology decision-making processes and assists vendors in communicating the value proposition of their products and services to clients The TEI methodology helps companies demonstrate justify and realize the tangible value of IT initiatives to both senior management and other key business stakeholders
The TEI methodology consists of four components to evaluate investment value benefits costs risks and flexibility
Benefits Benefits represent the value delivered to the user organization mdash IT andor business units mdash by the proposed product or project Often product or project justification exercises focus just on IT cost and cost reduction leaving little room to analyze the effect of the technology on the entire organization The TEI methodology and the resulting financial model place equal weight on the measure of benefits and the measure of costs allowing for a full examination of the effect of the technology on the entire organization Calculation of benefit estimates involves a clear dialogue with the user organization to understand the specific value that is created In addition Forrester also requires that there be a clear line of accountability established between the measurement and justification of benefit estimates after the project has been completed This ensures that benefit estimates tie back directly to the bottom line
Costs Costs represent the investment necessary to capture the value or benefits of the proposed project IT or the business units may incur costs in the form of fully burdened labor subcontractors or materials Costs consider all the investments and expenses necessary to deliver the proposed value In addition the cost category within TEI captures any incremental costs over the existing environment for ongoing costs associated with the solution All costs must be tied to the benefits that are created
Risk Risk measures the uncertainty of benefit and cost estimates contained within the investment Uncertainty is measured in two ways 1) the likelihood that the cost and benefit estimates will meet the original projections and 2) the likelihood that the estimates will be measured and tracked over time TEI applies a probability density function known as ldquotriangular distributionrdquo to the values entered At minimum three values are calculated to estimate the underlying range around each cost and benefit
Page 23
Forrester Consulting
Total Economic Impact Of Oracle Real-Time Decisions
Flexibility Within the TEI methodology direct benefits represent one part of the investment value While direct benefits can typically be the primary way to justify a project Forrester believes that organizations should be able to measure the strategic value of an investment Flexibility represents the value that can be obtained for some future additional investment building on top of the initial investment already made For instance an investment in an enterprisewide upgrade of an office productivity suite can potentially increase standardization (to increase efficiency) and reduce licensing costs However an embedded collaboration feature may translate to greater worker productivity if activated The collaboration can only be used with additional investment in training at some future point in time However having the ability to capture that benefit has a present value that can be estimated The flexibility component of TEI captures that value
Appendix B Glossary
Discount rate The interest rate used in cash flow analysis to take into account the time value of money Although the Federal Reserve Bank sets a discount rate companies often set a discount rate based on their business and investment environment Forrester assumes a yearly discount rate of 10 for this analysis Organizations typically use discount rates between 8 and 16 based on their current environment Readers are urged to consult their respective organization to determine the most appropriate discount rate to use in their own environment
Net present value (NPV) The present or current value of (discounted) future net cash flows given an interest rate (the discount rate) A positive project NPV normally indicates that the investment should be made unless other projects have higher NPVs
Present value (PV) The present or current value of (discounted) cost and benefit estimates given at an interest rate (the discount rate) The PV of costs and benefits feed into the total net present value of cash flows
Payback period The breakeven point for an investment The point in time at which net benefits (benefits minus costs) equal initial investment or cost
Return on investment (ROI) A measure of a projectrsquos expected return in percentage terms ROI is calculated by dividing net benefits (benefits minus costs) by costs
A Note On Cash Flow Tables The following is a note on the cash flow tables used in this study (see the example table below) The initial investment column contains costs incurred at ldquotime 0rdquo or at the beginning of Year 1 Those costs are not discounted All other cash flows in Years 1 through 3 are discounted using the discount rate (shown in Framework Assumptions section) at the end of the year Present value (PV) calculations are calculated for each total cost and benefit estimate Net present value (NPV) calculations are not calculated until the summary tables and are the sum of the initial investment and the discounted cash flows in each year
Page 24
Forrester Consulting
Total Economic Impact Of Oracle Real-Time Decisions
Table [Example] Example Table
Ref Category Calculation Initial cost Year 1 Year 2 Year 3 Total
Source Forrester Research Inc
Appendix C Supplemental Material
Related Forrester Research ldquoDefining The Online Marketing Suiterdquo Forrester Research Inc October 17 2007
Appendix D Endnotes
1 Forrester risk-adjusts the summary financial metrics to take into account the potential uncertainty of the cost and benefit estimates
Page 25
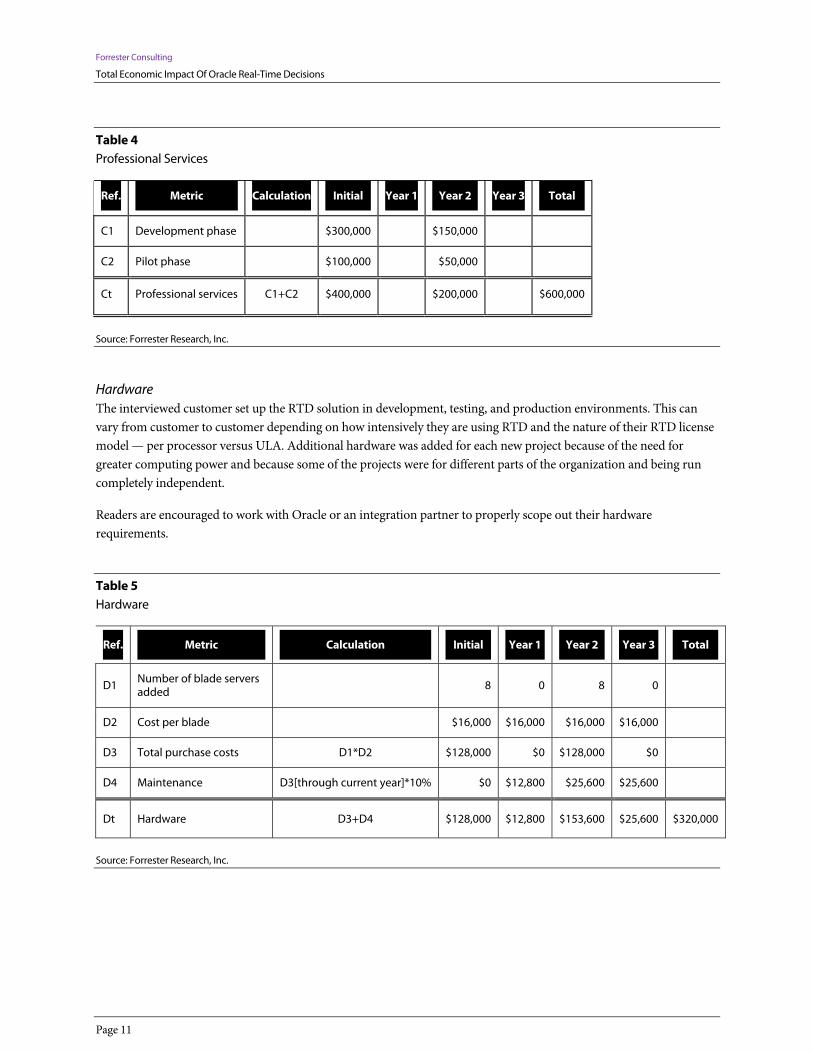
Forrester Consulting
Total Economic Impact Of Oracle Real-Time Decisions
bull There is also the risk of suboptimal results because of the lack of expertise to build score and iterate RTD campaigns This can be mitigated by engaging with an experienced integration partner and providing the necessary training to internal resources
bull RTD requires a certain level of trust from employees ie call center staff if they are to follow the system recommendations This requires adequate training to ensure that all parties are comfortable with the system and understand how it changes peoplersquos daily responsibilities
Table 13 shows the values used to adjust for risk and uncertainty in the cost and benefit estimates The TEI model uses a triangular distribution method to calculate risk-adjusted values To construct the distribution it is necessary to first estimate the low most likely and high values that could occur within the current environment The risk-adjusted value is the mean of the distribution of those points Readers are urged to apply their own risk ranges based on their own degree of confidence in the cost and benefit estimates
Table 13 Cost And Benefit Risk Adjustments
Costs Low Most likely High Mean
Internal implementation labor (medium risk) 100 100 115 105
Professional services (medium risk) 100 100 115 105
Hardware (medium risk) 100 100 115 105
RTD licenses and support (medium risk) 100 100 115 105
Ongoing campaign management labor (medium risk) 100 100 115 105
Benefits Low Most likely High Mean
Improved closure rate revenue (medium risk) 80 100 95 92
Incremental deal size revenue (medium risk) 80 100 95 92
Post cart abandonment follow-up campaign revenue (medium risk)
80 100 95 92
Source Forrester Research Inc
Page 20
mdash
mdash
Forrester Consulting
Total Economic Impact Of Oracle Real-Time Decisions
Financial Summary
The financial results calculated in the Costs and Benefits sections can be used to determine the return on investment net present value and payback period for the organizationrsquos investment in Oracle Real-Time Decisions The financial results are based on rigorous testing methodologies followed by the customer These include using control groups and blind testing of hypotheses These are shown in Table 14 below
Table 14 Cash Flow mdash Non-Risk-Adjusted
Cash flow Original estimates
Initial Year 1 Year 2 Year 3 Total Present value
Costs ($3602000) ($790480) ($4982960) ($1580960) ($10956400) ($9626566)
Benefits $18000000 $51788800 $80132400 $149921200 $119368956
Net benefits ($3602000) $17209520 $46805840 $78551440 $138964800 $109742390
ROI 1140
Payback period 2 Months
Source Forrester Research Inc
Table 15 below shows the risk-adjusted ROI NPV and payback period values These values are determined by applying the risk-adjustment values from Table 13 in the Risk section to the cost and benefits numbers in Tables 8 and 12
Table 15 Cash Flow mdash Risk-Adjusted
Cash flow Risk-adjusted estimates
Initial Year 1 Year 2 Year 3 Total Present value
Costs ($3782100) ($830004) ($5232108) ($1660008) ($11504220) ($10107894)
Benefits $16560000 $47645696 $73721808 $137927504 $109819439
Net benefits ($3782100) $15729996 $42413588 $72061800 $126423284 $99711545
ROI 986
Payback period 3 Months
Source Forrester Research Inc
Page 21
Forrester Consulting
Total Economic Impact Of Oracle Real-Time Decisions
Figure 3 Summary Financial Results Risk-Adjusted
$90000000
$70000000
$50000000
$30000000
$10000000
($10000000) ($3782100)
$10517896
$45570448
$99711545
Initial Year 1 Year 2 Year 3
Costs (PV) Benefits (PV) Cumulative cash flow (NPV)
Source Forrester Research Inc
Page 22
Forrester Consulting
Total Economic Impact Of Oracle Real-Time Decisions
Oracle Real-Time Decisions Overview
According to Oracle Oraclersquos Real-Time Decisions (RTD) platform combines both rules and predictive analytics to power solutions for real-time enterprise decision management It enables real-time intelligence to be instilled into any type of business process or customer interaction A high-performance transactional server delivers real-time decisions and recommendations This server automatically renders decisions within a business process and reveals insights creating actionable intelligence from data flowing through the process in real time
Appendix A Total Economic Impacttrade Overview
Total Economic Impact is a methodology developed by Forrester Research that enhances a companyrsquos technology decision-making processes and assists vendors in communicating the value proposition of their products and services to clients The TEI methodology helps companies demonstrate justify and realize the tangible value of IT initiatives to both senior management and other key business stakeholders
The TEI methodology consists of four components to evaluate investment value benefits costs risks and flexibility
Benefits Benefits represent the value delivered to the user organization mdash IT andor business units mdash by the proposed product or project Often product or project justification exercises focus just on IT cost and cost reduction leaving little room to analyze the effect of the technology on the entire organization The TEI methodology and the resulting financial model place equal weight on the measure of benefits and the measure of costs allowing for a full examination of the effect of the technology on the entire organization Calculation of benefit estimates involves a clear dialogue with the user organization to understand the specific value that is created In addition Forrester also requires that there be a clear line of accountability established between the measurement and justification of benefit estimates after the project has been completed This ensures that benefit estimates tie back directly to the bottom line
Costs Costs represent the investment necessary to capture the value or benefits of the proposed project IT or the business units may incur costs in the form of fully burdened labor subcontractors or materials Costs consider all the investments and expenses necessary to deliver the proposed value In addition the cost category within TEI captures any incremental costs over the existing environment for ongoing costs associated with the solution All costs must be tied to the benefits that are created
Risk Risk measures the uncertainty of benefit and cost estimates contained within the investment Uncertainty is measured in two ways 1) the likelihood that the cost and benefit estimates will meet the original projections and 2) the likelihood that the estimates will be measured and tracked over time TEI applies a probability density function known as ldquotriangular distributionrdquo to the values entered At minimum three values are calculated to estimate the underlying range around each cost and benefit
Page 23
Forrester Consulting
Total Economic Impact Of Oracle Real-Time Decisions
Flexibility Within the TEI methodology direct benefits represent one part of the investment value While direct benefits can typically be the primary way to justify a project Forrester believes that organizations should be able to measure the strategic value of an investment Flexibility represents the value that can be obtained for some future additional investment building on top of the initial investment already made For instance an investment in an enterprisewide upgrade of an office productivity suite can potentially increase standardization (to increase efficiency) and reduce licensing costs However an embedded collaboration feature may translate to greater worker productivity if activated The collaboration can only be used with additional investment in training at some future point in time However having the ability to capture that benefit has a present value that can be estimated The flexibility component of TEI captures that value
Appendix B Glossary
Discount rate The interest rate used in cash flow analysis to take into account the time value of money Although the Federal Reserve Bank sets a discount rate companies often set a discount rate based on their business and investment environment Forrester assumes a yearly discount rate of 10 for this analysis Organizations typically use discount rates between 8 and 16 based on their current environment Readers are urged to consult their respective organization to determine the most appropriate discount rate to use in their own environment
Net present value (NPV) The present or current value of (discounted) future net cash flows given an interest rate (the discount rate) A positive project NPV normally indicates that the investment should be made unless other projects have higher NPVs
Present value (PV) The present or current value of (discounted) cost and benefit estimates given at an interest rate (the discount rate) The PV of costs and benefits feed into the total net present value of cash flows
Payback period The breakeven point for an investment The point in time at which net benefits (benefits minus costs) equal initial investment or cost
Return on investment (ROI) A measure of a projectrsquos expected return in percentage terms ROI is calculated by dividing net benefits (benefits minus costs) by costs
A Note On Cash Flow Tables The following is a note on the cash flow tables used in this study (see the example table below) The initial investment column contains costs incurred at ldquotime 0rdquo or at the beginning of Year 1 Those costs are not discounted All other cash flows in Years 1 through 3 are discounted using the discount rate (shown in Framework Assumptions section) at the end of the year Present value (PV) calculations are calculated for each total cost and benefit estimate Net present value (NPV) calculations are not calculated until the summary tables and are the sum of the initial investment and the discounted cash flows in each year
Page 24
Forrester Consulting
Total Economic Impact Of Oracle Real-Time Decisions
Table [Example] Example Table
Ref Category Calculation Initial cost Year 1 Year 2 Year 3 Total
Source Forrester Research Inc
Appendix C Supplemental Material
Related Forrester Research ldquoDefining The Online Marketing Suiterdquo Forrester Research Inc October 17 2007
Appendix D Endnotes
1 Forrester risk-adjusts the summary financial metrics to take into account the potential uncertainty of the cost and benefit estimates
Page 25

mdash
mdash
Forrester Consulting
Total Economic Impact Of Oracle Real-Time Decisions
Financial Summary
The financial results calculated in the Costs and Benefits sections can be used to determine the return on investment net present value and payback period for the organizationrsquos investment in Oracle Real-Time Decisions The financial results are based on rigorous testing methodologies followed by the customer These include using control groups and blind testing of hypotheses These are shown in Table 14 below
Table 14 Cash Flow mdash Non-Risk-Adjusted
Cash flow Original estimates
Initial Year 1 Year 2 Year 3 Total Present value
Costs ($3602000) ($790480) ($4982960) ($1580960) ($10956400) ($9626566)
Benefits $18000000 $51788800 $80132400 $149921200 $119368956
Net benefits ($3602000) $17209520 $46805840 $78551440 $138964800 $109742390
ROI 1140
Payback period 2 Months
Source Forrester Research Inc
Table 15 below shows the risk-adjusted ROI NPV and payback period values These values are determined by applying the risk-adjustment values from Table 13 in the Risk section to the cost and benefits numbers in Tables 8 and 12
Table 15 Cash Flow mdash Risk-Adjusted
Cash flow Risk-adjusted estimates
Initial Year 1 Year 2 Year 3 Total Present value
Costs ($3782100) ($830004) ($5232108) ($1660008) ($11504220) ($10107894)
Benefits $16560000 $47645696 $73721808 $137927504 $109819439
Net benefits ($3782100) $15729996 $42413588 $72061800 $126423284 $99711545
ROI 986
Payback period 3 Months
Source Forrester Research Inc
Page 21
Forrester Consulting
Total Economic Impact Of Oracle Real-Time Decisions
Figure 3 Summary Financial Results Risk-Adjusted
$90000000
$70000000
$50000000
$30000000
$10000000
($10000000) ($3782100)
$10517896
$45570448
$99711545
Initial Year 1 Year 2 Year 3
Costs (PV) Benefits (PV) Cumulative cash flow (NPV)
Source Forrester Research Inc
Page 22
Forrester Consulting
Total Economic Impact Of Oracle Real-Time Decisions
Oracle Real-Time Decisions Overview
According to Oracle Oraclersquos Real-Time Decisions (RTD) platform combines both rules and predictive analytics to power solutions for real-time enterprise decision management It enables real-time intelligence to be instilled into any type of business process or customer interaction A high-performance transactional server delivers real-time decisions and recommendations This server automatically renders decisions within a business process and reveals insights creating actionable intelligence from data flowing through the process in real time
Appendix A Total Economic Impacttrade Overview
Total Economic Impact is a methodology developed by Forrester Research that enhances a companyrsquos technology decision-making processes and assists vendors in communicating the value proposition of their products and services to clients The TEI methodology helps companies demonstrate justify and realize the tangible value of IT initiatives to both senior management and other key business stakeholders
The TEI methodology consists of four components to evaluate investment value benefits costs risks and flexibility
Benefits Benefits represent the value delivered to the user organization mdash IT andor business units mdash by the proposed product or project Often product or project justification exercises focus just on IT cost and cost reduction leaving little room to analyze the effect of the technology on the entire organization The TEI methodology and the resulting financial model place equal weight on the measure of benefits and the measure of costs allowing for a full examination of the effect of the technology on the entire organization Calculation of benefit estimates involves a clear dialogue with the user organization to understand the specific value that is created In addition Forrester also requires that there be a clear line of accountability established between the measurement and justification of benefit estimates after the project has been completed This ensures that benefit estimates tie back directly to the bottom line
Costs Costs represent the investment necessary to capture the value or benefits of the proposed project IT or the business units may incur costs in the form of fully burdened labor subcontractors or materials Costs consider all the investments and expenses necessary to deliver the proposed value In addition the cost category within TEI captures any incremental costs over the existing environment for ongoing costs associated with the solution All costs must be tied to the benefits that are created
Risk Risk measures the uncertainty of benefit and cost estimates contained within the investment Uncertainty is measured in two ways 1) the likelihood that the cost and benefit estimates will meet the original projections and 2) the likelihood that the estimates will be measured and tracked over time TEI applies a probability density function known as ldquotriangular distributionrdquo to the values entered At minimum three values are calculated to estimate the underlying range around each cost and benefit
Page 23
Forrester Consulting
Total Economic Impact Of Oracle Real-Time Decisions
Flexibility Within the TEI methodology direct benefits represent one part of the investment value While direct benefits can typically be the primary way to justify a project Forrester believes that organizations should be able to measure the strategic value of an investment Flexibility represents the value that can be obtained for some future additional investment building on top of the initial investment already made For instance an investment in an enterprisewide upgrade of an office productivity suite can potentially increase standardization (to increase efficiency) and reduce licensing costs However an embedded collaboration feature may translate to greater worker productivity if activated The collaboration can only be used with additional investment in training at some future point in time However having the ability to capture that benefit has a present value that can be estimated The flexibility component of TEI captures that value
Appendix B Glossary
Discount rate The interest rate used in cash flow analysis to take into account the time value of money Although the Federal Reserve Bank sets a discount rate companies often set a discount rate based on their business and investment environment Forrester assumes a yearly discount rate of 10 for this analysis Organizations typically use discount rates between 8 and 16 based on their current environment Readers are urged to consult their respective organization to determine the most appropriate discount rate to use in their own environment
Net present value (NPV) The present or current value of (discounted) future net cash flows given an interest rate (the discount rate) A positive project NPV normally indicates that the investment should be made unless other projects have higher NPVs
Present value (PV) The present or current value of (discounted) cost and benefit estimates given at an interest rate (the discount rate) The PV of costs and benefits feed into the total net present value of cash flows
Payback period The breakeven point for an investment The point in time at which net benefits (benefits minus costs) equal initial investment or cost
Return on investment (ROI) A measure of a projectrsquos expected return in percentage terms ROI is calculated by dividing net benefits (benefits minus costs) by costs
A Note On Cash Flow Tables The following is a note on the cash flow tables used in this study (see the example table below) The initial investment column contains costs incurred at ldquotime 0rdquo or at the beginning of Year 1 Those costs are not discounted All other cash flows in Years 1 through 3 are discounted using the discount rate (shown in Framework Assumptions section) at the end of the year Present value (PV) calculations are calculated for each total cost and benefit estimate Net present value (NPV) calculations are not calculated until the summary tables and are the sum of the initial investment and the discounted cash flows in each year
Page 24
Forrester Consulting
Total Economic Impact Of Oracle Real-Time Decisions
Table [Example] Example Table
Ref Category Calculation Initial cost Year 1 Year 2 Year 3 Total
Source Forrester Research Inc
Appendix C Supplemental Material
Related Forrester Research ldquoDefining The Online Marketing Suiterdquo Forrester Research Inc October 17 2007
Appendix D Endnotes
1 Forrester risk-adjusts the summary financial metrics to take into account the potential uncertainty of the cost and benefit estimates
Page 25

Forrester Consulting
Total Economic Impact Of Oracle Real-Time Decisions
Table [Example] Example Table
Ref Category Calculation Initial cost Year 1 Year 2 Year 3 Total
Source Forrester Research Inc
Appendix C Supplemental Material
Related Forrester Research ldquoDefining The Online Marketing Suiterdquo Forrester Research Inc October 17 2007
Appendix D Endnotes
1 Forrester risk-adjusts the summary financial metrics to take into account the potential uncertainty of the cost and benefit estimates
Page 25