Embed Size (px)
Citation preview
www.wjpps.com Vol 4, Issue 03, 2015.
1043
Rajesh et al. World Journal of Pharmacy and Pharmaceutical Sciences
FORMULATION AND EVALUATION STUDIES ON TRANSDERMAL
DOSAGE FORMS OF DICLOFENAC SODIUM
Pilla Pavani Ganga Bhavani1, Putta Rajesh Kumar*
1, Ravi Shankar.K
1,
Tata Santosh2
1Sri Sai Aditya Institute of Pharmaceutical Sciences and Research, Surampalem – 533437.
2Corpuscle Research Solutions, Visakhapatnam - 530017.
ABSTRACT
The aim of the present study was to prepare and evaluate matrix type
transdermal patches of Diclofenac sodium by using Hydroxy propyl
methyl cellulose K15 (HPMCK15) and different grades of Eudragit
(RL100, RS100, RLPO, RSPO) as polymers to minimize adverse
effects associated with oral administration. Transdermal patches of
Diclofenac sodium were prepared by solvent evaporation method by
varying the blend ratios of HPMCK15 and Eudragit. The drug polymer
interaction studies were carried out by FT-IR studies. The prepared
patches were evaluated for their thickness, weight variation, folding
endurance, percentage moisture absorption, percentage moisture loss
and drug content. In vitro drug release was determined by using Franz diffusion cell in
phosphate buffer (pH 7.4). The release data was studied for various kinetic parameters to
understand the mechanism of drug release from the developed formulations. IR studies
revealed that the drug, polymer and excipients were compatible with each other. Thin,
flexible, smooth and uniform films were obtained with Eudragit and HPMC using dibutyl
phthalate as plasticizer. Thickness, weights and drug contents of all the formulations
remained almost uniform with low SD values. The formulations F7, F8 showed good release
of drug than marketed formulation. Formulations contain Eudragit RLPO and HPMC K15,
Eudragit RL100 and HPMC K15 showed good release when compared to the formulations
contain Eudragit RSPO and HPMC K15. Studies have shown promising results and there is a
scope for further pharmacokinetic evaluation.
Keywords: Diclofenac sodium, Hydroxy propyl methyl cellulose K15, Eudragit RL 100,
RS100, RLPO, RSPO, Release Kinetics.
WWOORRLLDD JJOOUURRNNAALL OOFF PPHHAARRMMAACCYY AANNDD PPHHAARRMMAACCEEUUTTIICCAALL SSCCIIEENNCCEESS
SSJJIIFF IImmppaacctt FFaaccttoorr 22..778866
VVoolluummee 44,, IIssssuuee 0033,, 11004433--11006633.. RReesseeaarrcchh AArrttiiccllee IISSSSNN 2278 – 4357
Article Received on
23 Dec 2014,
Revised on 18 Jan 2015,
Accepted on 11 Feb 2015
*Correspondence for
Author
Dr. Putta Rajesh Kumar
Sri Sai Aditya Institute of
Pharmaceutical Sciences
and Research,
Surampalem – 533437.

www.wjpps.com Vol 4, Issue 03, 2015.
1044
Rajesh et al. World Journal of Pharmacy and Pharmaceutical Sciences
INTRODUCTION
Transdermal therapeutic systems (TTS) are defined as self-contained discrete dosage forms
when applied to the intact skin, deliver the drugs through skin at a controlled rate to the
systemic circulation. Thus it is anticipated that transdermal drug delivery systems (TDDS)
can be designed to input drugs at appropriate rates to maintain suitable plasma drug levels for
therapeutic efficacy by using skin as the port [1,2]
.
Drug administration in conventional dosage forms like tablets, capsules, injectables or
ointments cause fluctuations in drug concentrations in blood stream and tissues may lead
undesirable toxicity and efficiency. The successful development of TTS depends on a
pondered choice of drug, which should be non-irritant and cross the skin in adequate amounts
to produce the therapeutic effect. Drugs produce these effects in small amounts with
molecular weight range of 100-800 Da are ideal candidates for TDDS[3]
.
Transdermal route offers several advantages over other routes for the delivery of drugs with
systemic activity. It provides a continuous mode of administration at rates approaching zero-
order similar to that provided by an I.V Infusion and the delivery is non-invasive, no
hospitalization is required. Additionally, the transdermal route as compared with the oral
route reduces drug degradation at the site of administration due to its lower metabolic
activity. Once the drug is absorbed, the hepatic circulation is by-passed, thus avoiding
another major site of potential drug inactivation [4,5]
.
With the concept of delivering drug into the skin for both local effects in dermatology and
through the integument for the systemic treatment of disease states can be achieved. This
later process has been brought into sharp focus in recent years by the efforts of
pharmaceutical field to develop transdermal delivery devices to treat motion sickness, angina,
hormone deficiency and hypertension[6,7]
.
“Transdermal drug delivery systems are adhesive, drug containing devices of defined surface
area that deliver a pre-determined amount of drug to the surface of intact skin at a pre-
programmed rate. These systems provide drug systemically at a predictable rate and maintain
the rate for extended periods of time.”
The skin site for transdermal drug administration: [8-10]
The skin is one of the most extensive and readily accessible organ with a thickness of 2.97 ±

www.wjpps.com Vol 4, Issue 03, 2015.
1045
Rajesh et al. World Journal of Pharmacy and Pharmaceutical Sciences
0.28 mm. It separates the underlying blood circulation network and viable organs from the
outside environment. It serves as a barrier against physical and chemical attacks and shields
the body from invasion by microorganisms. Microscopically the skin is a multilayered organ
composed of anatomically many histological layers, but it is generally described in terms of
three tissue layers; the epidermis, dermis and subcutaneous tissue.
Fig 1: Anatomy of the Skin
Fig 2: Permeation pathways of skin

www.wjpps.com Vol 4, Issue 03, 2015.
1046
Rajesh et al. World Journal of Pharmacy and Pharmaceutical Sciences
REVIEW OF LITERATURE
Patel RP et al., [11]
developed a matrix-type transdermal therapeutic system containing drug
Aceclofenac with different ratios of hydrophilic (hydroxyl propyl cellulose) and hydrophobic
(ethyl cellulose) polymeric systems using 15 % w/w of dibutyl phthalate as plasticizer.
Different concentrations of oleic acid and isopropyl myristate were used to enhance the
transdermal permeation of drug. Formulation prepared with hydrophilic polymer containing
permeation enhancer showed best in vitro skin permeation through albino rat skin as
compared to all other formulations. These results indicated that the formulation containing 15
% of oleic acid with 10 % Isopropyl myristate give better penetration through rat skin.
Patel KN et al., [12]
developed a matrix transdermal therapeutic system containing drug
Diclofenac sodium with different concentrations of oleic acid, labrasol, triacetin as
transdermal permeation enhancers. Formulation containing 5% drug, 85% adhesive solution,
10% triacetin found to be best formation which showed best release of Diclofenac sodium.
Hemanth B et al., [13]
done study on effect of Diclofenac sodium patches with respect to oral
dosage forms on human volunteers. Twenty young pre-orthodontic patients requiring bilateral
maxillary and mandibular first premolar extractions were selected for the study. From this
study observed that gradual increase in the pain relief scores and gradual decease in the pain
intensity score with both oral dosage forms as well as transdermal patches. But patient
compliance was increased with transdermal patches formulations.
Sanjay D et al., [14]
developed matrix type transdermal patches of carvedilol by using
hydroxy propyl methyl cellulose (HPMC) and eudragit RS100 as polymers with different
ratios and dibutyl phthalate and propylene glycol as plasticizer and permeation enhancer
respectively. In vitro release studies indicate that patches containing hydroxyl propyl methyl
cellulose, eudragit RS100 in the ratio of 1:4 showed best release. The formulation containing
30% w/w propylene glycol has exhibited better enhancement for the permeation of
carvedilol.
Hamang K et al., [15]
has developed controlled release transdermal patches of sertaconazole
nitrate by using Ethyl cellulose (EC) and poly vinyl pyrrolidone (PVPK-30) with different
ratios and dibutylphthalate as plasticizer. In vitro diffusion studies were performed by using
cellulose nitrate membrane in modified Franz diffusion cell in buffer pH 7.4. Permeation

www.wjpps.com Vol 4, Issue 03, 2015.
1047
Rajesh et al. World Journal of Pharmacy and Pharmaceutical Sciences
studies illustrated that the ratio of poly vinyl pyrrolidine and ethyl cellulose 1:5 showed good
controlled release.
Gudapa RR et al., [16]
formulated matrix transdermal patches of an antihypertensive drug
candesartan cilexetil using blends of two different polymeric combinations HPMCK100 and
eudragit RL100, prepared formulations were subjected to various physicochemical
evaluations and in vitro release study by using commercial semi permeable membrane. All
the formulations exhibited good physicochemical characteristics. In vitro release showed that
the formulation containing 400 mg HPMCK100 and 100 mg Eudragit RL100 showed faster
release when compared to other formulations.
Madhulatha A et al., [17]
developed sustained release transdermal patches containing
Ibuprofen with different ratios of chitosan and hydroxyl propyl methyl cellulose (HPMC) and
combination of chitosan- HPMC by solvent evaporation technique. Prepared films were
evaluated for physicochemical characteristics like thickness, weight variation, moisture
content, moisture loss, drug content, and in vitro drug permeation study. The in vitro
permeation studies using rat skin the formulation contain 0.2% plain chitosan and HPMC
showed 86% drug release in 24 h.
Updesh BL et al., [18]
developed transdermal patches of budenoside by using differernt
polymers with like eudragit RL100, eudragit RS100, ethyl cellulose and PVP with different
ratios and PEG-400, urea and dimethyl sulfoxide (DMSO) as plasticizer and permeation
enhancers respectively. Prepared films were evaluated for different characteristics like
thickness, weight uniformity, moisture uptake, water vapor transmission study, moisture loss,
drug content, and in vitro drug permeation study. Based on these studies patches containing
PVA and Eudragit RL 100 patches provide best resistance to water vapor which provided
better drug permeation.
Ting Li et al., [19]
formulated transdermal patches of indomethacin, Mascos 10 (poly acrylic
acid type) pressure sensitive adhesive was used to prepare a drug-in-adhesive type patch
containing a variety of permeation enhancers like azone, L-methanol, 2-isopropyl-5-
methylcylohexyl heptanoate (M-HEP), isopropyl myristate (IPM), tween-80 and oleic acid .
It was noted that patches containing Azone and L-ethanol showed increased indomethacin
permeation than patches containing IPM, oleic acid and tween-80.

www.wjpps.com Vol 4, Issue 03, 2015.
1048
Rajesh et al. World Journal of Pharmacy and Pharmaceutical Sciences
MATERIALS AND METHODS
Diclofenac sodium and Eudragit (RL100, RS100, RLPO, RSPO) were procured as gift
samples from Corpuscle research solutions (Visakhapatnam), Poly vinyl alchohol (PVA)
from Rolex Chemical Industries (Mumbai), Hydroxyl propyl methyl cellulose K15(HPMC-
K15) was supplied by Supra Laboratories (Hyderabad), Di butyl phthalate and Oleic acid
from Qualigens Fine Chemicals (Mumbai), Chloroform and Glycerin from S.D. Fine
Chemicals (Mumbai), All the materials used in the formulations, evaluations used were of
analytical and laboratory grade.
Analytical Method development studies:[20]
Phosphate buffer (pH 7.4) solution: Fifty ml of 0.2M potassium dihydrogen phosphate was
taken in 200 ml volumetric flask, to which 39.1 ml of 0.2 M sodium hydroxide solution was
added and the volume was made up to the mark with distilled water.
Potassium dihydrogen phosphate (0.2 M) solution: Potassium dihydrogen phosphate (27.218
g) was added to 1000 ml volumetric flask containing distilled water and the volume was
made up to the mark with distilled water.
Sodium hydroxide (0.2 M) solution: Eight gram of sodium hydroxide was taken in 1000 ml
volumetric flask containing distilled water and volume was made up to the mark with
distilled water.
Determination of λ max of Diclofenac sodium in phosphate buffer (pH 7.4):[20]
Preparation of Diclofenac sodium standard stock solution (1000 µg/ml) in Phosphate buffer
(pH 7.4) Standard stock solution of Diclofenac sodium was prepared by dissolving accurately
weighed 100 mg of Diclofenac sodium in the little quantity of phosphate buffer (pH 7.4) in
100 ml volumetric flask. The volume was then made up to 100 ml by using phosphate buffer
(pH 7.4) to obtain the solution of 1000 µg/ml. From the standard stock solution, 1 ml was
diluted to 100 ml with phosphate buffer solution (pH 7.4). The resulting solution containing
10µg/ml was scanned between 200 to 400 nm.
Calibration curve of Diclofenac sodium in phosphate buffer solution (pH 7.4): [21]
From
the Diclofenac sodium standard stock solution (1000 µg/ml), 10 ml solution was diluted to
100 ml using 7.4 pH phosphate buffer solutions (100 µg/ml). From this 0.2ml, 0.4ml, 0.6ml,
0.8ml, 1 ml of solutions were taken into different volumetric flasks and made up to 10ml with

www.wjpps.com Vol 4, Issue 03, 2015.
1049
Rajesh et al. World Journal of Pharmacy and Pharmaceutical Sciences
phosphate buffer solution (pH 7.4) so as to get the concentrations of 2 µg, 4 µg, 6 µg, 8 µg,
and 10 µg respectively. The absorbances of these solutions were measured at λ max 274 nm.
PREFORMULATION STUDIES
Determination of melting point: [22]
Melting point of the drug was determined by taking
small amount of drug in a capillary tube closed at one end. The capillary tube was placed in a
melting point apparatus and the temperature at which drug melts was recorded. This was
performed thrice and average value was noted.
Determination of solubility: [23]
The solubility of Diclofenac sodium was determined by
adding excess amount of drug to measured volume of distilled water in a glass vial to get a
saturated solution. The solution was sonicated and kept at room temperature for the
attainment of equilibrium. The concentration of Diclofenac sodium was determined
spectrophotometrically by measuring at 274 nm after 24 h.
Determination of pH: [24]
The pH of Diclofenac sodium was determined using potentiometer
for freshly prepared 1% aqueous solution of Diclofenac sodium.
Determination of partition coefficient: [25]
The known quantity of Diclofenac sodium was
added into 5 ml of 1-octanol and it was mixed with 5ml of water in a separating funnel. Then
two phases were allowed to equilibrate at 370Cfor 24 h with intermittent shaking. The
concentration of the drug in the aqueous phase and organic phase was determined by UV
spectroscopic method after necessary dilution. The apparent partition coefficient (Kp) was
calculated as the ratio of drug concentration in each phase by the following equation.
Drug excipient compatibility (FTIR) study:[26,27]
Pure drug Diclofenac sodium and
polymers were subjected for FTIR spectroscopic analysis for compatibility studies and to
ascertain whether there was any chemical interaction between the drug and the polymers
used. The FT-IR spectra of Diclofenac sodium pure drug and Diclofenac sodium with
polymers are studied for abscence of drug polymer interaction.
Preparation of transdermal patches of Diclofenac sodium:[28]
Transdermal patches of
Diclofenac sodium were prepared by solvent evaporation technique. Required quantities of

www.wjpps.com Vol 4, Issue 03, 2015.
1050
Rajesh et al. World Journal of Pharmacy and Pharmaceutical Sciences
Diclofenac sodium and HPMC-K15 and Eudragit (RS100, RL100, RSPO, RLPO) and DBP
etc. were weighed as per formulations shown in table 5. To these mixtures required quantity
of solvent chloroform was added. This solution poured in moulds containing dried PVA
laminates which were prepared by dissolving PVA in water with continuous stirring and
heating. Then this drug polymer mixture solution allowed to air dry for 24 h at room
temperature. After drying the patches were peeled from mould and wrapped in aluminum
foil and stored in desiccator for further studies.
Evaluation of transdermal patches of Diclofenac sodium [29, 30, 31, 32]
Physical appearance: The prepared patches were physically examined for colour, clarity and
surface texture.
Thickness uniformity: The thickness of patches was measured by using electronic caliper,
with a least count of 0.01mm. Thickness was measured at three different points on the film
and average readings were taken.
Uniformity of weight: The patch of size 1x1 cm2 was cut and weight of each patch was
taken individually, the average weight of the patch was calculated.
Folding endurance: The folding endurance was measured manually for the prepared
patches. A strip of patch (2 x 2 cm2) was cut and repeatedly folded at the same place till it
breaks. The number of times the film could be folded at the same place without breaking
gave the value of folding endurance.
Percentage moisture loss: The patches were weighed individually and kept in a desiccators
containing calcium chloride. The final weight was noted when there was no change in the
weight of individual patch. The percentage of moisture content was calculated as a difference
between initial and final weight with respect to final weight.
Percentage moisture uptake: The patches were weighed accurately and placed in a
desiccators where a humidity condition of 80-90% RH was maintained by using saturated
solution of potassium chloride. The patches were kept until uniform weight is obtained, then
taken out and weighed. The percentage of moisture uptake was calculated as the difference
between final and initial weight with respect to initial weight.

www.wjpps.com Vol 4, Issue 03, 2015.
1051
Rajesh et al. World Journal of Pharmacy and Pharmaceutical Sciences
Drug content uniformity: The patches were tested for the content uniformity. The patches
of size 1 cm2 was cut and placed in a 100 ml volumetric flask. The contents were stirred
using a magnetic bead for 24 h to dissolve the patches. Subsequent dilutions were made with
phosphate buffer (pH 7.4). The absorbance of the solution was measured against the
corresponding blank solution at 274 nm using UV-visible spectrophotometer. The experiment
was repeated three more time to validate the result.
In vitro release studies: [33, 34]
The fabricated patch were cut into 1 cm2 and placed on the
commercial semi permeable membrane (cellophane membrane) and attached to the diffusion
cell such that the cell‟s drug releasing surface towards the receptor compartment which was
filled with phosphate buffer solution of pH 7.4 at 37±10C. The elution medium was stirred
magnetically. The aliquots (2 ml) was withdrawn at predetermined time intervals and
replaced with same volume of phosphate buffer of pH 7.4. The samples were analyzed for
drug content using UV spectrophotometer at 274nm.
Kinetics of drug release [34]
In membrane controlled systems, first the drug will partition from reservoir into polymer
matrix that comprises the rate controlling membrane. In the membrane, diffusion will occur
down the concentration gradient at a rate, which will be controlled by the diffusion
coefficient of the drug in the polymer. Once the drug has diffused through the rate controlling
membrane, it will partition into skin. Diffusion occurs down the concentration gradient at a
rate that is controlled by diffusion of drug in the polymer.
The rate of permeation dQ/dt across various layers of skin can be expressed by the following
equation.
dQ/dt = Ps(Cd–Cr) ------------- (1)
Where,
Cd = concentration of drug in donor compartment.
Cr= concentration of drug in receptor compartment.
P s= overall permeability coefficient.
Whereas Ps can be defined as follows
Ps = Ks/dDss / Hs ------------------ (2)

www.wjpps.com Vol 4, Issue 03, 2015.
1052
Rajesh et al. World Journal of Pharmacy and Pharmaceutical Sciences
Where,
Ks/d = partition coefficient of penetrant molecule from system on to the stratum corneum.
Dss = apparent diffusivity for steady state diffusion of penetrant molecule through skin tissue.
Hs = thickness of the skin tissue.
Ps can be considered as a constant, if Ks/d, Dss and Hs terms in the above equation are constant
under a given set of conditions. Equation (1) suggests that to achieve a constant rate of drug
permeation, one needs to maintain a condition in which the drug concentration of the surface
of stratum corneum (Cd) is consistently and substantially greater than the drug concentration
in the receptor side (Cr); i.e., Cd>> Cr under such condition equation (1) can be reduced to,
dQ/dt = Ps Cd ----------------- (3)
The rate of skin permeation dQ/dt should be constant, if magnitude of Cd value remains fairly
constant throughout the course of skin permeation. To maintain Cd at a constant value, it is
necessary to deliver the drug at a rate Rd that is either constant or always greater than the rate
of skin absorption Ra; i.e., Rd>> Ra. By making Rd greater than Ra the drug concentration on
the skin surface Cd, is maintained at a level equal to or greater than equilibrium (or
saturation) solubility of drug in stratum corneum Cse; i.e. Cd Cs
e.
A maximum rate of skin permeation (dQ/dt)m was expressed by the following equation.
(dQ/dt)m = PsCse ------------------ (4)
Apparently the magnitude of (dQ/dt)m is determined by permeability coefficient Ps of the skin
to the drug and equilibrium solubility of the drug in the stratum corneum Cse.
Table 1: Composition of various transdermal patches of Diclofenac sodium
Formulations(mg/ml) F1 F2 F3 F4 F5 F6 F7 F8 F9 F10 F11 F12
Diclofenac sodium 50 50 50 50 50 50 50 50 50 50 50 50
Eudragit RL 100 100 200 300 -- -- -- -- -- -- -- -- --
Eudragit RS PO -- -- -- 100 200 300 -- -- -- -- -- --
Eudragit RL PO -- -- -- -- -- -- 100 200 300 -- -- --
Eudragit RS 100 -- -- -- -- -- -- -- -- -- 100 200 300
HPMC K15 500 400 300 500 400 300 500 400 300 500 400 300
DBP 0.25 0.25 0.25 0.25 0.25 0.25 0.25 0.25 0.25 0.25 0.25 0.25
Oleic acid 0.1 0.1 0.1 0.1 0.1 0.1 0.1 0.1 0.1 0.1 0.1 0.1
Chloroform 15 15 15 15 15 15 15 15 15 15 15 15
-- : No ingredient was added. HPMC: Hydroxy Propyl methyl cellulose. DBP: Dibutyl phthalate.

www.wjpps.com Vol 4, Issue 03, 2015.
1053
Rajesh et al. World Journal of Pharmacy and Pharmaceutical Sciences
RESULTS
Fig 3: UV spectrum of Diclofenac sodium in pH 7.4 phosphate buffer solution
y = 0.0356x + 0.0095R² = 0.9993
0
0.05
0.1
0.15
0.2
0.25
0.3
0.35
0.4
0.000 2.000 4.000 6.000 8.000 10.000 12.000
Ab
so
rba
nce
Concentration (µg)
Fig 4: Standard graph of Diclofenac sodium in pH 7.4 phosphate buffer
Table 2: Preformulation studies of Diclofenac sodium
S.no Parameter Result
1 Melting point 282 1.15
2 Solubility 35mg/ml
3 Partition coefficient 3.52
4 pH 3.47

www.wjpps.com Vol 4, Issue 03, 2015.
1054
Rajesh et al. World Journal of Pharmacy and Pharmaceutical Sciences
Fig 5: IR spectrum of Diclofenac sodium pure drug
Fig 6: IR spectrum of F7 formulation
Fig 7: IR spectrum of F8 formulation
www.wjpps.com Vol 4, Issue 03, 2015.
1055
Rajesh et al. World Journal of Pharmacy and Pharmaceutical Sciences
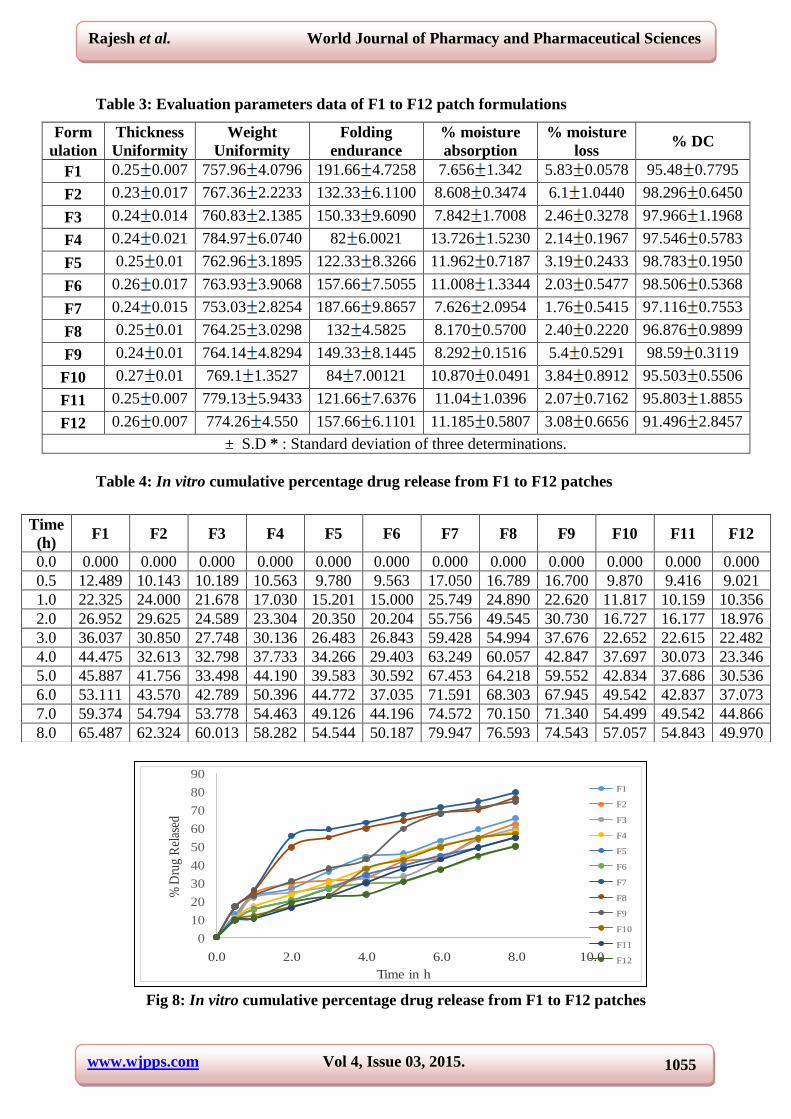
Table 3: Evaluation parameters data of F1 to F12 patch formulations
Form
ulation
Thickness
Uniformity
Weight
Uniformity
Folding
endurance
% moisture
absorption
% moisture
loss % DC
F1 0.25 0.007 757.96 4.0796 191.66 4.7258 7.656 1.342 5.83 0.0578 95.48 0.7795
F2 0.23 0.017 767.36 2.2233 132.33 6.1100 8.608 0.3474 6.1 1.0440 98.296 0.6450
F3 0.24 0.014 760.83 2.1385 150.33 9.6090 7.842 1.7008 2.46 0.3278 97.966 1.1968
F4 0.24 0.021 784.97 6.0740 82 6.0021 13.726 1.5230 2.14 0.1967 97.546 0.5783
F5 0.25 0.01 762.96 3.1895 122.33 8.3266 11.962 0.7187 3.19 0.2433 98.783 0.1950
F6 0.26 0.017 763.93 3.9068 157.66 7.5055 11.008 1.3344 2.03 0.5477 98.506 0.5368
F7 0.24 0.015 753.03 2.8254 187.66 9.8657 7.626 2.0954 1.76 0.5415 97.116 0.7553
F8 0.25 0.01 764.25 3.0298 132 4.5825 8.170 0.5700 2.40 0.2220 96.876 0.9899
F9 0.24 0.01 764.14 4.8294 149.33 8.1445 8.292 0.1516 5.4 0.5291 98.59 0.3119
F10 0.27 0.01 769.1 1.3527 84 7.00121 10.870 0.0491 3.84 0.8912 95.503 0.5506
F11 0.25 0.007 779.13 5.9433 121.66 7.6376 11.04 1.0396 2.07 0.7162 95.803 1.8855
F12 0.26 0.007 774.26 4.550 157.66 6.1101 11.185 0.5807 3.08 0.6656 91.496 2.8457
± S.D * : Standard deviation of three determinations.
Table 4: In vitro cumulative percentage drug release from F1 to F12 patches
Fig 8: In vitro cumulative percentage drug release from F1 to F12 patches
Time
(h) F1 F2 F3 F4 F5 F6 F7 F8 F9 F10 F11 F12
0.0 0.000 0.000 0.000 0.000 0.000 0.000 0.000 0.000 0.000 0.000 0.000 0.000
0.5 12.489 10.143 10.189 10.563 9.780 9.563 17.050 16.789 16.700 9.870 9.416 9.021
1.0 22.325 24.000 21.678 17.030 15.201 15.000 25.749 24.890 22.620 11.817 10.159 10.356
2.0 26.952 29.625 24.589 23.304 20.350 20.204 55.756 49.545 30.730 16.727 16.177 18.976
3.0 36.037 30.850 27.748 30.136 26.483 26.843 59.428 54.994 37.676 22.652 22.615 22.482
4.0 44.475 32.613 32.798 37.733 34.266 29.403 63.249 60.057 42.847 37.697 30.073 23.346
5.0 45.887 41.756 33.498 44.190 39.583 30.592 67.453 64.218 59.552 42.834 37.686 30.536
6.0 53.111 43.570 42.789 50.396 44.772 37.035 71.591 68.303 67.945 49.542 42.837 37.073
7.0 59.374 54.794 53.778 54.463 49.126 44.196 74.572 70.150 71.340 54.499 49.542 44.866
8.0 65.487 62.324 60.013 58.282 54.544 50.187 79.947 76.593 74.543 57.057 54.843 49.970
0
10
20
30
40
50
60
70
80
90
0.0 2.0 4.0 6.0 8.0 10.0
% D
rug
Rel
ased
Time in h
F1
F2
F3
F4
F5
F6
F7
F8
F9
F10
F11
F12

www.wjpps.com Vol 4, Issue 03, 2015.
1056
Rajesh et al. World Journal of Pharmacy and Pharmaceutical Sciences
Fig 9: In vitro drug release profiles of F7, F8 and Marketed formulation (Nupatch)
Table 5: Results of model fitting of Diclofenac sodium from F1 to F12 patches
Formulation Zero
order
First
order
Higuchi
matrix Peppas ‘n’ Best fit
F1 0.9526 0.9847 0.9893 0.9861 0.5651 Higuchi
F2 0.9233 0.9362 0.9486 0.9177 0.5462 Higuchi
F3 0.9389 0.9348 0.9356 0.9283 0.5468 Zero order
F4 0.9696 0.9945 0.9871 0.9960 0.6172 Peppas
F5 0.9769 0.9946 0.9822 0.9928 0.6175 First order
F6 0.9579 0.9681 0.9702 0.9829 0.5584 Peppas
F7 0.8221 0.9362 0.9521 0.9307 0.5476 Higuchi
F8 0.8465 0.9462 0.9679 0.9518 0.5402 Higuchi
F9 0.9610 0.9782 0.9711 0.9732 0.5628 First order
F10 0.9760 0.9853 0.9452 0.9515 0.7036 First order
F11 0.9927 0.9911 0.9478 0.9515 0.7036 Zero order
F12 0.9770 0.9707 0.9401 0.9588 0.6263 Zero order
Marketed
patch 0.8313 0.8918 0.9542 0.9274 0.6468 Higuchi
DISCUSSION
The pure sample of Diclofenac sodium was supplied by corpuscle research solutions,
Visakhapatnam was used in the present investigation. In the first phase of our study the drug
was subjected to various preformulation parameters namely purity, solubility, melting point,
partition coefficient and permeability coefficient. The purity of the compound was 99%. The
solubility studies indicated that Diclofenac sodium was freely soluble in water 35 mg/ml,
phosphate buffer pH 7.4, ethanol, dimethyl sulfoxide, chloroform and methanol respectively.
Melting point of Diclofenac sodium was found to be 282±1.15 . Partition coefficient
determination study of Diclofenac sodium was done with n-octanol and water. The partition
coefficient value of Diclofenac sodium was found to be 3.52. This indicates that Diclofenac

www.wjpps.com Vol 4, Issue 03, 2015.
1057
Rajesh et al. World Journal of Pharmacy and Pharmaceutical Sciences
sodium is lipophilic in nature. The pH of freshly prepared 1% aqueous solution of Diclofenac
sodium was found to be 3.47. The λmax of the selected drug was found to be 274 nm and it
was used throughout the study for the estimation of the drug in the formulations.
Analytical studies: The absorption maximum ( ) was obtained as 274 nm. This implies
purity of the sample drug Diclofenac sodium. The of Diclofenac sodium in pH 7.4 was
found to be 274 nm which corroborates with literature. The calibration curve of Diclofenac
sodium in pH 7.4 phosphate buffer solution shows linearity with of 0.9993.
Preformulation studies: Preformulation studies were carried out and the results was
indicated to be within the range. The melting point, solubility, partition coefficient
parameters were evaluated and the results obtained were corroborated to the existing ones.
Drug excipient compatibility studies: As described in the methodology section the Fourier
transform infrared spectroscopy studies were carried out for pure drug and drug along with
polymers taken respectively. The IR spectra of pure drug and formulations F7 and F8 are
shown in Fig 5, 6 and 7 respectively. Due to replication of peaks in IR spectra of
formulations as that of pure drug indicated the drug polymer compatibility. In the next step, a
total of 12 formulations were prepared using various polymers such as Eudragit, HPMC alone
and in combination as per formulae given in table 1.
Evaluation of transdermal patches: The transdermal patches of Diclofenac sodium were
successfully prepared for the compositions given. The prepared patches were stored in
aluminum pouch and preserved in desiccator for further studies. The prepared patches were
evaluated for their physical parameters and they were found to be flexible and smooth in
appearance. They were also found to be uniform in their weight and thickness.
Physical appearance: The patches formed were smooth with elegant appearance.
Thickness: With the help of digital calipers, the thickness of patches was measured and the
average thickness was noted. The thickness results are found to be uniform. the results
indicates that there was no much difference in the thickness within the formulations means
the patches showed uniformity in their thickness.

www.wjpps.com Vol 4, Issue 03, 2015.
1058
Rajesh et al. World Journal of Pharmacy and Pharmaceutical Sciences
Weight uniformity: Three different films of the individual batch were weighed and the
average weight was calculated. The dried patches were weighed on digital balance and were
found exhibit uniform weight. The data of the individual weights indicated to be within the
limits and uniform. The patches exhibited uniform weight and there was no deviation in the
weight of any formulation and the same was within the limits.
Folding endurance: The folding endurance was measured manually for the prepared
patches. A strip of patch 2x2 cm was cut evenly and repeatedly folded at the same place till it
broken. The number of times the patch could be folded at the same place without breaking
gave the exact value of folding endurance. The result indicates as the HPMC concentration
increases the folding endurance of the patches was increased.
Percentage moisture absorption: The recorded percent moisture absorption was of patches
shown in table 3. The percentage moisture absorption of the prepared patches are in the
following order F4<F5<F12<F11<F6<F10<F2<F9<F8<F3<F1<F7. The results show the
moisture absorption of all the patches are within the acceptable limits.
Percentage moisture loss: The recorded percentage moisture loss of prepared patches was
shown in table 3. The percentage moisture loss of patches are in the following order
F2<F1<F9<F10<F5<F12<F3<F8<F4<F11<F6<F7. The results show that the moisture losses
of all patches are within the acceptable limits.
Drug content uniformity: Drug content of the patch was carried out to ascertain that the
drug is uniformly distributed into the formulation. The results obtained are represented in
table 3. From the results obtained i.e., lowest S.D. values, it was clear that there was proper
distribution of Diclofenac sodium in the film formulations. Hence it was concluded that drug
was uniformly distributed in all the formulations. Delivery of drug through skin for systemic
action is a promising route of administration.
The purpose of this study was to investigate the in vitro release profile of Diclofenac sodium
from various patches containing different ratios of combination of polymers (HPMC and
Eudragit).
In vitro release studies: In vitro release Diclofenac patches were carried out in diffusion cell
using commercial available semi permeable membrane and phosphate buffer (pH 7.4) as
diffusion medium. The release profile data of Diclofenac sodium were given in table 4 for

www.wjpps.com Vol 4, Issue 03, 2015.
1059
Rajesh et al. World Journal of Pharmacy and Pharmaceutical Sciences
patches F1 to F12. From the diffusion studies it was observed that, at the end of 8 h drug
diffusion from formulation F7 (79.947) was maximum than F1 (65.497), F2 (62.324), F3
(60.013), F8 (76.593), F9 (74.543), F10 (57.057), F11 (54.843), F12 (49.97) presented in
table 25 and fig 12. The releases of prepared formulations are compared with the marketed
Diclofenac patch Nupatch 100. The results shown that the formulations F7, F8 released
(79.947, 76.593) drug little bit more than the marketed formulation (74.215). Whereas the
formulation F9 has released (74.543) drug when compared with marketed formulation.
The kinetics of drug diffusion profiles was found out by plotting different graphical models.
All the release profiles are calculated and the kinetic data is presented in respective table 5.
The matrix diffusion controlled transdermal drug delivery system of Diclofenac sodium was
studied for their in vitro drug diffusion to observe the kinetics of drug diffusion from
formulations. From the above results, it was evident that the drug diffusion from the patches
contain Eudragit RLPO and Eudragit RL100 is higher when compared to Eudragit RS100 and
Eudragit RSPO. In these formulations the role of Eudragit (RL100, RLPO, RS 100, RSPO) is
to control the release of the drug from the patches, the formulations containing Eudragit
RL100 and Eudragit RLPO along with HPMC K15 showed higher release when compared to
the other formulations having Eudragit RS100, Eudragit RSPO along with HPMC K15. The
reason for this is the polymers Eudragit RL100 and Eudragit RLPO are more permeable when
compared to Eudragit RS100 and RSPO.
In order to understand the mechanism of drug release, in vitro release data were treated to
kinetic models and linearity was observed with respect to higuchi equation. As indicated by
higher values, the drug release from all the formulations follows first order release and
higuchi model. Since it was conformed as higuchi model and the mechanism was diffusion
controlled. The peppa‟s model is widely used when the release mechanism is not well known
or when more than one type of release phenomenon could be involved. „n‟ value could be
used to characterize different release mechanisms.
Korsemeyer peppa‟s equation is given as %R=K tn or Log %R=Log K+Logt Where
R=drug release; K=constant; n=slope; t= time.

www.wjpps.com Vol 4, Issue 03, 2015.
1060
Rajesh et al. World Journal of Pharmacy and Pharmaceutical Sciences
Mechanism of drug release
‘n’ Mechanism
0.5 Fickian diffusion
0.5 n 1 Non-fickian diffusion
1 Case II transport
The „n‟ values obtained graphically from peppa‟s plot were shown in table 5. The values
obtained were more than 0.5, this indicates the release approximates non fickian diffusion
from the formulations.
CONCLUSION
Diclofenac sodium a non-steroidal anti-inflammatory agent (NSAID) and have analgesic
action which is selected for the preparation of transdermal delivery system as it as it complies
with physicochemical properties required to permeate through skin. The preformulation
studies involving description, melting point, solubility, partition coefficient of drug were
found to be comparable with the standard. The patches were prepared by solvent evaporation
method. The patches were subjected for following evaluation parameters such as physical
appearance, weight variation, thickness, folding endurance, drug content , percent moisture
absorption, percent moisture loss and diffusion studies. All the parameters were within the
limits.
Based on these result the formulations F7 (79.94 %), F8 (76.59 %), F9 (74.54 %) showed
best release in 8 h than other formulations. Formulations contain Eudragit RLPO and HPMC
K15, Eudragit RL100 and HPMC K15 showed good release when compared to the
formulations contain Eudragit RSPO and HPMC K15, Eudragit Rs100 and HPMC K15.
Eudragit RLPO and Eudragit RL100 have highly permeable nature whereas Eudragit RS100,
Eudragit RSPO have low permeable nature. So the formulations contain Eudragit RLPO and
HPMC K15, Eudragit RL100 and HPMC K15 showed good release when compared to the
formulations contain Eudragit RSPO and HPMC K15, Eudragit RS100 and HPMC K15.
The release of prepared patches was compared with the marketed Diclofenac Nupatch 100.
The formulations F7, F8 showed good release of drug (79.94 %, 76.59 %), little bit more than
marketed formulation (74.21 %).From the above studies, it is revealed that by the present
work could improve patient compliance by the current transdermal patch.

www.wjpps.com Vol 4, Issue 03, 2015.
1061
Rajesh et al. World Journal of Pharmacy and Pharmaceutical Sciences
ACKNOWLEDGEMENTS
The authors are thankful to Sri. N.Satish Reddy Vice Chairman of Aditya Institutions, for
providing necessary facilities for this research work. They are also thankful to Management
and teaching faculty of Sri Sai Aditya Institute of Pharmaceutical Sciences and Research,
Surampalem for their help in research.
REFERENCES
1. ChienYie W. Concepts and system design for rate controlled drug delivery. 2nd
ed. New
York: Marcel Dekker Inc, 1992.
2. ChienYie W. Transdermal drug delivery and delivery systems. 2nd
ed. New York: Marcel
DekkarInc, 1992.
3. Obsorne and Hattzenbuler, The influence of skin surface lipids on topical formulations,
in: Topical Drug Delivery formulations, David W. Obsorne, Abntum H. Anaman, Marcel
Dekker Inc, 1996; 70-71.
4. Bell GH, Davidson JN and Scorbrough H. Ch.37 in Textbook of Physiology and
Biochemistry, 5th
ed., Edinburgh, E & S Livingston, 1963; 205.
5. Yie W. Chien. Transdermal drug delivery and delivery systems, Chp 7 in: Novel Drug
Delivery Systems, 2nd
ed. New York, Marcel Dekkar Inc, 1992; 303–304.
6. Williams AC, Barry BW. Skin absorption enhancers, Critical Reviews in Therapeutic
Drug Carrier Systems, 1992; 9: 305-353.
7. Richard H Guy, Jonathan Hadgraft. Selection of drug candidate for transdermal drug
delivery. Vol 35. New York: Marcel DekkarInc, 1989.
8. Bhaskar P, Krishnaiah YSR, Vijaya RJ. Transdermal drug delivery: Role of chemical
penetration enhancers. Int. J. Pharm. Excip, 2004; (3): 6-15.
9. Williams AC, Barry BW. Terpenes and the lipid-protein partitioning therapy of skin
penetration enhancement. Pharm. Res, 1991; 8(1): 17-24.
10. Peppas NA. Mathematical modeling of diffusion process in delivery of polymeric
systems. Vol I, 1984.
11. Patel R P, Patel G, Baria A. Formulation and evaluation of transdermal patch of
aceclofenac. Int J Drug Deliv, 2009; 1:41-51.
12. Kunal N P, Hetal K P, Vishnu A P. Formulation and characterization of drug in adhesive
patches of Diclofenac acid. Int J PharmaSci, 2011; 4 (1): 296-299.

www.wjpps.com Vol 4, Issue 03, 2015.
1062
Rajesh et al. World Journal of Pharmacy and Pharmaceutical Sciences
13. Hemanth B, Pranav K, Ragini. Comparision of transdermal Diclofenac patches with oral
Diclofenac as a modality following multiple premolar extractions in orthodontic patients:
A cross over efficacy trail. Contemporary clinical dentistry, 2010; 1(3): 158-163.
14. Sanjay D, Malgope A. Preparation of carvedilol transdermal patch and the effect of
propylene glycol on permeation. Int J Pharm and Pharma Sci, 2010; 2(1): 137-143.
15. Hamang K, Subrata M, Asif K. Formulation and evaluation of transdermal patches of
Sertaconazole nitrate. Int. Res J Pharm, 2012; 3(11): 109-113.
16. Gudapa RR, Rajashekar V, Jayanthi, Saleem S, Sridhar KA. Formulation and in vitro
evaluation of transdermal films of an anti-hypertensive drug. IRJP 2013; 4(6): 66–71.
17. Madhulatha A, Naga RT. Formulation and evaluation of ibuprofen transdermal patches.
Int. J Res Pharm Bio Sci, 2013; 4(1): 351-362.
18. Updesh BL, Yogesh MA, Rupesh VC, Dinesh MB, Milind JU. Design, formulation and
evaluation of transdermal drug delivery system of Budesonide. Digest J Nano Bio
structures, 2011; 6(2): 475 - 497.
19. Ting L, Changshun R, Manli W, Ligang Z, Ximeng W, Liang F. Optimized preparation
and evaluation of indomethacin transdermal patch. Asian J Pharm Sci, 2007; 2(6): 249 -
259.
20. Bharathi A, Kalyana SN, Ramana RG, Veeranjaneyulu M, SirishaA, Kamala P.
Formulation and In Vitro Evaluation of Diclofenac Sodium Sustained Release Matrix
Tablets using Melt Granulation Technique. International Journal of Research in
Pharmaceutical and Biomedical Sciences, 2011; 2(2): 788-808.
21. Abdul B, Mahoodand M. Hamezh J. Spectrophotometric Determination of Diclofenac
sodium in Pharmaceutical preparations. Journal of Kerbala University, 2009; 7(2): 310-
316.
22. Atherden LM. Analytical methods. 8th
ed. Oxford medical publication, 2002.
23. Fang JY, Wamg RJ, Wu PC, Jsai YH. Passive and iontophoretic delivery of three
Diclofenac salts across various skin types. Bio Pharm. Bul, 2000; 23: 1357-1362.
24. Robert VS, James TS. Procurement and characterization of standard reference materials.
4th
ed. Philadelphia, 1981.
25. Priyanka A, Biswajit M. Design, development, physicochemical and in vitro, in vivo
evaluation of transdermal patches containing Diclofenac diethylammonium salt. J. Pharm.
Sci, 2002; 91(9): 2078-88.

www.wjpps.com Vol 4, Issue 03, 2015.
1063
Rajesh et al. World Journal of Pharmacy and Pharmaceutical Sciences
26. Fregany A, Mohammed, Hussin Khedr. Preparation and in vitro / in vivo evaluation of the
buccal adhesive properties of slow-release tablets containing miconazole nitrate. Drug.
Dev. Ind. Pharm, 2003; 29(3): 321-37.
27. Bremecker KD, Strempel H, Klein G. Novel concept for a mucosal adhesive ointment. J.
Pharm. Sci, 1984; 73(4): 548-52.
28. Munden BJ, Dekay HG, Banker GS. Evaluation of polymeric materials and screening of
film coating agent. J. Pharm. Sci, 1964; 53: 395-401.
29. Raghavendra K, Hiremath D, Marshal SC, Patil CC, Habbu PV. Comparative evaluation
of polymeric films for transdermal application. The Eastern Pharmacist 2000; XLIII
(516): 109-11.
30. Baichwal RW. Advances in drug delivery systems. MSR foundation. 1983: 136-47.
31. Kusum Devi V, Saisivam S, Maria GR, Deepti PU. Design and evaluation of matrix
diffusion controlled transdermal patches of verapamil hydrochloride. Drug. Dev. Ind.
Pharm, 2003; 29(5): 495-503.
32. Bhalla HL, Shah AA. Controlled release matrices for ketoprofen. Indian Drugs, 1991;
28(9): 420-22.
33. Flynn GL, Durrheim H, Huguchi WI. Permeation through hairless mouse skin II:
membrane sectioning techniques and influence on alkanol permeabilities. J. Pharm.Sci,
1981; 70 (1): 52-56.
34. Chien YW. Systemic drug delivery of pharmacologically active molecule across the skin.
Vol 100. New York, 1991.


![FORMULATION AND EVALUATION OF TRANSDERMAL …...FORMULATION AND EVALUATION OF TRANSDERMAL PATCHES USING ... 1.3 TRADITIONAL DOSAGE FORMS OF AYURVEDIC MEDICINES [2] The dosage forms](https://img.dokumen.tips/doc/110x75/5f0244287e708231d403685a/formulation-and-evaluation-of-transdermal-formulation-and-evaluation-of-transdermal.jpg)