Embed Size (px)
Citation preview
December 9, 2007
Formative and Summative Assessment in Economics Principles Courses:
Are Applied Exercises Effective?
Dagney Faulk, Ph.D.
Associate Professor of Economics
Indiana University Southeast
New Albany, IN
phone: (812)941-2569
e-mail: [email protected]
website: http://homepages.ius.edu/DFAULK
Prepared for the 2008 Annual Meeting of the American Economic Association,
January 4-6, New Orleans, LA.
Abstract:
A limited number of studies have focused on formative assessment in higher education.
This paper examines the effectiveness of applied exercises as a formative assessment
technique in an economics principles course. The exercises did correspond to overall
improvements in pre and post test scores. However, the analysis suggests that the applied
exercises are not the most effective way to provide feedback to students about their
understanding of a targeted topic but that there are other benefits, such as increased
motivation and getting to know other students in the class, which lead to overall
improvement in the course.
JEL Classifications: A22 – Undergraduate Economics Education and Teaching of
Economics
1
Formative and Summative Assessment in Economics Principles Courses:
Are Applied Exercises Effective?
Assessment has become an important aspect of course and curriculum design.
The No Child Left Behind Act, for example, requires annual assessment for every child
in grades 3-8. The Association to Advance Collegiate Schools of Business (AACSB)
Assurance of Learning (AOL) standards implemented in 2003 require direct measures of
student learning at the college level. Formative and summative assessment are two types
of assessment that have been studied. Torrance and Pryor (1998) define summative
assessment as assessment that occurs at the end of a course to “measure and communicate
pupil performance for purposes of certification and (latterly) accountability.” Formative
assessment occurs during a course “with the express purpose of improving pupil
learning.” (8) Formative assessment techniques provide information to students and
teachers about student understanding or course topics before summative assessment (such
as exams) takes place. Traditionally, most instruction includes lecture and exams where
exams are a form of summative assessment. More recently educators have become more
cognizant of formative assessment techniques and the role that such techniques can play
in facilitating student learning. The proposed paper analyzes the effectiveness of applied
exercises as a formative assessment technique.
This paper is organized as follows: The next section provides a brief overview of
formative assessment as an instructional tool. The following section provides a brief
literature review of the effectiveness of formative assessment in improving learning.
Section four provides information on course design for my economics principles courses.
Section five provides an overview of five applied exercises that I introduced in my

2
economics principles courses fall 2006. These applied exercises focus on topics that
students typically find difficult and were developed as part of the Teaching Innovation
Program assessment module.1 These assignments are formative assessment techniques in
that students and I can identify sources of confusion before the exam (summative
assessment). Section six analyzes the effectiveness of the applied exercises. The final
section offers conclusions.
Formative Assessment and Instruction
The functions of formative assessment have been identified and analyzed.
Wininger and Norman (2005) identify “three key functions of formative assessment: (a)
informing teachers about student learning during instruction for the purpose of guiding
and modifying instruction; (b) providing corrective feedback to students about learning
progress for the purpose of guiding and improving learning; and (c) enhancing student
motivation.” (p. 24) Some of the issues involving these functions are getting student to
respond to feedback, presenting feedback in such a say that students understand what
they need to do to improve, and getting students to understand that feedback is being
given if a nontraditional approach (such as applied exercises in pairs) is used. In addition
the literature is unclear about whether feedback or motivation is the dominant effect
resulting from formative assessment.
Sadler (1989) argues that formative assessment includes both feedback and self
monitoring, and that the goal of instruction is to “facilitate the transition from feedback to
self-monitoring” (122). Where feedback is information from an external source, and self
1 I participated in the May 2006 Teaching Innovation Program (TIP) in Rosemont, IL. TIP is cosponsored
by the American Economic Association and the National Science Foundation.
3
monitoring is information from the learner. A common problem with feedback is that
students receive valid judgments (feedback) on the quality of their work, yet do not
necessarily improve. He identifies three necessary conditions for effective feedback: (a)
The learner must know what the goal (ideal standard) is, (b) the learner‟s actual
performance must be compared to the ideal performance, and (c) the learner must engage
in actions to close the gap between the actual and the ideal. (121)
One issue that has not been explicitly addressed in the literature is exactly what
types of activities constitute formative assessment. Formative assessment takes many
forms including but not limited to self evaluation, teacher‟s comments on portfolios or
assignments, and peer evaluation. Black and Wiliam (1998) note that in order for
assessment to be formative the feedback has to be used: Students must respond to the
feedback. It is not clear from the research which types of activities are the most effective
way to provide feedback for the purposes of formative assessment.
Formative Assessment and Higher Education: A Literature Review
A limited number of studies have focused on formative assessment in higher
education. Black and Wiliam (1998) provide a comprehensive review of studies focusing
on formative assessment in primary, secondary and higher education settings since 1988.
Their general conclusion is that formative assessment is effective in a variety of
educational settings, circumstances and disciplines and that the quality of feedback is
crucial. They also point out that formative assessment techniques are not widely used.
Slater, Ryan and Samson (1997) focus on portfolio assessment in a college
physics course and compare final exam scores for students participating in portfolio
4
assessment and traditional objective examinations during the semester. They find no
significant difference in final exam scores among the two groups. Benefits of portfolio
assessment included less anxiety, more time reading and studying outside of class,
enjoying the learning experience.
While not explicitly focusing on formative assessment Johnston, James, Lye and
McDonald (2000) evaluate collaborative problem solving (CPS) as a method of learning
economics. CPS involved small group „tutoring‟ sessions outside of class where students
discussed issues and problems relevant to intermediate macroeconomic theory. This may
be considered a type of formative assessment since students receive immediate feedback
from other group members and the tutor. CPS was particularly beneficial (in terms of a
higher course grade) for high attending, below-average international students.
Lan, Bradley, and Parr (1993) examine self monitoring in a graduate-level
introductory statistics course. Students in the treatment group filled out a self-monitoring
protocol as they proceeded through the course. Another treatment group monitored
intructor‟s teaching activities using a similar protocol. Results of the study indicate that
students participating in the self-monitoring protocol found it an efficient way to gain
information about their learning and that these students scored higher on exams.
Stefani (1994) focuses on the reliability of peer and self assessment (in terms of
assigning grades) relative to assessment by a professor. She finds that students
participating in peer and self assessment give grades similar to the professor and that peer
and self assessment motivates students to reach higher levels of achievement.
Keefe and Eplion (2007) investigate the effects of online formative assessment
using pretests in an upper level undergraduate business management class and find that
5
formative assessment serves to motivate students to read more chapters and attend more
classes which lead to higher course grades. This motivational effect prior to feedback
accounts for nearly all of the impact of formative assessment on student achievement.
Course Details and Design
The applied exercises were implemented in E200 Fundamentals of Economics:
An Overview. This is the second economics principles course at Indiana University
Southeast. It covers both macroeconomics, microeconomics, and international
economics. The textbook is Economics Private and Public Choice by Gwartney, Stroup,
Sobel and MacPherson. Each semester I teach two sections with 30 to 40 students in
each class. The class meets 28 days during the semester. Each class meets twice a week
for 1 hour and 15 minutes for a total of 2.5 hours per week. The classrooms have
moveable desks, an overhead and projection unit, and a projection unit attached to a
computer with internet access. One of the two classrooms I usually teach in is quite
small for 35 students. For most students at IU Southeast, their education is not their top
priority. Most students have jobs and family responsibilities which take priority. Many
students have weak math and writing skills. I tend to teach day sections of this course, so
most of the students are traditional age.
Grading opportunities in the class include three semester exams each worth 15
percent of the course grade and a final exam worth 26 percent of the course grade. The
first exam covers supply and demand, elasticity, price controls, tax incidence, and the
role of government. The second exam covers microeconomics – costs of production and
market structure. The third exam covers macroeconomics – basic macro indicators, the

6
aggregate demand and supply model, monetary and fiscal policy. The final exam is semi
cumulative covering international economics and a variety of macro and micro concepts.
Other grading opportunities include 5 quizzes (totaling 17 percent of the course grade) –
a pretest and posttest, and traditional quizzes covering supply, demand, and elasticity;
market structure; and basic macro indicators. Additional grading opportunities include
exam corrections for the three semester exams (totaling 6 percent of the course grade)
and class participation (totaling 6 percent of the course grade). The class participation
includes discussion of instructor-assigned articles from the Wall Street Journal, the
applied exercises, and assigned material from the text.
I use a criterion approach to grading – no „curves‟ when grading exams and
quizzes. Research has shown that a normative approach (using curves) “emphasizes
competition between pupils rather than personal improvement of each” (Black and
Wiliam, 9) which is counter to the goals of formative assessment.
The Applied Exercises
Common weaknesses of traditional course design include a focus on
memorization and recall versus synthesis and evaluation both in class and in assignments
and exams, rewarding students for the quantity of work rather than quality, and the use of
summative assessment with no feedback action. In my economics principles course, I
have attempted to address these weaknesses. In the following discussion I focus on
feedback action as a form of formative assessment using applied exercises.
Fall semester 2006, I introduced a series of 5 applied exercises in my E200
classes. The purpose of this innovation was to assess student understanding of basic
7
economic concepts and in particular concepts that students often find difficult. The
exercises were designed to help students relate economic concepts to current events
(assignments 1 and 5), interpret tables or graphs (assignments 2 and 3), write about
economic concepts (all), understand supply and demand (assignment 1), and understand
monetary policy (assignment 4). These assignments help students and me identify
sources of confusion before the exam. Four of the exercises are group/writing
assignments and one assignment requires students to write their opinion about an
economic issue before and after instruction. Assignment details are in the appendix.
Copies of the assignments are available on my website:
http://homepages.ius.edu/DFAULK.
I also view quizzes as an additional formative assessment method in this class.
Since fall 2005 I have incorporated three quizzes over topics that students find
particularly difficult. When I distribute and return the quizzes I let students know that the
purpose of the quiz is to provide information about whether they understand the material.
Similar questions are included on the semester exams. One problem with this technique
is that each semester there are several students who miss the quiz question and then do
not take corrective action to the feedback and perform poorly on similar questions on the
exam. This illustrates that quizzes are not a good formative assessment instrument for all
students.
Are applied group exercises effective?
From my perspective, the outcomes of these applied exercises were that students
seemed more engaged in class discussion and with the material. From the students'

8
perspective, they seemed to enjoy doing these sorts of exercises. The exercises did
correspond to improvements in the summative assessment measures (discussed below).
The exercises affected my teaching in that they helped me to think more systematically
about how to structure individual classes and how to approach material that students
typically find difficult. The exercises promoted interactive learning by providing a
framework for students to interact with each other and with the material.
Analysis of Descriptive Statistics
The evidence collected to assess the effectiveness of the applied exercises include
Drop, Withdrawal, Fail (DWF) rates for each class, scores on pre and post tests, and
summative assessment over various economic topics based on the final exam (initially
developed for AACSB purposes). I determined if the formative assessment techniques
(i.e. the applied exercises) improved summative assessment results by comparing results
from spring 2006 when the applied exercises were not used and fall 2006 when the
exercises were used. Other aspects of the course were similar between the two semesters.
A summary of the assessment results include the following. DWF rates for spring
2006 were 40 percent and 35 percent, respectively. DWF rates for fall 2006 were 34.4
percent and 37.1 percent, respectively. These rates suggest that introducing the applied
exercises had little effect on DWF rates. I did not really expect that they would, but this
is one of the indicators that I track each semester.
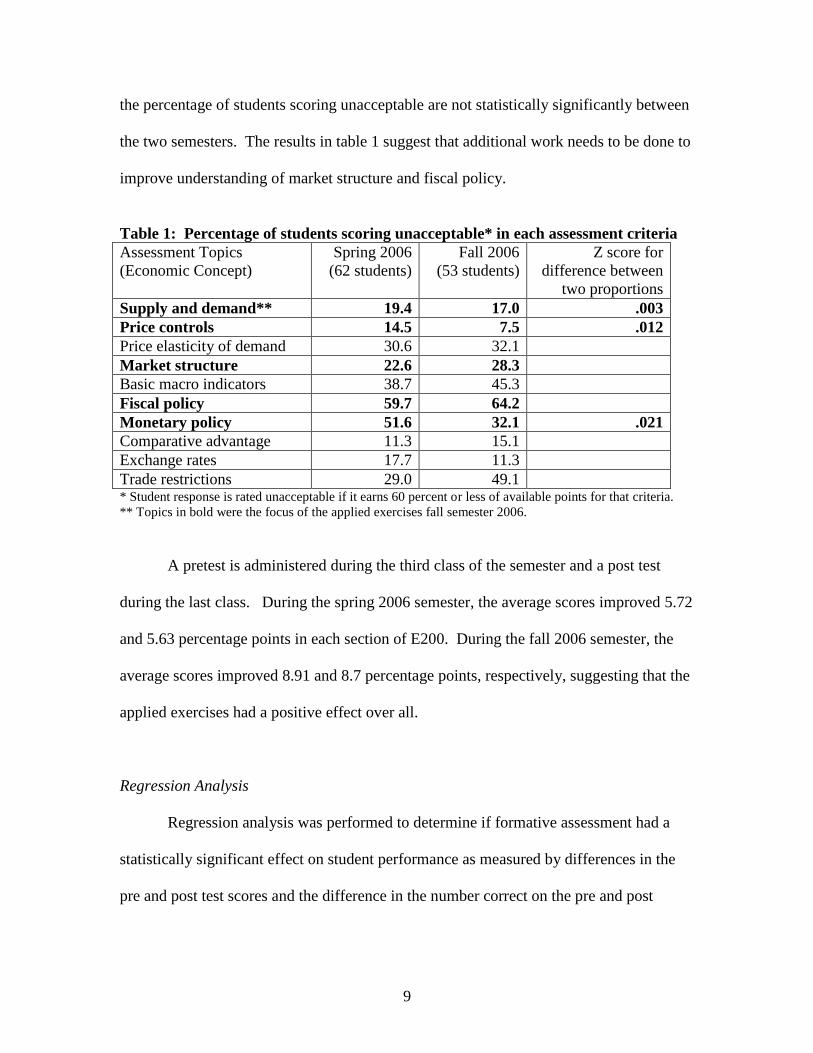
Summative assessment measures based on the final exam (presented in Table 1)
show improved understanding of basic supply and demand, price controls, and monetary
policy. However, statistical tests (the very small Z scores) reveal that the differences in
9
the percentage of students scoring unacceptable are not statistically significantly between
the two semesters. The results in table 1 suggest that additional work needs to be done to
improve understanding of market structure and fiscal policy.
Table 1: Percentage of students scoring unacceptable* in each assessment criteria
Assessment Topics
(Economic Concept)
Spring 2006
(62 students)
Fall 2006
(53 students)
Z score for
difference between
two proportions
Supply and demand** 19.4 17.0 .003
Price controls 14.5 7.5 .012
Price elasticity of demand 30.6 32.1
Market structure 22.6 28.3
Basic macro indicators 38.7 45.3
Fiscal policy 59.7 64.2
Monetary policy 51.6 32.1 .021
Comparative advantage 11.3 15.1
Exchange rates 17.7 11.3
Trade restrictions 29.0 49.1 * Student response is rated unacceptable if it earns 60 percent or less of available points for that criteria.
** Topics in bold were the focus of the applied exercises fall semester 2006.
A pretest is administered during the third class of the semester and a post test
during the last class. During the spring 2006 semester, the average scores improved 5.72
and 5.63 percentage points in each section of E200. During the fall 2006 semester, the
average scores improved 8.91 and 8.7 percentage points, respectively, suggesting that the
applied exercises had a positive effect over all.
Regression Analysis
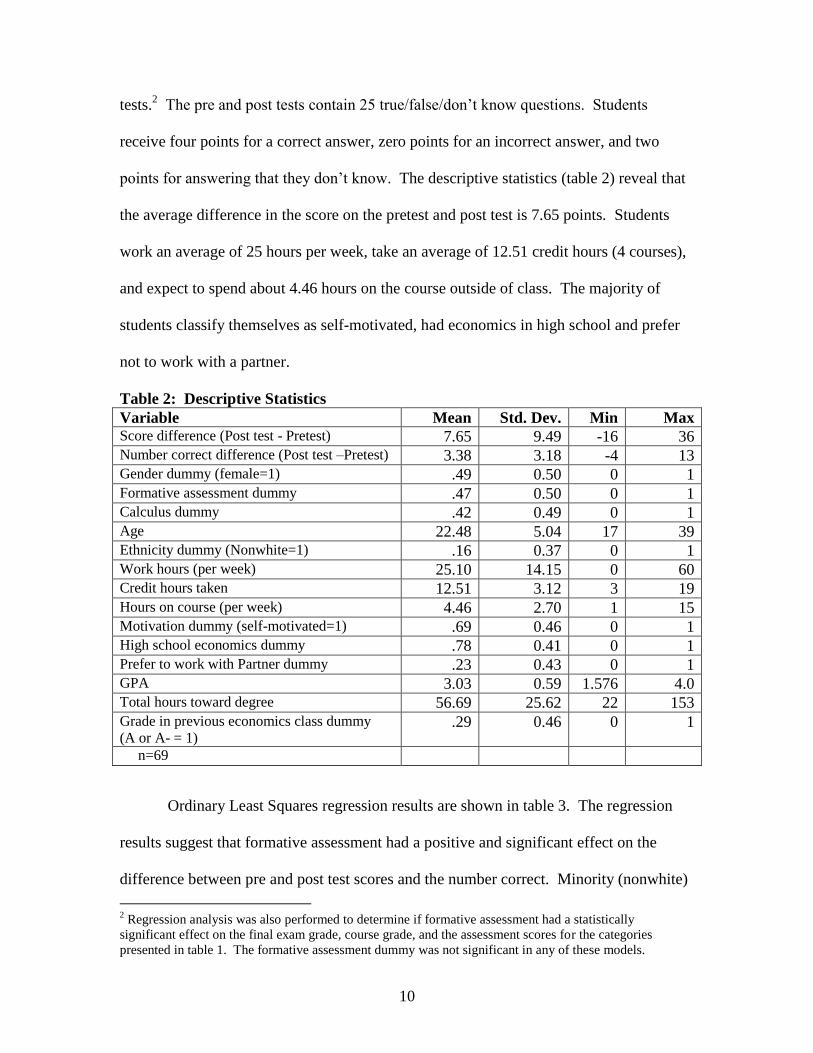
Regression analysis was performed to determine if formative assessment had a
statistically significant effect on student performance as measured by differences in the
pre and post test scores and the difference in the number correct on the pre and post
10
tests.2 The pre and post tests contain 25 true/false/don‟t know questions. Students
receive four points for a correct answer, zero points for an incorrect answer, and two
points for answering that they don‟t know. The descriptive statistics (table 2) reveal that
the average difference in the score on the pretest and post test is 7.65 points. Students
work an average of 25 hours per week, take an average of 12.51 credit hours (4 courses),
and expect to spend about 4.46 hours on the course outside of class. The majority of
students classify themselves as self-motivated, had economics in high school and prefer
not to work with a partner.
Table 2: Descriptive Statistics
Variable Mean Std. Dev. Min Max Score difference (Post test - Pretest) 7.65 9.49 -16 36 Number correct difference (Post test –Pretest) 3.38 3.18 -4 13 Gender dummy (female=1) .49 0.50 0 1 Formative assessment dummy .47 0.50 0 1 Calculus dummy .42 0.49 0 1 Age 22.48 5.04 17 39 Ethnicity dummy (Nonwhite=1) .16 0.37 0 1 Work hours (per week) 25.10 14.15 0 60 Credit hours taken 12.51 3.12 3 19 Hours on course (per week) 4.46 2.70 1 15 Motivation dummy (self-motivated=1) .69 0.46 0 1 High school economics dummy .78 0.41 0 1 Prefer to work with Partner dummy .23 0.43 0 1 GPA 3.03 0.59 1.576 4.0 Total hours toward degree 56.69 25.62 22 153 Grade in previous economics class dummy
(A or A- = 1) .29 0.46 0 1
n=69
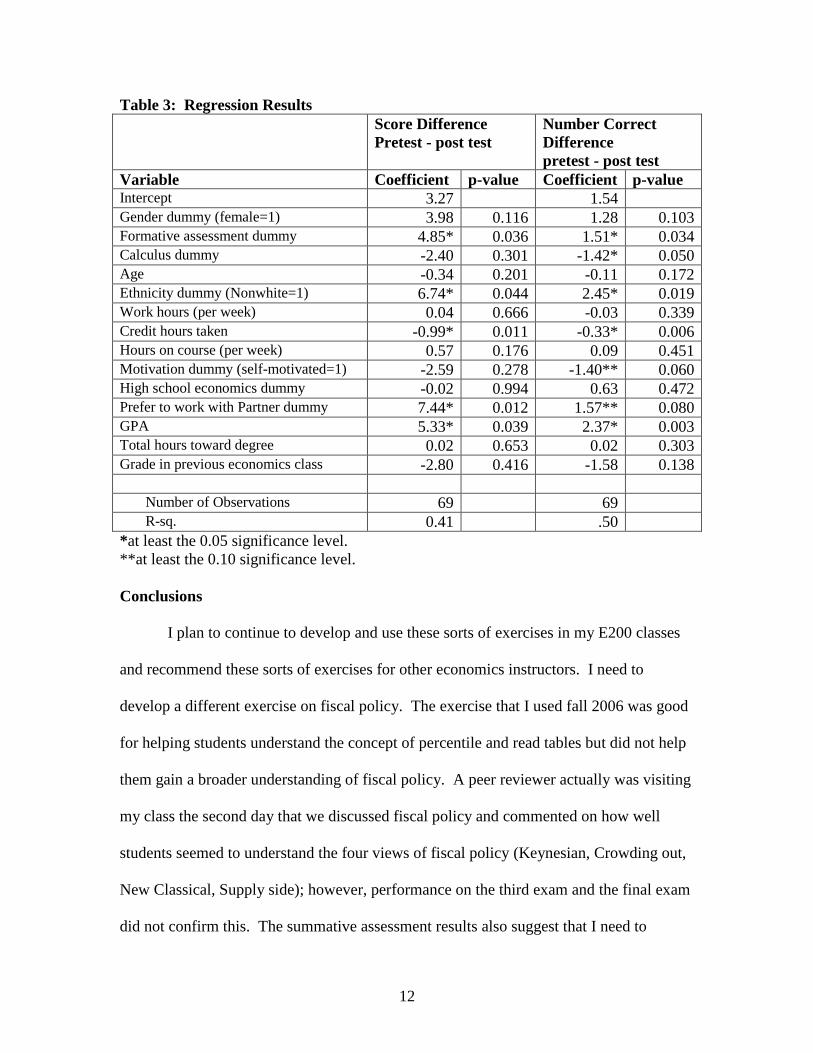
Ordinary Least Squares regression results are shown in table 3. The regression
results suggest that formative assessment had a positive and significant effect on the
difference between pre and post test scores and the number correct. Minority (nonwhite)
2 Regression analysis was also performed to determine if formative assessment had a statistically
significant effect on the final exam grade, course grade, and the assessment scores for the categories
presented in table 1. The formative assessment dummy was not significant in any of these models.

11
students tended to show the most improvement in pre and post test scores along with
students taking fewer credit hours. Students who prefer to work with a partner and with
higher GPAs also show more improvement in the test scores and number correct.
Regression analysis was also performed to determine if formative assessment had
a statistically significant effect on the assessment scores for supply and demand, price
controls, and monetary policy (listed in table 1). The formative assessment dummy was
not significant in any of these models.3
The formative assessment dummy was a significant determinant of overall
improvement as measured by the pre and post tests but not a significant determinant of
targeted assessment scores (supply and demand, etc.) that were the focus of the formative
assessment. This suggests that formative assessment served more of a motivational role.
The feedback that resulted from participation in the applied exercises does not appear to
have influenced performance on targeted test questions (supply and demand, etc.), but the
group exercises did provide a mechanism for students to get to know each other, think
about a realistic application, and ask questions which may have motivated students to
study more during the semester and perform better on the post test. This suggests that
students are not responding to the explicit feedback resulting from the applied exercises,
but that students are benefiting from the interaction with other students by working in
pairs. As a commuter school, it is common for students not to know anyone in class.
Working in pairs may provide a contact so that students feel comfortable asking another
student about confusing topics or applications throughout the course.
3 Regression results for these models are available from the author upon request.
12
Table 3: Regression Results
Score Difference
Pretest - post test
Number Correct
Difference
pretest - post test
Variable Coefficient p-value Coefficient p-value Intercept 3.27 1.54 Gender dummy (female=1) 3.98 0.116 1.28 0.103 Formative assessment dummy 4.85* 0.036 1.51* 0.034 Calculus dummy -2.40 0.301 -1.42* 0.050 Age -0.34 0.201 -0.11 0.172 Ethnicity dummy (Nonwhite=1) 6.74* 0.044 2.45* 0.019 Work hours (per week) 0.04 0.666 -0.03 0.339 Credit hours taken -0.99* 0.011 -0.33* 0.006 Hours on course (per week) 0.57 0.176 0.09 0.451 Motivation dummy (self-motivated=1) -2.59 0.278 -1.40** 0.060 High school economics dummy -0.02 0.994 0.63 0.472 Prefer to work with Partner dummy 7.44* 0.012 1.57** 0.080 GPA 5.33* 0.039 2.37* 0.003 Total hours toward degree 0.02 0.653 0.02 0.303 Grade in previous economics class -2.80 0.416 -1.58 0.138 Number of Observations 69 69 R-sq. 0.41 .50
*at least the 0.05 significance level.
**at least the 0.10 significance level.
Conclusions
I plan to continue to develop and use these sorts of exercises in my E200 classes
and recommend these sorts of exercises for other economics instructors. I need to
develop a different exercise on fiscal policy. The exercise that I used fall 2006 was good
for helping students understand the concept of percentile and read tables but did not help
them gain a broader understanding of fiscal policy. A peer reviewer actually was visiting
my class the second day that we discussed fiscal policy and commented on how well
students seemed to understand the four views of fiscal policy (Keynesian, Crowding out,
New Classical, Supply side); however, performance on the third exam and the final exam
did not confirm this. The summative assessment results also suggest that I need to
13
develop exercises on the relationship between price elasticity of demand and total
revenue, interpreting the price elasticity of demand, the advantages and disadvantages of
trade restrictions, and the benefits of international trade to help students understand these
concepts better.
This paper has provided information on the effects of applied exercises as a
formative assessment technique. Of the functions of formative assessment identified in
the literature, the regression analysis suggests that applied exercises as a formative
assessment technique may serve to motivate students to study more and thereby improve
their general understanding of economics rather than lead to significant improvement in
understanding the targeted topics. This suggests that applied exercises are not the most
effective way to provide feedback to students about their understanding of a specific
topic, but that there are other benefits that lead to overall improvement in the course.
14
References
Black, Paul and Wiliam, Dylan. “Assessment and Classroom Learning.” Assessment in
Education: Principles, Policy & Practice 5.1 (March 1998): 7-75.
Johnston, Carol G. James, Richard H., Lye, Jenny N. and McDonald, Ian M. “An
Evaluation of Collaborative Problem Solving for Learning Economics” Journal
of Economic Education 31.1 (Winter 2000): 13-29.
Keefe, Thomas J. and Eplion, David M. “Differentiating Motivational from Feedback
Effects: An Empirical Study of Formative Assessment in a College Classroom”
Indiana University Southeast, School of Business, Working Paper.
Lan, William Y., Bradley, Loretta, and Parr, Gerald. “The Effects of a Self-Monitoring
Process on College Students‟ Learning in an Introductory Statistics Class.”
Journal of Experimental Education 62.1 (Fall 1993): 26-40.
Sadler, D. Royce. “Formative Assessment and the Design of Instructional Systems.”
Instructional Science 18.2 (June 1989): 119-144.
Slater, Timothy F., Ryan Joseph M., and Samson, Sara L. “Impact and Dynamics of
Portfolio Assessment and the Traditional Assessment in a College Physics
Course.” Journal of Research in Science Teaching 34.3 (March 1997) 255-271.
Stefani, Lorraine A.J. “Peer, Self and Tutor Assessment: Relative Reliabilities.” Studies
in Higher Education 19.1 (March 1994): 69-76.
Torrance, Harry and Pryor, John. Investigating Formative Assessment Teaching,
learning and assessment in the classroom. Philadelphia: Open UP, 1998.
Wininger, Steven R. and Norman, Antony D. “Teacher Candidates‟ Exposure to
Formative Assessment in Educational Psychology Textbooks: A Content
Analysis.” Educational Assessment 10.1 (2005): 19-37.

15
APPENDIX
Assignment details (Please see my webpage http://homepages.ius.edu/DFAULK.
for additional information.)
1. (Class 3) Drawing and interpreting supply and demand graph using think, pair, share:
Display website with ad "Stop sending us your used clothes." (Kenyans are lobbying US
nonprofits to stop sending used clothes because is distorts the Kenyan domestic textile
market.) Students discuss why Kenyans are taking these actions, draw and supply and
demand graph to illustrate the effect of used US clothing on the Kenyan textile market,
and explain (written response) the effect on quantity and prices. Students work in groups
of two using the think, pair, share methodology. I alloted 25 minutes (out of one hour
and 15 minutes) toward the beginning of class for this activity -- 5 minutes alone, 10
minutes in pair, 10 minutes class discussion. The activity took place after a brief review
of factors that shift supply and demand and was followed by some additional examples as
time permitted. I did not run out of time for this particular assignment, but if we did
I would finish up as a review at the beginning of the next class. Students had an
incentive to participate because I circulate and monitor interaction as part of their
participation grade. I called on pairs randomly to draw the graph on the board and
explain the effect of used US clothing on the Kenyan textile market.
2. (Class 10) Calculating and interpreting various costs and revenue concepts using a
problem in the text and think, pair share. Students do calculations for TC, AC, MC, TR,
MR, etc. and provide written responses to questions interpreting the numbers followed by
class discussion. I allot 45 minutes for this problem. Students work in groups of 2 using
think, pair, share. It took a good 15 to 20 minutes for most students to make progress on
the calculations and then 15 minutes to begin to figure out what the numbers mean. I
circulate answering questions and monitoring interaction as the students work. About 15
to 20 minutes into the exercise, I project the correct calculations, begin calling on
students to explain how a particular number was calculated, and answer any questions
about how the numbers are calculated. Then, I give the students additional time to answer
the questions interpreting the numbers. Students have the most trouble with the marginal
concepts. After another 15 minutes or so, we have discussion where I randomly called on
pairs to answer questions. Students have an incentive to participate because it is part of
their participation grade; I circulate and check calculations as I go. Students know that
there will be a similar question on the exam worth 15 points (out of a 100). I removed
two chapters from the micro section of the course, so I have extra time for this exercise if
I need it. If I run out of time, I finish the exercise as a review of the cost and revenue
concepts at the beginning of the next class.
3. (Class 18) During the discussion of fiscal policy using think, pair, share: Students
examine the data table in the text displaying federal income tax share by percentile from
1980 to 2002 and provide written responses to the following questions (after reviewing
the concept of percentiles). Are the richest Americans paying more or less income taxes
over this time period? Explain. What has happened to the share of income taxes paid by

16
the bottom 50 percent of earners? How does this compare with the share paid by the top
10 percent of earners? What are some factors that could have caused this change in the
share of taxes paid by the top 1 percent and the bottom 50 percent of income earners?
How does this relate to fiscal policy? Students worked in groups of 2 using think, pair,
share. I allot 25 minutes at the end of class for the exercise -- five minutes working
alone, 10 minutes in pairs, 10 minutes of discussion. I circulated to make sure students
were staying on task and answer questions. During the discussion, I call on pairs
randomly to answer the questions. We ran out of time because we got started late, and I
picked up at the beginning of the next class as a review.
4. (Class 23) During the discussion of monetary policy using think, pair, share: Students
discuss the following problem and provided a written response. Consider the following
macro indicators: annual GDP growth rate in the U.S. is 6 percent, the US unemployment
rate is 4 percent, the annual inflation rate is 5 percent. (a) Explain what each indicator
means and whether each indicator is high or low by historical standards (refer to tables in
text that provide a time series of GDP growth, unemployment and inflation), (b) Draw an
AD-AS graph that is consistent with the indicators listed above, (c) Discuss actions the
Fed is likely to take at the next FOMC meeting and explain why. Students work in pairs
using think, pair, share method. I allot 25 minutes to this exercise -- 5 minutes alone, 10
minutes in pairs, 10 minutes class discussion at the end of class. I circulated during
group work and call on pair randomly to answer questions and comment on others'
responses during the discussion (to provide an incentive to participate). We did not run
out of time, but if we did, I would use this as a review at the beginning of the next class.
5. (Classes 4 and 5) Before discussing price controls -- I provided a summary of the
recent house bill to increase the minimum wage and ask students (individually) to write
their opinion on increasing the minimum wage (class 4). Repeat after covering price
controls in the course (class 5) with some additional questions about who benefits and
who loses from the minimum wage and comparing responses. I allot 10 minutes for
written responses at the end of class 4 before price controls are covered and 15 minutes at
the end of class 5 after price controls are covered for students to write responses and have
class discussion. Students worked individually and I circulate during the activity.
During class discussion, students indicate if their opinion changed and why and indicate
who benefits and who loses from minimum wage legislation. I make sure the reiterate
that I do not care if students support increasing the minimum wage or not, but that they
need to know the potential effects and have an economic rationale for their view. We did
not run out of time at the end of class 5, but if we did I would recap at the beginning of
class 6, which deals with the role of government.