Embed Size (px)
Citation preview
1
Formal versus Informal Finance:
Evidence from China
Meghana Ayyagari Asli Demirgüç-Kunt Vojislav Maksimovic*
March 2007
Abstract: China is often mentioned as a counterexample to the findings in the finance and growth literature since, despite the weaknesses in its banking system, it is one of the fastest growing economies in the world. The fast growth of Chinese private sector firms is taken as evidence that it is alternative financing and governance mechanisms that support China’s growth. This paper takes a closer look at firm financing patterns and growth using a database of 2400 Chinese firms. We find that a relatively small percentage of firms in our sample utilize formal bank finance with a much greater reliance on informal sources. However, our results suggest that despite its weaknesses, financing from the formal financial system is associated with faster firm growth, whereas fund raising from alternative channels is not. Using a selection model, we find no evidence that these results arise because of the selection of firms that have access to the formal financial system. While firms report bank corruption, we do not find evidence that it significantly affects the allocation of credit or the performance of firms that receive the credit. We find that an important determinant of access to bank loans is the ability to post collateral, which is in turn a function of firm size, level of fixed assets and firm location. Our findings suggest that the role of reputation and relationship based financing and governance mechanisms in financing the fastest growing firms in China is likely to be overestimated. ___________________________ *Ayyagari: School of Business, George Washington University; Demirgüç-Kunt: World Bank; Maksimovic: Robert H. Smith School of Business at the University of Maryland. This paper’s findings, interpretations, and conclusions are entirely those of the authors and do not necessarily represent the views of the World Bank, its Executive Directors, or the countries they represent.

2
Introduction There is a significant body of research on the role of informal or non-market
institutions1 in low income countries in risk sharing and providing credit. The dominant
theory in the literature has been that informal institutions have a comparative advantage
in monitoring (the peer monitoring view as in Stiglitz (1990) and Arnott and Stiglitz
(1990)) and enforcement capacity.2 A common interpretation of this theory is that
informal institutions act as a substitute to formal institutions in low income countries. For
instance, Besley and Levenson (1996) have argued that economies like Taiwan grew
despite an underdeveloped formal financial sector due to informal institutions. More
recently, Allen, Qian, and Qian (2005) suggest that China may be an important counter-
example to the law and finance literature since the fastest growing Chinese firms rely on
alternative financing channels rather than formal external finance. They argue that private
sector firms in China, despite facing weaker legal protections and poorer access to
finance than firms in the state and listed sectors, are the fastest growing due to their
reliance on alternative financing and governance mechanisms.
An alternative hypothesis is that informal financial institutions play a
complementary role to the formal financial system by servicing the lower end of the
market. Informal financial institutions serve firms who cannot access the formal
financial system due to the lack of good growth opportunities or poor credit ratings or
1 By informal financial institutions, we refer to the entire gamut of non-market institutions such as credit cooperatives, moneylenders, informal credit and insurance, rotating savings and credit associations, etc. that do not rely on formal contractual obligations enforced through a codified legal system. Several of these institutions operate as loan sharks in developing countries charging exorbitantly high interest rates. 2 Theoretically the informal sector has been modeled as both, a competitor to its formal counterpart (as in Bell et al., 1997; Jain, 1999; Varghese, 2005) as well as a channel of formal funds, where informal lenders who offer credit acquire formal funds to service entrepreneurs’ financing needs (Floro and Ray, 1997; Bose, 1998; Hoff and Stiglitz, 1998). Both strands of literature emphasize that informal lenders hold a monitoring advantage over the formal lender.

3
information asymmetry problems, and are able to use their monitoring and enforcement
advantage to ensure repayment. According to this view however, informal financial
systems cannot substitute for formal financial systems because their monitoring and
enforcement mechanisms are ill-equipped to scale up and meet the needs of the higher
end of the market. 3
In this paper, we use detailed firm level survey data on twenty four hundred firms
in China to investigate which of the two views are consistent with the operation of the
informal sector in China. Does the informal sector act as a substitute to the formal
financial system and finance the fastest growing firms or does the informal sector
primarily serve the lower end of the market? To answer this question, we first investigate
whether Chinese firms’ financing patterns are different when compared to those of
similar firms in other countries that have been the focus of the prior literature. Next, we
explore how the financing patterns, both formal and informal vary across different types
of firms in different cities and regions. We then study how bank finance and financing
from informal sources are associated with firm sales growth, productivity growth and
profit reinvestment.
We address these issues using a new data source, the Investment Climate Survey4,
a major firm level survey conducted in China in 2003 and led by the World Bank. The
survey has information on financing choices for firms across 18 different cities. One of
3 There is a direct parallel with the prevalence of angel finance (also referred to as informal venture capital) in the US. Business angels are typically wealthy individuals who provide the initial funding to get new firms off the ground. A big rationale for prevalence of angel financing is the capital constraints faced by new firms, especially technology intensive firms. In addition, venture capitalists tend to make highly concentrated investments and fund only firms with a substantial need for capital. Thus, the segment of young new firms with modest capital requirements rely on angel investors. However, Lerner (1998) argues that there is no evidence that angel financing generates positive financial returns or improves social welfare. 4 Other studies using the investment climate survey data on China include Cull and Xu (2004), Dollar et al. (2004).

4
the strengths of the survey is its coverage of small and medium enterprises. Hence, in
addition to information on commercial financing sources such as bank finance, the survey
also includes information on sources of financing that are associated with small firm
finance such as trade credit and finance from informal sources such as a money lender or
an informal bank or other financing sources.
We find that 20% of firm financing in our sample is sourced from banks, which is
comparable to the use of bank financing in other developing countries such as India,
Indonesia, Brazil, Bangladesh, Nigeria and the Russian Federation. However, the
breakdown of non-bank financing sources shows greater differences. Compared to other
countries, firms in our sample rely on a large informal sector and alternative financing
channels as suggested by Allen et al. (2005). Alternative financing channels represent
nearly 43% of firm financing in China compared to less than 9% in other developing
countries. These other financing sources could well be the large underground lending in
China, which represents several hundred billion dollars in bank deposits according to a
recent McKinsey report (Farrell et al. (2006)).
We also find substantial firm level heterogeneity in financing patterns within
China. The firms in the sample come from five different regions of China: Coastal,
Southwest, Central, Northwest, and Northeast. The financing patterns show that the
largest amount of bank financing is in the Coastal (23.3%) and Southwest regions (26%)
which have been known to have a more supportive investment climate that facilitates
access to formal sources of external finance (Dollar et al. (2004)).
We find that firms using formal bank finance grow faster than those financed
from alternative channels. Our results hold even when we exclude firms registered as

5
publicly traded companies or state owned companies and look at a sample of just private
sector firms, which are the fastest growing firms in the Chinese economy. We also find
that firms financed by formal bank finance experience higher reinvestment rates, and
productivity growth at least equal to that of firms financed from non-bank sources. This
suggests that the growth financed by banks is not inefficient growth.
We find no evidence that the faster growth rates of bank financed firms is caused
by selection of firms that obtain bank loans. Moreover, while firms complain about
imperfections in the allocation of bank loans such as corruption among bank officers and
importance of government help in obtaining loans, controlling for them in the selection
models only strengthens the effect of bank financing on firm performance. Our results
also highlight the role of collateral requirements in obtaining loans from the banking
sector. We find that larger firms, firms with more fixed assets and firms located in certain
cities and provinces are most likely to post collateral and thus obtain access to bank
finance.
Overall, our results suggest that, even in fast growing economies like China where
the formal financial system serves a small portion of the private sector, the fastest
growing firms depend on external finance from the formal financial system. We find no
evidence that alternative financing channels are associated with higher growth. Our
findings suggest that the role of reputation and relationship based informal financing and
governance mechanisms in supporting the growth of private sector firms is likely to be
limited and unlikely to substitute for formal mechanisms.
6
We discuss the Chinese economy and its financial system in detail in Section 2. In
Section 3 we describe the survey data and summary statistics and in section 4 we present
our empirical model and regression results. Section 5 concludes.
2. The Chinese Financial System
The Chinese financial system is characterized by a large banking sector,
dominated by four large state owned banks that have their own specialized role: the
Industrial and Commercial Bank of China (provides working capital loans to state
industrial enterprises), China Agriculture Bank (specializes in agricultural lending),
China Construction Bank (provides funds for construction and fixed asset investment)
and the Bank of China (specializes in trade finance and foreign-exchange transactions).
In addition to the big four state-owned commercial banks, there are also several minor
players that include Policy banks (eg: Export-Import Bank of China), Second-tier
Commercial banks (eg: CITIC Industrial Bank) and Trust and Investment Corporations
(ITICs) who capture a very small portion of the lending market.
The pervasive state ownership of the banking sector in China has given rise to
several disturbing features including a huge ratio of non-performing loans to total loans,
poor profitability, poor institutional framework of the banking system, weak corporate
governance and reduced competitive pressures on the banks to operate as profit making
enterprises. A large share of bank funding goes to state controlled companies, regardless
of their profitability, leaving companies in the private sector credit constrained.5 Lending
5 Anderson (2006) argues that Chinese banks do not discriminate against private borrowers per se but do discriminate against small borrowers including smaller SOEs without visible cash flow. While they have a short tail of corporate customers, banks do compete aggressively for the business of large private borrowers.

7
by banks is also hampered by the lack of adequate information on borrowers’ credit
histories and financial performance, making lending to SOEs seem a low-risk option,
given their government backing.
Lack of enforcement by regulatory bodies that are politically connected has
created a very weak governance environment. Furthermore, the highly decentralized
structure of the banks prevents them from reaping benefits of scale and also makes
lending decisions at the branch level susceptible to local government influence
preventing the allocation of loans according to market criteria.6
While China’s banking system is huge, its equity and bond markets are smaller
than most of the other countries, both in terms of market capitalization and total value
traded as a percentage of GDP. As stated in Farrell et al. (2006), equity market
capitalization, excluding non-tradable state-owned shares, is equivalent to just 17 percent
of GDP, compared to 60 percent or more in other emerging markets and corporate bond
issues by non-financial companies amount to just 1 percent of GDP, compared to an
average of 50 percent in other emerging markets.
One of the reasons for the poor performance of capital markets is again the
pervasive influence of the government. The equity markets are largely a vehicle for
privatization by the government rather than a market for capital raising by firms with
growth opportunities. Most IPOs on China’s largest exchanges are former SOEs with
connections to government officials. Further, government entities hold a large share of
the non-tradable shares reducing the corporate governance role of the market.
6 In the past few years, the banking sector is undergoing comprehensive reforms both to prepare the banks for equity listings and strategic sales and as a condition of China’s accession to the WTO. These reforms include allowing entry of foreign banks and eliminating special investment regulations for foreign banks which are bound to change the lending landscape but are yet to have a major impact on the operation of the banking sector.

8
Consequently, the large and best Chinese companies list on international exchanges such
as Hong Kong for their capital raising needs where as the smaller and riskier companies,
whose access to foreign exchanges is limited by government restrictions, list on domestic
exchanges within China. Durnev, Li, Morck, and Yeung (2004) show that compared to
other transition economies, China has one of the poorest functioning stock markets with
highly synchronous stock returns that can be linked to weak property rights, corporate
opacity and political rent-seeking.
The corporate bond market in China is crippled by excessive government
regulation and the lack of institutional investors and credit rating agencies to help price
the debt accurately and create a vibrant bond market. Hence large companies prefer to
borrow from banks rather than issue corporate bonds. This in turn leads to a crowding
out of small and medium enterprises from bank lending. In addition to the poorly
developed stock and bond markets, Allen et al. (2006) show that the venture capital
industry in China is underdeveloped and has a limited role in supporting the growth of
young firms.
Given the state of China’s banking system and capital markets, several
researchers including Tsai (2002) and Allen et al (2005) have argued that curb market
finance has played a significant role in the Chinese economy by serving the needs of the
private entrepreneurs who have been shut out of the formal banking system. In addition
to the informal associations, there are also private money houses and underground
lending organizations who function like banks but charge very high interest rates as
suggested by Farrell et al. (2006). While these are technically illegal since they charge
interest rates above the state-mandated interest rate ceilings, Tsai (2002) argues that in

9
reality, most forms of informal finance that private entrepreneurs use fall into the realm
of quasi-legality. They are not sanctioned by the People's Bank of China but are legally
registered by another government agency within China.
While the informal financing system in China has an important niche in the
market, it also has a dark side to it. Curb market lending comes at a high cost to
individual borrowers and ranges from legal to quasi-legal to highly illegal. It is therefore
interesting to examine if informal lending substitutes for formal lending in the
phenomenal growth of the private sector, or if it primarily serves a long tail of smaller,
private, and not necessarily fast growing firms who are shut out of the formal banking
system. Is it the case that the fastest growing firms in the private sector are serviced by
informal institutions rather than the formal banking sector?
3. Data and Summary Statistics
The data on Chinese firms comes from the World Bank Investment Climate
survey which was undertaken in early 2003 in collaboration with the Enterprise Survey
Organization of the Chinese National Bureau of Statistics. The Chinese survey is part of
the World Bank Enterprise Surveys which use standardized survey instruments and a
uniform sampling methodology to benchmark the investment climate of countries across
the world and to analyze firm performance. The Enterprise Surveys sample from the
universe of registered businesses and follow a stratified random sampling methodology. 7
7 A detailed description of the sample design and sample frame can be found at http://www.enterprisesurveys.org/documents/Sampling_Note.pdf and a detailed description of the implementation can be found at http://www.enterprisesurveys.org/documents/Implementation_note_January_2007.pdf

10
The firms are randomly surveyed from both manufacturing and services
industries8 with a restriction on minimum firm size where firm size is defined by number
of employees. The minimum number of employees was set at 20 for manufacturing firms,
and at 15 employees for services firms.
Twenty four hundred firms were sampled from the following18 cities in order to
represent the five main regions in China: (i) Northeast: Benxi, Dalian, Changchun, and
Haerbin; (ii) Coastal: Hangzhou, Wenzhou, Shenzhen, and Jiangmen; (iii) Central:
Nanchang, Zhenzhou, Wuhan, and Changsha; (iv) Southwest: Nanning, Guiyang,
Chongqing, and Kunming; (v) Northwest: Xi’an and Langzhou. Figure 1 shows a map of
the different cities and the regions from where the firms were sampled.9
The survey questionnaire has two main sections. The first section consists of
questions on general information about the firm, its relations with clients and suppliers,
its relations with the government, and qualitative questions asking for the manager’s
opinion on the business environment. The second section is based on interviews with the
firm’s accountant and personnel manager, asking for balance sheet information and other
quantitative information on employee training, schooling, and wages. While most of the
qualitative questions pertain only to the year 2002, a short panel from 1999 to 2002 is
available for the quantitative questions.
The survey allows us to identify firms on the basis of their registration status as
corporations, state owned companies, cooperatives and other legal structures. In addition, 8 The industries sampled include both manufacturing (apparel and leather goods, electronic equipment, electronic components, consumer products, vehicles and vehicle parts) and services (accounting and related services, advertising and marketing, business logistics services, communication services, and information technology services). 9 In an earlier phase of the survey in 2001, firms were sampled from following 5 Chinese cities: Beijing, Tianjin, Shanghai, Guangzhou, and Chengdu. We do not use these cities in our paper since the time period over which the information is available is different (1998-2000 as opposed to 2000-2002). In addition, firms in the first phase survey were not asked detailed information about their financing patterns.

11
each firm also provides a detailed breakdown of its ownership structure into domestic
versus foreign owners as well as a more disaggregated breakdown into percentage owned
by individuals, managers, institutional investors, firms and banks.
3.1. Financing Patterns: China compared to other countries.
Enterprise managers in the survey were asked: “Please identify the contribution of
each of the following sources of financing for your establishment’s new investments (i.e.
new land, buildings, machinery and equipment).” The sources are internal financial
sources such as retained earnings or loans from family and friends, and external financial
sources such as equity, local commercial banks, foreign owned commercial banks, trade
credit (supplier or customer credit), investment funds or special development financing,
informal sources such as a moneylender or an informal bank and other sources. The sum
of these proportions adds up to 100 percent.
We adopt two different categorizations of the various sources of financing. In the
first categorization, we have the following six groups : Bank Financing that includes
Local commercial banks and Foreign commercial banks; Informal Finance that includes
financing from informal sources such as a money lender or an informal bank; Operations
Finance that includes Trade Credit; Equity Finance; Investment Funds that includes
Investment funds or Special Development Financing or other State Services and Internal
Finance that includes Internal Funds or Retained Earnings, Loans from Family and
Friends and the Other category.
In the second categorization, we adopt Allen et al. (2005)’s classification of
financing sources into two groups: Bank Finance, that includes Local commercial banks

12
and Foreign commercial banks and Self Fund Raising that includes all other sources
such as retained earnings, informal sources, loans from family and friends, trade credit,
investment funds, equity and the other category. 10 One limitation of our survey data is
that financing patterns are given in terms of proportions of financing, not as debt to asset
ratios, as is common in the previous literature.
In Table 1, we compare firm-level financing patterns in China with other
developing countries in the world. The data for the countries is obtained from other
Investment Climate Surveys (ICS).11 As of 2006, there were 67 country surveys covering
over 40000 firms. Since the core survey instrument is the same across all countries, we
have comparable information on financing sources across the different countries. The
only difference is some surveys also have information on leasing arrangements and credit
card financing which is not provided in the case of China. We combine these two
categories along with Trade Credit and label it Operations Finance in our tables.
In panel A of Table 1, we present individual financing patterns and in panel B we
present aggregate financing patterns. In both panels, we compare firm-level financing
patterns (averaged across all firms) in China with those in other emerging markets such
as Bangladesh, Brazil, India,12 Indonesia, Nigeria, and the Russian Federation. Panel A
shows that China has the least amount of Internal financing/Retained Earnings (only
10 Allen et al. (2005) consider two additional financing sources that we do not have information on in our survey: the state budget and foreign investment. This is unlikely to influence our results on bank finance and informal finance since we have only 116 firms in our sample that have more than 50% foreign ownership and as Allen et al. themselves mention, the state budget contributes to only 10% of state owned companies’ total funding. 11 The Investment Climate Surveys are an on-going initiative by the World Bank to study the investment climate conditions in developing countries and their impact on firm productivity, investment and employment. 12 The information on financing choices for Indian firms comes from the World Business Environment Survey (WBES) which was also conducted by the World Bank as a precursor to the Investment Climate Surveys. The Indian ICS does not have detailed information on firm financing choices.

13
15.24%) compared to all the other emerging markets. On the other hand, China also has
the highest average amount of Other Financing (42.70%) compared to the other
developing countries. The next largest dependence on Other Financing is in Indonesia,
but even there, only 8.8% of new investments are financed by Other sources. These other
financing sources could well represent the large underground informal lending in China,
which represents several hundred billion dollars in bank deposits according to a recent
McKinsey report (Farrell et al. (2006)) and as suggested in Allen et al. (2005).13 However,
the use of funds from Family and Friends and Informal lending sources such as money
lender or informal banks seems to be comparable with its use in other countries.
China also looks unique in the large usage of Equity financing (12.39%)
compared to the other developing countries (all below 5%). However, when we look
across other geographic regions, the East Asia and Pacific region (excluding China) uses
the largest amount of Equity financing (21.38%) compared to other regions (below 5%).
Our data on China allows for a more detailed breakdown of the equity issuance into sale
of stock to employees, public issue of marketable shares to outside investors and sale of
stock to legal persons. The sale of stock to employees and public issuance of marketable
shares to outside investors is quite low at 2.89% and 1.26% respectively and most of the
equity issuance is really sale of stock to legal persons (8.24%). Legal Person shareholders
are unique to China and are analogous to institutional shareholders in western economies
13 It could be that the Other Sources in China are actually Internal Funds/Retained Earnings that are mis-classified. While we don’t have a detailed breakdown of what these Other sources could be for all firms, the responses from the 100 firms that do report the exact type of Other Financing suggest that there could be some mis-classification.

14
except that they tend to have strong state linkages14 and are not widely held as in western
economies.
In panel B, we look at the aggregate financing patterns. When we look at Internal
Financing, which includes Retained Earnings, loans from Family/Friends and Other
sources, Chinese firms look comparable to firms in other countries. Focusing on the
Allen et al. (2005) categorization, Chinese firms source 20% of their funds from banks
and the remaining 80% from self fund raising channels. These numbers are very similar
to the averages for countries in Africa (Bank financing=19%, Self Fund Raising = 81%),
South Asia (Bank financing=23%, Self Fund Raising=77%) and Latin America and the
Caribbean (Bank financing=21%, Self Fund Raising=79%). Countries in East Asia and
The Pacific use slightly more Bank financing (32%) and lesser amount of Self Fund
Raising (68%) compared to China where as countries in East Europe and Central Asia
and those in Middle East and North Africa use much lesser Bank financing (13%) and
much greater Self Fund Raising (87%) than even China.
The financing numbers are consistent when we look across country-income
groups. Use of Bank financing ranges from 18% in the Low Income and Middle Income
countries to 21% in High Income countries and use of Self Fund Raising is between 79-
83% across all country income groups. Overall, these figures suggest that Chinese firms
are not an anomaly in their use of Self Fund Raising compared to other developing
countries in contrast to the findings in Allen et al (2005).
14 The legal person identity was created to aid the transition of China's companies from state-owned to private-owned since the private sector did not have enough capital to acquire large tranches of state shareholdings. As described in Xu and Wang (1997) and Delios and Wu (2005), the legal person shareholder category comprises private companies, state-owned enterprises and non-bank financial institutions such as investment funds and security companies. The legal person shareholders differ from pure state shareholders in that they are profit seeking, and have relatively more freedom than state shareholders in deciding how to allocate profits and formulate and implement firm strategy.

15
3.2. Financing Patterns across firms within China Table 2 shows how financing patterns vary across different types of firms in
China. Panel A presents individual financing patterns and shows that there is substantial
variation in financing patterns across different types of cities. Overall, there is very little
use of formal external finance via banks or equity. For instance, the use of Local Bank
financing is a mere 3.98% in the city of Haerbin (Heilongjiang province) in the Northeast
region compared to 35.13% in Jiangmen which is in the coastal province of Guangdong.
Jiangmen also has the highest amount of Foreign Bank financing, though it is a mere
1.57%. Wenzhou, another coastal city has the highest amount of Equity financing (40%)
and also the lowest amount of Other financing (3.38%). The use of bank and equity
financing in Jiangmen and Wenzhou, both coastal cities, can probably be attributed to
their good investment climates (both cities were assigned a score of A+ in Dollar et al.
(2004) who studied the investment climate in different cities in China). The use of
Investment funds and Operations finance is generally low (<4%) across the different
cities and firms in several cities like Wenzhou and Wuhan use no trade credit or
investment funds.
When we look at sources other than formal finance, we find that the use of
Retained Earnings varies from 8% in Benxi in the northeast province to over 26% in
Changchun, also in the northeast province. The use of funds from Family and Friends
ranges from less than 1% in Guiyang and Shenzhen to over 11% in Lanzhou, Nanning
and Wenzhou. Benxi, Wuhan, and Chongqing have the highest amount of Informal
financing (4-6%). The use of Other financing is typically high in most cities ranging from
22% in Kunming to 70% in Shenzhen except for firms in Wenzhou where the average

16
Other financing is only 3.38%. 15 It is interesting that Shenzhen records the highest
amount of Other financing since this city is located in the Guangdong province which has
the highest number of private enterprises including underground lending organizations as
suggested by the McKinsey study.
The five different regions, from which firms were sampled in the survey, vary
considerably in their investment climate. The eastern and coastal areas (Yangtze and
pearl river deltas) are more developed due to a number of factors including differences in
natural endowments, access to ports, tax arrangements and favorable policies (Dollar et al.
(2004)).. By contrast, cities that are more inland, especially in the West and the
Northeast tend to have worse investment climates. Cities in the central region appear to
be in the middle in terms of their investment climate. The financing patterns are
correlated with the quality of investment climate, with the largest amount of Local Bank
financing being used in the Southwest (26%) and Coastal (23%) regions and the least
amount being used in the Northwest (14%).
Looking at aggregate financing patterns in panel B, the use of Internal funds
ranges from 46% in Benxi to 81% in Zhengzhou. When we use the Allen et al. (2005)
categorization, we find that several cities have in excess of 90% of their financing
coming from sources other than banks. Figure 2 reveals the financing patterns across the
different cities in increasing order of their use of bank financing. Figure 2 shows that
after Internal funds, firms use Equity or Bank finance. Use of informal sources,
investment funds and operations finance is very low.
15 Four of the 18 cities were designated as export processing zones- Shenzhen, Dalian, Hangzhou, and Wuhan. Their use of Other Financing ranges from 24% in Hangzhou to over 70% in Shenzhen suggesting that Other might also be funds from overseas investments (Hong Kong, Taiwan, Macao).

17
Table 2 also shows that the very large firms use more of Bank financing (30%)
than the micro and small firms (14-15%). Publicly listed companies finance a little over
33% of their new investments through Bank Financing and 67% from Self Fund Raising
sources. By contrast, cooperatives fund only 18% of their new investments from banks
and 82% from sources other than banks. When we look at ownership, domestic private
firms use 20% Bank financing and 80% Self Fund Raising compared to state firms that
use 26% Bank financing and 74% Self Fund Raising. In both cases, Other makes up a
bulk of the Self Fund Raising. Older firms (firms > 20 years) use more of Bank financing
(27%) compared to firms less than 5 years old which depend on Self Fund Raising for
80% of their financing needs.
3.3 Access to formal bank finance
Panel A of Table 3 presents the summary statistics for various measures that
measure firms’ access to the formal and informal financial systems in China. As the
main independent variable of interest, we have an indicator variable, Bank Dummy
showing whether the firm has access to the formal financial system. Bank Dummy takes
the value 1 if the firm states that is has a loan from a bank or financial institution and 0 if
the firm states that it has no bank loan and no overdraft facility or line of credit. We also
construct an Access Dummy, a dummy variable that takes the value 1 if the firm had
access to a bank loan in any year prior, from 1990-2001, and 0 otherwise.
We also consider alternative indicators of access based on the financing
proportions of new investments that firms report. Bank Financing Dummy takes the
value 1 if the firm states that it has a loan from a bank or financial institution and reports

18
that bank finances at least 50% of new investments or that bank financing of working
capital was greater than 50%. Bank Financing takes the value 0 if the firm states that it
has no loan from a bank or financial institution or said it had no overdraft facility or line
of credit and the bank financing of new investments was equal to 0% and bank financing
of working capital was equal to 0%. Thus, a firm is assigned a value of 1 for Bank
Financing only if we have evidence of substantial reliance on bank financing and a value
of 0 if it does not rely on bank financing.
We also employ two measures of self financing. Self Financing1 takes the value
1 if the sum of Informal financing and Other financing of either new investments or
working capital is greater than 50%. Self Financing1 takes the value 0 if the sum of
informal and other financing of new investments and working capital is equal to 0 %. Self
Financing2 broadens the definition of self financing and takes the value 1 if the sum of
Informal, Family, and Other financing of new investments or working capital is greater
than 50%
The summary statistics for the three bank variables, Bank Dummy, Access
Dummy and Bank Financing indicate that on average only 21-28% of the firms in the
sample have access to bank financing. For instance, according to the Bank Dummy, only
537 out of the 2326 firms answering the bank loan question reported having a bank loan.
Of the full sample of 2400 firms, 1466 firms report one of two reasons for not having an
existing loan - 1237 firms report not applying for a bank loan and 229 firms report not
having a bank loan because their application for a bank loan was rejected. When we look
at firms that are not registered as publicly traded corporations or as state owned
enterprises, of the 1666 private firms, 1301 firms reported not having an existing loan

19
from a bank or a financial institution, 933 private firms reported not having a bank loan
because they did not apply for the loan and 154 private firms reported not having a bank
loan because their application for a bank loan was rejected.
Figures 3 and 4 elaborate on the reasons why the firms in our sample do not apply
for loans and if they do apply, why they get rejected. The firms report six reasons for not
applying for a loan: Do not need loans, Application procedures for bank loans are too
cumbersome, Collateral requirements of bank loans are too stringent, Did not expect to
be approved, Interest rates are too high, and Corruption in the allocation of bank credit.
The reasons reported are not mutually exclusive. Figure 3 shows a distribution of the
reasons given by all firms and only private firms for not applying for a loan. Over 66% of
the firms report not applying for a loan because they didn’t need the loan. 25% of the
firms report cumbersome application procedures and stringent collateral requirements as
reasons for not applying for a loan, 16-18% of the firms report not expecting to be
approved and high interest rates as reasons and only 10% of the firms report corruption in
the allocation of bank credit as the reason for not applying for a loan. The statistics for
private firms are very similar.
The firms that report their loan application was rejected report three mutually
exclusive reasons for why their application was rejected: Lack of collateral, Perceived
lack of feasibility of project and Incompleteness of application. Figure 4 shows that of the
229 firms that report their loan application being rejected, 66% (152 firms) report lack of
collateral as the main reason why their loan was rejected. This includes 44 private sector
firms out of a sample of 154 private sector firms that report their loan application was
rejected.

20
Thus we are able to identify firms that that may or may not need bank financing
but do not apply for loans as well as firms that apply for loans but have their loan
applications rejected. The summary statistics also show that collateral seems to be main
constraint for access to bank loans.
3.4. Firm Performance and Control Variables
Our principal measure firm of performance is Sales Growth which is computed
as the log change in firm sales over the period 2001-2002. We supplement sales growth
with two additional indicators. We measure Productivity Growth over the period 2001-
2002 and the firm’s reinvestment rate in 2002. Productivity Growth is the log change in
productivity over the period 1999 to 2002 where productivity is defined as (Sales-Total
Material Costs)/Total Number of Workers. Reinvestment Rate is the manager’s estimate
of the percentage of net profits that are re-invested in the establishment and not
distributed to owners, the state or the shareholders. Productivity Growth shows whether a
source of financing is associated with declines in firm efficiency. The firm’s reinvestment
rate shows whether the firm’s managers are committing the firm’s resources to finance
growth, or whether external financing is used to substitute for internal resources. The
latter case would be suggestive of inefficient investment. We also consider firm
performance over a longer horizon by looking at Sales and Productivity growth over the
period 1999 to 2002.
The mean Sales growth rate across the full sample of firms from 2001 to 2002 is
5.6% where as Productivity growth is 0.45%. The corresponding figures for the period
1999 to 2002 are 13.3% and 8.1% respectively.

21
In addition to the rich detail on the financing choices of firms, the survey has
information on firm size, age, ownership, legal organization and capacity utilization, all
of which are used as firm level controls in our study. An important strength of the survey
is its wide coverage of micro and small size firms.16 We construct Size Dummies which
are the quintiles of firm’s sales in 1999. The survey thus provides data across a much
broader cross-section of firm sizes than is available in commercial data bases, such as
Worldscope.
Panel A of Table 3 shows that the average firm age in the sample is 16 years. We
include dummy variables to identify very young firms (1-5 years), middle-aged firms (5-
20 years) and older firms (>20 years). The firms in the survey are broadly classified in
terms of their current legal status into corporations, cooperatives and an other category.
Corporations, both public and private, make up 40% of our sample where as 16% of our
sample is composed of Cooperatives or Collectives. We also have detailed information
on the ownership breakdown of these companies and the percentage owned by different
entities in the private sector (eg: domestic firms, domestic institutional investors, foreign
individuals, foreign firms, foreign institutional investors, etc) and different entities in the
state sector (e.g.: national government, state/provincial government, local/municipal
government or other government bodies like collectives, etc). We use a dummy variable
State Ownership to characterize firms where the government owns more than 50% of
the company. Nearly 22% of the sample (531 firms) is composed of firms with more than
50% state ownership and the remaining is made up of firms with more than 50% private
ownership. We also identify the number of competitors of the firm in its main business
16 The mean (median) number of employees in a firm in our sample in 1999 was 579 (100) employees with 33% of our sample composed of firms with less than 50 employees.

22
line in the domestic market by using five Competition dummies for 1-3 competitors, 4-6
competitors, 7-15 competitors, 16-100 competitors and over 100 competitors respectively.
Panel B of Table 3 presents the correlation between the access variables and firm
performance. We find that the bank finance variables are all significantly correlated with
each other and in fact Bank Dummy and Bank Financing dummy, where the latter
variable takes into account bank financing of new investments and working capital are
perfectly correlated. Bank Financing and Bank Dummy are also positively correlated
with the firm performance measures where as the Access Dummy which focuses on
access to past bank financing appears to be negatively correlated. Both the Self Financing
dummies are negatively correlated with all measures of bank finance and also appear to
be negatively correlated with Sales Growth and Reinvestment rate and have a positive
association with productivity growth.
The raw correlations between firm performance and the financing variables mask
some of the underlying variation. The average 2001-2002 growth rate of firms that
receive bank finance is 10.34% compared to an average growth rate of 4.2% for firms
that receive no bank finance. To investigate if bank financing is indeed associated with
better firm performance, we next turn to regression analysis, controlling for a number of
firm level variables.
4. Financing Patterns and Firm Performance
4.1. The Empirical Model
We first estimate the following regression model:

23
Sales Growth/Reinvestment Rate/Productivity Growth = α + β1Bank Dummy+ β2Firm
Size dummies + β3 Age dummies + β4Corporations + β5Collectives + β6State Ownership
+ β7Competition Dummies + β8City Dummies + ε (1)
The bank loans for our sample were approved prior to 2002. Accordingly, we
report regressions for which the dependent variable is sales or productivity growth rate
between 2001 and 2002 or the reinvestment rate measured in 2002. However, because
annual growth rates are likely to be subject to random shocks, we also report regressions
using sales growth and productivity growth of firms for the period 1999-2002. These
regressions are descriptive, showing the association between growth and firm access to
the formal sector over a longer horizon.
Our main independent variable of interest is the Bank Dummy. We also report
alternative specifications using the other financing variables described in section 3.3 -
Access Dummy, Bank Financing Dummy, and the two informal financing variables, Self
Financing1 and Self Financing2. We also include a number of firm level control variables
- Firm Size dummies, Age dummies, State Ownership dummy, Corporation dummy,
Cooperatives dummy and Competition dummies. These variables are described in detail
in section 3.4. We also include city dummies to control for unobserved heterogeneity at
the city level. The data on industry sector is available for a very narrow definition of
business activity giving us 81 industry dummies. Hence, while our results are robust to
controlling for industry dummies, we do not include industry dummies in our baseline
specification so as to not lose too many degrees of freedom.
We use equation (1) as the baseline and then build on the model to explore a
number of questions. First we instrument for Bank finance and second we examine firm

24
heterogeneity in access to bank finance. Specifically, we examine if the positive
association between proportion of bank finance and firm growth is driven by politically
connected firms that get government help or by firms that are better at bribing bank
officers.
Equation (1) establishes a broad association between formal vs. informal financial
systems and firm performance, but does not address the issue of causality. One of the
important concerns when investigating the impact of external finance on growth is that
firms that are able to attract external finance from the formal financial system are those
with better growth opportunities and the positive relation we may observe between
external finance and firm growth (or the negative one between self fund raising and firm
growth) may be simply due to reverse causality. In the Chinese context, this is less likely
to be true since the private sector, which is the fastest growing sector in the Chinese
economy, finds access to bank lending tough due to asymmetric information, poor
protection of private properties and resulting lack of collateral, and discriminatory
lending policies by state banks. There exists an implicit political pecking order of firms
(Huang, 2003) whereby large and inefficient state owned enterprises and collectives and
cooperatives have easier access to cheap capital from state banks and thus overinvest.
We introduce a selection model that predicts which firms obtain bank financing.
To estimate the selection model using instrumental variables, we need an instrument that
is correlated with bank finance at the firm level, yet uncorrelated with firms’ growth
opportunities. 17 One of the factors that could affect access to bank loan is the ability to
post collateral, although the importance of collateral for accessing bank loans could vary
17 See Li and Prabhala (2007) for a discussion of selection models in corporate finance. As Li and Prabhala (2007) and Heckman and Navarro-Lozano (2004) note, strictly speaking we do not need any exclusion restrictions because the model is identified by non-linearity, thus allowing estimation.

25
according to the market environment in which the firm operates. Figures 3 and 4 indeed
show that firms report the inability to meet collateral requirements as causing banks to
reject their loan applications as well as making them not apply for loans. Hence as an
instrument for bank finance, we construct a dummy variable Collateral, which takes the
value 1 if the firm reported that the financing required collateral and takes the value 0 if
the firm reported that the financing did not need collateral or that it did not apply for a
loan because of stringent collateral requirements or that it was rejected for a loan because
of the lack of collateral. Thus Collateral serves as a proxy for the firm’s ability to post
collateral.
Whether there was a collateral requirement or not is less likely to be correlated
with firm’s growth and hence need not enter the second stage. Thus, collateral serves as
the identifying variable in our selection equation. There is a possibility that the selection
of firms receiving bank loans may be caused by firm characteristics unobserved by us,
but observable by banks.
Specifically, we assume that a firm obtains access to formal bank finance (i.e.
Bank Dummy = 1) if it meets the formal criteria of the banking system, so that the linear
function of information observed by us and proprietary information observed by the bank
exceeds a threshold. Therefore, Bank Dummy = 1 if
α0 + β1 Collateral + β2Size dummies +β3 Age dummies +β4Corporations + β5Collectives
+ β6State Ownership + β7Competition Dummies + β8City Dummies + ζ >0, (2)
where ζ∼(0,σ2) is proprietary information observed by the bank. Equation (2) is also
referred to as the Selection or Treatment Equation and forms the first stage of a two-stage
selection model in which equation (3) below forms the second stage :

26
Sales Growth/Reinvestment Rate/Productivity Growth = α1 + γ1BankDummy+ γ2Size
dummies+ γ3Age dummies + γ4Corporations + γ5Collectives + γ6State Ownership +
γ7Competition Dummies + γ8City Dummies + λ + ε (3)
We first obtain estimates of the selection equation and from these estimates, the
nonselection hazard λ (inverse of the Mill’s ratio), is computed for each observation. λ is
an estimate of the banks’ private information underlying the selection of firms. The
regression equation (3) is then augmented with the nonselection hazard λ which provides
an estimate of the selection bias.
4.2. Results
Table 4 reports the estimated coefficients from baseline regression (1). Columns
(1) and (6) show that the formal financial system is associated with higher sales growth
for both the full sample of all firms and a sub-sample of private firms (dropping public
and state owned firms). The role of bank financing in the second sub-sample is of
particular interest, since private firms are likely to have fewer alternative options than
publicly traded firms or state owned firms. Firms that have bank financing also reinvest
a higher proportion of their profits in their businesses in both samples (columns (2) and
(7)). Thus, there is no evidence that bank financing funds growth that firms are unwilling
to undertake using their own capital.
Columns (3) and (8) show that bank finance is not significantly negatively
associated with productivity growth. These findings suggest that the formal financial
system rather than informal sources have a positive association with firm growth and
reinvestment and that the growth that results is not inefficient. Columns (4) and (5) for

27
the full sample, and (9) and (10) for the sub sample reinforce this finding by showing that
the association holds over a longer horizon.
When we look at the control variables, larger firms, older firms and firms
organized as cooperatives or collectives are found to have lower growth rates. Growth
rates are lower in highly competitive (>100 competitors) industries. The city dummies
show that compared to firms in Benxi, firms in Changchun, Chongqing, Hangzhou,
Nanchang, Shenzen, and Wenzhou are the fastest growing over the period 1999 to 2002.
Note that each of these cities received an investment climate score of A or A+ (except for
Nanchang which received a score of B+) in the Dollar et al. (2004) study compared to
Benxi which received an investment climate score of B- in the study. When we look at
growth rates over a smaller time horizon from 2001 to 2002, only firms in Shenzen seem
to be growing faster than firms in Benxi. All our results in Table 4 are robust to
controlling for 81 industry dummies.
4.2.1. Accounting for Selection
In Table 5, we investigate the relation between bank financing and sales growth,
reinvestment, and productivity growth, controlling for the selection of firms that obtain
bank financing. The estimates of the selection equation (even numbered columns)
indicate that firms that obtain formal financing are more likely to have collateral that they
can pledge, are large companies organized as corporations, with some but relatively few
(<6), competitors. Interestingly, although firms in highly competitive industries grow
more slowly, there is little evidence that banks lend to them at a lower rate. The hazard

28
lambda (also referred to as the Inverse Mills Ratio) which measures the impact of self
selection is reported at the foot of Table 5.
In Table 5, controlling for selection, the coefficients of bank financing, are greater
than in Table 4, for both the full sample and the private firms sub-sample. This is in part
because banks lend disproportionately to large firms, which grow more slowly than small
firms. Once this selection effect is controlled for, there is a stronger relation between
bank financing and firm growth. Similarly, the coefficients of bank financing in the
productivity regressions are larger, albeit statistically insignificant. Thus, as in Table 4,
there is no evidence that bank financing is associated with inefficient growth.
In panel A of Table 6, we consider a wider range of determinants of access to the
formal financial sector. We examine alternative explanations for why the proportion of
bank finance is associated with higher sales growth, profit reinvestment and productivity.
It could be that the firms that get bank finance are the ones that are politically connected
or have been singled out for financing (directed credit) or that firms that get bank finance
are those that are better at bribing bank officers. Hence we introduce the following
variables into the selection equation. We introduce a “Government Help” dummy which
takes the value 1 if firms answer “yes” to the question “During the year 2002, did any
government agency or official assist you in obtaining bank financing?” and a value of
zero otherwise. As a proxy for bank corruption, we use firm responses to the following
question “In your dealings with bank officials and loan officers, was a gift or informal
payment expected?” We also measure the firm’s general perception of its property rights

29
enforcement. Property Rights Protection is the firm’s estimate of the likelihood that the
legal system will uphold the firm’s contract and property rights in business disputes.18
We also investigate additional firm-level variables that might affect a firm’s
ability to obtain a loan from the formal financial sector. The dummy variable, Loan from
Group or Holding Company, takes the value 1 if the firm is a member of a group or a
holding company that provided loan to the firm and 0 otherwise. Loan Guarantee
Program is a dummy variable that takes the value 1 if the firm benefited from a loan
guarantee program offered by loan guarantee companies. Located in Export Processing
Zone is also a dummy variable that takes the value 1 if the firm is located in an industrial
park, science park, or export processing zone and 0 otherwise. CEO Education Level
takes values 1 to 4 - 1 if the CEO had no formal education, 2 if the CEO had high-school,
secondary school or primary school education, 3 if the CEO had an undergraduate
education at home or abroad and 4 if the CEO had postgraduate education at home or
abroad. Politically Connected CEO takes the value 1 if the CEO was a party secretary,
deputy party secretary, party committee member or executive member or a party member
and 0 if the CEO is not a party member. Columns 1 to 4 present results for the sales
growth regression, columns 5 and 6 for profit reinvestment rate and columns 7 and 8
present results for the productivity growth. In columns 3 and 4, we also include past
sales growth rate from 1999 to 2001 to investigate if past performance is a predictor of
bank financing.
We find evidence that firms which report government help in obtaining loans,
report receiving loans from other firms in their group, or which are located in export
18 To the extent that property rights enforcement varies across localities, its variation will be captured by City Dummies. This variable captures firm-level deviations from the city-level mean as well as city-level deviations in firm perceptions from the city means.

30
processing zones are more likely to receive loans. While affecting the probability of a
loan, none of these variables significantly predict increases in the firm’s growth rate,
reinvestment rate, or productivity growth. Thus, there is no evidence that government
help in obtaining loans is directed to firms which subsequently report better outcomes.
However, we also find little evidence that firms which receive government help in
obtaining loans perform less well than other firms.
Controlling for these factors, we do not find evidence that the degree of perceived
bank corruption, participation in loan guarantee programs, the educational level of
general manager or reported political connections, significantly affects the probability of
obtaining a loan. Likewise, an index of property rights does not add explanatory power.
However the effect of the property rights could be subsumed by the size dummies since
larger firms in our sample report higher likelihood that the legal system will uphold their
contract and property rights in business disputes.
We do find that firms which grew fast in 1999-2001 were more likely to have
loans in 2001-2002 (Column 4). However, fast growth in 1999-2001 predicts slower
growth in 2001-2002. Thus, while the banking system is more likely to lend to firms that
grow fast, it is only those firms that the banks lend to who continue to grow fast.
In Panel B, Table 6 we repeat our analysis of Table 5, with a broader definition of
bank financing. Access Dummy is a dummy variable that takes the value 1 if the firm had
access to a bank loan in any year prior, from 1990-2001, and 0 otherwise. The results on
sales growth, reinvestment and productivity growth are qualitatively similar. One
difference is that we find less evidence that bank access is skewed in favor of larger firms.
This may be because small firms which do not have loans in 2001 may have obtained a

31
loan in the preceding decade. Thus, these firms may have access to the formal sector but
have a lower frequency of loans. All our results in Table 6 hold when we look at a
smaller sample without publicly traded corporations and state owned enterprises. We
don’t report these results in the interest of space.
4.2.2. Financing of New Investments and Working Capital and Robustness
In Table 7, panel A, we examine the association between indicators of
performance and bank financing for those firms that explicitly report using bank
financing to fund at least 50% of their new investments or working capital. The
coefficient estimates for the Bank Financing Dummy are shown in panel A. Since we
have data on uses of bank financing only for 2002, we do not estimate a selection model.
We interpret our estimates as a consistency check on our earlier results rather than as
evidence of a causal relationship.
Panel A shows that our earlier results hold for firms that report heavy use of bank
financing to fund investment and working capital. Such firms tend to grow faster and
reinvest more of their profits than comparable firms. This faster growth is not associated
with slower improvements in productivity.
In panel B, we show the association between performance indicators and self-
financing of investment and working capital. To recall, Self Financing1 takes the value 1
if the firm reports that it has financed at least half of its new investments or working
capital from informal and “other” sources. Self Financing 1 takes the value 0 if the firm
reports not using informal or “other” financing to fund investment or working capital. A
more comprehensive measure of self-financing, Self Financing2 takes the value 1 if the
32
firm reports using informal, family, and other financing to fund at least a half of its new
investments or working capital. Self Financing2 takes the value 0 if the firm reports not
using these sources to fund investment or working capital.
Panel B of Table 7 shows that there is no association between firm growth and
either measure of self-financing. Interestingly, firms that are self-funded reinvest a lower
proportion of their earnings in their business. We do find, however, that self-funded firms
report higher growth in productivity. If we were to decompose self financing into its
individual components (results not reported) and drop firms with any bank finance, we
find that firms that use informal and other financing reinvest significantly less than the
firms that rely on their internal funds. There is also evidence suggesting that firms relying
on informal and other financing grow slower, though not significantly, than firms relying
on their retained earnings. 19
To check whether our results are driven by outliers, we perform several
robustness checks. We have re-estimated all our specifications by removing potential
outliers (growth rates in excess of ± 1000%), by winsorizing the top 1% of the sales
growth, reinvestment rate and productivity growth variables, and by using median
regressions. Our results (not reported) remain unchanged in all cases. A representative
specification is shown in Table 8, where we re-estimate the base specification in Table 4
using median regressions. The coefficients of the Bank Dummy in Table 8 are
qualitatively similar to those in Table 4, indicating that our earlier results are not driven
by outliers.
19 The association between slow growth and dependence on informal and other sources is significant and strong when we look at growth over the longer time period of 1999-2002.

33
4.2.3. Role of collateral
The selection model in Tables 5 and 6 and the raw data shown in Figures 3 and 4
suggest that the availability of collateral is a key determinant of whether or not the firm
can obtain financing from the formal sector. Hence, in this section we investigate the
composition of collateral and its determinants.
In Panel A, Table 9, we present the mean and median percentage shares of the
type of collateral posted by firms in our sample. Land and buildings are the predominant
forms of collateral. The median share of collateral in this category is 80% (mean 63%).
The next largest category is machinery, with a median of 0% and a mean of
approximately 18%. Thus, for most firms, land and buildings are the key types of
collateral and may determine the firm’s ability to obtain bank financing.
In panel B of Table 9 we explore the ability to explain whether a firm can post
collateral by estimating the following reduced form model:
Collateralijk = μ + αi + βj + γij + εijk (4)
where Collateral (defined in the selection model in Section 4.1) is a proxy for the
firm’s ability to post collateral, μ is the average response across all firms and cities, αi are
city effects (i=1,…, 18), βj are firm category effects (j=1,….lβ), γij are city-firm
interaction effects, and εijk are random disturbances.
At the city level, to capture institutional differences in the determinants of
collateral across cities, we first use city dummies. We look at four different categories at
the firm level: firm size, age, total fixed assets and legal status. The premise in each
estimation is that the model being estimated is the true one. The model takes the
classification of firms into firm-categories and cities as given and is essentially

34
descriptive. In particular, while it posits the existence of differences in responses across
firms and cities, it offers no causal or structural explanation for these differences.
The model is estimated using a regression based simultaneous ANOVA approach.
We begin by estimating a restricted version of equation (4), where we exclude all effects
other than the constant and the city dummy variable. The R2 of this regression provides
an estimate of the variation in collateral at the firm level explained by city dummies alone.
In each case, we next add the firm level characteristic and compute the R2 to obtain an
estimate of the proportion of the variation in collateral explained by the city dummies and
the firm characteristic together.20 Finally, we add an interaction term, to provide for the
possibility that the firm characteristics may affect collateral more in some cities than in
others.
As an alternative measure of the institutional environment, we replace city
dummies with a Legal Environment Index at the province level, in the second sub-panel
of Panel B of Table 9. The Legal Environment Index is based on information from Fan
and Wang (2004), capturing (1) the development of market intermediaries using the ratio
of the number of lawyers and registered accountants to population; (2) protection of the
legal rights of producers using the frequency of economic crimes normalized by GDP; (3)
protection of property rights using the average number of patents applied per engineer
and the average number of patents approved per engineer; and (3) protection of
20 Note that the difference in R2 of the new regression and the restricted regression does not provide an estimate of the variation explained by the firm specific variable by itself, only the marginal increment of explanatory power that is gained by adding the firm specific variable.

35
consumers using the number of consumer complaints received by the Consumer
Association. A higher index is reflective of a better legal environment.21
Firm Size Dummies are quintiles of total firm sales in 1999. Age Dummies take
values 1 to 3 for age<5 years, 5 - 20 years and greater than 20 years respectively. Fixed
Asset Dummies are quintiles of fixed assets in 1999. Legal Status Dummies take the
value 1 for corporations, 2 for state owned enterprises, 3 for cooperatives and collectives
and 4 for all other legal status.
Since the LHS variable is a 0-1 dummy variable we use logistic regression, and in
each case compute the McKelvey and Zavoina (MZ) (1975) R-square of the logistic
regression model. We choose the MZ R-square statistic since DeMaris (2002) finds the
MZ R-square to be the best at estimating explained variance in a study comparing eight
R-square analogues.
Panel B of Table 9 shows that the city dummies explain 6.4% of the variance in
the posting of collateral by firms. When the firm variables are entered after the country
dummies, size dummies explain 7.2%, fixed asset dummies explain 10%, age dummies
explain 0.6%, and legal status dummies explain 0.3%.22 The results show that a firm’s
level of fixed assets has the highest marginal contribution to MZ R-square confirming
that fixed assets has the greatest explanatory power compared to other firm-level
variables in explaining a firm’s ability to post collateral. Size is also a significant
determinant of a firm’s ability to post collateral where as age and legal status are not.
21 The Fan and Wong (2004) Index has been used recently in other studies including Li, Yue, and Zhao (2006) and Fan, Wong, and Zhang (2007) 22 When firm size dummies are entered by themselves, without country dummies (results not reported), they explain 8%, fixed asset dummies explain 11.1%, age dummies explain 0.7%, and legal status dummies explain 0.6% of the variance in firm’s ability to post collateral.

36
When we look at the joint effect of city and firm characteristics, the city-firm
interactions are large and significant. The interaction of fixed asset dummies and city
dummies explains 45.7% and the interaction of size dummies and city dummies explains
nearly 27% of the variance in firm’s ability to post collateral. By contrast, the interaction
of city dummies with age dummies and legal status dummies explains 3.9% and 4.6%
respectively.
When we replace city dummies with province level indicators of the legal
environment, we find that the legal environment explains 5% of the variation in the
firm’s ability to post collateral. Size and Level of fixed assets again have high
explanatory power compared to age and legal status. The interaction of size dummies and
Legal Environment index explains 27.3%, the interaction of fixed asset dummies and
Legal Environment index explains 37.5% while all other interactions explain less than
5% of the variation in the firm’s ability to post collateral.
Thus we find that given the role of collateral in selecting which firms obtain loans,
size and possession of fixed assets 23confer advantages on firms attempting to obtain
access to the formal financial system. We also find evidence that there is sufficient
institutional variation across provinces which affects firms’ ability to post collateral.
When we take a closer look at the interactions, we find that firms in cities with poor
institutional environment but with higher fixed assets post more collateral. This suggests
that in poor institutional environments, firms have to rely on collateral to access bank
finance rather than relying on credit histories and growth opportunities.
23 If we were to re-estimate the selection equation in Tables 4 and 5 by replacing Collateral with the quintiles of fixed assets, we find that higher level of fixed assets are a significant predictor of the availability of bank finance.

37
4.3. Discussion
In this section, we discuss our findings in the context of recent evidence on the
link between finance and growth in China. Allen et al. (2005) find that while the Private
Sector dominates the State and Listed sectors in both the size of the output and the
growth trend, there is a huge reliance on non-bank financing sources amongst firms in the
Private sector. Given the weak external markets and poor legal protection of minority and
outside investors in China, Allen et al. (2005) attribute the growth of the Private sector to
the reliance on alternative financing channels and corporate governance mechanisms such
as reputation and relationships. They interpret this as evidence against the finance and
growth literature that the development of stock markets and a banking system is
important for growth of firms and economies. However, due to data limitations, the
results in Allen et al. (2005) are based on an analysis of the 17 largest, and perhaps
unrepresentative, firms in the two most developed regions in the country. Further, their
definition of informal financing channels includes retained earnings, informal financing,
issuance of equity and all other sources of fund raising except bank financing, state
funding and foreign investment.
While our data on 2400 firms (including 1720 non-publicly traded and non-state
companies) confirms the wide use of financing channels other than Bank Finance, our
regression results suggest that it is the formal financing channel, specifically Bank
Finance that is positively associated with higher growth and reinvestment. These
increases are not associated with decreases in firm productivity. We find no evidence that
alternative financing channels such as informal sources have a positive impact on growth
and reinvestment.

38
To investigate the relation between growth and bank financing further we
estimate a selection model which takes into account that banks may use proprietary
information not observed by researchers to allocate credit to firms that subsequently grow
faster. Controlling for this type of selection bias strengthens the relation between bank
financing and subsequent growth.
Our results are consistent with other studies emphasizing the role of institutions
and formal finance in China. Cull and Xu (2005) find that profit reinvestment rates are
affected by enterprise managers' perceptions about the security of property rights, the risk
of expropriation by government officials, the efficiency and reliability of courts, and
access to credit. In a more recent paper, Cull, Xu, and Zhu (2007) find that despite a
biased and inefficient banking system, trade credit does not play an economically
significant role in China. There are also more recent studies emphasizing the link
between institutions and growth at the provincial level. Cheng and Degryse (2006)
explore the impact of the development of bank versus non-bank financial institutions on
the growth rate of Chinese provinces over the period 1995-2003 and conclude that only
bank loans have a significant impact on local economic growth. Fan, Morck, Xu, and
Yeung (2007) find that inward FDI within China flows disproportionately into provinces
with less corrupt governments and governments that better protect private property rights. 24
24 Fan et al. (2007) estimate a cross-country (without China) FDI model explaining inward FDI using different measures of institutions and make out-of-sample predictions from their model for China. They find that China is no exception since Chinese FDI inflows are in line with what the model predicts for a country at China’s level of institutional development as measured by general government quality and rule of law. However, when they measure institutions by “strength of executive constraints”, they find that China receives more FDI than predicted by their model. But they argue that this could be because of other reasons including underestimation of the strength of checks on executive power in China or foreign firms enjoying better protections than identical Chinese firms.

39
So how do we reconcile our results with the inefficiencies in the formal financial
system described in section 2? The formal financial system does serve a small sector of
the economy and both the aggregate statistics and firm responses suggest that there are
imperfections in the allocation of capital. However, our results show that despite these
weaknesses, at the margin, private sector firms that have loans from the formal sector do
better than other firms and having a better developed financial system will only bring
more benefits.
The informal sector does finance a huge section of the economy but we have no
evidence that the firms depending on informal finance are the fastest growing firms.
Rather, the evidence suggests that firms relying on their retained earnings grow faster
than firms relying on informal or other sources. However, even though in the aggregate
informal financing sources are not associated with high growth, there could be small
entrepreneurial firms that depend on the informal financing sources for their growth and
survival, akin to the critical role played by angel finance, in the financing and creation of
rapid-growth start-ups in developed economies. So while the informal sector has its own
niche in financing firms we find no evidence that it is an efficient substitute for the
formal sector.
5. Conclusion
With one of the largest and fastest growing economies in the world, China
provides many puzzles. More recently, it has been singled out as a counterexample to the
findings of the finance and growth literature: while Chinese financial systems and
institutions are underdeveloped, its economy, particularly its private sector, has been

40
growing very fast. One explanation for this observation has been that China has
alternative mechanisms and institutions that play an important role in supporting its
growth and these alternative mechanisms are good substitutes for standard corporate
governance mechanisms and financing channels (Allen, et al. 2005).
In this paper we take a closer look at the financing of 2400 Chinese firms and
their performance, using a detailed firm level survey. We find that in China, private
firms’ use of formal financing channels is comparable to its use in other developing
countries, and it is financing from these sources that is positively associated with firm
performance. Contrary to earlier findings, fund raising from informal channels is not
associated with faster firm growth. These findings have broader implications for the role
of informal versus formal financial systems. Our results contradict the belief that
nonstandard financing mechanisms provide effective substitutes to formal financing
channels in promoting growth. They suggest that the role of reputation and relationship
based financing and governance mechanisms in supporting the growth of private sector
firms is likely to be overestimated.
We also find that an important determinant of access to bank finance is collateral
requirements and larger firms, firms with more fixed assets and firms located in poor
institutional environments tend to post more collateral. This suggests that in poor
institutional environments, firms have to rely on collateral to access bank finance rather
than relying on credit histories and growth opportunities. Our findings underscore the
importance of institutions in facilitating firms’ access to bank finance.

41
References Allen, F., Qian, J., Qian, M., 2005, Law, Finance, and Economic Growth in China,
Journal of Financial Economics, 77, 57-116. Allen, F., Qian, J., Qian, M., 2006, China's Financial System: Past, Present and Future" forthcoming in China's Economic Transition: Origins, Mechanism, and Consequences edited by L. Brandt and T. Rawski. Anderson, J., 2006, Five persistent myths about China's banking system. The Cato
Journal. Beck, T., Demirgüç-Kunt, A., Maksimovic, V., 2004, Financial and Legal Constraints to Firm Growth: Does Size Matter? Journal of Finance 60, 137–177. Beck, T., Levine, R., 2002, Industry growth and capital allocation: does having a market- or bank-based system matter? Journal of Financial Economics 64, 147–180. Beck, T., Demirguc-Kunt, A., Laeven, L., Levine, R., 2006, Finance, Firm Size, and Growth, World Bank Working Paper Series 3485. Bekaert, G., Harvey, C.R., and Lundblad, C. 2001., Emerging Equity Markets and Economic Development, Journal of Development Economics 66, 465–504. Bekaert, G., Harvey, C.R., Lundblad, C., 2005, Does Financial Liberalization Spur Growth? Journal of Financial Economics 77, 3-56. Bell, C., Srinivasan, T.N., Udry, C., 1997, Rationing, Spillover and Interlinking in Credit Markets: The Case of Rural Punjab, Oxford Economic Papers 49:557-585. Bertrand, M., Schoar, A.S., Thesmar, D., 2004, Banking Deregulation and Industry Structure: Evidence from the French Banking Reforms of 1985. Discussion Paper No.4488. Centre for Economic Policy Research. Besley, T., Levenson, A. R., 1996, The Role of Informal Finance in Household Capital Accumulation: Evidence from Taiwan, Economic Journal, Royal Economic Society, Vol. 106(434), pages 39-59. Bose, Pinaki. 1998. “Formal-Informal Sector Interaction in Rural Credit Markets.” Journal of Development Economics 56(2):265-280. Cheng, X., Degryse, H., 2006, The Impact of Bank and Non-Bank Financial Institutions on Local Economic Growth in China, Tilburg Law and Economics Center Discussion Paper No. 2006-009.

42
DeMaris, A. (2002). Explained Variance in Logistic Regression. A Monte Carlo Study of Proposed Measures. Sociological Methods & Research 31(1), 27-74. Demirguc-Kunt, A., Maksimovic, V., 1998, Law, finance, and firm growth, Journal of Finance 53, 2107–2137. Christopoulos, D.K., and Tsionas, E.G., 2004, Financial Development and Economic Growth: Evidence from Panel Unit Root and Cointegration Tests, Journal of Development Economics 73, 55–74. Cull, R., Xu, L. C., 2005, Institutions, Ownership, and Finance: The Determinants of
Profit Reinvestment among Chinese Firms, Journal of Financial Economics 77(1), 117-146.
Cull, R., Xu, L. C., Zhu, T., 2007, Bank Finance and Trade Credit during China’s
Transition, World Bank Working Paper Series. Delios, A., Wu, Z., 2005, Legal Person Ownership, Diversification Strategy and Firm
Profitability in China, Journal of Management and Governance 9, 151-169. Dollar, D., Wang, S., Xu, C., Shi, A., 2004, Improving City Competitiveness through the Investment Climate: Ranking 23 Chinese Cities, World Bank Working Paper Series. Durnev, A., Li, K., Morck, R., Yeung, B., 2004, Capital Markets and capital allocation: Implications for economies in transition, Economics of Transition Vol 12 (4), 593-634. Fan G., Wang, X., 2004, NERI Index of Marketization of China’s Provinces, Economics Science Press (in Chinese). Fan, J.P.H., Wong, T.J., Zhang, T., 2005, The Emergence of Corporate Pyramids in China, SSRN Working Paper Series. Fan, J.P.H., Morck, R., Xu, C. L., Yeung, B., 2006, Does ‘Good Government’ Draw Foreign Capital? Explaining China’s Exceptional FDI Inflow, SSRN Working Paper Farrell, D., Lund, S., Rosenfeld, J., Morin, F., Gupta, N., Greenberg, E., 2006, Putting China’s Capital to Work: The Value of Financial System Reform, McKinsey Global Institute Report �Floro, M., Ray, D., 1997, Vertical Links Between Formal and Informal Financial Institutions, Review of Development Economics 1(1):34-56. Guiso, L., Sapienza, P., Zingales, L., 2002, Does local financial development matter? National Bureau of Economic Research Working Paper No. 8922.

43
Heckman, J.J., and S. Navarro-Lozano, 2004, Using matching, instrumental variables, and control functions to estimate economic choice models, Review of Economics and Statistics, 86, 30-57. Hoff, K., Stiglitz, J. E., 1998, Moneylenders and Bankers: Price-Increasing Subsidies in a Monopolistically Competitive Market, Journal of Development Economics 55(2):485-518. Hunag, Y., 2003, Selling China: Foreign Direct Investment during the Reform Era, Cambridge University Press, Jain, Sanjay. 1999. “Symbiosis vs. Crowding-Out: The Interaction of Formal and Informal Credit Markets in Developing Countries.” Journal of Development Economics 59(2):419-444. Johnson, S., Woodruff, C., 2003, Property Rights and Finance, Journal of Finance King, R., Levine, R., 1993, Finance and growth: Schumpeter might be right, Quarterly Journal of Economics 108, 717–738. Lerner, J., 1998, “Angel” financing and public policy: An overview, Journal of Banking and Finance 22(6-8), 773-783. Levine, R., 2005, Law, Endowments, and Property Rights, Journal of Economic Perspectives 19 (3), 61-88. Levine, R., Zervos, S., 1998, Stock market, banks, and economic growth. American Economic Review 88, 537–558. Levine, R., Loayza, N., Beck, T., 2000, Financial Intermediation and Growth: Causality and Causes, Journal of Monetary Economics 46, 31–77. Li, K., Prabhala, N., 2007, Self-selection models in corporate finance, Handbook of Corporate Finance: Empirical Corporate Finance (Elsevier/North-Holland) forthcoming Li, K., Yue, H., Zhao, L., 2006, Ownership, Institutions, and Capital Structure: Evidence from Chinese Firms, SSRN Working Paper Series Love, I., 2003, Financial Development and Financing Constraint: International Evidence from the Structural Investment Model, Review of Financial Studies 16, 765–791. Rajan, R., Zingales, L., 1998, Financial dependence and growth, American Economic Review 88, 559–586.
44
Rousseau, P.L., Sylla, R., 1999, Emerging Financial Markets and Early U.S. Growth, National Bureau of Economic Research Working Paper No. 7448. Tsai, K., 2002, Back-Alley Banking: Private Entrepreneurs in China, Cornell University Press, Ithaca, NY. Varghese, Adel. 2005. “Bank-Moneylender Linkage as an Alternative to Bank Competition in Rural Credit Markets.” Oxford Economic Papers 57(2):315-335. Xu, X., Wang, Y., 1997, Ownership Structure, Corporate Governance and Firm performance: The Case of Chinese Stock Companies, World Bank Policy Research Paper #1794

45
Figure 1: Chinese Cities Surveyed by the Investment Climate Surveys
Haerbin
Benxi
Changchun
Dalian
Shenzhen
Zhengzhou
Nanning
Lanzhou
Guiyang
Chongqing
Kunming
Xian
Nanchang
Hangzhou Wuhan
Wenzhou
Beijing
Jiangmen
Changsha
SOUTHWEST
CENTRAL
NORTHWEST
NORTHEAST
COASTAL

46
Figure 2: Aggregate Financing Patterns across Chinese Cities
0%
20%
40%
60%
80%
100%
Haer
bin
Zhen
gzho
u
Shen
zhen
Nann
ing
Chan
gchu
n
Xian
Lanz
hou
Nanc
hang
Dalia
n
Wen
zhou
Hang
zhou
Wuh
an
Kunm
ing
Chon
gqin
g
Guiy
ang
Chan
gsha
Benx
i
Jiang
men
Internal Informal Operations Investment Fund Equity Bank

47
Figure 3: Why Chinese firms do not apply for bank loans Of the full sample of 2326 firms, 1789 firms reported not having an existing loan from a bank or a financial institution. 1237 firms reported not having a bank loan because they did not apply for a bank loan. Of the 1666 private firms, 1301 firms reported not having an existing loan from a bank or a financial institution. 933 private firms reported not having a bank loan because they did not apply for the loan. The firms report six reasons for not applying for a loan: Do not need loans, Application procedures for bank loans are too cumbersome, Collateral requirements of bank loans are too stringent, Did not expect to be approved, Interest rates are too high, Corruption in the allocation of bank credit. The reasons reported are not mutually exclusive.
0.00%
10.00%
20.00%
30.00%
40.00%
50.00%
60.00%
70.00%
80.00%
1.1. Do not need loans 1.2. Applicationprocedures for bank
loans are toocumbersome
1.3. Collateralrequirements of bankloans are too stringent
1.4. Did not expect to beapproved
1.5. Interest Rates aretoo high
1.6. Corruption in theallocation of bank credit
Perc
enta
ge o
f firm
s tha
t did
not
app
ly fo
r a b
ank
loan
All Firms Private Firms
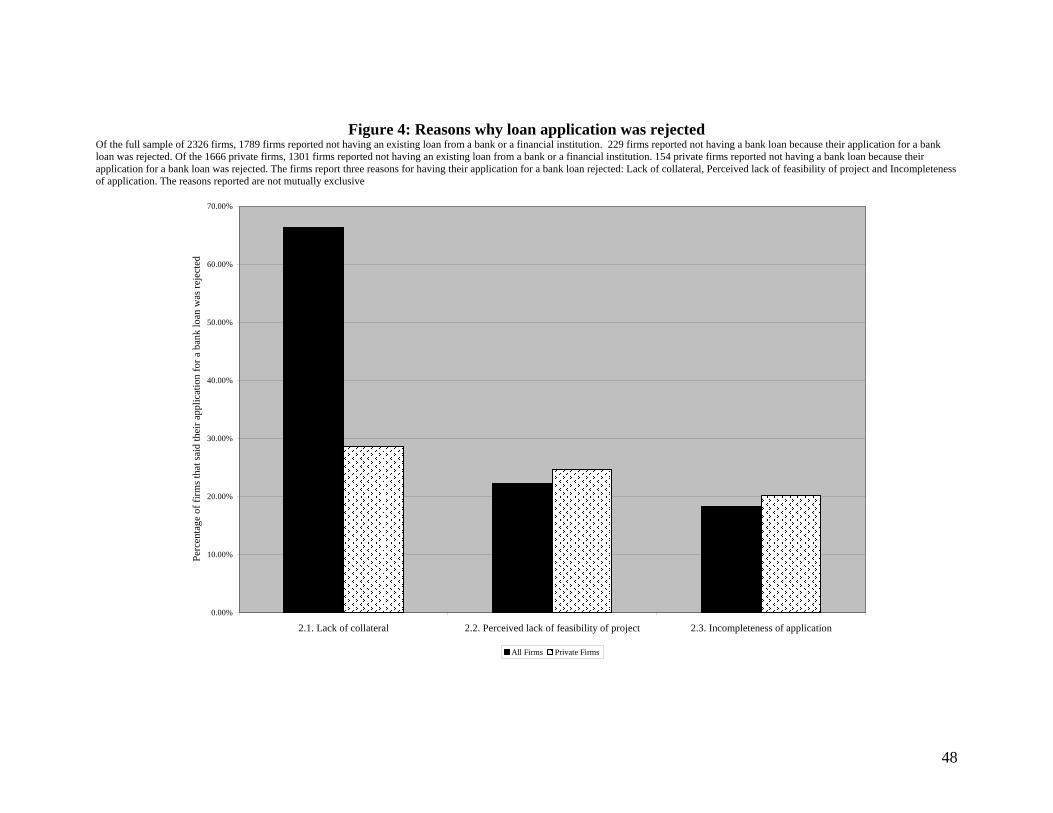
48
Figure 4: Reasons why loan application was rejected Of the full sample of 2326 firms, 1789 firms reported not having an existing loan from a bank or a financial institution. 229 firms reported not having a bank loan because their application for a bank loan was rejected. Of the 1666 private firms, 1301 firms reported not having an existing loan from a bank or a financial institution. 154 private firms reported not having a bank loan because their application for a bank loan was rejected. The firms report three reasons for having their application for a bank loan rejected: Lack of collateral, Perceived lack of feasibility of project and Incompleteness of application. The reasons reported are not mutually exclusive
0.00%
10.00%
20.00%
30.00%
40.00%
50.00%
60.00%
70.00%
2.1. Lack of collateral 2.2. Perceived lack of feasibility of project 2.3. Incompleteness of application
Perc
enta
ge o
f firm
s tha
t sai
d th
eir a
pplic
atio
n fo
r a b
ank
loan
was
reje
cted
All Firms Private Firms

49
Table 1: Financing Patterns in Developing Countries This table presents financing patterns across seven developing countries, geographic regions and country income groups across the world. In Panel A, Retained Earnings, Local Commercial Banks, Foreign Owned Commercial Banks, Equity, Operations Finance, Investment Funds, Loans from Family and Friends, Informal (eg: moneylender) and Other are financing proportions that stand for the proportion of new investments financed by each of these sources. Operations Finance consists of financing from leasing, trade credit and credit cards. Investment Funds includes funds from investment funds, development bank and other state services. In Panel B, we present two sets of aggregate financing patterns. The first set consists of Internal financing (Retained Earnings, Loans from Family and Friends and Other sources); Bank Financing (Local commercial banks and Foreign Owned commercial banks); Informal (informal sources such as moneylender or informal bank); Equity Financing, Operations Finance and Investment Funds. The second set consists of Bank Financing; and Self Fund Raising (100-Bank Financing) as defined in Allen et al. (2005) to represent the proportion of new investments financed by all other sources except Bank Financing. The financing proportions are in percentages. Panel A: Individual Financing Patterns
Number of
countries Number of firms
Retained Earnings
Local Commercial
Banks
Foreign Owned
Commercial Bank
Operations Finance
Investment Funds
Loans from
Family and
Friends Equity Informal Sources Other
Bangladesh 892 59.92 28.41 1.22 4.55 0.26 4.27 0.38 0.35 0.64 Brazil 1351 56.32 13.09 1.21 12.12 8.45 1.21 4.29 1.04 2.27 China 1342 15.24 20.24 0.12 1.03 0.55 5.89 12.39 1.84 42.70 India* 92 43.84 30.73 2.75 0.43 9.52 3.56 4.33 0.75 4.09 Indonesia 291 41.89 13.21 3.13 5.49 1.67 17.73 1.34 6.74 8.80 Nigeria 145 63.94 29.76 0.00 1.07 1.55 0.74 2.59 0.34 0.00 Russian Federation 701 82.47 5.57 0.36 5.87 0.73 1.74 0.36 1.02 1.87 Across Regions Africa 15 2708 66.02 18.14 1.05 6.15 0.98 1.88 1.36 0.48 3.95
East Asia and Pacific (excluding China) 8 5307 31.19 30.77 1.10 3.30 1.37 7.08 21.38 1.23 2.57 East Europe and Central Asia 36 15489 68.53 11.38 1.48 7.87 1.01 2.94 4.20 0.71 1.88 Latin America and Caribbean 10 4001 53.96 19.36 1.86 10.79 3.63 2.89 3.13 0.76 3.62 Middle East and North Africa 5 2103 74.52 12.37 0.69 5.25 0.28 2.46 1.70 0.15 2.57 South Asia 5 1572 58.63 21.95 0.86 4.76 1.00 4.59 3.23 0.68 4.29 Across Income Groups Low Income 26 6913 59.22 16.32 1.10 3.23 1.30 5.47 10.43 0.94 1.99 Middle Income 45 21062 59.26 16.12 1.40 7.29 1.43 3.26 4.89 0.82 5.53 High Income OECD 7 3020 58.22 19.74 1.04 12.81 0.62 1.09 5.29 0.10 1.09

50
Panel B: Aggregate Financing Patterns
Aggregate Financing Patterns Allen et al. (2005)'s Categorization
Number of
countries Number of firms Internal
Bank Financing Informal
Operations Finance Equity
Investment Funds Bank Financing
Self Fund Raising
Bangladesh 892 64.84 29.64 0.35 4.55 0.38 0.26 29.64 70.36 Brazil 1351 59.80 14.30 1.04 12.12 4.29 8.45 14.30 85.70 China 1342 63.82 20.37 1.84 1.03 12.39 0.55 20.37 79.63 India 92 51.49 33.48 0.75 0.43 4.33 9.52 33.48 66.52 Indonesia 291 68.42 16.34 6.74 5.49 1.34 1.67 16.34 83.66 Nigeria 145 64.69 29.76 0.34 1.07 2.59 1.55 29.76 70.24 Russian Federation 701 86.08 5.93 1.02 5.87 0.36 0.73 5.93 94.07 Across Regions Africa 15 2708 71.84 19.19 0.48 6.15 1.36 0.98 19.19 80.81
East Asia and Pacific (excluding China) 8 5307 40.84 31.87 1.23 3.30 21.38 1.37 31.87 68.13 East Europe and Central Asia 36 15489 73.34 12.86 0.71 7.87 4.20 1.01 12.86 87.14 Latin America and Caribbean 10 4001 60.47 21.22 0.76 10.79 3.13 3.63 21.22 78.78 Middle East and North Africa 5 2103 79.55 13.07 0.15 5.25 1.70 0.28 13.07 86.93 South Asia 5 1572 67.51 22.82 0.68 4.76 3.23 1.00 22.82 77.18 Across Income Groups Low Income 26 6913 66.67 17.42 0.94 3.23 10.43 1.30 17.42 82.58 Middle Income 45 21062 68.05 17.52 0.82 7.29 4.89 1.43 17.52 82.48 High Income OECD 7 3020 60.40 20.78 0.10 12.81 5.29 0.62 20.78 79.22

51
Table 2: Financing Patterns in China This table presents financing patterns across different cities and regions in China and across different types of firms. In Panel A, Retained Earnings, Local Commercial Banks, Foreign Owned Commercial Banks, Equity, Operations Finance, Investment Funds, Loans from Family and Friends, Informal (eg: moneylender) and Other are financing proportions that stand for the proportion of new investments financed by each of these sources. Operations Finance consists of financing from leasing, trade credit and credit cards. Investment Funds includes funds from investment funds, development bank and other state services. In Panel B, we present two sets of aggregate financing patterns. The first set consists of Internal financing (Retained Earnings, Loans from Family and Friends and Other sources); Bank Financing (Local commercial banks and Foreign Owned commercial banks); Informal (informal sources such as moneylender or informal bank); Equity Financing, Operations Finance and Investment Funds. The second set consists of Bank Financing and Self Fund Raising (100-Bank Financing) as defined in Allen et al. (2005) to represent the proportion of new investments financed by all other sources except Bank Financing. The financing proportions are in percentages. Panel A: Individual Financing Patterns
Region Province
Number of
Firms Retained Earnings
Local Commercial
Banks
Foreign Owned
Commercial Bank
Operations Finance
Family and Friends
Informal Sources Equity
Investment Funds Other
Across Cities in China Benxi Northeast Liaoning 89 7.96 33.81 0.00 0.00 9.56 5.43 14.03 1.12 28.09 Changchun Northeast Jilin 104 26.85 13.71 0.00 0.19 1.92 0.96 10.74 0.10 45.53 Changsha Central Hunan 55 15.56 29.91 0.36 0.00 4.84 4.55 6.96 0.64 37.18 Chongqing Southwest Chongqing 95 17.63 29.99 0.00 3.29 1.94 2.47 8.26 0.00 36.41 Dalian Northeast Liaoning 51 1.00 16.12 0.00 3.92 1.67 0.02 13.73 1.96 61.59 Guiyang Southwest Guizhou 57 8.93 30.12 0.00 0.09 0.61 0.00 9.54 0.32 50.39 Haerbin Northeast Heilongjiang 52 7.88 3.98 0.00 0.58 2.88 0.00 12.88 1.92 69.87 Hangzhou Coastal Zhejiang 78 24.96 25.53 0.19 1.03 1.41 0.00 22.91 0.00 23.97 Jiangmen Coastal Guangdong 70 4.29 35.13 1.57 2.26 5.13 1.14 8.31 1.86 40.31 Kunming Southwest Yunan 58 19.57 27.74 0.00 1.72 9.83 1.72 17.45 0.00 21.97 Lanzhou Northwest Gansu 27 11.85 15.11 0.00 0.00 11.48 1.48 16.67 0.00 43.41 Nanchang Central Jiangxi 135 18.01 15.39 0.00 0.89 8.22 1.07 10.64 0.19 45.59 Nanning Southwest Guangxi 48 15.23 9.92 0.00 0.83 11.15 4.85 28.23 0.00 29.79 Shenzhen Coastal Guangdong 78 12.49 9.59 0.00 1.92 0.00 0.00 5.71 0.00 70.29 Wenzhou Coastal Zhejiang 39 21.15 24.31 0.00 0.00 11.03 0.26 39.87 0.00 3.38 Wuhan Central Hubei 85 15.74 26.01 0.00 0.00 5.94 5.65 4.65 0.00 42.01 Xian Northwest Shaanxi 62 13.60 13.73 0.00 1.61 4.03 1.90 9.13 1.15 54.85 Zhengzhou Central Henan 104 16.08 9.20 0.00 0.10 9.69 0.96 8.83 0.05 55.10 Across Regions in China Central 379 16.61 18.18 0.05 0.34 7.62 2.57 8.26 0.17 46.18 Coastal 265 15.27 23.19 0.47 1.46 3.39 0.34 16.49 0.49 38.89 Northeast 296 13.38 18.46 0.00 0.84 4.34 1.97 12.62 1.05 47.33 Northwest 89 13.07 14.15 0.00 1.12 6.29 1.78 11.42 0.80 51.38 Southwest 258 15.70 25.78 0.00 1.78 5.13 2.20 14.33 0.07 35.02

52
Region Province
Number of
Firms Retained Earnings
Local Commercial
Banks
Foreign Owned
Commercial Bank
Operations Finance
Family and Friends
Informal Sources Equity
Investment Funds Other
Across All Firms 1287 15.16 20.52 0.11 1.03 5.41 1.85 12.39 0.46 43.07 Across Firm Sizes Micro 250 11.41 15.06 0.00 0.48 13.54 2.58 12.78 0.84 43.31 Small 249 14.20 14.82 0.04 1.14 6.70 1.59 13.97 0.10 47.45 Medium 249 16.50 21.89 0.46 0.60 4.62 1.49 11.14 0.94 42.36 Large 249 17.04 21.35 0.00 1.10 2.79 1.99 12.14 0.14 43.45 Very Large 249 17.02 30.13 0.08 1.61 0.08 1.81 11.25 0.29 37.73 Legal Status Publicly Listed Company 37 9.00 33.32 0.00 0.00 0.00 0.00 36.11 0.00 21.57 Privately held Company 490 18.11 20.54 0.03 0.98 10.00 2.21 14.14 0.26 33.75 Cooperatives 165 15.92 17.59 0.00 0.55 5.33 0.99 10.65 0.06 48.92 Across Firm Ownership (>50%) State 288 11.69 25.90 0.00 0.02 0.79 1.47 6.36 0.59 53.18 Domestic Private 901 16.23 19.60 0.14 1.10 7.30 2.00 14.16 0.36 39.12 Foreign Private 108 16.19 14.56 0.19 3.36 1.67 1.39 13.64 0.93 48.08 Age Less than 5 years 262 14.83 20.53 0.00 0.73 10.29 2.61 16.33 0.52 34.18 Between 5 and 20 years 735 16.67 18.16 0.20 1.45 4.85 1.52 13.53 0.62 43.01 Greater than 20 years 290 11.67 26.51 0.00 0.24 2.40 1.99 5.96 0.00 51.23

53
Panel B: Aggregate Financing Patterns
Aggregate Financing Patterns Allen et al. (2005)'s Categorization
Region Province Number of
firms Internal Bank
Financing Informal Operations
Finance Equity Investment
Funds Bank Financing Self Fund Raising Across Cities in China Benxi Northeast Liaoning 89 45.61 33.81 5.43 0.00 14.03 1.12 33.81 66.19 Changchun Northeast Jilin 104 74.30 13.71 0.96 0.19 10.74 0.10 13.71 86.29 Changsha Central Hunan 55 57.58 30.27 4.55 0.00 6.96 0.64 30.27 69.73 Chongqing Southwest Chongqing 95 55.98 29.99 2.47 3.29 8.26 0.00 29.99 70.01 Dalian Northeast Liaoning 51 64.25 16.12 0.02 3.92 13.73 1.96 16.12 83.88 Guiyang Southwest Guizhou 57 59.93 30.12 0.00 0.09 9.54 0.32 30.12 69.88 Haerbin Northeast Heilongjiang 52 80.63 3.98 0.00 0.58 12.88 1.92 3.98 96.02 Hangzhou Coastal Zhejiang 78 50.35 25.72 0.00 1.03 22.91 0.00 25.72 74.28 Jiangmen Coastal Guangdong 70 49.73 36.70 1.14 2.26 8.31 1.86 36.70 63.30 Kunming Southwest Yunan 58 51.36 27.74 1.72 1.72 17.45 0.00 27.74 72.26 Lanzhou Northwest Gansu 27 66.74 15.11 1.48 0.00 16.67 0.00 15.11 84.89 Nanchang Central Jiangxi 135 71.82 15.39 1.07 0.89 10.64 0.19 15.39 84.61 Nanning Southwest Guangxi 48 56.17 9.92 4.85 0.83 28.23 0.00 9.92 90.08 Shenzhen Coastal Guangdong 78 82.78 9.59 0.00 1.92 5.71 0.00 9.59 90.41 Wenzhou Coastal Zhejiang 39 35.56 24.31 0.26 0.00 39.87 0.00 24.31 75.69 Wuhan Central Hubei 85 63.69 26.01 5.65 0.00 4.65 0.00 26.01 73.99 Xian Northwest Shaanxi 62 72.48 13.73 1.90 1.61 9.13 1.15 13.73 86.27 Zhengzhou Central Henan 104 80.87 9.20 0.96 0.10 8.83 0.05 9.20 90.80 Across Regions in China Central 379 70.41 18.23 2.57 0.34 8.26 0.17 18.23 81.77 Coastal 265 57.55 23.66 0.34 1.46 16.49 0.49 23.66 76.34 Northeast 296 65.05 18.46 1.97 0.84 12.62 1.05 18.46 81.54 Northwest 89 70.74 14.15 1.78 1.12 11.42 0.80 14.15 85.85 Southwest 258 55.85 25.78 2.20 1.78 14.33 0.07 25.78 74.22 Across All Firms 1287 63.64 20.63 1.85 1.03 12.39 0.46 20.63 79.37 Across Firm Sizes Micro 250 68.27 15.06 2.58 0.48 12.78 0.84 15.06 84.94 Small 249 68.35 14.86 1.59 1.14 13.97 0.10 14.86 85.14 Medium 249 63.47 22.35 1.49 0.60 11.14 0.94 22.35 77.65 Large 249 63.27 21.35 1.99 1.10 12.14 0.14 21.35 78.65 Very Large 249 54.84 30.21 1.81 1.61 11.25 0.29 30.21 69.79 Legal Status Publicly Listed Company 37 30.57 33.32 0.00 0.00 36.11 0.00 33.32 66.68 Privately held Company 490 61.86 20.57 2.21 0.98 14.14 0.26 20.57 79.43 Cooperatives 165 70.16 17.59 0.99 0.55 10.65 0.06 17.59 82.41

54
Aggregate Financing Patterns Allen et al. (2005)'s Categorization
Region Province Number of
firms Internal Bank
Financing Informal Operations
Finance Equity Investment
Funds Bank Financing Self Fund Raising Across Firm Ownership (>50%) State 288 65.66 25.90 1.47 0.02 6.36 0.59 25.90 74.10 Domestic Private 901 62.65 19.74 2.00 1.10 14.16 0.36 19.74 80.26 Foreign Private 108 65.94 14.75 1.39 3.36 13.64 0.93 14.75 85.25 Age Less than 5 years 262 59.29 20.53 2.61 0.73 6.36 0.59 20.53 79.47 Between 5 and 20 years 735 64.53 18.35 1.52 1.45 14.16 0.36 18.35 81.65 Greater than 20 years 290 65.30 26.51 1.99 0.24 13.64 0.93 26.51 73.49

55
Table 3: Summary Statistics and Correlations Panel A presents summary statistics. Panel B presents the correlations between the financing variables and firm performance. Bank Dummy takes the value 1 if the firm said it had a loan from a bank or financial institution and 0 if the firm said it had no bank loan and had no overdraft facility or line of credit. Access Dummy is a dummy variable that takes the value 1 if the firm had access to a bank loan in any year prior from 1990-2001 and 0 otherwise. Bank Financing takes the value 0 if (the firm said it had no loan from a bank or financial institution OR said it had no overdraft facility or line of credit) AND (bank financing of new investments was equal to 0% AND bank financing of working capital was equal to 0%). Self Financing1 takes the value 1 if the sum of informal financing and other financing of new investments was greater than 50% OR the sum of informal financing and other financing of working capital was greater than 50%. Self Financing1 takes the value 0 if the sum of informal and other financing of new investments is equal to 0 % AND the sum of informal and other financing of working capital is equal to 0%. Self Financing2 takes the value 1 if the sum of informal, family, and other financing of new investments was greater than 50% OR the sum of informal, family and other financing of working capital was greater than 50%. Self Financing2 takes the value 0 if the sum of informal, family and other financing of new investments is equal to 0 % AND the sum of informal, family and other financing of working capital is equal to 0%.Sales Growth is defined as the log change in total sales and is computed from 2001 to 2002 and from 1999 to 2002. Productivity Growth is defined as the log change in productivity where productivity is (Sales-Total Material Costs)/Total Number of Workers. Productivity Growth is computed from 2001 to 2002 and from 1999 to 2002. Reinvestment Rate is the share of net profits re-invested in the establishment in 2002. Firm Size Dummies are quintiles of total firm sales in 1999. Age is the age of the company in 2003. Corporation Dummy takes the value 1 if the firm is organized as a corporation (public or private) and 0 otherwise. Cooperatives/Collectives Dummy takes the value 1 if the firm is organized as a Cooperative or a Collective. State Ownership Dummy takes the value 1 if the state owns more than 50% of the company. Competition takes values 1 to 5 for 1-3 competitors, 4- 6 competitors. 7- 15 competitors, 16-100 competitors and over 100 competitors respectively for the number of competitors in its main business line in the domestic Market. Panel A: Summary Statistics
Variable N Mean Standard Deviation Minimum Maximum Financing Bank Dummy 2326 0.2309 0.4215 0 1 Access Dummy 2400 0.2858 0.4519 0 1 Bank Financing 1777 0.2060 0.4045 0 1 Self Financing1 2176 0.4003 0.4901 0 1 Self Financing2 2141 0.4521 0.4978 0 1 Firm Performance Sales Growth [2001-2002] 2370 0.0563 0.7072 -7.44 7.13 Reinvestment Rate [2001] 2115 0.1761 0.3230 0 1 Sales Growth [1999-2002] 2559 0.1349 0.3890 -2.36 2.71 Productivity Growth [2001-2002] 1558 0.0045 0.8132 -6.68 8.02 Productivity Growth [1999-2002] 1486 0.0810 0.3397 -1.97 3.28 Firm Characteristics Size Dummies 2283 2.9991 1.4145 1 5 Age 2400 15.9862 14.3902 3 53 Corporation Dummy 2400 0.4046 0.4909 0 1 Cooperatives Dummy 2400 0.1612 0.3678 0 1 State Ownership Dummy 2399 0.2213 0.4152 0 1 Competition Dummies 2326 3.8224 1.3535 1 5

56
Panel B: Correlations between Financing and Firm Performance
Sales Growth Sales Growth
[2001-2002] Reinvestment Rate
Productivity Growth [2001-2002] [1999-2002]
Productivity Growth [1999-2002]
Bank Dummy
Access Dummy
Bank Financing
Self Financing1
Reinvestment Rate 0.074a
Productivity Growth [2001-2002] 0.6536 a -0.0111
Sales Growth [1999-2002] 0.5072 a 0.1171 a 0.2982 a
Productivity Growth [1999-2002] 0.4238 a 0.0488 c 0.4682 a 0.7298 a Bank Dummy 0.037 c 0.132 a 0.0058 0.0671 a 0.0573 b Access Dummy 0.0003 -0.0076 -0.0332 -0.0613 a -0.0601 b 0.0914 a Bank Financing 0.0366 0.1664 a 0.0279 0.074 a 0.0878 a 1 a 0.0767 a Self Financing1 -0.0077 -0.0923 a 0.0639 b -0.0491 b 0.0016 -0.1174 a -0.0854 a -0.1762 a Self Financing2 0.0009 -0.0672 a 0.0746 a -0.0229 0.0111 -0.1281 a -0.0801 a -0.1861 a 0.9303 a
c significant at 10%; b significant at 5%; a significant at 1%

57
Table 4: Bank Financing and Firm Performance – Partial Correlations The estimated model is: Sales Growth/Reinvestment Rate/Productivity Growth = α + β1BankDummy+ β2Small + β3 Medium + β4Large + β5Very Large + β6 Mid-Age + β7 Old + β8Corporations + β9Collectives + β10State Ownership + β11Competition Dummies + β12City Dummies. Sales Growth is defined as the log change in total sales and is computed from 2001 to 2002 and from 1999 to 2002. Productivity Growth is defined as the log change in productivity where productivity is (Sales-Total Material Costs)/Total Number of Workers. Productivity Growth is computed from 2001 to 2002 and from 1999 to 2002. Reinvestment Rate is the share of net profits re-invested in the establishment in 2002. Bank Dummy takes the value 1 if the firm said it had a loan from a bank or financial institution and 0 if the firm said it had no bank loan and had no overdraft facility or line of credit. Firm Size Dummies are quintiles of total firm sales in 1999. Small, Medium, Large and Very Large dummies take the value 1 if the firm is in the second, third, fourth or fifth quintile respectively of firm sales. Mid-Age is a dummy variable that takes the value 1 if the firm is between 5 and 20 years of age and Old is a dummy variable that takes the value 1 if the firm is greater than 20 years old. The omitted age dummy is less than 5 years. Corporation Dummy takes the value 1 if the firm is organized as a corporation (public or private) and 0 otherwise. Cooperatives/Collectives Dummy takes the value 1 if the firm is organized as a Cooperative or a Collective. State Ownership Dummy takes the value 1 if the state owns more than 50% of the company. 4 to 6 Competitors, 7 to 15 Competitors, 16 to 100 Competitors and Over 100 Competitors are dummy variables that take the value 1 if the firm has the corresponding number of competitors in its main business line in the domestic market. The omitted category is 1 to 3 Competitors. Columns 1 to 5 present results for the full sample and columns 6 to 10 present results for a sample of firms that don’t include firms registered as publicly traded firms and state owned enterprises. We use OLS regressions with robust standard errors.
1 2 3 4 5 6 7 8 9 10 Full Sample Drop Public Corporations and State Owned Companies
Sales Growth
[2001-2002]
Profit Reinvestment rate in 2002
Productivity Growth
[2001-2002]
Sales Growth
[1999-2002]
Productivity Growth
[1999-2002]
Sales Growth
[2001-2002]
Profit Reinvestment rate in 2002
Productivity Growth
[2001-2002]
Sales Growth
[1999-2002]
Productivity Growth
[1999-2002] Bank Dummy 0.075b 0.078a -0.002 0.115a 0.058a 0.068c 0.086a -0.004 0.120a 0.066b
[0.034] [0.020] [0.051] [0.019] [0.022] [0.040] [0.024] [0.056] [0.024] [0.026]Small -0.121b 0.057b -0.064 -0.195a -0.085b -0.126c 0.077a -0.09 -0.205a -0.097b
[0.057] [0.023] [0.079] [0.031] [0.038] [0.064] [0.026] [0.084] [0.034] [0.043]Medium -0.136b 0.071a 0.007 -0.258a -0.136a -0.146b 0.086a -0.007 -0.289a -0.168a
[0.056] [0.024] [0.080] [0.031] [0.038] [0.065] [0.028] [0.087] [0.035] [0.043]Large -0.160a 0.047b -0.088 -0.298a -0.187a -0.169a 0.058b -0.123 -0.319a -0.202a
[0.057] [0.023] [0.081] [0.032] [0.040] [0.065] [0.027] [0.089] [0.037] [0.046]Very Large -0.230a 0.075a -0.086 -0.359a -0.184a -0.221b 0.107a -0.087 -0.398a -0.221a
[0.072] [0.026] [0.087] [0.036] [0.043] [0.093] [0.034] [0.100] [0.044] [0.053]Mid-Age 0.001 -0.007 -0.038 -0.143a -0.090a -0.006 -0.027 -0.04 -0.163a -0.098a
[0.041] [0.021] [0.059] [0.024] [0.029] [0.047] [0.024] [0.063] [0.026] [0.032]Old -0.064 -0.048b 0.03 -0.208a -0.046 -0.035 -0.088a 0.062 -0.209a -0.062 [0.049] [0.024] [0.075] [0.027] [0.035] [0.065] [0.031] [0.085] [0.035] [0.041]Corporations -0.03 0.083a -0.027 -0.012 -0.038c -0.067 0.107a -0.047 -0.045b -0.041 [0.035] [0.019] [0.057] [0.018] [0.022] [0.043] [0.022] [0.069] [0.021] [0.026]Cooperative -0.116b 0.033 -0.024 -0.143a -0.098a -0.170a 0.056c -0.051 -0.184a -0.100a
[0.053] [0.022] [0.068] [0.025] [0.027] [0.064] [0.028] [0.081] [0.030] [0.032]State -0.01 -0.022 0.053 -0.037c -0.033 [0.041] [0.019] [0.062] [0.020] [0.026] 4 to 6 Competitors 0.012 0.053 -0.049 0.011 -0.029 -0.017 0.092b -0.004 0.021 -0.02 [0.055] [0.033] [0.086] [0.033] [0.038] [0.070] [0.039] [0.104] [0.043] [0.047]7 to 15 Competitors 0.015 0.004 0.011 -0.031 -0.03 0.019 0.033 0.074 -0.007 0 [0.062] [0.029] [0.097] [0.034] [0.042] [0.080] [0.035] [0.123] [0.043] [0.053]16 to 100 Competitors -0.053 0.022 -0.043 -0.063b -0.077b -0.051 0.063c -0.023 -0.06 -0.074c
[0.049] [0.027] [0.078] [0.029] [0.036] [0.063] [0.032] [0.095] [0.038] [0.045]

58
1 2 3 4 5 6 7 8 9 10 Full Sample Drop Public Corporations and State Owned Companies
Sales Growth
[2001-2002]
Profit Reinvestment rate in 2002
Productivity Growth
[2001-2002]
Sales Growth
[1999-2002]
Productivity Growth
[1999-2002]
Sales Growth
[2001-2002]
Profit Reinvestment rate in 2002
Productivity Growth
[2001-2002]
Sales Growth
[1999-2002]
Productivity Growth
[1999-2002] Over 100 Competitors -0.125b 0.02 -0.073 -0.091a -0.081b -0.106c 0.046 -0.029 -0.083b -0.073c
[0.050] [0.025] [0.075] [0.027] [0.034] [0.061] [0.029] [0.090] [0.036] [0.043]Changchun -0.024 0.178a -0.03 0.149a 0.059 -0.05 0.185a -0.004 0.159b 0.134b
[0.091] [0.039] [0.144] [0.049] [0.053] [0.125] [0.052] [0.156] [0.064] [0.064]Changsha -0.024 0.083b -0.083 0.048 -0.034 -0.08 0.096b -0.213 0.07 0.017 [0.089] [0.032] [0.130] [0.044] [0.046] [0.121] [0.045] [0.153] [0.055] [0.055]Chongqing 0.034 0.089b 0.12 0.093b 0.077c -0.022 0.056 0.002 0.121b 0.100c
[0.086] [0.038] [0.125] [0.044] [0.046] [0.118] [0.048] [0.138] [0.057] [0.056]Dalian -0.108 0.031 0.023 0.043 0.035 -0.127 0.032 -0.13 0.088 0.074 [0.124] [0.038] [0.130] [0.058] [0.054] [0.123] [0.052] [0.144] [0.069] [0.066]Guiyang 0.031 0.064c -0.049 0.069 -0.008 0.115 0.089c -0.19 0.159b 0.029 [0.108] [0.037] [0.129] [0.054] [0.053] [0.154] [0.054] [0.159] [0.073] [0.062]Haerbin -0.146 0.081b -0.156 0.054 -0.039 -0.122 0.095b -0.201 0.076 0.014 [0.096] [0.038] [0.135] [0.055] [0.055] [0.124] [0.048] [0.150] [0.066] [0.066]Hangzhou 0.06 0.118a -0.034 0.147a 0.052 0.036 0.131b -0.07 0.184a 0.151b
[0.105] [0.044] [0.164] [0.051] [0.059] [0.134] [0.056] [0.155] [0.063] [0.062]Jiangmen 0.061 0.094b -0.031 0.045 -0.042 0.002 0.088c -0.117 0.047 0.016 [0.106] [0.040] [0.145] [0.048] [0.056] [0.141] [0.048] [0.159] [0.060] [0.065]Kunming 0.003 0.112a 0.047 0.005 -0.022 -0.078 0.122b -0.088 0.007 0.017 [0.099] [0.036] [0.121] [0.048] [0.048] [0.134] [0.048] [0.144] [0.063] [0.060]Lanzhou 0.011 0.089a -0.092 0.003 -0.065 -0.06 0.077c -0.182 -0.012 -0.047 [0.101] [0.035] [0.147] [0.050] [0.054] [0.129] [0.047] [0.175] [0.065] [0.073]Nanchang 0.114 0.191a -0.08 0.113b 0.042 0.068 0.227a -0.184 0.136b 0.087 [0.091] [0.038] [0.143] [0.047] [0.056] [0.128] [0.053] [0.173] [0.064] [0.074]Nanning -0.113 0.076b -0.161 0.025 -0.086 -0.148 0.088c -0.327c 0.073 -0.035 [0.116] [0.036] [0.144] [0.056] [0.054] [0.158] [0.051] [0.168] [0.074] [0.067]Shenzhen 0.223c 0.048 0.151 0.185a 0.116 0.215 0.051 0.034 0.234a 0.174 [0.131] [0.042] [0.236] [0.057] [0.084] [0.183] [0.057] [0.294] [0.077] [0.114]Wenzhou 0.108 0.123a -0.107 0.155a 0.031 0.068 0.102b -0.185 0.192a 0.074 [0.104] [0.046] [0.156] [0.052] [0.058] [0.131] [0.051] [0.169] [0.063] [0.064]Wuhan -0.181c 0.081b -0.182 0.027 -0.001 -0.261c 0.06 -0.317c 0.026 0.029 [0.097] [0.033] [0.137] [0.045] [0.051] [0.134] [0.045] [0.162] [0.059] [0.066]Xian -0.008 0.085b -0.044 0.067 0.035 -0.061 0.103b -0.236 0.099 0.087 [0.108] [0.033] [0.155] [0.050] [0.047] [0.148] [0.046] [0.183] [0.064] [0.059]Zhengzhou -0.011 0.144a 0.037 0.027 -0.045 -0.061 0.127a -0.076 0.019 -0.024 [0.085] [0.039] [0.118] [0.046] [0.051] [0.116] [0.047] [0.136] [0.059] [0.061]Constant 0.288a -0.022 0.151 0.489a 0.349a 0.360a -0.072 0.245 0.520a 0.318a
[0.099] [0.036] [0.144] [0.052] [0.061] [0.136] [0.048] [0.166] [0.067] [0.074]Observations 2145 1905 1456 2135 1423 1535 1363 1099 1528 1072R-squared 0.036 0.072 0.017 0.175 0.071 0.038 0.087 0.023 0.195 0.083
c significant at 10%; b significant at 5%; a significant at 1%

59
Table 5: Bank Financing and Firm Performance – Selection Model A two-step selection model is used to estimate the effect of the endogenous Bank Dummy (binary treatment) on Firm Performance. In Panel A: The first step is: Bank Dummy = α0 + β1 Collateral + β2Small + β3 Medium + β4Large + β5Very Large + β6 Mid-Age + β7 Old + β8Corporations + β9Collectives + β10State Ownership + β11Competition Dummies + β12City Dummies. The second step is: Sales/Reinvestment Rate/Productivity Growth = α1 + γ1BankDummy+ γ2Small + γ3 Medium + γ4Large + γ5Very Large + γ6 Mid-Age + γ7 Old + γ8Corporations + γ9Collectives + γ10State Ownership + γ11Competition Dummies + γ12City Dummies. Sales Growth is defined as the log change in total sales and is computed from 2001 to 2002. Productivity Growth is defined as the log change in productivity where productivity is (Sales-Total Material Costs)/Total Number of Workers. Productivity Growth is computed from 2001 to 2002. Reinvestment Rate is the share of net profits re-invested in the establishment in 2002. Bank Dummy takes the value 1 if the firm said it had a loan from a bank or financial institution and 0 if the firm said it had no bank loan and had no overdraft facility or line of credit. The identifying variable is Collateral which is a dummy variable that takes the value 1 if the financing required a collateral or a deposit and 0 if the financing did not require collateral or if the firm did not apply for a loan because of stringent collateral requirements or if the firm was rejected for a loan because of the lack of collateral. Firm Size Dummies are quintiles of total firm sales in 1999. Small, Medium, Large and Very Large dummies take the value 1 if the firm is in the second, third, fourth or fifth quintile respectively of firm sales. Mid-age is a dummy variable that takes the value 1 if the firm is between 5 and 20 years of age and Old is a dummy variable that takes the value 1 if the firm is greater than 20 years old. The omitted age dummy is less than 5 years. Corporation Dummy takes the value 1 if the firm is organized as a corporation (public or private) and 0 otherwise. Cooperatives/Collectives Dummy takes the value 1 if the firm is organized as a Cooperative or a Collective. State Ownership Dummy takes the value 1 if the state owns more than 50% of the company. 4 to 6 Competitors, 7 to 15 Competitors, 16 to 100 Competitors and Over 100 Competitors are dummy variables that take the value 1 if the firm has the corresponding number of competitors in its main business line in the domestic market. The omitted category is 1 to 3 Competitors. Columns 1 to 6 present results for the full sample and columns 7 to 12 present results for a sample of firms that don’t include firms registered as publicly traded firms and state owned enterprises. Hazard Lambdas are reported for each of the second stages.
1 2 3 4 5 6 7 8 9 10 11 12 Full Sample Drop Public Corporations and State Owned Companies
Sales Growth [2001-2002]
Selection Equation
Profit Reinvestment rate in 2002
Selection Equation
Productivity Growth [2001-2002]
Selection Equation
Sales Growth [2001-2002]
Selection Equation
Profit Reinvestment rate in 2002
Selection Equation
Productivity Growth [2001-2002]
Selection Equation
Bank Dummy 0.310a 0.183a 0.116 0.244b 0.156b 0.068 [0.116] [0.058] [0.147] [0.124] [0.063] [0.143] Collateral 0.968a 0.964a 0.941a 1.120a 1.102a 1.103a [0.076] [0.080] [0.089] [0.095] [0.099] [0.107] Small -0.229a 0.101 0.075b 0.081 -0.101 -0.044 -0.219a 0.01 0.093a -0.018 -0.129 -0.131 [0.062] [0.147] [0.031] [0.154] [0.088] [0.182] [0.067] [0.163] [0.034] [0.171] [0.089] [0.199] Medium -0.274a 0.240c 0.065b 0.224 -0.062 0.101 -0.276a 0.139 0.082b 0.142 -0.11 0.01 [0.062] [0.141] [0.031] [0.147] [0.085] [0.171] [0.069] [0.159] [0.035] [0.167] [0.087] [0.187] Large -0.289a 0.401a 0.03 0.363b -0.147c 0.215 -0.284a 0.281c 0.06 0.262 -0.190b 0.085 [0.065] [0.140] [0.032] [0.146] [0.086] [0.168] [0.073] [0.161] [0.037] [0.167] [0.088] [0.186] Very Large -0.420a 0.850a 0.042 0.860a -0.12 0.700a -0.386a 0.742a 0.080c 0.714a -0.116 0.610a [0.076] [0.144] [0.038] [0.150] [0.099] [0.173] [0.089] [0.173] [0.045] [0.181] [0.105] [0.200] Mid Age -0.001 -0.042 -0.007 -0.06 -0.097 -0.15 -0.022 -0.051 -0.014 -0.059 -0.1 -0.129 [0.049] [0.104] [0.024] [0.108] [0.065] [0.123] [0.054] [0.117] [0.027] [0.122] [0.066] [0.137] Old -0.033 -0.02 -0.061b -0.075 -0.052 -0.177 -0.018 -0.184 -0.105a -0.173 0.024 -0.314 [0.061] [0.129] [0.030] [0.135] [0.080] [0.154] [0.077] [0.169] [0.039] [0.174] [0.092] [0.194] Corporations -0.036 0.170c 0.070a 0.139 -0.06 0.147 -0.065 -0.026 0.111a -0.023 -0.084 -0.064 [0.044] [0.089] [0.022] [0.094] [0.055] [0.102] [0.050] [0.108] [0.025] [0.113] [0.060] [0.123]

60
1 2 3 4 5 6 7 8 9 10 11 12 Full Sample Drop Public Corporations and State Owned Companies
Sales Growth [2001-2002]
Selection Equation
Profit Reinvestment rate in 2002
Selection Equation
Productivity Growth [2001-2002]
Selection Equation
Sales Growth [2001-2002]
Selection Equation
Profit Reinvestment rate in 2002
Selection Equation
Productivity Growth [2001-2002]
Selection Equation
Cooperative -0.150a -0.02 0.024 0.003 -0.01 0.05 -0.207a -0.063 0.061c -0.046 -0.044 -0.052 [0.056] [0.124] [0.028] [0.130] [0.072] [0.144] [0.066] [0.148] [0.034] [0.154] [0.079] [0.166] State -0.032 0.062 -0.01 0.102 0.066 0.097 [0.049] [0.102] [0.025] [0.108] [0.067] [0.126] 4 to 6 Competitors 0.015 0.446a 0.032 0.462a -0.079 0.412b -0.021 0.554a 0.062 0.545a -0.059 0.610a [0.080] [0.161] [0.040] [0.170] [0.099] [0.182] [0.095] [0.200] [0.048] [0.207] [0.109] [0.220] 7 to 15 Competitors -0.011 0.203 -0.004 0.236 -0.097 0.245 -0.034 0.276 0.014 0.317 -0.072 0.392c [0.074] [0.155] [0.037] [0.163] [0.092] [0.175] [0.090] [0.198] [0.045] [0.204] [0.104] [0.217] 16 to 100 Competitors -0.055 0.232 0.003 0.269c -0.1 0.201 -0.059 0.291 0.041 0.249 -0.122 0.297 [0.068] [0.145] [0.034] [0.153] [0.085] [0.164] [0.082] [0.185] [0.041] [0.190] [0.093] [0.201] Over 100 Competitors -0.146b 0.141 0.007 0.155 -0.153c 0.173 -0.134c 0.237 0.02 0.231 -0.143 0.308 [0.064] [0.140] [0.032] [0.147] [0.083] [0.161] [0.078] [0.177] [0.039] [0.183] [0.091] [0.197] Hazard Lambda -0.146b -0.068c -0.095 -0.122 -0.042 -0.059 [0.072] [0.036] [0.092] [0.078] [0.039] [0.090] Observations 1549 1549 1397 1397 1089 1089 1110 1110 1004 1004 819 819
c significant at 10%; b significant at 5%; a significant at 1%

61
Table 6: Bank Financing and Firm Performance – Selection Model Robustness A two-step selection effects model is used to estimate the effect of the endogenous Bank Dummy (binary treatment) on Firm Performance. In Panel A: The first step is: Bank Dummy = α0 + β1 Collateral + β2Small + β3 Medium + β4Large + β5Very Large + β6 Middle-Age + β7 Old + β8Corporations + β9Collectives + β10State Ownership + β11Competition Dummies + β12City Dummies + β13 Bank Corruption + β14 Government Help dummy + β15Loan from Group or Holding Company + β16Loan Guarantee Program + β17 Located in Export Processing Zone+ β18 Property Rights + β19Dispute Resolution in Courts + β20CEO Education Level + β21Politically Connected CEO. The second step is: Sales/Reinvestment Rate/Productivity Growth = α1 + γ1BankDummy+ γ2Small + γ3 Medium + γ4Large + γ5Very Large + γ6 Middle-Age + γ7 Old + γ8Corporations + γ9Collectives + γ10State Ownership + γ11Competition Dummies + γ12City Dummies + γ13 Bank Corruption + γ14 Government Help dummy + γ15Loan from Group or Holding Company + γ16Loan Guarantee Program +γ17 Located in Export Processing Zone+ γ18 Property Rights + γ19Dispute Resolution in Courts + γ20CEO Education Level + γ21Politically Connected CEO. In Panel B: The first step is: Access Dummy = α0 + β1 Collateral + β2Small + β3 Medium + β4Large + β5Very Large + β6 Middle-Age + β7 Old + β8Corporations + β9Collectives + β10State Ownership + β11Competition Dummies + β12City Dummies. The second step is: Sales/Reinvestment Rate/Productivity Growth = α1 + γ1Access Dummy+ γ2Small + γ3 Medium + γ4Large + γ5Very Large + γ6
Middle-Age + γ7 Old + γ8Corporations + γ9Collectives + γ10State Ownership + γ11Competition Dummies + γ12City Dummies. Sales Growth is defined as the log change in total sales and is computed from 2001 to 2002. Productivity Growth is defined as the log change in productivity where productivity is (Sales-Total Material Costs)/Total Number of Workers. Productivity Growth is computed from 2001 to 2002. Reinvestment Rate is the share of net profits re-invested in the establishment in 2002. Bank Dummy takes the value 1 if the firm said it had a loan from a bank or financial institution and 0 if the firm said it had no bank loan and had no overdraft facility or line of credit. Access Dummy is a dummy variable that takes the value 1 if the firm had access to a bank loan in any year prior from 1990-2001 and 0 otherwise. The identifying variable is Collateral which is a dummy variable that takes the value 1 if the financing required a collateral or a deposit and 0 if the financing did not require collateral or if the firm did not apply for a loan because of stringent collateral requirements or if the firm was rejected for a loan because of the lack of collateral. Firm Size Dummies are quintiles of total firm sales in 1999. Small, Medium, Large and Very Large dummies take the value 1 if the firm is in the second, third, fourth or fifth quintile respectively of firm sales. Middle-age is a dummy variable that takes the value 1 if the firm is between 5 and 20 years of age and Old is a dummy variable that takes the value 1 if the firm is greater than 20 years old. Corporation Dummy takes the value 1 if the firm is organized as a corporation (public or private) and 0 otherwise. Cooperatives/Collectives Dummy takes the value 1 if the firm is organized as a Cooperative or a Collective. State Ownership Dummy takes the value 1 if the state owns more than 50% of the company. 4 to 6 Competitors, 7 to 15 Competitors, 16 to 100 Competitors and Over 100 Competitors are dummy variables that take the value 1 if the firm has the corresponding number of competitors in its main business line in the domestic market. The omitted category is 1 to 3 Competitors. Bank Corruption is a dummy variable that takes the value 1 if the firm reported that a gift or informal payment was expected in its dealing with bank officials and loan officers and 0 otherwise. Government Help dummy takes the value 1 if a government agency or official assisted the firm in obtaining bank financing. Loan from Group or Holding Company takes the value 1 if the firm was a member of a group or a holding company that provided loan to the firm and 0 otherwise. Loan Guarantee Program takes the value 1 if the firm benefited from a loan guarantee program offered by loan guarantee companies. Located in Export Processing Zone takes the value 1 if the firm is located in an industrial park, science park or export processing zone and 0 otherwise. Property Rights Protection is the likelihood that the legal system will uphold the firm’s contract and property rights in business disputes. CEO Education Level takes the values 1 to 4, 1 if the CEO had no education, 2 if the CEO had high-school, secondary school or primary school education, 3 if the CEO had an undergraduate education at home or abroad and 4 if the CEO had postgraduate education at home or abroad. Politically Connected CEO takes the value 1 if the CEO was a party secretary, deputy party secretary, party committee member or executive member or a party member and 0 if the CEO is not a party member. Columns 1 to 6 present results for the full sample and columns 7 to 12 present. Hazard Lambdas are reported for each of the second stages. Panel A: Expanded Selection Model
1 2 3 4 5 6 7 8
Sales Growth [2001-2002]
Selection Equation
Sales Growth [2001-2002]
Selection Equation
Profit Reinvestment rate in 2002
Selection Equation
Productivity Growth
[2001-2002] Selection Equation
Bank Dummy 0.278c 0.328b 0.242a 0.073 [0.145] [0.144] [0.075] [0.191] Collateral 0.869a 0.860a 0.849a 0.827a [0.088] [0.089] [0.092] [0.104] Sales Growth [1999-2001] -0.278a 0.368a [0.045] [0.098] Bank Corruption -0.058 -0.199 -0.066 -0.182 0.017 -0.204 0.087 -0.07 [0.066] [0.144] [0.065] [0.145] [0.034] [0.150] [0.082] [0.163]

62
1 2 3 4 5 6 7 8
Sales Growth [2001-2002]
Selection Equation
Sales Growth [2001-2002]
Selection Equation
Profit Reinvestment rate in 2002
Selection Equation
Productivity Growth
[2001-2002] Selection Equation
Government Help Dummy 0.003 0.324a 0.016 0.307a 0.04 0.311a -0.026 0.393a [0.054] [0.100] [0.053] [0.101] [0.027] [0.104] [0.068] [0.114] Loan from Group/Holding Co. 0.013 0.272c 0.04 0.243 -0.086b 0.282c 0.028 0.309c [0.076] [0.147] [0.075] [0.148] [0.039] [0.157] [0.099] [0.175] Loan Guarantee Program -0.024 0.127 -0.019 0.112 -0.013 0.105 0.017 0.059 [0.054] [0.111] [0.053] [0.112] [0.027] [0.116] [0.067] [0.129] Located in an Export Processing -0.036 0.237b -0.01 0.193c 0.039 0.219b -0.077 0.299a [0.048] [0.100] [0.048] [0.101] [0.025] [0.104] [0.061] [0.114] Property Rights Protection 0 0 0 0 0 0 0 0.002 [0.001] [0.001] [0.001] [0.001] [0.000] [0.001] [0.001] [0.001] CEO Education Level 0.012 0.047 0.036 0.017 -0.005 0.065 -0.054 0.04 [0.036] [0.077] [0.036] [0.078] [0.019] [0.082] [0.048] [0.093] Politically Connected CEO -0.051 0.1 -0.046 0.099 0.029 0.086 0.016 0.098 [0.045] [0.100] [0.045] [0.101] [0.023] [0.104] [0.058] [0.115] Small -0.187a 0.148 -0.294a 0.293 0.056 0.109 -0.105 0.047 [0.071] [0.176] [0.073] [0.185] [0.036] [0.181] [0.102] [0.225] Medium -0.229a 0.261 -0.356a 0.450b 0.044 0.229 -0.027 0.212 [0.071] [0.170] [0.074] [0.182] [0.036] [0.174] [0.098] [0.210] Large -0.235a 0.481a -0.385a 0.692a 0.011 0.442b -0.071 0.338 [0.076] [0.169] [0.081] [0.184] [0.038] [0.173] [0.101] [0.206] Very Large -0.386a 0.818a -0.566a 1.060a 0.022 0.803a -0.092 0.728a [0.087] [0.176] [0.095] [0.193] [0.045] [0.180] [0.116] [0.216] Medium 0.014 -0.053 -0.036 0.021 0.004 -0.047 -0.146b -0.134 [0.053] [0.117] [0.053] [0.120] [0.027] [0.121] [0.069] [0.139] Old -0.001 0.062 -0.067 0.145 -0.059c 0.055 -0.119 -0.001 [0.068] [0.148] [0.069] [0.151] [0.035] [0.154] [0.089] [0.178] Corporations -0.031 0.146 -0.027 0.144 0.062b 0.123 -0.031 0.125 [0.048] [0.101] [0.047] [0.101] [0.024] [0.106] [0.061] [0.116] Cooperative -0.179a 0.011 -0.215a 0.066 0.01 0.038 -0.012 0.155 [0.063] [0.143] [0.062] [0.145] [0.032] [0.148] [0.082] [0.170] State -0.016 0.062 -0.032 0.084 -0.007 0.115 0.032 0.1 [0.055] [0.117] [0.055] [0.118] [0.029] [0.124] [0.074] [0.144] 4 to 6 Competitors 0.07 0.433b 0.061 0.427b 0.052 0.471b -0.144 0.438b [0.086] [0.180] [0.085] [0.181] [0.044] [0.189] [0.106] [0.203] 7 to 15 Competitors -0.004 0.329c -0.031 0.362b 0.021 0.368b -0.154 0.448b [0.081] [0.175] [0.081] [0.176] [0.042] [0.183] [0.102] [0.199] 16 to 100 Competitors -0.038 0.25 -0.071 0.278c 0.021 0.295c -0.133 0.256 [0.074] [0.162] [0.073] [0.163] [0.038] [0.171] [0.092] [0.186]

63
1 2 3 4 5 6 7 8
Sales Growth [2001-2002]
Selection Equation
Sales Growth [2001-2002]
Selection Equation
Profit Reinvestment rate in 2002
Selection Equation
Productivity Growth
[2001-2002] Selection Equation
Over 100 Competitors -0.136c 0.236 -0.157b 0.256 0.026 0.247 -0.230b 0.322c [0.071] [0.158] [0.070] [0.159] [0.036] [0.167] [0.092] [0.185] Hazard Lambda -0.107 -0.028 -0.116b -0.061 [0.089] [0.078] [0.046] [0.117] Observations 1229 1229 1225 1225 1118 1118 874 874
c significant at 10%; b significant at 5%; a significant at 1% Panel B: Access to finance
1 2 3 4 5 6
Sales Growth [2001-2002]
Selection Equation
Profit Reinvestment rate in 2002
Selection Equation
Productivity Growth
[2001-2002] Selection Equation
Access Dummy 0.842b 0.652b 0.618 [0.403] [0.262] [0.455] Collateral 0.263a 0.221a 0.289a [0.072] [0.076] [0.085] Small -0.172b -0.165 0.120a -0.185 -0.083 -0.06 [0.073] [0.123] [0.045] [0.130] [0.094] [0.163] Medium -0.251a -0.008 0.065 0.047 -0.078 0.068 [0.069] [0.122] [0.042] [0.128] [0.092] [0.157] Large -0.226a -0.086 0.064 -0.078 -0.127 -0.074 [0.070] [0.123] [0.041] [0.129] [0.090] [0.157] Very Large -0.283a -0.177 0.127a -0.163 -0.064 -0.135 [0.074] [0.129] [0.044] [0.136] [0.094] [0.164] Medium -0.087 0.290a -0.063 0.287a -0.171b 0.267b [0.066] [0.098] [0.040] [0.102] [0.080] [0.120] Old -0.136 0.363a -0.133a 0.353a -0.132 0.310b [0.085] [0.120] [0.051] [0.125] [0.098] [0.147] Corporations 0.022 -0.132 0.109a -0.136 -0.024 -0.147 [0.050] [0.083] [0.030] [0.087] [0.060] [0.098] Cooperative -0.157b 0.04 0.012 0.045 -0.012 0.023 [0.064] [0.108] [0.038] [0.114] [0.077] [0.129] State -0.042 0.048 -0.012 0.041 0.05 0.064 [0.057] [0.094] [0.034] [0.100] [0.074] [0.119]

64
1 2 3 4 5 6
Sales Growth [2001-2002]
Selection Equation
Profit Reinvestment rate in 2002
Selection Equation
Productivity Growth
[2001-2002] Selection Equation
4 to 6 Competitors 0.108 -0.168 0.101c -0.19 -0.04 -0.131 [0.089] [0.151] [0.054] [0.158] [0.104] [0.174] 7 to 15 Competitors 0.013 -0.01 0.023 -0.068 -0.1 0.111 [0.083] [0.142] [0.050] [0.149] [0.099] [0.163] 16 to 100 Competitors -0.02 -0.042 0.036 -0.062 -0.082 -0.037 [0.076] [0.130] [0.045] [0.137] [0.091] [0.152] Over 100 Competitors -0.096 -0.124 0.046 -0.138 -0.133 -0.049 [0.074] [0.124] [0.044] [0.131] [0.089] [0.148] Hazard Lambda -0.523b -0.4b -0.413
[0.244] [0.158] [0.276] Observations 1566 1566 1413 1413 1102 1102
c significant at 10%; b significant at 5%; a significant at 1%

65
Table 7: Financing Proportions of New Investments and Working Capital – Bank Financing versus Informal Financing
The estimated model is: Sales Growth/Reinvestment Rate/Productivity Growth = α + β1Bank Financing or Self Financing1 or Self Financing2 + β2Small + β3 Medium + β4Large + β5Very Large + β6
Mid-Age + β7 Old + β8Corporations + β9Collectives + β10State Ownership + β11Competition Dummies + β12City Dummies. Sales Growth is defined as the log change in total sales and is computed from 2001 to 2002. Productivity Growth is defined as the log change in productivity where productivity is (Sales-Total Material Costs)/Total Number of Workers. Productivity Growth is computed from 2001 to 2002. Reinvestment Rate is the share of net profits re-invested in the establishment in 2002. Bank Financing Dummy takes the value 1 if the firm said it had a loan from a bank or financial institution AND (bank financing of new investments was greater than 50% OR bank financing of working capital was greater than 50%). Bank Financing takes the value 0 if (the firm said it had no loan from a bank or financial institution OR said it had no overdraft facility or line of credit) AND (bank financing of new investments was equal to 0% AND bank financing of working capital was equal to 0%). Self Financing1 takes the value 1 if the sum of informal financing and other financing of new investments was greater than 50% OR the sum of informal financing and other financing of working capital was greater than 50%. Self Financing1 takes the value 0 if the sum of informal and other financing of new investments is equal to 0 % AND the sum of informal and other financing of working capital is equal to 0%. Self Financing2 takes the value 1 if the sum of informal, family, and other financing of new investments was greater than 50% OR the sum of informal, family and other financing of working capital was greater than 50%. Self Financing2 takes the value 0 if the sum of informal, family and other financing of new investments is equal to 0 % AND the sum of informal, family and other financing of working capital is equal to 0%. Firm Size Dummies are quintiles of total firm sales in 1999. Small, Medium, Large and Very Large dummies take the value 1 if the firm is in the second, third, fourth or fifth quintile respectively of firm sales. Mid-age is a dummy variable that takes the value 1 if the firm is between 5 and 20 years of age and Old is a dummy variable that takes the value 1 if the firm is greater than 20 years old. Corporation Dummy takes the value 1 if the firm is organized as a corporation (public or private) and 0 otherwise. Cooperatives/Collectives Dummy takes the value 1 if the firm is organized as a Cooperative or a Collective. State Ownership Dummy takes the value 1 if the state owns more than 50% of the company. 4 to 6 Competitors, 7 to 15 Competitors, 16 to 100 Competitors and Over 100 Competitors are dummy variables that take the value 1 if the firm has the corresponding number of competitors in its main business line in the domestic market. The omitted category is 1 to 3 Competitors. We use OLS regressions with robust standard errors. Panel A: Bank Financing
1 2 3 4 5 6 Full Sample Drop Public Corporations and State Owned Companies
Sales Growth [2001-2002]
Profit Reinvestment rate
in 2002
Productivity Growth [2001-
2002] Sales Growth [2001-2002]
Profit Reinvestment rate
in 2002
Productivity Growth [2001-
2002] Bank Financing Dummy 0.083c 0.103a 0.053 0.085c 0.110a 0.071 [0.044] [0.025] [0.057] [0.050] [0.030] [0.059] Observations 1628 1441 1081 1188 1042 831 R-squared 0.035 0.091 0.022 0.036 0.109 0.032
c significant at 10%; b significant at 5%; a significant at 1%

66
Panel B: Self Financing 1 2 3 4 5 6 7 8 9 10 11 12 Full Sample Drop Public Corporations and State Owned Companies
Sales Growth [2001-2002]
Sales Growth [2001-2002]
Profit Reinvestment rate in 2002
Profit Reinvestment rate in 2002
Productivity Growth
[2001-2002]
Productivity Growth
[2001-2002]
Sales Growth [2001-2002]
Sales Growth [2001-2002]
Profit Reinvestment rate in 2002
Profit Reinvestment rate in 2002
Productivity Growth
[2001-2002]
Productivity Growth
[2001-2002]
Self Financing1 -0.02 -0.068a 0.095c -0.026 -0.060a 0.072 [0.035] [0.016] [0.051] [0.044] [0.020] [0.059] Self Financing2 -0.013 -0.057a 0.113b -0.009 -0.042b 0.104c [0.034] [0.016] [0.049] [0.043] [0.020] [0.057] Observations 1997 1963 1761 1727 1328 1300 1417 1385 1249 1217 992 966 R-squared 0.035 0.034 0.075 0.074 0.023 0.026 0.037 0.036 0.085 0.085 0.026 0.03
c significant at 10%; b significant at 5%; a significant at 1%

67
Table 8: Bank Financing and Firm Performance – Robustness using Median Regressions
The estimated model is: Sales Growth/Productivity Growth = α + β1BankDummy+ β2Small + β3 Medium + β4Large + β5Very Large + β6 Mid-Age + β7 Old + β8Corporations + β9Collectives + β10State Ownership + β11Competition Dummies + β12City Dummies. Sales Growth is defined as the log change in total sales and is computed from 2001 to 2002 and from 1999 to 2002. Productivity Growth is defined as the log change in productivity where productivity is (Sales-Total Material Costs)/Total Number of Workers. Productivity Growth is computed from 2001 to 2002 and from 1999 to 2002. Bank Dummy takes the value 1 if the firm said it had a loan from a bank or financial institution and 0 if the firm said it had no bank loan and had no overdraft facility or line of credit. Firm Size Dummies are quintiles of total firm sales in 1999. Small, Medium, Large and Very Large dummies take the value 1 if the firm is in the second, third, fourth or fifth quintile respectively of firm sales. Mid-age is a dummy variable that takes the value 1 if the firm is between 5 and 20 years of age and Old is a dummy variable that takes the value 1 if the firm is greater than 20 years old. Corporation Dummy takes the value 1 if the firm is organized as a corporation (public or private) and 0 otherwise. Cooperatives/Collectives Dummy takes the value 1 if the firm is organized as a Cooperative or a Collective. State Ownership Dummy takes the value 1 if the state owns more than 50% of the company. 4 to 6 Competitors, 7 to 15 Competitors, 16 to 100 Competitors and Over 100 Competitors are dummy variables that take the value 1 if the firm has the corresponding number of competitors in its main business line in the domestic market. The omitted category is 1 to 3 Competitors. Columns 1 to 5 present results for the full sample and columns 6 to 10 present results for a sample of firms that don’t include firms registered as publicly traded firms and state owned enterprises. We use median regressions.
1 3 4 5 6 8 9 10 Full Sample Drop Public Corporations and State Owned Companies
Sales Growth [2001-2002]
Productivity Growth [2001-2002]
Sales Growth [1999-2002]
Productivity Growth [1999-2002]
Sales Growth [2001-2002]
Productivity Growth [2001-2002]
Sales Growth [1999-2002]
Productivity Growth [1999-2002]
Bank Dummy 0.063a 0.046 0.075a 0.03 0.065b 0.033 0.076a 0.017 [0.020] [0.032] [0.016] [0.020] [0.029] [0.034] [0.019] [0.025] Observations 2145 1456 2135 1423 1535 1099 1528 1072
c significant at 10%; b significant at 5%; a significant at 1%

68
Table 9: Type of Collateral Posted and its determinants In Panel A, we present the mean and median percentage shares of the type of collateral posted by firms. Panel B documents the contribution of firm and city and provincial variables to the McKelvey and Zavoina(1975) R-square of the logistic regression model. The regression model in Panel B is Collateralij = City Effecti or Legal Environment Indexi+ Firm Sizej (or Fixed Assetj) (or Agej) (or Legal Statusj) + City-Firm Interaction Effectij. The City Effect is captured by city dummies. The Legal Environment Index is based on information from Fan and Wang (2004), capturing (1) the development of market intermediaries using the ratio of the number of lawyers and registered accountants to population; (2) protection of the legal rights of producers using the frequency of economic crimes normalized by GDP; (3) protection of property rights using the average number of patents applied per engineer and the average number of patents approved per engineer; and (3) protection of consumers using the number of consumer complaints received by the Consumer Association. The Legal Environment Index is at the province level. The firm variables are defined as follows: Firm Size Dummies are quintiles of total firm sales in 1999. Age Dummies take the values 1 to 3 for age<5 years, 5 - 20 years and greater than 20 years old. Legal Status Dummies take the value 1 for corporations, 2 for state owned enterprises, 3 for cooperatives and collectives and 4 for all other legal status. Fixed Asset Dummies are quintiles of fixed assets in the year 2000. Panel A: Type of Collateral Posted
Land and Buildings Machinery
Intangible Assets (accounts
receivable, inventory)
Personal Assets of owner/manager
Mean 63.11 17.87 4.89 10.3 Median 80 0 0 0
Panel B: Determinants of Collateral - ANOVA
Size Dummies Fixed Assets
Dummies Age Dummies Legal Status
Dummies City Effect 6.4 6.4 6.4 6.4 Firm Effect 7.2 10 0.6 0.3 Interaction 27.1 45.7 3.9 4.6 Total 40.7 62.1 10.9 11.3 Legal Environment 5 5 5 5 Firm Effect 7.8 10.6 0.7 0.4 Interaction 27.3 37.5 4.3 3.7 Total 40.1 53.1 10 9.1