Embed Size (px)
Citation preview

I:\MSC\83\INF-8.doc
For reasons of economy, this document is printed in a limited number. Delegates are kindly asked to bring their copies to meetings and not to request additional copies.
INTERNATIONAL MARITIME ORGANIZATION
IMO
E
MARITIME SAFETY COMMITTEE 83rd session Agenda item 21
MSC 83/INF.8 3 July 2007 ENGLISH ONLY
FORMAL SAFETY ASSESSMENT
FSA – container vessels
Details of the Formal Safety Assessment
Submitted by Denmark
SUMMARY
Executive summary:
This document is related to document MSC 83/21/2 entitled “FSA – container vessels” and provides further details for that study.
Action to be taken:
Paragraph 2
Related document:
MSC 83/21/2
Introduction 1 Document MSC 83/21/2 submitted by Denmark reports the results of a high level FSA application on container vessels that has been performed within the research project SAFEDOR. Supplementary details on that study are provided in the annex of this document, in particular related to:
.1 risk assessment, and .2 cost benefit analysis.
Action requested of the Committee 2 The Committee is invited to note the information provided in this document in relation to its consideration of document MSC 83/21/2.
***

MSC 83/INF.8
I:\MSC\83\INF-8.doc
ANNEX
DETAILS ON FORMAL SAFETY ASSESSMENT OF
CONTAINER VESSELS
Contents
1 INTRODUCTION...................................................................................................................... 2 1.1 SCOPE AND BOUNDARIES ......................................................................................................... 2 1.2 GENERIC MODEL ..................................................................................................................... 2 2 METHOD OF WORK............................................................................................................... 6 2.1 TEAM ....................................................................................................................................... 6 2.2 HAZID .................................................................................................................................... 6 2.3 RISK ANALYSIS ........................................................................................................................ 6 2.4 RISK CONTROL OPTIONS ......................................................................................................... 7 2.5 COST BENEFIT ASSESSMENT.................................................................................................... 7 2.6 RECOMMENDATIONS FOR DECISION MAKING......................................................................... 8 2.7 COMMON ASSUMPTIONS ......................................................................................................... 8 2.8 RISK ACCEPTANCE .................................................................................................................. 8 3 HAZID RESULTS ................................................................................................................... 10
4 RISK ANALYSIS..................................................................................................................... 11 4.1 ACCIDENT STATISTICS........................................................................................................... 11 4.2 ACCIDENT SCENARIOS........................................................................................................... 12 4.3 PROBABILITY ASSESSMENT ................................................................................................... 14 4.4 CONSEQUENCE ASSESSMENT................................................................................................. 15 4.5 RISK SUMMATION .................................................................................................................. 32 4.6 UNCERTAINTIES..................................................................................................................... 34 5 RISK CONTROL OPTIONS.................................................................................................. 36 5.1 IDENTIFICATION .................................................................................................................... 36 5.2 DETAILED DESCRIPTION ....................................................................................................... 37 6 COST BENEFIT ASSESSMENT........................................................................................... 43 6.1 METHODOLOGY..................................................................................................................... 43 6.2 RISK REDUCTION ................................................................................................................... 44 6.3 COSTS OF IMPLEMENTATION AND ECONOMIC BENEFITS.................................................... 45 6.4 GCAF AND NCAF................................................................................................................. 46 7 REFERENCES......................................................................................................................... 47
APPENDIX....................................................................................................................................... 49

MSC 83/INF.8 ANNEX Page 2
I:\MSC\83\INF-8.doc
1 INTRODUCTION 1.1 Scope and boundaries This high level Formal Safety Assessment addresses a limited number of identified major hazards and accident scenarios. Accidents associated with piracy or war losses are not considered in the study. The accident statistics used reflect a limited time period and input frequency figures are taken as average figures for the time period. The actual safety level of today is, however, also influenced by a number of newly introduced risk control options and of course also by today’s actual composition of the container vessel population and general characteristics of ship traffic pattern. Detailed trend analysis and estimations on the actual risk reduction effects from recently introduced options may contribute to higher accuracy of the predicted present safety level, but is beyond the scope of this high level assessment. This risk assessment addresses all types of container vessels (UCC) of 100 GT and above. The results from the risk analysis are currently the best estimate of the actual risk level for the various accident categories, and there are uncertainties associated with these results. The assessment is based on introduction of one risk control option (RCO) at a time only. Introduction of one RCO will lead to higher NCAF/GCAFs for other RCOs addressing the same hazards. However, this dependency of the different RCOs has not been accounted for in this study. The economic benefits of introducing a measure are mainly accounted for in terms of reduced accident costs. The assessments are based on various assumptions and the values used in the calculations should be regarded as somewhat uncertain. However, efforts have been made to explicitly state all relevant assumptions for the sake of transparency. 1.2 Generic model Container vessel This study is limited to container ships only, where a container ship is defined as a sea-going vessel specifically designed, constructed and equipped with the appropriate facilities for carriage of cargo containers. These containers are stowed in cargo spaces, i.e. in cargo holds below or above deck. A fully cellular containership carries only containers. It has cell-guides under deck and necessary fittings and equipment on deck. It is important to note that ships differ in their equipment installed for loading and unloading. When a ship is equipped with onboard cranes, loading und unloading of containers can proceed without shore-side cranes or bridges. Such a ship with onboard cranes is commonly referred to as a “geared ship”. While the larger containerships usually do not have cranes onboard, smaller ships may have. Those smaller ships often operate in areas where the ports are small and not technically equipped with container terminals or sometimes not even with shored-based cranes. An open top containership is a vessel designed for the carriage of containers in holds that are not fitted with hatch covers. In cross-section, it is “U” shaped, with a double bottom and high coamings on the upper deck to protect the cargo holds and without a complete deck above the moulded draft. A complete deck is one which extends from stem to stern and side-to-side at all points of its length.

MSC 83/INF.8 ANNEX
Page 3
I:\MSC\83\INF-8.doc
In order to issue a class notation “CONTAINER SHIP”, approval and/or testing of lashing elements according to the classification society’s rules, as well as the approval of container stowage and lashing plans is required /1/. In the following discussion only fully cellular containerships are considered. They include container ships where a number of refrigerated (or reefer) containers can be placed in dedicated positions with electric connection, so-called reefer-plugs. These places can be on deck or in hold, but no reefers will be stowed at the outer row. General purpose ships capable of carrying containers as well as other combined carriers are excluded as their number is fairly small compared to full container carriers. A basic assumption is that a container ship is built according to technical regulations and rules of a recognized classification society. Containers The most common type of container is the general purpose container designed for homogeneous loads. There are other types of containers, e.g. reefer and ducted reefer containers that need a connection to an onboard cooling unit. Some containers have a controlled atmosphere. Other container types include open-top, hard-top, platform, flat racks - or foldable, tank container (with outer frame), isolating, cooling, bulk container, and special purpose, e.g. for dangerous goods, partially with own cooling generator. There are two standard sizes for containers: 20 and 40 foot. These are referred to as Twenty-Foot Equivalent Unit (TEU) and Forty-Foot Equivalent Unit (FEU), respectively. Other sizes exist, but are much less common and are therefore not considered within this study. Container shipping and world fleet today The first container ships built in the 1950s were converted tankers. Subsequently, dedicated designs for container vessels have been developed. Today, there is more than 50 years’ experience in designing, building and operating container vessels. The number of ships has been continuously growing over the last 15 years. As of January 2007, the world container fleet consisted of 3,875 ships of 100 GT and above, comprising some 10% of the total merchant fleet /2/. The total capacity and total tonnage of this fleet are approximately 9,400,000 TEU and 127,000,000 tonnes deadweight, respectively. In 2006, 325 container ships with an overall capacity of 1,245,304 TEU were delivered. During the year 2005, the fully cellular container fleet grew by 13.5 per cent (based on TEU). Compared with 1996, the fully cellular container fleet has more than doubled its TEU capacity, whereby the disproportionate increase of the TEU capacity indicates the trend towards larger container ships. Another 1,180 vessels are in the order books of the ship yards. The world container fleet is relatively young. On average a container vessel is 11.6 years old. 71% of the fleet, 78% of the total deadweight tonnage, and 81% of the total capacity were built less than 16 years ago. Container ships can be grouped by their size, capacity and main dimensions. Typical categories are presented in Table 1, which displays total values and shares for number, capacity and tonnage.
MSC 83/INF.8 ANNEX Page 4
I:\MSC\83\INF-8.doc
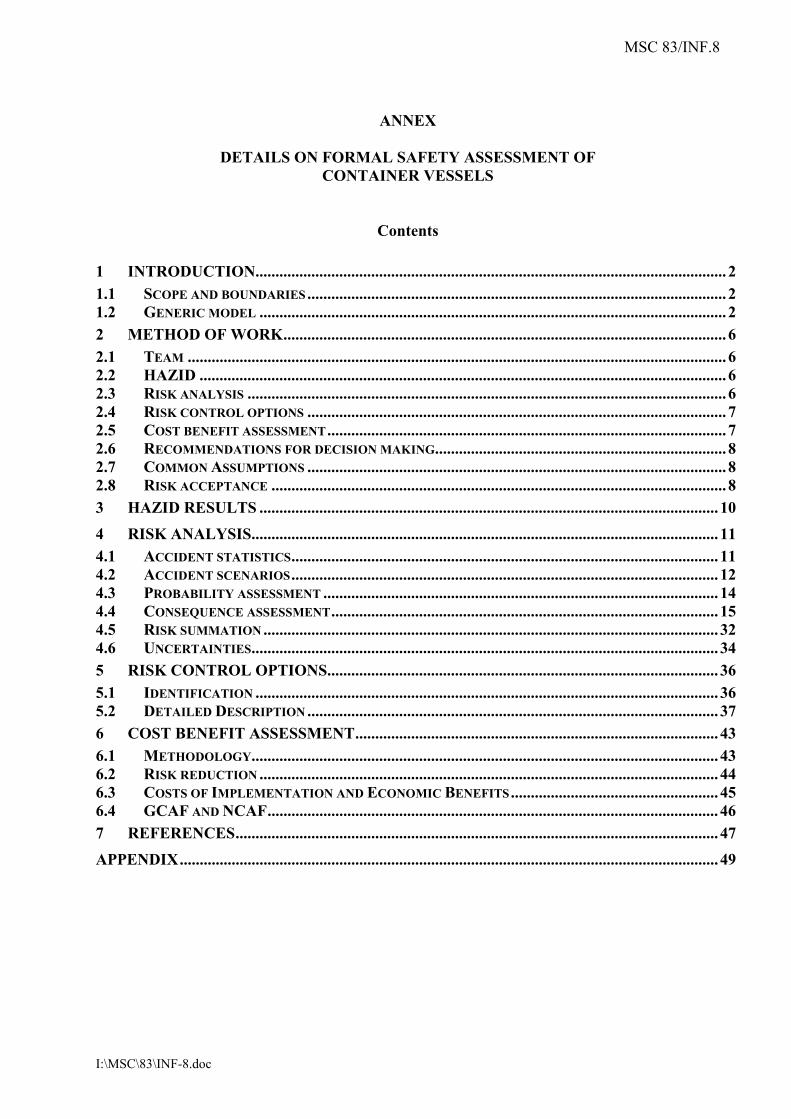
Table 1: Breakdown of container vessel fleet [/2/, January 2007]
Total Share AverageCategory Number Capacity
(TEU) Tonnage Number Capacity
(TEU) Tonnage Capacity
(TEU) Post-Panamax 831 4,684,326 59,961,119 21.4% 49.8% 47.0% 5,637Panamax 297 1,015,287 13,717,507 7.7% 10.8% 10.7% 3,418Sub-Panamax 646 1,626,273 23,201,565 16.7% 17.3% 18.2% 2,517Handysize 1,036 1,463,333 21,540,685 26.7% 15.5% 16.9% 1,412Feedermax 690 506,398 7,218,570 17.8% 5.4% 5.7% 734Feeder 375 115,579 2,052,578 9.7% 1.2% 1.6% 308Total 3,875 9,411,196 127,692,024 100.0% 100.0% 100.0% 2,429 While the average capacity is 2,400 TEU, an increasing number of ships with more than 8,000 TEU capacity are on order, some as large as 12,500 TEU. For container vessels, there are two main operational patterns. Line operation typically involves ships with large transportation capacities. They sail on a fixed route with a limited number of ports according to a schedule with fixed arrival and departures times. These schedules enable long term planning for the transport of large quantities. Their operating profile includes fewer stays in port and more open sea voyage. Loading and unloading requires significant time. Major line trades are Europe – North America and Europe – East Asia. Feeder operation typically involves much smaller ships on short distances, e.g. along coastlines. They are characterized by frequent port calls. Their routes, cargo and departure times are dominated by short term demands. Additionally, they are required for areas with limitations in draught or breadth. According to the figures above, the two segments are equally important. While large line vessels (Panamax, Post-Panamax) provide nearly 60% of the total transport capacity, small feeder vessels (Feeder, FeederMax, HandySize) comprise nearly 55% of the total number of ships. Reference vessels For this study, two representative vessels – one feeder and one ocean going vessel – were selected as reference ships for calculations during risk assessment and cost benefit analysis. In some cases the discussion is separated for the two main categories but for most calculations, average values of main particulars and other features are used. The two reference designs are briefly described in Figure 1, Figure 2 and Table 2.

MSC 83/INF.8 ANNEX
Page 5
I:\MSC\83\INF-8.doc
Figure 1: Feeder vessel – General arrangement plan, side and top view
Figure 2: 4,400 TEU Post-Panamax container vessel, side view
Table 2: Comparison reference vessels of generic container ship
Vessel 1 Vessel 2 Operating Profile Feeder Liner Capacity (TEU) 1,706 4,444 - in hold 652 2,051 - on deck 1,054 2,393 - at 14 t homog. load 1,250 3,100 Length (m) 173 271 Deadweight (t) 21,750 58,255 Speed (kn) 20.2 25.5 Crew 20 20 Market price 2005, /35/ $36,000,000 $67,000,000
MSC 83/INF.8 ANNEX Page 6
I:\MSC\83\INF-8.doc
2 METHOD OF WORK 2.1 Team The FSA methodology outlined in the FSA guidelines for the IMO rule-making process /3/ has been used in this study. The FSA application has been carried out as a joint effort between Germanischer Lloyd (Germany), Aker Yards (Germany), SSPA (Sweden), and Peter Döhle Schiffahrts-KG (Germany) and the project team has comprised risk analysts, naval architects and other experts from the partners above. Technical experts have been extensively consulted for engineering judgements, etc. throughout the work with the FSA. The work was conducted within the SAFEDOR project /4/. The FSA commenced with HAZID meetings in June 2005, and the final report was completed in July 2006. Three HAZID sessions were organized in June 2005. Subsequently, harmonized risk and severity estimates were established by using the Delphi method over email. Additionally, a number of co-ordination meetings were held between the partners. Technical workshops involving additional experts were arranged to identify and prioritize risk control options. After an internal review by the SAFEDOR Steering Committee, an additional workshop with technical experts was organized in May 2007, to develop a risk model for the accident category “heavy weather” which included estimates of frequency and consequences. 2.2 HAZID The HAZID (FSA step 1) was conducted as a series of three moderated expert meetings including brainstorming sessions, each of them focussed on one operational state (phase of operation). The following operational states were considered most relevant for a high-level analysis:
• Loading and unloading at a terminal; • Operation in port, restricted and coastal waters; • Open sea transit.
A Failure Mode, Effects and Criticality Analysis (FMECA) technique was used to record potential causes and consequences for each hazard identified. The identified hazards were combined into scenarios. Afterwards, the frequencies and consequences were estimated by the participants and a consolidated result was compiled using a Delphi method to streamline the individual assessments. Frequency and severity index tables from the FSA guidelines /3/ were used in a slightly extended format, allowing better granularity and reflecting more realistic values for loss of ship or cargo as well as damage to the environment. The outcome of the HAZID was a risk register containing the hazards and their subjective risk rankings from which a list of the highest ranked hazards could be extracted. 2.3 Risk analysis The risk analysis (FSA step 2) comprised an investigation of accident statistics for container vessels as well as risk modelling utilizing event tree methodology for the most important accident scenarios. Based on the survey of accident statistics and the outcome of the HAZID, generic accident scenarios were selected for further risk analysis.

MSC 83/INF.8 ANNEX
Page 7
I:\MSC\83\INF-8.doc
The risk analysis contained two parts, a frequency assessment and a consequence assessment. For the frequency assessment, the initiating frequencies of generic incidents were estimated using accident statistics for the selected accident scenarios. The estimates arrived at in this way are comparable to those obtained in similar studies for other ship types. The consequence assessment was performed using event tree methodology. First, conceptual risk models were developed for each accident category and event trees were constructed accordingly. The event trees were subsequently populated using different techniques for each branch probability according to what was deemed the best approach in each case. The approaches employed included accident statistics, damage statistics, fleet statistics, simplified calculations and modelling and expert opinion elicitation. The frequency and consequence assessments provided the risk associated with the different generic accident scenarios and these risks were summarized to estimate the individual and societal risks to human life and risks to the environment resulting from the operation of container vessels. 2.4 Risk control options The purpose of step 3 of an FSA is to propose new, effective and practical RCOs comprising the following principal stages:
• Focusing on risk areas needing control; • Identifying potential risk control measures (RCOs); • Evaluating the effectiveness of the RCOs in reducing risk.
Specific risk control options were identified, described, and prioritized during workshops involving additional experts. Existing measures and risk control options identified by similar FSA studies for other ship types were reviewed for applicability. Subsequently, the identified risk control options were screened by the project team taking into account the number of scenarios affected as well as the potential for risk reduction, resulting in a list of risk control options for further evaluation and cost benefit assessment. Both “general approaches” which controls risk by controlling the likelihood of accidents and “distributed approaches” which provides control of escalation of accidents are considered. 2.5 Cost benefit assessment The purpose of step 4 of an FSA is to calculate and compare costs and benefits associated with the implementation of each risk control option identified in step 3. The cost effectiveness was estimated in terms of the Gross Cost of Averting a Fatality (GCAF) and the Net Cost of Averting a Fatality (NCAF) for each risk control option. Related costs are expressed as life cycle costs and include initial investment, operating, training, inspection, certification, decommissioning, etc. The cost benefit assessment comprised the following stages, with considerations of the risk levels assessed in step 2:
• Arrange the RCOs, defined in step 3, in a way to facilitate understanding of the resulting costs and benefits;

MSC 83/INF.8 ANNEX Page 8
I:\MSC\83\INF-8.doc
• Calculate / estimate the pertinent costs, risk reductions and economic benefits for selected RCOs using the event trees developed during the risk analysis;
• Estimate and compare the cost effectiveness of each option, in terms of the cost per unit risk reduction by dividing the net cost by the risk reduction achieved as a result of implementing the option;
• Rank the RCOs from a cost-benefit perspective in order to facilitate the decision-making recommendations in step 5.
In addition to risk reduction, the implementation of a RCO might result in economic benefits. Within this study, economic benefits are limited to reduced loss of property (ship and cargo) due to accidents. Other potential benefits resulting from an RCO, such as reduced downtime, reduced maintenance costs, and loss of hire, were not accounted for. Hence the NCAF values received are conservative and benefits would increase even further if consequential costs of environmental damages were taken into account. 2.6 Recommendations for decision making Recommendations for decision-making (FSA step 5) were developed based on the outcome of the cost benefit assessment for risk control options in step 4. An established decision criterion based on GCAF, Gross Cost of Averting a Fatality, was used as a decision criterion for ranking and recommendation of risk reduction options. 2.7 Common assumptions A number of common assumptions about basic input parameters were defined in order to provide consistent input to risk modelling and cost benefit analysis. The figures applied are given in the table below, but when using the event tree models individual figures may easily be varied.
Table 3: General common assumptions and estimation of basic input parameters
Input parameter Value Ship Value (newbuilding price) $51,750,000Payload capacity at 14t homog. Load 2,175 TEUFuel tank capacity 3,850 m³Ship crew 20Container value per TEU $20,000Share of dangerous cargo from total payload 6%Average amount of fuel in tanks (portion of capacity) 50%Interest rate for NPV calculation 5%
Payload capacity, newbuilding price, and fuel tank capacity are calculated as average values of both reference vessels, see Table 2. 2.8 Risk acceptance Individual risk In order to assess the risk as estimated by the risk analysis, appropriate risk acceptance criteria are needed. Such criteria regarding individual and societal risk were proposed in document MSC 72/16 /5/, based on figures published by the United Kingdom Health and Safety Executive.

MSC 83/INF.8 ANNEX
Page 9
I:\MSC\83\INF-8.doc
Table 4 presents the suggested acceptance levels for the individual risk to crew members, which have been used by various FSA studies since then. They are also used within this study, since there is no reason why container vessels should be considered differently.
Table 4: Individual risk levels for exposed crew members
Risk level Annual fatal risk Maximum tolerable risk for crew members 10-3 Negligible risk 10-6
Societal risk Risks below the tolerable risk, but above the negligible risk, should be made as low as reasonably practical (ALARP) by adopting cost effective risk reduction measures. Document MSC 72/16 also presents an approach for determining societal risk acceptance criteria for crew on particular vessel types based on the respective economic value of shipping. This approach is applied here using average daily charter rates of US$23,500 per day for a 2,500 TEU vessel. As a result, the economic value of a typical container vessel is estimated to be US$8.5 million per year. On that basis, the risk acceptance criteria illustrated in Figure 3 are derived.
1E-06
1E-05
1E-04
1E-03
1E-02
1E-01
1 10 100Number of fatalities [N]
Freq
uenc
y [F
] of N
or m
ore
fata
litie
s pe
rsh
ip y
ear
INTOLERABLE
NEGLIGIBLE
ALARP
Figure 3: Acceptance criteria for societal risk

MSC 83/INF.8 ANNEX Page 10
I:\MSC\83\INF-8.doc
3 HAZID RESULTS The HAZID was conducted as a series of three moderated expert sessions, each of them addressing a particular operational state – loading and unloading at berth; operations in port, restricted and coastal waters; and open sea voyage. Sixteen experts from six companies with backgrounds in design, operation, and regulation of container ships as well as in risk analysis participated. In total, 91 hazards in 22 scenarios were identified, recorded and ranked. Some scenarios were covered more than once. Each hazard was associated with a risk index based on qualitative judgement by the HAZID participants. The top ranked hazards for human safety are presented in Table 5. In the same way, hazards were estimated with respect to potential damage to the environment.
Table 5: HAZID results: top-ranked hazards for human safety
Id Hazard Scenario Operational state Riskindex
I-4.3 Bad working conditions during lashing (icy, wet floor)
Lashing Loading/unloading 7.4
III-1.9 Wrong decision in course, speed, timing, etc. Large ship motions
Open sea 7.2
I-7.1 Communication problems Human error Loading/unloading 7.0 III-5.1 Stability problems caused by ballast water
exchange Structural failure
Open sea 7.0
III-5.1 Overpressure in tanks caused by ballast water exchange
Structural failure
Open sea 7.0
III-1.6 Extreme pitch motions Large ship motions
Open sea 7.0
II-2.3 Contact after navigational failure Contact Restricted waters 6.6 II-3 Grounding after navigational failure Grounding Restricted waters 6.6 II-6.2 Plate buckling after damage by tug Structural
failure Restricted waters 6.5
III-7.1 Contact with floating object Contact Open sea 6.5 It should be noted that hazards identified for the lashing process do not necessarily involve the crew members, but often terminal workers instead. It is therefore considered to be an occupational hazard which is out of scope for this study. The ranking suggests, however, that those occupational hazards are serious issues that should be addressed separately. The output of the hazard identification process identified:
• 3 hazards with risk index RI > 9.0, • 4 hazards with risk index RI > 8.0, and • 42 hazards with risk index RI > 7.0,
related to the four risk types – human, environmental and property risks. Some hazards are listed for more than one risk type (life, environment, cargo and ship), for example hazard I-7.1 is represented in all four categories as a top hazard (RI > 7).
MSC 83/INF.8 ANNEX Page 11
I:\MSC\83\INF-8.doc
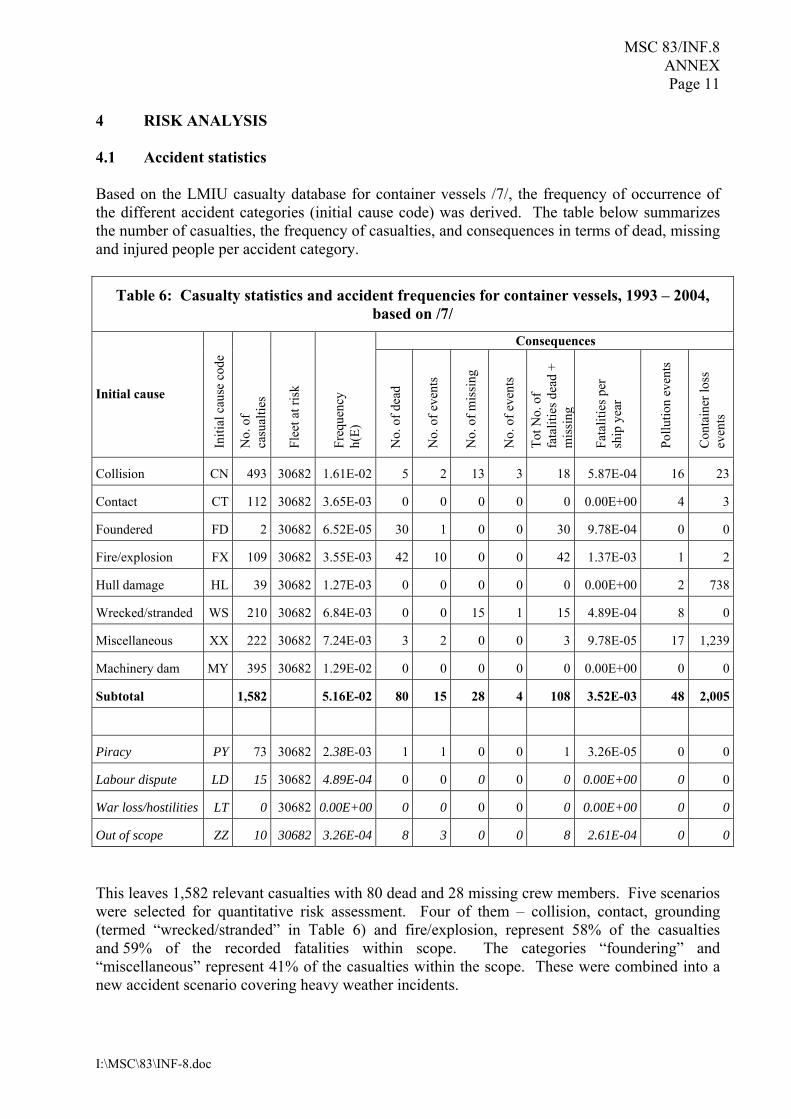
4 RISK ANALYSIS 4.1 Accident statistics Based on the LMIU casualty database for container vessels /7/, the frequency of occurrence of the different accident categories (initial cause code) was derived. The table below summarizes the number of casualties, the frequency of casualties, and consequences in terms of dead, missing and injured people per accident category.
Table 6: Casualty statistics and accident frequencies for container vessels, 1993 – 2004, based on /7/
Consequences
Initial cause
Initi
al c
ause
cod
e
No.
of
casu
altie
s
Flee
t at r
isk
Freq
uenc
y
h(E)
No.
of d
ead
No.
of e
vent
s
No.
of m
issi
ng
No.
of e
vent
s
Tot N
o. o
f fa
talit
ies d
ead
+ m
issi
n g
Fata
litie
s per
sh
ip y
ear
Pollu
tion
even
ts
Con
tain
er lo
ss
even
ts
Collision CN 493 30682 1.61E-02 5 2 13 3 18 5.87E-04 16 23
Contact CT 112 30682 3.65E-03 0 0 0 0 0 0.00E+00 4 3
Foundered FD 2 30682 6.52E-05 30 1 0 0 30 9.78E-04 0 0
Fire/explosion FX 109 30682 3.55E-03 42 10 0 0 42 1.37E-03 1 2
Hull damage HL 39 30682 1.27E-03 0 0 0 0 0 0.00E+00 2 738
Wrecked/stranded WS 210 30682 6.84E-03 0 0 15 1 15 4.89E-04 8 0
Miscellaneous XX 222 30682 7.24E-03 3 2 0 0 3 9.78E-05 17 1,239
Machinery dam MY 395 30682 1.29E-02 0 0 0 0 0 0.00E+00 0 0
Subtotal 1,582 5.16E-02 80 15 28 4 108 3.52E-03 48 2,005
Piracy PY 73 30682 2.38E-03 1 1 0 0 1 3.26E-05 0 0
Labour dispute LD 15 30682 4.89E-04 0 0 0 0 0 0.00E+00 0 0
War loss/hostilities LT 0 30682 0.00E+00 0 0 0 0 0 0.00E+00 0 0
Out of scope ZZ 10 30682 3.26E-04 8 3 0 0 8 2.61E-04 0 0
This leaves 1,582 relevant casualties with 80 dead and 28 missing crew members. Five scenarios were selected for quantitative risk assessment. Four of them – collision, contact, grounding (termed “wrecked/stranded” in Table 6) and fire/explosion, represent 58% of the casualties and 59% of the recorded fatalities within scope. The categories “foundering” and “miscellaneous” represent 41% of the casualties within the scope. These were combined into a new accident scenario covering heavy weather incidents.
MSC 83/INF.8 ANNEX Page 12
I:\MSC\83\INF-8.doc
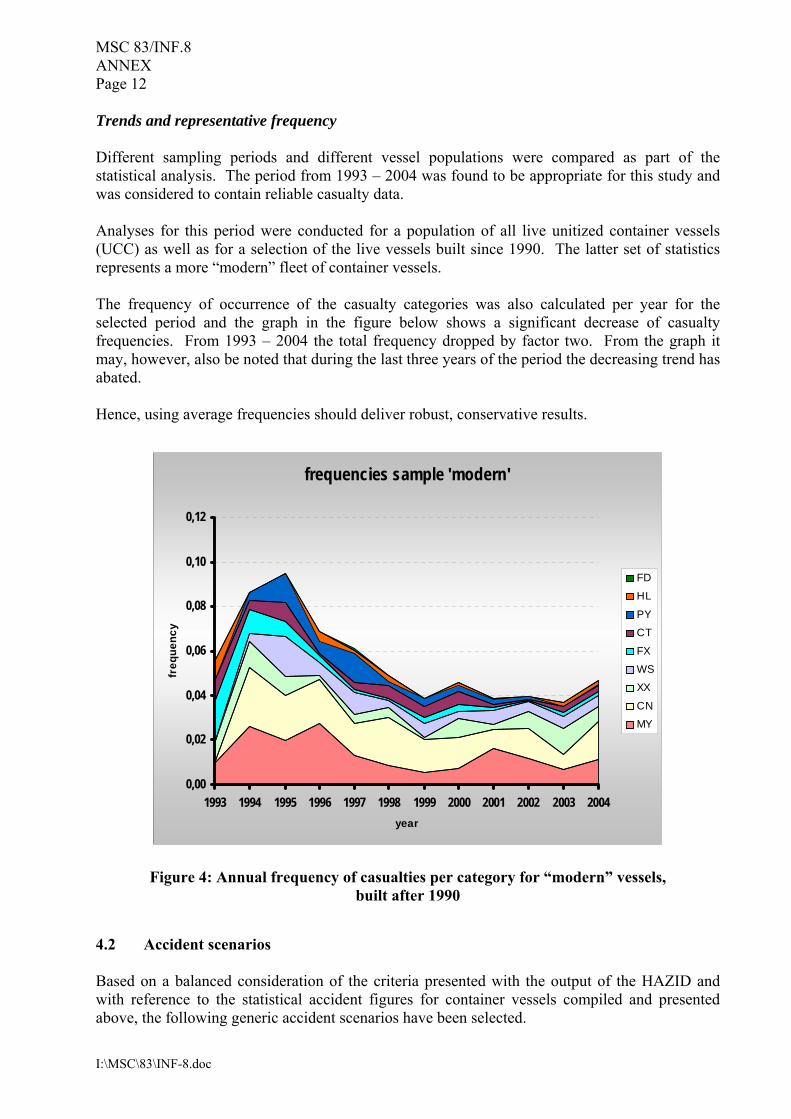
Trends and representative frequency Different sampling periods and different vessel populations were compared as part of the statistical analysis. The period from 1993 – 2004 was found to be appropriate for this study and was considered to contain reliable casualty data. Analyses for this period were conducted for a population of all live unitized container vessels (UCC) as well as for a selection of the live vessels built since 1990. The latter set of statistics represents a more “modern” fleet of container vessels. The frequency of occurrence of the casualty categories was also calculated per year for the selected period and the graph in the figure below shows a significant decrease of casualty frequencies. From 1993 – 2004 the total frequency dropped by factor two. From the graph it may, however, also be noted that during the last three years of the period the decreasing trend has abated. Hence, using average frequencies should deliver robust, conservative results.
frequencies sample 'modern'
0,00
0,02
0,04
0,06
0,08
0,10
0,12
1993 1994 1995 1996 1997 1998 1999 2000 2001 2002 2003 2004year
freq
uenc
y
FD
HL
PY
CT
FX
WS
XX
CN
MY
Figure 4: Annual frequency of casualties per category for “modern” vessels, built after 1990
4.2 Accident scenarios Based on a balanced consideration of the criteria presented with the output of the HAZID and with reference to the statistical accident figures for container vessels compiled and presented above, the following generic accident scenarios have been selected.
MSC 83/INF.8 ANNEX Page 13
I:\MSC\83\INF-8.doc
General maritime accident scenarios, common for all ship types addressed by the FSA include: Collision Collision scenarios represent 31% of all relevant initial causes in the casualty statistics above. Contact In general most collision scenarios occur in fairways and at sea whilst contact scenarios more frequently occur during port approach or manoeuvring in terminal areas. Hence the typical speed range for collisions differs from contacts as does the character of the consequences. Therefore the collision and contact scenarios were analysed separately. Grounding Grounding scenarios represent 13.3% of all relevant initial causes. Although these scenarios were not analysed in detail during the HAZID, representative causal chains of such scenarios are often fairly similar to collision and contact scenarios. Fire Fire and explosion scenarios represent 6.9% of all relevant initial causes. While engine-room and accommodation fire scenarios are considered to be similar for all cargo vessels and can therefore be described by a common risk model, cargo fires are specific for container vessels and must therefore be analysed separately. For this high-level FSA the presence of dangerous cargo is only considered on a general level. It is noted that a much more detailed risk model for cargo fire/explosion could be elaborated taking into account various types of hazardous cargo and related requirements as specified by the International Maritime Dangerous Goods Code /10/ and SOLAS /11/. Heavy weather Heavy weather and large ship motions were also identified as important hazards during the HAZID and are considered important contributing factors in the analysis for the container vessel specific risk scenarios discussed above. A number of accident scenarios were found to be directly associated with heavy weather and were therefore compiled into a common model. These include, in particular: o Water ingress in container hold
The intact stability requirements for open top container vessels differs from those for conventional vessels reflecting the fact that open top designs are more susceptible to water ingress and subsequent loss of stability. FSA methodology provides a tool for risk-based rulemaking, ensuring that design rules represent consistent and relevant safety levels. A risk model shall be developed in order to compare the safety levels of open top and conventional designs and to assess the efficiency of specific risk control options. Green water on deck is covered within this scenario.

MSC 83/INF.8 ANNEX Page 14
I:\MSC\83\INF-8.doc
o Parametric rolling The design and dimensions of large container vessels call for special attention regarding the susceptibility to parametric rolling. Technical, operational, and organizational risk reduction measures may be identified and evaluated by the use of a risk model.
o Container lashing failure The total percentage of transported containers that are lost overboard is low but is still significant and the lost containers may also cause pollution and damage to third parties. The analysis of lashing failures can be combined with a number of various primary causes or accidental events.
The findings from the HAZID and the statistical analysis do not match completely. On one hand, there is a good correlation for the well known accident categories “Collision”, “Grounding”, “Contact”, and “Fire/Explosion”, but on the other hand, incidents due to large ship motions and cargo losses due to lashing failures are prominent hazards that seem to be underreported in the statistics. Despite the fact that a significant number of casualties are reported under the category “Machinery damage”, a separate model was not considered necessary, since those cases leading to collision, grounding, and fire are already covered by the respective scenarios and for the remaining cases the impact on human safety was considered negligible. During the HAZID, human error was identified as an important contributing factor in the causal chain hence it was considered a contributing factor for fault tree structures during the risk analysis. Finally, the following accident scenario specific to container vessels was also discussed during the selection process. o Container lifting failure
Loading and unloading of container vessels at a terminal involves a large number of container lifting events. High container handling frequency is a critical factor for high total handling capacity. Lifting failure may result in damage to the ship, cargo damage, fatalities and injuries of crew and harbour personnel. Other consequences are environmental damage due to cargo spill. However, this accident type is considered basically an issue of occupational safety at the terminals and therefore not further analysed in this study.
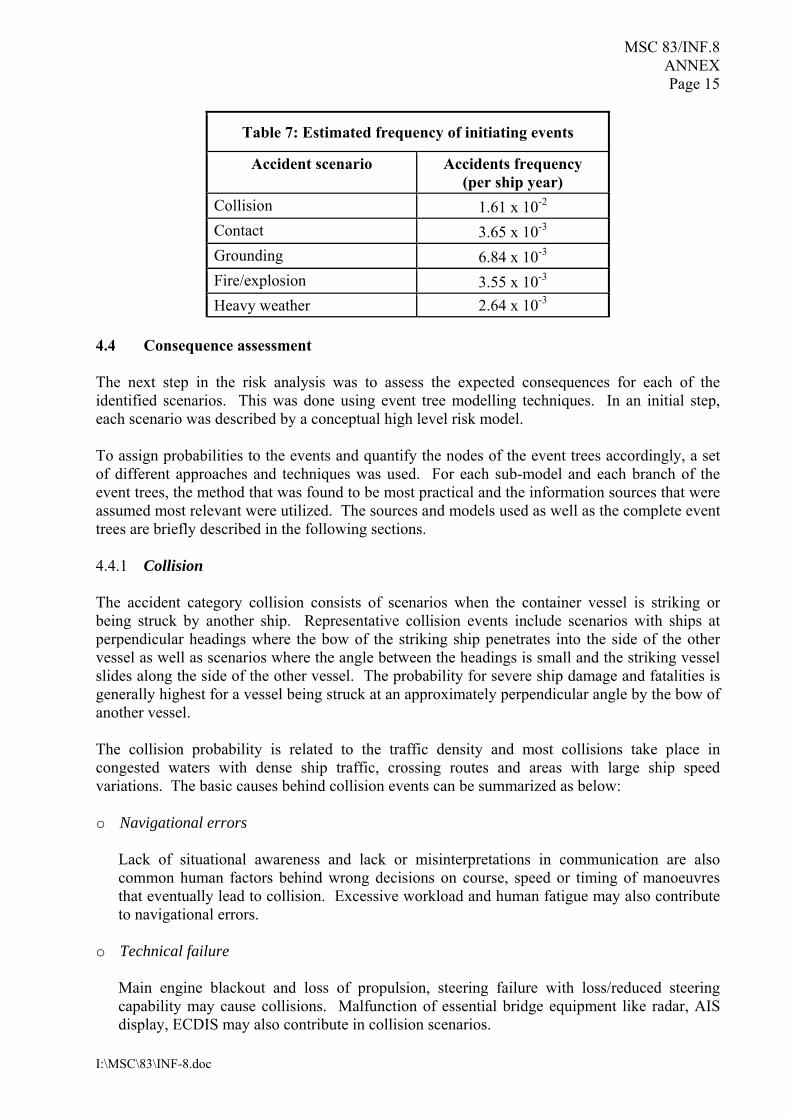
4.3 Probability assessment In this study, the figures were derived by relating accident frequencies according to statistics presented above to the fleet at risk during 1993 – 2004, equal to 30,682 ship years. The estimated relative frequencies were then used as probability of initiating events, see Table 7 below.
MSC 83/INF.8 ANNEX Page 15
I:\MSC\83\INF-8.doc
Table 7: Estimated frequency of initiating events
Accident scenario Accidents frequency (per ship year)
Collision 1.61 x 10⁻² Contact 3.65 x 10⁻³ Grounding 6.84 x 10⁻³ Fire/explosion 3.55 x 10⁻³ Heavy weather 2.64 x 10⁻³
4.4 Consequence assessment The next step in the risk analysis was to assess the expected consequences for each of the identified scenarios. This was done using event tree modelling techniques. In an initial step, each scenario was described by a conceptual high level risk model. To assign probabilities to the events and quantify the nodes of the event trees accordingly, a set of different approaches and techniques was used. For each sub-model and each branch of the event trees, the method that was found to be most practical and the information sources that were assumed most relevant were utilized. The sources and models used as well as the complete event trees are briefly described in the following sections. 4.4.1 Collision The accident category collision consists of scenarios when the container vessel is striking or being struck by another ship. Representative collision events include scenarios with ships at perpendicular headings where the bow of the striking ship penetrates into the side of the other vessel as well as scenarios where the angle between the headings is small and the striking vessel slides along the side of the other vessel. The probability for severe ship damage and fatalities is generally highest for a vessel being struck at an approximately perpendicular angle by the bow of another vessel. The collision probability is related to the traffic density and most collisions take place in congested waters with dense ship traffic, crossing routes and areas with large ship speed variations. The basic causes behind collision events can be summarized as below: o Navigational errors
Lack of situational awareness and lack or misinterpretations in communication are also common human factors behind wrong decisions on course, speed or timing of manoeuvres that eventually lead to collision. Excessive workload and human fatigue may also contribute to navigational errors.
o Technical failure Main engine blackout and loss of propulsion, steering failure with loss/reduced steering capability may cause collisions. Malfunction of essential bridge equipment like radar, AIS display, ECDIS may also contribute in collision scenarios.

MSC 83/INF.8 ANNEX Page 16
I:\MSC\83\INF-8.doc
o External environmental conditions Low visibility in particular may act as a contributing factor in the causal chain of collision scenarios.
The qualitative description of possible causes of collision accidents is expected to be relatively similar for different types of vessels. Some container vessel specific features, which may influence the probability for collision accidents can, however, be identified: o Visibility line
High container stacks on deck limit the visibility line. Collisions with small ships or boats not visible from the bridge may be more likely compared to ships without deck cargo. The minimum visibility line is regulated by design rules but in practice is also influenced by the actual loading condition and trim.
o Terminal location Compared to oil and bulk terminals many container terminals are located in inner port areas with long entrance channels with dense traffic and frequent close meeting events.
o Frequent calls and strict time schedules Container vessels operate according to strict timetables and have higher frequency of port calls than tankers and other vessels operating on spot market or time charter contracts.
o High power Large container vessels are generally designed for operation at relatively high speed, 17–23 knots. High speed also means that the time available for decision on collision avoidance and give way manoeuvres is short.
The figure below illustrates the chain of events, influencing factors and conditions that affect the outcome of a collision and are considered in the risk model.

MSC 83/INF.8 ANNEX Page 17
I:\MSC\83\INF-8.doc
Figure 5: Conceptual risk model for collision scenario The severity of the final outcome of collision scenarios is highly dependent on the speed and mass of the striking ship and the angle between the headings of the ships at the collision event. Three different operational states – associated with three different operational speed ranges – can be identified as a basic categorization for further analysis and probability estimation for collision events. The set of accident statistics investigated for container vessels did not allow for detailed analysis with respect to the distribution between the different categories. A brief review of the collision events registered for container vessels, however, verifies that all categories are represented but events near ports dominate and a 0.40 − 0.40 − 0.20 probability distribution is assumed for the three respective operational states. Striking or struck ship The striking ship generally only suffers damage in the fore body, ahead of the collision bulkhead. If the inertia of the striking vessel is large, its bow will penetrate the hull of the struck vessel resulting in water ingress in one or more compartments. A natural assumption is that the probability for being the striking or the struck ship is 0.5. Damage extent For this high level model it seems sufficient to separate probabilities for minor (no fatalities, minor plate deformation) and critical (water ingress in two or more cargo holds, flooding and possibly leading to capsizing and sinking) damages. Based on engineering considerations and with reference to empirical estimations presented for passenger vessels and other vessels /12/, it is assumed that the probability distribution between the two categories of ship damages for collision accidents at the three different operational states can be roughly described as below:
Collision frequency
Survivability model
Evacuation model
Operational state
Damage extent model
Consequence
Initiating frequency for collision
Probability of being in port, restricted waters, or at sea
Probability distribution of damage extent
Probability of sinking
Number of crew fatalities, environmental damage
Probability of timely evacuation
Cargo leakage model
Probability of DG and fuel oil release
Environmental damage

MSC 83/INF.8 ANNEX Page 18
I:\MSC\83\INF-8.doc
Table 8: Collision – ship damage probability for struck vessel and striking vessel
Operational state Ship damage Assumed probability Minor damage only Pminor damage = 1.0 struck
Pminor damage = 1.0 striking
Manoeuvring at low speed, near the terminal Plow speed|collision = 0.40 Critical hull damage water ingress Does not occur at low speed collisions
Minor damage only Pminor damage = 0.5 struck Pminor damage = 0.8 striking
Passage at reduced speed in port approach areas or entrance channels Preduced speed|collision = 0.40 Critical hull damage water ingress Pcritical damage = 0.5 struck
Pcritical damage = 0.2 striking
Minor damage only Pminor damage = 0.2 struck Pminor damage = 0.5 striking
En route, at full speed at sea Pfull speed|collision = 0.20
Critical hull damage water ingress Pcritical damage = 0.8 struck Pcritical damage = 0.5 striking
The operational state, governing the ship speed and the possibilities to deliberately put the ship aground to avoid sinking, influences the distribution of the survivability probability. The probability of rapid sinking is higher at high speed in open sea than at reduced or low speed in channels and at terminals. For high speed collisions, there is also a small probability that the striking ship will suffer severe damages eventually leading to sinking. Based on the above considerations the following probabilities were assumed:
Table 9: Probability distribution of the vessel survivability
Open sea full speed
Channels reduced speed
Terminals low speed
Struck ship stays afloat/becomes stranded Pstays afloat = 0.5 Pstays afloat = 0.8 Pstays afloat = 1 Struck ship sinks slowly Psinks slowly = 0.4 Psinks slowly = 0.2 Struck ship sinks rapidly Psinks rapidly = 0.1 Striking ship stays afloat/become stranded Pstays afloat = 0.95 Striking ship sinks slowly Psinks slowly = 0.05 A high-level event tree model for collision accidents has been developed on the basis of the qualitative and quantitative considerations presented above, see Annex A.7. The event tree structure has a total of 47 sequential scenario branches, of which 19 scenario are associated with single or multiple crew fatalities. The model also includes options to calculate third party fatalities, but the results are not presented as this is out of the scope of this study. 4.4.2 Contact The accident category contact is defined by scenarios when the container vessel is striking or being struck by any fixed or floating object, but not a ship or the sea bottom. Representative contact accidents include low speed contact scenarios with quays, breakwaters, piers, cranes, floating docks, road bridges, lighthouses, etc.

MSC 83/INF.8 ANNEX Page 19
I:\MSC\83\INF-8.doc
The presence of objects likely to be struck in contact scenarios is higher in port areas than at open sea. Hence the majority of the contact scenarios take place at low speed during manoeuvring in terminals or approach channels. There are no known cases where container vessels have collided with offshore structures, icebergs or other floating objects in which severe damage has been reported. The basic causes are either related to the ship or to external factors and can generally be attributed to some of the following categories: o Technical failure
This covers failures such as main engine blackout and loss of propulsion, steering failure with loss/reduced steering capability. The root causes behind such failures may often also involve non-technical issues.
o Navigational errors Wrong decisions on course, speed or timing of manoeuvres are usually attributed to human errors. Technical failures such as failure of bridge equipment may also contribute to navigational errors.
o External assistance failure Tug failure may occur independently from the actions taken/orders given from the ship/pilot and may be attributed to technical or human factor related issues onboard the tug.
o Mooring failure If mooring lines break/slip the ship may break adrift and cause contact scenarios. Mooring failure can be attributed to technical or human factor related issues and external factors like strong wind or close passage of other vessels may be contributing factors.
o Submerged/undetectable objects Due to lack of information, unpredictable occurrence of submerged or undetectable objects such as dropped floating containers may result in contact scenarios at open sea.
Severe external environmental conditions like strong wind, low visibility, strong current, extreme tide or ice often influence the causal chain acting as contributing factors. Some potential causes of contact accidents are fairly similar to collisions, e.g., restricted visibility, terminal location, frequent calls and strict time schedules. All are container vessel specific and are hence expected to make container vessels more susceptible for contact accidents compared to other types of ships. Additional causes that have an influence on the probability for contact accidents can be identified as follows: o Wind area
High container stack loads on deck means that the vessels expose large longitudinal areas to the wind which may influence manoeuvring and ship motions in strong wind.
MSC 83/INF.8 ANNEX Page 20
I:\MSC\83\INF-8.doc
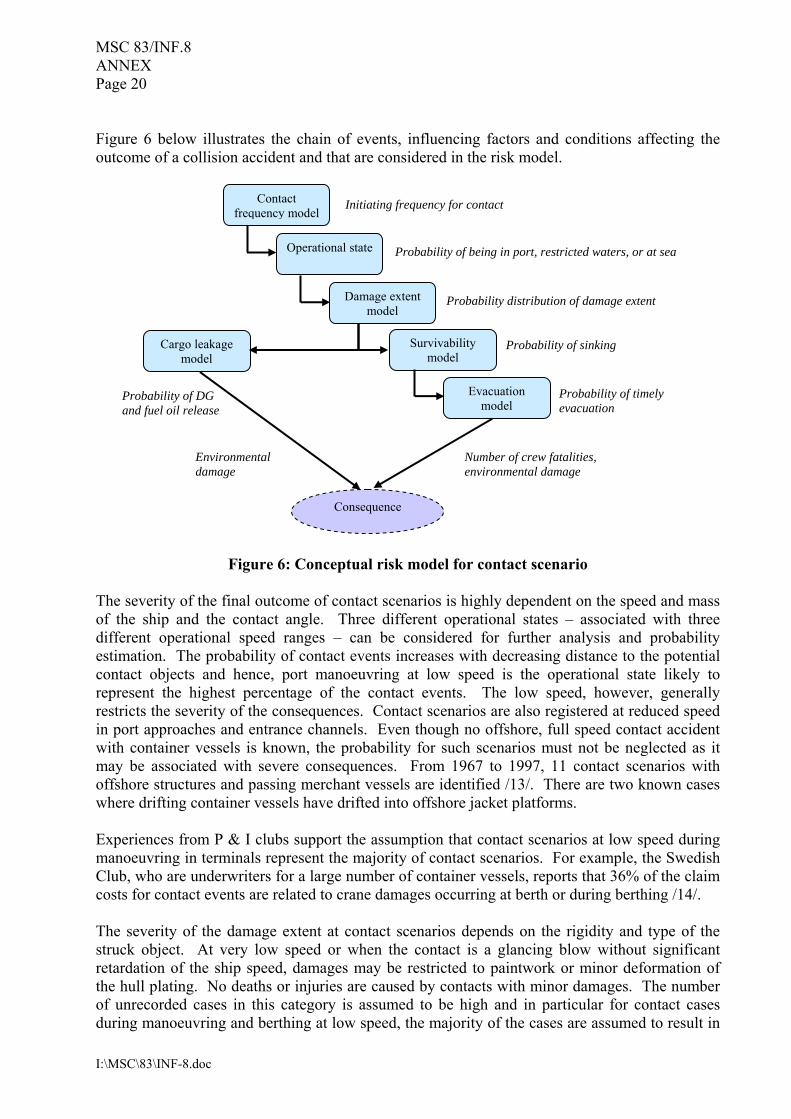
Figure 6 below illustrates the chain of events, influencing factors and conditions affecting the outcome of a collision accident and that are considered in the risk model.
Figure 6: Conceptual risk model for contact scenario The severity of the final outcome of contact scenarios is highly dependent on the speed and mass of the ship and the contact angle. Three different operational states – associated with three different operational speed ranges – can be considered for further analysis and probability estimation. The probability of contact events increases with decreasing distance to the potential contact objects and hence, port manoeuvring at low speed is the operational state likely to represent the highest percentage of the contact events. The low speed, however, generally restricts the severity of the consequences. Contact scenarios are also registered at reduced speed in port approaches and entrance channels. Even though no offshore, full speed contact accident with container vessels is known, the probability for such scenarios must not be neglected as it may be associated with severe consequences. From 1967 to 1997, 11 contact scenarios with offshore structures and passing merchant vessels are identified /13/. There are two known cases where drifting container vessels have drifted into offshore jacket platforms. Experiences from P & I clubs support the assumption that contact scenarios at low speed during manoeuvring in terminals represent the majority of contact scenarios. For example, the Swedish Club, who are underwriters for a large number of container vessels, reports that 36% of the claim costs for contact events are related to crane damages occurring at berth or during berthing /14/. The severity of the damage extent at contact scenarios depends on the rigidity and type of the struck object. At very low speed or when the contact is a glancing blow without significant retardation of the ship speed, damages may be restricted to paintwork or minor deformation of the hull plating. No deaths or injuries are caused by contacts with minor damages. The number of unrecorded cases in this category is assumed to be high and in particular for contact cases during manoeuvring and berthing at low speed, the majority of the cases are assumed to result in
Contact frequency model
Survivability model
Evacuation model
Operational state
Damage extent model
Consequence
Initiating frequency for contact
Probability of being in port, restricted waters, or at sea
Probability distribution of damage extent
Probability of sinking
Number of crew fatalities, environmental damage
Probability of timely evacuation
Cargo leakage model
Probability of DG and fuel oil release
Environmental damage
MSC 83/INF.8 ANNEX Page 21
I:\MSC\83\INF-8.doc
minor damage only. In contact scenarios with cranes on the quay or road bridges the ship cranes, its masts, superstructure or funnel may suffer damages. Such damages will not be critical for the survival of the ship but may, at rare occasions be associated with injuries and fatalities /15/. Critical hull damages leading to water ingress in two or more cargo holds and possibly leading to sinking of the ship are very rare for contact events. No such event is identified in the analysed dataset of container vessel casualties, but contact scenarios with offshore platforms or wind turbines may possibly cause critical damage. Based on reviewed statistics and the above considerations, probability distributions for operational state and ship damage according to the table below are assumed.
Table 10: Contact – damage probabilities for the ship
Operational state Ship damage Assumed probability
Minor damage Pminor damage = 0.80
Damage to superstructure Psuperstructure damage = 0.20
Critical hull damage Does not occur at low speed
Manoeuvring at low speed, close to berths in the terminal area Plow speed|contact = 0.80
Both Does not occur at low speed
Minor damage Pminor damage = 0.50
Damage to superstructure Psuperstructure damage = 0.49
Critical hull damage Pcritical hull damage = 0.01
Passage at reduced speed in port approach areas/entrance channels Preduced speed|contact = 0.19
Both Does not occur at reduced speed
Minor damage Does not occur at full speed
Damage to superstructure Psuperstructure damage = 0.30
Critical hull damage Pcritical hull damage = 0.30
En route, at full speed at sea Pfull speed|contact = 0.01
Both Pboth = 0.40
A high-level event tree model for contact accident with container vessels has been developed on the basis of the considerations above, see Annex A.7. It has a total of 48 scenarios of which 27 are developed into quantitative final outcome. Four scenarios are associated with single or multiple fatalities of the ship crew. 4.4.3 Grounding A number of models are available for the grounding scenario /8/, /12/, all of which differ in complexity and aspects considered. Aiming at a generic model, only major aspects are included here. In many respects the grounding scenario is similar to the scenarios for collision and contact discussed previously. There are also similarities to collision analysis for offshore wind farms /16/. Furthermore, the grounding scenario is common for all ship types, regarding causes and event chains. Differences are associated with the outcome mainly depending on the payload. For grounding accidents to happen a ship must be on a grounding course and no proper action is taken to avoid the grounding. Not acting properly includes situations such as impossibility to act,

MSC 83/INF.8 ANNEX Page 22
I:\MSC\83\INF-8.doc
wrong action, or no action is taken by the crew. Impossible action means inability for manoeuvring or steering due to severe machinery failures (steering gear, rudder, main engine or blackout) or extreme environmental conditions. No action is taken includes situations when the Officer on Watch (OOW) is not aware of the problem, cannot cope with it, or does not pay attention. Wrong actions include navigational errors. The main causes for grounding related to /17/:
• Waterway system and environmental conditions, • Vessel, and • Human factors, related to the Officer on Watch and shipboard communication.
Other contributing factors are:
• Bad weather (bad visibility, strong winds, strong current, storm, typhoon, waves), • Route near coast or shallow waters, • Navigator failure (technical or human), • Failure of anchors, and • Machinery failure or breakdown (affecting manoeuvring, steering, propulsion).
While bad weather, route and navigator failure are often causes of powered groundings, drifting groundings are mainly due to failure of the main engine, steering or manoeuvring system, or blackout. When the ship runs aground, this typically causes damage to the ship bottom, rudder, propeller and hull appendages. Structural deformations of inner members, tank rupture, etc. can be expected as well. Grounding casualties can be categorized as follows:
• Grounding on soft seabed (e.g. sand, mud), or • Grounding on hard, rigid bottoms (e.g. rock, coral reef) – Fuel spill and water ingress
more likely. After damage, water ingress into the ship may occur, resulting in progressive flooding of double bottom, cargo space, or engine-room. In combination with currents or tidal waters, the ship may develop an increased heel. When the ship re-floats either by own force or due to salvage action, it may capsize or sink due to loss of stability, e.g., when the hull is badly damaged. In worst case, the ship may break in two due to deteriorating strength caused by ship movements caused, for example, by tidal streams. In any case, if the crew cannot be evacuated completely before the ship sinks, fatalities will occur. Other effects on human safety and third party damages from the ship or cargo will not be considered. An important aspect of the evacuation is that grounding occurs in shallow waters, usually near the coast. After coming loose, the ship can be beached intentionally, in order to prevent it from sinking and to save lives. This is a major risk control option for passenger ships, but not as important for cargo ships. In summary, consequences of the grounding scenario include (injuries and) fatalities, spillage of bunkers, leakage of dangerous goods, damage to ship (equivalent to cost of repair), damage to cargo, loss of charter, and potential loss of ship. Financial consequences of any kind, such as
MSC 83/INF.8 ANNEX Page 23
I:\MSC\83\INF-8.doc
cost of the salvage operation, cost of repair, loss of charter, and loss of reputation will not be addressed here.
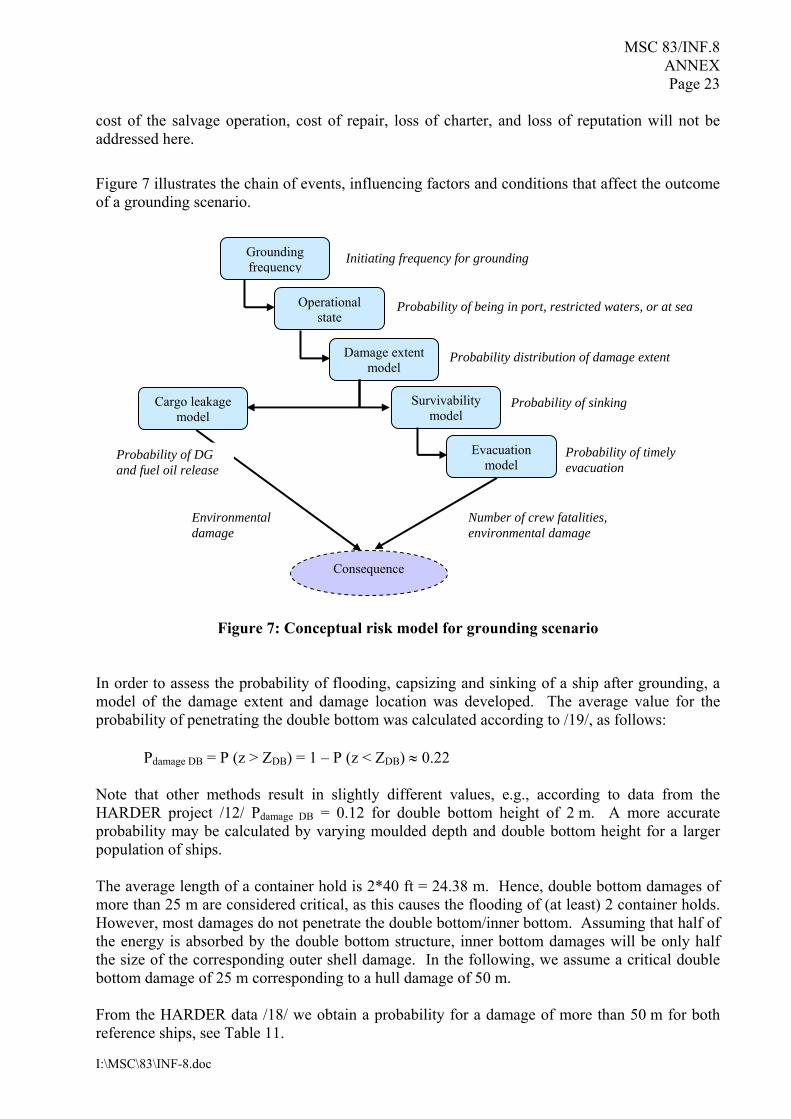
Figure 7 illustrates the chain of events, influencing factors and conditions that affect the outcome of a grounding scenario.
Figure 7: Conceptual risk model for grounding scenario In order to assess the probability of flooding, capsizing and sinking of a ship after grounding, a model of the damage extent and damage location was developed. The average value for the probability of penetrating the double bottom was calculated according to /19/, as follows:
Pdamage DB = P (z > ZDB) = 1 – P (z < ZDB) ≈ 0.22 Note that other methods result in slightly different values, e.g., according to data from the HARDER project /12/ Pdamage DB = 0.12 for double bottom height of 2 m. A more accurate probability may be calculated by varying moulded depth and double bottom height for a larger population of ships. The average length of a container hold is 2*40 ft = 24.38 m. Hence, double bottom damages of more than 25 m are considered critical, as this causes the flooding of (at least) 2 container holds. However, most damages do not penetrate the double bottom/inner bottom. Assuming that half of the energy is absorbed by the double bottom structure, inner bottom damages will be only half the size of the corresponding outer shell damage. In the following, we assume a critical double bottom damage of 25 m corresponding to a hull damage of 50 m. From the HARDER data /18/ we obtain a probability for a damage of more than 50 m for both reference ships, see Table 11.
Grounding frequency
Survivability model
Evacuation model
Operational state
Damage extent model
Consequence
Initiating frequency for grounding
Probability of being in port, restricted waters, or at sea
Probability distribution of damage extent
Probability of sinking
Number of crew fatalities, environmental damage
Probability of timely evacuation
Cargo leakage model
Probability of DG and fuel oil release
Environmental damage

MSC 83/INF.8 ANNEX Page 24
I:\MSC\83\INF-8.doc
Table 11: Probability of critical damage for reference ships according to /18/
Ship size Vessel 1 Vessel 2 Ship length (Lpp) 175 m 271 m lcritical = Lcritical / Lpp 0.29 0.18 P(ldamage > lcritical) 0.25 0.35
Again, it seems reasonable to calculate an average value for the probability of a critical damage:
P(ldamage > lcritical) ≈ (0.25+0.35)/2 = 0.3 Since damage is considered critical only, when it exceeds a critical length of 50 m and penetrates the double bottom, the probability for a critical damage is:
Pcritical damage | grounding = P(ldamage > lcritical) * Pdamage DB ≈ 0.3*0.22 = 0.066 The probability for a ship to remain aground or beached successfully after grounding has been analysed for passenger vessels /12/. These data were assumed to be independent of the ship type. Following this assumption we can reuse the data.
Pcoming loose | grounding ≈ 0.31 Pnot beached | coming loose | grounding ≈ 0.84
and hence the probability of sinking following grounding is:
Psinking | grounding = Pcritical damage | grounding * Pcoming loose | grounding * Pnot beached | coming loose | grounding ≈ 0.017 Regarding human safety, only loss of life is considered when a ship sinks. Two different cases must be considered. The ship sinks either rapidly (within 20 minutes) – possibly after capsize – or it sinks gracefully, at moderate speed. In this high-level model, we can assume, that for a rapid capsize none of the crew can be evacuated, while for a graceful sinking all of the crew but one can be evacuated. It is estimated, that 50% of all ships sinking due to grounding sink rapidly, while the remaining 50% sink gracefully. A high-level event tree model for contact accidents has been developed based on the considerations above, see Annex A.7. It has a total of 10 sequential scenario branches of which 6 are developed into a quantitative final outcome. Four scenario sequence branches are associated with single or multiple fatalities of the ship crew. 4.4.4 Fire/explosion Although fires and explosions were the cause of a relatively small percentage of incidents, they account for a substantial portion of the human consequences (see Table 6). Another report on cargo fires on container ships states that fires caused more than a third of all fatalities and injuries due to accidents on container vessels and /20/. It also states that fires are the second largest contributors to the overall accident costs. Fires that break out on container ships can be very difficult to control, partly because of access problems resulting from stacking and small clearances, and also due to safety issues and risk of explosions that may prevent the fire fighting crew from getting close enough.

MSC 83/INF.8 ANNEX Page 25
I:\MSC\83\INF-8.doc
Almost 50% of all fires on container ships begin in the engine-room or machinery spaces. Fires originating in the cargo area account for 25%. Within the risk analysis, a more detailed model was developed for cargo fires specific to container vessels, with focus on the wide range of cargo within a container and the difficulties associated with fire fighting. Fires in engine-room, accommodation, and other areas are assumed to develop similarly to other ship types. Some of the high level causes for a cargo fire on a container vessel include:
• inappropriate stowage conditions for dangerous goods (usually resulting from dangerous goods not being declared),
• cargo not cooled sufficiently prior to packing, • electrical problems/malfunction of refrigeration unit on reefer containers, • stowage location too warm, • ventilation in hold not effective, and • collision or extreme ship motions results in damaged containers, release of flammable
materials. Figure 8 below illustrates the chain of events, influencing factors and conditions that affect the outcome of a fire/explosion scenario. Engine-room and accommodation fires are included as separate branches in the model, showing their relative contribution to the overall fire/explosion outcome. These branches are not further developed in this analysis because it was not considered container vessel specific, but this could be addressed in a separate study if necessary.
Figure 8: Conceptual risk model for fire/explosion scenario
Damage extent model
Survivability model
Evacuation model
Operational state
Fire protection model
Consequence
Initiating frequency for fire/explosion
Probability of being in port, restricted waters, or at sea
Probability of fire detection / fire fighting system failing
Probability distribution of damage extent
Probability of sinking
Number of crew fatalities, environmental damage
Fire/explosion frequency model
Machinery Other/unknown: Bridge, tank, accommodation area,
Cargo spaces
Cargo leakage model
Probability of DG and fuel oil release
Environmental damage
Probability of timely evacuation

MSC 83/INF.8 ANNEX Page 26
I:\MSC\83\INF-8.doc
Statistical data related to fire accidents were further analysed with respect to their location of origin /21/. From a total of 109 fire/explosion incidents, 51% and 24% originated in machinery spaces and cargo areas, respectively. For the majority of remaining incidents the location of origin was unknown. Additionally, fire/explosion incidents which originated in the cargo area were further broken down by sequence of events, see Table 12: Breakdown of fire/explosion incidents originating in the cargo area.
Table 12: Breakdown of fire/explosion incidents originating in the cargo area
Incident type No. of incidents (1993 – 2004)
Accident frequency (per ship year)
Fire 20 6.5 x 10⁻⁴
Explosion and Subsequent fire 3 9.8 x 10⁻⁵
Explosion, subsequent fire possible (not clearly specified)
3 9.8 x 10⁻⁵
The frequencies shown above were used for the initiating events in the event trees for fire. The high-level model developed includes only “fire only” incidents. Incidents with explosion and subsequent fire could be added as separate event tree during further stages of refinement. Although the probability of “explosion and subsequent fire” incidents is rather low, they can have substantial consequences. /20/ discusses several cases of damaged hatch covers after explosion, rendering the CO2 fire fighting system ineffective with rapid spreading of fire as a result. Probabilities for each branch node on the event tree were estimated based on available data or engineering judgement. Fire detection and control It is assumed that 70% of the time the fire would be detected before it spread beyond the containers based on the following reasoning:
• Approximately 50% of containers are carried in holds with hatch covers equipped with fire/smoke detectors and an automatic fire fighting system. It is assumed that any fire beginning in a hold would be detected before the fire spread, and
• 50% of containers are carried on deck: it is assumed that the crew detects a fire before it spreads in about 40% of the cases, i.e. in 40% x 50% = 20% of total.
Based on results from /21/, it is further assumed that timely fire fighting assistance can be obtained in 35% of cases. Dangerous cargo Based on casualty data review and specific accident reports /22/, it was assumed that containers with dangerous cargo would be affected by 30% of the fires. In particular, undeclared dangerous cargo is a concern with respect to fire. Some limited data on compliance monitoring of dangerous goods transported by sea was reviewed /23/. These data were then used to estimate that 80% of dangerous goods are properly declared and marked. If dangerous goods are not declared, there is a risk that they are stowed under inappropriate conditions and it is more likely that inappropriate fire fighting measures will be attempted and that crew injuries/fatalities will

MSC 83/INF.8 ANNEX Page 27
I:\MSC\83\INF-8.doc
occur. It was also assumed that a fire would spread more quickly if undeclared dangerous goods were onboard. No statistics were found so the following assumptions were made regarding the effectiveness of manual fire fighting.
• No dangerous goods involved: 20% effective • Correctly declared dangerous goods: 10% effective • Undeclared dangerous goods: 5% effective
The part of the event tree related to fires in the cargo area contains a total of 57 accident sequences resulting in various outcomes. Those outcomes were grouped into 12 categories, see Table 13. Frequencies for the accident sequences were summed up for each category. Accident sequence numbers can be used to identify individual outcomes in the event tree, see Annex A.7. The table is sorted from low to high consequences.
Table 13: Outcome categories and frequencies for fires initiated in the cargo area
Outcome Category Frequency (per ship year)
Fatalities among crew
Accident sequence number
(from event tree) 1 container burns 1.55 x 10⁻⁴ 0 3, 16, 34, 52 1 container burns, dangerous goods (d.g.) involved
4.86 x 10⁻⁵ 0 1, 2, 4, 10, 22, 28, 40, 46
>1 container burns, no d.g. 1.05 x 10⁻⁴ 0 17, 35, 53 >1 container burns, d.g. involved 5.12 x 10⁻⁵ 0 5, 11, 23, 29, 41, 47 Many containers burn, no d.g., fire affects other ship areas
1.75 x 10⁻⁴ 1 18, 36, 54
Many containers burn, d.g. involved, fire affects other ship areas
8.39 x 10⁻⁵ 2 6, 12, 24, 30, 42, 48
Many containers burn, no d.g., fire affects other ship areas, not near rescue services for crew
8.78 x 10⁻⁷ 5 19, 37, 55
Many containers, d.g. involved, fire affects other ship areas, not near rescue services for crew
1.71 x 10⁻⁶ 10 7, 13, 25, 31, 43, 49
Loss of all containers, vessel, rescue services available for crew, no dg involved, environmental damage
1.94 x 10⁻⁵ 0 20, 38, 56
Loss of all containers, vessel, rescue services available for crew, dg involved, environmental damage
9.33 x 10⁻⁶ 2 8, 14, 26, 32, 44, 50
Worst Case: Loss of vessel, all cargo, all crew, no d.g., environmental damage
9.76 x 10⁻⁸ 20 21, 39, 57
Worst Case: Loss of vessel, all cargo, all crew, third party possible from dg release, environmental damage
1.90 x 10⁻⁷ 20 9, 15, 27, 33, 45, 51

MSC 83/INF.8 ANNEX Page 28
I:\MSC\83\INF-8.doc
4.4.5 Heavy weather This accident category addresses incidents due to heavy seas and strong tropical rain. Typical consequences of strong tropical rain include water ingress, and possibly subsequent flooding of cargo holds, listing, and capsizing. This is more much relevant to hatchless container vessels than to conventional designs. Immediate consequences of heavy seas are large wave-induced ship motions, which in turn can lead to water ingress, flooding of cargo holds, listing, and capsizing, but also damage of deck equipment (wave breakers), local or global damage of the hull (bow and stern slamming), minor and major structural failure as well as, in rare cases, foundering. Most often, large ship motions refer to pitch and roll motions exceeding certain boundaries. Under certain conditions related to the environment, susceptible hull design, actual load distribution and ship course, parametric rolling may occur. More details can be found in France et al. /38/. Other cases of intact loss of stability due to large ship motions are known, e.g. pure loss of stability. With respect to cargo, typical consequences include failure of lashing, shift of cargo, loss of and damage to containers. In particular, deck containers are affected more often than others as they are less protected against the environment. Furthermore, heavy weather can lead to navigation related incidents due to partial or complete loss of steering and manoeuvring capability, or to machinery failures in general. Cases leading to collision, grounding or contact are analysed under the respective accident categories and are out of scope here. Other cases without major consequences are listed for completeness, but are not considered in detail. It should be noted, that very few accidents actually lead to serious consequences, while the majority are non-serious with respect to human safety, and typically associated to hull damage, containers lost and pollution events. A significant underreporting must be assumed, especially for cases leading to hull damage or loss of a few containers but do not involve fatalities or injuries. Figure 9 below illustrates the chain of events, influencing factors and conditions for the heavy weather scenario.

MSC 83/INF.8 ANNEX Page 29
I:\MSC\83\INF-8.doc
Figure 9: Conceptual risk model for heavy weather scenario According to the accident statistics, heavy weather was reported in 150 out of 1582 – or 9.5% – of all cases. The initiating frequency was determined to 2.64 x 10⁻³ per ship year. Some of the high level causes for heavy weather incidents include:
• wrong heading or speed caused by machinery failure (loss of propulsion, loss of manoeuvring capability),
• wrong heading or speed caused by operational failure, and • vulnerable or inadequate design (hatch cover sealing, venting/piping piping, pumps).
The quantification of the risk model was mainly based on engineering judgements. Even though sophisticated tools are available for the of simulation wave induced ship motions in principle, their use would require excessively long computation time and an exhaustive calculation of parameter combinations it is nearly impossible today. The following assumptions apply to the engineering judgements. Tropical rain occurs during the wet season, which is assumed to last 2 months per year. Since for a typical trade between Asia and Europe 15% the route is in tropical waters, a vessel is exposed 2.5% of her life to strong tropical rain.
Ptropical_rain = 0.025 Furthermore, approximately 70 out of 3,500 – or 2% – of all container vessels are hatchless. It is assumed that only those are affected by tropical rain.
Heavy weather frequency
Survivability model
Evacuation model
Damage model
Flooding model
Consequence
Initiating frequency for heavy weather
Probability minor or major hull damage
Probability of flooding (intact or damaged)
Probability of sinking
Number of crew fatalities, environmental damage
Probability of timely evacuation
Cargo leakage model
Probability of DG and fuel oil release
Environmental damage

MSC 83/INF.8 ANNEX Page 30
I:\MSC\83\INF-8.doc
Regarding the final consequences of strong tropical, the following is assumed. If the intake of water increases, this will cause progressive flooding and finally capsize and sinking of the ship. It is assumed, that this happens in 1% of the cases, which is certainly a conservative estimate. As the ship sinks slowly, it is assumed that the only a single crew member cannot be saved. According to accident statistics, heavy weather was reported in 150 cases. From those, 64 led to collision, contact, grounding or fire and are therefore out of scope here. The remaining 86 incidents are categorized into machinery damage, hull damage, foundering, and miscellaneous, respectively. Furthermore, the miscellaneous incidents are classified into hull damage, loss of cargo, and “others”, see Table 14.
Table 14: Outcome categories and frequencies for heavy weather incidents other than collision, grounding, contact and fire
Accident category Number of events Frequency (per ship year)
Machinery damage 5 6% Hull damage 13 15% Foundering 1 1% Miscellaneous 67 78%
• Hull damage 14 16% • Loss of cargo 45 52% • Others 8 9%
Total 86 100% Hence, the frequencies for other (including machinery damage) and large motions are estimated to:
Pother = (5+8)/86 ≈ 0.15 Plarge_motions = 1 – Ptropical_rain - Pother
From those incidents not related to categories “machinery” or “other”, 28 are related to hull damage including foundering.
Phull_damage = 28/73 ≈ 0.384 If the hull is damaged severely, the ship may founder and sink. Accident statistics contain a single case of foundering, hence the probability of sinking is assumed as for both cases, sinking slow and rapidly.
Psinking_slow = Psinking_repaidly = 1/1582 ≈ 6.32 x 10⁻⁴ When the ship sinks slowly, this leaves the chance for all but one crew member being evacuated. In contrast, is assumed that none of the crew can be saved when the ship sinks fast. However, in most cases, the ship will stay afloat, despite minor damages to the hull. In 2% of those cases is assumed that a crew member is washed overboard and cannot be saved afterwards (taking into account rough sea conditions). The cost of minor hull damages due to bow or stern slamming or damaged wave breakers are estimated to US$500,000 – or 1%. If the ship sinks, this will result in a complete loss of both ship and cargo.

MSC 83/INF.8 ANNEX Page 31
I:\MSC\83\INF-8.doc
Finally, in case the hull is not damage, only a small percentage (0.1%) of deck containers may be lost. In rare cases (0.01%) the ship will sink rapidly due to pure loss of stability. In this case no one can be saved. A high-level event tree model for heavy weather accidents with container vessels has been developed, see Annex A.7. A more refined event tree for water ingress has been established and used, particularly for the purpose of evaluating risk control options related to water ingress into open-top vessels and efficient dewatering. This event tree has a total of 38 accident sequences grouped into 11 categories according to the severity of the outcome. 4.5 Risk summation Based on the risk model described above and the output from the event trees, characteristic risk figures for container vessels are compiled below. Table 15: Potential loss of life among crew members on container vessels presents the potential loss of life among crew members.
Table 16: Potential loss of life among crew members on container vessels
Accident scenario PLL (Crew) (per ship year)
PLL (Crew)
Collision 6.11 x 10⁻³ 67.9% Contact 1.25 x 10⁻⁴ 1.4% Grounding 1.24 x 10⁻³ 13.7% Fire / Explosion 1.50 x 10⁻³ 16.7% Heavy weather 3.10 x 10⁻⁵ 0.3% Total PLL 9.00 x 10⁻³ 100.0%
On that basis the individual risk for a crew member is estimated to 2.25 x 10⁻⁴ per year assuming a crew of 20 and a 50:50 rotation scheme. Hence, the individual risk for crew members onboard a container vessel is in the ALARP region, i.e., it is lower than the maximum tolerable risk for a crew member (10-3), but still larger than “negligible” individual risk of 10-6 (see Table 4). The PLL figures provide an expected average number of fatalities per ship year for each accident scenario. The PLL figures, however, do not provide any details about the distribution of expected fatalities with respect to the severity of the accidents in terms of single, multiple or large number of fatalities. It can be seen from Table 17: Potential loss of life among crew members on container vessels that collision, fire and grounding represent the highest overall risk contributions. Together, they account for 98% of the total risk. In comparison with the statistically derived frequencies as presented in Table 6, the PLL figures derived from the event trees are significantly higher. This holds true particularly for the collisions. This can be explained by the fact that the risk model also covers accidents that did not occur in the past. In addition to risk to human life, this high level risk assessment also addressed risks for the environment due to the release of dangerous cargo and spillage of bunker oil. For calculation of environmental consequences, the same event trees were used after extending them in such a way that for all final events, the expected quantity of dangerous cargo released from damaged containers and bunker oil spilled from damaged fuel tanks are estimated. The assigned quantities

MSC 83/INF.8 ANNEX Page 32
I:\MSC\83\INF-8.doc
reflect either partial or total damage of the containers and fuel tanks according to the common assumptions about the reference vessels as specified in Table 3. The final environmental consequences of the released dangerous goods and fuel oil spills for each accident scenario are summarized in the table below. The risk figures indicate that the collision and grounding scenarios represent the highest contribution to the total risk for the environment.
Table 18: Environmental consequences: Expected quantities of dangerous goods released and bunker oil spilled
Accident scenario Dangerous goods tonnes (per ship year)
Bunker spill (tonnes/ship year)
Collision 5.38 x 10⁻¹ 1.05 x 100 Contact 3.17 x 10⁻² 4.58 x 10⁻² Grounding 2.69 x 10⁻¹ 4.52 x 10⁻¹ Fire/explosion1 1.04 x 10⁻¹ 5.65 x 10⁻² Heavy weather 6.45 x 10⁻² 2.31 x 10⁻³ Total 1.01 1.61
It is common to present the societal risk of an activity using FN diagrams. These diagrams show the cumulative frequencies of events causing N or more fatalities against the number of fatalities (N) on the horizontal axis. The number of exact N fatalities per accident category can be found in the table below.
Table 19: Frequency of N fatalities per accident category
N Collision Contact Grounding Fire/ explosion
Heavy weather Total
1 9.64 x 10⁻⁴ 1.36 x 10⁻⁵ 5.88 x 10⁻⁵ 1.28 x 10⁻³ 1.67 x 10⁻⁵ 2.34 x 10⁻³ 2 7.30 x 10⁻⁷ 9.43 x 10⁻⁵ 5.27 x 10⁻⁷ 9.55 x 10⁻⁵ 5 5.14 x 10⁻⁴ 7.30 x 10⁻⁶ 8.88 x 10⁻⁷ 5.22 x 10⁻⁴
10 1.73 x 10⁻⁶ 1.73 x 10⁻⁶ 20 1.29 x 10⁻⁴ 3.65 x 10⁻⁶ 5.88 x 10⁻⁵ 2.91 x 10⁻⁷ 6.61 x 10⁻⁷ 1.92 x 10⁻⁴ Figure 10 shows two FN curves and an associated ALARP region. The first FN curve corresponds to the societal risk derived within this study. The second curve presents the societal risk according to the LMIU casualty statistics /7/, for the sampling period 1978 –1998. It was prepared and previously submitted to IMO MSC 72 by Norway /5/. Comparing both curves, it can be seen that the historic risk level is smaller than the one derived in this study, but apart from this, they match quite well. The difference between them can be explained partly by the fact that before 1993 casualty reporting was not fully established yet. Figure 10 also contains the container vessel specific risk acceptance criteria derived earlier (see Figure 3). These criteria demonstrate that the FN curve for container vessel crew derived within this study fits into the ALARP (As Low As Reasonably Practicable) range, thereby providing incentive to identify risk control options and to assess them with respect to cost efficiency.
1 Environmental consequences cover only fires in cargo area.

MSC 83/INF.8 ANNEX Page 33
I:\MSC\83\INF-8.doc
Total Risk for Container Vessels
1E-05
1E-04
1E-03
1E-02
1E-01
1 10 100Number of fatalities [N]
Freq
uenc
y [F
] of N
or m
ore
fata
litie
s pe
r sh
ip y
ear
SAFEDOR MSC72/16 upper ALARP boundary lower ALARP boundary
Figure 10: Societal risk level according to this study (“SAFEDOR”) and to the LMIU casualty statistics 1978 – 1998. Proposed acceptance criteria are shown.
4.6 Uncertainties A number of uncertainties are introduced when a risk model is elaborated. Various degrees of uncertainty are associated with the following areas and factors:
• Scope and limitations – the generic ships as representative for all UCCs, • The statistics – not complete, • The outlined model – omitted branches, • The engineering judgments, • The assumptions – Yes/no probabilities, and • Assumptions on the number of fatalities per final outcome of each event branch.
In general, a conservative approach has been applied in this risk assessment process when assumptions have been necessary for parameters that cannot be statistically verified. Engineering judgments and other considerations associated with the assumption of quantitative figures have been presented in a transparent way and can easily be updated if new sources of more accurate information become available.
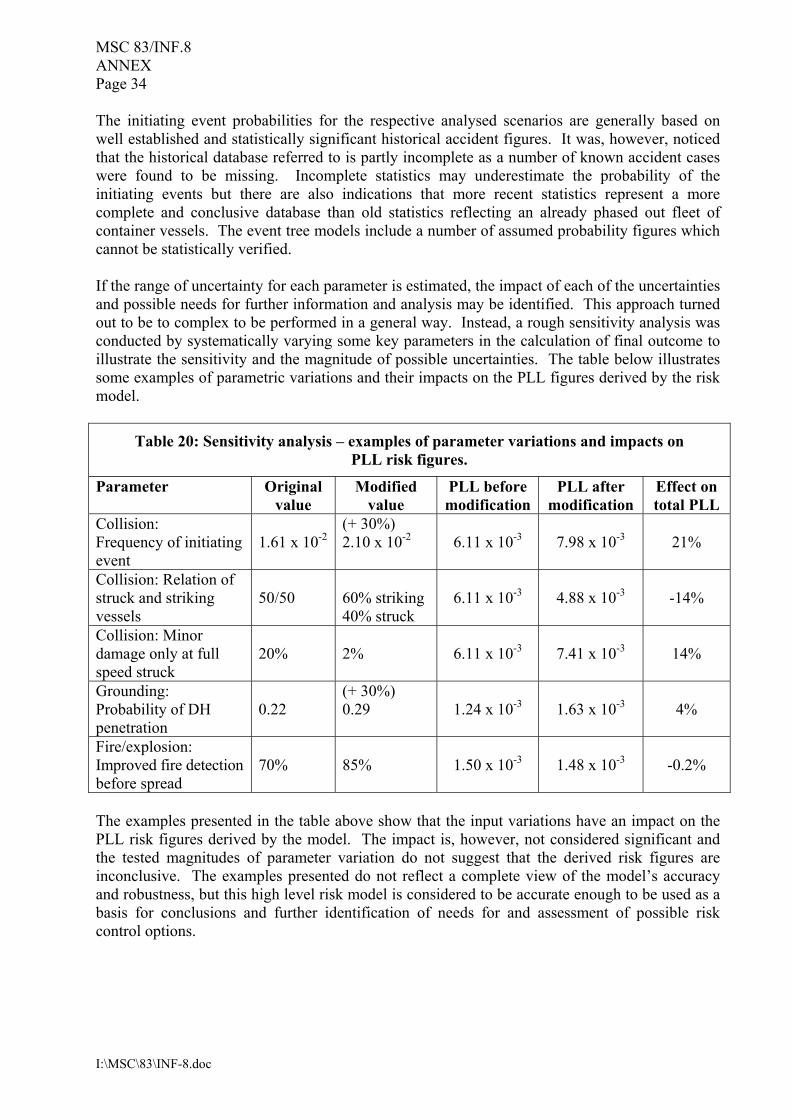
MSC 83/INF.8 ANNEX Page 34
I:\MSC\83\INF-8.doc
The initiating event probabilities for the respective analysed scenarios are generally based on well established and statistically significant historical accident figures. It was, however, noticed that the historical database referred to is partly incomplete as a number of known accident cases were found to be missing. Incomplete statistics may underestimate the probability of the initiating events but there are also indications that more recent statistics represent a more complete and conclusive database than old statistics reflecting an already phased out fleet of container vessels. The event tree models include a number of assumed probability figures which cannot be statistically verified. If the range of uncertainty for each parameter is estimated, the impact of each of the uncertainties and possible needs for further information and analysis may be identified. This approach turned out to be to complex to be performed in a general way. Instead, a rough sensitivity analysis was conducted by systematically varying some key parameters in the calculation of final outcome to illustrate the sensitivity and the magnitude of possible uncertainties. The table below illustrates some examples of parametric variations and their impacts on the PLL figures derived by the risk model.
Table 20: Sensitivity analysis – examples of parameter variations and impacts on PLL risk figures.
Parameter Original value
Modified value
PLL before modification
PLL after modification
Effect on total PLL
Collision: Frequency of initiating event
1.61 x 10⁻²
(+ 30%) 2.10 x 10⁻²
6.11 x 10⁻³
7.98 x 10⁻³
21%
Collision: Relation of struck and striking vessels
50/50
60% striking 40% struck
6.11 x 10⁻³
4.88 x 10⁻³
-14%
Collision: Minor damage only at full speed struck
20%
2%
6.11 x 10⁻³
7.41 x 10⁻³
14%
Grounding: Probability of DH penetration
0.22
(+ 30%) 0.29
1.24 x 10⁻³
1.63 x 10⁻³
4%
Fire/explosion: Improved fire detection before spread
70%
85%
1.50 x 10⁻³
1.48 x 10⁻³
-0.2%
The examples presented in the table above show that the input variations have an impact on the PLL risk figures derived by the model. The impact is, however, not considered significant and the tested magnitudes of parameter variation do not suggest that the derived risk figures are inconclusive. The examples presented do not reflect a complete view of the model’s accuracy and robustness, but this high level risk model is considered to be accurate enough to be used as a basis for conclusions and further identification of needs for and assessment of possible risk control options.

MSC 83/INF.8 ANNEX Page 35
I:\MSC\83\INF-8.doc
5 RISK CONTROL OPTIONS 5.1 Identification According to the risk analysis, the highest potential for risk reduction is related to collision, grounding and fire/explosion which are associated with 68%, 14%, and 16% of the total risk, respectively. Furthermore, the overall risk associated to the operation of container vessels was found to be in the ALARP area, thereby giving justification to search for cost effective risk control measures. Since collision, grounding, and fire accidents were identified as main risk contributions, measures related to the following areas will be considered:
• Manoeuvrability • Collision and grounding avoidance • Navigational safety
In addition, risk control options aimed at reducing the risk of fire or explosion were considered. Finally, some risk control options specific to container ships have been identified, especially for the “heavy weather” scenario. The main risk drivers according to the risk analysis were presented to experts at workshops at which through brainstorming a number of risk control options were found. Additionally, existing measures (both optional and mandatory) from current rules, regulations, guidelines related to design and operation of seagoing vessels as well as FSA studies for other ship types were reviewed regarding their applicability to container vessels (see Annex A.3 for details). As a result, a total of 33 risk control options were identified and documented. Most of them are preventive, only a few related to the heavy weather scenario are mitigating. Subsequently the identified options were pre-screened by the project team taking into account the number of accident scenarios affected, perceived risk reduction, and perceived scale of economic benefits. This resulted in a prioritized list of 11 risk control options to be assessed further with respect to costs and benefit: RCO to reduce the risk related to contact and grounding:
• Bow camera systems RCO to reduce the risk related to grounding:
• ECDIS • Track control
RCOs to reduce the risk related to collision:
• AIS integrated with radar
MSC 83/INF.8 ANNEX Page 36
I:\MSC\83\INF-8.doc
RCOs to reduce the risk related to collision, contact and grounding:
• Improved navigator training • Improved bridge design • Additional officer on the bridge • Implementation of guidelines for Bridge Resource Management (BRM)
RCO to reduce fire and explosion risks:
• Reduced amount of undeclared dangerous goods RCOs to reduce the risk related to heavy weather:
• Increased efficiency of bilge system • Bilge alarms in cargo holds
Some FSA studies addressing navigational safety of large passenger ships have been submitted to IMO previously and received positive feedback /24/, /25/, /26/. A number of risk control options contained therein are applicable to container vessels in principle, too. Those were adopted using numbers for risk reduction and costs when appropriate. The same effects are expected with respect to the reduction of the initiating frequency for collisions and groundings, but the absolute reduction effect will be much smaller for container vessels due to the lower initial risk. 5.2 Detailed description This section contains a detailed description of each risk control option selected by the pre-screening process. 5.2.1 RCO 3: Increased efficiency of bilge system It is generally acknowledged that bilge systems in container vessels are quite reliable. Each cargo hold is equipped with two bilge suctions. At least two bilge pumps are installed, and are separated in case of carrying dangerous goods. Increased bilge pump capacity is mandatory for open top vessels, depending on the outcome of model tests with respect to the intake of green water entering into open cargo holds /6/. This RCO covers the installation of additional bilge suction at higher level to avoid blocked bilge wells and to increase the reliability of the bilge system. This option was considered for open-top vessels and for conventional vessels. 5.2.2 RCO 4: Bilge alarms in cargo holds Many container vessels are equipped with remote devices for detection and alarms in case of flooding and a remotely operated bilge suction system. Those systems are mandatory for open top container vessels, where high bilge level alarms are required for all open cargo holds /6/. In general, the availability of a bilge alarm shortens the reaction time significantly. Hence, two related risk control options, ensuring different levels of reliability, are considered:

MSC 83/INF.8 ANNEX Page 37
I:\MSC\83\INF-8.doc
• Installation of a high bilge level alarm compared to the situation without alarms, and • Installation of a second bilge alarm in each cargo hold.
Both options were considered for open-top vessels and for conventional vessels. 5.2.3 RCO 5: Improved navigator training Safety practice in heavy weather varies widely among ship management companies. It often depends on experience of the individual officer. Introduction of standard procedures, codes of practice and compulsorily manuals onboard would improve operational safety and reduce the human failure rate. Officers on the bridge would improve their ability to avoid extreme situations and their preparedness to take the right decision in such a situation, by attending periodic training courses, for example at simulation centres. A similar RCO was suggested for passenger vessels /24/. 5.2.4 RCO 10: Bow camera systems According to SOLAS the view of the sea surface from the conning position and the navigating and manoeuvring workstation shall not be obscured by more than two ship lengths, or 500 m, whichever is the less, forward of the bow to 10° on either side under all conditions of draught, trim and deck cargo /28/. Although these requirements are typically met at the design stage, in reality, load and trim conditions might not comply with the visibility line requirement. Even when the requirements are met, there is a blind sector that reduces the possibilities for precise manoeuvring by visual observations leading to the risk for collisions or contacts with boats or objects in that sector. Many collisions or contacts occur while operating at low speed, in restricted waters or manoeuvring in ports. For those cases improved near range visibility would be beneficial, because lead time for collision avoidance actions would increase when objects in the hidden sector are detected earlier. Please keep in mind that at a speed of 5 knots, a visibility line of 500 m corresponds to more than three minutes of steaming. At higher speeds efficiency will reduce, since the lead time for collision avoidance actions will only reduce marginally. The installation of a bow camera system combined with monitors on the bridge was identified as an RCO to address the lack of visual observation in the near range ahead of the ship. In response to the fact that at least half of the collisions occur during night time and twilight /32/, the use of night vision systems like thermal cameras will provide a more efficient risk reduction. Hence, the following two different options were investigated:
a) Bow camera system with conventional daylight vision capabilities. b) Bow camera system with conventional daylight vision capabilities combined with thermal
sensors colour for night vision capabilities. In both cases, the cameras were required to be compact, weatherproof, and of robust design. Special attention has been paid to the location of the camera and to accessibility for maintenance. Another issue was protection against the environment including green water, wash of the waves, and vibrations. The camera could be activated when necessary, e.g. in restricted areas or areas with high traffic density and switched off and protected with a blind or faceplate otherwise.

MSC 83/INF.8 ANNEX Page 38
I:\MSC\83\INF-8.doc
5.2.5 RCO 11: Reduced amount of undeclared DG Recently, serious fires on container vessels were partially caused by undeclared dangerous goods and it is recognized that the carriage of dangerous goods is a significant concern for cargo fires /22/, /30/. If the crew is unaware that a container holds dangerous goods, it will likely not be stowed and handled in the required manner. This can result in the ignition of the goods and additional hazards during fire-fighting may develop. Hence, cargo fires could be reduced by increased inspections by coast guard or by shipping companies aiming at identification of undeclared cargo. Undeclared cargo could be detected by X-ray screening of containers that are often used for security screening anyway. A recent investigation report recommended, that “shipping papers and dangerous cargo manifests should be on board prior to the stowage of cargo, or at least be presented early enough to allow the Master or Chief Officer sufficient time to review the documents for possible oversights on the part of the person preparing the documents”, ref /31/. This measure should also help reducing the share of undeclared dangerous goods.” Measures recommended to reduce the occurrence of carriage of undeclared or incorrectly declared dangerous goods include the following two step process:
1) Pre-screening and review of shipping papers and dangerous cargo manifests (DCMs) prior to loading of cargo. This requires additional screening by an officer or crew member to identify questionable or potential problem containers for additional inspection prior to loading.
2) Inspection of containers identified during the pre-screening process. This requires either
manual inspection or gamma systems screening. 5.2.6 RCO 15: Improved bridge design Improved bridge design has been suggested as one of the most important RCOs for improved navigation of large passenger vessels /24/. Here the term “improved design” means upgrading from a standard SOLAS bridge, fitted with the minimum required equipment and very limited requirements regarding the bridge layout. It is common for cruise vessels to go beyond the minimum required standards in relation to bridge design, and to upgrade to a more sophisticated level. The same practice could be applied to container vessels, too. The degree of this upgrading depends on the policy of each operator. In order to quantify “improved bridge design” and the degree of the upgrading, the following sectors can be considered:
• Design of the workspace and the bridge layout • Navigational equipment • Human-machine interface.
As a result, the efficient performance of all navigation related tasks as well as good co-operation within the bridge team is enhanced by improved bridge design to enable efficient management of all operating conditions of the vessel. The following aspects of improved bridge design are included:
• Bridge layout and workstation arrangement • Task specific workstations
MSC 83/INF.8 ANNEX Page 39
I:\MSC\83\INF-8.doc
• Design and ergonomics of workstations including location of instruments • Field of vision from workstations • Bridge physical working environment
5.2.7 RCO 22: Integration of AIS with ARPA radar An Automatic Identification System (AIS) is designed to send and receive information in relation with a vessel’s identity (e.g. name, call sign, and dimensions), course (e.g. route, speed) and cargo. Current regulations, implemented mainly due to security reasons, require the information to be presented into an AIS display. The most common type of installed display (minimum required) provides three lines of data consisting of basic information of a selected target (name, range and bearing). Additional information regarding the target can be provided by scrolling. A huge amount of information received by the AIS is hidden behind the small display, and it is time consuming and distracting for the navigator to search for the information. The AIS can be connected to the radar’s Automatic Radar Plotting Aid (ARPA) function, and provide all the additional “hidden” data in the radar display. By selecting an AIS target into the ARPA display, the navigator will be able to see all available information for the particular vessel. In addition to the easier access of AIS information through the ARPA, there are five more areas where the AIS integration improves the radar performance:
• Detection of targets which are in radar shadow areas • Identification of radar targets with ship’s names • Takes account of the ships rate of turn (ROT), hence, predicting more accurately the
target’s path • In some cases extends radar’s range • Clarifies the target intentions.
AIS can become a useful source of supplementary information and an important tool in enhancing situation awareness of the traffic conditions. Benefits deriving from the AIS-ARPA interface will improve the navigator’s ability to make early decisions based on real-time data, and avoid potential collisions. The same RCO has been proposed for passenger ships /24/. 5.2.8 RCO 25: Additional officer on the bridge IMO regulates the minimum safe manning on the bridge by requiring the navigation as being able:
.1 to plan and conduct safe navigation; .2 to maintain a safe navigational watch, .3 to manoeuvre and handle the ship under all conditions, and .4 to moor and unmoor the ship safely.
Resolution A.890(21) calls for one navigational officer and one lookout on the bridge. However, in the cruise industry is most common to have two navigational officers on watch, i.e. one extra watch in difficult or critical situations, e.g. congested areas. Typically, the tasks and

MSC 83/INF.8 ANNEX Page 40
I:\MSC\83\INF-8.doc
responsibilities are clearly separated by having one officer focusing on navigation of the vessel in the waters while the other takes care of the traffic situation in the area or other tasks. Thereby the risk for navigational mistakes is reduced by the presence of two officers. Originally proposed for passenger vessels /24/, two variants are evaluated for container vessels:
a) One additional officer on the bridge anytime requires 6 extra officers per ship, 3 onboard and 3 onshore. Three officer cabins are needed in addition.
b) One additional officer on the bridge who will be activated in critical navigational situations.
On average this will be no more than 8 hours per day, hence two additional officers will suffice, one on board and one at shore. One officer cabin is needed in addition.
5.2.9 RCO 30: Electronic Chart Display and Information System (ECDIS) An Electronic Chart Display and Information System (ECDIS) is a real-time geographic information system that can be used as a navigation aid instead of nautical paper charts and publications to plan and display the ship’s route, and to plot and monitor positions throughout the intended voyage. It is capable of continuously determining a vessel’s position in relation to land, charted objects, navigational aids, possible unseen hazards, and represents a new approach to maritime navigation. In daily navigational operations, it can reduce the workload of the navigating officers compared to using paper charts. Route planning, monitoring and positioning will be performed in a more convenient and continuously real time way, enabling the navigator to have a continuous overview of the situation. ECDIS is a sophisticated electronic navigation system, which is possible to integrate with both the radar system and Automatic Identification System (AIS). The ECDIS is thus a powerful navigational tool, with potential for direct risk reduction for grounding and contact. Indirect effects are expected for collision scenarios. While this RCO has been evaluated in two variants for passenger vessels /24/, the current study only compares the introduction of ECDIS to the situation without ECDIS. Simultaneous introduction of ECDIS and track control is not considered. More recently, further studies on ECDIS have been submitted to IMO /25/, /26/, /27/. 5.2.10 RCO 31: Track control Track control and track keeping systems are based on a continuous comparison between the vessel’s actual course and the originally planned one. The route of the vessel is planned before departure and is provided as input to the track control system. The underlying assumption of track control systems is that a vessel can not run aground if the route is planned properly and if the ship follows the route throughout the entire voyage. By receiving real time information from navigational equipment, the system ensures that the planned route is followed. In case a deviation occurs, for example due to environmental forces, the vessel is corrected automatically to follow the track. Even though this is a powerful tool, it should be noted that the navigator must supervise the system and must take action if required. Implementation of track control systems will also liberate more time for the operating officer to monitor traffic conditions. This RCO has been proposed previously for passenger ships /24/.

MSC 83/INF.8 ANNEX Page 41
I:\MSC\83\INF-8.doc
5.2.11 RCO 32: Implementation of guidelines for Bridge Resource Management Bridge Resource Management (BRM) is a simple system of checks and delegation of duties aiming at efficient use of personnel and equipment during vessel operations. It is designed to reduce errors and omissions in bridge operations. BRM systems emphasize a co-ordinated effort among bridge personnel to ensure smooth, efficient and safe operation of the vessel. The 1995 amendments to the Standard of Training, Certification and Watchkeeping (STCW) include a requirement for training in bridge team procedures and a recommendation for training in BRM techniques. The main objectives of BRM are:
• To assist the ship master in managing the vessel’s bridge team for each voyage so that personnel are rested, trained and prepared to handle any situation.
• To help the ship master recognize workload demands and other risk factors that may affect decisions in setting watch conditions.
• To ensure bridge team members are trained and aware of their responsibilities. • To help bridge team members interact with and support the master and/or the pilot.
The implementation of BRM is assumed to involve some initial preparations of procedures to be followed and definition of relevant responsibilities. In addition, the bridge teams are assumed to go through a BRM course to assist the implementation. For communication and responsibilities that are connected to the onshore personnel, such training should also include key onshore personnel. Originally, this RCO has been proposed to improve the navigational safety for passenger ships /24/.

MSC 83/INF.8 ANNEX Page 42
I:\MSC\83\INF-8.doc
6 COST BENEFIT ASSESSMENT 6.1 Methodology 6.1.1 Assessment criteria The cost effectiveness of a risk control option is assessed in terms of Gross Cost of Averting a Fatality (GCAF) and Net Cost of Averting a Fatality (NCAF), where both indices are defined according to /3/:
CGCAFR
∆=∆
C BNCAFR
∆ −∆=
∆
where:
C∆ is the cost of implementing this risk control option during a ship’s lifetime B∆ is the economic benefit resulting from the implementation of the risk
control option during a ship’s lifetime R∆ is the risk reduction, in terms of the number of fatalities averted, due to the
implementation of the risk control option during a ship’s lifetime. In accordance with current practice within IMO and the proposals presented to MSC, a risk control option is regarded as cost-effective if its GCAF ≤ US$ 3 million /29/, /5/. Cost effective measures with notable potential for risk reduction are recommended for implementation. Higher GCAF/NCAF values indicate that a RCO is not cost effective. Negative NCAF values indicate that an RCO is economically beneficial in itself, i.e. the expected economic benefits outweigh the implementation costs. Further investigations might be required for risk control options with a GCAF close to US$3 million. 6.1.2 Data sources Cost estimates are based on information from suppliers, service providers, training centres, yards, technical experts and previous studies where appropriate. Economic benefits and risk reduction ascribed to each risk control option were calculated using the event trees developed during the risk analysis and include considerations about the accident scenarios affected. As a basis for cost benefit calculations, the following assumptions were made for an average container vessel:
• Crew size : 20 • Expected lifetime: 20 years • Depreciation rate: 5% • Newbuilding price: US$51.75 million • Value of 20 ft container /36/: US$20,000 • Payload capacity at 14 t homog. load: 2,175 TEU
Payload capacity and newbuilding price are calculated as an average of both reference vessels.

MSC 83/INF.8 ANNEX Page 43
I:\MSC\83\INF-8.doc
All calculations assume that one risk control option is introduced at a time. Although simultaneous introduction of several risk control options has not been investigated, it is reasonable to expect that the cost-effectiveness will be less than the sum of individual NCAF/GCAF values. 6.1.3 Calculation of costs and benefits Costs and benefits of an RCO typically spread over the lifetime of the vessel. To facilitate consistent and comparable calculation of all costs and benefits for NCAF and GCAF, net present values (NPVs) are used:
( ) ( ) ( ) ( )∑= +
+=+
+++
++
+=T
tt
tT
T
rX
Ar
Xr
Xr
XANPV
12
21
11....
11
where:
Xt is the cost (or benefit) of RCO in year t, A is the amount spent initially for implementation of an RCO, r is the depreciation rate, and T lifetime of the vessel.
For constant annual costs, the formula above can further be simplified to:
( )
T
tt 1
1NPV A X1 r=
= ++
∑
The direct costs of a measure consist of two parts: initial costs and running costs over the lifetime of the vessel. Initial costs include all costs of implementing the measure, e.g. acquiring and installing equipment, writing of procedures and training of crew. Thereafter there might be additional costs at regular intervals in order to maintain the effect of the measure, e.g. equipment service and refresher courses. The additional cost might for example be annual, bi-annual or every 5 years. 6.2 Risk reduction To determine the potential risk reduction due to implementation of a risk control option, the event tree models developed during risk analysis were used. In addition, general high level fault tree models, other available FSAs, or engineering/expert judgements have been used to supplement the event tree evaluation. For preventive risk control options, a reduction of the initiating frequency was assumed, resulting in proportional reductions of consequences. For mitigating risk control options the reduction was calculated by variation of characterizing quantities specified as nodes or sub-trees of the event trees. In some cases, the event tree model had to be extended. The resulting risk reduction, expressed in terms of lives saved per vessel lifetime, served as input to the calculation of GCAF and NCAF values. The table below summarizes the risk reduction effects due to implementation of RCOs. The risk reduction is calculated per ship year and the risk reduction relates to the total PLL value before introduction of the respective RCO. Details about risk reduction, e.g. associated with specific accident scenarios, can be found in Annex A.6.

MSC 83/INF.8 ANNEX Page 44
I:\MSC\83\INF-8.doc
Table 21: Risk reduction achieved by implementing RCOs
RCO No. Risk Control Option ∆PLL
(per ship year) Reduction
% 3 a) Increased efficiency of bilge system (conventional design) 2.47 x 10⁻⁵ 0.3% 3 b) Increased efficiency of bilge system (open-top design) 1.24 x 10⁻⁴ 1.4% 4 a) High bilge level alarm in cargo holds (conventional design) 2.19 x 10⁻⁴ 2.4% 4 b) High bilge level alarm in cargo holds (open-top design) 1.10 x 10⁻³ 12.2% 4 c) Second bilge alarm in cargo holds (conventional design) 2.47 x 10⁻⁵ 0.3% 4 d) Second bilge alarm in cargo holds (open-top design) 1.24 x 10⁻⁴ 1.4% 5 Improved navigator training 4.51 x 10⁻⁴ 5.0% 10 a) Bow camera system (standard) 1.35 x 10⁻⁵ 0.2% 10 b) Bow camera system (incl. night vision) 2.03 x 10⁻⁵ 0.2% 11 Reduced amount of undeclared dangerous goods 5.89 x 10⁻⁵ 0.7% 15 Improved bridge design 9.96 x 10⁻⁴ 11.0% 22 AIS integrated with radar 7.33 x 10⁻⁴ 8.1% 25 a) Additional officer on the bridge (always ) 9.71 x 10⁻⁴ 10.8% 25 b) Additional officer on the bridge (on demand) 7.47 x 10⁻⁴ 8.3% 30 ECDIS 3.09 x 10⁻³ 3.4% 31 Track control system 2.84 x 10⁻⁴ 3.2% 32 Implementation of BRM guidelines 3.96 x 10⁻⁴ 4.4% 6.3 Costs of Implementation and Economic Benefits The table below summaries costs of implementation and expected economic benefits for each RCO. All figures are net present values. For more details of cost calculations see Annex A.6.
Table 22: Lifetime implementation costs for and economic benefits from RCOs (NPV)
RCO No. Risk Control Option Cost Benefits
3 a) Increased efficiency of bilge system (conventional design)
$70,900 $23,200
3 b) Increased efficiency of bilge system (open-top design) $70,900 $116,300 4 a) High bilge level alarm in cargo holds (conventional
design) $37,900 $206,200
4 b) High bilge level alarm in cargo holds (open-top design) $37,900 $1,033,900 4 c) Second bilge alarm in cargo holds (conventional design) $37,900 $23,200 4 d) Second bilge alarm in cargo holds (open-top design) $37,900 $116,300 5 Improved navigator training $105,100 $53,500 10 a) Bow camera system (standard) $29,600 $6,500 10 b) Bow camera system (incl. night vision) $165,300 $9,700
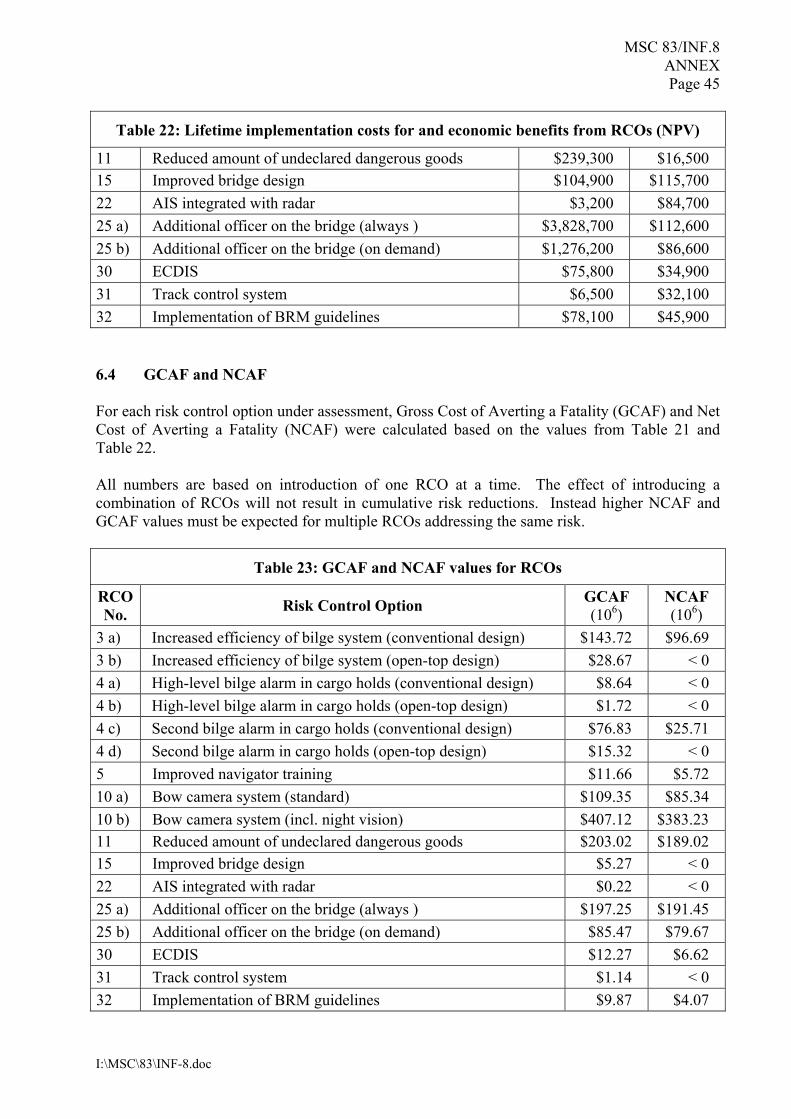
MSC 83/INF.8 ANNEX Page 45
I:\MSC\83\INF-8.doc
Table 22: Lifetime implementation costs for and economic benefits from RCOs (NPV)
11 Reduced amount of undeclared dangerous goods $239,300 $16,500 15 Improved bridge design $104,900 $115,700 22 AIS integrated with radar $3,200 $84,700 25 a) Additional officer on the bridge (always ) $3,828,700 $112,600 25 b) Additional officer on the bridge (on demand) $1,276,200 $86,600 30 ECDIS $75,800 $34,900 31 Track control system $6,500 $32,100 32 Implementation of BRM guidelines $78,100 $45,900 6.4 GCAF and NCAF For each risk control option under assessment, Gross Cost of Averting a Fatality (GCAF) and Net Cost of Averting a Fatality (NCAF) were calculated based on the values from Table 21 and Table 22. All numbers are based on introduction of one RCO at a time. The effect of introducing a combination of RCOs will not result in cumulative risk reductions. Instead higher NCAF and GCAF values must be expected for multiple RCOs addressing the same risk.
Table 23: GCAF and NCAF values for RCOs
RCO No. Risk Control Option GCAF
(106) NCAF (106)
3 a) Increased efficiency of bilge system (conventional design) $143.72 $96.69 3 b) Increased efficiency of bilge system (open-top design) $28.67 < 0 4 a) High-level bilge alarm in cargo holds (conventional design) $8.64 < 0 4 b) High-level bilge alarm in cargo holds (open-top design) $1.72 < 0 4 c) Second bilge alarm in cargo holds (conventional design) $76.83 $25.71 4 d) Second bilge alarm in cargo holds (open-top design) $15.32 < 0 5 Improved navigator training $11.66 $5.72 10 a) Bow camera system (standard) $109.35 $85.34 10 b) Bow camera system (incl. night vision) $407.12 $383.23 11 Reduced amount of undeclared dangerous goods $203.02 $189.02 15 Improved bridge design $5.27 < 0 22 AIS integrated with radar $0.22 < 0 25 a) Additional officer on the bridge (always ) $197.25 $191.45 25 b) Additional officer on the bridge (on demand) $85.47 $79.67 30 ECDIS $12.27 $6.62 31 Track control system $1.14 < 0 32 Implementation of BRM guidelines $9.87 $4.07

MSC 83/INF.8 ANNEX Page 46
I:\MSC\83\INF-8.doc
7 REFERENCES /1/ Germanischer Lloyd: Rules for Classification and Construction, I - Ship Technology,
Part I, Seagoing Ships, Section 2 Machinery Installations, Hamburg, 2004 /2/ Lloyd Register Fairplay, world fleet database, January 2007 /3/ Guidelines for the Formal Safety Assessment, MSC/Circ.1023, International Maritime
Organization (IMO), 2002 /4/ Design, Operation and Regulation for Safety, EU Integrated Project 516278 /5/ FSA – Decision parameters including risk acceptance criteria, MSC 72/16, International
Maritime Organization (IMO), 2000 /6/ Interim Guidelines for Open-Top Containerships, MSC/Circ.608/Rev.1, International
Maritime Organization (IMO), 1994 /7/ Lloyd Maritime Information Unit: Casualty database, December 2004 /8/ FSA on LNG carriers, MSC 83/21/1, International Maritime Organization (IMO), 2007 /9/ UNCTAD Review Maritime Transport 2005 /10/ International Maritime Dangerous Goods (IMDG) Code, International Maritime
Organization (IMO), 2004 /11/ International Convention for the Safety of Life at Sea, (SOLAS), International Maritime
Organization (IMO), Consolidated Edition, London, 2004 /12/ Skjong, R., Vanem, E. Collision and Grounding of Passenger Ships – Risk Assessment
and Emergency Evacuations, ICCGS 2004 /13/ Spounge, John. 1999. A Guide to Quantitative Risk Assessment for Offshore Structures /14/ Swedish Club, Letter No 2, 2005 /15/ Bahamas Maritime Authority and Danish Division for Investigation of Maritime
Accidents. 2005. Karen Danielsen collision with Great Baelt West bridge, Joint Bahamas Maritime Authority and Danish Division for Investigation of Maritime Accidents report, 17 August 2005
/16/ Povel, D. Collision Risk Analysis for Offshore Structures and Offshore Wind Parks, OMEA 2006
/17/ Lützen, M. Ship Collision Damages, PhD Thesis, Technical University of Denmark, Department of Mechanical Engineering, December 2001
/18/ Laubenstein, L., Mains, Ch., Jost, A., Tagg, R. Updated probabilistic Extents of damage based on actual collision data
/19/ Proposed Amendments to the revised MARPOL Annex I (Addition of new regulation 13A on oil fuel tank protection), International Maritime Organization (IMO), MEPC 53/24/Add.2, 2005
/20/ Tosseviken, A., and J. Bergmann. 2003. Cargo Fires on Container Ships. DNV Technical Paper – Paper Series No. 2003-P013. Det Norske Veritas, Section for Fire Safety
/21/ Povel, D. Cargo Safety – Qualitative Design Review (QDR), Deliverable 2.5.3, SAFEDOR, 2005
/22/ Giant boxships and the spectre of cargo fires, 2003-11-10, www.hazcheck.com [January 2006]
/23/ Melander, A. Efterlevs regelverket? Erfarenheter från inspektion. Material from presentation at seminar Säkra transporter från sjö till land, Stockholm, 2001
/24/ FSA Large Passenger Ships - Navigation Safety Progress report, NAV 49/INF.2, International Maritime Organization, 2003
/25/ FSA Study on ECDIS/ENCs, IMO MSC 81/24/5, International Maritime Organization, submitted by Denmark and Norway
/26/ FSA Study on ECDIS/ENCs: Details on Risk Assessment and Cost Benefit Assessment, IMO MSC 81/INF.9, submitted by Denmark and Norway, International Maritime Organization

MSC 83/INF.8 ANNEX Page 47
I:\MSC\83\INF-8.doc
/27/ Evaluation of the effect of ECDIS, ENC and Track control by using Bayesian network, IMO MSC 81/18/1, International Maritime Organization, submitted by Japan, 2006
/28/ SOLAS chapter V, regulation 22 /29/ Skjong, Vanem, Endresen. Risk Evaluation Criteria, Deliverable D.4.5.2, SAFEDOR,
2006 /30/ Swedish Club. Personal communication with Björn Forsman, February 2006 /31/ Maritime Administrator, Republic of the Marshall Islands. 1999. Decision of the
Maritime Administrator Republic of the Marshall Islands and the Report of Investigation In the Matter of the Explosion and Fire On Board the Container Vessel SEA-LAND MARINER – O.N. 1100 Off the Island of Crete on 18 April 1998
/32/ Bridge Watchkeeping Safety Study, MAIB Marine Accident Investigation Branch United Kingdom, July 2004
/33/ Hernis Scan Systems AS, Norway /34/ Heaton, M. 2003. The use of Gamma Systems and associated support to create viable and
efficient Cargo Screening. Maritime Security Conference, Hamburg, 2003 /35/ Clarkson Research Services Ltd., World Shipyard Monitor, 15 February 2006 /36/ Containers. Transport, Technology, Insurance, Munich Re Group, 2002 /37/ Guide for the Assessment of Parametric Roll Resonance in the Design of Container
Carriers, American Bureau of Shipping, 2004 /38/ France, W.N, Levadou, M., Treakle, T.W., Paulling, J.R., Michel, R.K., and C. Moore.
An Investigation of Head-Sea Parametric Rolling and Its Influence on Container Lashing Systems. Marine Technology. Vol. 40, No. 1. pp. 1-19, 2003
MSC 83/INF.8 ANNEX Page 48
I:\MSC\83\INF-8.doc
APPENDIX A.1 Expert workshops for risk control options A number of expert workshops were held aiming at identification, assessment and prioritization of risk control options. Part of the workshops was brainstorming sessions recording potential risk control options proposed by the experts. Subsequently, the experts were asked to rank and rate all identified risk control options in terms of perceived cost effectiveness. Finally, the most promising options were selected for a more detailed analysis of cost effectiveness based on the ranking. The group of the workshop participants provided comprehensive expertise in design, operation, and regulation of container vessels as well as in risk analysis and also represented a significant share of the maritime industry involved in container shipping. Two meetings were held in Hamburg on 2006-02-22 and 2006-03-29 with the following participants: Kurt Riedel Döhle Ship owner Björn Forsman SSPA Ship design centre Joanne Ellis SSPA Ship design centre Susann Gehl Aker MTW Ship yard Uwe Langbecker GL Classification society A further meeting took place in Wismar 2006-02-16 with the following participants: Guido Schulte Aker MTW Ship yard Torsten Voht Aker MTW Ship yard Gerd Milbradt Aker MTW Ship yard Susann Gehl Aker MTW Ship yard An additional meeting aiming at development and quantification of the risk model for heavy weather incidents was held on 2007-05-15 in Hamburg, with the following participants: Pierre Sames GL Classification society Helge Rathje GL Classification society Betar El Moctar GL Classification society Marcus Ihms GL Classification society Vanessa Vieira Belchior GL Classification society Uwe Langbecker GL Classification society

MSC 83/INF.8 ANNEX Page 49
I:\MSC\83\INF-8.doc
A.2 Short CV’s of workshop participants Björn Forsman, Project Manager, M.Sc. Mech. Eng. From 1980, when he joined SSPA, Mr Forsman has been active in areas related to marine environment, oil spill prevention and spill clean-up. For the last ten years, maritime safety and risk analysis have also become important fields of expertise in his projects as well as in the research projects that he is engaged in. He is also regularly engaged as expert lecturer in SSPAs international training programmes on sustainable coastal development, marine pollution prevention and maritime safety. Joanne Ellis Joanne Ellis has worked as project manager at SSPA Sweden AB since 1999, carrying out projects in the areas of risk, safety, and environment assessment of marine transport. Educational background includes a BSc Civil Engineering (1985) from UNB, an MASc Environmental Engineering (1991) from UBC, and a Licentiate Degree (2003) from Chalmers University of Technology, Sweden, with a thesis on the topic of risk assessment of dangerous goods transport. Prior to working at SSPA, she worked for ten years in Canada on civil and environmental engineering projects. Susann Gehl Susann Gehl studied ship engineering at the University in Rostock, finished with a Dipl.-Ing. degree in ship engineering in 1988. After joining the company, Aker MTW Wismar (former MTW shipyard) she has been working as a project engineer in the project and development department. She also gained experiences in working and managing of research projects. Starting in September 2004 she joined the new R&D Department as project/research engineer in the field of conceptual design of propulsion, machinery, cargo and common ship systems and as design/bid manager for newbuilding projects. Guido Schulte After obtaining his Diplom-Ingenieur degree in Naval Architecture at Duisburg University, Guido Schulte started his career at MTW Schiffswerft in 1996 as project engineer, followed by several years as project design manager / bid manager for newbuilding projects and R&D manager for related research. When the German Aker and Kvaerner branches merged to Aker Ostsee and later Aker Yards, Germany (AYG), he joined the new R&D Department as R&D project manager and senior researcher in the field of conceptual ship design, before he took on his current position as Head of Research and Development in 2005. Torsten Voht After obtaining his Doctor-engineer degree in Naval Architecture at Rostock University, Claus-Torsten Voht started his career at the Institute of Shipbuilding Techniques of the East German Shipbuilding Group in 1989 as project engineer. Several years he worked as project engineer for newbuilding projects at Neptun Shipyard and after merger with Warnow Shipyard at this shipyard. With handover of Warnow Shipyard by Kvaerner he works as project engineer for newbuilding projects and research projects within the Kvaerner Group. When the German Aker and Kvaerner branches merged to Aker Ostsee and later Aker Yards, Germany (AYG), he joined the new R&D Department as R&D project manager and senior researcher in the field of conceptual ship design.

MSC 83/INF.8 ANNEX Page 50
I:\MSC\83\INF-8.doc
Gerd Milbradt Gerd Milbradt works as project engineer at Aker Yards. He started his career at University of Rostock in 1990 as a PhD aspirant after obtaining his Dipl.-Ing. degree in naval architecture. He has several years of experience in dealing with R&D projects and related research and worked as member of the Project department at Kvaerner Warnow Werft. When the German Aker and Kvaerner branches became Aker Ostsee, he joined the new R&D Department as a R&D co-ordinator. Helge Rathje Helge Rathje is head of the “Analysis of Hull Structures and Damages” Department at Germanischer Lloyd (GL). Before joining GL in 1994, he worked for MAERSK Shipping Line as a freight co-ordinator in Hamburg. His technical background primarily comprises seakeeping analysis and statistical evaluation of wave loads and ship motions. The development of rules for ship loads and structural strength belong to his tasks. Furthermore, he is responsible for the assessment of rule related ship damages. Uwe Langbecker Uwe Langbecker is deputy head of department “CAE development” at Germanischer Lloyd (GL). He holds a degree in mathematics from Technical University Dresden. Before joining GL as research engineer in 1996 he worked as research associate at the Institute of Naval Architecture and Ocean Engineering at Technical University Berlin. Mr. Langbecker has worked as project manager for several national and international R&D projects with focus on the application of information technology in the maritime domain for more than 15 years. His technical background is applied mathematics, computer geometry, data modelling and software engineering.

MSC 83/INF.8 ANNEX Page 51
I:\MSC\83\INF-8.doc
A.3 Review of current measures The table below lists applicable rules and regulations, both generic and specific to container vessels.
Table 24: International rules, regulations and guidelines for container vessels
Code Full Title Source Version SOLAS International Convention for Safety of Life at Sea 2004 HSSC Harmonized System of Surveys and Certification SOLAS 2000 INF International Code for the safe carriage of
packaged irradiated nuclear fuel, plutonium and high-level radioactive wastes on board ships
SOLAS MSC.88(71)
2001
Inspection of watertight bulkheads SOLAS MSC.69(69)
2002
CSM Cargo Securing Manual SOLAS MSC.69(69)
2002
FSS International Code for Fire Safety Systems MSC.98(73) 2002 FTP Fire Test Procedures Code MSC.80(43) 2002 Jacket Piping and insulation SOLAS
MSC.31(63) 2003
IMDG International Maritime Dangerous Goods Code SOLAS MSC.123(75)
2004/2006
AIS Automatic identification system SOLAS 2004 Special Measures to enhance Maritime Security SOLAS,
chapter XI-2 2004
ILLC 66/88 International Convention on Load lines MSC.143(77) 2005 Interim Guidelines for Open-Top Containerships MSC/Circ.608 1994, Rev.1 SOLAS 2000, chapter V MSC/Circ.864 2000 CSS Code of Safe practice for cargo stowage and
securing 1992
LSA International Life-saving Appliance Code 2003 MARPOL International Convention for Prevention of
Pollution from Ships including Annex VI “Prevention of Air Pollution from Ships” (1997)
1973/78, 1991 plus amendments
COLREG Convention on the International Regulations for Preventing Collisions at Sea, amendments adopted up to 1993 + resolution A.910(22)
1972 / 2002
International Convention on Tonnage Measurement of Ships, amended by IMO resolutions A.493(XII) and A.494(XII)
1969
STCW International Convention on Standards of Training, Certification and Watch keeping for Seafarers
1978
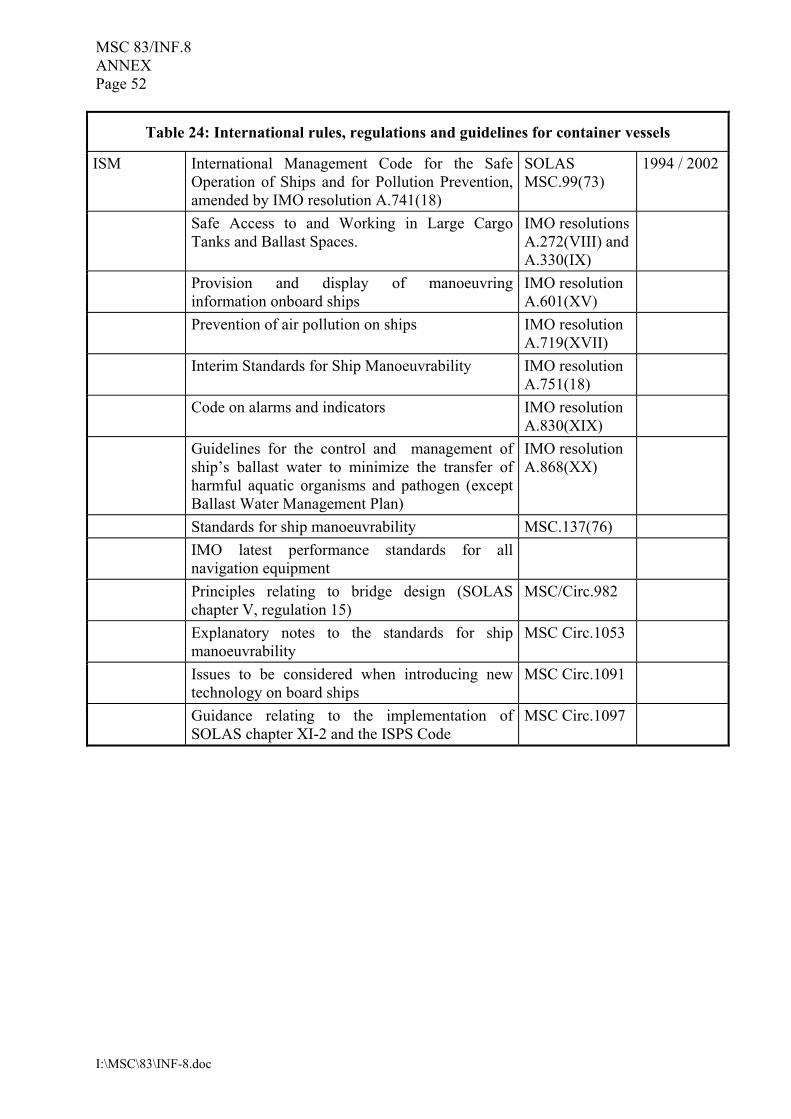
MSC 83/INF.8 ANNEX Page 52
I:\MSC\83\INF-8.doc
Table 24: International rules, regulations and guidelines for container vessels
ISM International Management Code for the Safe Operation of Ships and for Pollution Prevention, amended by IMO resolution A.741(18)
SOLAS MSC.99(73)
1994 / 2002
Safe Access to and Working in Large Cargo Tanks and Ballast Spaces.
IMO resolutions A.272(VIII) and A.330(IX)
Provision and display of manoeuvring information onboard ships
IMO resolution A.601(XV)
Prevention of air pollution on ships IMO resolution A.719(XVII)
Interim Standards for Ship Manoeuvrability IMO resolution A.751(18)
Code on alarms and indicators IMO resolution A.830(XIX)
Guidelines for the control and management of ship’s ballast water to minimize the transfer of harmful aquatic organisms and pathogen (except Ballast Water Management Plan)
IMO resolution A.868(XX)
Standards for ship manoeuvrability MSC.137(76) IMO latest performance standards for all
navigation equipment
Principles relating to bridge design (SOLAS chapter V, regulation 15)
MSC/Circ.982
Explanatory notes to the standards for ship manoeuvrability
MSC Circ.1053
Issues to be considered when introducing new technology on board ships
MSC Circ.1091
Guidance relating to the implementation of SOLAS chapter XI-2 and the ISPS Code
MSC Circ.1097
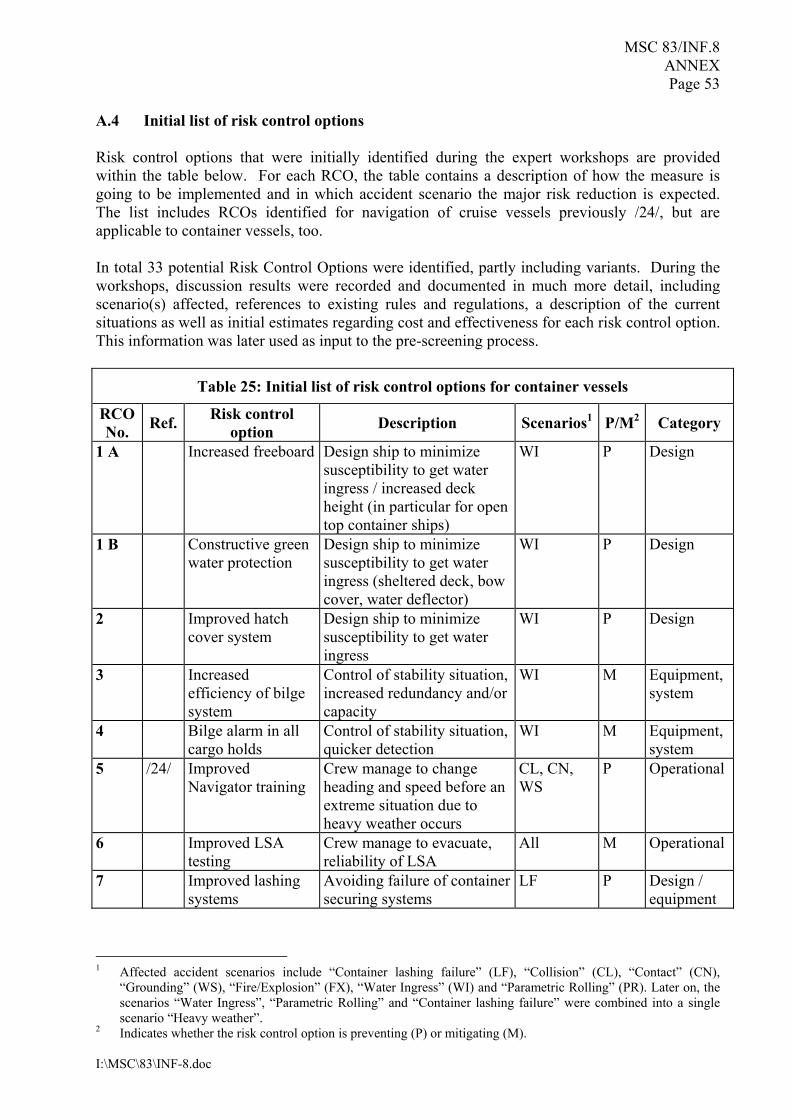
MSC 83/INF.8 ANNEX Page 53
I:\MSC\83\INF-8.doc
A.4 Initial list of risk control options Risk control options that were initially identified during the expert workshops are provided within the table below. For each RCO, the table contains a description of how the measure is going to be implemented and in which accident scenario the major risk reduction is expected. The list includes RCOs identified for navigation of cruise vessels previously /24/, but are applicable to container vessels, too. In total 33 potential Risk Control Options were identified, partly including variants. During the workshops, discussion results were recorded and documented in much more detail, including scenario(s) affected, references to existing rules and regulations, a description of the current situations as well as initial estimates regarding cost and effectiveness for each risk control option. This information was later used as input to the pre-screening process.
Table 25: Initial list of risk control options for container vessels
RCO No. Ref. Risk control
option Description Scenarios1 P/M2 Category
1 A Increased freeboard Design ship to minimize susceptibility to get water ingress / increased deck height (in particular for open top container ships)
WI P Design
1 B Constructive green water protection
Design ship to minimize susceptibility to get water ingress (sheltered deck, bow cover, water deflector)
WI P Design
2 Improved hatch cover system
Design ship to minimize susceptibility to get water ingress
WI P Design
3 Increased efficiency of bilge system
Control of stability situation, increased redundancy and/or capacity
WI M Equipment, system
4 Bilge alarm in all cargo holds
Control of stability situation, quicker detection
WI M Equipment, system
5 /24/ Improved Navigator training
Crew manage to change heading and speed before an extreme situation due to heavy weather occurs
CL, CN, WS
P Operational
6 Improved LSA testing
Crew manage to evacuate, reliability of LSA
All M Operational
7 Improved lashing systems
Avoiding failure of container securing systems
LF P Design / equipment
1 Affected accident scenarios include “Container lashing failure” (LF), “Collision” (CL), “Contact” (CN),
“Grounding” (WS), “Fire/Explosion” (FX), “Water Ingress” (WI) and “Parametric Rolling” (PR). Later on, the scenarios “Water Ingress”, “Parametric Rolling” and “Container lashing failure” were combined into a single scenario “Heavy weather”.
2 Indicates whether the risk control option is preventing (P) or mitigating (M).

MSC 83/INF.8 ANNEX Page 54
I:\MSC\83\INF-8.doc
Table 25: Initial list of risk control options for container vessels
RCO No. Ref. Risk control
option Description Scenarios1 P/M2 Category
8 Exact weight distribution
Avoiding container securing failures and stability problems
LF P Operational
9 Ship board routing assistance
Identification and avoidance of speed/headings likely to generate parametric roll/large motions
WI, PR P Equipment
10 Bow camera systems
Improving near range visual observation sector for vessels with high deck loads to avoid collision, contact
CL, CN P Equipment
11 Reduced amount of undeclared DG
Inspections, x-ray and screening systems
FX P Operational
12 Increased effectiveness of fire protection system
Measures to (avoid) or keep fire/explosion under control
FX M Equipment
13 Constructive roll damping devices
Anti-heeling system or stabilizer to resist roll motions, reducing of amount of green water
WI, PR M Equipment
14 Modified hull shape
Design ship to minimize susceptibility to head seas parametric roll
PR P Design
15 /24/ Improved bridge design a) above average b) above SOLAS
to decrease navigation failure
CL, CN, WS
P Design
16 /24/ Automatic logging of information / Electronic Logbook
to decrease navigation failure
CL, CN P Equipment
17 Redundant navigation equipment in separate rooms
to avoid black out of navigating system
CL, CN, WS
P Design / equipment
18 Enhanced weather routing
to avoid hazardous weather situations
CL, WI, PR
P Equipment
19 Redundant main propulsion components
to increase redundancy of propulsion systems, improved manoeuvrability
All P Equipment, system
20 Increasing of numbers of watertight compartments
Increased stability in flooded condition
CL, CN, WS, WI
M Design

MSC 83/INF.8 ANNEX Page 55
I:\MSC\83\INF-8.doc
Table 25: Initial list of risk control options for container vessels
RCO No. Ref. Risk control
option Description Scenarios1 P/M2 Category
21 Device to reduce the intake of green water into cargo holds
Protection measure for water ingress for hatch coverless ships
WI P Equipment
22 /24/ Integration of AIS with ARPA radar
Improved navigation equipment
CL, CN, WS
P Equipment
23 Track predictor integrated in the bridge system
Improved navigation equipment
CL, CN, WS
P Equipment
24 Enhanced external info/pilot guidance
Improved navigation operation
CL, CN, WS
P Operational
25 /24/ Additional officer on the bridge a) on demand b) always
Improved navigation operation
CL, CN, WS
P Operational
26 Drift prediction handbook
to enable calculation of stranding time
WS M Operational
27 Emergency offloading/ lightering facilities
to avoid / decrease environmental impact, cargo losses
WS M Operational, third party equipment
28 Emergency oil spill recovery equipment
to avoid / decrease environmental impact
CL, WS M Equipment
29 /24/ Onboard safety and security centre
Improved navigation operation
CL, CN, WS
P Equipment
30 /24/ ECDIS a) without track
control b) with track
control
Improved navigation equipment
CL, WS P Equipment
31 /24/ Track control Improved navigation equipment
CL, WS P Equipment
32 /24/ Implementation of guidelines of BRM
Improved navigation operation
CL, CN, WS
P Operational
33 /24/ Improved Navigation system availability
Improved navigation equipment
CL, CN, WS
P Equipment

MSC 83/INF.8 ANNEX Page 56
I:\MSC\83\INF-8.doc
A.5 Risk Control Options after Pre-Screening All risk control options identified during the expert workshops were then discussed and ranked by experts, taking into account the following aspects:
• Approximate risk reduction in terms of fatality avoided • Estimated other benefits (NCAF) • Approximate costs • Maximum expected risk reduction • Availability of cost information
Accordingly, priorities (low, medium, high) were assigned to each risk control option, see Table 26.
Table 26: RCO priority according to pre-screening
Scenario High Medium Low Collision RCO 10 RCOs 5, 15, 18, 22, 23, 24, 25 RCOs 6, 17, 19, 20, 28 Grounding RCOs 5, 15, 18, 23, 24, 25 RCOs 6, 17, 19, 20, 26, 27, 28 Fire/explosion RCOs 11, 12B, 12E RCOs 6, 12A, 12C, 12D, 12F Water ingress RCOs 3, 4, 5, 9, 13, 18 RCOs 1A, 1B, 2, 6, 19, 20, 21 Contact RCO 10 RCOs 5, 15, 18, 22, 23, 24, 25 RCOs 6, 17, 20 Other RCOs 8, 9, 13, 18 RCOs 7, 14 The following risk control options received medium or high priority:
• RCO 10 Bow camera systems • RCO 5 Improved Navigator training • RCO 11 Reduced amount of undeclared DG • RCO 4 Bilge alarm in all cargo holds • RCO 3 Increased efficiency of bilge system
Furthermore, the following RCOs adopted from the FSA Navigation seemed to offer a high potential for risk reduction:
• RCOs 15, 22, 25, 30, 31, 32 In total 11 risk control options were selected for a more detailed assessment with respect to cost-effectiveness.
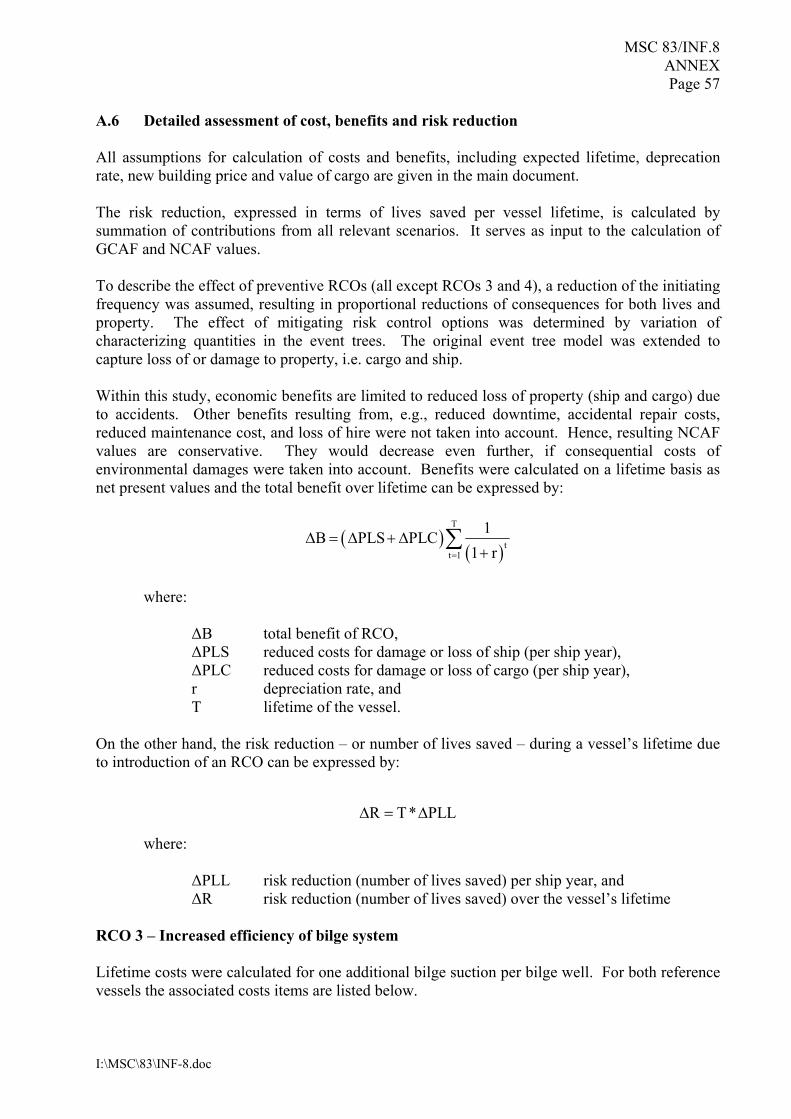
MSC 83/INF.8 ANNEX Page 57
I:\MSC\83\INF-8.doc
A.6 Detailed assessment of cost, benefits and risk reduction All assumptions for calculation of costs and benefits, including expected lifetime, deprecation rate, new building price and value of cargo are given in the main document. The risk reduction, expressed in terms of lives saved per vessel lifetime, is calculated by summation of contributions from all relevant scenarios. It serves as input to the calculation of GCAF and NCAF values. To describe the effect of preventive RCOs (all except RCOs 3 and 4), a reduction of the initiating frequency was assumed, resulting in proportional reductions of consequences for both lives and property. The effect of mitigating risk control options was determined by variation of characterizing quantities in the event trees. The original event tree model was extended to capture loss of or damage to property, i.e. cargo and ship. Within this study, economic benefits are limited to reduced loss of property (ship and cargo) due to accidents. Other benefits resulting from, e.g., reduced downtime, accidental repair costs, reduced maintenance cost, and loss of hire were not taken into account. Hence, resulting NCAF values are conservative. They would decrease even further, if consequential costs of environmental damages were taken into account. Benefits were calculated on a lifetime basis as net present values and the total benefit over lifetime can be expressed by:
( )( )
T
tt 1
1B PLS PLC1 r=
∆ = ∆ + ∆+
∑
where:
∆B total benefit of RCO, ∆PLS reduced costs for damage or loss of ship (per ship year), ∆PLC reduced costs for damage or loss of cargo (per ship year), r depreciation rate, and T lifetime of the vessel.
On the other hand, the risk reduction – or number of lives saved – during a vessel’s lifetime due to introduction of an RCO can be expressed by:
R T* PLL∆ = ∆
where:
∆PLL risk reduction (number of lives saved) per ship year, and ∆R risk reduction (number of lives saved) over the vessel’s lifetime
RCO 3 – Increased efficiency of bilge system Lifetime costs were calculated for one additional bilge suction per bilge well. For both reference vessels the associated costs items are listed below.
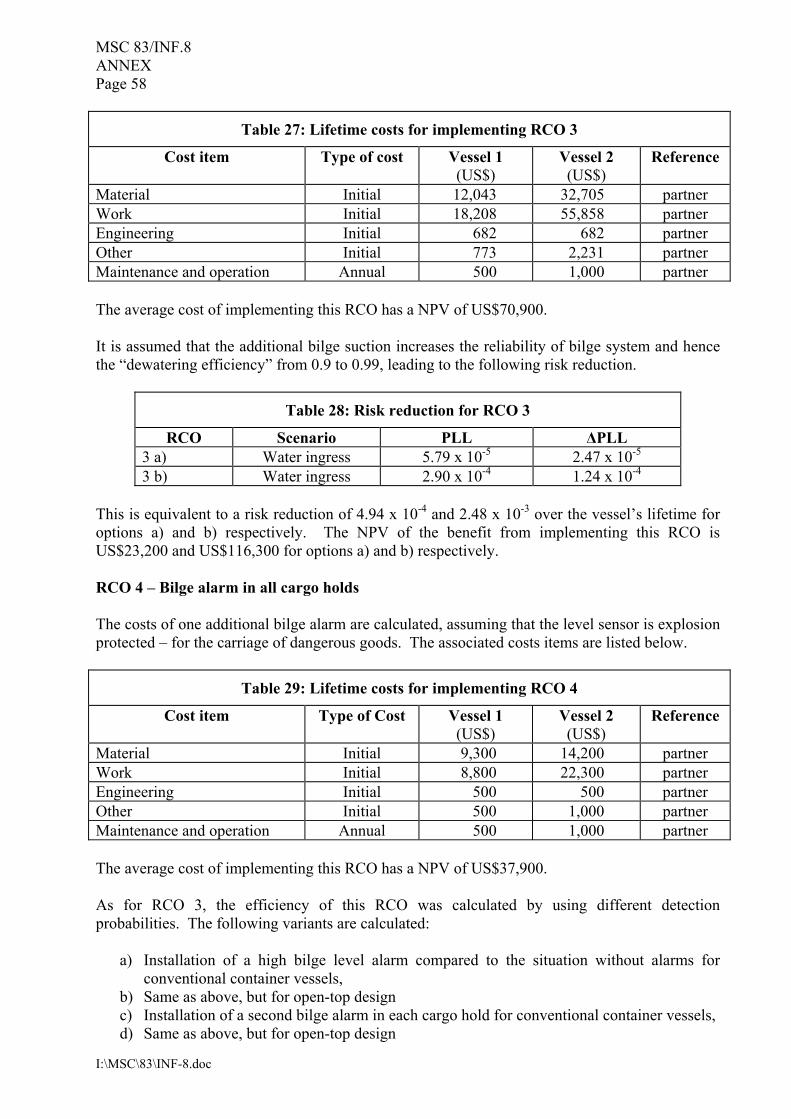
MSC 83/INF.8 ANNEX Page 58
I:\MSC\83\INF-8.doc
Table 27: Lifetime costs for implementing RCO 3
Cost item Type of cost Vessel 1 (US$)
Vessel 2 (US$)
Reference
Material Initial 12,043 32,705 partner Work Initial 18,208 55,858 partner Engineering Initial 682 682 partner Other Initial 773 2,231 partner Maintenance and operation Annual 500 1,000 partner The average cost of implementing this RCO has a NPV of US$70,900. It is assumed that the additional bilge suction increases the reliability of bilge system and hence the “dewatering efficiency” from 0.9 to 0.99, leading to the following risk reduction.
Table 28: Risk reduction for RCO 3
RCO Scenario PLL ∆PLL 3 a) Water ingress 5.79 x 10⁻⁵ 2.47 x 10⁻⁵ 3 b) Water ingress 2.90 x 10⁻⁴ 1.24 x 10⁻⁴
This is equivalent to a risk reduction of 4.94 x 10⁻⁴ and 2.48 x 10⁻³ over the vessel’s lifetime for options a) and b) respectively. The NPV of the benefit from implementing this RCO is US$23,200 and US$116,300 for options a) and b) respectively. RCO 4 – Bilge alarm in all cargo holds The costs of one additional bilge alarm are calculated, assuming that the level sensor is explosion protected – for the carriage of dangerous goods. The associated costs items are listed below.
Table 29: Lifetime costs for implementing RCO 4
Cost item Type of Cost Vessel 1 (US$)
Vessel 2 (US$)
Reference
Material Initial 9,300 14,200 partner Work Initial 8,800 22,300 partner Engineering Initial 500 500 partner Other Initial 500 1,000 partner Maintenance and operation Annual 500 1,000 partner The average cost of implementing this RCO has a NPV of US$37,900. As for RCO 3, the efficiency of this RCO was calculated by using different detection probabilities. The following variants are calculated:
a) Installation of a high bilge level alarm compared to the situation without alarms for conventional container vessels,
b) Same as above, but for open-top design c) Installation of a second bilge alarm in each cargo hold for conventional container vessels, d) Same as above, but for open-top design
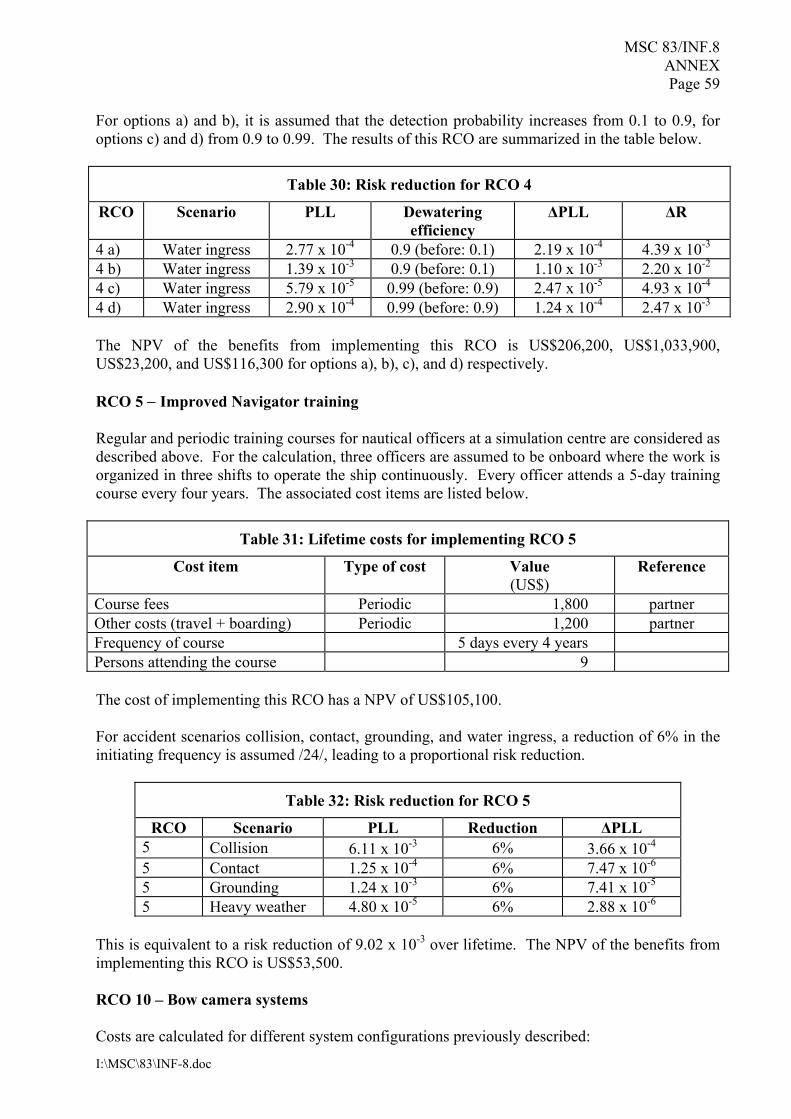
MSC 83/INF.8 ANNEX Page 59
I:\MSC\83\INF-8.doc
For options a) and b), it is assumed that the detection probability increases from 0.1 to 0.9, for options c) and d) from 0.9 to 0.99. The results of this RCO are summarized in the table below.
Table 30: Risk reduction for RCO 4
RCO Scenario PLL Dewatering efficiency
∆PLL ∆R
4 a) Water ingress 2.77 x 10⁻⁴ 0.9 (before: 0.1) 2.19 x 10⁻⁴ 4.39 x 10⁻³ 4 b) Water ingress 1.39 x 10⁻³ 0.9 (before: 0.1) 1.10 x 10⁻³ 2.20 x 10⁻² 4 c) Water ingress 5.79 x 10⁻⁵ 0.99 (before: 0.9) 2.47 x 10⁻⁵ 4.93 x 10⁻⁴ 4 d) Water ingress 2.90 x 10⁻⁴ 0.99 (before: 0.9) 1.24 x 10⁻⁴ 2.47 x 10⁻³ The NPV of the benefits from implementing this RCO is US$206,200, US$1,033,900, US$23,200, and US$116,300 for options a), b), c), and d) respectively. RCO 5 − Improved Navigator training Regular and periodic training courses for nautical officers at a simulation centre are considered as described above. For the calculation, three officers are assumed to be onboard where the work is organized in three shifts to operate the ship continuously. Every officer attends a 5-day training course every four years. The associated cost items are listed below.
Table 31: Lifetime costs for implementing RCO 5
Cost item Type of cost Value (US$)
Reference
Course fees Periodic 1,800 partner Other costs (travel + boarding) Periodic 1,200 partner Frequency of course 5 days every 4 years Persons attending the course 9 The cost of implementing this RCO has a NPV of US$105,100. For accident scenarios collision, contact, grounding, and water ingress, a reduction of 6% in the initiating frequency is assumed /24/, leading to a proportional risk reduction.
Table 32: Risk reduction for RCO 5
RCO Scenario PLL Reduction ∆PLL 5 Collision 6.11 x 10⁻³ 6% 3.66 x 10⁻⁴ 5 Contact 1.25 x 10⁻⁴ 6% 7.47 x 10⁻⁶ 5 Grounding 1.24 x 10⁻³ 6% 7.41 x 10⁻⁵ 5 Heavy weather 4.80 x 10⁻⁵ 6% 2.88 x 10⁻⁶
This is equivalent to a risk reduction of 9.02 x 10⁻³ over lifetime. The NPV of the benefits from implementing this RCO is US$53,500. RCO 10 – Bow camera systems Costs are calculated for different system configurations previously described:

MSC 83/INF.8 ANNEX Page 60
I:\MSC\83\INF-8.doc
a) Bow camera system with conventional daylight vision capabilities. b) Bow camera system with conventional daylight vision capabilities combined with thermal
sensors colour for night vision capabilities. For option a) a pan and tilt colour camera station on the mast with zoom lens, auto focus, wipe and wash was chosen, for option b) a dual type (thermal + colour) camera station with zoom/fixed lens, auto focus, pan and tilt, wipe and wash was selected. The associated costs items are listed below.
Table 33: Lifetime costs for implementing RCO 10
Cost item Type of cost Option a) (US$)
Option b) (US$)
Reference
Material Initial 15,200 42,900 /33/ Work Initial 3,700 3,800 partner Engineering Initial 850 850 partner Other Initial 500 1,200 partner Maintenance Annual 152 429 partner Maintenance Periodic 6,600
every 8 years 30,000
every 3 years partner
The cost of implementing this RCO has a NPV of US$29,600 and US$165,300 for options a) and b), respectively. The costs for maintenance and repair reflect the fact that mean time between failures is approximately 65,000 h for a standard colour camera, while a thermal camera has an estimated lifetime of only 20,000 h. With respect to risk reduction, the highest reduction rates are assumed for low speed operation and manoeuvring in port. The efficiency decreases with increasing speed of operation. Especially, there is no risk reduction at full speed since the lead time cannot be decreased significantly. See Table 34 for the results.
Table 34: Risk reduction for RCO 10
RCO No. Scenario PLL Reduction ∆PLL 10 a Collision, low speed 0 8% 0 10 a Collision, restricted speed 3.21 x 10⁻⁴ 4% 1.29 x 10⁻⁵ 10 a Collision, full speed 5.78 x 10⁻³ 0% 0 10 a Contact, low speed 0 10% 0 10 a Contact, restricted speed 1.36 x 10⁻⁵ 5% 6.80 x 10⁻⁷ 10 a Contact, full speed 1.11 x 10⁻⁴ 0% 0 10 b Collision, low speed 0 12% 0 10 b Collision, restricted speed 3.21 x 10⁻⁴ 6% 1.93 x 10⁻⁵ 10 b Collision, full speed 5.78 x 10⁻³ 0% 0 10 b Contact, low speed 0 15% 0 10 b Contact, restricted speed 1.36 x 10⁻⁵ 7.5% 1.02 x 10⁻⁶ 10 b Contact, full speed 1.11 x 10⁻⁴ 0% 0

MSC 83/INF.8 ANNEX Page 61
I:\MSC\83\INF-8.doc
This results in a risk reduction of 2.71 x 10⁻⁴ and 4.06 x 10⁻⁴ over lifetime for options a) and b) respectively. The NPV of the benefit from implementing this RCO is US$6,500 and US$9,700 for options a) and b) respectively. RCO 11 – Reduced amount of undeclared dangerous goods Assumptions for the cost estimate were as follows:
• One person is required one day per week for pre-screening of shipping papers and cargo. Personnel doing the screening would be at the level of second officer.
• It is assumed that 72,000 containers are loaded per year on the container vessel. The pre-screening process would identify 1 in every 200 containers for inspection. Inspection costs are estimated to US$20 for a scan of the container using a gamma system /33/. Hence, approximately 360 containers will be screened per year.
• It is assumed that the gamma scanning or x-ray scanning equipment is owned either by the port or by a security contractor based at the port. Ship owners would therefore not incur any equipment costs for scanning equipment.
Table 35: Lifetime costs for implementing RCO 11
Cost item Type of cost Value (US$)
Reference
Material 0 partner Personnel (pre-screening) Annual 12,000 partner Screening inspection) Annual 7,200 partner
The average cost of implementing this RCO has a NPV of US$239,300. Measures to reduce carriage of undeclared dangerous goods are preventative; hence reduced a probability of the initiating event will result in proportional reductions of PLL, cargo losses, and ship loss. It is assumed that cargo area fires can be reduced by 15% due to reduced amount undeclared dangerous goods. The results of risk reduction for implementation of RCO 11 are summarized in the table below:
Table 36: Risk reduction for RCO 11
RCO Scenario PLL Reduction ∆PLL 11 Fire/explosion
(cargo area) 3.93 x 10⁻⁴ 15% 5.89 x 10⁻⁵
This is equivalent to a risk reduction of 1.18 x 10⁻³ over lifetime. The NPV of the benefits from implementing this RCO is US$16,500. RCO 15 – Improved bridge design The input value represents all costs necessary for the additional equipment and all ergonomic modifications that have to be performed over a standard SOLAS (minimum required) bridge. The following table contains the major cost items for this RCO.

MSC 83/INF.8 ANNEX Page 62
I:\MSC\83\INF-8.doc
Table 37: Lifetime cost items for implementing RCO 15
Cost item Type of cost Value (US$)
Reference
Upgrading of a standard bridge Initial 80,000 /24/ Maintenance Annual 2,000 /24/
The cost of implementing this RCO has a NPV of US$104,900. For accident scenarios collision, contact, and grounding, a reduction of 14%, 14% and 10% in the initiating frequency is assumed /8/, leading to a proportional risk reduction.
Table 38: Risk reduction for RCO 15
RCO Scenario PLL Reduction ∆PLL 15 Collision 6.11 x 10⁻³ 14% 8.55 x 10⁻⁴ 15 Contact 1.25 x 10⁻⁴ 14% 1.74 x 10⁻⁵ 15 Grounding 1.24 x 10⁻³ 10% 1.24 x 10⁻⁴ This results in a risk reduction of 1.99 x 10⁻² over the ship’s lifetime. The NPV of the benefits from implementing this RCO is US$115,700. RCO 22 – Integration of AIS with ARPA radar The following table contains the major cost items for this RCO. The initial amount represents all necessary equipment and upgrading for the integration of the AIS into the ARPA. The whole process of the integration is simple and fairly easy to accomplish, therefore some manufacturers provide it as a standard feature with currently available units.
Table 39: Lifetime cost items for implementing RCO 22
Cost item Type of cost Value (US$)
Reference
Integration of AIS with ARPA radar Initial 2,000 /24/ Maintenance Annual 100 /24/ The cost of implementing this RCO has a NPV of US$3,200. For collisions, a reduction of 12% in the initiating frequency is assumed /24/, leading to a proportional risk reduction. Please note, that this more conservative compared to other recent studies /8/, where a reduction of 26% is assumed.
Table 40: Risk reduction for RCO 22
RCO Scenario PLL Reduction ∆PLL 22 Collision 6.11 x 10⁻³ 12% 7.33 x 10⁻⁴
This results in a risk reduction of 1.47 x 10⁻² over the ship’s lifetime. The NPV of the benefits from implementing this RCO is US$84,700.

MSC 83/INF.8 ANNEX Page 63
I:\MSC\83\INF-8.doc
RCO 25 – Additional officer on the bridge The following table contains the major cost items for this RCO. Based on the variants described previously, either 1 or 3 additional officers are needed on board. The same number is required on shore to ensure smooth rotation. Accordingly, either 1 or 3 cabins are required in addition assuming a separate cabin for each officer. Unlike for passenger vessels, no annual loss of income is assumed due to additional cabins. Also, the building cost for a cabin will be less than for a cruise vessel.
Table 41: Lifetime cost items for implementing RCO 25
Cost item Type of cost Option a) Option b) Reference Officer salary Annual US$50,000 US$50,000 /24/ Additional cabin Initial US$30,000 US$30,000 partner Additional officers 6 2 /24/ Additional cabins 3 1 /24/ The cost of implementing this RCO has a NPV of US$3,828,700 and US$1,276,200 for options a) and b), respectively. For accident scenarios collision, contact, and grounding, a reduction of 13% in the initiating frequency is assumed for options a). For option b) a reduction of only 10% is assumed as the officer will only be on duty in critical situations like narrow passages, harbour areas, heavy weather, or twilight.
Table 42: Risk reduction for RCO 25
RCO Scenario PLL Reduction ∆PLL 25 a) Collision 6.11 x 10⁻³ 13% 7.94 x 10⁻⁴ 25 a) Contact 1.25 x 10⁻⁴ 13% 1.62 x 10⁻⁵ 25 a) Grounding 1.24 x 10⁻³ 13% 1.61 x 10⁻⁴ 25 b) Collision 6.11 x 10⁻³ 10% 6.11 x 10⁻⁴ 25 b) Contact 1.25 x 10⁻⁴ 10% 1.25 x 10⁻⁵ 25 b) Grounding 1.24 x 10⁻³ 10% 1.24 x 10⁻⁴
Hence the annual risk reduction is 9.71 x 10⁻⁴ and 7.47 x 10⁻⁴ for options a) and b), respectively. This leads to the following results for RCO 25: This results in a risk reduction of 1.94 x 10⁻² and 1.49 x 10⁻² over lifetime for options a) and b) respectively. The NPV of the benefit from implementing this RCO is US$112,600 and US$86,600 for options a) and b) respectively. RCO 30 – Electronic Chart Display and Information System (ECDIS) Major cost items for this RCO include back up arrangements and maintenance cost. The amount spent initially represents acquisition and installation costs for all necessary equipment. Estimations on initial cost are somehow conservative. On the contrary, annual expenses for regular service and maintenance purposes are high so as to represent a possible future breakdown and the need for replacing some parts of the installation. It is assumed, that all officers need to attend a 4-day training course, before introducing ECDIS onboard.

MSC 83/INF.8 ANNEX Page 64
I:\MSC\83\INF-8.doc
Table 43: Lifetime cost items for implementing RCO 30
Cost item Type of cost Value Reference ECDIS system Initial US$32,000 /24/ Backup arrangements Initial US$20,000 /24/ Maintenance Annual US$500 /24/ Course fees Initial US$1,000 /8/ Other cost (travel + subsistence) Initial US$1,200 partner Persons attending the course 8 The cost of implementing this RCO has a NPV of US$75,800. A reduction of 36% is assumed for powered groundings, which represent 70% of all groundings /8/. This is equivalent to a reduction of 26% related to all groundings.
Table 44: Risk reduction for RCO 30
RCO Scenario PLL Reduction ∆PLL 30 Grounding 1.24 x 10⁻³ 26% 3.09 x 10⁻⁴
This results in a risk reduction of 6.18 x 10⁻³ over lifetime. The NPV of the benefits from implementing this RCO is US$34,900. RCO 31 – Track control The initial amount represents acquisition costs for the system. Some manufacturers provide such systems as an extra to the autopilot without giving a separate price. Annual maintenance is relatively small and represents maintenance work and possible breakdowns during the expected lifetime of the system.
Table 45: Lifetime cost items for implementing RCO 31
Cost item Type of cost Value (US$)
Reference
Track control system Initial 4,000 /24/ Maintenance Annual 200 /24/
The cost of implementing this RCO has a NPV of US$6,500. For groundings a reduction rate of 23% is assumed /8/.
Table 46: Risk reduction for RCO 31
RCO Scenario PLL Reduction ∆PLL 31 Grounding 1.24 x 10⁻³ 26% 2.84 x 10⁻⁴
This results in a risk reduction of 5.68 x 10⁻³ over lifetime. The NPV of the benefits from implementing this RCO is US$32,100.

MSC 83/INF.8 ANNEX Page 65
I:\MSC\83\INF-8.doc
RCO 32 – Implementation of guidelines for Bridge Resource Management (BRM) The course fee is based on standard 5 day courses as given by the training centres. Expenses related to boarding and lodging cover the same period. An average value is used for travel expenses. Due to the 3-shift-systems of the vessel, 3 officers onboard and another 3 officers onshore are required to complete the rotation. In order to maintain and update the procedures and ensure clear communication and understanding between the bridge and onshore office in case of an emergency, 2 employees from the onshore office should also attend the BRM course.
Table 47: Lifetime cost items for implementing RCO 32
Cost item Type of Cost Value Reference Course fee Initial, periodic US$1,800 partner Other cost (travel + subsistence) Initial, periodic US$1,200 partner Officers attending the course 6 Onshore personnel 2 Frequency of course every 4 years
The cost of implementing this RCO has a NPV of US$78,100. For collisions, contacts, and groundings a reduction rates 5.3% is assumed /24/.
Table 48: Risk reduction for RCO 32
RCO Scenario PLL Reduction ∆PLL 32 Collision 6.11 x 10⁻³ 5.3% 3.24 x 10⁻⁴ 32 Contact 1.25 x 10⁻⁴ 5.3% 6.60 x 10⁻⁶ 32 Grounding 1.24 x 10⁻³ 5.3% 6.55 x 10⁻⁵
This results in a risk reduction of 7.91 x 10⁻³ over the ship’s lifetime. The NPV of the benefits from implementing this RCO is US$45,900.

MSC 83/INF.8 ANNEX Page 66
I:\MSC\83\INF-8.doc
A.7 Event Tree Models
Risk Model Container Vessels - COLLISION
f = 0,0161 Low speed p= 0,40 striking p= 0,50 minor damage p= 1,00 stays afloat p= 1,00 1,00 stays afloat p= 1 3,21E-03 1manoeuvring in or close terminal critical damage p= 0,00 0,00E+00 2
struck p= 0,50 minor damage p= 1,00 stays afloat p= 1,00 1,00 stays afloat p= 1 3,21E-03 3
critical damage p= 0,00 0,00E+00 4
Restricted p= 0,40 striking p= 0,50 minor damage p= 0,80 stays afloat p= 1,00 1,00 stays afloat p= 1 2,57E-03 5in approach channels/fairway stays afloat p= 0,8 2,57E-05 6
passenger p= 0,05 sinks slowly p= 0,2 6,43E-06 7
critical damage p= 0,20 stays afloat p= 1,00 sinks rapidly p= 0 0,00E+00 8
sinks slowly p= 0,00 stays afloat p= 0,8 4,88E-04 9
sinks rapidly p= 0,00 non passenger p= 0,95 sinks slowly p= 0,2 1,22E-04 10
sinks rapidly p= 0 0,00E+00 11
struck p= 0,50 minor damage p= 0,50 stays afloat p= 1,00 1,00 stays afloat p= 1 1,61E-03 12
stays afloat p= 0,80 1,00 stays afloat p= 1 1,29E-03 13
critical damage p= 0,50 sinks slowly p= 0,20 1,00 stays afloat p= 1 3,21E-04 14
sinks rapidly p= 0,00 1,00 stays afloat p= 1 0,00E+00 15
Full speed p= 0,20 striking p= 0,50 minor damage p= 0,50 stays afloat p= 1,00 1,00 stays afloat p= 1 8,03E-04 16en route at sea
stays afloat p= 0,5 1,91E-05 17
passenger p= 0,05 sinks slowly p= 0,4 1,53E-05 18
critical damage p= 0,50 stays afloat p= 0,95 sinks rapidly p= 0,1 3,82E-06 19
stays afloat p= 0,5 3,63E-04 20
non passenger p= 0,95 sinks slowly p= 0,4 2,90E-04 21
sinks rapidly p= 0,1 7,25E-05 22
stays afloat p= 0,5 1,00E-06 23
passenger p= 0,05 sinks slowly p= 0,4 8,03E-07 24
sinks rapidly p= 0,1 2,01E-07 25sinks slowly p= 0,05
stays afloat p= 0,5 1,91E-05 26sinks rapidly p= 0,00
non passenger p= 0,95 sinks slowly p= 0,4 1,53E-05 27
sinks rapidly p= 0,1 3,82E-06 28
struck p= 0,50 minor damage p= 0,20 1,00 1,00 1 3,21E-04 29
stays afloat p= 0,95 3,05E-05 30
passenger p= 0,05 sinks slowly p= 0,05 1,61E-06 31
sinks rapidly p= 0 0,00E+00 32critical damage p= 0,80 stays afloat p= 0,50
stays afloat p= 0,95 5,80E-04 33
non passenger p= 0,95 sinks slowly p= 0,05 3,05E-05 34
sinks rapidly p= 0 0,00E+00 35
stays afloat p= 0,95 2,44E-05 36
passenger p= 0,05 sinks slowly p= 0,05 1,29E-06 37
sinks rapidly p= 0 0,00E+00 38sinks slowly p= 0,40
stays afloat p= 0,95 4,64E-04 39
non passenger p= 0,95 sinks slowly p= 0,05 2,44E-05 40
sinks rapidly p= 0 0,00E+00 41
stays afloat p= 0,95 6,11E-06 42
passenger p= 0,05 sinks slowly p= 0,05 3,21E-07 43
sinks rapidly p= 0 0,00E+00 44sinks rapidly p= 0,10
stays afloat p= 0,95 1,16E-04 45
non passenger p= 0,95 sinks slowly p= 0,05 6,11E-06 46
sinks rapidly p= 0 0,00E+00 47
ScenarioInitial
Frequency Operational state? Ship damage? Ship suvivability? Third party type of ship
Third party survivability
Striking or struck ship?
0 1 2
Frequency (Calculated)
3 4 5 6
Figure 11: Event Tree Collision (1 of 2)

MSC 83/INF.8 ANNEX Page 67
I:\MSC\83\INF-8.doc
Human fatalities crew
Leakage of Dangerous
goods
Leakage of bunker fuel
Ship damage
Cargo loss or damage
Human Life (Crew)
Leakage of
Dangerous goods
Leakage of bunker fuel
Ship damage
Cargo loss or damage
Outcome
1 0 0,0% 0% 0,00E+00 0,00E+00 0,00E+00 0,00E+00 0,00E+00
2 0 0,0% 0% 0,00E+00 0,00E+00 0,00E+00 0,00E+00 0,00E+00
3 0 0,0% 0% 0,00E+00 0,00E+00 0,00E+00 0,00E+00 0,00E+00
4 0 0,0% 0% 0,00E+00 0,00E+00 0,00E+00 0,00E+00 0,00E+00
5 0 0,0% 0% 0,00E+00 0,00E+00 0,00E+00 0,00E+00 0,00E+00
6 0 5,0% 0% 0,00E+00 1,29E-06 0,00E+00 0,00E+00 0,00E+00
7 0 5,0% 0% 100% 100% 0,00E+00 3,21E-07 0,00E+00 6,43E-06 6,43E-06
8 0 5,0% 0% 100% 100% 0,00E+00 0,00E+00 0,00E+00 0,00E+00 0,00E+00
9 0 5,0% 0% 0,00E+00 2,44E-05 0,00E+00 0,00E+00 0,00E+00
10 0 5,0% 0% 100% 100% 0,00E+00 6,11E-06 0,00E+00 1,22E-04 1,22E-04
11 0 5,0% 0% 100% 100% 0,00E+00 0,00E+00 0,00E+00 0,00E+00 0,00E+00
12 0 0,0% 0% 0,00E+00 0,00E+00 0,00E+00 0,00E+00 0,00E+00
13 0 5,0% 0% 0,00E+00 6,43E-05 0,00E+00 0,00E+00 0,00E+00
14 1 12,7% 50% 3,21E-04 4,09E-05 1,61E-04 0,00E+00 0,00E+00
15 0 12,7% 50% 0,00E+00 0,00E+00 0,00E+00 0,00E+00 0,00E+00
16 0 0,0% 0% 0,00E+00 0,00E+00 0,00E+00 0,00E+00 0,00E+00
17 0 5,0% 0% 0,00E+00 9,54E-07 0,00E+00 0,00E+00 0,00E+00
18 0 5,0% 0% 100% 100% 0,00E+00 7,63E-07 0,00E+00 1,53E-05 1,53E-05
19 0 5,0% 0% 100% 100% 0,00E+00 1,91E-07 0,00E+00 3,82E-06 3,82E-06
20 0 5,0% 0% 0,00E+00 1,81E-05 0,00E+00 0,00E+00 0,00E+00
21 0 5,0% 0% 100% 100% 0,00E+00 1,45E-05 0,00E+00 2,90E-04 2,90E-04
22 0 5,0% 0% 100% 100% 0,00E+00 3,63E-06 0,00E+00 7,25E-05 7,25E-05
23 0 12,7% 0% 0,00E+00 1,28E-07 0,00E+00 0,00E+00 0,00E+00
24 0 12,7% 0% 100% 100% 0,00E+00 1,02E-07 0,00E+00 8,03E-07 8,03E-07
25 0 12,7% 0% 100% 100% 0,00E+00 2,56E-08 0,00E+00 2,01E-07 2,01E-07
26 0 12,7% 0% 0,00E+00 2,43E-06 0,00E+00 0,00E+00 0,00E+00
27 0 12,7% 0% 100% 100% 0,00E+00 1,94E-06 0,00E+00 1,53E-05 1,53E-05
28 0 12,7% 0% 100% 100% 0,00E+00 4,86E-07 0,00E+00 3,82E-06 3,82E-06
29 0 0,0% 0% 0,00E+00 0,00E+00 0,00E+00 0,00E+00 0,00E+00
30 1 5,0% 0% 3,05E-05 1,53E-06 0,00E+00 0,00E+00 0,00E+00
31 1 5,0% 0% 100% 100% 1,61E-06 8,03E-08 0,00E+00 1,61E-06 1,61E-06
32 1 5,0% 0% 100% 100% 0,00E+00 0,00E+00 0,00E+00 0,00E+00 0,00E+00
33 1 5,0% 0% 5,80E-04 2,90E-05 0,00E+00 0,00E+00 0,00E+00
34 1 5,0% 0% 100% 100% 3,05E-05 1,53E-06 0,00E+00 3,05E-05 3,05E-05
35 1 5,0% 0% 100% 100% 0,00E+00 0,00E+00 0,00E+00 0,00E+00 0,00E+00
36 5 12,7% 50% 1,22E-04 3,11E-06 1,22E-05 0,00E+00 0,00E+00
37 5 12,7% 50% 100% 100% 6,43E-06 1,64E-07 6,43E-07 1,29E-06 1,29E-06
38 5 12,7% 50% 100% 100% 0,00E+00 0,00E+00 0,00E+00 0,00E+00 0,00E+00
39 5 12,7% 50% 2,32E-03 5,91E-05 2,32E-04 0,00E+00 0,00E+00
40 5 12,7% 50% 100% 100% 1,22E-04 3,11E-06 1,22E-05 2,44E-05 2,44E-05
41 5 12,7% 50% 100% 100% 0,00E+00 0,00E+00 0,00E+00 0,00E+00 0,00E+00
42 20 12,7% 100% 1,22E-04 7,77E-07 6,11E-06 0,00E+00 0,00E+00
43 20 12,7% 100% 100% 100% 6,43E-06 4,09E-08 3,21E-07 3,21E-07 3,21E-07
44 20 12,7% 100% 100% 100% 0,00E+00 0,00E+00 0,00E+00 0,00E+00 0,00E+00
45 20 12,7% 100% 2,32E-03 1,48E-05 1,16E-04 0,00E+00 0,00E+00
46 20 12,7% 100% 100% 100% 1,22E-04 7,77E-07 6,11E-06 6,11E-06 6,11E-06
47 20 12,7% 100% 100% 100% 0,00E+00 0,00E+00 0,00E+00 0,00E+00 0,00E+00
6,11E-03 2,95E-04 5,46E-04 5,95E-04 5,95E-04
Expected Loss Ratesper ship year
Scenario
Consequences
Figure 12: Event Tree Collision (2 of 2)

MSC 83/INF.8 ANNEX Page 68
I:\MSC\83\INF-8.doc
Risk Model Container Vessels - CONTACT
contact f = 3,65E-03 Low speed p= 0,8 minor damage p= 0,8 Yes p= 0,2 Yes p= 0,2 9,34E-05 1manoeuvring or drifting No p= 0,8 3,74E-04 2
No p= 0,8 Yes p= 0,2 3,74E-04 3
No p= 0,8 1,50E-03 4
superstructure p= 0,2 Yes p= 0,8 Yes p= 0,8 3,74E-04 5
No p= 0,2 9,34E-05 6
No p= 0,2 Yes p= 0,8 9,34E-05 7
No p= 0,2 2,34E-05 8
critical hull damage p= 0 Yes p= 0,15 Yes p= 0,3 0,00E+00 9
No p= 0,7 0,00E+00 10
No p= 0,85 Yes p= 0,4 0,00E+00 11
No p= 0,6 0,00E+00 12
both p= 0 Yes p= 0,11 Yes p= 0,5 0,00E+00 13
No p= 0,5 0,00E+00 14
No p= 0,89 Yes p= 0 0,00E+00 15
No p= 1 0,00E+00 16
Restricted p= 0,19 minor damage p= 0,5 Yes p= 0,2 Yes p= 0,8 5,55E-05 17in approach channels/fairway No p= 0,2 1,39E-05 18
No p= 0,8 Yes p= 0,2 5,55E-05 19
No p= 0,8 2,22E-04 20
superstructure p= 0,49 Yes p= 0,8 Yes p= 0,8 2,18E-04 21
No p= 0,2 5,44E-05 22
No p= 0,2 Yes p= 0,8 5,44E-05 23
No p= 0,2 1,36E-05 24
critical hull damage p= 0,01 Yes p= 0,8 Yes p= 0,5 2,77E-06 25
No p= 0,5 2,77E-06 26
No p= 0,2 Yes p= 0,5 6,94E-07 27
No p= 0,5 6,94E-07 28
both p= 0 Yes p= 0,11 Yes p= 0,5 0,00E+00 29
No p= 0,5 0,00E+00 30
No p= 0,89 Yes p= 0 0,00E+00 31
No p= 1 0,00E+00 32
Full speed p= 0,01 minor damage p= 0 Yes p= 0,2 Yes p= 0,7 0,00E+00 33en route at sea 1
No p= 0,3 0,00E+00 34
No p= 0,8 Yes p= 0,2 0,00E+00 35
No p= 0,8 0,00E+00 36
superstructure p= 0,5 Yes p= 0,8 Yes p= 0,8 1,17E-05 37
No p= 0,2 2,92E-06 38
No p= 0,2 Yes p= 0,2 7,30E-07 39
No p= 0,8 2,92E-06 40
critical hull damage p= 0,4 Yes p= 1 Yes p= 0,5 7,30E-06 41
No p= 0,5 7,30E-06 42
No p= 0 Yes p= 0,5 0,00E+00 43
No p= 0,5 0,00E+00 44
both p= 0,1 Yes p= 1 Yes p= 1 3,65E-06 45
No p= 0 0,00E+00 46
No p= 0 Yes p= 0 0,00E+00 47
No p= 1 0,00E+00 48
Initial Frequency operational state?
0 1 2 3
ship damage? cargo damage? struck object damaged? Scenario
4
Frequency (Calculated)
Figure 13: Event Tree Contact (1 of 2)

MSC 83/INF.8 ANNEX Page 69
I:\MSC\83\INF-8.doc
Human fatalities crew
Leakage of Dangerous
goods
Leakage of bunker fuel
Ship damage
Cargo loss or damage
Human fatalities crew
Leakage of
Dangerous goods
Leakage of bunker fuel
Ship damage
Cargo loss or damage Outcome
1 0 0,0% 0,0% 0,00E+00 0,00E+00 0,00E+00 0,00E+00 0,00E+00 no significant outcome
2 0 0,0% 0,0% 0,00E+00 0,00E+00 0,00E+00 0,00E+00 0,00E+00
3 0 0,0% 0,0% 0,00E+00 0,00E+00 0,00E+00 0,00E+00 0,00E+00
4 0 0,0% 0,0% 0,00E+00 0,00E+00 0,00E+00 0,00E+00 0,00E+00
5 0 0,0% 0,0% 0,00E+00 0,00E+00 0,00E+00 0,00E+00 0,00E+00 ship cranes in contact with quay cranes
6 0 0,0% 0,0% 0,00E+00 0,00E+00 0,00E+00 0,00E+00 0,00E+00
7 0 0,0% 0,0% 0,00E+00 0,00E+00 0,00E+00 0,00E+00 0,00E+00 colapse
8 0 0,0% 0,0% 0,00E+00 0,00E+00 0,00E+00 0,00E+00 0,00E+00
9 0,00E+00 0,00E+00 0,00E+00 0,00E+00 0,00E+00
10 0,00E+00 0,00E+00 0,00E+00 0,00E+00 0,00E+00
11 0,00E+00 0,00E+00 0,00E+00 0,00E+00 0,00E+00
12 0,00E+00 0,00E+00 0,00E+00 0,00E+00 0,00E+00
13 0,00E+00 0,00E+00 0,00E+00 0,00E+00 0,00E+00
14 0,00E+00 0,00E+00 0,00E+00 0,00E+00 0,00E+00
15 0,00E+00 0,00E+00 0,00E+00 0,00E+00 0,00E+00
16 0,00E+00 0,00E+00 0,00E+00 0,00E+00 0,00E+00
17 0 0,0% 0,0% 0,00E+00 0,00E+00 0,00E+00 0,00E+00 0,00E+00
18 0 0,0% 0,0% 0,00E+00 0,00E+00 0,00E+00 0,00E+00 0,00E+00
19 0 0,0% 0,0% 0,00E+00 0,00E+00 0,00E+00 0,00E+00 0,00E+00
20 0 0,0% 0,0% 0,00E+00 0,00E+00 0,00E+00 0,00E+00 0,00E+00
21 0 5,0% 0,0% 5,0% 0,00E+00 1,09E-05 0,00E+00 0,00E+00 1,09E-05damage on deck loaded containers, 5% of all containers damaged/leaking
22 0 5,0% 0,0% 5,0% 0,00E+00 2,72E-06 0,00E+00 0,00E+00 2,72E-06damage on deck loaded containers, 5% of all containers damaged/leaking
23 0 0,0% 0,0% 0,00E+00 0,00E+00 0,00E+00 0,00E+00 0,00E+00ship superstructure contact with road bride leading to bridge colapse
24 1 0,0% 0,0% 1,36E-05 0,00E+00 0,00E+00 0,00E+00 0,00E+00 road brige span
25 0 12,7% 100,0% 0,00E+00 3,53E-07 2,77E-06 0,00E+00 0,00E+00partial lakage from bunker tanks and leakage of dangerous goods in flooded cargo holds
26 0 12,7% 100,0% 0,00E+00 3,53E-07 2,77E-06 0,00E+00 0,00E+00partial lakage from bunker tanks and leakage of dangerous goods in flooded cargo holds
27 0 0,0% 0,0% 0,00E+00 0,00E+00 0,00E+00 0,00E+00 0,00E+00
28 0 0,0% 0,0% 0,00E+00 0,00E+00 0,00E+00 0,00E+00 0,00E+00
29 0,00E+00 0,00E+00 0,00E+00 0,00E+00 0,00E+00
30 0,00E+00 0,00E+00 0,00E+00 0,00E+00 0,00E+00
31 0,00E+00 0,00E+00 0,00E+00 0,00E+00 0,00E+00
32 0,00E+00 0,00E+00 0,00E+00 0,00E+00 0,00E+00
33 0,00E+00 0,00E+00 0,00E+00 0,00E+00 0,00E+00
34 0,00E+00 0,00E+00 0,00E+00 0,00E+00 0,00E+00
35 0,00E+00 0,00E+00 0,00E+00 0,00E+00 0,00E+00
36 0,00E+00 0,00E+00 0,00E+00 0,00E+00 0,00E+00
37 0 5,0% 0,0% 5,0% 0,00E+00 5,84E-07 0,00E+00 0,00E+00 5,84E-07damage on deck loaded containers, 5% of all containers damaged/leaking
38 0 5,0% 0,0% 5,0% 0,00E+00 1,46E-07 0,00E+00 0,00E+00 1,46E-07damage on deck loaded containers, 5% of all containers damaged/leaking
39 2 0,0% 0,0% 1,46E-06 0,00E+00 0,00E+00 0,00E+00 0,00E+00 platform
40 0 0,0% 0,0% 0,00E+00 0,00E+00 0,00E+00 0,00E+00 0,00E+00
41 0 12,7% 100,0% 0,00E+00 9,29E-07 7,30E-06 0,00E+00 0,00E+00partial lakage from bunker tanks and leakage of dangerous goods in flooded cargo holds
42 5 12,7% 100,0% 100,0% 100,0% 3,65E-05 9,29E-07 7,30E-06 7,30E-06 7,30E-06capsize/sink, crew partly rescued from platformsaveaing f dama
43 0,00E+00 0,00E+00 0,00E+00 0,00E+00 0,00E+00
44 0,00E+00 0,00E+00 0,00E+00 0,00E+00 0,00E+00
45 20 12,7% 100,0% 100,0% 100,0% 7,30E-05 4,65E-07 3,65E-06 3,65E-06 3,65E-06Ship in high energy contact with manned offshore platformard, ship sinks, platform colapses
46 0,00E+00 0,00E+00 0,00E+00 0,00E+00 0,00E+00
47 0,00E+00 0,00E+00 0,00E+00 0,00E+00 0,00E+00
48 0,00E+00 0,00E+00 0,00E+00 0,00E+00 0,00E+00
1,25E-04 1,74E-05 2,38E-05 1,10E-05 2,53E-05
Expected Loss Ratesper ship yearConsequences
Scenario
Figure 14: Event Tree Contact (2 of 2)
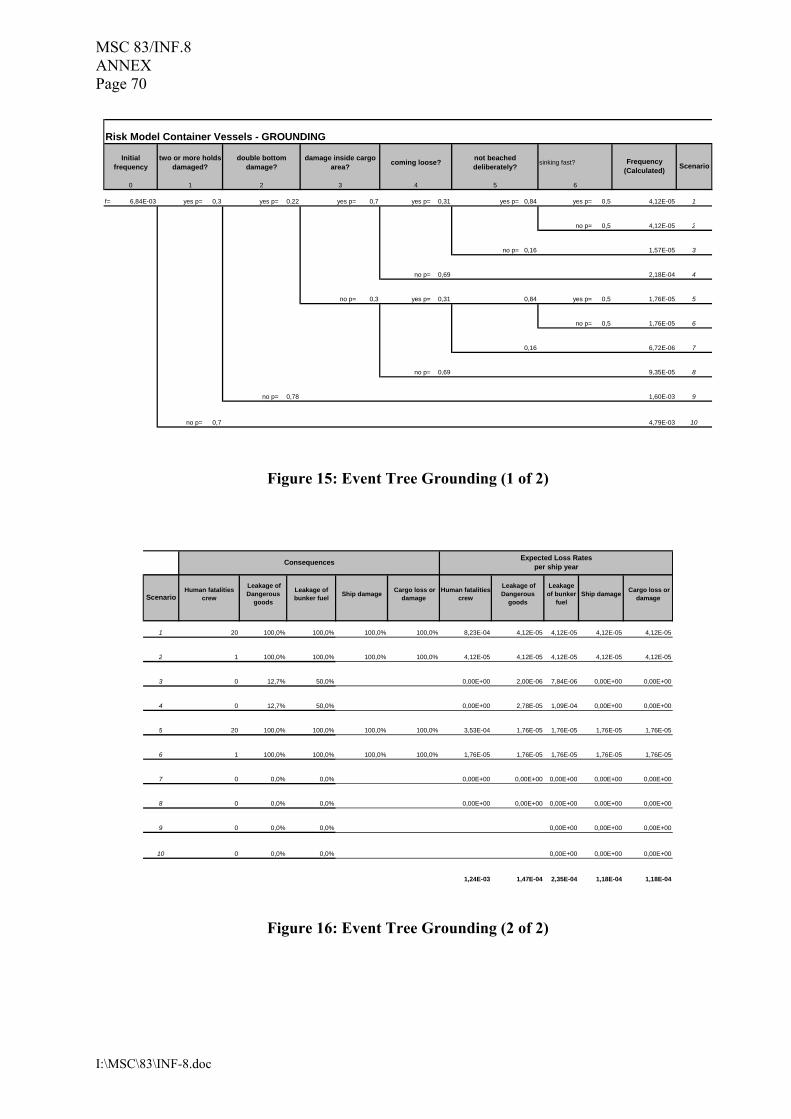
MSC 83/INF.8 ANNEX Page 70
I:\MSC\83\INF-8.doc
Risk Model Container Vessels - GROUNDING
f= 6,84E-03 yes p= 0,3 yes p= 0,22 yes p= 0,7 yes p= 0,31 yes p= 0,84 yes p= 0,5 4,12E-05 1
no p= 0,5 4,12E-05 2
no p= 0,16 1,57E-05 3
no p= 0,69 2,18E-04 4
no p= 0,3 yes p= 0,31 0,84 yes p= 0,5 1,76E-05 5
no p= 0,5 1,76E-05 6
0,16 6,72E-06 7
no p= 0,69 9,35E-05 8
no p= 0,78 1,60E-03 9
no p= 0,7 4,79E-03 10
Scenariodouble bottom
damage?
2
damage inside cargo area?
43
coming loose? not beached deliberately?
Frequency (Calculated)
Initial frequency
two or more holds damaged?
10 5
sinking fast?
6
Figure 15: Event Tree Grounding (1 of 2)
Human fatalities crew
Leakage of Dangerous
goods
Leakage of bunker fuel Ship damage Cargo loss or
damage Human fatalities
crew
Leakage of Dangerous
goods
Leakage of bunker
fuelShip damage Cargo loss or
damage
1 20 100,0% 100,0% 100,0% 100,0% 8,23E-04 4,12E-05 4,12E-05 4,12E-05 4,12E-05
2 1 100,0% 100,0% 100,0% 100,0% 4,12E-05 4,12E-05 4,12E-05 4,12E-05 4,12E-05
3 0 12,7% 50,0% 0,00E+00 2,00E-06 7,84E-06 0,00E+00 0,00E+00
4 0 12,7% 50,0% 0,00E+00 2,78E-05 1,09E-04 0,00E+00 0,00E+00
5 20 100,0% 100,0% 100,0% 100,0% 3,53E-04 1,76E-05 1,76E-05 1,76E-05 1,76E-05
6 1 100,0% 100,0% 100,0% 100,0% 1,76E-05 1,76E-05 1,76E-05 1,76E-05 1,76E-05
7 0 0,0% 0,0% 0,00E+00 0,00E+00 0,00E+00 0,00E+00 0,00E+00
8 0 0,0% 0,0% 0,00E+00 0,00E+00 0,00E+00 0,00E+00 0,00E+00
9 0 0,0% 0,0% 0,00E+00 0,00E+00 0,00E+00
10 0 0,0% 0,0% 0,00E+00 0,00E+00 0,00E+00
1,24E-03 1,47E-04 2,35E-04 1,18E-04 1,18E-04
Expected Loss Ratesper ship year
Scenario
Consequences
Figure 16: Event Tree Grounding (2 of 2)
MSC 83/INF.8 ANNEX Page 71
I:\MSC\83\INF-8.doc
Risk Model Container Vessels - Heavy weather
f = 0,0026 heavy rain p= 0,0250 yes p= 0,0200 stays afloat p= 0,9900 1,31E-06 1
sinks slowly p= 0,0100 1,32E-08 2
no p= 0,9800 stays afloat p= 1,0000 6,47E-05 3
wave induced motions p= 0,8238 yes p= 0,384 stays afloat p= 0,9987 yes p= 0,02 1,67E-05 4
no p= 0,98 8,16E-04 5
sinks slowly p= 0,0006 5,27E-07 6
sinks rapidly p= 0,0006 5,27E-07 7
no p= 0,6164 stays afloat p= 0,9999 1,34E-03 8
sinks slowly p= 0,0000 9
sinks rapidly p= 0,0001 1,34E-07 10
other type of accidents p= 0,1512 3,99E-04 11e.g. machinery damage 0,2089552
Leading to ...
0 1
Initial frequency Open top design?
2 3 4
Frequency (Calculated)
Hull damage? Suvivability ScenarioFatalities
5
Figure 17: Event Tree Heavy weather (1 of 2)
1 0 0% 10% 0% 20% 0,00E+00 0,00E+00 1,31E-07 0,00E+00 2,61E-07 listing
2 1 100% 100% 100% 100% 1,32E-08 1,32E-08 1,32E-08 1,32E-08 1,32E-08listing and subsequent capsize
3 0
4 1 0% 4% 1,0% 2% 1,67E-05 0,00E+00 6,67E-07 1,67E-07 3,33E-07
slamming (minor, local damage, e.g. bow or stern, wave breaker)
5 0 0% 4% 1,0% 2% 0,00E+00 0,00E+00 3,27E-05 8,16E-06 1,63E-05
slamming (minor, local damage, e.g. bow or stern, wave breaker)
6 2 100% 100% 100% 100% 1,05E-06 5,27E-07 5,27E-07 5,27E-07 5,27E-07
foundering (global, critical damage, hull breach)
7 20 100% 100% 100% 100% 1,05E-05 5,27E-07 5,27E-07 5,27E-07 5,27E-07
foundering (global, critical damage, hull breach)
8 0 0% 0,1% 0% 0,1% 0,00E+00 0,00E+00 6,70E-07 0,00E+00 1,34E-06large roll motions, loss or damage of containers
9 can be controlled
10 20 100% 100% 100% 100% 2,68E-06 1,34E-07 1,34E-07 1,34E-07 1,34E-07intact capsize, pure loss of stability
11 0 0% 0% 0% 0% 0,00E+00 0,00E+00 0,00E+00 0,00E+00 0,00E+00collision, machinery failure, …
3,10E-05 1,20E-06 3,53E-05 9,53E-06 1,95E-05
ScenarioHuman
fatalities crew
Leakage of Dangerous
goods
Leakage of bunker fuel
Cargo damage or loss
Ship damage
Consequences Expected Loss Ratesper ship year
OutcomeLeakage of bunker fuel
Cargo damage or
loss
Ship damage
Human fatalities crew
Leakage of Dangerous
goods
Figure 18: Event Tree Heavy weather (2 of 2)

MSC 83/INF.8 ANNEX Page 72
I:\MSC\83\INF-8.doc
Figure 19: Event Tree Fire (1 of 2)
Ris
k M
odel
Con
tain
er V
esse
ls -
FIR
E
Initi
al F
requ
ency
Fire
and
ex
plos
ion
orig
in
loca
tion
Fire
is d
etec
ted
befo
re it
spr
eads
be
yond
co
ntai
ner?
Con
tain
er is
in
hold
(with
CO
2 or
w
ater
spr
ay
extin
guis
hing
)?
Auto
mat
ic
firef
ight
ing
is
effe
ctiv
e? (f
ire
extin
guis
hed)
Haz
ardo
us g
oods
(to
xic,
exp
losi
ve,
high
ly
flam
mab
le, e
tc.)
in c
onta
iner
s af
fect
ed b
y fir
e?
All d
ange
rous
go
ods
have
bee
n pr
oper
ly d
ecla
red
and
mar
ked?
Man
ual
Fire
fight
ing
is
effe
ctiv
e (a
cces
sibl
e co
ntai
ner)
? (fi
re
extin
guis
hed)
Fire
fight
ing
assi
stan
ce fr
om
othe
r ves
sels
or
land
pos
sibl
e to
pr
even
t fire
sp
read
to o
ther
sh
ip a
reas
?
Fire
ex
tingu
ishi
ng,
vess
el to
win
g po
ssib
le?
Tim
ely
Evac
uatio
n/R
esc
ue o
f cre
w
poss
ible
?
Freq
uenc
y (C
alcu
late
d)
Scenario
Scenario
Ship Damage
Cargo Loss
Human: Crew Fatalities
Human
Third Party Damage
Environment
Out
com
e (S
hort
Des
crip
tion)
01
23
45
67
89
10
YES
P =
2,
76E-
051
XX
0X
1 co
ntai
ner b
urns
, dec
lare
d dg
YES
P =
0,
8YE
S P
=
0,3
NO
P
= 6,
90E-
062
XX
0X
1 co
ntai
ner b
urns
, und
ecla
red
dg0,
50,
2YE
S P
=
NO
P
= 8,
05E-
053
XX
01
cont
aine
r bur
ns, n
o dg
0,5
0,7
YES
P =
YE
S P
=
2,76
E-06
4X
X0
X1
cont
aine
r bur
ns, d
ecla
red
dg0,
7YE
S P
=
0,1
YES
P =
0,
8YE
S P
=
8,70
E-06
5X
X0
XX
X>1
con
tain
er, d
ecla
red
dgN
O
P =
0,3
NO
P
= 0,
35
0,5
0,9
YES
P =
1,
42E-
056
XX
2X
XX
Man
y co
ntai
ners
, dg,
mar
ked,
oth
er s
hip
area
sYE
S P
=
0,98
NO
P
= 0,
9N
O
P =
2,91
E-07
7X
X10
XX
XM
any
cont
aine
rs, d
g, o
ther
shi
p ar
eas,
m
any
crew
cas
ualti
es0,
650,
02YE
S P
=
1,58
E-06
8X
X2
XX
Xin
jurie
s, fa
talti
es p
ossi
ble,
dg
invo
lved
NO
P
= 0,
98
0,1
NO
P
= 3,
23E-
089
XX
20X
XX
Wor
st C
ase:
Los
s of
ves
sel,
all c
argo
, all
crew
0,02
YES
P =
3,
45E-
0710
XX
0X
1 co
ntai
ner b
urns
, und
ecla
red
dgN
O
P =
0,05
0,2
YES
P =
2,
29E-
0611
XX
0X
XX
>1 c
onta
iner
, und
ecla
red
dgN
O
P =
0,35
0,95
YES
P =
3,
76E-
0612
XX
2X
XX
Man
y co
ntai
ners
, dg,
not
mar
ked,
oth
er s
hip
area
sYE
S P
=
0,98
NO
P
= 0,
9N
O
P =
7,67
E-08
13X
X10
XX
XM
any
cont
aine
rs, d
g, o
ther
shi
p ar
eas,
m
any
crew
cas
ualti
es0,
650,
02
YES
P =
4,
18E-
0714
XX
2X
XX
Loss
of a
ll co
ntai
ners
, ves
sel,
som
e cr
ew
inju
ries,
fata
lties
pos
sibl
eN
O
P =
0,98
0,1
NO
P
= 8,
52E-
0915
XX
20X
XX
Wor
st C
ase:
Los
s of
ves
sel,
all c
argo
, all
crew
0,02
Car
go a
rea
fire
YES
P =
1,
61E-
0516
XX
0X
1 co
ntai
ner b
urns
, no
dg0,
19N
O
P =
0,2
0,7
YES
P =
2,
25E-
0517
XX
0X
X>1
con
tain
er, n
o dg
NO
P
= 0,
350,
8YE
S P
=
3,75
E-05
18X
X1
XX
ship
are
asYE
S P
=
0,99
5
NO
P
= 0,
9N
O
P =
1,88
E-07
19X
X5
XX
Man
y co
ntai
ners
, no
dg, o
ther
shi
p ar
eas,
cr
ew fa
talit
ies
0,65
0,00
5
YES
P =
4,
17E-
0620
XX
0X
XLo
ss o
f all
cont
aine
rs, v
esse
l, so
me
crew
in
jurie
s, fa
talti
es p
ossi
ble,
no
dgN
O
P =
0,99
5
0,1
NO
P
= 2,
09E-
0821
XX
20X
XW
orst
Cas
e: L
oss
of v
esse
l, al
l car
go, a
ll cr
ew, n
o dg
0,00
5YE
S P
=
5,52
E-06
22X
X0
X1
cont
aine
r bur
ns, d
ecla
red
dgYE
S P
=
0,1
YES
P =
0,
8YE
S P
=
1,74
E-05
23X
X0
XX
X>1
con
tain
er, d
ecla
red
dg0,
3N
O
P =
0,35
0,9
YES
P =
2,
85E-
0524
XX
2X
XX
Man
y co
ntai
ners
, dg,
mar
ked,
oth
er s
hip
area
sYE
S P
=
0,98
NO
P
= 0,
9N
O
P =
5,81
E-07
25X
X10
XX
XM
any
cont
aine
rs, d
g, o
ther
shi
p ar
eas,
m
any
crew
cas
ualti
es0,
650,
02
YES
P =
3,
17E-
0626
XX
2X
XX
Loss
of a
ll co
ntai
ners
, ves
sel,
som
e cr
ew
inju
ries,
fata
lties
pos
sibl
ef =
N
O
P =
0,98
3,55
E-03
0,1
NO
P
= 6,
46E-
0827
XX
20X
XX
Wor
st C
ase:
Los
s of
ves
sel,
all c
argo
, all
crew
0,02
NO
P
= n/
aYE
S P
=
6,90
E-07
28X
X0
X1
cont
aine
r bur
ns, u
ndec
lare
d dg
0,5
NO
P
= 0,
050,
2YE
S P
=
4,59
E-06
29X
X0
XX
X>1
con
tain
er, u
ndec
lare
d dg
NO
P
= 0,
35
0,95
YES
P =
7,
52E-
0630
XX
2X
XX
Man
y co
ntai
ners
, dg,
not
mar
ked,
oth
er s
hip
area
sYE
S P
=
0,98

MSC 83/INF.8 ANNEX Page 73
I:\MSC\83\INF-8.doc
Figure 20: Event Tree Fire (2 of 2)
___________
NO
P
= 0,
9N
O
P =
1,
53E
-07
31X
X10
XX
XM
any
cont
aine
rs, d
g, o
ther
shi
p ar
eas,
m
any
crew
cas
ualti
es0,
650,
02
YES
P =
8,
35E
-07
32X
X2
XX
XLo
ss o
f all
cont
aine
rs, v
esse
l, so
me
crew
in
jurie
s, fa
talti
es p
ossi
ble
NO
P
= 0,
98
0,1
NO
P
=
1,70
E-0
833
XX
20X
XX
Wor
st C
ase:
Los
s of
ves
sel,
all c
argo
, all
crew
0,02
YES
P =
3,
22E
-05
34X
X0
X1
cont
aine
r bur
ns, n
o dg
NO
P
= 0,
20,
7YE
S P
=
4,51
E-0
535
XX
0X
X>1
con
tain
er, n
o dg
NO
P
=
0,35
0,8
YES
P =
7,
50E
-05
36X
X1
XX
ship
are
asYE
S P
=
0,99
5
NO
P
= 0,
9N
O
P =
3,
77E
-07
37X
X5
XX
Man
y co
ntai
ners
, no
dg, o
ther
shi
p ar
eas,
cr
ew fa
talit
ies
0,65
0,00
5
YES
P =
8,
33E
-06
38X
X0
XX
Loss
of a
ll co
ntai
ners
, ves
sel,
som
e cr
ew
inju
ries,
fata
lties
pos
sibl
e, n
o dg
NO
P
= 0,
995
0,1
NO
P
=
4,19
E-0
839
XX
20X
XW
orst
Cas
e: L
oss
of v
esse
l, al
l car
go, a
ll cr
ew, n
o dg
0,00
5YE
S P
=
4,73
E-0
640
XX
0X
1 co
ntai
ner b
urns
, dec
lare
d dg
YES
P =
0,
1YE
S P
=
0,8
YES
P =
1,
49E
-05
41X
X0
XX
X>1
con
tain
er, d
ecla
red
dg0,
3N
O
P =
0,
35
0,9
YES
P =
2,
44E
-05
42X
X2
XX
XM
any
cont
aine
rs, d
g, m
arke
d, o
ther
shi
p ar
eas
YES
P =
0,
98
NO
P
= 0,
9N
O
P =
4,
98E
-07
43X
X10
XX
XM
any
cont
aine
rs, d
g, o
ther
shi
p ar
eas,
m
any
crew
cas
ualti
es0,
650,
02
YES
P =
2,
71E
-06
44X
X2
XX
XLo
ss o
f all
cont
aine
rs, v
esse
l, so
me
crew
in
jurie
s, fa
talti
es p
ossi
ble
NO
P
= 0,
98
0,1
NO
P
=
5,54
E-0
845
XX
20X
XX
Wor
st C
ase:
Los
s of
ves
sel,
all c
argo
, all
crew
0,02
YES
P =
5,
92E
-07
46X
X0
X1
cont
aine
r bur
ns, u
ndec
lare
d dg
NO
P
= 0,
05N
O
P =
n/a
n/a
0,2
YES
P =
3,
93E
-06
47X
X0
XX
X>1
con
tain
er, u
ndec
lare
d dg
0,3
NO
P
=
0,35
0,95
YES
P =
6,
44E
-06
48X
X2
XX
XM
any
cont
aine
rs, d
g, n
ot m
arke
d, o
ther
shi
p ar
eas
YES
P =
0,
98
NO
P
= 0,
9N
O
P =
1,
31E
-07
49X
X10
XX
XM
any
cont
aine
rs, d
g, o
ther
shi
p ar
eas,
m
any
crew
cas
ualti
es0,
650,
02
YES
P =
7,
16E
-07
50X
X2
XX
XLo
ss o
f all
cont
aine
rs, v
esse
l, so
me
crew
in
jurie
s, fa
talti
es p
ossi
ble
NO
P
= 0,
98
0,1
NO
P
=
1,46
E-0
851
XX
20X
XX
Wor
st C
ase:
Los
s of
ves
sel,
all c
argo
, all
crew
0,02
YES
P =
2,
76E
-05
52X
X0
X1
cont
aine
r bur
ns, n
o dg
NO
P
= 0,
20,
7YE
S P
=
3,86
E-0
553
XX
0X
X>1
con
tain
er, n
o dg
NO
P
=
0,35
0,8
YES
P =
6,
43E
-05
54X
X1
XX
ship
are
asYE
S P
=
0,99
5
NO
P
= 0,
9N
O
P =
3,
23E
-07
55X
X5
XX
Man
y co
ntai
ners
, no
dg, o
ther
shi
p ar
eas,
cr
ew fa
talit
ies
0,65
0,00
5
YES
P =
7,
14E
-06
56X
X0
XX
Loss
of a
ll co
ntai
ners
, ves
sel,
som
e cr
ew
inju
ries,
fata
lties
pos
sibl
e, n
o dg
NO
P
= 0,
995
0,1
NO
P
=
3,59
E-0
857
XX
20X
XW
orst
Cas
e: L
oss
of v
esse
l, al
l car
go, a
ll cr
ew, n
o dg
0,00
5
Mac
hine
ryPr
obab
ility
of F
atal
ities
Am
ong
Cre
w6,
98E
-04
581
Prob
abilit
y of
fata
litie
s pe
r inc
iden
t, us
ing
rate
of 4
2 fa
talit
ies
for 1
09 e
vent
s fro
m
LMIU
dat
abas
e 0,
510,
385
Prob
abili
ty o
f no
fata
litie
s0,
615
1,11
E-0
30
Oth
er (p
lus
expl
osio
ns fr
om c
argo
are
a)Pr
obab
ility
of F
atal
ities
Am
ong
Cre
w4,
10E
-04
591
Prob
abilit
y of
fata
litie
s pe
r inc
iden
t, us
ing
rate
of 4
2 fa
talit
ies
for 1
09 e
vent
s fro
m
LMIU
dat
abas
e 0,
30,
385
Prob
abili
ty o
f no
fata
litie
s0,
615
6,55
E-0
40
Not
e: T
hese
two
bran
ches
hav
e no
t bee
n de
velo
ped
furth
er a
s th
e st
udy
conc
entra
ted
on c
onta
iner
-ves
sel s
peci
fic in
cide
nts,
spe
cific
ally
fire
s in
the
carg
o ar
ea. T
hey
are
incl
uded
to s
how
rela
tive
cont
ribut
ion
from
fire
s an
d ex
plos
ions
orig
inat
ing
in o
ther
are
as
3,53
E-0
3


![fsa imagery [Read-Only] · PDF fileObjectives of Presentation: ... FSA Imagery Requirements ... FSA Ortho Large Format FSA Ortho DOQs Small Format GIS Possible Yes Yes FAA](https://img.dokumen.tips/doc/110x75/5ab947c47f8b9ad5338dc355/fsa-imagery-read-only-of-presentation-fsa-imagery-requirements-fsa-ortho.jpg)