Embed Size (px)
Citation preview
REPORT DOCUMENTATION PAGE Form Approved
OMB No. 0704-0188 Public reporting burden for this collection of information is estimated to average 1 hour per response, including the time for reviewing instructions, searching existing data sources, gathering and maintaining the data needed, and completing and reviewing this collection of information. Send comments regarding this burden estimate or any other aspect of this collection of information, including suggestions for reducing this burden to Department of Defense, Washington Headquarters Services, Directorate for Information Operations and Reports (0704-0188), 1215 Jefferson Davis Highway, Suite 1204, Arlington, VA 22202-4302. Respondents should be aware that notwithstanding any other provision of law, no person shall be subject to any penalty for failing to comply with a collection of information if it does not display a currently valid OMB control number. PLEASE DO NOT RETURN YOUR FORM TO THE ABOVE ADDRESS. 1. REPORT DATE (DD-MM-YYYY) xx-10-1999
2. REPORT TYPE Technical
3. DATES COVERED (From - To) 5a. CONTRACT NUMBER
5b. GRANT NUMBER
4. TITLE AND SUBTITLE Natural Attenuation of Fuel Hydrocarbons Performance and Cost results from Multiple Air Force Demonstration Sites, Technology Demonstration Slide Presentation 5c. PROGRAM ELEMENT NUMBER
6. AUTHOR(S) Parsons Engineering Science, Inc.
5d. PROJECT NUMBER
5e. TASK NUMBER
5f. WORK UNIT NUMBER
7. PERFORMING ORGANIZATION NAME(S) AND ADDRESS(ES)
8. PERFORMING ORGANIZATION REPORT NUMBER
Parsons Engineering Science, Inc. 1700 Broadway, Suite 900, Denver, CO
9. SPONSORING / MONITORING AGENCY NAME(S) AND ADDRESS(ES) 10. SPONSOR/MONITOR’S ACRONYM(S) AFCEE 11. SPONSOR/MONITOR’S REPORT NUMBER(S)
Air Force Center for Environmental Excellence 3300 Sidney Brooks Brooks City-Base, TX 78235
12. DISTRIBUTION / AVAILABILITY STATEMENT Approved for public release; distribution unlimited
13. SUPPLEMENTARY NOTES
14. ABSTRACT This slide presentation summarizes the five-year results of natural attenuation treatability studies at 42 Air Force sites contaminated with fuel hydrocarbons. The main emphasis of the work described in this report was to evaluate the potential for naturally occurring degradation mechanisms to reduce dissolved benzene, ethylbenzene, toluene, and xylenes concentrations in groundwater to levels that are protective of human health and the environment.
15. SUBJECT TERMS natural attenuation, fuel hydrocarbons, biodegradation, groundwater remediation, geochemistry, contaminant destruction rates
16. SECURITY CLASSIFICATION OF: UNCLASSIFIED
17. LIMITATION OF ABSTRACT
18. NUMBER OF PAGES
19a. NAME OF RESPONSIBLE PERSON Mr. Jerry Hansen
a. REPORT U
b. ABSTRACT U
c. THIS PAGE U
SAR 39
19b. TELEPHONE NUMBER (include area code) 210-536-4353
Standard Form 298 (Rev. 8-98) Prescribed by ANSI Std. Z39.18
nafuels.ppt 1/2000
Natural Attenuation of Fuel HydrocarbonsNatural Attenuation of Fuel HydrocarbonsPerformance and Performance and
Costs Results from MultipleCosts Results from MultipleAir Force Demonstration SitesAir Force Demonstration Sites
Presented byBruce Henry
P a r s o n sP a r s o n s E n g in e e r in g S c ie n c e , In c .
{
nafuels.ppt 1/200
Natural Attenuation InitiativeNatural Attenuation Initiative
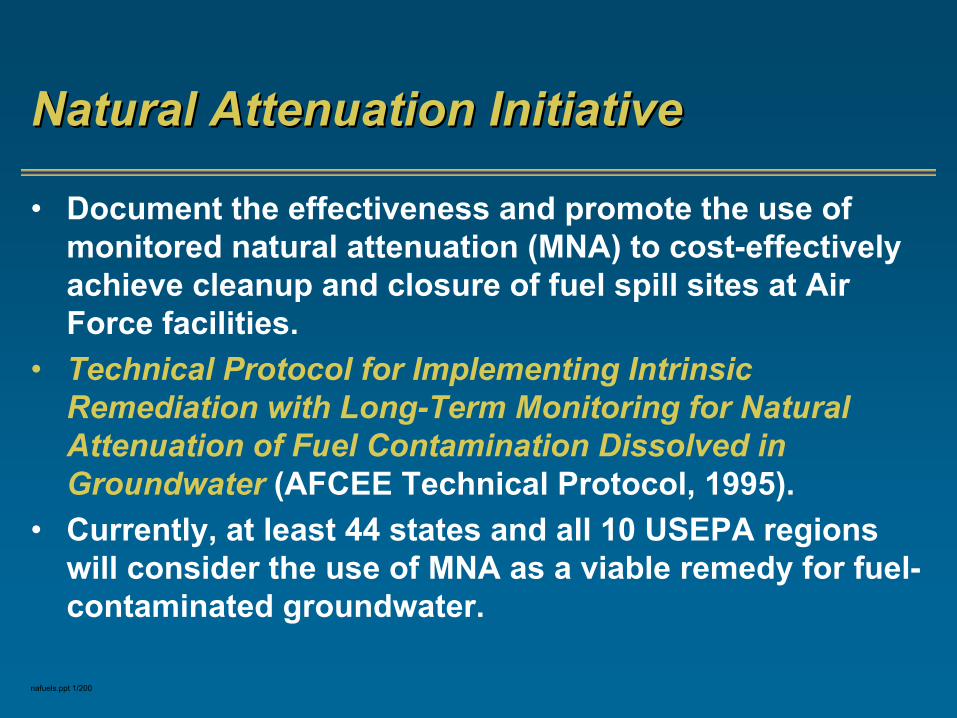
• Document the effectiveness and promote the use of monitored natural attenuation (MNA) to cost-effectively achieve cleanup and closure of fuel spill sites at Air Force facilities.
• Technical Protocol for Implementing Intrinsic Remediation with Long-Term Monitoring for Natural Attenuation of Fuel Contamination Dissolved inGroundwater (AFCEE Technical Protocol, 1995).
• Currently, at least 44 states and all 10 USEPA regions will consider the use of MNA as a viable remedy for fuel-contaminated groundwater.
nafuels.ppt 1/200
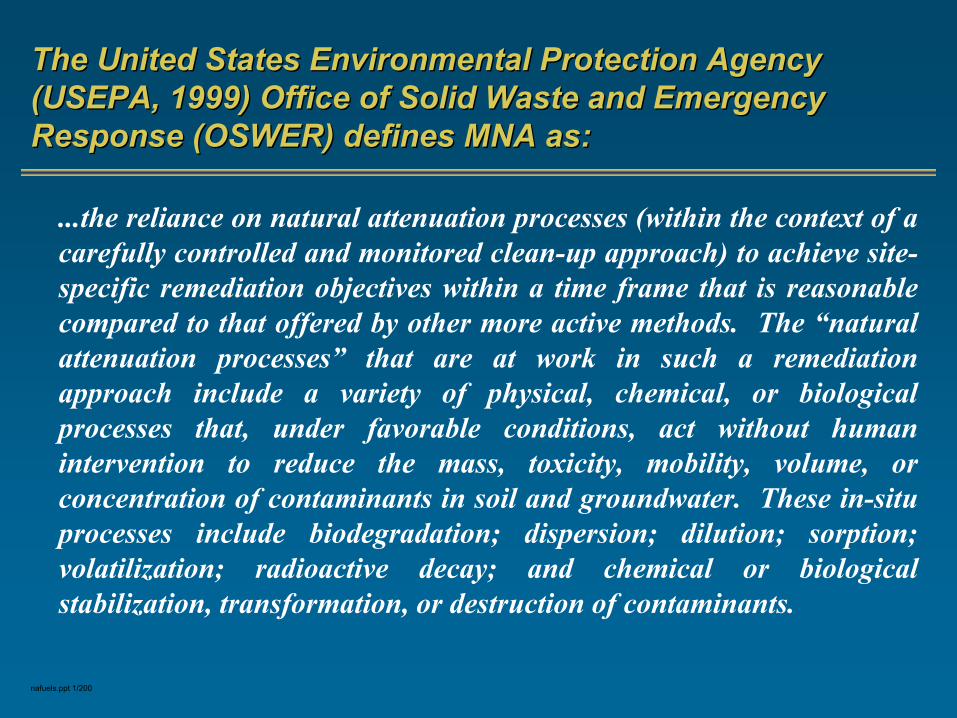
The United States Environmental Protection Agency The United States Environmental Protection Agency (USEPA, 1999) Office of Solid Waste and Emergency (USEPA, 1999) Office of Solid Waste and Emergency Response (OSWER) defines MNA as:Response (OSWER) defines MNA as:
...the reliance on natural attenuation processes (within the context of a carefully controlled and monitored clean-up approach) to achieve site-specific remediation objectives within a time frame that is reasonable compared to that offered by other more active methods. The “natural attenuation processes” that are at work in such a remediation approach include a variety of physical, chemical, or biological processes that, under favorable conditions, act without human intervention to reduce the mass, toxicity, mobility, volume, or concentration of contaminants in soil and groundwater. These in-situ processes include biodegradation; dispersion; dilution; sorption; volatilization; radioactive decay; and chemical or biological stabilization, transformation, or destruction of contaminants.
nafuels.ppt 1/200
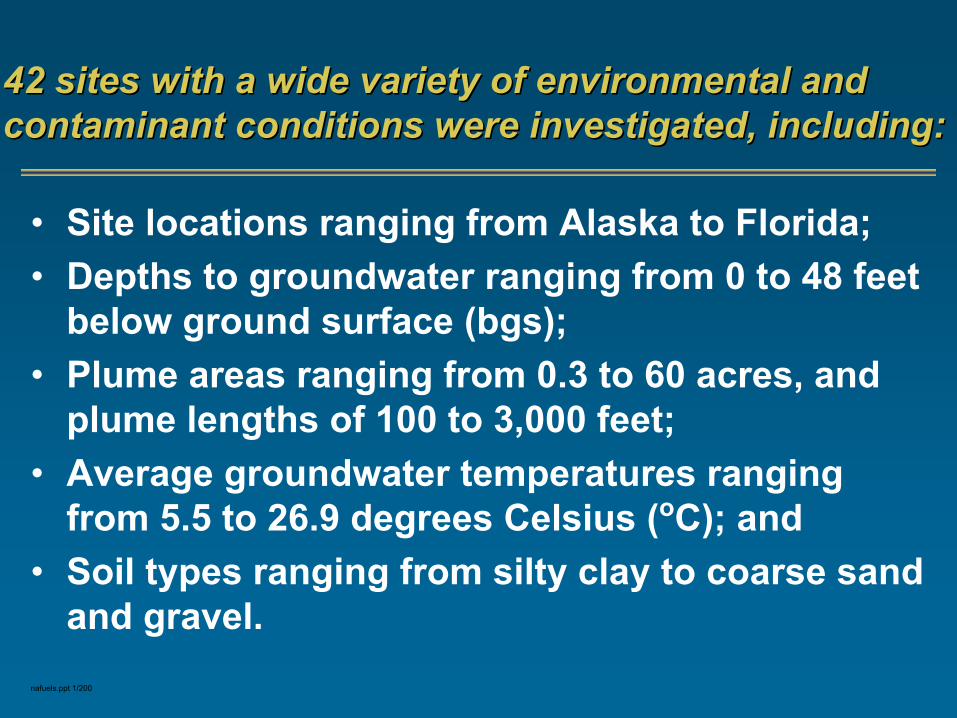
42 sites with a wide variety of environmental and 42 sites with a wide variety of environmental and contaminant conditions were investigated, including:contaminant conditions were investigated, including:
• Site locations ranging from Alaska to Florida;• Depths to groundwater ranging from 0 to 48 feet
below ground surface (bgs); • Plume areas ranging from 0.3 to 60 acres, and
plume lengths of 100 to 3,000 feet;• Average groundwater temperatures ranging
from 5.5 to 26.9 degrees Celsius (oC); and• Soil types ranging from silty clay to coarse sand
and gravel.
nafuels.ppt 1/200
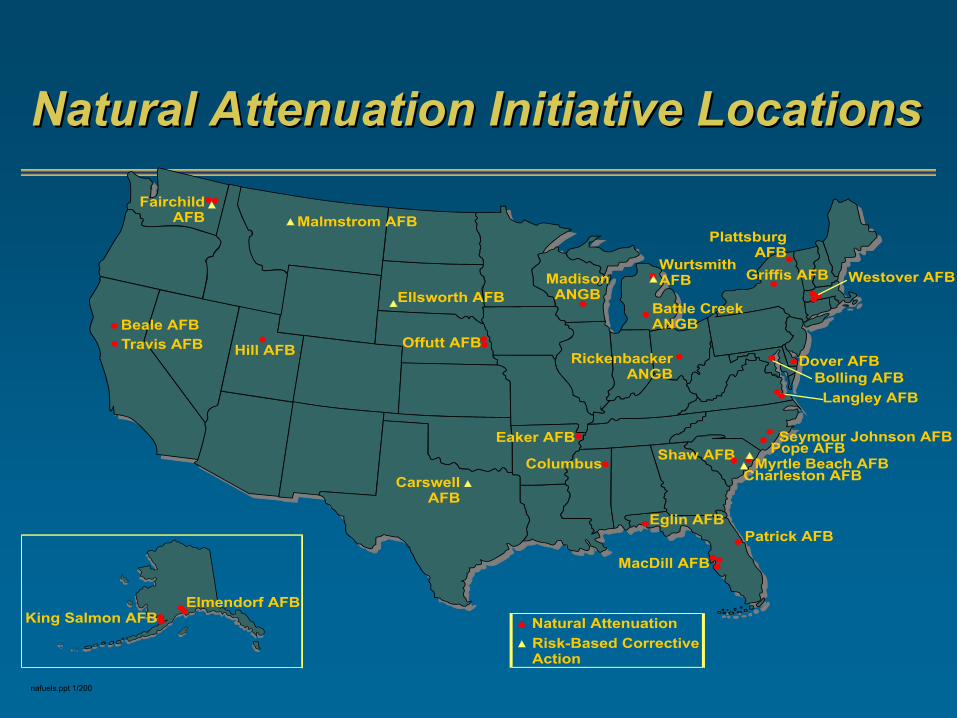
Natural Attenuation Initiative LocationsNatural Attenuation Initiative Locations
Risk-Based CorrectiveAction
Elmendorf AFB
Travis AFB
Fairchild AFB Malmstrom AFB
Ellsworth AFB
Offutt AFB
Carswell AFB
Patrick AFB
Charleston AFBMyrtle Beach AFB
Pope AFBSeymour Johnson AFB
Langley AFB
Dover AFB
Westover AFBGriffis AFB
Plattsburg AFB
Bolling AFB
Shaw AFB
MacDill AFB
Eglin AFB
Columbus
Eaker AFB
Rickenbacker ANGB
MadisonANGB
Battle Creek ANGB
Wurtsmith AFB
Hill AFB
Beale AFB
King Salmon AFB Natural Attenuation
nafuels.ppt 1/200
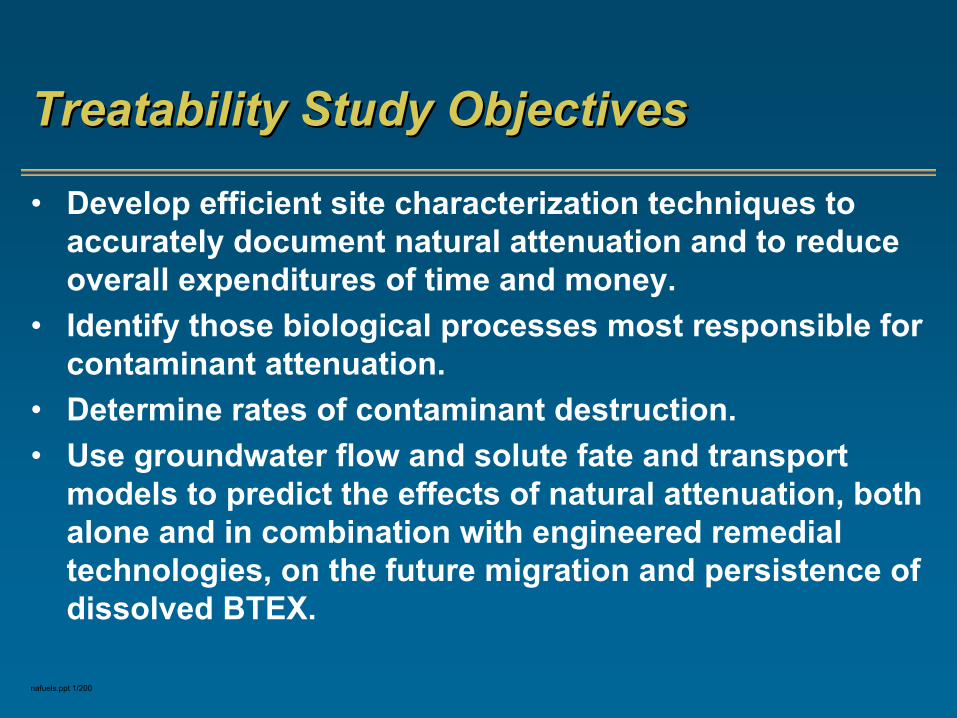
Treatability Study ObjectivesTreatability Study Objectives
• Develop efficient site characterization techniques to accurately document natural attenuation and to reduce overall expenditures of time and money.
• Identify those biological processes most responsible for contaminant attenuation.
• Determine rates of contaminant destruction.• Use groundwater flow and solute fate and transport
models to predict the effects of natural attenuation, both alone and in combination with engineered remedial technologies, on the future migration and persistence of dissolved BTEX.
nafuels.ppt 1/200
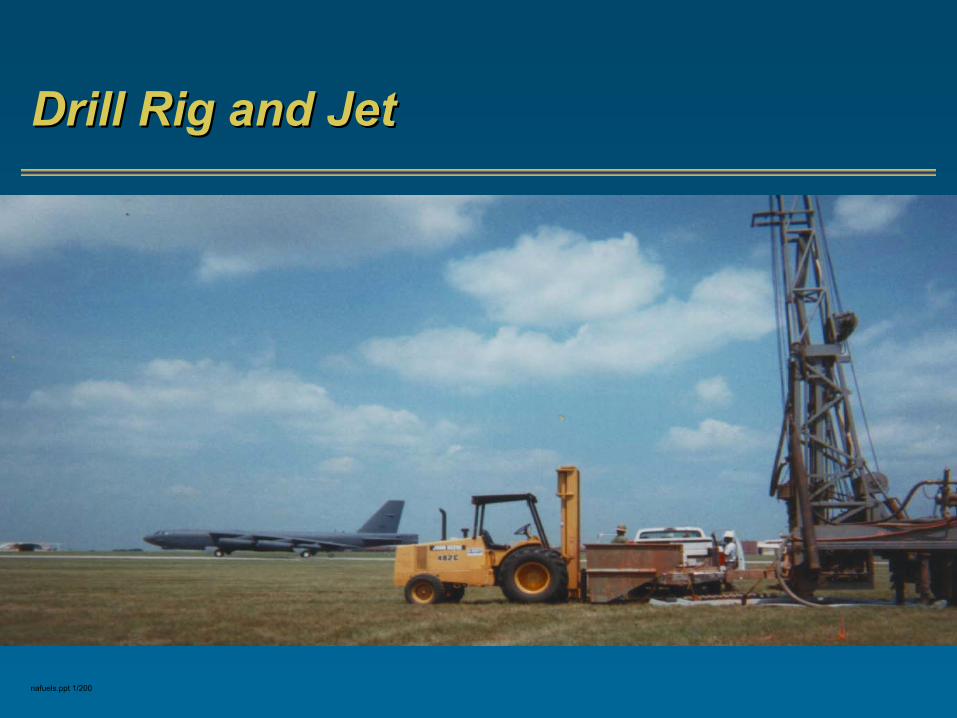
Drill Rig and JetDrill Rig and Jet
nafuels.ppt 1/200
Treatability Study ResultsTreatability Study Results
• Dissolved BTEX compounds are undergoing natural attenuation (biodegradation) at all 42 Air Force test sites representing a broad range of environmental conditions.
• The majority of dissolved BTEX plumes were either stable or receding (historical data or model predictions).
• The average relative contribution of each primary biodegradation process to the total assimilative capacity of the groundwater system decreased in the following order: sulfate reduction, methanogenesis, iron reduction, denitrification, and aerobic oxidation.

nafuels.ppt 1/200
Average Relative Contribution of BTEX Average Relative Contribution of BTEX Biodegradation Processes in Site GWBiodegradation Processes in Site GW
Sulfate Reduction74%
Methanogenesis16% Iron (III) Reduction
4%
Nitrate Reduction3%
Aerobic Oxidation3%

nafuels.ppt 1/200
Average Relative Contributions of BTEX Average Relative Contributions of BTEX Biodegradation Processes in Site GWBiodegradation Processes in Site GW
Iron (III) Reduction12%
Denitrification7%
Aerobic Oxidation8%
Sulfate Reduction28%
Methanogenesis45%
(Excluding 5 Sites with >200mg/l Sulfate Reduction Capacity)(Excluding 5 Sites with >200mg/l Sulfate Reduction Capacity)
nafuels.ppt 1/200
Treatability Study Results (continued)Treatability Study Results (continued)
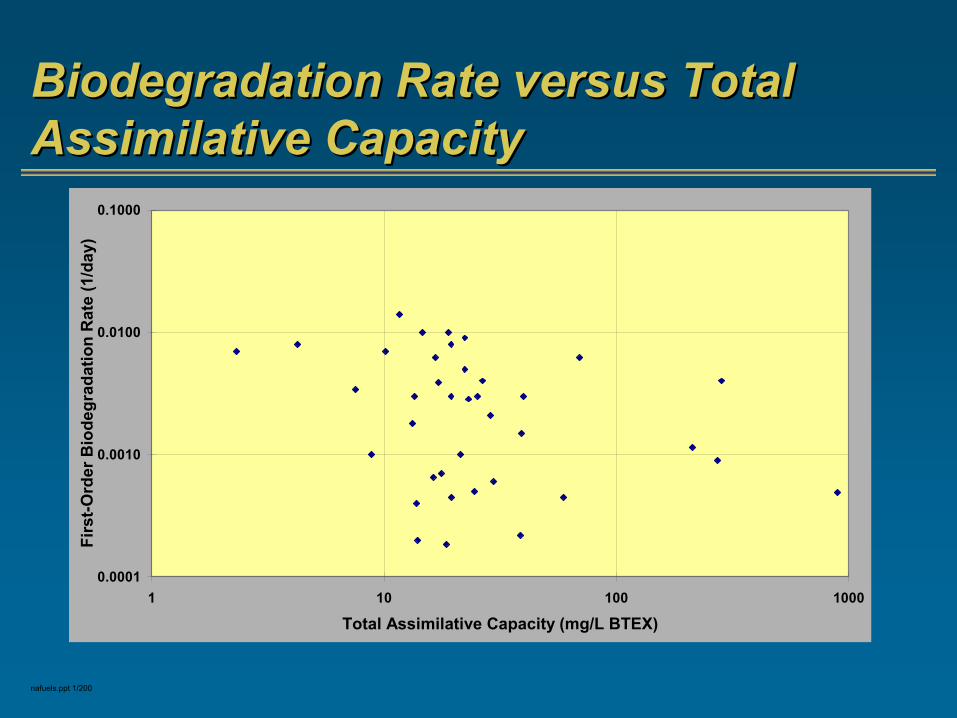
• The total BTEX assimilative capacity of groundwater averaged 64 milligrams per liter.
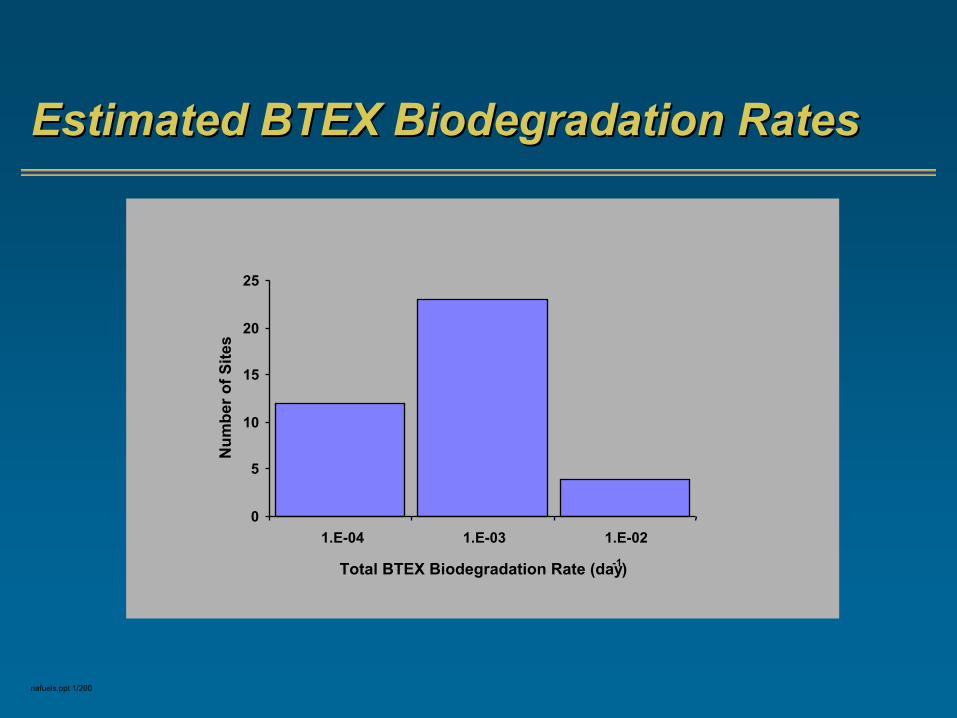
• The field-scale biodegradation rate constants ranged from 0.0002 to 0.08 percent per day (day-1), with a geometric mean value of 0.0019 day-1. Or, biodegradation half-lives of 9.5 years to 9 days, with a mean half-life of 1 year.
nafuels.ppt 1/200
Estimated BTEX Biodegradation RatesEstimated BTEX Biodegradation Rates
0
5
10
15
20
25
1.E-04 1.E-03 1.E-02
Total BTEX Biodegradation Rate (day-1)
Num
ber o
f Site
s

nafuels.ppt 1/200
Treatability Study Results (continued)Treatability Study Results (continued)
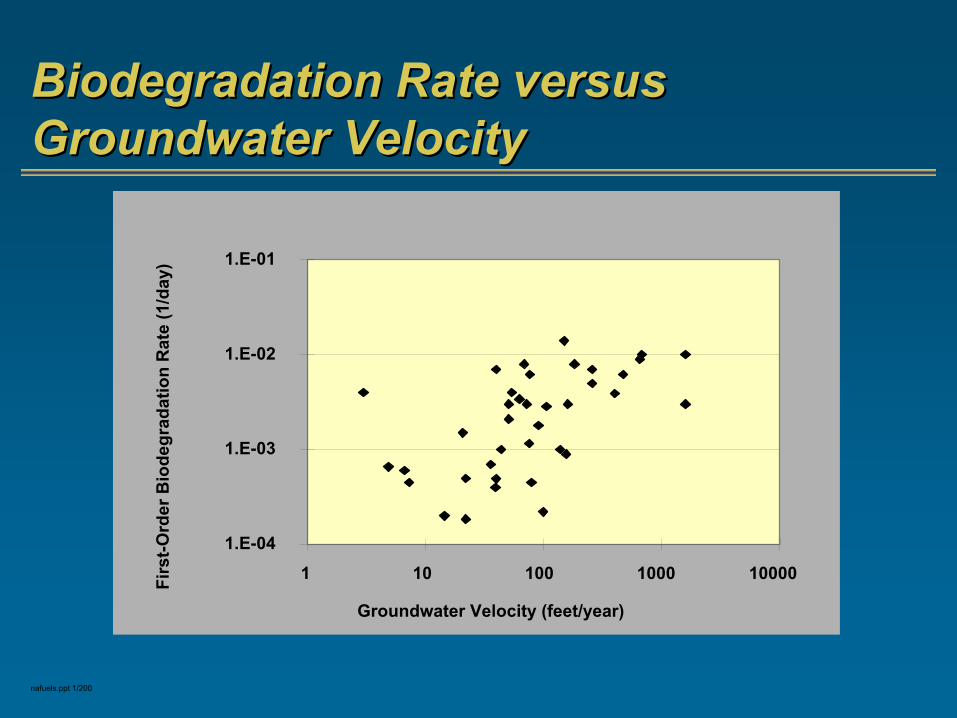
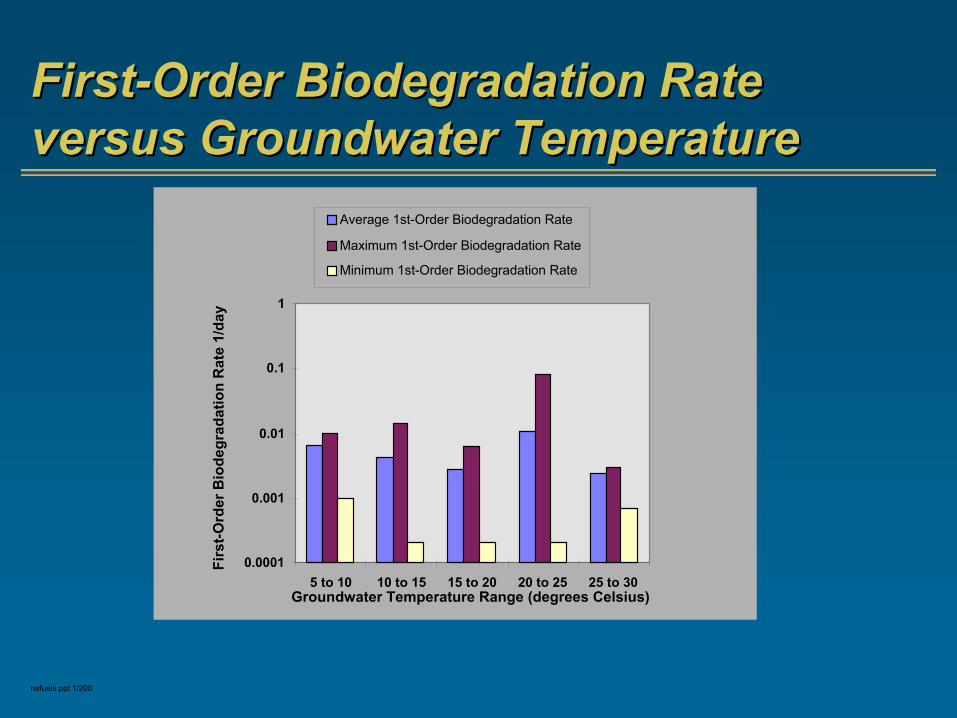
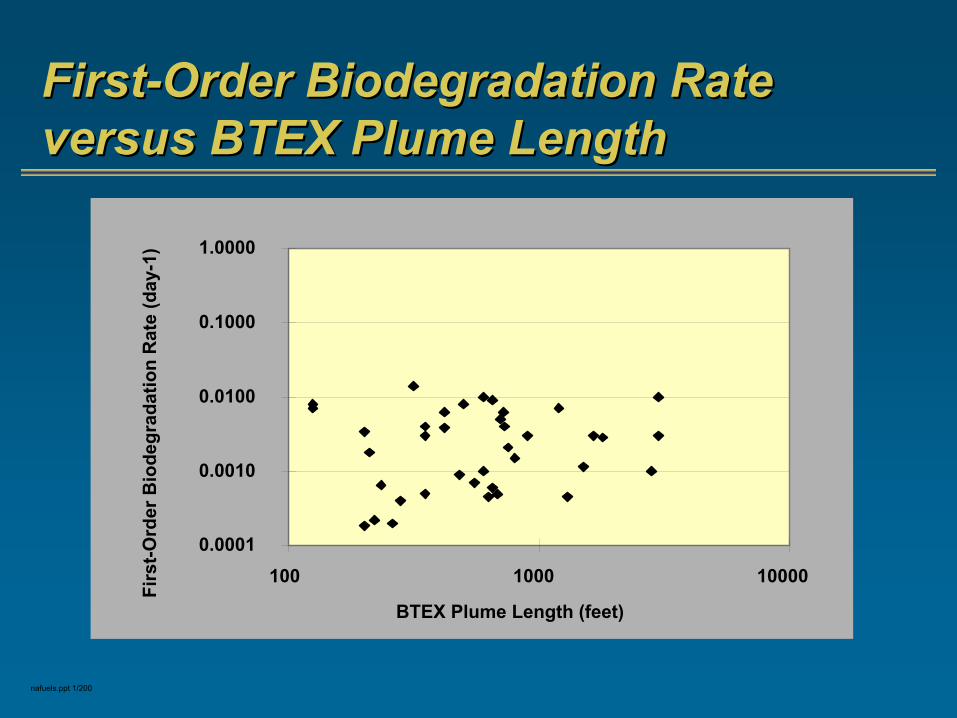
• There was some correlation between field biodegradation rates and groundwater velocity; correlation between biodegradation rates and groundwater temperature, assimilative capacity, and plume length were not apparent.
nafuels.ppt 1/200
Biodegradation Rate versus Biodegradation Rate versus Groundwater VelocityGroundwater Velocity
1.E-04
1.E-03
1.E-02
1.E-01
1 10 100 1000 10000
Groundwater Velocity (feet/year)
Firs
t-Ord
er B
iode
grad
atio
n R
ate
(1/d
ay)
nafuels.ppt 1/200
FirstFirst--Order Biodegradation Rate Order Biodegradation Rate versus Groundwater Temperatureversus Groundwater Temperature
0.0001
0.001
0.01
0.1
1
5 to 10 10 to 15 15 to 20 20 to 25 25 to 30Groundwater Temperature Range (degrees Celsius)
Firs
t-Ord
er B
iode
grad
atio
n R
ate
1/da
yAverage 1st-Order Biodegradation Rate
Maximum 1st-Order Biodegradation Rate
Minimum 1st-Order Biodegradation Rate
nafuels.ppt 1/200
Biodegradation Rate versus Total Biodegradation Rate versus Total Assimilative CapacityAssimilative Capacity
0.0001
0.0010
0.0100
0.1000
1 10 100 1000
Total Assimilative Capacity (mg/L BTEX)
Firs
t-Ord
er B
iode
grad
atio
n R
ate
(1/d
ay)
nafuels.ppt 1/200
FirstFirst--Order Biodegradation Rate Order Biodegradation Rate versus BTEX Plume Lengthversus BTEX Plume Length
0.0001
0.0010
0.0100
0.1000
1.0000
100 1000 10000
BTEX Plume Length (feet)
Firs
t-Ord
er B
iode
grad
atio
n R
ate
(day
-1)
nafuels.ppt 1/200
Are these Are these correlationscorrelations, or lack thereof, , or lack thereof, significant?significant?
• Biodegradation of BTEX compounds was documented under ALL environmental conditions encountered.
• Biodegradation, in conjunction with the non-destructive mechanisms of natural attenuation (advection, dispersion, and sorption), was significant enough to stabilize or attenuate groundwater plumes at the majority of sites.
nafuels.ppt 1/200
Treatability Study Results (continued)Treatability Study Results (continued)
• The average predicted time frame for dissolved BTEX to naturally attenuate below regulatory cleanup standards is conservatively estimated at 30 years. Engineered source reduction typically is required to attain cleanup standards in less than 20 years.

nafuels.ppt 1/200
Treatability Study Results (continued)Treatability Study Results (continued)
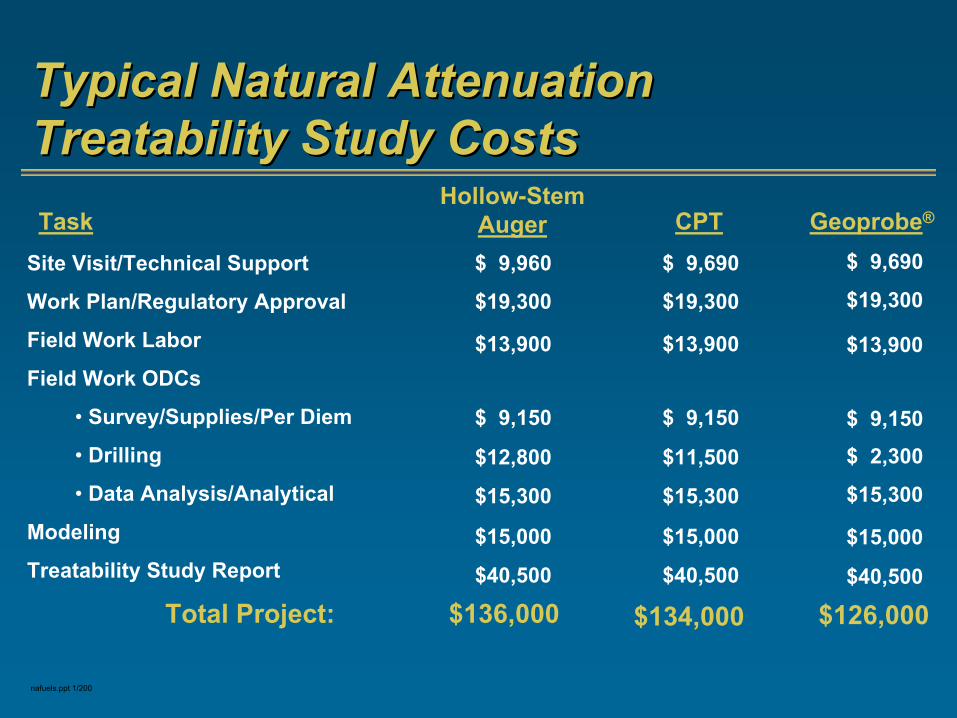
• The average cost per site for completingGeoprobe® site characterization, laboratory analysis, data analysis, fate and transport modeling, and reporting was $126,000. Slightly higher costs (up to $136,000) were incurred at sites where conventional auger drilling was required due to groundwater depth.
nafuels.ppt 1/200
Typical Natural AttenuationTypical Natural AttenuationTreatability Study CostsTreatability Study Costs
Site Visit/Technical Support
Work Plan/Regulatory Approval
Field Work Labor
Field Work ODCs
• Survey/Supplies/Per Diem
• Drilling
• Data Analysis/Analytical
Modeling
Treatability Study Report
$ 9,960
$19,300
$13,900
$ 9,150
$12,800
$15,300
$15,000
$40,500
TaskHollow-Stem
Auger Geoprobe®
$ 9,690
$19,300
$13,900
$ 9,150
$ 2,300
$15,300
$15,000
$40,500
$ 9,690
$19,300
$13,900
$ 9,150
$11,500
$15,300
$15,000
$40,500
CPT
Total Project: $136,000 $134,000 $126,000
nafuels.ppt 1/200
Treatability Study Results (concluded)Treatability Study Results (concluded)
• Recommended LTM programs for MNA included an average network of 11 wells with a duration of 22 years, and had an average total program cost of $192,000.
• At many sites, natural attenuation processes had stabilized the groundwater plume, but engineered source remediation was recommended to reduce the duration and cost of LTM.
nafuels.ppt 1/200
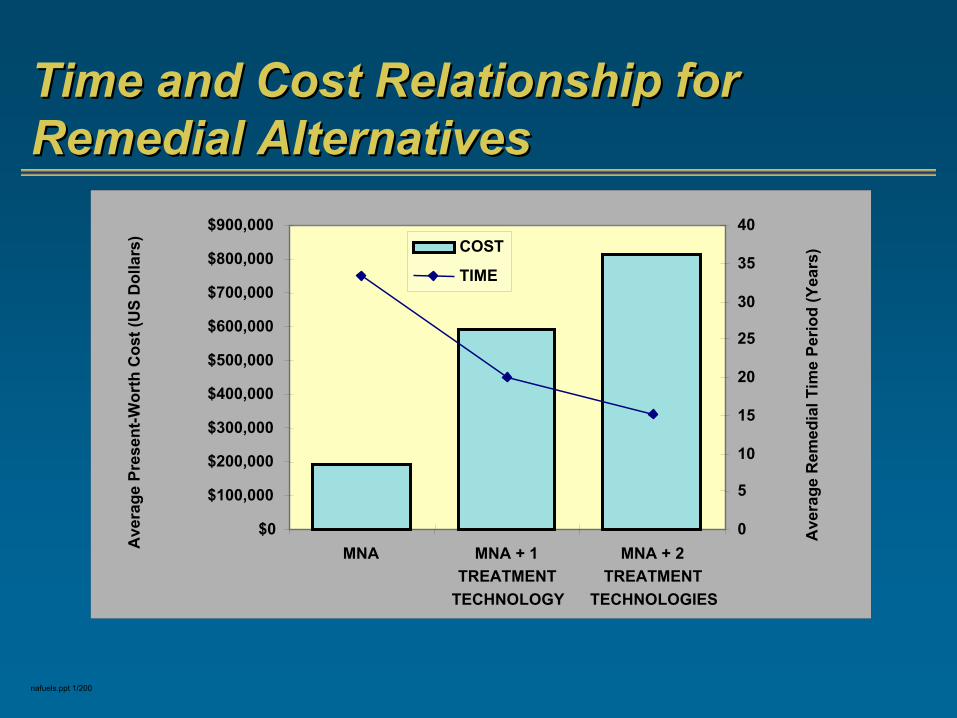
Time and Cost Relationship for Time and Cost Relationship for Remedial AlternativesRemedial Alternatives
$0
$100,000
$200,000
$300,000
$400,000
$500,000
$600,000
$700,000
$800,000
$900,000
MNA MNA + 1TREATMENT
TECHNOLOGY
MNA + 2TREATMENT
TECHNOLOGIES
Ave
rage
Pre
sent
-Wor
th C
ost (
US
Dol
lars
)
0
5
10
15
20
25
30
35
40
Ave
rage
Rem
edia
l Tim
e Pe
riod
(Yea
rs)COST
TIME
nafuels.ppt 1/2000
Case Study:Case Study: MacDillMacDill AFB Service AFB Service Station Site 56Station Site 56
Service Station Fuel Release Site
nafuels.ppt 1/200
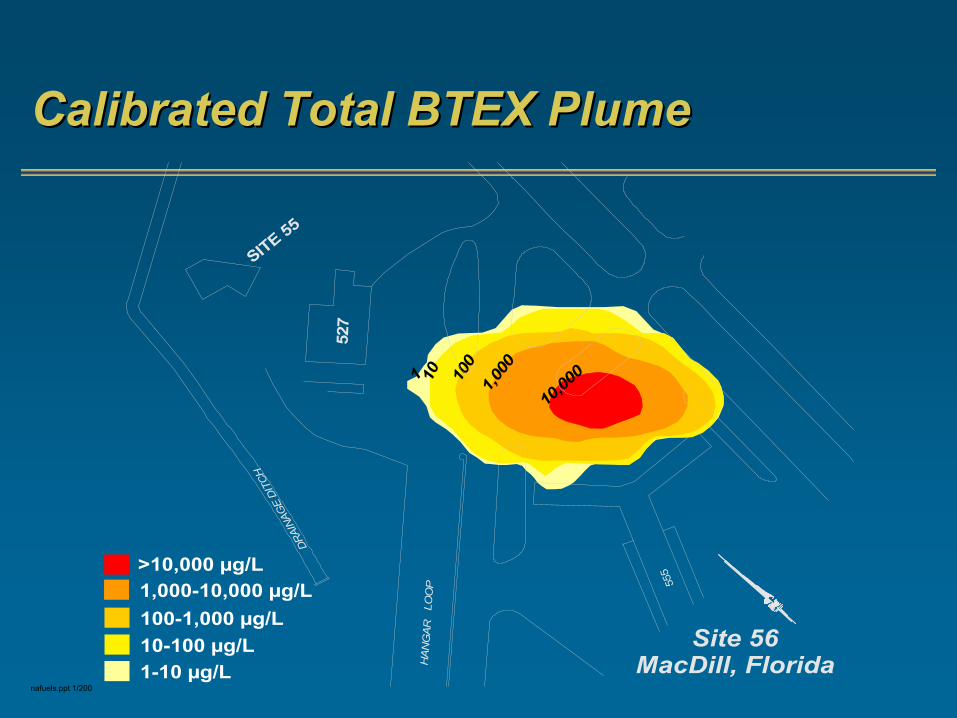
Calibrated Total BTEX PlumeCalibrated Total BTEX Plume
527
555
HAN
GAR
LOO
P
SITE 55
DRAI
NAG
E DI
TCH
100
1
10,00
010 1,000
>10,000 µg/L
100-1,000 µg/L1,000-10,000 µg/L
10-100 µg/L1-10 µg/L , Florida
Site 56MacDill

nafuels.ppt 1/200
Simulated Total BTEX at 10 YearsSimulated Total BTEX at 10 Years
527
555
HAN
GAR
LOO
P
SITE 55
DRAI
NAG
E DI
TCH
>10,000 µg/L
100-1,000 µg/L1,000-10,000 µg/L
10-100 µg/L1-10 µg/L , Florida
Site 56MacDill
100
1
10,00010
1,000
nafuels.ppt 1/200
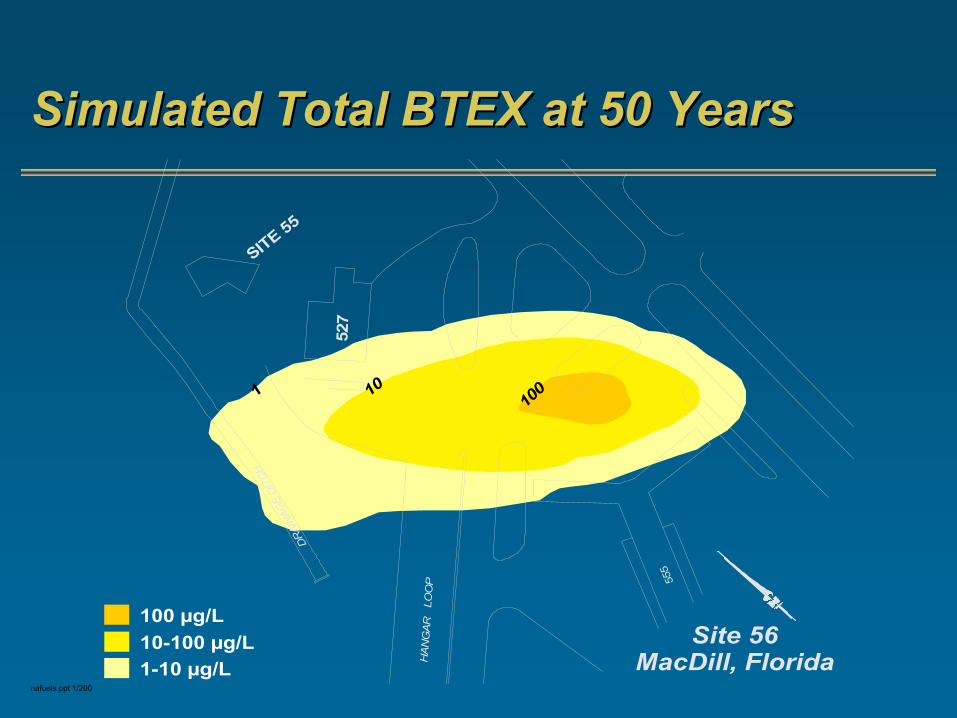
Simulated Total BTEX at 50 YearsSimulated Total BTEX at 50 Years
100 µg/L10-100 µg/L1-10 µg/L , Florida
Site 56MacDill
1001 10
527
555
HAN
GAR
LOO
P
SITE 55
DRAI
NAG
E DI
TCH
nafuels.ppt 1/200
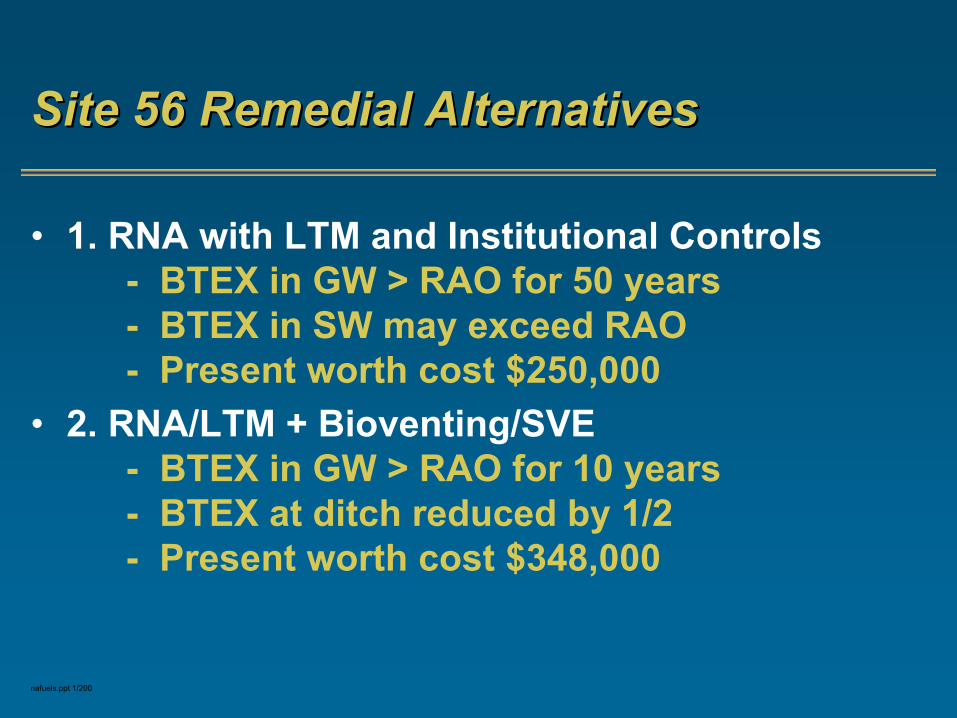
Site 56 Remedial AlternativesSite 56 Remedial Alternatives
• 1. RNA with LTM and Institutional Controls- BTEX in GW > RAO for 50 years- BTEX in SW may exceed RAO- Present worth cost $250,000
• 2. RNA/LTM + Bioventing/SVE- BTEX in GW > RAO for 10 years- BTEX at ditch reduced by 1/2- Present worth cost $348,000
nafuels.ppt 1/200
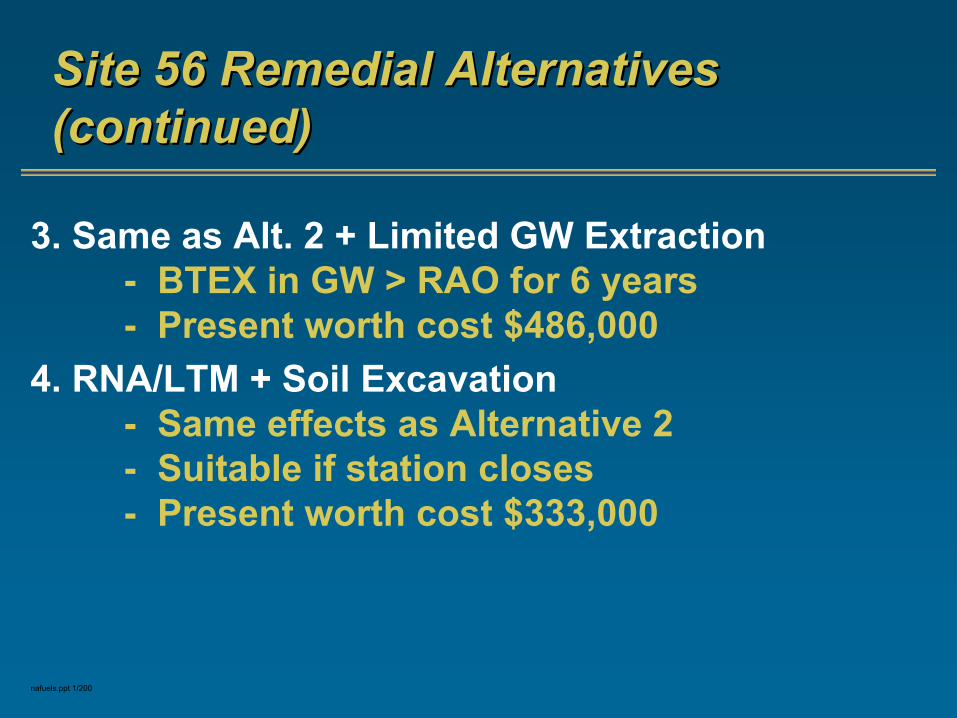
Site 56 Remedial AlternativesSite 56 Remedial Alternatives(continued)(continued)
3. Same as Alt. 2 + Limited GW Extraction- BTEX in GW > RAO for 6 years- Present worth cost $486,000
4. RNA/LTM + Soil Excavation- Same effects as Alternative 2- Suitable if station closes- Present worth cost $333,000
nafuels.ppt 1/200
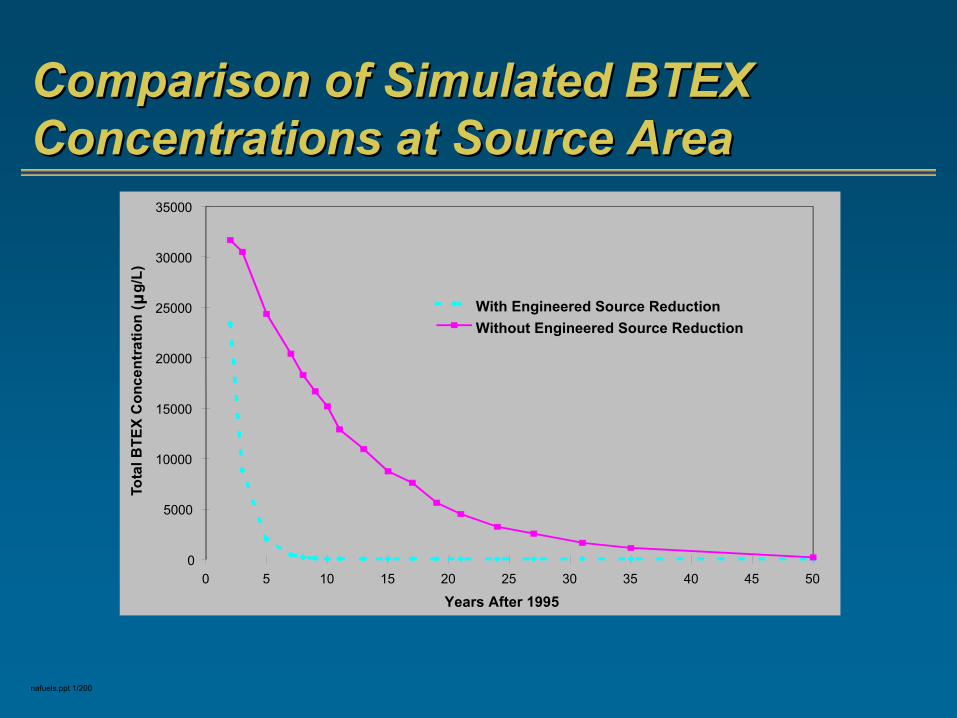
Comparison of Simulated BTEX Comparison of Simulated BTEX Concentrations at Source AreaConcentrations at Source Area
0
5000
10000
15000
20000
25000
30000
35000
0 5 10 15 20 25 30 35 40 45 50
Years After 1995
Tota
lBTE
XC
o nce
n tra
ti on
(g/
L )
With Engineered Source ReductionWithout Engineered Source Reduction
µ
nafuels.ppt 1/200
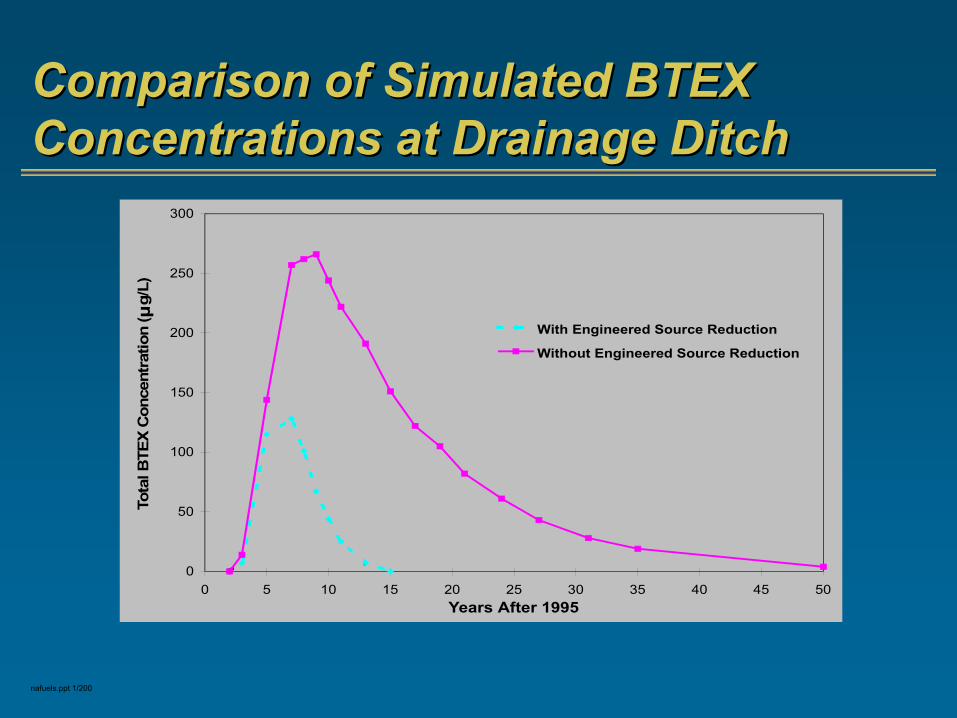
Comparison of Simulated BTEX Comparison of Simulated BTEX Concentrations at Drainage DitchConcentrations at Drainage Ditch
0
50
100
150
200
250
300
0 5 10 15 20 25 30 35 40 45 50Years After 1995
Tota
l BTE
X C
once
ntra
tion
( g
/L)
With Engineered Source Reduction
Without Engineered Source Reduction
µ
nafuels.ppt 1/200
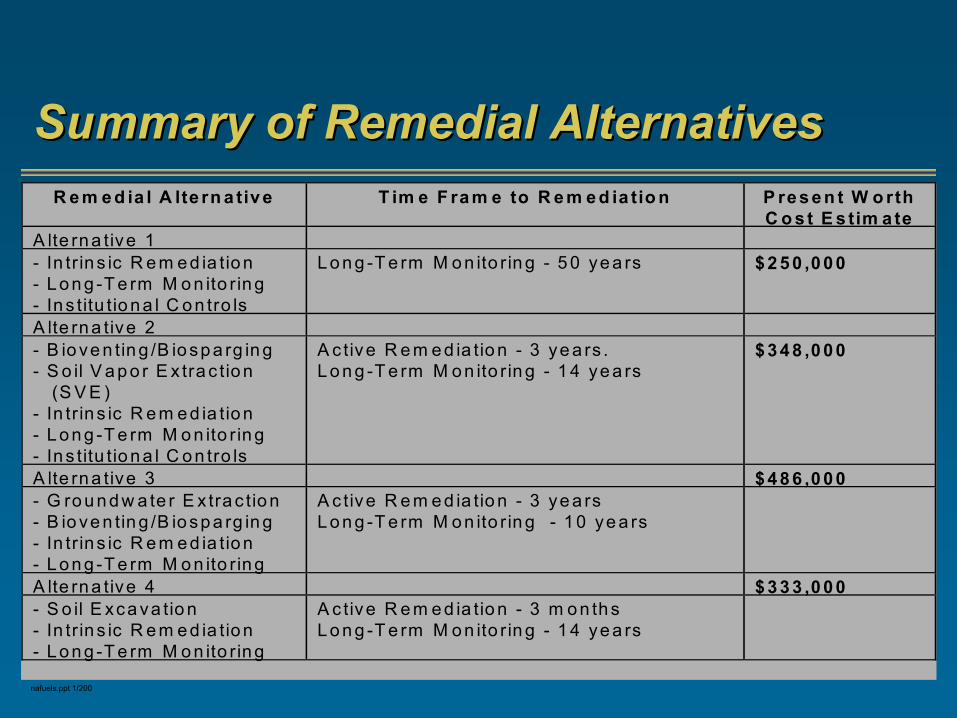
R e m e d ia l A lte rn a tiv e T im e F ra m e to R e m e d ia tio n P re s e n t W o rthC o s t E s tim a te
A lte rn a tive 1- In tr in s ic R e m e d ia tio n- L o n g -T e rm M o n ito rin g- In s titu tio n a l C o n tro ls
L o n g -T e rm M o n ito r in g - 5 0 ye a rs $ 2 5 0 ,0 0 0
A lte rn a tive 2- B io ve n tin g /B io sp a rg in g- S o il V a p o r E x tra c tio n (S V E )- In tr in s ic R e m e d ia tio n- L o n g -T e rm M o n ito rin g- In s titu tio n a l C o n tro ls
A c tive R e m e d ia tio n - 3 ye a rs .L o n g -T e rm M o n ito r in g - 1 4 ye a rs
$ 3 4 8 ,0 0 0
A lte rn a tive 3 $ 4 8 6 ,0 0 0- G ro u n d w a te r E x tra c tio n- B io ve n tin g /B io sp a rg in g- In tr in s ic R e m e d ia tio n- L o n g -T e rm M o n ito rin g
A c tive R e m e d ia tio n - 3 ye a rsL o n g -T e rm M o n ito r in g - 1 0 ye a rs
A lte rn a tive 4 $ 3 3 3 ,0 0 0- S o il E xca va tio n- In tr in s ic R e m e d ia tio n- L o n g -T e rm M o n ito rin g
A c tive R e m e d ia tio n - 3 m o n th sL o n g -T e rm M o n ito r in g - 1 4 ye a rs
Summary of Remedial AlternativesSummary of Remedial Alternatives
nafuels.ppt 1/200
Site 56 RecommendationsSite 56 Recommendations
• Alternative 2 achieves best combination of risk reduction and cost effectiveness
• If station closes, Alternative 4 may be most appropriate
nafuels.ppt 1/200
Lessons Learned:Lessons Learned:
• Natural attenuation with biodegradation of fuel hydrocarbons is ubiquitous throughout the environment.
• Natural attenuation rates were rapid enough to stabilize hydrocarbon plume migration even when groundwater velocities were relatively high.
• Evaluate natural attenuation as a preferred remedy for fuel-contaminated groundwater before considering other more costly alternatives.
nafuels.ppt 1/200
Lessons Learned (continued):Lessons Learned (continued):
• In cases where engineered remediation is required to lessen the remediation time frame or to protect potential receptors, low-cost, in situ source reduction (e.g., bioventing, SVE, and biosparging) should be considered to speed the remediation process.
• More costly remediation techniques (e.g., groundwater extraction and treatment) should be implemented only if the plume poses an imminent threat to human health or the environment.
nafuels.ppt 1/200
Lessons Learned (continued):Lessons Learned (continued):
• Important factors to consider when using MNA are the required level of groundwater modeling and the potential value of source reduction technologies in reducing LTM time frames and obtaining regulatory acceptance of a site closure strategy.
nafuels.ppt 1/200
Lessons Learned (concluded):Lessons Learned (concluded):
• AFCEE/ERT and Parsons ES have implemented a streamlined risk-based site closure program that incorporates the “lessons learned” from natural attenuation studies.
• Under this program, fuel-contaminated sites are obtaining MNA site closure agreements at half the cost of the original natural attenuation TSs.

nafuels.ppt 1/200
Special Considerations:Special Considerations:
• With the majority of fuel hydrocarbon plumes either stable or receding, the focus of site remediation shifts to the persistence of contaminants in groundwater at levels above regulatory guidelines.
• Several states have published guidance or regulations regarding the conduct of natural attenuation studies.
• Some regulatory agencies may have restrictions on the time frame for remediation by natural attenuation (e.g., State of Florida - 5 years)
nafuels.ppt 1/200
Special Considerations (concluded):Special Considerations (concluded):
• Property transfer or sale may impose time constraints on remediation (base closures, real estate sales).
• Responsible parties are subject to continuing environmental liability during the long-term remediation.
• No guarantees that regulatory guidelines will not change in the future (e.g., time frame to remediate, possible enforceable guidelines for MTBE).