Embed Size (px)
Citation preview

REPORT DOCUMENTATION PAGE
Form Approved OMB No. 074-0188
Public reporting burden for this collection of information is estimated to average 1 hour per response, including g the time for reviewing instructions, searching existing data sources, gathering and maintaining the data needed, and completing and reviewing the collection of information. Send comments regarding this burden estimate or any other aspect of the collection of information, including suggestions for reducing this burden to Washington Headquarters Services, Directorate for Information Operations and Reports, 1215 Jefferson Davis Highway, Suite 1204, Arlington, VA 22202-4302, and to the Office of Management and Budget, Paperwork Reduction Project (0704-0188), Washington, DC 20503. 1. AGENCY USE ONLY (Leave blank)
2. REPORT DATE 7 May 2007
3. REPORT TYPE AND DATE COVERED
4. TITLE AND SUBTITLE Multi-pulse Converters and Passive Filtering to Improve Power Harmonics in an Integrated Power System 6. AUTHOR(S) Ku, Daniel C.
5. FUNDING NUMBERS
7. PERFORMING ORGANIZATION NAME(S) AND ADDRESS(ES)
8. PERFORMING ORGANIZATION REPORT NUMBER
9. SPONSORING/MONITORING AGENCY NAME(S) AND ADDRESS(ES)
10. SPONSORING/MONITORING AGENCY REPORT NUMBER
US Naval Academy Annapolis, MD 21402
Trident Scholar project report no. 354 (2007)
11. SUPPLEMENTARY NOTES
12a. DISTRIBUTION/AVAILABILITY STATEMENT This document has been approved for public release; its distribution is UNLIMITED.
12b. DISTRIBUTION CODE
13. ABSTRACT The United States Navy is considering new power distribution architectures for surface combatants to enhance war-fighting capabilities and ship design opportunities. One such concept is the Integrated Power System (IPS) in which a common electric bus delivers power to both the ship’s propulsion system and ship service electric system. One of the main challenges to the IPS/all-electric ship is the introduction of significant harmonic distortion into the main AC distribution bus caused by power electronic equipment. Power electronic equipment is necessary to implement the variable-speed motor drive for propulsion and for power conversion associated with distribution. The harmonic distortion leads to derating distribution equipment and degrading the performance of various system loads. As a result, every system attached to the main distribution bus must be able to accommodate the harmonics or the harmonics must be reduced to acceptable levels.The project’s objective is to compare competing strategies that seek to reduce bus harmonics in a naval warship IPS. The subsidiary benefit of this task is to improve the efficiency and minimize the derating factor for shipboard engines, generators, and transformers. The proposed method of reducing harmonics is a system based on multi-pulse rectifiers and passive filtering. A multi-pulse rectifier is a power electronic device that converts AC power into DC power. Six and twelve-pulse rectifier systems are simulated and evaluated, as well as constructed and tested in the laboratory on a reduced scale. A design paradigm for passive filtering is set forth for each system. Size, weight, and acquisition cost estimates are derived from vendor data and assessed for feasibility of implementation on an actual destroyer-class warship. This project demonstrates the feasibility of improving power harmonics in an IPS using a system of multi-pulse converters and filtering.
15. NUMBER OF PAGES 72
14. SUBJECT TERMS Total Harmonic Distortion (THD), Integrated Power System (IPS), Multi-pulse Converters (IPS), Power Harmonics, Harmonic Filter.
16. PRICE CODE
17. SECURITY CLASSIFICATION OF REPORT
18. SECURITY CLASSIFICATION OF THIS PAGE
19. SECURITY CLASSIFICATION OF ABSTRACT
20. LIMITATION OF ABSTRACT
NSN 7540-01-280-5500 Standard Form 298 (Rev.2-89) Prescribed by ANSI Std. Z39-18
298-102

1
U.S.N.A. --- Trident Scholar project report; no. 354 (2007)
MULTI-PULSE CONVERTERS AND PASSIVE FILTERING
TO IMPROVE POWER HARMONICS IN AN INTEGRATED POWER SYSTEM
by
Midshipman 1/c Daniel C. Ku
United States Naval Academy
Annapolis, Maryland
_____________________________________________
Certification of Advisers Approval
Associate Professor John G. Ciezki
Electrical Engineering Department
______________________________________________
______________________________
Assistant Professor Thomas Salem
Electrical Engineering Department
______________________________________________
______________________________
Acceptance for the Trident Scholar Committee
Professor Joyce E. Shade
Deputy Director of Research & Scholarship
______________________________________________
______________________________
USNA-1531-2

1
Abstract
The United States Navy is considering new power distribution architectures for surface
combatants to enhance war-fighting capabilities and ship design opportunities. One such concept
is the Integrated Power System (IPS) in which a common electric bus delivers power to both the
ship’s propulsion system and ship service electric system.
One of the main challenges to the IPS/all-electric ship is the introduction of significant
harmonic distortion into the main AC distribution bus caused by power electronic equipment.
Power electronic equipment is necessary to implement the variable-speed motor drive for
propulsion and for power conversion associated with distribution. The harmonic distortion leads
to derating distribution equipment and degrading the performance of various system loads. As a
result, every system attached to the main distribution bus must be able to accommodate the
harmonics or the harmonics must be reduced to acceptable levels.
The project’s objective is to compare competing strategies that seek to reduce bus
harmonics in a naval warship IPS. The subsidiary benefit of this task is to improve the efficiency
and minimize the derating factor for shipboard engines, generators, and transformers. The
proposed method of reducing harmonics is a system based on multi-pulse rectifiers and passive
filtering. A multi-pulse rectifier is a power electronic device that converts AC power into DC
power. Six and twelve-pulse rectifier systems are simulated and evaluated, as well as constructed
and tested in the laboratory on a reduced scale. A design paradigm for passive filtering is set
forth for each system.
Size, weight, and acquisition cost estimates are derived from vendor data and assessed for
feasibility of implementation on an actual destroyer-class warship. This project demonstrates the
feasibility of improving power harmonics in an IPS using a system of multi-pulse converters and
filtering.

2
Keywords
Total Harmonic Distortion (THD)
Integrated Power System (IPS)
Multi-pulse Converters
Power Harmonics
Harmonic Filter

3
Acknowledgements
I would like to thank Professor Ciezki and Professor Salem for their guidance and support
with this project. Without them, this project would have been impossible. I would also like to
thank the Electrical Engineering Department Lab Technicians for helping me set up equipment,
providing technical support, and assisting whenever needed. I would also like to thank Bonnie
Jarrell, the Electrical Engineering Department secretary, for always providing a smile and
helping with the administrative side of this project. Finally, I would like to thank Professor
Shade and the members of the Trident Scholar Committee for their continual dedication.

4
Table of Contents
Abstract.....................................................................................................................1
Acknowledgements......................................................................................................................3
Table of Contents .....................................................................................................4
List of Figures/Tables ..................................................................................................................5
Glossary .......................................................................................................................................7
I. Introduction ..........................................................................................................9
II. Background .......................................................................................................14
A. Source of Harmonics.............................................................................................................14
B. Harmonic Analysis................................................................................................................17
C. Impact and Treatment of Harmonics.....................................................................................20
III. Simulation ........................................................................................................24
A. Six-Pulse Rectifier System....................................................................................................24
B. Thyristor Firing Control ........................................................................................................26
C. Twelve-Pulse Rectifier System .............................................................................................28
D. Filtering.................................................................................................................................31
E. Full Integrated Power System ...............................................................................................36
IV. Hardware..........................................................................................................40
A. Six-Pulse Rectifier System....................................................................................................40
B. Windowing ............................................................................................................................41
C. Twelve-Pulse Rectifier System .............................................................................................44
D. Hardware Filtering ................................................................................................................48
V. Comparison of Hardware to Simulation.........................................................50
VI. Tradeoff Analysis.............................................................................................52
VII. Areas of Future Research..............................................................................57
VIII. Bibliography..................................................................................................59
IX. Appendices .......................................................................................................61
A. Appendix A- MATLAB®
Code ............................................................................................61
B. Appendix B- Hardware/Simulation Data, Six-Pulse Current Waveforms............................64

5
List of Figures/Tables
Figure 1: Integrated Electric Drive Ship......................................................................................... 9
Figure 2: Current Destroyer-Class (DDG-51) Navy Ship Power System .................................... 11
Figure 3: Notional Integrated Power System for Destroyer Class Navy Ship.............................. 12
Figure 4: Electrical vs. Mechanical Propulsion ............................................................................ 12
Figure 5: Sinusoidal Voltage with No Harmonics........................................................................ 14
Figure 6: Six-Pulse Rectifier Circuit............................................................................................. 15
Figure 7: Output Voltage for Six-Pulse Rectifier Displaying Six Ripples
for Each Cycle of Input Voltage ................................................................................. 16
Figure 8: Representative Supply Phase Current Waveform for Six-Pulse Rectifier .................... 16
Figure 9: Fundamental Frequency of 60 Hz Sine Wave and Harmonics ..................................... 17
Figure 10: Decomposition of a Distorted Wave ........................................................................... 18
Figure 11: Severe Voltage Distortion as a Result of Harmonic Currents..................................... 21
Figure 12: Implementation of Passive Filtering for a-phase
for Reducing the 5th, 7th, and Nth Harmonics ........................................................... 22
Figure 13: Six-Pulse Rectifier Test System Schematic in PSCAD®
............................................ 25
Figure 14: PSCAD®
Simulation Waveform for a-phase Current
from Six-Pulse Rectifier Test System......................................................................... 25
Figure 15: PSCAD®
Simulation Waveform for a-phase from Reference 164
.............................. 25
Figure 16: ACSL Simulation Waveform for a-phase Current ...................................................... 25
Figure 17: SABRE Simulation Waveform for a-phase Current ................................................... 25
Figure 18: Firing Signal Control Circuit for Thyristor 1 of Figure 13 ......................................... 27
Figure 19: Time-Delay Method of Firing Control........................................................................ 28
Figure 20: Twelve-Pulse Rectifier System ................................................................................... 28
Figure 21: Twelve-Pulse Rectifier Test System Schematic in PSCAD®
...................................... 29
Figure 22: PSCAD®
Simulation Waveform for a-phase Current
from Twelve-Pulse Rectifier Test System .................................................................. 30
Figure 23: Shunt Filtering for Reducing the 5th
Harmonic........................................................... 31
Figure 24: Full-Integrated Power System Model.......................................................................... 36
Figure 25: Full Integrated Power System Schematic in PSCAD®
................................................ 37
Figure 26: Six-Pulse Thyristor Rectifier Circuit Implemented using Lab-Volt®
modules ........... 40
Figure 27: Expected FFT versus Leakage Effects ........................................................................ 41
Figure 28: Leakage Effects versus Windowing ............................................................................ 42
Figure 29: Supply Phase Current and Effect of Hanning Window............................................... 43
Figure 30: FFT of Supply Phase Current and Effect of Hanning Window .................................. 44
Figure 31: Twelve-Pulse Diode Rectifier Model Implemented Using LabVOLT ....................... 45
Figure 32: Hardware Setup of Multi-Pulse Converters ................................................................ 46
Figure 33: Generator Phase Current and Hanning Window ......................................................... 47
Figure 34: Implementation of Harmonic Filters on Connector Board.......................................... 49
Figure 35: Integrated Power System Without DC Load............................................................... 57
Figure B- 1: Generator Current for Six-Pulse, No Filter and Firing Angle=0° ............................ 65
Figure B- 2: Generator Current for Six-Pulse, 5th
Harmonic Filter and Firing Angle=0°............ 65
Figure B- 3: Generator Current for Six-Pulse,
5th
+7th
Harmonic Filter and Firing Angle=0° .......................................................... 66

6
Figure B- 4: Generator Current for Six-Pulse,
5th
+11th
Harmonic Filter and Firing Angle=0° ........................................................ 66
Figure B- 5: Generator Current for Six-Pulse, No Filter and Firing Angle=0° ............................ 67
Figure B- 6: Generator Current for Six-Pulse, No Filter and Firing Angle=20.4° ....................... 67
Figure B- 7: Generator Current for Six-Pulse,
5th
+7th
Harmonic Filter and Firing Angle=20.4° ..................................................... 68
Figure B- 8: Generator Current for Six-Pulse,
5th
+11th
Harmonic Filter and Firing Angle=20.4° ................................................... 68
Figure B- 9: Generator Current for Six-Pulse, No Filter and Firing Angle=45° .......................... 69
Figure B- 10: Generator Current for Six-Pulse, 5th
Harmonic Filter and Firing Angle=45°........ 69
Figure B- 11: Generator Current for Six-Pulse,
5th
+7th
Harmonic Filter and Firing Angle=45° ........................................................ 70
Figure B- 12: Generator Current for Six-Pulse,
5th
+11th
Harmonic Filter and Firing Angle=45° ...................................................... 70
Table 1: Parameter Values for Six-Pulse Rectifier Test System .................................................. 24
Table 2: LC Design....................................................................................................................... 33
Table 3: Twelve-Pulse Test System: Output Voltage, Generator RMS Current, and Generator
Current THD for Various Filtering and Firing Angles .................................................. 34
Table 4: Full Integrated Power System: Supply Current THD, Output Voltage, and Power for
Various Filtering and Propulsion Loads ........................................................................ 38
Table 5: THD Data for Various Windows and Firing Angles ...................................................... 42
Table 6: LC Values for Filtering................................................................................................... 48
Table 7: Comparison of Hardware to Simulation Results for THD, Vout, and Ia.......................... 50
Table 8:Parameters for 3 Step, 5th
Harmonic Filter ...................................................................... 53
Table 9: Complete Hardware Simulation Data for Six-Pulse Rectifier........................................ 64
Table 10: Complete PSCAD®
Simulation Data for Six-Pulse Rectifier....................................... 64

7
Glossary
Apparent Power: “total” power; if the impedance of the system is purely resistive, the voltage
and current are in-phase and apparent power is equal to real power; otherwise, it is
equivalent to the magnitude of the phasor sum of real and reactive power
Diode: semiconductor device that operates in a manner similar to that of a mechanical check
valve, carrying current in only one direction. A diode turns ON when it has a positive
voltage across it; it turns OFF when the diode current attempts to reverse its direction
(turn negative)
Filter: electronic circuit that rejects or passes a signal based on its frequency
Generator: rotating machine that converts mechanical energy into electrical energy; for a ship, a
generator produces 3-phase AC power (same as synchronous machine)
Harmonic: a component frequency of a periodic signal that is an integer multiple of the
fundamental frequency; i.e. if the fundamental frequency is 60Hz, the second harmonic is
120Hz
Inverter: power electronic device that converts DC power into AC power
Motor Drive: power electronic system that converts fixed-amplitude, fixed-frequency AC power
into variable-amplitude, variable-frequency AC power to control a motor
Power Conversion Module: system that converts power into the appropriate form for
distribution to various loads
Power Electronic Converter: a circuit that employs semiconductor devices in order to
transform power from one form into another; i.e. from AC into DC
Power Factor: ratio of real power to apparent power, represented as a dimensionless number
between 0 and 1

8
Prime Mover: gas turbine engine that converts fuel into mechanical power
Propulsion Motor: electric motor that drives the propeller, which in turn drives the ship
Reactive Power: “cost” of charging and discharging the magnetic fields of inductors and the
electric field of capacitors
Real Power: “useful” power that is manifested in a tangible form, such as heat, light, or
mechanical motion
Root Mean Square (RMS): the effective value of voltage or current; the waveform is squared,
the result is averaged over time, and the square root of the value is taken
Ship Service: shipboard electrical power requirements not related to propulsion such as lighting,
heating, and computers
Rectifier: power electronic device that converts AC power into DC power
Thyristor: controllable diode in which turn on can be delayed from its natural point

9
I. Introduction
The concept of integrated electric ship propulsion is popular in the U.S. Navy because it
provides opportunities for new war-fighting capabilities and a flexible arrangement of equipment.
An Integrated Power System (IPS) is one in which a common electric bus delivers power to both
the ship’s propulsion system and ship service electric system, as illustrated in Figure 1. The
concept dates back to the early 1900s; however, modern IPS architectures exploit advancements
in power electronics.
Figure 1: Integrated Electric Drive Ship1
In Figure 1, the prime mover is a mechanical engine that drives an AC synchronous
generator, which would typically produce fixed-amplitude 60 Hz voltages. In the motor drive,
the AC voltages are first converted to DC by a rectifier. Variable-frequency, variable-amplitude
AC is then synthesized by a power electronic device called an inverter. The inverter output is
Invt. Prime Mover
Gen. Rect.
Trans.
Propeller
Prop. Motor
Motor Drive
Power Conversion Module
Ship Service Power
Rect.

10
applied to a propulsion motor that is directly coupled to the propeller shaft. To enhance
reliability and survivability, the propulsion motor will have more than the traditional three phases.
In addition, as shown in Figure 1, emerging ship designs are employing DC voltage distribution.
In such an architecture, a power conversion module containing a transformer and a rectifier
converts the generator AC power into DC for distribution. The DC voltage is then manipulated
into a form required by the end user (e.g. Three-phase AC, lower voltage DC, etc.).
With the continued rapid growth and development in the power electronics industry,
including high-power solid-state switching devices and multi-megawatt variable speed drives,
the all-electric ship with an IPS has become possible, with numerous potential advantages over a
current non-IPS ship. For several years, the commercial marine industry has adopted IPS
architectures with example applications including cruise liners, ferries, and icebreakers.2 The
research work proposed here will focus on one of the outstanding design challenges facing the
implementation of an IPS for a surface combatant warship. Specifically, this project will focus
on reducing the bus harmonics in a naval warship IPS.
The current mechanical drive system of a typical destroyer-class (DDG-51 Arleigh Burke)
warship, as shown in Figure 2, requires four prime movers (gas turbines), with a combined
capacity of approximately 78 MW, to drive two variable-pitch propellers via reduction gears.
Ship speed control is achieved through the coordinated change of the propeller pitch and the
speed of the gas turbines. Three additional engines are necessary to drive AC synchronous
generators, which make available approximately 9 MW for ship service power. Thus, for most of
the operating speeds of the ship, much of the installed power is “chained” to propulsion and is
not available for use by electrical loads, as illustrated in Figure 2.

11
Figure 2: Current Destroyer-Class (DDG-51) Navy Ship Power System
The U.S. Navy’s interest in the IPS stems primarily from its promise to increase war-
fighting capability by accommodating emerging high-energy weapons. For example, rail gun
technology promises to increase the land-attack range of a surface combatant while high-energy
lasers or microwave weapons can figure integrally into Theater Ballistic Missile Defense
(TBMD). Current surface combatant power systems do not possess the capacity to accommodate
such energy-intensive weaponry. In addition, combining the propulsion and ship service
electrical systems allows for the total number of engines to be reduced, for example, from seven
to four, as shown in Figure 3. The number and size of these engines would be optimized for the
ship mission. The proposed elimination of both reduction gear and the direct connection of the
prime mover to the propeller shaft increases the acoustic performance of the ship.

12
Figure 3: Notional Integrated Power System for Destroyer Class Navy Ship
In an IPS ship, the prime movers can always be run at an optimized speed while ship
speed is adjusted through power electronic control of electric motors directly coupled to the
propeller shaft. Thus, in spite of the lower drive-train efficiency (η), as illustrated in Figure 4, an
IPS ship can always have the optimal number of prime movers operating at near their peak
efficiency; hence, fuel efficiency gains can be realized.
Figure 4: Electrical vs. Mechanical Propulsion1
Gen.

13
The use of ship power is also made more flexible by an IPS. In the current DDG-51
class destroyer, approximately four-fifths of available power is dedicated to ship’s propulsion
(see Figure 2). In an IPS ship, the ship’s captain has the ability to decide where to allocate his
power usage. As previously stated, the new availability of electrical power for non-propulsion
use is in line with the U.S. Navy’s vision of future electrical weapons systems, including rail
guns and high-powered microwave and laser weapons.
One of the main challenges to the IPS/all-electric ship is the introduction of significant
harmonic distortion into the main distribution bus caused by the switching of non-linear power
electronic equipment required by the propulsion drive and DC distribution system. The harmonic
distortion has the potential to negatively impact all equipment directly connected to the main bus
and may also pose Electro-Magnetic Interference (EMI) and signature concerns. As a result,
these systems must be able to accommodate the harmonics generated by the power electronic
converters. Hence, the generators and the power conversion equipment must either be robust
enough to handle the increased harmonics or the harmonics must be decreased to an acceptable
level.1

14
II. Background
A. Source of Harmonics
Harmonic currents are typically the result of non-linear loads connected to an electrical
power system. In the past, only a small sector of the electrical industry has had to deal with
harmonics because most loads in an electric power system were linear. However, the advent of
semiconductor devices, which enable power conversion and more efficient and better control of
power to loads, has resulted in non-sinusoidal load currents which then lead to non-sinusoidal
bus voltages.
Time (s)
Vo
ltag
e (
V)
Figure 5: Sinusoidal Voltage with No Harmonics
The negative effect of harmonic currents on power systems was first noted in the late
1920’s and early 1930’s. As rectifiers were added to power lines and these power systems were
installed and energized across the West, the harmonic currents in the power lines induced large
voltages in telephone communication lines, eventually creating enough noise to interrupt
telephone conversations. The problem was fixed when power companies discovered that they
were able to eliminate most of the harmonic currents by using more complex rectifier
topologies.3
15
Soon, with the introduction of lower-cost semiconductor devices, the country saw a
proliferation of power converters throughout the power system. Components such as variable-
speed motor drives and power supplies caused non-sinusoidal currents to be pulled from the
power system resulting in distortion in the bus voltage. This distorted bus voltage is then
distributed to loads that would prefer a perfect sinusoid. Therefore, research into ways to
alleviate the impact of harmonics has become particularly important in power system design.3,4
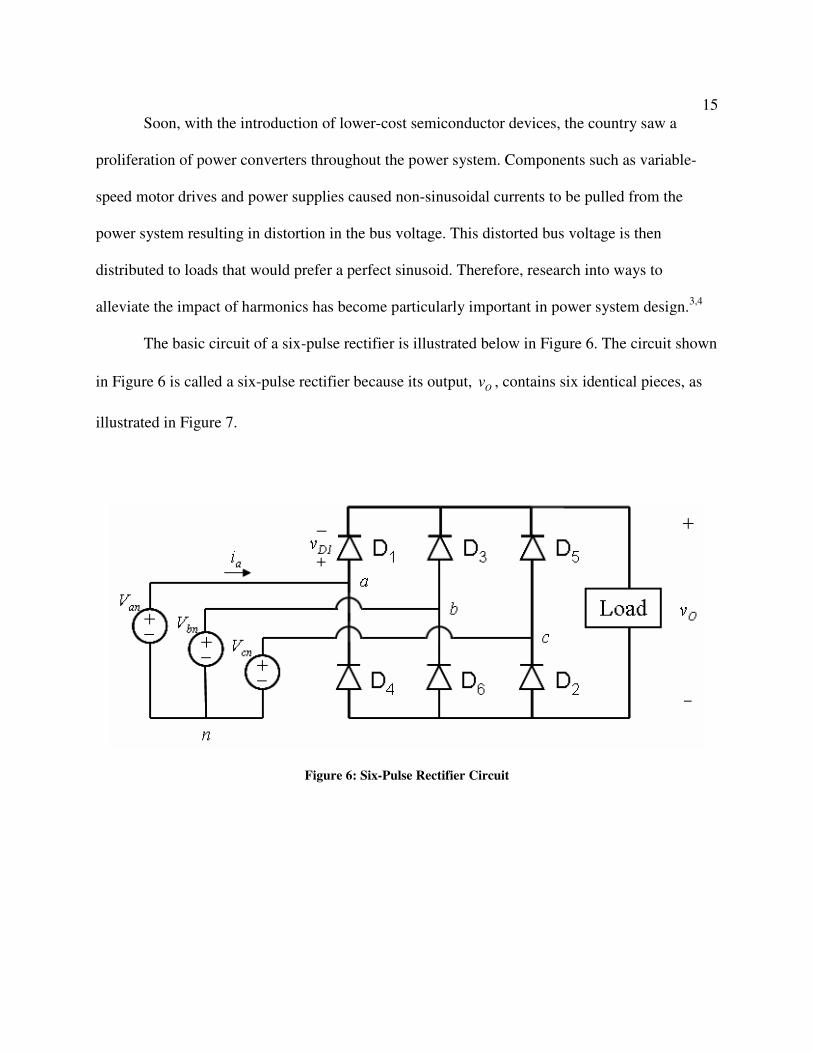
The basic circuit of a six-pulse rectifier is illustrated below in Figure 6. The circuit shown
in Figure 6 is called a six-pulse rectifier because its output, O
v , contains six identical pieces, as
illustrated in Figure 7.
Figure 6: Six-Pulse Rectifier Circuit

16
Figure 7: Output Voltage for Six-Pulse Rectifier Displaying Six Ripples for Each Cycle of Input
Voltage (the dashed straight line represents the average value)
The diodes, or electronic switches, labeled from D1 to D6, only allow for current flow (turn
ON) when there is a positive voltage across the diode. When not conducting (turn OFF), a diode
serves as an open-circuit voltage blocker. As configured, the diodes will naturally turn ON and
OFF in pairs due to the changing supply voltages (Van, Vbn, Vcn). The pairs D1 and D2 are ON
together, followed by D2 and D3, D3 and D4, and so on, until the cycle finishes with D6 and D1
conducting. For each of the six intervals, a different line voltage governs the output voltage
across the load. For instance, when diodes D1 and D2 are ON, the output voltage is equal to the
line voltage Vac. Because the diodes switch ON and OFF and only one device connected to either
the top or bottom rails is ON for ideal operation, the current drawn from the supply is no longer a
purely sinusoidal wave and instead can appear as shown in Figure 8. The harmonics contained in
this waveform are the cause of additional unwanted power losses and voltage bus distortion.
Figure 8: Representative Supply Phase Current Waveform for Six-Pulse Rectifier

17
B. Harmonic Analysis
A periodic waveform ( )f t is one that functionally satisfies
( ) ( )f t T f t+ = Equation 1
where t is time and T is the period in seconds. The fundamental frequency ω in radians/second
is then found from
2
T
πω = Equation 2
A harmonic is defined as a component frequency of a periodic signal that is an integer
multiple of the fundamental frequency. The second harmonic is a component of frequency twice
that of the fundamental frequency; the third harmonic is a component of frequency three times
the fundamental frequency, etc. Examples of harmonic frequencies for a 60 Hz source are
illustrated in Figure 9.
(a) 2nd Harmonic (120 Hz)
60 Hz
120 Hz
(b) 3rd Harmonic (180 Hz)
60 Hz
180 Hz
(c) 4th Harmonic (240 Hz)
60 Hz
240 Hz
(d) 5th Harmonic (300 Hz)
60 Hz
300 Hz
Figure 9: Fundamental Frequency of 60 Hz Sine Wave and Harmonics

18
The distortion due to harmonics can be studied using Fourier analysis.5 Any periodic
signal can be analyzed as a fundamental sinusoidal waveform and a set of harmonics. A pictorial
example of the decomposition of a distorted periodic signal into its Fourier components is shown
in Figure 10.
(a) Distorted Wave
(b) Fundamental and Harmonics of Distorted
Waveform
Fundamental
3rd Harmonic
5th Harmonic
Figure 10: Decomposition of a Distorted Wave
Using Fourier analysis, any periodic waveform can be expressed using the general
equation
0 0
1 1
1( ) ( ) cos( ) sin( )
2h h h
h h
f t F f t a a h t b h tω ω
∞ ∞
= =
= + = + +∑ ∑ Equation 3

19
where ω is the fundamental angular frequency expressed in Equation 2. The 0F term is the DC
or average value of the signal. In the summation, h=1 is the fundamental and each subsequent
term is a harmonic.
The coefficients h
a and h
b are defined as
2
0
2
0
1( )cos( ) ( )
1( )sin( ) ( )
0,...,
h
h
a f t h t d t
b f t h t d t
h
π
π
ω ωπ
ω ωπ
=
=
= ∞
∫
∫ Equation 4
The average value 0F is defined as
2
0 00 0
1 1 1( ) ( ) ( )
2 2
T
F a f t d t f t dtT
π
ωπ
= = =∫ ∫ Equation 5
The amount of distortion in a voltage or current waveform is quantified using the metric
Total Harmonic Distortion (THD). Given a periodic current of the form
1
1
( ) ( ) ( )s s sh
h
i t i t i t≠
= +∑ Equation 6
where 1( )s
i t is the fundamental, the distortion component of the current is found by subtracting
the fundamental from the periodic signal.
1
1
( ) ( ) ( ) ( )dis s s sh
h
i t i t i t i t≠
= − =∑ Equation 7
In terms of root mean square (rms) values and employing Parseval’s Theorem5,
2 2 2
1
1
dis s s sh
h
I I I I≠
= − = ∑ Equation 8
where s
I is established by
2 2 2
10
1
1( )
T
s s s sh
h
I i t dt I IT ≠
= = +∑∫ Equation 9

20
The THD can now be defined as
2 2
1 2
11 1 1
% 100 100 100 ( )s sdis sh
i
hs s s
I II ITHD
I I I≠
−= × = × = × ∑ Equation 10
The THD of a voltage waveform can be calculated in a similar manner. A small value of THD is
desirable, implying that the fundamental amplitude is large compared to the amplitudes of the
harmonics. Recommended practices and requirements for THD can be found in Reference 8. For
this project, the desirable THD is less than 10%.
C. Impact and Treatment of Harmonics
The impact of harmonics on power systems is found mainly in the additional losses due
to heating that can cause equipment to malfunction. The result is that equipment must be derated
to handle both the intended load and the additional harmonic load. If the derating is not adequate,
the long-term thermal performance of the generators and transformers connected to the bus can
also be compromised. Generator efficiency can be reduced by as much as 10% of that which
would be experienced by a purely sinusoidal load current. Additional harmonic torque can also
be developed, causing cogging (unsmooth start) or crawling (high slip) in induction motor loads.
Transformers are primarily impacted by heating losses.
In addition, harmonic currents produce voltage distortion, as shown in Figure 11. Many
devices are not capable of handling more than 5% voltage THD without experiencing
malfunctions, including the controls devices for phase-controlled rectifiers used for DC
distribution. In a U.S. Navy warship, malfunctions of key systems are clearly unacceptable.

21
Figure 11: Severe Voltage Distortion as a Result of Harmonic Currents
There are three main approaches to improving THD and mitigating the impacts of
harmonic currents. The first is the use of passive shunt filters, which are designed to absorb
harmonic current, illustrated in Figure 12. The filters are designed as a series combination of
inductors and capacitors that can be tuned to the desired harmonic frequency. The advantages of
shunt filters include affordability, reliability, and low maintenance. The drawback is that shunt
filters must be specifically designed and tuned for each application.
-15 -10 -5 0 5 10 15-10
-5
0
5
10
Time (s)
Voltage (
V)
Ideal Voltage Waveform
-15 -10 -5 0 5 10 15-10
-5
0
5
10
Time (s)
Voltage (
V)
Voltage Waveform w/Harmonics

22
Figure 12: Implementation of Passive Filtering for a-phase for Reducing the 5th, 7th, and Nth Harmonics
(same filtering would also be added for the b and c-phases)
The second approach is the use of multi-pulse rectifiers, examples being twelve-pulse,
eighteen-pulse, and twenty-four-pulse rectified systems. Rectifiers that employ more than six
pulses require specially designed transformers to achieve the necessary phase-shifted source
voltages, as well as additional semiconductor devices. If these devices are thyristors, then they
each require a snubber and gating circuit, adding circuit cost and complexity. Harmonics are
reduced by phase multiplication, where the lowest harmonic present is shifted to higher
frequencies, with the amount of shift dictated by the number of pulse rectifier sections. The
rectifier approach has been successfully implemented, but the cost and volume issues associated
with a shipboard implementation have received minimal attention in the literature.
The final method is the use of active filtering or current injection. Harmonic currents can
be reduced or cancelled by injecting equivalent currents that are 180° out of phase. However,
Gen.
Rectifier
5th 7th Nth
Harmonic Filters

23
active filtering requires additional power converters with associated controls and
coordination.1 The investigation of active filters is beyond the scope of this research effort.
The goal of this project is to compare competing strategies that seek to reduce bus
harmonics in a naval warship integrated power system. The subsidiary benefit of this task is to
improve the efficiency and minimize the derating factor for shipboard engines, generators, and
transformers. The method of reducing harmonics is a system based on rectifiers of varying
complexity and passive filtering. The candidate systems are simulated and evaluated in software,
as well as constructed and validated in the laboratory at a reduced scale. The data, coupled with
vendor information regarding size, weight, and acquisition costs, lead to a recommended solution.

24
III. Simulation
A. Six-Pulse Rectifier System
The simulation part of the project was implemented using PSCAD®
, a commercially
available software package used in the power system industry.6 A six-pulse diode rectifier
connected to an ideal three-phase power supply was initially modeled. The ideal six-pulse
rectifier model is shown in Figure 6. After verification of the accuracy of the ideal model with
theory, the complexity of the system was increased by replacing the diodes with thyristors,
adding a non-ideal three-phase power supply source behind impedance, and adding snubber
circuits to the thyristors. The new model, shown in Figure 13, was tested using specifications
derived from the U.S. Navy’s Philadelphia Land Based Engineering Site (LBES) test facility,
whose parameters are shown in Table 1.
Table 1: Parameter Values for Six-Pulse Rectifier Test System
Parameter Value
Source Frequency 60 Hz
Line to neutral Peak Voltage 3396.6 V
AC line inductance 391.7 µH
AC line resistance 1.272 mΩ
Thyristor on state voltage drop 1 V
Thyristor on state resistance 130 µΩ
Snubber capacitance 9 µF
Snubber resistance 3.33 Ω
DC link inductance 666.67 µH
DC filter capacitance 30 mF
DC link resistance 3.3 mΩ
Load resistance 4.13 Ω
Since waveform reproductions were the only available data for comparison, the accuracy
of the model was verified by comparing the waveform of the A-phase of the supply current
(Figure 14) with known results from both Reference 16 (Figure 15) and LBES simulations. The

25
LBES simulations were performed using Advanced Continuous Simulation Language (ACSL)
(Figure 16) and SABRE (Figure 17) simulation programs.
Figure 13: Six-Pulse Rectifier Test System Schematic in PSCAD
®
Figure 14: PSCAD® Simulation Waveform for Figure 15: PSCAD
® Simulation Waveform
a-phase Current from Six-Pulse Rectifier for a-phase from Reference 164
Test System
Figure 16: ACSL Simulation Waveform for a-phase Figure 17: SABRE Simulation Waveform
Current7 for a-phase Current
7

26
Based on the nearly identical waveforms, we are confident in the accuracy of the six-pulse
rectifier model. PSCAD®
post-processing capability calculates the THD of the a-phase current as
27.5%, where this high value demonstrates the need for some harmonic mitigation strategy.
B. Thyristor Firing Control
The previous waveforms were generated using a natural line-commutated six-pulse
rectifier, where the thyristors behaved as diodes. In an IPS, the propulsion motor drive rectifier
and the DC distribution rectifier can be operated with a phase delay in order to control the
respective DC-link voltage. Therefore, for this project, thyristor control was also implemented.
Thyristors behave in the same manner as diodes but allow for greater control because the angle
of turn on, or firing angle, can be set as desired. Controlling the firing angle of the thyristors for
turn on allows for the control of the DC voltage output, either increasing or decreasing the
amount of power delivered to the load. This control is particularly important when there is a need
to interrupt the flow of power due to a fault (anomaly) on either the source or load side of the
rectifier.
The thyristor controls were developed by noting that each thyristor has a unique 180°
range where it is forward biased and can be gated ON. There is one line voltage that is always
positive over the 180° turn ON range. For thyristor 1 in Figure 13, the coinciding line voltage is
Vac. To identify the “in-range” condition, a comparator was used to compare the appropriate line
voltage with ground, outputting a HIGH signal when in range and a LOW signal when out of
range.
The initial attempt at controlling the turn-on of the thyristors utilized the cosine
comparison method. For each thyristor, there is also a corresponding line-to-neutral voltage that

27
is single valued for the entire “in-range” condition. For thyristor 1, the appropriate line-to-
neutral voltage was -Vbg. By overlaying the line-to-neutral voltage with a control voltage Vcontrol,
the thyristor can be gated ON at the point of intersection between the two signals. A second
comparator was used to identify the point of intersection. The two comparator outputs were then
used as the inputs to an AND logic gate, whose output (FP1 in Figure 18) was used as the firing
control for the respective thyristor. The entire firing signal control circuit for thyristor 1 is shown
below in Figure 18, where nVbg represents -Vbg.
Figure 18: Firing Signal Control Circuit for Thyristor 1 of Figure 13
Due to bus voltage harmonics, this firing control circuit did not work reliably and seemed
to introduce additional harmonics or limit cycles into the system. As a result, a time-delay
method was developed.
The time-delay method of controlling the thyristor first identifies the “in-range” condition,
as discussed previously. The firing angle was then incorporated as a time delay signal, which
was implemented by knowing that the source frequency was 60Hz. The correct firing pulse
signal delay time was calculated by multiplying the period of the line-to-neutral voltage by the
fraction of the angle to 360° times the period of the function, as shown in Equation 11.
1*
60 360
FAFP
Hz=
° Equation 11

28
Figure 19 shows the implementation of the time-delay method for control of thyristor 1
(in Figure 13) in PSCAD®
. Control of the remaining thyristors occurred in a similar fashion, with
each thyristor’s “in-range” condition first being identified and then delaying the firing pulse
signal according to the desired firing angle.
Figure 19: Time-Delay Method of Firing Control.
C. Twelve-Pulse Rectifier System
A twelve-pulse thyristor controlled rectifier model was created. The twelve-pulse rectifier
is essentially two series-connected six-pulse rectifiers connected to the main bus through three-
phase transformers. A representative twelve-pulse rectifier is shown in Figure 20.
Figure 20: Twelve-Pulse Rectifier System

29
The addition of transformers is necessary to phase shift the source voltages so that
there are in effect six phases, where one balanced set is shifted 30° from the other by the ∆-Y
transformer. The model in Figure 20 shows Y-Y and Y-∆ transformers; however, the U.S. Navy
intends to use ∆-Y and ∆-∆ transformers, to avoid nonlinearities introduced by a Y-Y connection.
The circuit schematic of the twelve-pulse rectifier model in PSCAD®
is illustrated in Figure 21.
Figure 21: Twelve-Pulse Rectifier Test System Schematic in PSCAD®
There were several problems encountered when developing the twelve-pulse model. The
addition of the transformers caused the output voltage on the secondary side to drop to very low
levels, which was unexpected for a properly operating transformer with a 1:1 turns ratio. The
simulation was also unable to extract the line-to-neutral voltage Van1 from the secondary side of
the ∆-Y transformer. The line-to-neutral voltages are necessary to properly implement the cosine
comparison method of generating firing controls for the thyristors in the top rectifier.

30
Through discussions with PSCAD®
technical support, the transformer voltage drop
was resolved by lowering the per-unit (PU) impedance of the transformer from 0.1 to 0.001.
Previously, the large PU impedance value of the transformers was causing an excessively large
voltage drop across the transformer impedance instead of the load impedance. By modifying the
PU impedance, all line-to-neutral voltages can also now be extracted.
The additional six-pulse rectifier significantly improves the harmonic distortion in the
source current. As shown in Figure 22 , the a-phase current of the source using the twelve-pulse
rectifier contains fewer harmonics than the a-phase current from the six-pulse rectifier, shown
previously in Figure 14.
Figure 22: PSCAD® Simulation Waveform for a-phase Current from
Twelve-Pulse Rectifier Test System
The results confirm what is expected from theory. The a-phase current THD is 8.92%, which is a
significant improvement over the current THD of the six-pulse rectifier, which was 27.5%.
However, the THD can be reduced further by the application of filtering.

31
D. Filtering
Passive filtering can be implemented through harmonic trap filters, containing banks of
capacitors and inductors tuned to absorb the unwanted harmonics. Figure 23 demonstrates the
six-pulse test system with filtering tuned to the 5th
harmonic, with capacitance and inductance
values derived from LBES data.
Figure 23: Shunt Filtering for Reducing the 5
th Harmonic
Tuning the banks to a specific frequency can be achieved by setting the resonant
frequency of the LC filter equal to the harmonic, giving the harmonic current a lower impedance
path in which to travel through. In Equation 12, ω , the frequency in rad/s, is related to f , the
frequency in hertz in the following manner.
2 fω π= Equation 12
A filter can be tuned to any harmonic o
nω , where o
ω is the fundamental frequency and n is the
harmonic number through the equation
1
o
n n
nL C
ω = Equation 13

32
where n
C is the capacitance and n
L is the inductance.
Traditional methods of designing filtering are based on power factor correction.8 On a
terrestrial power system, the load can be assumed to be relatively constant and the filter can be
designed with a capacitance that will change the power factor from lagging to near unity. For an
IPS system with DC distribution, each load will have a rectifier between it and the main
generation bus. The controlled rectifier load means that the displacement power factor will vary
with firing angle. As a consequence, variable power factor correction is required. Therefore, a
new paradigm for filter synthesis is required for shipboard systems.
While the power factor correction method is a good starting point, there remain issues
with choosing the value of the capacitance. Too large of a capacitance will cause the power
factor to change to leading and negate the benefits of harmonic filtering because of the additional
reactive power requirement. The capacitance value must also be selected so that it does not
resonate with the inductance of the generator, causing large overvoltages.
The filtering for this project was designed through simulation. Focusing on the 5th
harmonic filter, the simulations of the filter started with the LBES value for inductance (1.19mH,
rounded to 1.2mH). The filter inductance was then varied by a factor of ten up and down from
the LBES value. The corresponding matching capacitance for every value of inductance was
calculated, as shown in Equation 13, to tune the filter to the 5th
harmonic. For each simulation
run, the generator current THD as well as the actual generator current were monitored as metrics
for determining the optimal value of inductance and capacitance. While an increase of several
magnitudes in the generator current is expected due to the reactive power demanded by the
capacitor, a smaller current is more desirable because it signifies less total power output from the
generator.

33
The simulation runs utilized the six-pulse rectifier test system with LBES parameters, a
firing angle of 0°, and using an input voltage of 100V for convenience. The data in Table 2
shows the various values of inductance that were simulated, as well as their corresponding
capacitance for a tuned 5th
harmonic filter. The data shows a significant increase in generator
current for filters with inductance values less than 1mH when compared to the generator current
without filtering. Filters with inductance values greater than 1.2mH were less effective at
reducing current harmonics, as demonstrated by the corresponding larger THD values. As a
result, the inductance value of 1mH was selected for use in the LC filters. The value of 1mH was
used for LC filters was used for the design of all harmonic filters used in this project (5th
, 7th
, 11th
)
for cost-control and simplicity.
Table 2: LC Design
Inductance (H)
Capacitance (F)
Input Voltage (V)
Generator Current (A)
THD of Gen. Current (%)
0 0 100 2.37 29.35
0.0005 0.000562 100 18.1 4.1
0.0009 0.000312 100 10.6 7.2
0.001 0.000281 100 8.6 8.7
0.0012 0.000234 100 8.5 9.65
0.0015 0.000187 100 7.2 11.64
0.002 0.000140 100 6.8 14.6
This analysis assumes that the original rectifier system operates at near unity power
factor and thus seeks a compromise between THD and operation at a leading power factor. If the
rectifier is operated with phase delay, then the designer has another degree of freedom. In
addition, if the filter can be built with step increments of capacitance, then that would further
enable “tuning” of the system.
Table 3 shows the results of applying filtering to the twelve-pulse test system using
LBES parameters. The input voltage was set at the U.S. Navy’s design of 4160V and the DC

34
resistive load was set to give an output voltage of approximately 1000V, which is the desired
output voltage for ship-service distribution. The U.S. Navy will also operate the converters on
the IPS at an as of yet undetermined firing angle. Because of this, the affect of varying the firing
angle is also shown. For instance, towards the end of this project, it was learned that the DDG-
1000 propulsion device utilize firing angles ranging from 0° (full power) to 45° (low speed).
Table 3: Twelve-Pulse Test System: Output Voltage, Generator RMS Current, and
Generator Current THD for Various Filtering and Firing Angles
Firing Angle (°) Filtering Vout (V) Ia RMS (A) THD (%)
0 None 1113 42.105 14.37
0 5th 1112 261.8 2.26
0 5th+7th 1113 394.8 1.51
0 5+7th+11th 1114 446.6 1.3
0 5th+11th 1112 321.3 1.84
21.6 None 1034 40.6 15.9
21.6 5th 1034 252 2.43
21.6 5th+7th 1033 378 1.61
21.6 5+7th+11th 1035 435.4 1.34
21.6 5th+11th 1034 304.5 1.93
45 None 808 34.72 21.5
45 5th 808 238 2.6
45 5th+7th 809 369.6 1.7
45 5+7th+11th 808 422.8 1.42
45 5th+11th 808 289.8 2.06
The data demonstrates the reduction of harmonics in the generator current through the
addition of filtering. The increase of the generator current due to filtering can also clearly be seen.
Although the harmonic trap filter tuned to the 5th
, 7th
, and 11th
harmonics resulted in the lowest
THD values, it also created a ten-fold increase in generator current. The system of harmonic
filters tuned to the 5th
and 11th
may be the best balance of reducing THD while limiting the
increase in generator current. This could be due to the fact that the 5th
harmonic filter may be

35
able to eliminate some of the 7th
harmonic, while the 11th
harmonic filter can eliminate some
of the 13th
harmonic.
From the data, an increase in the firing angle of the thyristor also causes an increase in
the THD. This is due to the introduction of more harmonics as a result of delaying the turn-on of
the thyristors. However, despite the increase in harmonics, the harmonic filters are still able to
effectively reduce the THD value. Future research could revisit the idea of selecting the filter
capacitance to achieve a certain power factor value. The required inductance is then found from
Equation 13. To account for changes in operating conditions, the amount of power factor
correction could be made incremental.

36
E. Full Integrated Power System
The goal of the project was to assess the rectifier choice and filter design for a shipboard
IPS. With that in mind, a representative integrated system was selected, guided by vendor-
supplied data. The system consists of a twelve-pulse thyristor rectifier for ship service DC
distribution, a twelve-pulse diode rectifier for pulsed power and radar loads, and a six-pulse
thyristor rectifier for ship propulsion. The system is shown in Figure 24.
Y∆ −
∆ − ∆
∆ − ∆
Y∆ −
Figure 24: Full-Integrated Power System Model
For the DDG-1000, the U.S. Navy is using a 4160V input voltage to the rectifier systems.
The DC voltage output of the Ship Service load will be 1000V with a full-power output of
approximately 3MW. The propulsion load will utilize a full-power 5600V DC voltage and the
power will range from 0 to 34MW of power per propeller. The pulsed-power and radar loads will

37
receive an assumed 5600V DC output voltage with a peak power of 5.8MW of power. This
arrangement assumes two such systems to account for two propeller shafts and redundant loads.
The MTG stands for main turbine generator, while ATG stands for auxiliary turbine generator.
Figure 25 shows the full integrated power system schematic as modeled in PSCAD®
. An
aggregate machine model was used to represent both the MTG and ATG. The aggregate model
consisted of a voltage source behind a sub-transient reactance as was used in prior efforts [16]. In
future research, the impact of separate sources can be addressed. This would enable the
investigation of the influence of the individual sub-transient reactance values.
Figure 25: Full Integrated Power System Schematic in PSCAD
®

38
Table 4 shows the results of the PSCAD® simulation of the full integrated power
system with various harmonic filters and various propulsion loads. For these simulations, all
converter systems were operated with a 0° firing angle. In the table, the subscript a represents the
pulsed power and radar load, the subscript b represents the propulsion load, and the subscript c
represents the ship service distribution load, where Ea is the DC output voltage for the a load and
Ra is the resistive load for a.
Table 4: Full Integrated Power System: Supply Current THD, Output Voltage, and Power for Various
Filtering and Propulsion Loads
Filtering THD Ea (V) Ra (Ω) Pouta (W) Eb (V) Rb (Ω) Poutb (W) Ec (V) Rc (Ω) Poutc (W)
none 16.95 5600 22 1425455 5640 4.13 7702082 1030 0.32 3315313
5 8.096 5360 22 1305891 5400 4.13 7060533 971.5 0.32 2949413
5+7 3.16 5473 22 1361533 5515 4.13 7364461 982 0.32 3013513
5+7+11 1.48 5524 22 1387026 5563 4.13 7493213 990 0.32 3062813
5+7+11+13 1.23 5546 22 1398096 5591 4.13 7568833 994 0.32 3087613
none 20.4 5590 22 1420368 5600 2.13 14723005 1000 0.32 3125000
5 3.95 5314 22 1283573 5324 2.13 13307500 956 0.32 2856050
5+7 2.95 5377 22 1314188 5384 2.13 13609134 965 0.32 2910078
5+7+11 1.45 5432 22 1341210 5447 2.13 13929488 976 0.32 2976800
5+7+11+13 1.25 5454 22 1352096 5470 2.13 14047371 979 0.32 2995128
none 23.7 5590 22 1420368 5550 1.13 27258850 1000 0.32 3125000
5 3.66 5114 22 1188773 5074 1.13 22783607 922 0.32 2656513
5+7 2.51 5179 22 1219184 5138 1.13 23361986 932 0.32 2714450
5+7+11 1.38 5244 22 1249979 5216 1.13 24076687 943 0.32 2778903
5+7+11+13 1.23 5267 22 1260968 5230 1.13 24206106 947 0.32 2802528
none 25.1 5590 22 1420368 5520 0.8 38088000 1030 0.32 3315313
5 3.46 4904 22 1093146 4824 0.8 29088720 888 0.32 2464200
5+7 2.74 5000 22 1136364 4920 0.8 30258000 901 0.32 2536878
5+7+11 1.31 5058 22 1162880 4986 0.8 31075245 912 0.32 2599200
5+7+11+13 1.15 5081 22 1173480 5018 0.8 31475405 915 0.32 2616328

39
The decrease in the DC output voltage is a result of holding the voltage in the voltage-
behind-reactance source fixed at 4160V. Ideally, a feedback control system would control the
input voltage to keep the output voltages at the desired levels.
The data again demonstrates that the addition of filtering has a significant impact of
reducing generator current THD. Adding more filters tuned to the appropriate frequencies
increases the capability of the filtering to reduce THD. However, the reduction in THD still
causes an increase in the reactive power supplied by the generator due to the choice of capacitor
value, forcing the generator to supply a larger total power.

40
IV. Hardware
The goals of the hardware investigations are to further validate simulation results,
demonstrate the efficacy of filtering, and to explore real-world component effects.
A. Six-Pulse Rectifier System
Laboratory hardware testing involved three parts: design and building of the rectifier
system, collecting and importing data into MATLAB®
, and using MATLAB®
to calculate THD.
A six-pulse thyristor rectifier system was constructed using Lab-Volt®
modules. For initial tests,
the system contains a three-phase variable (0-120 Vrms line-to-neutral, 5 A) power supply
(module #8821-20) connected to a six-pulse thyristor rectifier (module #8841-20), shown in
Figure 26. Firing control was directly implemented through a Lab-Volt®
firing control module
(module #9030-30) that was synchronized to the supply voltages. The load consisted of a large
DC link inductance of 0.8H (module #8325-10), a large DC link capacitance of 2500µF (module
#8837-00), and a variable resistance resistive load (module #8311-00) set to 57.15Ω.
Figure 26: Six-Pulse Thyristor Rectifier Circuit Implemented using Lab-Volt
® modules

41
Using a Tektronix A622 current probe, one of the supply phase currents was displayed
on a Tektronix TDS2024 oscilloscope. Through a GPIB board, the waveform appearing on the
oscilloscope was then imported into MATLAB®
. The GPIB interface was capable of exporting a
maximum of 2500 data points from the waveform into MATLAB®
.
In MATLAB®
, the Fast Fourier Transform (FFT) was performed on the data to extract
frequency data. The THD is then calculated. A MATLAB®
script, documented in Appendix A,
was written to automatically extract the waveform, perform the FFT, and calculate the THD. The
script was validated through testing of waveforms in which the THD can be easily calculated,
such as 0 0 05cos( * ) 2cos(5 * ) cos(7 * ) ...w t w t w t+ + + + .
B. Windowing
Because the FFT performs a Fourier Transform at discrete times over a finite interval of
time, the phenomenon known as leakage is introduced. Leakage results in a distortion of the
frequency data, introducing large side lobes and returning values for harmonics that are not
present in the waveform, as shown below in Figure 27.
Figure 27: Expected FFT versus Leakage Effects9
(a) FFT of a Perfectly Periodic Waveform
(b) FFT of a Waveform Displaying Leakage

42
Applying a window forces the beginning and end of a waveform to zero, resulting in a
perfectly periodic function with no abrupt transitions. The result is greatly reduced side lobes and
better frequency resolution, as shown in Figure 28.
Figure 28: Leakage Effects versus Windowing9
(a) FFT of a Waveform Displaying leakage, No Window Applied
(b) FFT of a Waveform with Hanning Window Applied
The MATLAB®
script contains a number of different windows, including Flat-top,
Hanning, Hamming, or Blackman, that could be applied to the data for better frequency
resolution. The Hanning and Hamming windows give the best frequency resolution, while the
Blackman window has excellent amplitude accuracy.
THD data for one phase of the supply current for each of the windows is shown in Table
5. The data includes THD values at firing angles of 0° and 20.4°.
Table 5: THD Data for Various Windows and Firing Angles
THD Value (%) Window
Type 0° Firing Angle 20.4° Firing Angle
Rectangular (No window) 28.51 30.76
Hanning 28.46 30.82
Hamming 28.64 30.81
Blackman 28.45 30.86

43
The figures below are sample waveforms generated by the MATLAB®
script demonstrating
the use of windowing. In Figure 29, the waveform for one phase of the supply current for a
thyristor firing angle of 20.4° is shown in the top half of the figure. The effect of applying a
Hanning window is shown in the bottom half of the figure.
-0.05 -0.04 -0.03 -0.02 -0.01 0 0.01 0.02 0.03 0.04 0.05-0.1
-0.05
0
0.05
0.1
Time(sec)
Volts
Channel 1: Rectangular Window
-0.05 -0.04 -0.03 -0.02 -0.01 0 0.01 0.02 0.03 0.04 0.05-0.1
-0.05
0
0.05
0.1
Time(sec)
Volts
Channel 1: Hanning Window
Figure 29: Supply Phase Current and Effect of Hanning Window
Figure 30 shows the FFT of the waveforms above. The FFT of the waveform with the
Hanning window has considerably better frequency resolution than the FFT of the rectangular
window.

44
-1000 -800 -600 -400 -200 0 200 400 600 800 10000
0.05
0.1
Frequency(Hz)
Am
pl.
FFT: Rectangular Window
-1000 -800 -600 -400 -200 0 200 400 600 800 10000
0.02
0.04
0.06
Frequency(Hz)
Am
pl.
FFT: Hanning Window
Figure 30: FFT of Supply Phase Current and Effect of Hanning Window
C. Twelve-Pulse Rectifier System
With the ability to extract waveforms from the six-pulse hardware model with thyristor
control, the twelve-pulse diode rectifier was constructed using two six-pulse systems, a set of
transformers (module #8341-00), and diodes (module #8842-10) instead of thyristors. The load
again consisted of a large DC link inductance of 0.8H and a large DC link capacitance of 2500µF.
The resistive load was increased to 300Ω to decrease the required current and increase the
measurable output voltage.
For input power, a synchronous motor (module #8241-00) was used to drive a
synchronous generator (module #8241-00), which created the three-phase output voltages. The

45
field winding of the generator was supplied from a variable DC voltage source to enable some
adjustment of the output voltage. The transformers were characterized using standard tests,
including a DC test, short-circuit test, and open-circuit test. The twelve-pulse test system is
represented by the model shown in Figure 31.
Figure 31: Twelve-Pulse Diode Rectifier Model Implemented Using Lab-Volt
®
The actual hardware setup of the twelve-pulse system is shown in Figure 32. By slightly
modifying the wiring connections, the twelve-pulse rectifier system can be operated as a six-
pulse system. In Figure 32, the modules on the bench on the left are the transformers and power
diodes. The top section of the cart contains the modules for the DC load, as well as the power
thyristors and thyristor control module. The bottom section of the cart contains the power supply,
motor, and generator.

46
Figure 32: Hardware Setup of Multi-Pulse Converters
Despite decreasing the attached load, there was still a large voltage drop when comparing
the measured output voltage to the input voltage. Ideally, a twelve-pulse converter should double
the output voltage when compared to six-pulse converter; however, our system had a maximum
output voltage of around 13V with an input of 50V, when the system reached a maximum load
current.
The system was still able to extract the generator current data to calculate THD. Figure
33 shows one phase of the supply current, with a calculated THD of 9.25%. The THD result is
similar to the results obtained from simulation (THD of 8.97%, as discussed previously).

47
-0.05 -0.04 -0.03 -0.02 -0.01 0 0.01 0.02 0.03 0.04 0.05-5
-4
-3
-2
-1x 10
-3
Time(sec)
Volts
12-Pulse, Generator Current, No filtering
-0.05 -0.04 -0.03 -0.02 -0.01 0 0.01 0.02 0.03 0.04 0.05-4
-3
-2
-1
0x 10
-3
Time(sec)
Volts
Channel 1: Hanning Window
Figure 33: Generator Phase Current and Hanning Window
Although the THD could be extracted from the generator current, the large voltage drop
prevented useful data from being collected. Through various troubleshooting techniques, the
voltage drop was found to be due to larger internal resistances in the generator and transformer
than initially anticipated. As a result, the hardware model of the twelve-pulse converter was
abandoned and six-pulse converter data was taken using the variable power supply as an input
voltage. The use of the variable power supply as the input voltage eliminated extraneous voltage
drops cause by unexpected resistances. Future research might include finding a more
appropriately sized generator for the twelve-pulse system.

48
D. Hardware Filtering
Hardware filtering was implemented through a system of AC motor-start capacitors and
toroid-wound inductors. The inductors selected for the harmonic filters had a rated inductance
value of 1.1mH. Capacitors were sized to tune the harmonic filters to the 5th
, 7th
, 11th
, and 13th
harmonic. The capacitors were also sized so to be placed in a delta configuration, since a delta
configuration requires only a third of the capacitance of a Y configuration. In practice, at
medium voltages (> 2.4 kV), the bank would be connected in Y to avoid line-to-line faults when
a capacitor suffers dielectric failure.
Capacitors were then paired to the inductors in order to create a harmonic filter for the
reduction of the desired harmonic. The inductors were measured and those selected for the actual
harmonic filters had a value of 1.14mH. In the same manner, the capacitance of each capacitor
was measured and only those with the closest value to the calculated capacitance were utilized.
The following combinations of filtering were tested: no filtering, filters tuned to 5th
harmonic,
filters tuned to 5th
and 7th
harmonics, and filters tuned to 5th
and 11th
harmonics. Table 6 lists the
actual inductance and capacitance values used in the various hardware harmonic filters compared
to the inductance and capacitance values of the filters designed in simulation. The filters
modeled in simulation each contained an inductance of 1mH and a corresponding theoretical
capacitance depending on harmonic number. Since capacitors from vendors are sized in ranges,
the capacitors chosen for hardware had the closest capacitance value to the theoretical value.
Table 6: LC Values for Filtering
Inductance (H) Capacitance (F)
Harmonic Desired Actual Theoretical Actual
5th 0.001 0.0014 9.3816E-05 9.20E-05
7th 0.001 0.0014 4.7865E-05 5.18E-05
11th 0.001 0.0014 1.9383E-05 2.20E-04

49
The filtering was built on a connector board, with the inductors and capacitors
mounted on plastic housing that plugged directly into the board, as shown in Figure 34. The
filtering tests were performed on the six-pulse thyristor system at the firing angles of 0°, 20.4°
and 45°. A complete filtering solution with tuned filters to the 5th
, 7th
, 11th
, and 13th
harmonics
was not possible due to Lab-Volt®
limitations. With the filtering tuned to both the 5th
and 7th
harmonic, the power supply was already beginning to approach its rated value of current,
restricting the ability to add more filtering.
Figure 34: Implementation of Harmonic Filters on Connector Board
50
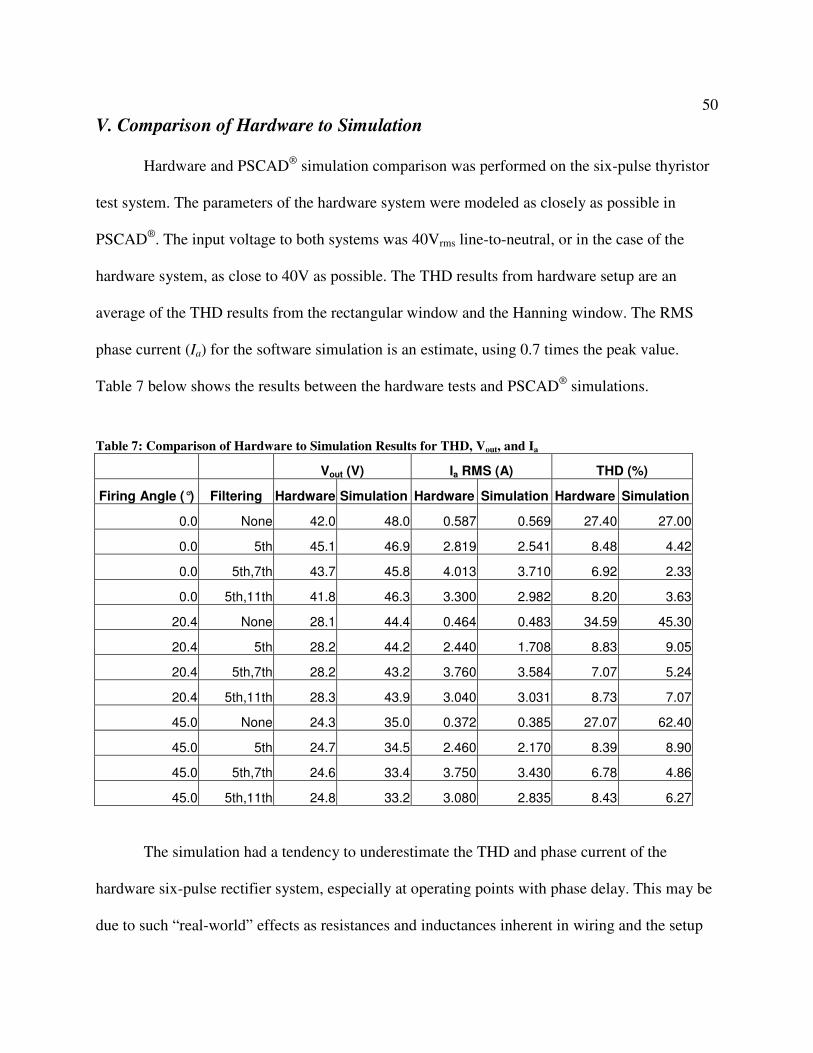
V. Comparison of Hardware to Simulation
Hardware and PSCAD®
simulation comparison was performed on the six-pulse thyristor
test system. The parameters of the hardware system were modeled as closely as possible in
PSCAD®
. The input voltage to both systems was 40Vrms line-to-neutral, or in the case of the
hardware system, as close to 40V as possible. The THD results from hardware setup are an
average of the THD results from the rectangular window and the Hanning window. The RMS
phase current (Ia) for the software simulation is an estimate, using 0.7 times the peak value.
Table 7 below shows the results between the hardware tests and PSCAD®
simulations.
Table 7: Comparison of Hardware to Simulation Results for THD, Vout, and Ia
Vout (V) Ia RMS (A) THD (%)
Firing Angle (°) Filtering Hardware Simulation Hardware Simulation Hardware Simulation
0.0 None 42.0 48.0 0.587 0.569 27.40 27.00
0.0 5th 45.1 46.9 2.819 2.541 8.48 4.42
0.0 5th,7th 43.7 45.8 4.013 3.710 6.92 2.33
0.0 5th,11th 41.8 46.3 3.300 2.982 8.20 3.63
20.4 None 28.1 44.4 0.464 0.483 34.59 45.30
20.4 5th 28.2 44.2 2.440 1.708 8.83 9.05
20.4 5th,7th 28.2 43.2 3.760 3.584 7.07 5.24
20.4 5th,11th 28.3 43.9 3.040 3.031 8.73 7.07
45.0 None 24.3 35.0 0.372 0.385 27.07 62.40
45.0 5th 24.7 34.5 2.460 2.170 8.39 8.90
45.0 5th,7th 24.6 33.4 3.750 3.430 6.78 4.86
45.0 5th,11th 24.8 33.2 3.080 2.835 8.43 6.27
The simulation had a tendency to underestimate the THD and phase current of the
hardware six-pulse rectifier system, especially at operating points with phase delay. This may be
due to such “real-world” effects as resistances and inductances inherent in wiring and the setup

51
of the hardware. Overall, the hardware data and simulation data were very similar,
demonstrating that the simulation model can be validated by hardware results. Differences in
output voltage can be attributed to voltage drops in the transformer, rectifier, and DC link
inductors that become more prominent at low voltage.
Appendix B contains the waveforms collected from the hardware tests, as well as the full
table of the THD values calculated by the rectangular and Hanning windows. The peak supply
current values from the simulations are also shown in Appendix B.

52
VI. Tradeoff Analysis
Tradeoff analysis was assessed based on weight and harmonic performance of various
rectifier system implementations. Within the scope of this project, tradeoff analysis considered
the following propulsion drive options: Option A uses a six-pulse rectifier front end versus
Option B, which uses a twelve-pulse rectifier front end. Both options include various
combinations of harmonic filtering. The structure of the DC ship service distribution converter
and the high-power radar converter are assumed to be at least 12-pulse rectifiers, due to the U.S.
Navy’s power quality requirements on the DC side of those loads.
Current surface combatant research assumes a propulsion drive rated on the order of
40MVA. As a consequence, the two options include the following components (per drive):
Option A: one 40MVA phase-controlled rectifier; no transformer; filtering units
Option B: two series-connected 20MVA phase-controlled rectifiers; two 20MVA
three-phase transformers; filtering units
Smaller power electronic devices can be used in the 20MVA rectifier units; however,
approximately twice as many devices are required (the need for redundancy and the lower
voltage required for the twelve-pulse system makes this approximate), which doubles the number
of snubber circuits, gate drives, and protection devices necessary. Thus on average, the aggregate
of the two 20MVA rectifiers will be larger than the single 40MVA unit (precise vendor data is
pending). In terms of weight, the most significant difference between the two options is the
transformer. Option B requires two 20MVA transformers per propulsion drive with a net weight
on the order of 100 tons (precise vendor data is pending). This large weight difference dwarfs the
difference in the size of the rectifier units.

53
In sizing the generators and filter banks, it was assumed that sufficient filtering would
be added to each respective system so that the phase-current THD of the generator would be
identical each of the cases. If the generator experiences the same THD stress in both cases, then
the same generator is admissible for operation. This is a pragmatic assumption, since the number
of military-qualified generators is limited. Therefore, qualitatively, the six-pulse rectifier system
will require substantially more passive filtering to achieve the same level of current THD as the
twelve-pulse system.
To quantify the “cost” of filtering, harmonic filter data was assessed using data from the
Northeast Power Systems, Inc. (www.nepsi.com) website. Data was available based on aggregate
power factor correction kVAR (reactive power), the rated current of the filter, and the rated
voltage. For a 4160V system and cancellation of only the 5th
harmonic, the data shown in Table 8
is relevant for harmonic filters with three steps in reactive power. The weight does not change
appreciably for a variation in the total reactive power. In general, units with fewer steps (fewer
LC combinations) weigh less while units with more steps weigh more.
The data for three steps is viewed as representative. To account for higher harmonics, the
units would in general require less kVAR and smaller inductances. Thus, a 7th
harmonic filter or
an 11th
harmonic filter should be smaller than the 5th
harmonic filter.
Table 8:Parameters for 3 Step, 5th
Harmonic Filter
Reactive Power (kVAR) Weight (lbs)
710 14178
1421 14355
2131 14533
2841 14710
3551 14888
4262 15066
5683 15421

54
As the data indicates, if each filter required approximately six tons, then it would take
the weight of over sixteen separate filters to be equivalent to the weight addition of the
transformers in the twelve-pulse system, which still requires its own filtering.
As a result, based on weight, Option A with additional filtering will be more effective. In
terms of THD performance, additional filtering of additional harmonics can make the six-pulse
system equivalent to the twelve-pulse system. Thus the overriding determinant in the tradeoff
analysis is the weight of the transformer. The conclusion must be that Option A should be used
for shipboard propulsion as far as the problem is currently cast.
Option B can be made more attractive by shrinking the size of the transformer. This can
be achieved through a higher frequency main AC bus (240Hz). While a higher frequency main
AC bus will significantly bring down the weight of the transformer, it also introduces other
technical issues. First, the issue of the availability of components at the frequency or the derating
of 60Hz equipment to operate in a 240Hz environment (specifically switchgear) must be
addressed. Second, U.S. manufacturers must be willing to build a small quantity of the
specialized equipment with little other commercial market possibilities. Finally, large power
high-frequency generators would need to be developed by the U.S. Navy and qualified for the
marine environment. The assessment of a high-frequency alternative system could be an area of
future research.
A final alternative to using the large 60Hz transformer would be to use high-voltage DC
distribution from the main generators. This solution suffers from similar problems as the high
frequency main AC bus system solution, specifically the need for specialized equipment and no
real opportunities to leverage the commercial marketplace. However, this too can be an area of
future research project.

55
VII. Conclusion
This project successfully demonstrated that the addition of filtering, along with multi-
pulse converters can greatly reduce generator bus harmonics as measured by THD. A method of
designing harmonic filters was introduced, demonstrating differences in the ability to reduce
harmonics based on different choices for the values of inductance and capacitance. The process
of optimizing the choice of inductance and capacitance was derived for a case when all rectifiers
were operated at zero phase delay. The affect of varying the firing angle on thyristor rectifier
systems with filtering was also explored, though source currents can become excessive if the
zero delay angle values of inductance and capacitance are used. It was determined that if
considerable phase delay is used, then the capacitors must be resized according to power factor
correction or the capacitance values made adjustable. The ability of the designed harmonic filters
to handle the greater harmonics associated with operating a thyristor system was also shown. The
six-pulse simulation model in PSCAD®
was verified by hardware results. A PSCAD®
simulation
of the full integrated power system was modeled, with the capability of simulating thyristor
rectifier systems with various firing angles and various DC loads.
While the civilian ship industry has successfully realized Integrated Power System (IPS)
architectures for ships, power density and acoustic requirements of the U.S. Navy are much more
stringent. A successful, cost-effective implementation of multi-pulse rectifiers in combination
with filtering to reduce power harmonics in an IPS would be extremely beneficial to the U.S.
Navy in achieving its goal of an all-electric ship. The different implementations tested in this
project will also allow the U.S. Navy to choose the best system based on the metrics considered.
Even if the U.S. Navy decides to choose a different method of reducing harmonics, this project

56
still demonstrates the feasibility of improving power harmonics using multi-pulse converters
and filtering and provides a methodology for evaluating future candidate architectures.

57
VII. Areas of Future Research
Y∆ −
∆ − ∆
∆ − ∆
Y∆ −
1,A ssI∆ ,a ss
I∆
,dc ssI
1,A radI
∆ ,a radI∆ ,dc rad
I
,A spI ,dc sp
I
,aY ssI2,A ss
I∆
,aY radI2,A radI
∆
,A MTGI
,A ATGI
,A FMI
,A FAI
,dc ssV
,dc radV
,dc spV
Figure 35: Integrated Power System Without DC Load
There are many aspects of harmonic filtering that have yet to be addressed. Future
research could focus on the generator parameter known as sub-transient reactance. The machine
sub-transient reactance impacts both potential fault current and voltage distortion. A minimum
values is set by fault calculations; the maximum value is set by voltage THD requirements.
Further research can explore the optimization of this value for an isolated generator or multiple
units in parallel. Future studies could also focus on the DC side of the converter solution.
Simulations run while varying of the DC side inductance demonstrated a change in the THD of
the supply current; however, there did not seem to be a direct relationship between the DC
inductance and THD. Follow-on work can explore the relationship between power quality on the
DC load side versus THD on the AC side. This study focused solely on the LBES values for the

58
DC load of a warship. Varying other parameters may also lead to better system topologies for
reducing THD. Acquiring and integrating a higher capacity generator into the hardware setup
would facilitate improved data collection. The commercial industry also employs a step
increment to filtering to gradually bring in reactive power in steps. The introduction of a stepped
unit for filtering could change the method of designing filter values, as there are fewer concerns
over the reactive power introduced by large capacitance values. Finally, future research efforts
can expand the full-scale IPS model to represent the DC loads in more detail and consider
multiple generators connected to a given bus.
1 T. McCoy, “Trends in Ship Electric Propulsion”. Power Engineering Summer Meeting, Vol.1, pp. 343-346, 2002.
2 N. Doerry, J. Davis, “Integrated Power System for Marine Applications”, Naval Engineers Journal, May 1994.
3 “IEEE Harmonics in Power Systems”, IEEE Std 141-1993, IEEE, New York, 1993.
4 E. West, “Analysis of Harmonic Distortion in an Integrated Power System for Naval Applications”, MIT, MSEE
Thesis, 2005. 5 N. Mohan, T.M. Undeland, W.P. Robbins, Power Electronics: Converters, Applications, and Design, John Wiley
and Songs, pg. 39-42, 1989. 6 Manitoba HVDC Research Centre, “Professional Power System Design and Simulation”. Retrieved March, 2007.
<http://www.pscad.com>. 7 S.D. Sudhoff, S.F. Glover, B.T. Kuhn, “IPS FSAD Model Verification, Final Technical Progress Report”. Energy
Systems Analysis Consortium, 1999. 8 “IEEE Recommended Practices and Requirements for Harmonic Control in Electrical Power Systems”, IEEE Std
519-1992, IEEE, New York, 1993. 9 LDS Group. “Understanding FFT Windows”, 2003, Retrieved Nov, 2006. <http://www.lds-
group.com/docs/site_documents/AN014%20Understanding%20FFT%20Windows.pdf>

59
VIII. Bibliography
1. Barton, T., Rectifiers, Cycloconverters, and AC Controllers, Clarendon Press:
Oxford, 1994.
2. Bourguet, S., Guerin, P. & Le Doeuff, R., “Analysis of the Interharmonics
Generated by a Ship Propulsion System”, Presented at 11th
International
Conference on Harmonics and Quality of Power, 2004.
3. Cassimere, B., Rodriquez Valdez, C., Sudhoff, S., et al, “System Impact of Pulsed
Power Loads on a Laboratory Scale Integrated Fight Through Power (IFTP)
System”, Presented at IEEE Electric Ship Technologies Symposium, 2005.
4. Ciezki, J. & Ashton, R., “Selection and Stability Issues Associated with a Navy
Shipboard DC Zonal Electric Distribution System”, IEEE Transactions on
Power Delivery, Vol. 15, No. 2, April 2000.
5. Doerry, N., & Davis, J., “Integrated Power System for Marine Applications”, Naval
Engineers Journal, May 1994.
6. Electrotek Concepts., “Harmonic Studies”, Retrieved Dec, 2006.
<http://www.electrotek.com/harmonic.htm>
7. “IEEE Harmonics in Power Systems”, IEEE Std. 141-1993, IEEE: New York, 1993.
8. “IEEE Recommended Practices and Requirements for Harmonic Control in Electric
Power Systems”, IEEE Std. 519-1993, IEEE: New York, 1993.
9. LDS Group. “Understanding FFT Windows”, 2003, Retrieved Nov, 2006.
<http://www.lds-group.com/docs/site_documents/
AN014%20Understanding%20FFT%20Windows.pdf>

60
10. McCoy, T. & Dalton, T., “Design Implications of PWM Propulsion Motor Drives
on Shipboard Power Systems”. All-Electric Ship Conference, 1998.
11. McCoy, T., “Trends in Ship Electric Propulsion”. Power Engineering Summer
Meeting, Vol.1, pp. 343-346, 2002.
12. Mohan, N., Undeland, T.M. & Robbins, W.P., Power Electronics: Converters,
Applications, and Design, John Wiley and Songs: New York, 1989.
13. Paice, D., Power Electronic Converter Harmonics, IEEE Press: New York, 1996.
14. Sudhoff, S.D., Glover, S.F., Kuhn, B.T., IPS FSAD Model Verification, Final
Technical Progress Report. Energy Systems Analysis Consortium, October
1999.
15. Truong, L. & Birchenough, A., “Simulation and Analysis of Three-Phase Rectifiers
for Aerospace Power Applications”, Presented at Second International Energy
Conversion Engineering Conference, Rhode Island, 2004.
16. West, E., “Analysis of Harmonic Distortion in an Integrated Power System for
Naval Applications”, MIT, MSEE Thesis, 2005.

61
IX. Appendices
A. Appendix A- MATLAB®
Code
%This program extracts a waveform from an Tektronix TDS2024
%Oscilloscope and plots the waveform in MATLAB. It then calculates the
%FFT, which is plotted and calculates the THD.
%October 2006 % % This is the representation of an instrument control % session using a device object. The instrument control session
% comprises all the steps to take when communicating with your % instrument. These steps are: % 1. Create a device object % 2. Connect to the instrument % 3. Configure properties % 4. Invoke functions % 5. Disconnect from the instrument
% Create a GPIB object. interfaceObj = instrfind('Type', 'gpib', 'BoardIndex', 0,
'PrimaryAddress', 4, 'Tag', '');
% Create the GPIB object if it does not exist % otherwise use the object that was found. if isempty(interfaceObj) interfaceObj = gpib('NI', 0, 4); else fclose(interfaceObj); interfaceObj = interfaceObj(1); end
%input buffer size interfaceObj.inputbuffersize=1024; interfaceObj.outputbuffersize=1024;
% Create a device object. deviceObj = icdevice('tektronix_tds2024.mdd', interfaceObj); connect(deviceObj)
% Extract waveform from Channel 1 waveform_group = get( deviceObj, 'Waveform' ); [y, t] = invoke(waveform_group, 'readwaveform', 'channel1');
% Delete objects. fclose(interfaceObj); disconnect(deviceObj); delete([deviceObj interfaceObj]); clear interfaceObj deviceObj;
%number of samples taken by o-scope s=length(t);

62 %pick window out of Hanning, Hamming, or Blackman graph=input('Window? (1-Hanning, 2-Hamming, 3-Blackman): '); if graph==1 w=hann(s); elseif graph==2 w=hamming(s); elseif graph==3 w=blackman(s); end
w=w'; %changes from column vector to row vector
%sample frequency of o-scope fs=1/((t(s)-t(1))/s);
y2=w.*y; %applies appropriate window
figure; subplot(2,1,1); plot(t,y) xlabel('Time(sec)'); ylabel('Volts'); title('Channel 1: Rectangular Window'); subplot(2,1,2); plot(t,y2) xlabel('Time(sec)'); ylabel('Volts'); if graph==1 title('Channel 1: Hanning Window'); elseif graph==2 title('Channel 1: Hamming Window'); elseif graph==3 title('Channel 1: Blackman Window'); end
%number of samples for fft N=16384*4;
Y=fft(y,N); Y2=fft(y2,N);
%useful frequency is only half f=-N/2:N/2-1; k=f*fs/N;
%frequency map and amplitude scaling figure; subplot(2,1,1); plot(k, fftshift(abs(Y))/(s/2)) xlabel('Frequency(Hz)'); ylabel('Volts'); title('FFT: Rectangular Window'); subplot(2,1,2); plot(k, fftshift(abs(Y2))/(s/2)) xlabel('Frequency(Hz)'); ylabel('Volts'); if graph==1 title('FFT: Hanning Window'); elseif graph==2

63 title('FFT: Hamming Window'); elseif graph==3 title('FFT: Blackman Window'); end
%extract values for harmonics fund=60; %fundamental frequency n=1; k2=round(k);%rounds fft frequency vector to nearest integer c=[]; c2=[]; %vector of values for each harmonic frequency d=[]; %vector of harmonic frequencies
z=fftshift(abs(Y))/(s/2); z2=fftshift(abs(Y2))/(s/2); counter=1;
while fund*n < max(k2) harm=fund*n; diff1=1; diff2=0; while diff1>=diff2 %finds closest data point to harmonic diff1=(harm-k(counter))^2; diff2=(harm-k(counter+1))^2; counter=counter+1; end b=z(counter-1); %finds amplitude associated with harmonic b2=z2(counter-1); c=[c b]; c2=[c2 b2]; d=[d harm]; %if length(d)>length(c) %if harmonic is not present, add 0 to value
%associated with frequency n=n+1; end
%calculate thd num=0; num2=0; for n2=2:n-1, num=num + c(n2)^2; num2=num2+c2(n2)^2; end num=sqrt(num); %sqrt of sum of harmonic amplitudes squared num2=sqrt(num2); denom2=c2(1); %fundamental amplitude denom=c(1);
THD_rectangular=num/denom
if graph==1 THD_hanning=num2/denom2 elseif graph==2 THD_hamming=num2/denom2 elseif graph==3 THD_blackman=num2/denom2 End

64
B. Appendix B- Hardware/Simulation Data, Six-Pulse Current Waveforms
Table 9: Complete Hardware Simulation Data for Six-Pulse Rectifier
THD (%)
Firing Angle (°) Filtering Vin (V) Vout (V) Ia RMS (A) Average THD (%) Rectangular Hanning
0.0 None 40.1 42.0 0.587 27.40 27.41 27.39
0.0 5th 40.6 45.1 2.819 8.48 8.48 8.48
0.0 5th,7th 39.4 43.7 4.013 6.92 6.93 6.9
0.0 5th,11th 40.0 41.8 3.300 8.20 8.22 8.18
20.4 None 40.1 28.1 0.464 34.59 34.54 34.64
20.4 5th 40.2 28.2 2.440 8.83 8.84 8.81
20.4 5th,7th 40.1 28.2 3.760 7.07 7.08 7.05
20.4 5th,11th 40.1 28.3 3.040 8.73 8.75 8.71
45.0 None 40.0 24.3 0.372 27.07 27.05 27.09
45.0 5th 40.4 24.7 2.460 8.39 8.41 8.37
45.0 5th,7th 40.4 24.6 3.750 6.78 6.77 6.79
45.0 5th,11th 40.6 24.8 3.080 8.43 8.42 8.43
Table 10: Complete PSCAD
® Simulation Data for Six-Pulse Rectifier
Firing Angle (°) Filtering Vin (V) Vout (V) Ia RMS (A) THD (%) Ia peak (A)
0.0 None 40.0 48.0 0.569 27.00 0.813
0.0 5th 40.0 46.9 2.541 4.42 3.630
0.0 5th,7th 40.0 45.8 3.710 2.33 5.300
0.0 5th,11th 40.0 46.3 2.982 3.63 4.260
20.4 None 40.0 44.4 0.483 45.30 0.690
20.4 5th 40.0 44.2 1.708 9.05 2.440
20.4 5th,7th 40.0 43.2 3.584 5.24 5.120
20.4 5th,11th 40.0 43.9 3.031 7.07 4.330
45.0 None 40.0 35.0 0.385 62.40 0.550
45.0 5th 40.0 34.5 2.170 8.90 3.100
45.0 5th,7th 40.0 33.4 3.430 4.86 4.900
45.0 5th,11th 40.0 33.2 2.835 6.27 4.050
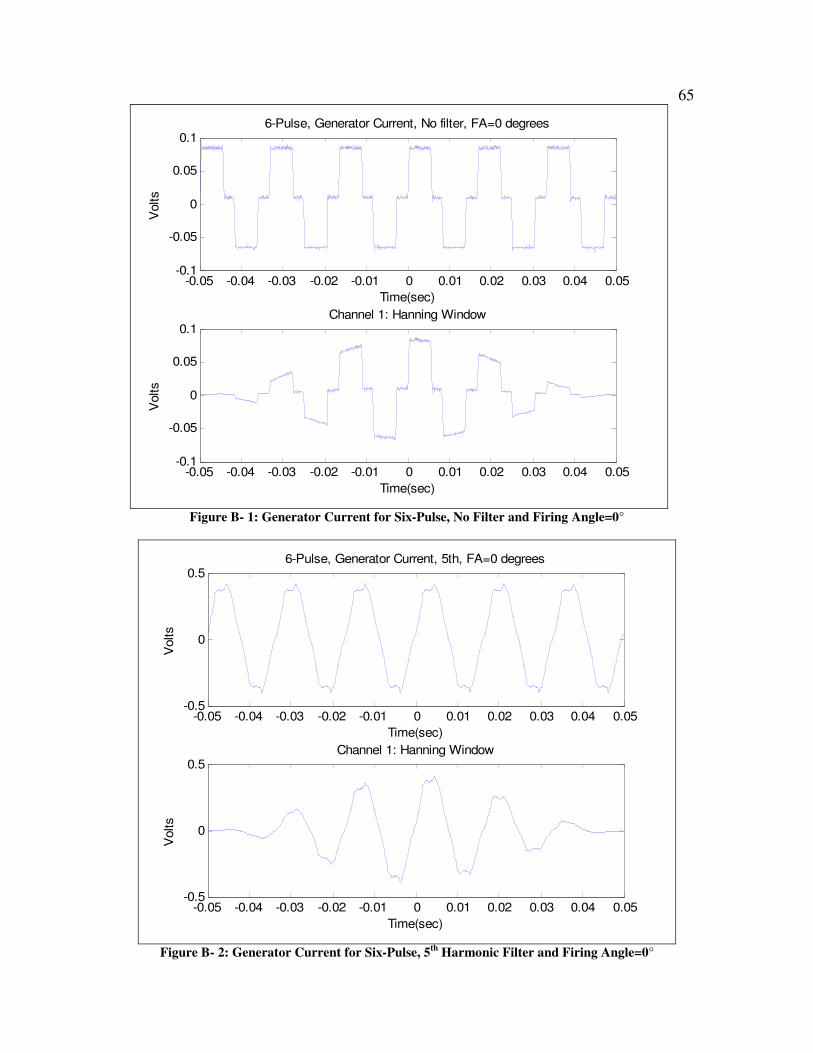
65
-0.05 -0.04 -0.03 -0.02 -0.01 0 0.01 0.02 0.03 0.04 0.05-0.1
-0.05
0
0.05
0.1
Time(sec)
Volts
6-Pulse, Generator Current, No filter, FA=0 degrees
-0.05 -0.04 -0.03 -0.02 -0.01 0 0.01 0.02 0.03 0.04 0.05-0.1
-0.05
0
0.05
0.1
Time(sec)
Volts
Channel 1: Hanning Window
Figure B- 1: Generator Current for Six-Pulse, No Filter and Firing Angle=0°
-0.05 -0.04 -0.03 -0.02 -0.01 0 0.01 0.02 0.03 0.04 0.05-0.5
0
0.5
Time(sec)
Volts
6-Pulse, Generator Current, 5th, FA=0 degrees
-0.05 -0.04 -0.03 -0.02 -0.01 0 0.01 0.02 0.03 0.04 0.05-0.5
0
0.5
Time(sec)
Volts
Channel 1: Hanning Window
Figure B- 2: Generator Current for Six-Pulse, 5
th Harmonic Filter and Firing Angle=0°

66
-0.05 -0.04 -0.03 -0.02 -0.01 0 0.01 0.02 0.03 0.04 0.05-1
-0.5
0
0.5
1
Time(sec)
Volts
6-Pulse, Generator Current, 5th+7th, FA=0 degrees
-0.05 -0.04 -0.03 -0.02 -0.01 0 0.01 0.02 0.03 0.04 0.05-1
-0.5
0
0.5
1
Time(sec)
Volts
Channel 1: Hanning Window
Figure B- 3: Generator Current for Six-Pulse, 5
th+7
th Harmonic Filter and Firing Angle=0°
-0.05 -0.04 -0.03 -0.02 -0.01 0 0.01 0.02 0.03 0.04 0.05-0.5
0
0.5
Time(sec)
Volts
6-Pulse, Generator Current, 5th+11th, FA=0 degrees
-0.05 -0.04 -0.03 -0.02 -0.01 0 0.01 0.02 0.03 0.04 0.05-0.5
0
0.5
Time(sec)
Volts
Channel 1: Hanning Window
Figure B- 4: Generator Current for Six-Pulse, 5
th+11
th Harmonic Filter and Firing Angle=0°

67
-0.05 -0.04 -0.03 -0.02 -0.01 0 0.01 0.02 0.03 0.04 0.05-0.1
-0.05
0
0.05
0.1
Time(sec)
Volts
6-Pulse, Generator Current, No filter, FA=20.4 degrees
-0.05 -0.04 -0.03 -0.02 -0.01 0 0.01 0.02 0.03 0.04 0.05-0.05
0
0.05
0.1
0.15
Time(sec)
Volts
Channel 1: Hanning Window
Figure B- 5: Generator Current for Six-Pulse, No Filter and Firing Angle=0°
-0.05 -0.04 -0.03 -0.02 -0.01 0 0.01 0.02 0.03 0.04 0.05-0.4
-0.2
0
0.2
0.4
Time(sec)
Volts
6-Pulse, Generator Current, 5th, FA=20.4 degrees
-0.05 -0.04 -0.03 -0.02 -0.01 0 0.01 0.02 0.03 0.04 0.05-0.4
-0.2
0
0.2
0.4
Time(sec)
Volts
Channel 1: Hanning Window
Figure B- 6: Generator Current for Six-Pulse, No Filter and Firing Angle=20.4°

68
-0.05 -0.04 -0.03 -0.02 -0.01 0 0.01 0.02 0.03 0.04 0.05-1
-0.5
0
0.5
1
Time(sec)
Volts
6-Pulse, Generator Current, 5th+7th, FA=20.4 degrees
-0.05 -0.04 -0.03 -0.02 -0.01 0 0.01 0.02 0.03 0.04 0.05-1
-0.5
0
0.5
1
Time(sec)
Volts
Channel 1: Hanning Window
Figure B- 7: Generator Current for Six-Pulse, 5
th+7
th Harmonic Filter and Firing Angle=20.4°
-0.05 -0.04 -0.03 -0.02 -0.01 0 0.01 0.02 0.03 0.04 0.05-0.5
0
0.5
Time(sec)
Volts
6-Pulse, Generator Current, 5th+11th, FA=20.4 degrees
-0.05 -0.04 -0.03 -0.02 -0.01 0 0.01 0.02 0.03 0.04 0.05-0.5
0
0.5
Time(sec)
Volts
Channel 1: Hanning Window
Figure B- 8: Generator Current for Six-Pulse, 5
th+11
th Harmonic Filter and Firing Angle=20.4°

69
-0.05 -0.04 -0.03 -0.02 -0.01 0 0.01 0.02 0.03 0.04 0.05-0.05
0
0.05
0.1
0.15
Time(sec)
Volts
6-Pulse, Generator Current, No filter, FA=45 degrees
-0.05 -0.04 -0.03 -0.02 -0.01 0 0.01 0.02 0.03 0.04 0.05-0.05
0
0.05
0.1
0.15
Time(sec)
Volts
Channel 1: Hanning Window
Figure B- 9: Generator Current for Six-Pulse, No Filter and Firing Angle=45°
-0.05 -0.04 -0.03 -0.02 -0.01 0 0.01 0.02 0.03 0.04 0.05-0.5
0
0.5
Time(sec)
Volts
6-Pulse, Generator Current, 5th, FA=45 degrees
-0.05 -0.04 -0.03 -0.02 -0.01 0 0.01 0.02 0.03 0.04 0.05-0.5
0
0.5
Time(sec)
Volts
Channel 1: Hanning Window
Figure B- 10: Generator Current for Six-Pulse, 5
th Harmonic Filter and Firing Angle=45°

70
-0.05 -0.04 -0.03 -0.02 -0.01 0 0.01 0.02 0.03 0.04 0.05-1
-0.5
0
0.5
1
Time(sec)
Volts
6-Pulse, Generator Current, 5th+7th, FA=45 degrees
-0.05 -0.04 -0.03 -0.02 -0.01 0 0.01 0.02 0.03 0.04 0.05-1
-0.5
0
0.5
1
Time(sec)
Volts
Channel 1: Hanning Window
Figure B- 11: Generator Current for Six-Pulse, 5
th+7
th Harmonic Filter and Firing Angle=45°
-0.05 -0.04 -0.03 -0.02 -0.01 0 0.01 0.02 0.03 0.04 0.05-0.5
0
0.5
Time(sec)
Volts
6-Pulse, Generator Current, 5th+11th, FA=45 degrees
-0.05 -0.04 -0.03 -0.02 -0.01 0 0.01 0.02 0.03 0.04 0.05-0.5
0
0.5
Time(sec)
Volts
Channel 1: Hanning Window
Figure B- 12: Generator Current for Six-Pulse, 5
th+11
th Harmonic Filter and Firing Angle=45°