Embed Size (px)
Citation preview

UNITED STATES SECURITIES AND EXCHANGE COMMISSION
Washington, D.C. 20549
FORM 10-Q
For the quarterly period ended September 30, 2012
OR
For the transition period from to
Commission File No. 001-34220
3D SYSTEMS CORPORATION (Exact Name of Registrant as Specified in Its Charter)
(803) 326-3900 (Registrant’s Telephone Number, Including Area Code)
Indicate by check mark whether the registrant: (1) has filed all reports required to be filed by Section 13 or 15(d) of the Securities Exchange Act of 1934 during the preceding 12 months (or for such shorter period that the registrant was required to file such reports), and (2) has been subject to such filing requirements for the past 90 days. Yes ⌧ No �
Indicate by check mark whether the registrant has submitted electronically and posted on its corporate Web site, if any, every Interactive Data File required to be submitted and posted pursuant to Rule 405 of Regulation S-T (§232.405 of this chapter) during the preceding 12 months (or for such shorter period that the registrant was required to submit and post such files). Yes ⌧ No �
Indicate by check mark whether the registrant is a large accelerated filer, an accelerated filer, a non-accelerated filer, or a smaller reporting company. See the definitions of “large accelerated filer,” “accelerated filer” and “smaller reporting company” in Rule 12b-2 of the Exchange Act. (Check one):
Indicate by check mark whether the registrant is a shell company (as defined in Rule 12b-2 of the Exchange Act.) Yes � No ⌧
APPLICABLE ONLY TO ISSUERS INVOLVED IN BANKRUPTCY PROCEEDINGS DURING THE PRECEDING FIVE YEARS:
⌧ QUARTERLY REPORT PURSUANT TO SECTION 13 OR 15(d) OF THE SECURITIES EXCHANGE ACT OF 1934
� TRANSITION REPORT PURSUANT TO SECTION 13 OR 15(d) OF THE SECURITIES EXCHANGE ACT OF 1934
DELAWARE 95-4431352(State or Other Jurisdiction of
Incorporation or Organization) (I.R.S. Employer
Identification No.)
333 THREE D SYSTEMS CIRCLE ROCK HILL, SOUTH CAROLINA 29730
(Address of Principal Executive Offices) (Zip Code)
Large accelerated filer ⌧ Accelerated filer �
Non-accelerated filer � (Do not check if smaller reporting company) Smaller reporting company �

Indicate by check mark whether the registrant has filed all documents and reports required to be filed by Sections 12, 13 or 15(d) of the Securities Exchange Act of 1934 subsequent to the distribution of securities under a plan confirmed by a court. Yes � No �
APPLICABLE ONLY TO CORPORATE ISSUERS:
Indicate the number of shares outstanding of each of the issuer’s classes of common stock, as of the latest practicable date.
Shares of Common Stock, par value $0.001, outstanding as of October 19, 2012: 57,040,024

3D SYSTEMS CORPORATION
Quarterly Report on Form 10-Q for the Quarter Ended September 30, 2012
TABLE OF CONTENTS
2
PART I. — FINANCIAL INFORMATION 3 Item 1. Financial Statements 3 Item 2. Management’s Discussion and Analysis of Financial Condition and Results of Operations 18 Item 3. Quantitative and Qualitative Disclosures About Market Risk 34 Item 4. Controls and Procedures 34
PART II — OTHER INFORMATION 35 Item 1. Legal Proceedings 35 Item 1A. Risk Factors 35 Item 6. Exhibits 35
Exhibit 31.1 38 Exhibit 31.2 39 Exhibit 32.1 40 Exhibit 32.2 41

PART I. — FINANCIAL INFORMATION
Item 1. Financial Statements.
3D SYSTEMS CORPORATION CONDENSED CONSOLIDATED BALANCE SHEETS
(Unaudited)
See accompanying notes to condensed consolidated financial statements.
3
(in thousands, except par value) September 30,
2012 December 31,
2011
ASSETS
Current assets:
Cash and cash equivalents $ 183,931 $ 179,120 Accounts receivable, net of allowance for doubtful accounts of $5,155 (2012) and $3,019
(2011) 69,750 51,195 Inventories, net of reserves of $3,824 (2012) and $2,542 (2011) 41,281 25,283 Prepaid expenses and other current assets 2,570 2,241 Current deferred income taxes 3,969 3,528 Restricted cash 13 13
Total current assets 301,514 261,380 Property and equipment, net 34,187 29,594 Intangible assets, net 96,902 54,040 Goodwill 220,465 107,651 Long term deferred income taxes 636 3,195 Other assets, net 6,814 7,114
Total assets $ 660,518 $ 462,974
LIABILITIES AND EQUITY
Current liabilities:
Current portion of capitalized lease obligations $ 159 $ 163 Accounts payable 26,730 25,911 Accrued and other liabilities 33,636 16,816 Customer deposits 2,755 3,398 Deferred revenue 15,935 12,735
Total current liabilities 79,215 59,023 Long term portion of capitalized lease obligations 7,494 7,609
Convertible senior notes, net 123,561 131,107 Deferred income tax liability 22,091 3,666 Other liabilities 11,667 6,781
Total liabilities 244,028 208,186
Commitments and Contingencies
Stockholders’ equity:
Preferred stock, authorized 5,000 shares, none issued — — Common stock, $0.001 par value, authorized 120,000 shares; 57,376 (2012) and 50,975
(2011) issued 57 51 Additional paid-in capital 408,031 274,542 Treasury stock, at cost: 343 (2012) and 324 shares (2011) (228) (214) Accumulated earnings (deficit ) 5,498 (22,531) Accumulated other comprehensive income 3,132 2,940
Total stockholders’ equity 416,490 254,788
Total liabilities and stockholders’equity $ 660,518 $ 462,974

3D SYSTEMS CORPORATION CONDENSED CONSOLIDATED STATEMENTS OF OPERATIONS AND COMPREHENSIVE INCOME
(Unaudited)
See accompanying notes to condensed consolidated financial statements.
4
Quarter Ended September 30, Nine Months Ended September 30,(in thousands, except per share amounts) 2012 2011 2012 2011
Revenue:
Products $ 59,551 $ 33,248 $ 161,223 $ 95,002 Services 30,981 24,290 90,839 65,561
Total revenue 90,532 57,538 252,062 160,563 Cost of sales:
Products 26,729 16,010 73,621 45,732 Services 16,924 13,765 49,741 38,667
Total cost of sales 43,653 29,775 123,362 84,399
Gross profit 46,879 27,763 128,700 76,164 Operating expenses:
Selling, general and administrative 22,900 15,100 70,898 42,224 Research and development 5,543 3,872 15,397 9,737
Total operating expenses 28,443 18,972 86,295 51,961
Income from operations 18,436 8,791 42,405 24,203 Interest and other expense, net 2,167 654 8,589 465
Income before income taxes 16,269 8,137 33,816 23,738 Provision for (benefit of) income taxes 2,752 917 5,787 (3,677)
Net income $ 13,517 $ 7,220 $ 28,029 $ 27,415 Other comprehensive income
Unrealized gain (loss) on pension obligation $ (6) $ (5) $ 1 $ — Foreign currency translation gain (loss) 2,016 (2,873) 191 (250)
Comprehensive income $ 15,527 $ 4,342 $ 28,221 $ 27,165
Net income per share — basic $ 0.24 $ 0.14 $ 0.53 $ 0.55
Net income per share — diluted $ 0.24 $ 0.14 $ 0.52 $ 0.54

3D SYSTEMS CORPORATION CONDENSED CONSOLIDATED STATEMENTS OF CASH FLOWS
(Unaudited)
See accompanying notes to condensed consolidated financial statements.
5
Nine Months Ended September 30,(in thousands) 2012 2011
Cash flows from operating activities:
Net income $ 28,029 $ 27,415
Adjustments to reconcile net income to net cash provided by operating activities:
Provision for (benefit of) deferred income taxes 2,941 (4,833) Depreciation and amortization 15,804 7,402 Non-cash interest on convertible notes 2,923 — Provision for bad debts 2,369 929 Stock-based compensation 3,656 1,827 (Gain) loss on the disposition of property and equipment and investments (631) 82 Loss on conversion of convertible debt 1,245 —
Changes in operating accounts:
Accounts receivable (11,270) (2,568) Inventories (10,582) (5,000) Prepaid expenses and other current assets 237 (293) Accounts payable (4,488) (4,777) Accrued liabilities 14,298 37 Customer deposits (1,347) 608 Deferred revenue 815 (1,106) Other operating assets and liabilities 12 (940)
Net cash provided by operating activities 44,011 18,783
Cash flows from investing activities:
Purchases of property and equipment (1,902) (2,295) Additions to license and patent costs (535) (305) Cash paid for acquisitions, net of cash assumed (148,278) (44,830)
Net cash used in investing activities (150,715) (47,430)
Cash flows from financing activities:
Proceeds from issuance of common stock 106,890 62,054 Proceeds from exercise of stock options and restricted stock, net 4,582 2,378 Repayment of capital lease obligations (121) (172) Restricted cash — (189)
Net cash provided by financing activities 111,351 64,071
Effect of exchange rate changes on cash 164 (156)
Net increase in cash and cash equivalents 4,811 35,268
Cash and cash equivalents at the beginning of the period 179,120 37,349
Cash and cash equivalents at the end of the period $ 183,931 $ 72,617
Supplemental Cash Flow Information:
Interest payments $ 5,114 $ 418 Income tax payments 1,889 994 Non-cash items:
Transfer of equipment from inventory to property and equipment, net(a) 2,228 2,721 Transfer of equipment to inventory from property and equipment, net(b) (1,365) 779 Stock issued for acquisitions of businesses 7,103 3,042 Stock issued for conversions of 5.50% senior convertible notes 11,250 —
(a) Inventory is transferred from inventory to property and equipment at cost when the Company requires additional machines for training, demonstration or short-term rentals.
(b) In general, an asset is transferred from property and equipment, net into inventory at its net book value when the Company has identified a potential sale for a used machine. The machine is removed from inventory upon recognition of the sale.

3D SYSTEMS CORPORATION CONDENSED CONSOLIDATED STATEMENT OF EQUITY
(Unaudited)
See accompanying notes to condensed consolidated financial statements.
6
Common Stock Treasury Stock
(In thousands, except par value) Shares
Par Value $0.001
AdditionalPaid In Capital Shares Amount
AccumulatedDeficit
Accumulated Other
ComprehensiveIncome
TotalStockholders’
Equity
Balance at December 31, 2011 50,975 $ 51 $274,542 324 $ (214) $ (22,531) $ 2,940 $ 254,788 Exercise of stock options 962 — (a) 4,133 — — — — 4,133 Issuance (repurchase) of restricted
stock, net 474 — (a) 463 19 (14) — — 449 Issuance of common stock 4,151 5 106,885 106,890 Issuance of stock for acquisitions 278 — (a) 7,103 7,103 Issuance of stock for 5.50% senior
convertible notes 536 1 11,249 — — — — 11,250 Stock-based compensation expense — — 3,656 — — — — 3,656 Net income — — — — — 28,029 — 28,029 Gain on pension plan – unrealized — — — — — — 1 1 Foreign currency translation
adjustment — — — — — — 191 191
Balance at September 30, 2012 57,376 $ 57 $408,031 343 $ (228) $ 5,498 $ 3,132 $ 416,490
(a) Amounts not shown due to rounding.

3D SYSTEMS CORPORATION NOTES TO THE CONDENSED CONSOLIDATED FINANCIAL STATEMENTS
(Unaudited)
(1) Basis of Presentation The accompanying unaudited condensed consolidated financial statements include the accounts of 3D Systems Corporation and
its subsidiaries (collectively, the “Company”). All significant intercompany transactions and balances have been eliminated in consolidation. The unaudited condensed consolidated financial statements have been prepared in accordance with generally accepted accounting principles in the United States of America (“GAAP”) and the rules and regulations of the Securities and Exchange Commission (“SEC”) applicable to interim reports. Accordingly, they do not include all the information and notes required by GAAP for complete financial statements and should be read in conjunction with the audited financial statements included in the Company’s Annual Report on Form 10-K (“Form 10-K”) for the year ended December 31, 2011.
In the opinion of management, the unaudited condensed consolidated financial statements contain all adjustments, consisting of adjustments of a normal recurring nature, necessary to present fairly the financial position, results of operations and cash flows for the periods presented. The results of operations for the quarter and nine months ended September 30, 2012 are not necessarily indicative of the results to be expected for the full year.
The preparation of financial statements in accordance with GAAP requires management to make estimates and assumptions that affect the amounts reported in the financial statements. Actual results may differ from those estimates and assumptions.
Certain prior period amounts presented in the accompanying footnotes have been reclassified to conform to current year presentation.
All amounts presented in the accompanying footnotes are presented in thousands, except for per share information.
The Company has evaluated subsequent events from the date of the condensed consolidated balance sheet through the date of the filing of this Form 10-Q. During this period, the Company closed the acquisition of Tim The Innovative Modelmakers B.V. (“TIM”) and INUS Technology, Inc., known as Rapidform . See Note 2 and Note 16 for a description of subsequent events.
Recent Accounting Pronouncements In July 2012, the Financial Accounting Standards Board (“FASB”) issued Accounting Standards Update 2012-2 (“ASU 2012-
2”), “Intangibles – Goodwill and Other (Topic 350).” ASU 2012-2 is intended to simplify the testing of intangible assets for impairment by permitting an entity the option to first assess qualitative factors to determine whether it is more likely than not that the fair value of indefinite-lived intangible assets is less than its carrying amount. If an entity determines on the basis of the qualitative factors this is the case, then it is required to perform the currently prescribed two-step impairment test described in Topic 350. ASU 2012-2 will become effective for fiscal years beginning after September 15, 2012, with early adoption permitted. The Company does not anticipate that this amendment will have a significant impact on the company’s consolidated financial statements.
No new accounting pronouncements, issued or effective during the third quarter of 2012, have had or are expected to have a significant impact on the Company’s consolidated financial statements.
(2) Acquisitions The Company completed an acquisition in the third quarter of 2012, which is discussed below.
On July 23, 2012, the Company acquired the shares of Viztu Technologies, Inc. (“Viztu”). Viztu is the developer of Hypr3D™, an online platform that allows anyone to turn their pictures and videos into printable 3D creations. Viztu’s operations have been integrated into the Company and are included in services revenue. The fair value of the consideration paid for this acquisition, net of cash acquired, was $1,000, of which $500 was paid in cash and $500 was paid in shares of the Company’s common stock. These shares were issued in a private transaction exempt from registration under the Securities Act of 1933. The fair value of the consideration paid for this acquisition was allocated to the assets purchased and liabilities assumed, based on their estimated fair values as of the acquisition date, with any excess recorded as goodwill, and is included in the table below which summarizes third quarter 2012 acquisitions. The Viztu acquisition is not significant to the Company’s financial statements.
7
®

Subject to the terms and conditions of the acquisition agreement, the seller has the right to earn an additional amount, of up to a maximum of $1,000, pursuant to an earnout formula over a four-year period as set forth in the acquisition agreement. As of September 30, 2012, an accrued liability of approximately $81 was recorded for the earnout. The earnout was determined to be acquisition consideration and therefore is reflected as part of goodwill.
The Company’s purchase price allocations for the acquired company is preliminary and subject to revision as more detailed analyses are completed and additional information about fair value of assets and liabilities becomes available. The amounts related to the acquisition of this business were allocated to the assets acquired and the liabilities assumed and included in the Company’s condensed consolidated balance sheet at September 30, 2012 as follows:
Subsequent acquisitions In October 2012, the Company acquired the shares of TIM The Innovative Modelmakers B.V. (“TIM”), a full service provider
of on-demand custom parts services, located in the Netherlands. The fair value of the consideration paid for this acquisition, net of cash acquired, was $1,369, based on the exchange rate of the Euro at the date of acquisition, of which $801 was paid in cash and $568 was paid in shares of the Company’s common stock. These shares were issued in a private transaction exempt from registration under the Securities Act of 1933. Due to the timing of this acquisition, the Company is in the process of allocating the fair values of the assets purchased, liabilities assumed and other intangibles identified as of the acquisition date, with any excess to be recorded as goodwill. The Company plans to integrate TIM into its European on-demand parts services and future revenue from this acquisition will be reported in services revenue. The TIM acquisition is not significant to the Company’s financial statements.
In October 2012, the Company acquired the shares of INUS Technology, Inc., a developer of scan-to-CAD and inspection software tools, known as Rapidform (“Rapidform”). Rapidform is located in Seoul, South Korea. The fair value of the consideration paid for this acquisition, net of cash acquired, was $35,000, all of which was paid in cash. Due to the timing of this acquisition, the Company is in the process of allocating the fair values of the assets purchased, liabilities assumed and other intangibles identified as of the acquisition date, with any excess to be recorded as goodwill. Future revenue from this acquisition will be reported in printers and other products revenue. The Rapidform acquisition is not significant to the Company’s financial statements.
(3) Inventories Components of inventories, net at September 30, 2012 and December 31, 2011 were as follows:
8
(in thousands) 2012
Fixed assets $ — Intangible assets 1,166 Other liabilities, net of cash acquired and assets assumed (166)
Net assets acquired $1,000
(in thousands) 2012 2011
Raw materials $21,578 $ 8,797 Work in process 1,361 606 Finished goods and parts 22,166 18,422
Total cost 45,105 27,825 Less: reserves (3,824) (2,542)
Inventories, net $41,281 $25,283
®

(4) Property and Equipment Property and equipment at September 30, 2012 and December 31, 2011 were as follows:
Depreciation and amortization expense on property and equipment for the quarter and nine months ended September 30, 2012 were $2,151 and $6,285, respectively, compared to $1,547 and $4,596, respectively, for the quarter and nine months ended September 30, 2011.
(5) Intangible Assets Intangible assets other than goodwill at September 30, 2012 and December 31, 2011 were as follows:
For the nine months ended September 30, 2012 and 2011, the Company capitalized $535 and $305, respectively, of costs incurred to acquire, develop and extend patents in the United States and various other countries.
Amortization expense for intangible assets for the quarter and nine months ended September 30, 2012 was $3,079 and $9,519, respectively, compared to $855 and $2,806 for the quarter and nine months ended September 30, 2011.
Annual amortization expense for intangible assets for 2012, 2013, 2014, 2015 and 2016 is expected to be $12,545, $12,090, $11,974, $10,765 and $9,624, respectively.
9
(in thousands) 2012 2011 Useful Life (in
years)
Land $ 541 $ 541 N/ABuilding 9,204 9,204 25Machinery and equipment 46,431 36,773 3-7Capitalized software — ERP 3,174 3,141 5Office furniture and equipment 3,283 3,138 5Leasehold improvements 6,532 5,996 Life of lease Rental equipment 56 56 5Construction in progress 967 980 N/A
Total property and equipment 70,188 59,829
Less: Accumulated depreciation and amortization (36,001) (30,235)
Total property and equipment, net $ 34,187 $ 29,594
(1) Leasehold improvements are amortized on a straight-line basis over the shorter of (i) their estimated useful lives and (ii) the estimated or contractual life of the related lease.
2012 2011
(in thousands) Gross AccumulatedAmortization Net Gross
Accumulated Amortization Net
Intangible assets with finite lives:
Licenses $ 5,875 $ (5,875) $ — $ 5,875 $ (5,875) $ — Patent costs 20,091 (13,989) 6,102 16,379 (13,846) 2,533 Acquired technology 26,234 (11,437) 14,797 11,015 (10,345) 670 Internally developed software 17,847 (11,064) 6,783 17,847 (9,983) 7,864 Customer relationships 56,865 (6,171) 50,694 32,974 (1,798) 31,176 Non-compete agreements 11,717 (3,280) 8,437 8,976 (1,890) 7,086 Trade names 4,362 (574) 3,788 1,951 (180) 1,771 Other 6,355 (2,824) 3,531 1,986 (1,746) 240
Intangibles with indefinite lives:
Trademarks 2,770 — 2,770 2,700 — 2,700
Total intangible assets $152,116 $ (55,214) $96,902 $99,703 $ (45,663) $54,040
(1)

(6) Accrued and Other Liabilities Accrued liabilities at September 30, 2012 and December 31, 2011 were as follows:
Other liabilities at September 30, 2012 and December 31, 2011 were as follows:
(7) Hedging Activities and Financial Instruments The Company conducts business in various countries using both the functional currencies of those countries and other currencies
to effect cross border transactions. As a result, the Company is subject to the risk that fluctuations in foreign exchange rates between the dates that those transactions are entered into and their respective settlement dates will result in a foreign exchange gain or loss. When practicable, the Company endeavors to match assets and liabilities in the same currency on its balance sheet and those of its subsidiaries in order to reduce these risks. When appropriate, the Company enters into foreign currency contracts to hedge exposures arising from those transactions. The Company has elected not to prepare and maintain the documentation to qualify for hedge accounting treatment under ASC 815, “Derivatives and Hedging,” and therefore, all gains and losses (realized or unrealized) are recognized in “Interest and other expense, net” in the condensed consolidated statements of operations and comprehensive income. Depending on their fair value at the end of the reporting period, derivatives are recorded either in prepaid expenses and other current assets or in accrued liabilities on the condensed consolidated balance sheet.
There were no foreign currency contracts outstanding at September 30, 2012 or December 31, 2011.
The total impact of foreign currency transactions on the condensed consolidated statements of operations and comprehensive income for the quarter and nine months ended September 30, 2012 reflected gains of $653 and $138, respectively, compared to a loss of $575 and a gain of $36, respectively, for the quarter and nine months ended September 30, 2011.
(8) Borrowings 5.5% senior convertible notes and interest expense
In November 2011, the Company issued $152,000 of 5.50% senior convertible notes due December 2016. These notes are senior unsecured obligations and rank equal in right of payment with all the Company’s existing and future senior unsecured indebtedness. They are also senior in right of payment to any subordinated indebtedness that the Company may incur in the future.
The notes accrue interest at the rate of 5.50% per year payable in cash semi-annually on June 15 and December 15 of each year.
10
(in thousands) 2012 2011
Compensation and benefits $21,613 $ 7,036 Vendor accruals 2,118 1,640 Accrued professional fees 474 326 Accrued taxes 4,309 3,500 Royalties payable 468 302 Accrued interest 2,332 950 Earnouts and deferred payments related to acquisitions 1,497 1,384 Accrued other 825 1,678
Total $33,636 $16,816
(in thousands) 2012 2011
Defined benefit pension obligation $ 3,855 $3,884 Long-term tax liability 825 827 Earnouts and deferred payments related to acquisitions 6,531 1,898 Other long-term liabilities 456 172
Total $11,667 $6,781

The following table summarizes the principal amounts and related unamortized discount on convertible notes at September 30, 2012 and December 31, 2011:
These notes are convertible into shares of the Company’s Common Stock at an initial conversion rate equivalent to 46.6021 shares of Common Stock per $1 principal amount of notes, which represents an initial conversion rate of approximately $21.46 per share of Common Stock. The conversion rate is subject to adjustment in certain circumstances as more fully set forth in the indenture covering the notes. Conditions for conversion have been satisfied and the notes are convertible. During the third quarter of 2012 note holders converted $11,500 aggregate principal amount of notes, which converted into 536 shares of common stock. The Company recognized a $1,245 loss on conversion of these notes in other expense, net.
If converted, the aggregate principal amount of the notes then outstanding may be settled in cash, shares of common stock, or a combination thereof, at the Company’s election. Subject to the terms of the indenture, holders may convert their notes at any time. The number of shares of common stock that the notes are convertible into is approximately 6,548. In certain circumstances provided for in the indenture, the number of shares of common stock issuable upon conversion of the notes may be increased, and with it the aggregate principal amount of the notes. Unless earlier repurchased, redeemed or converted, the notes will mature on December 15, 2016.
The notes were issued with an effective yield of 5.96% based upon an original issue discount at 98.0%. The net proceeds from the issuance of these notes, after deducting original issue discount and capitalized issuance costs of $6,634, amounted to $145,366. The capitalized issuance costs are being amortized to interest expense over the life of the notes, or realized upon conversion of the notes.
Upon certain terms and conditions, the Company may elect to satisfy its conversion obligation with respect to the notes by paying cash, in whole or in part, for specified aggregate principal amount of the notes. In the event of certain types of fundamental changes, the Company will increase the conversion rate by a number of additional shares, up to a maximum of 8,348 shares, which equates to a conversion price of approximately $16.83 per share.
(9) Stock-based Compensation Plans The Company records stock-based compensation expense in selling, general and administrative expenses in the condensed
consolidated statements of operations and comprehensive income. Stock-based compensation expense for the quarter and nine months ended September 30, 2012 and 2011 was as follows:
The number of shares of restricted common stock awarded and the weighted average fair value per share during the quarter and nine months ended September 30, 2012 and 2011 were as follows:
11
(in thousands) 2012 2011
Principal amount of convertible notes $140,500 $152,000 Unamortized discount on convertible notes (16,939) (20,893)
Net carrying value $123,561 $131,107
Quarter Ended September 30, Nine Months Ended September 30, (in thousands) 2012 2011 2012 2011
Restricted stock awards $ 1,176 $ 593 $ 3,656 $ 1,827
Quarter Ended September 30, 2012 2011
(in thousands, except per share amounts) Shares
Awarded Weighted Average
Fair Value Shares
Awarded Weighted Average
Fair Value
Restricted stock awards:
Granted under the 2004 Incentive Stock Plan 80 $ 34.78 46 $ 22.65 Granted under the 2004 Restricted Stock Plan
for Non-Employee Directors — — — —
Total restricted stock awards 80 $ 34.78 46 $ 22.65

In the nine months ended September 30, 2012, the Company granted restricted stock awards covering 237 shares of common stock pursuant to the Company’s 2004 Incentive Stock Plan. Of the 237 shares granted in the first nine months of 2012, 13 of the shares were awarded to executive officers of the Company. Additionally, of the 237 shares granted in the first nine months of 2012, 4 remained subject to acceptance at September 30, 2012. In the first nine months of 2011, the Company granted restricted stock awards covering 198 shares of common stock pursuant to the Company’s 2004 Incentive Stock Plan; 10 of which were awarded to executive officers of the Company.
In the first nine months of 2012 and 2011, respectively, the Company granted 11 shares and 16 shares, respectively, of common stock pursuant to the Company’s 2004 Restricted Stock Plan for Non-Employee Directors. Stock compensation expense for Non-Employee Directors for the first nine months of 2012 and 2011 was $300 and $300, respectively.
(10) International Retirement Plan The following table shows the components of net periodic benefit costs and other amounts recognized in the condensed
consolidated statements of operations and comprehensive income for the quarter and nine months ended September 30, 2012 and 2011:
(11) Earnings Per Share The Company presents basic and diluted earnings per share (“EPS”) amounts. Basic EPS is calculated by dividing net income
available to common stockholders by the weighted average number of common shares outstanding during the applicable period. Diluted EPS is calculated by dividing net income by the weighted average number of common and common equivalent shares outstanding during the applicable period.
12
Nine Months Ended September 30, 2012 2011
(in thousands, except per share amounts) Shares
Awarded Weighted Average
Fair Value Shares
Awarded Weighted Average
Fair Value
Restricted stock awards:
Granted under the 2004 Incentive Stock Plan 237 $ 27.78 198 $ 20.49
Granted under the 2004 Restricted Stock Plan for Non-Employee Directors 11 27.42 16 18.23
Total restricted stock awards 248 $ 27.76 214 $ 20.32
Quarter Ended September 30, Nine Months Ended September 30, (in thousands) 2012 2011 2012 2011
Service cost $ 18 $ 28 $ 55 $ 85 Interest cost 29 31 93 95
Total $ 47 $ 59 $ 148 $ 180

The following table reconciles basic weighted average outstanding shares to diluted weighted average outstanding shares at September 30, 2012 and 2011:
For the quarter ended September 30, 2012, average common shares for basic and diluted earnings per share were 55,935 and 56,564, respectively, and basic and diluted earnings per share were both $0.24. For the quarter ended September 30, 2011, average common shares for basic and diluted earnings per share were 50,450 and 51,402 respectively, and basic and diluted earnings per share were each $0.14.
For the nine months ended September 30, 2012, average common shares for basic and diluted earnings per share were 52,689 and 53,473, respectively, and basic and diluted earnings per share were $0.53 and $0.52, respectively. For the nine months ended September 30, 2011, average common shares for basic and diluted earnings per share were 49,455 and 50,475 respectively, and basic and diluted earnings per share were $0.55 and $0.54, respectively.
(12) Fair Value Measurements ASC 820, “Fair Value Measurements and Disclosures,” defines fair value as the exchange price that would be received for an
asset or paid to transfer a liability (an exit price) in the principal or most advantageous market for the asset or liability in an orderly transaction between market participants on the measurement date. ASC 820 also establishes a fair value hierarchy which requires an entity to maximize the use of observable inputs that may be used to measure fair value:
Level 1 - Quoted prices in active markets for identical assets or liabilities; Level 2 - Observable inputs other than Level 1 prices, such as quoted prices for similar assets or liabilities; quoted prices in
markets that are not active; or other inputs that are observable or can be corroborated by observable market data for substantially the full term of the assets or liabilities; or
Level 3 - Unobservable inputs that are supported by little or no market activity and that are significant to the fair value of the assets or liabilities.
For the Company, the above standard applies to cash equivalents and senior convertible notes. The Company utilizes the market approach to measure fair value for its financial assets and liabilities. The market approach uses prices and other relevant information generated by market transactions involving identical or comparable assets or liabilities.
13
Quarter Ended September 30, Nine Months Ended September 30, (in thousands, except per share amounts) 2012 2011 2012 2011
Numerator: Net income – numerator for basic net earnings per share $ 13,517 $ 7,220 $ 28,029 $ 27,415 Add: Effect of dilutive securities
Interest expense on 5.50% convertible notes (after-tax) — — — —
Stock options and other equity compensation — — — —
Numerator for diluted earnings per share $ 13,517 $ 7,220 $ 28,029 $ 27,415
Denominator:
Weighted average shares – denominator for basic net earnings per share 55,935 50,450 52,689 49,455
Add: Effect of dilutive securities
Stock options and other equity compensation 629 952 784 1,020 5.50% convertible notes (after-tax) — — — —
Denominator for diluted earnings per share 56,564 51,402 53,473 50,475
Earnings per share
Basic $ 0.24 $ 0.14 $ 0.53 $ 0.55
Diluted $ 0.24 $ 0.14 $ 0.52 $ 0.54
Interest expense excluded from diluted earnings per share calculation $ 2,508 — $ 7,578 —
5.50% Convertible notes shares excluded from diluted earnings per share calculation 6,548 — 5,303 —
Average outstanding diluted earnings per share calculation excludes shares that may be issued upon conversion of the outstanding senior convertible notes since the effect of their inclusion would have been anti-dilutive.
(1)
(1)
(1)
(1)
(1)

Assets and liabilities measured at fair value on a recurring basis are summarized below:
The Company did not have any transfers of assets and liabilities between Level 1 and Level 2 of the fair value measurement hierarchy during the quarter and nine months ended September 30, 2012.
The carrying value of the senior convertible notes as of September 30, 2012 and December 31, 2011 was $123,561 and $131,107, respectively, net of the unamortized discount. As of September 30, 2012 and December 31, 2011, the estimated fair value of the senior convertible notes was $141,570 and $149,615, respectively, based on quoted market prices. The Company determined the fair value of the convertible notes utilizing transactions in the listed markets for identical or similar liabilities. As such, the fair value of the senior convertible notes is considered Level 2.
In addition to the financial assets included in the above table, certain of our non-financial assets and liabilities are to be initially measured at fair value on a non-recurring basis. This includes items such as non-financial assets and liabilities initially measured at fair value in a business combination (but not measured at fair value in subsequent periods) and non-financial, long-lived assets measured at fair value for an impairment assessment. In general, non-financial assets and liabilities including goodwill, other intangible assets and property and equipment are measured at fair value when there is an indication of impairment and are recorded at fair value only when impairment is recognized. The Company has not recorded any impairments related to such assets and has had no other significant non-financial assets or non-financial liabilities requiring adjustments or write-downs to fair value as of September 30, 2012 or December 31, 2011.
(13) Income Taxes The Company’s effective tax rates were 16.9% and 17.1% for the quarter and nine months ended September 30, 2012,
respectively, compared to 11.3% and (15.5%) for the quarter and nine months ended September 30, 2011, respectively.
The Company has utilized a portion of its U.S. net deferred tax assets, against which there is a valuation allowance, in determining its effective tax rate for 2012. The remainder of its U.S. net deferred assets, against which there are valuation allowances, has been offset by the recognition of deferred income tax liabilities from the acquisitions of Z Corp, Vidar, My Robot Nation, Bespoke and Viztu. These acquisitions resulted in recognizing $502 of deferred income tax assets and $18,393 of deferred income tax liabilities.
In conjunction with the Company’s ongoing review of its actual results and anticipated future earnings, the Company assesses the possibility of releasing the valuation allowance remaining on its U.S. net deferred tax assets. There were no releases of the valuation allowance on deferred tax assets during the first nine months of 2012; however, the Company’s effective tax rate has been reduced as a result of the use of U.S. net deferred tax assets against which there is a valuation allowance. During the first nine months ended September 30, 2011, the Company reversed $17,000 of the valuation allowance applied to U.S. net deferred tax assets. The reversal of the valuation allowance resulted in a non-cash income tax benefit of $6,221, which resulted in a benefit of 12 cents per share for the first nine months of 2011. As of September 30, 2012, the Company has a valuation allowance remaining on its U.S. net deferred tax assets of $9,253.
As a result of the exercise of stock options during the third quarter, the Company will have the benefit of an excess deduction of $31,049, which will be recorded to additional paid-in capital when the Company realizes a reduction in its current taxes payable.
Tax years 2008 to 2011 remain subject to examination by the U.S. Internal Revenue Service. The Company has utilized a portion of its U.S. loss carryforwards covering the years 1997 through 2003. Should the Company utilize any of its remaining losses, which date back to 2003, these would be subject to examination. The Company files income tax returns (which are open to examination beginning in the year shown in parentheses) in France (2005), Germany (2007), Japan (2006), Italy (2006), Switzerland (2006), the United Kingdom (2008), the Netherlands (2006), India (2011) and Australia (2007).
14
Fair Value Measurements as of September 30, 2012 (in thousands) Level 1 Level 2 Level 3 Total
Description
Cash equivalents $ 136,805 $ — $ — $ 136,805
Cash equivalents include funds held in money market instruments and are reported at their current carrying value, which approximates fair value due to the short-term nature of these instruments and are included in cash and cash equivalents in the consolidated balance sheet.
(1)
(1)
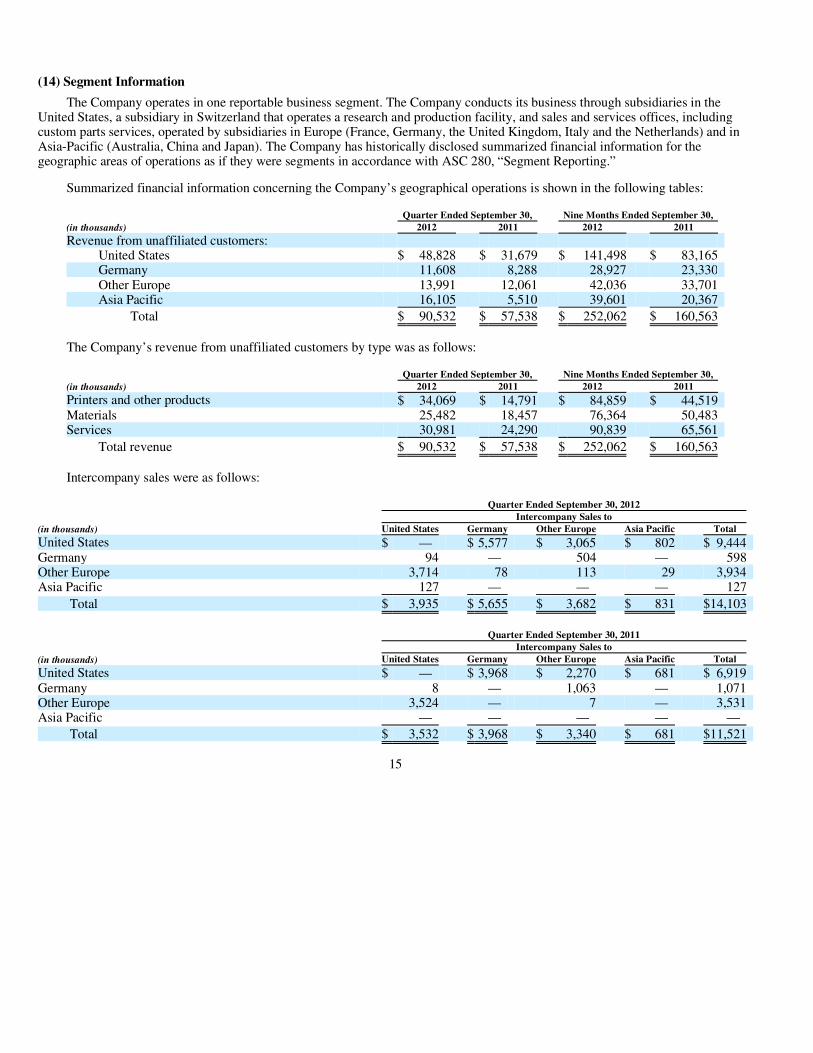
(14) Segment Information The Company operates in one reportable business segment. The Company conducts its business through subsidiaries in the
United States, a subsidiary in Switzerland that operates a research and production facility, and sales and services offices, including custom parts services, operated by subsidiaries in Europe (France, Germany, the United Kingdom, Italy and the Netherlands) and in Asia-Pacific (Australia, China and Japan). The Company has historically disclosed summarized financial information for the geographic areas of operations as if they were segments in accordance with ASC 280, “Segment Reporting.”
Summarized financial information concerning the Company’s geographical operations is shown in the following tables:
The Company’s revenue from unaffiliated customers by type was as follows:
Intercompany sales were as follows:
15
Quarter Ended September 30, Nine Months Ended September 30, (in thousands) 2012 2011 2012 2011
Revenue from unaffiliated customers:
United States $ 48,828 $ 31,679 $ 141,498 $ 83,165 Germany 11,608 8,288 28,927 23,330 Other Europe 13,991 12,061 42,036 33,701 Asia Pacific 16,105 5,510 39,601 20,367
Total $ 90,532 $ 57,538 $ 252,062 $ 160,563
Quarter Ended September 30, Nine Months Ended September 30, (in thousands) 2012 2011 2012 2011
Printers and other products $ 34,069 $ 14,791 $ 84,859 $ 44,519 Materials 25,482 18,457 76,364 50,483 Services 30,981 24,290 90,839 65,561
Total revenue $ 90,532 $ 57,538 $ 252,062 $ 160,563
Quarter Ended September 30, 2012 Intercompany Sales to (in thousands) United States Germany Other Europe Asia Pacific Total
United States $ — $ 5,577 $ 3,065 $ 802 $ 9,444 Germany 94 — 504 — 598 Other Europe 3,714 78 113 29 3,934 Asia Pacific 127 — — — 127
Total $ 3,935 $ 5,655 $ 3,682 $ 831 $14,103
Quarter Ended September 30, 2011 Intercompany Sales to (in thousands) United States Germany Other Europe Asia Pacific Total
United States $ — $ 3,968 $ 2,270 $ 681 $ 6,919 Germany 8 — 1,063 — 1,071 Other Europe 3,524 — 7 — 3,531 Asia Pacific — — — — —
Total $ 3,532 $ 3,968 $ 3,340 $ 681 $11,521

All revenue between geographic areas is recorded at prices that provide for an allocation of profit (loss) between entities. Income from operations and assets for each geographic area was as follows:
(15) Commitments and Contingencies The Company leases office space under various non-cancelable operating leases. Rent expense under operating leases was
$1,217 and $3,553 for the quarter and nine months ended September 30, 2012, respectively, compared to $652 and $1,921 for the quarter and nine months ended September 30, 2011, respectively.
As of September 30, 2012, the Company has supply commitments with third party assemblers for printer assembly at September 30, 2012 that total $13,062, compared to $9,146 at September 30, 2011.
For certain of the acquisitions, the Company is obligated for deferred purchase price commitments totaling $1,885, which are due in 2012 and 2013. Certain of our recent acquisitions contain earnout provisions under which the sellers of the acquired businesses can earn additional amounts. The total liabilities recorded for these earnouts as of September 30, 2012 was $6,143. As of September 30, 2011, the Company had recorded $5,158 of liabilities for earnouts related to acquisitions. See Note 2 for details of acquisitions and related commitments.
16
Nine Months Ended September 30, 2012 Intercompany Sales to(in thousands) United States Germany Other Europe Asia Pacific Total
United States $ — $ 8,270 $ 6,004 $ 1,539 $15,813 Germany 128 — 1,033 177 1,338 Other Europe 6,661 52 139 122 6,974 Asia Pacific 44 7 — — 51
Total $ 6,833 $ 8,329 $ 7,176 $ 1,838 $24,176
Nine Months Ended September 30, 2011 Intercompany Sales to (in thousands) United States Germany Other Europe Asia Pacific Total
United States $ — $11,265 $ 6,222 $ 2,812 $20,299 Germany 118 — 2,466 — 2,584 Other Europe 9,396 1 19 — 9,416 Asia Pacific — — — — —
Total $ 9,514 $11,266 $ 8,707 $ 2,812 $32,299
Quarter Ended September 30, Nine Months Ended September 30,(in thousands) 2012 2011 2012 2011
Income from operations:
United States $ 11,601 $ 5,840 $ 24,607 $ 12,975 Germany 133 158 949 985 Other Europe 793 1,247 4,225 3,880 Asia Pacific 5,909 1,556 12,528 6,327
Subtotal 18,436 8,801 42,309 24,167 Inter-segment elimination — (10) 96 36
Total $ 18,436 $ 8,791 $ 42,405 $ 24,203
September 30, December 31, (in thousands) 2012 2011
Assets:
United States $ 539,294 $ 346,350 Germany 21,123 20,285 Other Europe 76,703 71,202 Asia Pacific 23,398 25,137
Total $ 660,518 $ 462,974

Litigation The Company had been pursuing patent infringement litigation against EnvisionTEC, Inc. and certain of its related companies
since 2005. During the third quarter of 2012, the parties settled the dispute and the litigation has been dismissed.
In 2010, MSK K.K., a Japanese company, filed a complaint against the Company’s Japanese subsidiary in the Tokyo District Court asserting, among other things, various contract claims associated with two laser sintering machines purchased from the Company’s Japanese subsidiary in 2007. During the third quarter of 2012, the parties settled the dispute and the litigation has been dismissed.
In 2008, DSM Desotech Inc. filed a complaint, which it has subsequently amended, in an action titled DSM Desotech Inc. v. 3D Systems Corporation and 3D Systems, Inc. in the United States District Court for the Northern District of Illinois (Eastern Division) asserting that the Company engaged in anticompetitive behavior with respect to resins used in certain of its stereolithography machines. The complaint further asserted that the Company is infringing upon two of DSM Desotech’s patents relating to stereolithography machines.
The Company filed answers to DSM Desotech’s complaint in which, among other things, the Company denied the material allegations of DSM Desotech’s complaint. In 2010, the Court issued a decision relating to the construction of the claims of the patents-in-suit following a Markman hearing held in 2009. In that decision, the Court generally adopted the claim constructions that the Company proposed.
Fact discovery, including expert discovery, regarding the claims pending in this case concluded in 2011. The Company filed motions for summary judgment in December 2011 that seek rulings in its favor on all of DSM Desotech’s claims in the litigation. As of the date of this Form 10-Q, the Court had ruled on only one of the four motions, denying the Company’s motion.
The Company understands that DSM Desotech estimates the damages associated with its claims to be in excess of $40,000. The Company intends to continue to vigorously contest all the claims asserted by DSM Desotech.
The Company is also involved in various other legal matters incidental to its business. The Company believes, after consulting with counsel, that the disposition of these other legal matters will not have a material effect on our consolidated results of operations or consolidated financial position.
Indemnification In the normal course of business the Company periodically enters into agreements to indemnify customers or suppliers against
claims of intellectual property infringement made by third parties arising from the use of the Company’s products. Historically, costs related to these indemnification provisions have not been significant and we are unable to estimate the maximum potential impact of these indemnification provisions on our future results of operations.
To the extent permitted under Delaware law, the Company indemnifies directors and officers for certain events or occurrences while the director or officer is, or was serving, at the Company’s request in such capacity, subject to limited exceptions. The maximum potential amount of future payments we could be required to make under these indemnification obligations is unlimited; however, the Company has directors and officers insurance coverage that may enable the Company to recover future amounts paid, subject to a deductible and the policy limits. There is no assurance that the policy limits will be sufficient to cover all damages, if any.
(16) Subsequent Events In October 2012, the Company acquired the shares of TIM The Innovative Modelmakers B.V. (“TIM”). TIM, located in the
Netherlands, is a full service provider of on-demand custom parts services. The Company plans to integrate TIM into its European on-demand parts services and future revenue from this acquisition will be reported in services revenue. The TIM acquisition is not significant to the Company’s financial statements. See Note 2.
In October 2012, the Company acquired the shares of INUS Technology, Inc., located in Korea, a developer of scan-to-CAD and inspection software tools, known as Rapidform (“Rapidform”). Future revenue from this acquisition will be reported in printers and other products revenue. The Rapidform acquisition is not significant to the Company’s financial statements. See Note 2.
17
®

Item 2. Management’s Discussion and Analysis of Financial Condition and Results of Operations. This discussion should be read in conjunction with the unaudited condensed consolidated financial statements and the notes
thereto included in Item 1 of this Quarterly Report on Form 10-Q (“Form 10-Q”).
We are subject to a number of risks and uncertainties that may affect our future performance that are discussed in greater detail in the sections entitled “Forward-Looking Statements” and “Cautionary Statements and Risk Factors” at the end of this Item 2 and that are discussed or referred to in Item 1A of Part II of this Form 10-Q.
Business Overview We are a global provider of three-dimensional (“3D”) content-to-print solutions including 3D printers, print materials, on-
demand custom parts services and creative content development, design productivity tools and curation services and downloads for professionals and consumers alike. Our integrated solutions enable complex three-dimensional objects to be produced directly from 3D digital data without tooling, greatly reducing the time and cost required to produce prototypes or customized production parts. Through our custom parts services, which consists of our 3Dproparts™ and Quickparts brands, we also supply a wide variety of custom-made plastic and metal parts as well as assembly and production jigs, fixtures and casting patterns in different finishes and colors through a growing network of custom parts service locations.
We derive our consolidated revenue primarily from the sale of our printers, the sale of the related print materials used by the printers to produce solid objects and the provision of printer services and custom parts services to our customers.
Recent Developments We have continued to execute on our strategic initiatives, including growing our on-demand custom parts services, accelerating
personal, professional and production 3D printer penetration by expanding our distribution channel of reseller partners, continuing to expand our healthcare solutions offerings and continuing to execute on our initiative to build 3D consumer content products and services. We also recently announced a new 3D authoring solutions growth initiative, which is to combine scan-data capture, mesh processing, auto-surfacing and CAD modeling into a single platform.
During the third quarter, we announced the immediate availability of our new ProJet™ 5000 3D printer. The ProJet™ 5000 is a large format professional 3D printer designed for production durability and productivity, in a compact, quiet, easy-to-use format. It prints at speeds twice as fast as the previous version and offers the highest resolution available in its class.
In connection with our consumer solutions initiative, we acquired Viztu Technologies, the developer of Hypr3D™, an online platform that allows anyone to turn their pictures and videos into printable 3D creations. We have integrated Viztu into our consumer solutions products and services. We also launched Cubify Invent, the first 3D design tool developed specifically with 3D printing in mind, empowering users to easily turn ideas into reality, and several new Cubify apps for game-like creation of personalized 3D printed items.
In support of our on-demand parts initiative, we acquired TIM The Innovative Modelmakers B.V. (“TIM”) in October. TIM is a full service provider of on-demand custom parts services located in the Netherlands.
During October, in connection with our new 3D authoring growth initiative, we acquired INUS Technology, Inc., a global provider of 3D scan-to-CAD and inspection software tools known as Rapidform (“Rapidform”). Rapidform is located in Seoul, South Korea and we plan to integrate it into our printers and other products revenue.
Also in October, we launched a new material, VisiJet Jewel, formulated for high volume jewelry production. VisiJet Jewel enables manufacturers worldwide to produce master models for cost effective direct casting of jewelry with detail, accuracy and quality, and the high contrast provided by the material enables detailed visual inspection of designs and patterns.
Results of Operations Summary of 2012 financial results Our operating activities generated $44.0 million of cash during the first nine months of 2012, which is discussed in further detail
below. We used $150.7 million to fund our strategic investing activities, including acquisition of businesses. Financing activities during the first nine months of 2012 provided $111.4 million of cash. In total, our unrestricted cash balance at September 30, 2012 was $183.9 million compared to $179.1 million at December 31, 2011.
18
®
®
®
®
® ®

During the third quarter of 2012 we reported improved revenue and profit results as compared to the third quarter of 2011 as our worldwide businesses continued to expand both organically and through acquisitions. Revenue for the third quarter of 2012 increased by 57.3% over the third quarter of 2011. This increase in revenue was led by a $19.3 million, or 130.3%, increase in sales of printers and other products together with a $7.0 million, or 38.1%, increase in print material sales and a $6.7 million, or 27.5%, increase in services revenue year-over-year. Higher revenue combined with increased selling, general and administrative expenses primarily related to compensation and acquisition expenses and interest expense on the convertible notes resulted in net income of $13.5 million for the third quarter of 2012, compared to net income of $7.2 million for the same period in 2011. Revenue for Z Corp and Vidar for the third quarter of 2012 was $13.3 million and, after taking into account the integration and severance costs, the operating loss for Z Corp and Vidar was $2.2 million.
Printers and other products revenue increased by $19.3 million from the third quarter of 2011, to $34.1 million, both organically and through acquisitions. Printer units increased 121.2%, excluding Cube units, compared to the third quarter of 2011, from both organic growth and acquired growth from the addition of Z Corp and Vidar in 2012.
Print materials sales for the third quarter of 2012 were $25.5 million, an increase of $7.0 million from the third quarter of 2011 as revenue from materials was favorably impacted by continued expansion of printers installed over past periods through both organic growth and acquisitions.
Revenue from services increased by $6.7 million to $31.0 million in the third quarter of 2012 from $24.3 million in the same quarter in 2011. The increase in services revenue reflects revenue from our custom parts services and increased revenue from printer service components, from both organic growth and acquisitions. Service revenue from custom parts services was $20.0 million, or 64.7%, of total service revenue for the third quarter of 2012.
For the third quarter of 2012, healthcare solutions revenue made up 13.3%, or $12.1 million, of our total revenue compared to 12.5%, or $7.2 million, in the third quarter of 2011, primarily due to our increased penetration into healthcare applications and to our acquisition of Vidar. Healthcare solutions revenue includes sales of printers, print materials, and services for hearing aid, dental, medical device and other health-related applications.
Our gross profit in the third quarter and first nine months of 2012 improved by $19.1 million and $52.5 million, respectively, primarily due to our higher level of revenue from increases across all revenue categories, including increased revenue from our higher gross profit margin print materials, coupled with continued cost containment. Our gross profit margin increased to 51.8% in the third quarter of 2012 from 48.3% in the third quarter of 2011 due to product mix, with an increased portion of sales of higher margin print materials, improvements in our cost structure and on-demand parts gross profit margin and the addition of higher margin Z Corp and Vidar printers.
Our total operating expenses increased by $9.4 million in the third quarter of 2012 to $28.4 million from $19.0 million in the 2011 quarter. The increase reflected higher selling, general and administrative expenses primarily due to higher commissions and staffing from our acquisitions, and acquisition and severance costs of $0.3 million during the third quarter of 2012 and $3.0 million during the first nine months of 2012, from which we expect annual savings of $5.0 million to $5.5 million. This is consistent with our previous expectations of achieving between $5.0 million and $10.0 million in synergies. The increase also reflected a $1.6 million increase in research and development expenses related to our new products and consumer solutions development and acquired R&D expenses. We expect to continue to increase operating leverage as we reduce costs as a percent of revenue.
Our operating income for the third quarter of 2012 increased to $18.4 million from $8.8 million in the 2011 quarter. This improvement in operating income improved from higher revenues and increased gross profit, partially offset by higher operating expenses, including acquisition expenses incurred, as discussed below.
19
®

Third quarter comparison of revenue by class of product and service
Table 1 sets forth our change in revenue by class of product and service for the third quarter of 2012 compared to the third quarter of 2011:
Table 1
We earn revenues from the sale of printers and other products, print materials and services. On a consolidated basis, revenue for the third quarter of 2012 increased by $33.0 million, or 57.3%, compared to the third quarter of 2011 primarily due to increased sales of printers from acquired and organic growth, coupled with increased print materials and on-demand parts service revenue from acquired and organic growth.
The increase in revenue from printers and other products compared to the third quarter of 2011 is primarily due to increased printer unit sales volume for the third quarter of 2012, driven by increased demand for personal and professional printers and acquired printers revenue from the Z Corp and Vidar acquisitions that we completed in the first quarter of 2012.
Production printers made up $10.2 million, or 30.5%, of total printers revenue for the third quarter of 2012, compared to $7.8 million, or 52.7% for the third quarter of 2011. This represented a 30.3% increase over the 2011 quarter, all of which was organic growth.
Personal and professional printers made up $23.1 million, or 69.5%, of total printers revenue for the third quarter of 2012, compared to $7.0 million, or 47.3%, for the third quarter of 2011. This represented a 230.9% increase in personal and professional printers revenue over the 2011 quarter, including revenue and units from Z Corp and Vidar which were acquired in 2012.
Due to the relatively high price of certain production printers and a corresponding lengthy selling cycle and relatively low unit volume of these higher priced production printer sales in any particular period, a shift in the timing and concentration of orders and shipments of a few printers from one period to another can significantly affect reported revenue in any given period. Revenue reported for printers sales in any particular period is also affected by revenue recognition rules prescribed by generally accepted accounting principles. The shift of production printer revenue to a lower percentage of total printer revenue and professional printers making up a larger percentage of printer revenue is consistent with our ongoing plan to accelerate printer adoption by introducing lower priced printers and is partially due to the acquisition of Z Corp and Vidar in 2012, which added only personal and professional printers.
The $7.0 million increase in revenue from print materials was aided by the improvement in printers sales and by the continued expansion of printers installed over past periods and by increased materials sales from the acquisitions of RenShape and Z Corp print materials. Sales of integrated materials represented 63.2% of total materials revenue in the third quarter of 2012 compared to 53.3% in the third quarter of 2011.
The increase in services revenue primarily reflects revenue from our on-demand parts services from both organic growth and acquisitions. Service revenue from on-demand parts services was $20.0 million, or 64.7% of total service revenue for the third quarter of 2012 compared to $15.6 million, or 64.4% of total service revenue in the 2011 period.
For both the third quarter of 2012 and 2011, Z Corp and Vidar had $13.3 million of revenue. If Z Corp and Vidar had been included in our revenue for 2011, our overall corporate growth rate would have been 27.7%.
Excluding revenue of all acquired businesses that we have owned for less than one year, our organic growth rate for the third quarter of 2012 was 26.2%.
At September 30, 2012 our backlog was $9.3 million, compared to backlogs of $8.3 million at December 31, 2011 and $11.3 million at September 30, 2011. Production and delivery of our printers is generally not characterized by long lead times, backlog is more dependent on timing of customers requested delivery. In addition, custom parts services lead time and backlog depends on whether orders are for rapid prototyping or longer-range production runs. The September 30, 2012 backlog was well distributed with a significant portion from each of our revenue categories and included personal, professional and production printers, as well as from print materials and on-demand parts. The backlog at September 30, 2012 includes $5.5 million of custom parts services orders, compared to $6.3 million at September 30, 2011.
20
(Dollars in thousands) Printers and Other
Products Print Materials Services TotalsRevenue – 3rd quarter 2011 $ 14,791 25.7% $18,457 32.1% $24,290 42.2% $ 57,538 100%
Change in revenue: Volume
Core products and services 56,882 384.5 (2,137) (11.6) 7,032 29.1 61,777 107.4 New products and services 11,341 76.7 6,976 37.8 490 2.0 18,807 32.7
Price/Mix (48,199) (325.9) 2,951 16.0 — — (44,538) (78.6) Foreign currency translation (746) (5.0) (765) (4.1) (831) (3.4) (2,342) (4.1)
Net change 19,278 130.4 7,025 38.1 6,691 27.5 32,994 57.3
Revenue – 3rd quarter 2012 $ 34,069 37.6% $25,482 28.1% $30,981 34.2% $ 90,532 100%
®

In addition to changes in sales volumes, including the impact of revenue from acquisitions, there are two other primary drivers of changes in revenues from one period to another: the combined effect of changes in product mix and average selling prices, sometimes referred to as price and mix effects, and the impact of fluctuations in foreign currencies.
As used in this Management’s Discussion and Analysis, the price and mix effects relate to changes in revenue that are not able to be specifically related to changes in unit volume. Among these changes are changes in the product mix of our materials and our systems as the trend toward smaller, lower-priced printers has continued and the influence of new printers and print materials on our operating results has grown.
Change in third quarter revenue by geographic region Each geographic region contributed to our higher level of revenue in third quarter of 2012. Table 2 sets forth the change in
revenue by geographic area for the third quarter of 2012 compared to the third quarter of 2011:
Table 2
Revenue from U.S. operations in the third quarter of 2012 increased by $17.1 million, or 54.1%, to $48.8 million in 2012 from $31.7 million in the third quarter of 2011. The increase was due to higher volume, partially offset by the unfavorable combined effect of price and mix.
Revenue from non-U.S. operations in the third quarter of 2012 increased by $15.8 million, or 61.3%, to $41.7 million from $25.9 million in 2011. Revenue from non-U.S. operations as a percent of total revenue was 46.1% and 45.0%, respectively, at September 30, 2012 and 2011. The increase in non-U.S. revenue, excluding the effect of foreign currency translation, was 70.3% in the third quarter of 2012 compared to 3.8% in the third quarter of 2011.
Revenue from European operations increased by $5.3 million, or 25.8%, to $25.6 million from $20.3 million in the prior year period. This increase was due to a $10.1 million increase in volume, partially offset by $2.4 million unfavorable combined effect of price and mix and a $2.4 million unfavorable impact of foreign currency translation.
Revenue from Asia-Pacific operations increased by $10.6 million, or 192.3%, to $16.1 million from $5.5 million in the prior year period due primarily to the favorable $11.2 million increase in volume combined with a $0.1 million favorable impact of foreign currency translation, partially offset by a $0.7 million unfavorable combined effect of price and mix.
Gross profit and gross profit margins Table 3 sets forth gross profit and gross profit margin for our products and services for the third quarters of 2012 and 2011:
Table 3
21
(Dollars in thousands) U.S. Europe Asia-Pacific Total
Revenue – 3rd quarter 2011 $ 31,679 55.0% $20,349 35.4% $ 5,510 9.6% $ 57,538 100%
Change in revenue:
Volume 59,290 187.1 10,114 49.7 11,180 202.9 80,584 140.0 Price/Mix (42,141) (133.0) (2,395) (11.8) (712) (12.9) (45,248) (78.6) Foreign currency translation — — (2,469) (12.1) 127 2.3 (2,342) (4.1) Net change 17,149 54.1 5,250 25.8 10,595 192.3 32,994 57.3
Revenue – 3rd quarter 2012 $ 48,828 53.9% $25,599 28.3% $16,105 17.8% $ 90,532 100%
Quarter Ended September 30, 2012 2011
(Dollars in thousands) Gross Profit Gross Profit
Margin Gross Profit Gross Profit
Margin
Printers and other products $ 15,412 45.2% $ 5,257 35.5% Print materials 17,410 68.3 11,981 64.9 Services 14,057 45.4 10,525 43.3
Total $ 46,879 51.8% $ 27,763 48.3%

On a consolidated basis, gross profit for the third quarter of 2012 increased by $19.1 million to $46.9 million from $27.8 million in the third quarter of 2011, primarily as a result of higher sales from all revenue categories and an increase in our gross profit margin, as discussed below.
Consolidated gross profit margin in the third quarter of 2012 increased by 3.5 percentage points to 51.8% of revenue from 48.3% of revenue for the 2011 quarter. The higher gross profit margin reflected improvements in printers gross profit margin due to the addition of higher margin Z Corp and Vidar printers coupled with our initiative to expand gross profit margins on all professional printers, which more than offset the lower gross profit margin personal printers. The higher gross profit margin also reflected improvements in print materials and services margins.
Printers and other products gross profit for the third quarter of 2012 increased to $15.4 million from $5.3 million for the 2011 quarter due to higher revenue and expanded gross profit margin. Gross profit margin for printers increased by 9.7 percentage points to 45.2% from 35.5% in the 2011 quarter primarily due to the addition of higher gross profit margin Z Corp and Vidar printers coupled with our initiative to expand gross profit margins on all professional printers and due to increased sales of software and products with higher gross profit margins, which more than offset the lower margin printers.
Print materials gross profit for the third quarter of 2012 increased by $5.4 million, or 45.3%, to $17.4 million from $12.0 million for the 2011 quarter, and gross profit margin for print materials increased by 3.4 percentage points to 68.3% from 64.9% in the 2011 quarter primarily due to the favorable shift of the mix of materials towards higher gross profit margin personal and professional print materials and integrated materials.
Gross profit for services for the third quarter of 2012 increased by $3.6 million, or 33.6%, to $14.1 million from $10.5 million for the 2011 quarter, and gross profit margin for services increased by 2.1 percentage points to 45.4% from 43.3% in the 2011 quarter. The increase in gross profit was due primarily to higher levels of revenue from all categories. The increase in gross profit margin for services is primarily due to the increase in gross profit margin on printer services and increased revenue from higher gross profit margin consumer services. On-demand custom parts services gross profit margin improved to 42.5% for the third quarter of 2012 from 42.4% in the third quarter of 2011. Printer services had a gross profit margin of 48.8% compared to 46.5% for the third quarter of 2011.
Operating expenses As shown in Table 4, total operating expenses increased by $9.4 million, or 49.9%, to $28.4 million in the third quarter of 2012
from $19.0 million in the third quarter of 2011. This increase was due to higher selling, general and administrative expenses and higher research and development expenses, both of which are discussed below.
Table 4
Selling, general and administrative expenses increased by $7.8 million to $22.9 million in the third quarter of 2012 compared to $15.1 million in the third quarter of 2011, and decreased to 25.3% of revenue in 2012 compared to 26.2% for 2011. The increase was due primarily to a $3.9 million increase in compensation costs due to commissions on higher revenues and higher staffing from acquisitions and continued investment in our consumer growth initiative. SG&A expenses included $0.3 million of acquisition and severance expenses. Additionally, SG&A expenses were impacted by a $2.2 million increase in amortization expense due to acquired intangibles, a $0.9 million increase in marketing expenses and a $0.5 million increase in occupancy costs related to additional acquired locations, partially offset by a $1.9 million improvement in legal expenses.
Research and development expenses increased by $1.6 million, or 43.2%, to $5.5 million in the third quarter of 2012 from $3.9 million in the third quarter of 2011. This increase was principally due to a $1.2 million increase in compensation expense and a $0.2 million increase in building rent in the 2012 quarter related to new products and consumer solutions development.
22
Quarter Ended September 30, 2012 2011 (Dollars in thousands) Amount % Revenue Amount % Revenue
Selling, general and administrative expenses $22,900 25.3% $15,100 26.2% Research and development expenses 5,543 6.1 3,872 6.7
Total operating expenses $28,443 31.4% $18,972 32.9%

Income from operations Our income from operations of $18.4 million for the third quarter of 2012 improved from $8.8 million in 2011. See Gross profit
and gross profit margins and Operating expenses above.
The following table sets forth operating income by geographic area for the third quarter of 2012 compared to 2011:
Table 5
With respect to the U.S., in 2012 and 2011, the changes in operating income by geographic area reflected the same factors discussed above in Gross profit and gross profit margins and Operating expenses.
As most of our operations outside the U.S. are conducted through sales and marketing subsidiaries, the changes in operating income in our operations outside the U.S. in 2012 and 2011 resulted primarily from changes in transfer pricing which is a function of revenue levels. Asia Pacific operating income also benefitted from our revenue growth and the acquisition completed in the fourth quarter of 2011.
Interest and other expense, net Interest and other expense, net was $2.2 million in the third quarter of 2012 compared with $0.7 million in the 2011 quarter. The
higher interest and other expense primarily reflected the interest related to the senior convertible notes issued in the fourth quarter of 2011, which amounted to $3.2 million of interest expense, of which $1.0 million represents non-cash amortization. Interest and other expense, net in the third quarter of 2012 also reflected a net gain on acquisition and litigation settlements of $1.5 million, a loss on conversion of convertible notes of $1.2 million and foreign exchange gain of $0.7 million. The $0.7 million of interest and other expense, net in the third quarter of 2011 reflected foreign exchange losses of $0.6 million and $0.1 million of interest expense, partially offset by a nominal amount of interest and other income.
Provision for income taxes We recorded a $2.8 million provision for income taxes in the third quarter of 2012 and a $0.9 million provision for income taxes
in the third quarter of 2011. Our 2012 provision for income taxes reflects deferred U.S. income taxes associated with the use of net operating loss carryforwards and tax expense associated with income taxes in non-U.S. jurisdictions. The 2011 provision for income taxes primarily reflects tax expense associated with income taxes in non-U.S. jurisdictions.
We utilized U.S. net deferred tax assets, specifically net operating loss carryforwards and U.S. federal tax credits, in determining the effective tax rate for the year. This resulted in a reduction of our effective tax rate. Absent the use of these net operating loss carryforwards and tax credits, income tax expense would have been $5.8 million and the income tax rate would have been 35.9 percent. Due to our U.S. net operating loss carryforwards, our rate of cash taxes was 6.5 percent of taxable income.
Our U.S. deferred income tax assets, against which there is a valuation allowance, have been partially utilized in determining the effective tax rate for 2012, with the remainder offset by the recognition of $18.4 million of deferred income tax liabilities from the acquisitions of Z Corp, Vidar, My Robot Nation, Bespoke and Viztu. We will continue our ongoing review of actual results and anticipated future earnings, and their impact on future releases of valuation allowances. As of September 30, 2012, the Company has a $9.3 million valuation allowance remaining on its U.S. net deferred tax assets.
23
Quarter Ended September 30, (Dollars in thousands) 2012 2011 Income from operations
United States $ 11,601 $ 5,840 Germany 133 158 Other Europe 793 1,247 Asia Pacific 5,909 1,556
Subtotal 18,436 8,801 Inter-segment elimination — (10)
Total $ 18,436 $ 8,791

Net income Our net income for the third quarter of 2012 increased $6.3 million to $13.5 million compared to $7.2 million in the third quarter
of 2011. The principal reasons for the increase, which are discussed in more detail above, were:
For the quarter ended September 30, 2012, average common shares for basic and diluted earnings per share were 55.9 million and 56.6 million, respectively, and basic and diluted earnings per share were $0.24. For the quarter ended September 30, 2011, average common shares for basic and diluted earnings per shares were 50.5 million and 51.4 million, respectively, and basic and diluted earnings per share were $0.14.
Results of Operations – Nine Months Comparison Nine months comparison of revenue by class of product and service Table 6 sets forth our change in revenue by class of product and service for the first nine months of 2012 compared to the first
nine months of 2011:
Table 6
We earn revenues from the sale of printers and other products, print materials and services. On a consolidated basis, revenue for the first nine months of 2012 increased by $91.5 million, or 57.0%, compared to the first nine months of 2011 across all revenue categories, from acquired and organic growth.
The increase in revenue from printers and other products compared to the first nine months of 2011 is primarily due to increased printer unit sales volume for the first nine months of 2012, driven by increased demand for personal and professional printers and acquired printers revenue from the Z Corp and Vidar acquisitions that we completed in the first quarter of 2012.
Production printers made up $25.7 million, or 30.9%, of total printers revenue for the first nine months of 2012, compared to $25.1 million, or 56.4% for the first nine months of 2011.
Personal and professional printers made up $57.4 million, or 69.1%, of total printers revenue for the first nine months of 2012, compared to $19.4 million, or 43.6%, for the first nine months of 2011. This represented a 195.8% increase in personal and professional printers revenue over the 2011 period, including revenue from units from Z Corp and Vidar, which we acquired in 2012.
Due to the relatively high price of certain production printers and a corresponding lengthy selling cycle and relatively low unit volume of these higher priced production printer sales in any particular period, a shift in the timing and concentration of orders and shipments of a few printers from one period to another can significantly affect reported revenue in any given period. Revenue reported for printers sales in any particular period is also affected by revenue recognition rules prescribed by generally accepted accounting principles. The shift of production printer revenue to a lower percentage of total printer revenue and personal and professional printers making up a larger percentage of printer revenue is consistent with our ongoing plan to accelerate printer adoption by introducing lower priced printers and is partially due to the acquisition of Z Corp and Vidar in 2012, which added only personal and professional printers.
24
• the $9.6 million increase in operating income; partially offset by
• the $1.9 million increase in our tax provision; and
• the $1.5 million increase in interest and other expense.
(Dollars in thousands) Printers and Other
Products Print Materials Services Total
Revenue – nine months 2011 $ 44,519 27.7% $50,483 31.4% $65,561 40.9% $160,563 100%
Change in revenue:
Volume
Core products and services 111,190 249.8 (1,903) (3.7) 25,876 39.5 135,163 84.2 New products and services 15,524 34.9 21,671 42.9 1,296 2.0 38,491 24.0
Price/Mix (84,521) (189.9) 7,787 15.4 — — (76,734) (47.8) Foreign currency translation (1,853) (4.2) (1,674) (3.3) (1,894) (2.9) (5,421) (3.4)
Net change 40,340 90.6 25,881 51.3 25,278 38.6 91,499 57.0
Revenue – nine months 2012 $ 84,859 33.7% $76,364 30.3% $90,839 36.0% $252,062 100%

The $25.9 million increase in revenue from print materials was aided by the improvement in printers sales and by the continued expansion of printers installed over past periods and by increased materials sales from the acquisitions of RenShape and Z Corp print materials. Sales of integrated materials represented 62.7% of total materials revenue in the first nine months of 2012 compared to 52.3% in the first nine months of 2011.
The increase in services revenue primarily reflects revenue from our on-demand parts services from both organic growth and acquisitions. Service revenue from on-demand parts services was $58.3 million, or 64.1% of total service revenue for the first nine months of 2012 compared to $40.1 million, or 61.1% of total service revenue in the 2011 period.
For the first nine months of 2012, Z Corp and Vidar contributed $40.2 million of revenue. For the first nine months of 2011, Z Corp and Vidar had revenue of $40.8 million. If Z Corp and Vidar had been included in our revenue for 2011, our overall corporate growth rate would have been 25.2%.
Excluding revenue of all acquired businesses that we have owned for less than one year, our organic growth rate for the first nine months of 2012 was 24.0%.
In addition to changes in sales volumes, including the impact of revenue from acquisitions, there are two other primary drivers of changes in revenues from one period to another: the combined effect of changes in product mix and average selling prices, sometimes referred to as price and mix effects, and the impact of fluctuations in foreign currencies.
As used in this Management’s Discussion and Analysis, the price and mix effects relate to changes in revenue that are not able to be specifically related to changes in unit volume. Among these changes are changes in the product mix of our materials and our systems as the trend toward smaller, lower-priced printers has continued and the influence of new printers and print materials on our operating results has grown.
Change in first nine months revenue by geographic region Each geographic region contributed to our higher level of revenue in first nine months of 2012. Table 7 sets forth the change in
revenue by geographic area for the first nine months of 2012 compared to the first nine months of 2011:
Table 7
Revenue from U.S. operations increased by $58.3 million, or 70.1%, to $141.5 million in 2012 from $83.2 million in the first nine months of 2011. The increase was due to higher volume, partially offset by the unfavorable combined effect of price and mix.
Revenue from non-U.S. operations in the first nine months of 2012 increased by $33.2 million, or 42.9%, to $110.6 million from $77.4 million in 2011. Revenue from non-U.S. operations as a percent of total revenue was 43.9% and 48.2%, respectively, for the first nine months of 2012 and 2011. The increase in non-U.S. revenue, excluding the effect of foreign currency translation, was 49.9% in the first nine months of 2012 compared to 24.5% in the first nine months of 2011.
Revenue from European operations increased by $14.0 million, or 24.4%, to $71.0 million from $57.0 million in the prior year period. This increase was due to a $26.5 million increase in volume, partially offset by $6.5 million unfavorable combined effect of price and mix and a $6.0 million unfavorable impact of foreign currency translation.
Revenue from Asia-Pacific operations increased by $19.2 million, or 94.4%, to $39.6 million from $20.4 million in the prior year period due primarily to the favorable $21.6 million increase in volume combined with a $0.6 million favorable impact of foreign currency translation, partially offset by a $3.0 million unfavorable combined effect of price and mix.
25
(Dollars in thousands) U.S. Europe Asia-Pacific Total
Revenue – nine months 2011 $ 83,165 51.8% $57,031 35.5% $20,367 12.7% $160,563 100%
Change in revenue:
Volume 125,467 150.8 26,511 46.5 21,676 106.4 173,654 108.2 Price/Mix (67,134) (80.7) (6,590) (11.6) (3,010) (14.8) (76,734) (47.8) Foreign currency translation — — (5,989) (10.5) 568 2.8 (5,421) (3.4)
Net change 58,333 70.1 13,932 24.4 19,234 94.4 91,499 57.0
Revenue – nine months 2012 $141,498 56.1% $70,963 28.2% $39,601 15.7% $252,062 100%
®
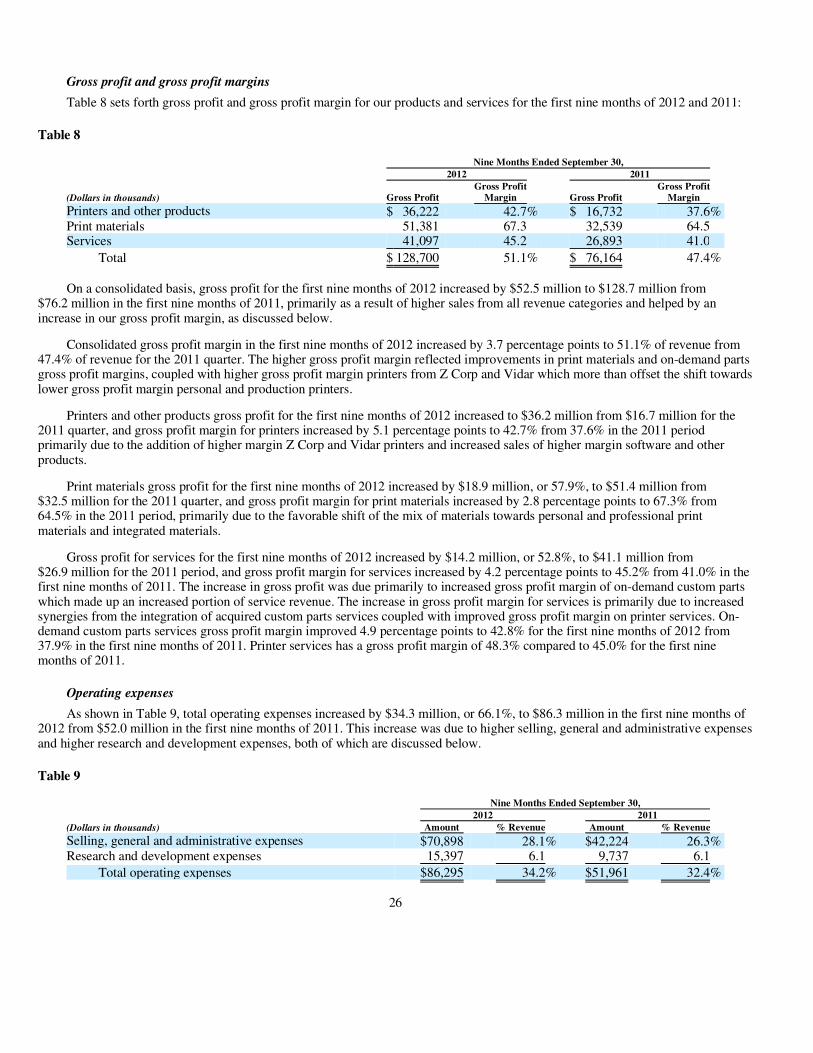
Gross profit and gross profit margins
Table 8 sets forth gross profit and gross profit margin for our products and services for the first nine months of 2012 and 2011:
Table 8
On a consolidated basis, gross profit for the first nine months of 2012 increased by $52.5 million to $128.7 million from $76.2 million in the first nine months of 2011, primarily as a result of higher sales from all revenue categories and helped by an increase in our gross profit margin, as discussed below.
Consolidated gross profit margin in the first nine months of 2012 increased by 3.7 percentage points to 51.1% of revenue from 47.4% of revenue for the 2011 quarter. The higher gross profit margin reflected improvements in print materials and on-demand parts gross profit margins, coupled with higher gross profit margin printers from Z Corp and Vidar which more than offset the shift towards lower gross profit margin personal and production printers.
Printers and other products gross profit for the first nine months of 2012 increased to $36.2 million from $16.7 million for the 2011 quarter, and gross profit margin for printers increased by 5.1 percentage points to 42.7% from 37.6% in the 2011 period primarily due to the addition of higher margin Z Corp and Vidar printers and increased sales of higher margin software and other products.
Print materials gross profit for the first nine months of 2012 increased by $18.9 million, or 57.9%, to $51.4 million from $32.5 million for the 2011 quarter, and gross profit margin for print materials increased by 2.8 percentage points to 67.3% from 64.5% in the 2011 period, primarily due to the favorable shift of the mix of materials towards personal and professional print materials and integrated materials.
Gross profit for services for the first nine months of 2012 increased by $14.2 million, or 52.8%, to $41.1 million from $26.9 million for the 2011 period, and gross profit margin for services increased by 4.2 percentage points to 45.2% from 41.0% in the first nine months of 2011. The increase in gross profit was due primarily to increased gross profit margin of on-demand custom parts which made up an increased portion of service revenue. The increase in gross profit margin for services is primarily due to increased synergies from the integration of acquired custom parts services coupled with improved gross profit margin on printer services. On-demand custom parts services gross profit margin improved 4.9 percentage points to 42.8% for the first nine months of 2012 from 37.9% in the first nine months of 2011. Printer services has a gross profit margin of 48.3% compared to 45.0% for the first nine months of 2011.
Operating expenses As shown in Table 9, total operating expenses increased by $34.3 million, or 66.1%, to $86.3 million in the first nine months of
2012 from $52.0 million in the first nine months of 2011. This increase was due to higher selling, general and administrative expenses and higher research and development expenses, both of which are discussed below.
Table 9
26
Nine Months Ended September 30, 2012 2011
(Dollars in thousands) Gross Profit Gross Profit
Margin Gross Profit Gross Profit
Margin
Printers and other products $ 36,222 42.7% $ 16,732 37.6% Print materials 51,381 67.3 32,539 64.5 Services 41,097 45.2 26,893 41.0
Total $ 128,700 51.1% $ 76,164 47.4%
Nine Months Ended September 30, 2012 2011 (Dollars in thousands) Amount % Revenue Amount % Revenue
Selling, general and administrative expenses $70,898 28.1% $42,224 26.3% Research and development expenses 15,397 6.1 9,737 6.1
Total operating expenses $86,295 34.2% $51,961 32.4%

Selling, general and administrative expenses increased by $28.7 million to $70.9 million in the first nine months of 2012 compared to $42.2 million in the first nine months of 2011, and increased to 28.1% of revenue in 2012 compared to 26.3% for 2011. The increase was due primarily to a $15.8 million increase in compensation costs due to commissions on higher revenues and higher staffing from acquisitions and bonuses associated with the 2012 acquisition and integration activities. SG&A expenses included $3.0 million of acquisition and severance expenses, from which we expect to realize annual savings of $5.0 million to $5.5 million. Additionally, SG&A expenses were impacted by a $6.8 million increase in amortization expense due to acquired intangibles, a $2.3 million increase in marketing expenses and a $1.5 million increase in occupancy costs related to additional acquired locations, a $0.8 million increase in travel expenses and a $1.4 million increase in bad debts and bank fees, partially offset by a $3.4 million improvement in legal expenses.
Research and development expenses increased by $5.7 million, or 58.1%, to $15.4 million in the first nine months of 2012 from $9.7 million in the first nine months of 2011, principally due to a $3.0 million increase in compensation expense and a $1.0 million increase in operating supplies, a $0.5 million increase in R&D materials and supplies and a $0.5 million increase in occupancy costs.
Income from operations Our income from operations of $42.4 million for the first nine months of 2012 improved from $24.2 million in 2011. See Gross
profit and gross profit margins and Operating expenses above.
The following table sets forth operating income by geographic area for the first nine months of 2012 compared to 2011:
Table 10
With respect to the U.S., in 2012 and 2011, the changes in operating income by geographic area reflected the same factors discussed above in Gross profit and gross profit margins and Operating expenses.
As most of our operations outside the U.S. are conducted through sales and marketing subsidiaries, the changes in operating income in our operations outside the U.S. in 2012 and 2011 resulted primarily from changes in transfer pricing which is a function of revenue levels.
Interest and other expense, net Interest and other expense, net was $8.6 million in the first nine months of 2012 compared with $0.5 million in the 2011 period.
The higher interest and other expense, net in 2012 primarily reflected the interest related to the senior convertible notes issued in the fourth quarter of 2011, which amounted to $9.5 million of interest expense, of which $2.9 million represents non-cash amortization. Interest and other expense, net in the first nine months of 2012 also reflected a net gain on acquisition and litigation settlements of $1.5 million, a loss on conversion of convertible notes of $1.2 million and foreign exchange gain of $0.1 million. The $0.5 million of expense, net in the first nine months of 2011 reflected $0.4 million of interest expense and $0.2 million of other expense; partially offset by $0.1 million of other income and a nominal amount of interest income and foreign exchange gain.
Provision for income taxes We recorded a $5.8 million provision for income taxes in the first nine months of 2012 and a $3.7 million benefit for income
taxes in the first nine months of 2011. Our 2012 provision for income taxes reflects deferred U.S. income taxes associated with the use of net operating loss carryforwards and tax expense associated with income taxes in non-U.S. jurisdictions. We released a portion of the valuation allowance related to our U.S. net deferred tax assets during 2011. The 2011 provision for income taxes primarily reflects tax expense associated with income taxes in non-U.S. jurisdictions.
27
Nine Months Ended September 30, (Dollars in thousands) 2012 2011 Income from operations
United States $ 24,607 $ 12,975 Germany 949 985 Other Europe 4,225 3,880 Asia Pacific 12,528 6,327
Subtotal 42,309 24,167 Inter-segment elimination 96 36
Total $ 42,405 $ 24,203

We utilized U.S. net deferred tax assets, specifically net operating loss carryforwards and U.S. federal tax credits, in determining the effective tax rate for the year. This resulted in a reduction our effective tax rate. Absent the use of these net operating loss carryforwards and tax credits, income tax expense would have been $11.7 million and the income tax rate would have been 34.7 percent. Due to our U.S. net operating loss carryforwards, our rate of cash taxes was 9.1 percent of taxable income.
Our U.S. deferred income tax assets, against which there is a valuation allowance, have been partially utilized in determining the effective tax rate for 2012, with the remainder offset by the recognition of $18.4 million of deferred income tax liabilities from the acquisitions of Z Corp, Vidar, My Robot Nation, Bespoke and Viztu. We will continue our ongoing review of actual results and anticipated future earnings, and their impact on future releases of valuation allowances. As of September 30, 2012, the Company has a $9.3 million valuation allowance remaining on its U.S. net deferred tax assets.
Net income Our net income for the first nine months of 2012 increased $0.6 million to $28.0 million compared to $27.4 million in the first
nine months of 2011. The principal reasons for the increase, which are discussed in more detail above, were:
For the nine months ended September 30, 2012, average common shares for basic and diluted earnings per share were 52.7 million and 53.5 million, respectively, and basic and diluted earnings per share were $0.53 and $0.52, respectively. For the nine months ended September 30, 2011, average common shares for basic and diluted earnings per shares were 49.5 million and 50.5 million, respectively, and basic and diluted earnings per share were $0.55 and $0.54, respectively.
Other Financial Information In addition to our results determined under U.S. generally accepted accounting principles (“GAAP”) discussed above,
management believes non-GAAP financial measures, which adjust net income and earnings per share are useful to investors in evaluating our operating performance.
We use non-GAAP financial measures of adjusted net income and adjusted earnings per share to supplement our unaudited condensed consolidated financial statements presented on a GAAP basis to facilitate a better understanding of the impact that several strategic acquisitions had on our financial results.
These non-GAAP financial measures have not been prepared in accordance with GAAP and may be different from non-GAAP financial measures used by other companies and they are subject to inherent limitations as they reflect the exercise of judgments by our management about which costs, expenses and other items are excluded from our GAAP financial statements in determining our non-GAAP financial measures. We have sought to compensate for these limitations by analyzing current and expected future results on a GAAP basis as well as a non-GAAP basis and also by providing GAAP financial statements as required in our public disclosures as well as reconciliations of our non-GAAP financial measures of adjusted net income and adjusted earnings per share to our GAAP financial statements.
The presentation of our non-GAAP financial measures which adjust net income and earnings per share are not meant to be considered in isolation or as a substitute for the directly comparable financial measures prepared in accordance with GAAP. These non-GAAP financial measures are meant to supplement, and be viewed in conjunction with, GAAP financial measures. We urge investors to review the reconciliation of our non-GAAP financial measures to the comparable GAAP financial measures included below, and not to rely on any single financial measure to evaluate our business.
Our non-GAAP financial measures, which adjust net income and earnings per share, are adjusted for the following: Stock-based compensation expenses. We exclude the tax-effected stock-based compensation expenses primarily because
they are non-cash.
Amortization of intangibles. We exclude the tax-effected amortization of intangible assets. The increase in recent periods is primarily in connection with acquisitions of businesses.
Acquisition and severance expenses. We exclude the tax-effected charges associated with the acquisition of businesses and the related severance expenses.
28
• the $18.2 million increase in operating income as discussed above; partially offset by
• the $9.5 million increase in our tax provision; and
• the $8.1 million increase in interest and other expense, net.

Non-cash interest expenses. We exclude tax-effected, non-cash interest expenses, primarily related to the amortization costs associated with our outstanding senior convertible notes.
Release of valuation allowance on deferred tax assets. We exclude the tax-effected, non-cash benefit of the releases of portions of the valuation allowance on deferred tax assets.
Loss on conversion of convertible notes. We exclude the tax-effected, loss on conversion of convertible notes.
Net gain on acquisitions and litigation settlements. We exclude the tax-effected, net gain or loss on acquisitions and litigation settlements.
Reconciliation of GAAP Net Income to Non-GAAP Financial Measures Table 11
Financial Condition and Liquidity Table 12
Our unrestricted cash and cash equivalents increased by $4.8 million to $183.9 million at September 30, 2012 from $179.1 million at December 31, 2011. We generated $44.0 million of cash from operating activities. Cash from operations consisted of $28.0 million net income, including $28.3 million of non-cash charges and $12.3 million of cash used by net changes in operating accounts, including a $10.0 million benefit due to a timing difference in accrued liabilities at September 30, 2012 that will reverse in the fourth quarter. We used $150.7 million of cash in investing activities. See Cash flow and Capitalized lease obligations below.
Cash equivalents comprise funds held in money market instruments and are reported at their current carrying value, which approximates fair value due to the short-term nature of these instruments. We minimize our credit risk by investing primarily in investment grade, liquid instruments and limit exposure to any one issuer depending on credit quality.
29
Quarter Ended September 30, Nine Months Ended September 30, (Dollars in thousands, except per share) 2012 2011 2012 2011
GAAP net income $ 13,517 $ 7,220 $ 28,029 $ 27,415 Stock-based compensation 1,035 593 3,296 1,827 Amortization of intangibles 2,709 855 8,558 2,807 Acquisition and severance expenses 232 445 2,967 1,151 Non-cash interest expense 863 — 2,632 — Loss on convertible notes 1,096 — 1,096 — Net gain on acquisitions and litigation settlements (1,296) — (1,296) — Release of valuation allowance on deferred tax
assets — — — (6,221)
Non-GAAP adjusted net income $ 18,156 $ 9,113 $ 45,282 $ 26,979
Non-GAAP adjusted basic earnings per share $ 0.33 $ 0.18 $ 0.86 $ 0.55
Non-GAAP adjusted diluted earnings per share $ 0.32 $ 0.18 $ 0.85 $ 0.53
(a) Represents amortization expense for the quarter ended September 30, 2012 and 2011, of which $0.1 million each period is included in cost of sales and the remaining $2.6 million and $0.8 million, respectively, is included in operating expenses.
(b) Represents amortization expense for the nine months ended September 30, 2012 and 2011, of which $0.1 million and $0.2 million, respectively, is included in cost of sales and the remaining $8.5 million and $2.6 million, respectively, is included in operating expenses.
(Dollars in thousands) September 30, 2012 December 31, 2011 Cash and cash equivalents $ 183,931 $ 179,120 Working capital $ 222,299 $ 202,357 Total stockholders’ equity $ 416,490 $ 254,788
(a) (b)

Our net working capital increased by $19.9 million to $222.3 million at September 30, 2012 from $202.4 million at December 31, 2011, primarily due to the factors discussed below.
Our unrestricted cash and cash equivalents increased by $4.8 million to $183.9 million at September 30, 2012 from $179.1 million at December 31, 2011. This increase primarily was due to cash from operations of $44.0 million and $111.4 million from financing activities in the first nine months of 2012 which included $106.9 million of net proceeds from our common stock offering completed in the second quarter of 2012, partially offset by $150.7 million of net cash used in investing activities.
Accounts receivable, net, increased by $18.6 million to $69.8 million at September 30, 2012 from $51.2 million at December 31, 2011. Our gross accounts receivable increased by $20.7 million from December 31, 2011, primarily due to acquiring the receivables of ZCorp and Vidar and our changing business model, which includes higher revenue from custom parts services and materials, both of which are generally sold on credit terms and which make up a larger percent of our total sales. With an increased portion of our sales on credit terms, our days sales outstanding increased to 71 days at September 30, 2012 from 67 days at December 31, 2011 and accounts receivable more than 90 days past due decreased to 8.2% of gross receivables from 11.9% at December 31, 2011.
Inventories, net increased by $16.0 million to $41.3 million at September 30, 2012 from $25.3 million at December 31, 2011. This increase resulted primarily from a $14.1 million increased in raw materials inventory and a $2.4 million increase in finished goods inventory due to the acquisition of Z Corp and Vidar and due to the timing of sales and revenue recognition at quarter-end, which also impacts our backlog. We maintained $3.8 million of inventory reserves at September 30, 2012 and $2.5 million of such reserves at December 31, 2011.
The majority of our inventory consists of finished goods, including primarily printers, print materials and service parts. Inventory also consists of raw materials and spare parts for the in-house assembly and support service for personal and professional 3D printers. We outsource the assembly and refurbishment of production printers; therefore, we generally do not hold in inventory most parts for production printer assembly or refurbishment.
Accounts payable increased by $0.8 million to $26.7 million at September 30, 2012 from $25.9 million at December 31, 2011. The increase primarily related to the normal timing of our scheduled expense payments, an increase in payables related to our acquisition of Z Corp and Vidar, and the increase in inventories, which is explained above.
Accrued and other liabilities increased by $16.8 million to $33.6 million at September 30, 2012 from $16.8 million at December 31, 2011. This increase is primarily due to the benefit of a $10.0 million accrual due to a timing difference which will reverse in the next quarter. Accrued liabilities also increased due to an increase in accrued compensation related to higher compensation cost and an increase in earnouts related to acquisitions.
The changes in the first nine months of 2012 that make up the other components of working capital not discussed above arose in the ordinary course of business.
Differences between the amounts of working capital item changes in the cash flow statement and the balance sheet changes for the corresponding items are primarily the result of foreign currency translation adjustments.
We have relied on our unrestricted cash, cash flow from operations and capital markets transactions to meet our cash requirements for working capital, capital expenditures and acquisitions. However, it is possible that we may need to raise additional funds to finance our activities beyond the next twelve months or to consummate significant acquisitions of other businesses, assets, products or technologies. If needed, we may be able to raise such funds by issuing equity or debt securities to the public or selected investors, or by borrowing from financial institutions, selling assets or restructuring debt.
Cash flow Table 12 summarizes the cash provided by or used in operating activities, investing activities and financing activities, as well as the
effect of changes in foreign currency exchange rates on cash, for the first nine months of 2012 and 2011.
Table 13
30
Nine Months Ended September 30, 2012 2011 (Dollars in thousands) Cash provided by operating activities $ 44,011 $ 18,783 Cash used in investing activities (150,715) (47,430) Cash provided by financing activities 111,351 64,071 Effect of exchange rate changes on cash 164 (156)
Net increase in cash and cash equivalents $ 4,811 $ 35,268

Cash flow from operating activities
For the nine months ended September 30, 2012, our operating activities provided $44.0 million of net cash. This source of cash consisted primarily of net income plus the effects of non-cash items and changes in working capital, which are described above.
For the nine months ended September 30, 2011, our operating activities provided $18.8 million of net cash. This source of cash consisted of our $27.4 million net income, $5.4 million of non-cash items included in our net income and $14.0 million of cash used by net changes in operating accounts.
Cash flow from investing activities Net cash used in investing activities in the first nine months of 2012 increased to $150.7 million from $47.4 million for the first
nine months of 2011. This increase was primarily due to $148.3 million of cash paid for acquisitions in the first nine months of 2012 compared to $44.8 million paid for acquisitions in the 2011 period.
Cash flow from financing activities Net cash provided by financing activities increased to $111.4 million for the nine months ended September 30, 2012 compared
to $64.1 million in the 2011 period. Cash from financing activities in the first nine months of 2012 was from $106.9 million of net proceeds from our Common Stock offering in the second quarter and $4.6 million of stock-based compensation proceeds, partially offset by capital lease payments. Cash from financing activities in the nine months ended September 30, 2011 included $62.1 million of net proceeds resulting from our Common Stock offering in March 2011 coupled with $2.4 million of stock-based compensation proceeds.
Contractual commitments and off-balance sheet arrangements Debt
In November 2011, we issued 5.50% Senior Convertible Notes due 2016 (“the Notes”) in an aggregate principal amount of $152.0 million. These Notes bear interest at a fixed rate of 5.50% per annum, payable June 15 and December 15 of each year while they are outstanding, beginning June 15, 2012. The net proceeds of the Notes were used to fund the acquisition of Z Corp and Vidar and for general corporate purposes. See Note 8 to the unaudited condensed consolidated financial statements.
The Notes have an initial conversion rate of 46.6021 shares of Common Stock per $1,000 principal amount of Notes, which amounts to a conversion price of $21.46 per common share. Upon conversion, the Company has the option to pay cash or issue Common Stock, or a combination thereof. The aggregate principal amount of these Notes then outstanding matures on December 15, 2016, unless earlier converted, redeemed or repurchased in accordance with the terms of the Notes.
Conditions for conversion have been satisfied and the notes are convertible. During the third quarter of 2012 note holders converted $11.5 million aggregate principal amount of notes, which converted into 0.5 million shares of common stock. The Company recognized a $1.2 million loss on conversion of these notes.
The Notes contain a number of covenants covering, among other things, payment of notes, reporting, maintenance of existence and payment of taxes. Failure to comply with these covenants, or any other event of default, could result in acceleration of the principal amount and accrued and unpaid interest on the notes. We were in compliance with all covenants as of September 30, 2012. See Note 8 to the unaudited condensed consolidated financial statements.
Capitalized lease obligations Our principal contractual commitments consist of capitalized lease obligations. Our capitalized lease obligations, which
primarily relate to a lease agreement that we entered into during 2006, with respect to our Rock Hill facility which covers the facility itself, decreased to $7.7 million at September 30, 2012 from $7.8 million at December 31, 2011 primarily due to scheduled payments of principal on capital lease installments.
31

Our outstanding capitalized lease obligations carrying values at September 30, 2012 and December 31, 2011 were as follows:
Table 14
Other contractual commitments For certain of our recent acquisitions we are obligated for the payment of deferred purchase price totaling $1.9 million, due in
2012 and 2013, compared to $1.4 million at December 31, 2011. Certain of our recent acquisitions contain earnout provisions under which the sellers of the acquired businesses can earn additional amounts. The total amount of liabilities recorded for these earnouts at September 30, 2012 is $6.1 million, compared to $1.9 million at December 31, 2011. See Note 2 for details of acquisitions and related commitments.
As of September 30, 2012, we have supply commitments related to printer assembly that total $13.1 million compared to $10.9 million at December 31, 2011.
Off-balance sheet arrangements We have no off-balance sheet arrangements and do not utilize any “structured debt,” “special purpose,” or similar
unconsolidated entities for liquidity or financing purposes.
Financial instruments We conduct business in various countries using both the functional currencies of those countries and other currencies to effect
cross border transactions. As a result, we are subject to the risk that fluctuations in foreign exchange rates between the dates that those transactions are entered into and their respective settlement dates will result in a foreign exchange gain or loss. When practicable, we endeavor to match assets and liabilities in the same currency on our balance sheet and those of our subsidiaries in order to reduce these risks. We also, when we consider it to be appropriate, enter into foreign currency contracts to hedge exposures arising from those transactions.
We do not hedge or trade for speculative purposes, and our foreign currency contracts are generally short-term in nature, typically maturing in 90 days or less. We have elected not to prepare and maintain the documentation to qualify for hedge accounting treatment under ASC 815, “Derivatives and Hedging,” and therefore, we recognize all gains and losses (realized or unrealized) in interest and other expense, net in our unaudited condensed consolidated statements of operations and comprehensive income.
There were no foreign exchange contracts at September 30, 2012 or December 31, 2011. See Note 7 of the unaudited condensed consolidated financial statements.
Changes in the fair value of derivatives are recorded in interest and other expense, net, in our unaudited condensed consolidated statements of operations and comprehensive income. Depending on their fair value at the end of the reporting period, derivatives are recorded either in prepaid and other current assets or in accrued liabilities in our unaudited condensed consolidated balance sheets.
The total impact of foreign currency related items on our unaudited condensed consolidated statements of operations and comprehensive income was a $0.1 million gain for the nine months ended September 30, 2012 and a nominal gain for the nine months ended September 30, 2011.
Recent Accounting Pronouncements For information with respect to recent accounting pronouncements and the impact of these pronouncements on our condensed
consolidated financial statements, see Note 1 to the unaudited condensed consolidated financial statements.
32
(Dollars in thousands) September 30, 2012 December 31, 2011
Capitalized lease obligations:
Current portion of capitalized lease obligations $ 159 $ 163
Capitalized lease obligations, long-term portion 7,494 7,609
Total capitalized lease obligations $ 7,653 $ 7,772

Critical Accounting Policies and Significant Estimates For a discussion of our critical accounting policies and estimates, refer to “Management’s Discussion and Analysis of Financial
Condition and Results of Operations – Critical Accounting Policies and Significant Estimates” in our Annual Report on Form 10-K for the year ended December 31, 2011.
Forward-Looking Statements Certain statements made in this Form 10-Q that are not statements of historical or current facts are forward-looking statements
within the meaning of the Private Securities Litigation Reform Act of 1995. Forward-looking statements include the cautionary statements and risk factors set forth below as well as other statements made in the Form 10-Q that may involve known and unknown risks, uncertainties and other factors that may cause our actual results, performance or achievements to be materially different from historical results or from any future results expressed or implied by such forward-looking statements.
In addition to statements that explicitly describe such risks and uncertainties, readers are urged to consider statements in future or conditional tenses or that include terms such as “believes,” “belief,” “expects,” “intends,” “anticipates” or “plans” to be uncertain and forward-looking. Forward-looking statements may include comments as to our beliefs and expectations as to future events and trends affecting our business. Forward-looking statements are based upon management’s current expectations concerning future events and trends and are necessarily subject to uncertainties, many of which are outside of our control. The factors stated under the heading “Cautionary Statements and Risk Factors” set forth below and those described in our other SEC reports, including our Form 10-K for the year ended December 31, 2011, as well as other factors, could cause actual results to differ materially from those reflected or predicted in forward-looking statements.
Any forward-looking statements are based on management’s beliefs and assumptions, using information currently available to us. We assume no obligation, and do not intend, to update these forward-looking statements.
If one or more of these or other risks or uncertainties materialize, or if our underlying assumptions prove to be incorrect, actual results may vary materially from those reflected in or suggested by forward-looking statements. Any forward-looking statement you read in this Form 10-Q reflects our current views with respect to future events and is subject to these and other risks, uncertainties and assumptions relating to our operations, results of operations, growth strategy and liquidity. All subsequent written and oral forward-looking statements attributable to us or individuals acting on our behalf are expressly qualified in their entirety by this paragraph. You should specifically consider the factors identified or referred to in this Form 10-Q and our other SEC reports, including our Annual Report on Form 10-K for the year ended December 31, 2011, which would cause actual results to differ from those referred to in forward-looking statements.
Cautionary Statements and Risk Factors We recognize that we are subject to a number of risks and uncertainties that may affect our future performance. The risks and
uncertainties described in Item 1A in our Annual Report on Form 10-K for the year ended December 31, 2011 are not the only risks and uncertainties that we face. Additional risks and uncertainties not currently known to us or that we currently deem not to be material also may impair our business operations. If any of these risks actually occur, our business, results of operations and financial condition could suffer. In that event the trading price of our common stock could decline, and you may lose all or part of your investment in our common stock. The risks discussed in Item 1A in our Annual Report on Form 10-K for the year ended December 31, 2011 also include forward-looking statements, and our actual results may differ substantially from those discussed in these forward-looking statements.
Except as required by the federal securities laws, we undertake no obligation to publicly update or revise any forward-looking statement, whether as a result of new information, future events or otherwise.
Item 3. Quantitative and Qualitative Disclosures About Market Risk. For a discussion of market risks at December 31, 2011, refer to Item 7A, “Quantitative and Qualitative Disclosures about Market
Risk,” in our Annual Report on Form 10-K for the year ended December 31, 2011. During the first nine months of 2012, there were no material changes or developments that would materially alter the market risk assessment performed as of December 31, 2011.
33

Item 4. Controls and Procedures. Evaluation of disclosure controls and procedures As of September 30, 2012, we carried out an evaluation, under the supervision and with the participation of our management,
including our Chief Executive Officer and Chief Financial Officer, of the effectiveness of the design and operation of our disclosure controls and procedures (as defined in Rules 13a-15(e) and 15d-15(e) of the Securities Exchange Act of 1934, as amended (the “Exchange Act”) pursuant to Rules 13a-15 and 15d-15 under the Exchange Act. These controls and procedures were designed to provide reasonable assurance that the information required to be disclosed in the reports that we file or submit under the Exchange Act is recorded, processed, summarized and reported within the time periods specified in the SEC’s rules and forms and that such information is accumulated and communicated to our management, including our Chief Executive Officer and Chief Financial Officer, in a manner to allow timely decisions regarding required disclosures. Based on this evaluation, including an evaluation of the rules referred to above in this Item 4, management has concluded that our disclosure controls and procedures were effective as of September 30, 2012 to provide reasonable assurance that the information required to be disclosed in the reports we file or submit under the Exchange Act is recorded, processed, summarized and reported within the time periods specified in the SEC’s rules and forms and that such information is accumulated and communicated to management, including our Chief Executive Officer and Chief Financial Officer, in a manner to allow timely decisions regarding required disclosures.
Changes in Internal Controls over Financial Reporting There were no material changes in our internal controls over financial reporting during the period covered by this Form 10-Q
that have materially affected, or are reasonably likely to materially affect, our internal control over financial reporting.
34

PART II — OTHER INFORMATION
Item 1. Legal Proceedings. The information set forth in Note 15 of the unaudited condensed consolidated financial statements in Part I, Item 1 of this Form
10-Q is incorporated herein by reference.
Item 1A. Risk Factors. There have been no material changes from the risk factors as previously disclosed in our Annual Report on Form 10-K for the
year ended December 31, 2011.
Item 4. Mine Safety Disclosures. Item 6. Exhibits.
The following exhibits are included as part of this filing and incorporated herein by this reference:
35
3.1
Certificate of Incorporation of Registrant. (Incorporated by reference to Exhibit 3.1 to Form 8-B filed on August 16, 1993, and the amendment thereto, filed on Form 8-B/A on February 4, 1994.)
3.2
Amendment to Certificate of Incorporation filed on May 23, 1995. (Incorporated by reference to Exhibit 3.2 to Registrant’s Registration Statement on Form S-2/A, filed on May 25, 1995.)
3.3
Certificate of Designation of Rights, Preferences and Privileges of Preferred Stock. (Incorporated by reference to Exhibit 2 to Registrant’s Registration Statement on Form 8-A filed on January 8, 1996.)
3.4
Certificate of Designation of the Series B Convertible Preferred Stock, filed with the Secretary of State of Delaware on May 2, 2003. (Incorporated by reference to Exhibit 3.1 to Registrant’s Current Report on Form 8-K, filed on May 7, 2003.)
3.5
Certificate of Elimination of Series A Preferred Stock filed with the Secretary of State of Delaware on March 4, 2004. (Incorporated reference to Exhibit 3.6 of Registrant’s Annual Report on Form 10-K for the year ended December 31, 2003, filed on March 15, 2004.)
3.6
Certificate of Elimination of Series B Preferred Stock filed with the Secretary of State of Delaware on September 9, 2006. (Incorporated reference to Exhibit 3.1 of Registrant’s Current Report on Form 8-K, filed on September 9, 2006.)
3.7
Certificate of Amendment of Certificate of Incorporation filed with Secretary of State of Delaware on May 19, 2004. (Incorporated by reference to Exhibit 3.1 of the Registrant’s Quarterly Report on Form 10-Q for the quarterly period ended September 30, 2004, filed on August 5, 2004.)
3.8
Certificate of Amendment of Certificate of Incorporation filed with Secretary of State of Delaware on May 17, 2005. (Incorporated by reference to Exhibit 3.1 of the Registrant’s Quarterly Report on Form 10-Q for the quarterly period ended September 30, 2005, filed on August 1, 2005.)
3. 9
Certificate of Designations, Preferences and Rights of Series A Preferred Stock, filed with the Secretary of State of Delaware on December 9, 2008. (Incorporated by reference to Exhibit 3.1 of Registrant’s Current Report on Form 8-K, filed on December 9, 2008.)
3.10
Certificate of Elimination of Series A Preferred Stock, filed with the Secretary of State of Delaware on November 14, 2011. (Incorporated by reference to Exhibit 3.1 of Registrant’s Current Report on Form 8-K, filed on November 15, 2011.)
3.11
Amended and Restated By-Laws. (Incorporated by reference to Exhibit 3.2 of Registrant’s Current Report on Form 8-K filed on December 1, 2006.)
3.12
Certificate of Amendment of Certificate of Incorporation filed with the Secretary of State of Delaware on October 7, 2011. (Incorporated by reference to Exhibit 3.1 of the Registrant’s Current Report on Form 8-K, filed on October 7, 2011.)
31.1
Certification of Principal Executive Officer filed pursuant to Section 302 of the Sarbanes-Oxley Act of 2002 dated October 25, 2012.
31.2
Certification of Principal Financial Officer filed pursuant to Section 302 of the Sarbanes-Oxley Act of 2002 dated October 25, 2012.

In accordance with Rule 406T of Regulation S-T, the XBRL related information in Exhibit 101 to this Quarterly Report on Form 10-Q shall not be deemed to be “filed” for purposes of Section 18 of the Exchange Act of 1934, as amended, and is otherwise not subject to liability under these sections.
36
32.1
Certification of Principal Executive Officer filed pursuant to 18 U.S.C. Section 1350, as adopted pursuant to Section 906 of the Sarbanes-Oxley Act of 2002 dated October 25, 2012.
32.2
Certification of Principal Financial Officer filed pursuant to 18 U.S.C. Section 1350, as adopted pursuant to Section 906 of the Sarbanes-Oxley Act of 2002 dated October 25, 2012.
101.INS XBRL Instance Document.
101.SCH XBRL Taxonomy Extension Schema Document.
101.CAL XBRL Taxonomy Extension Calculation Linkbase Document.
101.DEF XBRL Taxonomy Extension Definition Linkbase Document.
101.LAB XBRL Taxonomy Extension Label Linkbase Document.
101.PRE XBRL Taxonomy Extension Presentation Linkbase Document.

SIGNATURE
Pursuant to the requirements of the Securities Exchange Act of 1934, the registrant has duly caused this report to be signed on itsbehalf by the undersigned thereunto duly authorized.
Date: October 25, 2012
37
3D SYSTEMS CORPORATION
By /s/ DAMON J. GREGOIRE
Damon J. Gregoire
Senior Vice President and Chief Financial Officer(Principal Financial and Accounting Officer)
(Duly Authorized Officer)

Exhibit 31.1
Certification of Principal Executive Officer of
3D Systems Corporation
I, Abraham N. Reichental, certify that:
1. I have reviewed this report on Form 10-Q of 3D Systems Corporation;
2. Based on my knowledge, this report does not contain any untrue statement of a material fact or omit to state a material fact necessary to make the statements made, in light of the circumstances under which such statements were made, not misleading with respect to the period covered by this report;
3. Based on my knowledge, the financial statements, and other financial information included in this report, fairly present in all material respects the financial condition, results of operations and cash flows of the registrant as of, and for, the periods presented in this report;
4. The registrant’s other certifying officer(s) and I are responsible for establishing and maintaining disclosure controls and procedures (as defined in Exchange Act Rules 13a-15(e) and 15d-15(e)) and internal control over financial reporting (as defined in Exchange Act Rules 13a-15(f) and 15d-15(f)) for the registrant and have:
(a) Designed such disclosure controls and procedures, or caused such disclosure controls and procedures to be designed under our supervision, to ensure that material information relating to the registrant, including its consolidated subsidiaries, is made known to us by others within those entities, particularly during the period in which this report is being prepared;
(b) Designed such internal control over financial reporting, or caused such internal control over financial reporting to be designed under our supervision, to provide reasonable assurance regarding the reliability of financial reporting and the preparation of financial statements for external purposes in accordance with generally accepted accounting principles;
(c) Evaluated the effectiveness of the registrant’s disclosure controls and procedures and presented in this report our conclusions about the effectiveness of the disclosure controls and procedures, as of the end of the period covered by this report based on such evaluation; and
(d) Disclosed in this report any change in the registrant’s internal control over financial reporting that occurred during the registrant’s most recent fiscal quarter (the registrant’s fourth fiscal quarter in the case of an annual report) that has materially affected, or is reasonably likely to materially affect, the registrant’s internal control over financial reporting; and
5. The registrant’s other certifying officer(s) and I have disclosed, based on our most recent evaluation of internal control over financial reporting, to the registrant’s auditors and the audit committee of the registrant’s board of directors (or persons performing the equivalent functions):
(a) All significant deficiencies and material weaknesses in the design or operation of internal control over financial reporting which are reasonably likely to adversely affect the registrant’s ability to record, process, summarize and report financial information; and
(b) Any fraud, whether or not material, that involves management or other employees who have a significant role in the registrant’s internal control over financial reporting.
Date: October 25, 2012
38
By: /s/ ABRAHAM N. REICHENTAL
Abraham N. ReichentalTitle: President and Chief Executive Officer
(Principal Executive Officer)

Exhibit 31.2
Certification of Principal Financial Officer of
3D Systems Corporation
I, Damon J. Gregoire, certify that:
1. I have reviewed this report on Form 10-Q of 3D Systems Corporation;
2. Based on my knowledge, this report does not contain any untrue statement of a material fact or omit to state a material fact necessary to make the statements made, in light of the circumstances under which such statements were made, not misleading with respect to the period covered by this report;
3. Based on my knowledge, the financial statements, and other financial information included in this report, fairly present in all material respects the financial condition, results of operations and cash flows of the registrant as of, and for, the periods presented in this report;
4. The registrant’s other certifying officer(s) and I are responsible for establishing and maintaining disclosure controls and procedures (as defined in Exchange Act Rules 13a-15(e) and 15d-15(e)) and internal control over financial reporting (as defined in Exchange Act Rules 13a-15(f) and 15d-15(f)) for the registrant and have:
(a) Designed such disclosure controls and procedures, or caused such disclosure controls and procedures to be designed under our supervision, to ensure that material information relating to the registrant, including its consolidated subsidiaries, is made known to us by others within those entities, particularly during the period in which this report is being prepared;
(b) Designed such internal control over financial reporting, or caused such internal control over financial reporting to be designed under our supervision, to provide reasonable assurance regarding the reliability of financial reporting and the preparation of financial statements for external purposes in accordance with generally accepted accounting principles;
(c) Evaluated the effectiveness of the registrant’s disclosure controls and procedures and presented in this report our conclusions about the effectiveness of the disclosure controls and procedures, as of the end of the period covered by this report based on such evaluation; and
(d) Disclosed in this report any change in the registrant’s internal control over financial reporting that occurred during the registrant’s most recent fiscal quarter (the registrant’s fourth fiscal quarter in the case of an annual report) that has materially affected, or is reasonably likely to materially affect, the registrant’s internal control over financial reporting; and
5. The registrant’s other certifying officer(s) and I have disclosed, based on our most recent evaluation of internal control over financial reporting, to the registrant’s auditors and the audit committee of the registrant’s board of directors (or persons performing the equivalent functions):
(a) All significant deficiencies and material weaknesses in the design or operation of internal control over financial reporting which are reasonably likely to adversely affect the registrant’s ability to record, process, summarize and report financial information; and
(b) Any fraud, whether or not material, that involves management or other employees who have a significant role in the registrant’s internal control over financial reporting.
Date: October 25, 2012
39
By: /s/ DAMON J. GREGOIRE
Damon J. GregoireTitle: Senior Vice President and Chief Financial Officer
(Principal Financial and Accounting Officer)

Exhibit 32.1
CERTIFICATION PURSUANT TO 18 U.S.C. SECTION 1350,
AS ADOPTED PURSUANT TO SECTION 906 OF THE SARBANES-OXLEY ACT OF 2002
This certification is provided pursuant to Section 906 of the Sarbanes-Oxley Act of 2002 and accompanies the Quarterly Report on Form 10-Q (the “Form 10-Q”) for the quarter ended September 30, 2012 of 3D Systems Corporation (the “Issuer”).
I, Abraham N. Reichental, the Principal Executive Officer of the Issuer, certify that, pursuant to 18 U.S.C. § 1350, as adopted pursuant to § 906 of the Sarbanes-Oxley Act of 2002, to the best of my knowledge:
(i) the Form 10-Q fully complies with the requirements of Section 13(a) or Section 15(d) of the Securities Exchange Act of 1934; and
(ii) the information contained in the Form 10-Q fairly presents, in all material respects, the financial condition and results of operations of the Issuer.
Date: October 25, 2012
A signed original of this written statement required by Section 906 has been provided to 3D Systems Corporation and will be retained by 3D Systems Corporation and furnished to the Securities and Exchange Commission or its staff upon request.
40
/s/ ABRAHAM N. REICHENTAL
Name: Abraham N. Reichental

Exhibit 32.2
CERTIFICATION PURSUANT TO 18 U.S.C. SECTION 1350,
AS ADOPTED PURSUANT TO SECTION 906 OF THE SARBANES-OXLEY ACT OF 2002
This certification is provided pursuant to Section 906 of the Sarbanes-Oxley Act of 2002 and accompanies the Quarterly Report on Form 10-Q (the “Form 10-Q”) for the quarter ended September 30, 2012 of 3D Systems Corporation (the “Issuer”).
I, Damon J. Gregoire, the Principal Financial Officer of the Issuer, certify that, pursuant to 18 U.S.C. § 1350, as adopted pursuant to § 906 of the Sarbanes-Oxley Act of 2002, to the best of my knowledge:
(i) the Form 10-Q fully complies with the requirements of Section 13(a) or Section 15(d) of the Securities Exchange Act of 1934; and
(ii) the information contained in the Form 10-Q fairly presents, in all material respects, the financial condition and results of operations of the Issuer.
Date: October 25, 2012
A signed original of this written statement required by Section 906 has been provided to 3D Systems Corporation and will be retained by 3D Systems Corporation and furnished to the Securities and Exchange Commission or its staff upon request.
41
/s/ DAMON J. GREGOIRE Name: Damon J. Gregoire