Embed Size (px)
Citation preview

1
UNITED STATES SECURITIES AND EXCHANGE COMMISSION
Washington, D.C. 20549
FORM 10-K
ANNUAL REPORT PURSUANT TO SECTION 13 OR 15(d) OF THE SECURITIES EXCHANGE ACT OF 1934
For the fiscal year ended July 31, 2004
TRANSITION REPORT PURSUANT TO SECTION 13 OR 15 (d)
OF THE SECURITIES EXCHANGE ACT OF 1934
For the Transition Period from _____ to _____ ___________________________
Commission File Number 0-8675
OIL-DRI CORPORATION OF AMERICA
Delaware 36-2048898 (State or other jurisdiction of (I.R.S. Employer Identification No.) incorporation or organization)
410 North Michigan Avenue, Suite 400, Chicago, Illinois 60611-4213 (312) 321-1515
Securities registered pursuant to Section 12(b) of the Act:
Common Stock, par value $0.10 per share
Securities registered pursuant to Section 12(g) of the Act:
None
Indicate by check mark whether Oil-Dri (1) has filed all reports required to be filed by Section 13 or 15(d) of the Securities Exchange Act of 1934 during the preceding 12 months (or for such shorter period that Oil-Dri was required to file such reports), and (2) has been subject to such filing requirements for the past 90 days:
Yes No Indicate by check mark if disclosure of delinquent filers pursuant to Item 405 of Regulation S-K is not contained herein, and will not be contained, to the best of Oil-Dri’s knowledge, in definitive proxy or information statements incorporated by reference in Part III of this Form 10-K or any amendment to this Form 10-K. Indicate by check mark whether Oil-Dri is an accelerated filer:
Yes No
2
The aggregate market value of Oil-Dri’s Common Stock owned by non-affiliates as of January 31, 2004 for accelerated filer purposes was $66,598,000. The aggregate market value of Oil-Dri’s Common Stock owned by non-affiliates as of September 30, 2004 was $60,577,000. Number of shares of each class of Oil-Dri’s capital stock outstanding as of September 30, 2004:
Common Stock – 5,598,460 shares (including 1,538,571 treasury shares) Class B Stock – 1,792,583 shares (including 342,241 treasury shares) Class A Common Stock – 0 shares
DOCUMENTS INCORPORATED BY REFERENCE The following documents are incorporated by reference: 1. Oil-Dri’s Proxy Statement for its 2004 Annual Meeting of Stockholders (“Proxy Statement”), which will be filed with the Securities and Exchange Commission not later than November 29, 2004 (120 days after the end of Oil-Dri’s fiscal year ended July 31, 2004), is incorporated into Part III of this Annual Report on Form 10-K, as indicated herein.

3
CONTENTS
Page
PART I
Item 1: Business......................................................................................................................................... 4 - 8 Item 2: Properties....................................................................................................................................... 9 - 10 Item 3: Legal Proceedings......................................................................................................................... 10 Item 4: Submission of Matters to a Vote of Security Holders.................................................................. 10 Executive Officers of Oil-Dri.................................................................................................................................. 11
PART II Item 5: Market for Registrant's Common Equity and Related Stockholder Matters ............................... 12 Item 6: Selected Financial Data................................................................................................................. 14 - 15 Item 7: Management Discussion and Analysis of Financial Condition and the Results of Operations...................................................................................... 16 - 23 Item 7a: Quantitative and Qualitative Disclosures About Market Risk..................................................... 24 Item 8: Financial Statements and Supplementary Data............................................................................ 26 - 55 Item 9: Changes in and Disagreements with Accountants on Accounting and Financial Disclosure...................................................................................... 56 Report of Independent Registered Public Accounting Firm.............................................................................. 56
PART III Item 10: Directors and Executive Officers of Oil-Dri ................................................................................ 57 Item 11: Executive Compensation .............................................................................................................. 57 Item 12: Security Ownership of Certain Beneficial Owners and Management......................................... 57 Item 13: Certain Relationships and Related Transactions.......................................................................... 58 Item 14: Controls and Procedures ............................................................................................................... 58
PART IV Item 15: Exhibits, Financial Statement Schedules, and Reports on Form 8-K.......................................... 59 - 62 Signatures ....................................................................................................................................................... 63 - 64 Report of Independent Registered Public Accounting Firm on Financial Statement Schedule.................... 65 Schedule II -- Valuation and Qualifying Accounts.............................................................................................. 66 Exhibit Index ....................................................................................................................................................... 67 Attached Exhibits..................................................................................................................................................... 68 - 76
4
PART I Item 1. Business Oil-Dri is a leader in developing, manufacturing and marketing sorbent products and related services for the consumer, specialty, crop production and horticultural and industrial and automotive markets. Oil-Dri’s sorbent products are principally produced from clay minerals and, to a lesser extent, other sorbent materials. Oil-Dri’s sorbent technologies include absorbent and adsorbent products. Absorbents, like sponges, draw liquids up into their many pores. Examples of Oil-Dri’s absorbent clay products are Cat’s Pride® and Jonny Cat® premium cat litter and other cat litters, Oil-Dri All Purpose® floor absorbent and other floor absorbents and Agsorb® granular agricultural chemical carriers. Adsorbent products attract liquids, impurities, metals and surfactants to themselves and form low-level chemical bonds. Oil-Dri’s adsorbents are used for cleanup and filtration mediums. Oil-Dri’s adsorbent products include Oil-Dri Lites™ sorbents for industrial cleanup, Pure-Flo®, Pure-Flo® Supreme, Perform™ and Select™ bleaching clays for edible oils, fats and tallows, and Ultra-Clear® clarification aids for petroleum-based oils and by-products. Consumer products, consisting primarily of cat litter, are sold through the grocery products industry, mass merchandisers, warehouse clubs, and pet retail outlets. Specialty products, consisting of both bleaching, filtration and clarification clays, are sold to processors and refiners of edible and petroleum-based oils and animal health products sold to feed manufacturers and poultry producer. Crop production and horticultural products, which include carriers for crop protection chemicals and fertilizers, drying agents, soil conditioners, sports field products, and flowability aids, are sold to manufacturers of agricultural chemicals and distributors of other agricultural and sports turf products. Industrial and automotive products, consisting primarily of oil, grease and water sorbents (both clay and non-clay), are sold to distributors of industrial cleanup and automotive products, environmental service companies and retail outlets. Oil-Dri has pursued a strategy of developing products for consumer, specialty, crop production, horticultural, and industrial and automotive uses, where Oil-Dri’s marketing, manufacturing and research and development capabilities can play important roles. Oil-Dri’s products are sold through its specialized divisional sales staffs supported by technical service representatives and a network of industrial distributors and food brokers. Oil-Dri maintains its own research and development facility and staff. Oil-Dri Corporation of America was incorporated in 1969 in Delaware as the successor to an Illinois corporation incorporated in 1946; the Illinois corporation was the successor to a partnership that commenced business in 1941. Except as otherwise indicated herein or as the context otherwise requires, references herein to “Oil-Dri” or to the “Company” are to Oil-Dri Corporation of America and its subsidiaries. Certain financial information on segments is contained in Note 3 of the Notes to the Consolidated Financial Statements, incorporated herein by reference. Information concerning total revenue of classes of similar products accounting for more than 10% of consolidated revenues in any of the last three fiscal years is not separately provided because it is the same as the information on net sales of segments furnished in Note 3 of the Notes to the Consolidated Financial Statements. Certain financial information about Oil-Dri’s foreign and domestic operations is also contained in Note 3 of the Notes to the Consolidated Financial Statements, and is incorporated herein by reference. Consumer Products Group Oil-Dri’s cat litter products, in both coarse granular and fine granular clumping (scoopable) forms, are sold under Oil-Dri’s Cat’s Pride®, Jonny Cat® and Lasting Pride® brand names, the Fresh Step® brand manufactured for The Clorox Company (“Clorox”), and private label cat litters manufactured for mass merchandisers, wholesale clubs, drugstore chains, pet superstores and retail grocery stores. Oil-Dri also packages and markets Cat’s Pride® Kat Kit® and Jonny Cat® cat litter in a disposable tray. These products are sold through independent food brokers and Oil-Dri’s sales force to major outlets such as Wal-Mart, Publix, Kroger, Stop and Shop and others. The cat litter market consists of two segments of product, coarse (traditional) and scoopable. Coarse litters are products that have absorbent and odor controlling characteristics. Scoopable litters, in addition to having absorbent and odor controlling characteristics, also have the characteristic of clumping when exposed to moisture, allowing the consumer to dispose of the used portion of the litter selectively. The cat litter market has expanded at a moderate pace in recent years, with the larger portion of the growth coming in the scoopable segment. Introduced in the early 1990s, the scoopable litters have captured the majority of the market measured in retail dollars.

5
The overwhelming majority of all cat litter is mineral based; however, over the years various alternative litters have been introduced based on alternative strata such as paper, various agricultural waste products and most recently, silica gels. To date, these products have assumed only niche positions within the category. Oil-Dri has two long-term supply agreements (only one of which is material) under which it manufactures branded traditional litters for other marketers. Under these co-manufacturing relationships, the marketer controls all aspects of sales, marketing, distribution and the odor control formula; the Company is responsible for manufacturing. Oil-Dri and Clorox have such an agreement under which they developed Fresh Step® premium-priced cat litter products and under which Oil-Dri has an exclusive right to supply Clorox’s requirements for Fresh Step® coarse cat litter up to certain levels. Oil-Dri had manufactured and sold dog treats as part of its Consumer Products Group. In February 2004, however, Oil-Dri sold this business. The sale had no material impact on Oil-Dri’s revenue or results of operations. Specialty Products Group Specialty products include Pure-Flo® and Pure-Flo® Supreme bleaching clays and Ultra-Clear® clarification aids. These products are supported by a team of technical sales and support representatives employed by the Company as well as agent representatives and the services of Oil-Dri’s research and development group. The products are marketed in the United States and international markets. Pure-Flo® bleaching clays, used in the bleaching of edible oils, remove impurities and color bodies from these oils. The primary customers for these products are refiners of food oils. Ultra-Clear® clarification aids are used as filtration and purification mediums for jet fuel and other petroleum-based products. These products adsorb unwanted moisture and other impurities, and are primarily sold to petroleum refiners. Oil-Dri also produces Perform™ and Select™ bleaching clays, which offer performance advantages to refiners. The Perform™ products provide increased activity for hard-to-bleach oils. The Select™ line of products is used earlier in the process stream to remove a variety of impurities from edible oils. Select™ bleaching clays can also be used to significantly improve the refining process of edible oils. Other products include Pel-Unite Plus™ and ConditionAde® binders used in the manufacturing of animal feeds and Poultry Guard® litter amendments used in controlling ammonia levels in commercial poultry houses. Crop Production and Horticultural Products Group Oil-Dri produces and markets a wide range of granular and powdered mineral absorbent products that are used with crop protection chemicals, agricultural drying agents, bulk processing aids, growing media, turf fertilizers and sports field products. Brands include Agsorb® agricultural chemical carriers and drying agents; Flo-Fre®, a highly absorbent microgranule flowability aid; Terra-Green® growing media supplement; and Pro’s Choice® sports field conditioners. Agsorb® carriers are used as a delivery system for crop protection chemicals, including herbicides, fungicides, insecticides, and fertilizers. Agsorb® customized carriers are designed to reduce dust and to facilitate accuracy of application. Oil-Dri’s Agsorb® drying agent is used to make blends of fertilizers and pesticides more robust, allowing farmers to apply these blends to their fields in one application. Oil-Dri has also developed the Agsorb® product as a blending agent for fertilizers and chemicals used in the lawn and garden market. Agricultural products are marketed in the United States by technical salesmen employed by the Company who sell to crop protection chemical manufacturers, feed producers and lawn and garden manufacturers. Oil-Dri’s principal customers for these products include DowElanco, Syngenta, ASDG and Bayer. Pro’s Choice sports field products are used on baseball, football and soccer fields to prevent rain outs, break up field compaction and improve field resiliency. They are used at all levels of play, including professional, college, high school and on municipal fields. These products are sold through a network of distributors specializing in sports turf products use by groundskeepers and athletic directors.

6
Industrial and Automotive Products Group Products for industrial applications include Oil-Dri’s oil, grease and water sorbents, which are cost effective floor maintenance products that provide a non-slip and nonflammable surface for workers. These products are sold through a wide range of distribution channels and have achieved a high level of brand name recognition. Oil-Dri distributes clay-based sorbents sold in granular form and in other configurations such as “socks.” Oil-Dri also distributes polypropylene sorbents in various forms such as pads and rolls. Oil-Dri sells its industrial products through a distributor network that includes industrial, auto parts, safety, sanitary supply, chemical and paper distributors and environmental service companies. Oil-Dri supports the efforts of the industrial distributors with specialized divisional sales personnel. Oil-Dri also produces a floor absorbent for home and garage use. This product is sold through automobile parts distributors and mass merchandisers. Patents Oil-Dri has obtained or applied for patents for certain of its processes and products. These patents expire at various times, beginning in 2005. Patented processes and products are not material to Oil-Dri’s overall business. Foreign Favorite Products Company, Ltd. (d.b.a. Oil-Dri Canada) is a manufacturer and marketer of branded and private label cat litter in the Canadian market place. Among its branded products are Saular®, a leading cat litter brand in Canada; and Saular® Kat-Kit™, a disposable cat litter tray and litter combination. Certain of the products sold in Canada are blends of clay and synthetic sorbent materials. Oil-Dri’s wholly-owned subsidiary in England, Oil-Dri (U.K.), Ltd., packages clay granules produced by Oil-Dri’s domestic manufacturing facilities and, for certain applications, blends a synthetic sorbent material which it manufactures locally. Oil-Dri (U.K.), Ltd. markets these products, primarily in the United Kingdom, as an oil and grease absorbent and as a cat litter. Oil-Dri’s wholly owned subsidiary in Switzerland, Oil-Dri S.A., performs various management, customer service and administrative functions for Oil-Dri and its foreign subsidiaries. The Company’s foreign operations are subject to the normal risks of doing business overseas, such as currency devaluations and fluctuations, restrictions on the transfer of funds and import/export duties. Oil-Dri was not materially impacted by these foreign currency fluctuations in any of its last three fiscal years. Backlog; Seasonality At July 31, 2004, 2003 and 2002, Oil-Dri’s backlog of orders was approximately $3,421,000, $4,277,000 and $2,448,000 respectively. Oil-Dri considers its clay sorbent business, taken as a whole, to be only moderately seasonal. However, business activities of certain customers (such as agricultural) are subject to such factors as crop acreage planted and product formulation cycles. Customers Sales to Wal-Mart Stores, Inc. accounted for approximately 18%, 19% and 22% of Oil-Dri’s net sales for the fiscal year ended July 31, 2004, 2003 and 2002 respectively. Sales to The Clorox Company accounted for approximately 9%, 9% and 10% of Oil-Dri’s net sales for the fiscal year ended July 31, 2004, 2003 and 2002 respectively. The loss of any other of Oil-Dri’s customers would not have a materially adverse effect on Oil-Dri. Competition Oil-Dri has approximately seven principal competitors in the United States, some of which have substantially greater financial resources than the Company, which compete with Oil-Dri in certain markets and with respect to certain products. Price, service and technical support, product quality and delivery are the principal methods of competition in Oil-Dri’s markets and competition has historically been very vigorous.

7
Reserves Oil-Dri mines sorbent materials, consisting of either montmorillonite, attapulgite or diatomaceous earth on leased or owned land near its manufacturing facilities in Mississippi, Georgia, Illinois and California; it also has reserves in Nevada, Oregon and Tennessee (see “Item 2. Properties” below). Oil-Dri estimates that its proven recoverable reserves of these sorbent materials aggregate approximately 462,467,000 tons. Based on its rate of consumption during the 2004 fiscal year, without regard to any of its reserves in Nevada, Oregon and Tennessee, Oil-Dri considers its proven recoverable reserves adequate to supply Oil-Dri’s needs for over 40 years. Although Oil-Dri considers these reserves to be both marketable and extremely valuable to the business, only a small portion of the reserves, those which were acquired in acquisitions, are reflected at cost on the balance sheet. It is Oil-Dri’s policy to attempt to add to reserves in most years, but not necessarily in every year, an amount at least equal to the amount of reserves consumed in that year. Oil-Dri has a program of exploration for additional reserves and, although reserves have been acquired, Oil-Dri cannot assure that additional reserves will continue to become available. Oil-Dri’s use of these reserves will be subject to compliance with existing and future federal and state statutes and regulations regarding mining and environmental compliance. Also, requirements for environmental compliance may restrict exploration or use of lands that might otherwise be utilized as a source of reserves. During the fiscal year ended July 31, 2004, Oil-Dri utilized these reserves to produce substantially all of the sorbent minerals that it sold. Proven reserves are those reserves for which (a) quantity is computed from dimensions revealed in outcrops, trenches, workings or drill holes; grade and/or quality are computed from results of detailed sampling, and (b) the sites for inspection, sampling and measurement are spaced so closely and the geologic character is so well defined that size, shape, depth and mineral content of reserves are well established. Probable reserves are computed from information similar to that used for proven reserves, but the sites for inspection, sampling, and measurement are farther apart or are otherwise less adequately spaced. The degree of assurance, although lower than that for proven reserves, is high enough to assume continuity between points of observation. Oil-Dri employs a staff of geologists and mineral specialists who estimate and evaluate existing and potential reserves in terms of quality, quantity and availability. Mining Operations Oil-Dri has conducted mining operations in Ripley, Mississippi since 1963; in Ochlocknee, Georgia since 1971; in Blue Mountain, Mississippi since 1989; in Mounds, Illinois since 1998 and in Taft, California since 2002. Oil-Dri’s raw materials are surface mined on a year-round basis, generally using large earth moving scrapers, bulldozers, excavators or off-road tucks to remove overburden, and then loaded into dump trucks with backhoe or front end loader for movement to the processing facilities. The mining and hauling of Oil-Dri’s clay is performed by Oil-Dri and by independent contractors. Oil-Dri’s current operating mines range in distance from immediately adjacent to approximately 13 miles from the related processing plants. Access to processing facilities from the mining areas is generally by private road, and in some instances public highways are utilized. Each of Oil-Dri’s processing facilities maintains inventories of unprocessed clay of approximately one week of production requirements. The following schedule summarizes, for each of Oil-Dri’s manufacturing facilities, the net book value of land and other plant and equipment: Plant and Land Equipment (in thousands) Ochlocknee, Georgia ...................................................................................................................... $ 2,433 $ 9,911 Ripley, Mississippi ......................................................................................................................... $ 1,535 $ 7,140 Mounds, Illinois.............................................................................................................................. $ 1,544 $ 6,541 Blue Mountain, Mississippi............................................................................................................ $ 955 $ 5,089 Taft, California................................................................................................................................ $ 1,283 $ 3,289
8
Employees As of July 31, 2004, Oil-Dri employed 781 persons, 72 of who were employed by Oil-Dri’s foreign subsidiaries. Oil-Dri’s corporate offices, research and development center and manufacturing facilities are adequately staffed and no material labor shortages are anticipated. Approximately 44 of Oil-Dri’s employees in the U.S. and approximately 28 of Oil-Dri’s employees in Canada are represented by labor unions, which have entered into separate collective bargaining agreements with the Company. Employee relations are considered satisfactory. Environmental Compliance Oil-Dri’s mining and manufacturing operations and facilities in Georgia, Mississippi, California and Illinois are required to comply with state surface mining statutes and various federal, state and local statutes, regulations and ordinances which govern the discharge of materials, water and waste into the environment and restrict mining on wetlands or otherwise regulate Oil-Dri’s operations. In recent years, environmental regulation has grown increasingly stringent, a trend that Oil-Dri expects will continue. Oil-Dri endeavors to be in substantial compliance at all times with all applicable environmental controls and regulations. As a result, expenditures relating to environmental compliance have increased over the years; however, these expenditures have not been material. Oil-Dri continues, and will continue, to incur costs in connection with reclaiming exhausted mining sites. The costs of reclamation have not had a material effect on its mining costs. These costs are treated as part of Oil-Dri’s mining expense. In addition to the environmental requirements relating to mining and manufacturing operations and facilities, there is increasing federal and state legislation and regulation with respect to the labeling, use, and disposal after use, of various Oil-Dri products. Oil-Dri endeavors to be in substantial compliance at all times with that legislation and regulation and to assist its customers in that compliance. Oil-Dri cannot assure that, despite all commercially reasonable efforts, it will always be in compliance with environmental legislation and regulations or with requirements regarding the labeling, use, and disposal after use, of its products; nor can it assure that from time to time enforcement of such requirements will not have an adverse impact on its business. Energy Oil-Dri uses coal, natural gas and recycled fuel oil as permitted for energy sources in the processing of its clay products. Consistent with prior years, Oil-Dri has switched from natural gas to other energy sources during certain months due to seasonal unavailability and the higher cost of natural gas relative to other fuels. See Item 7a. “Quantitative and Qualitative Disclosures About Market Risk” with respect to the use of forward contracts. Research and Development At Oil-Dri’s research and development facility, the staff develops new products and applications and improves existing products. The staff and various consultants consist of geologists, mineralogists and chemists. In the past several years, Oil-Dri’s research efforts have resulted in a number of new sorbent products and processes. The facility produces prototype samples and tests new products for customer trial and evaluation. Oil-Dri spent approximately $2,453,000, $1,923,000 and $1,955,000 during its fiscal years ended July 31, 2004, 2003 and 2002, respectively, for research and development. None of such research and development was customer sponsored, and all research and development costs are expensed in the year in which incurred. See Note 1 of the Notes to the Consolidated Financial Statements.
9
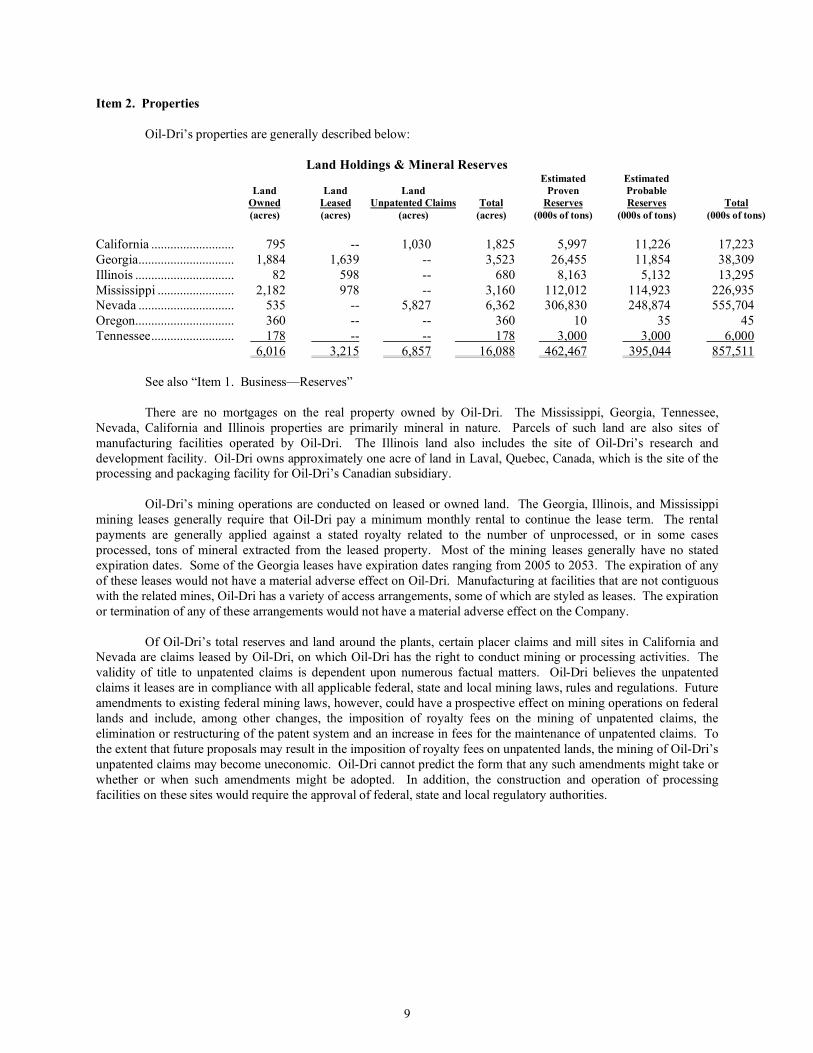
Item 2. Properties Oil-Dri’s properties are generally described below:
Land Holdings & Mineral Reserves Estimated Estimated Land Land Land Proven Probable Owned Leased Unpatented Claims Total Reserves Reserves Total (acres) (acres) (acres) (acres) (000s of tons) (000s of tons) (000s of tons) California .......................... 795 -- 1,030 1,825 5,997 11,226 17,223 Georgia.............................. 1,884 1,639 -- 3,523 26,455 11,854 38,309 Illinois ............................... 82 598 -- 680 8,163 5,132 13,295 Mississippi ........................ 2,182 978 -- 3,160 112,012 114,923 226,935 Nevada .............................. 535 -- 5,827 6,362 306,830 248,874 555,704 Oregon............................... 360 -- -- 360 10 35 45 Tennessee.......................... 178 -- -- 178 3,000 3,000 6,000 6,016 3,215 6,857 16,088 462,467 395,044 857,511 See also “Item 1. Business—Reserves” There are no mortgages on the real property owned by Oil-Dri. The Mississippi, Georgia, Tennessee, Nevada, California and Illinois properties are primarily mineral in nature. Parcels of such land are also sites of manufacturing facilities operated by Oil-Dri. The Illinois land also includes the site of Oil-Dri’s research and development facility. Oil-Dri owns approximately one acre of land in Laval, Quebec, Canada, which is the site of the processing and packaging facility for Oil-Dri’s Canadian subsidiary. Oil-Dri’s mining operations are conducted on leased or owned land. The Georgia, Illinois, and Mississippi mining leases generally require that Oil-Dri pay a minimum monthly rental to continue the lease term. The rental payments are generally applied against a stated royalty related to the number of unprocessed, or in some cases processed, tons of mineral extracted from the leased property. Most of the mining leases generally have no stated expiration dates. Some of the Georgia leases have expiration dates ranging from 2005 to 2053. The expiration of any of these leases would not have a material adverse effect on Oil-Dri. Manufacturing at facilities that are not contiguous with the related mines, Oil-Dri has a variety of access arrangements, some of which are styled as leases. The expiration or termination of any of these arrangements would not have a material adverse effect on the Company. Of Oil-Dri’s total reserves and land around the plants, certain placer claims and mill sites in California and Nevada are claims leased by Oil-Dri, on which Oil-Dri has the right to conduct mining or processing activities. The validity of title to unpatented claims is dependent upon numerous factual matters. Oil-Dri believes the unpatented claims it leases are in compliance with all applicable federal, state and local mining laws, rules and regulations. Future amendments to existing federal mining laws, however, could have a prospective effect on mining operations on federal lands and include, among other changes, the imposition of royalty fees on the mining of unpatented claims, the elimination or restructuring of the patent system and an increase in fees for the maintenance of unpatented claims. To the extent that future proposals may result in the imposition of royalty fees on unpatented lands, the mining of Oil-Dri’s unpatented claims may become uneconomic. Oil-Dri cannot predict the form that any such amendments might take or whether or when such amendments might be adopted. In addition, the construction and operation of processing facilities on these sites would require the approval of federal, state and local regulatory authorities.

10
Oil-Dri operates facilities in the following locations: Location Owned/Leased Size (sq. ft.) Function Alpharetta, Georgia Leased 26,000 Non-clay processing and warehousing Blue Mountain, Mississippi Both 146,000 Clay mining, manufacturing and packaging Chicago, Illinois Leased 20,000 Principal executive office Mounds, Illinois Owned 129,000 Clay mining, manufacturing and packaging Coppet, Switzerland Leased 1,000 Customer service office Laval, Quebec, Canada Owned 22,500 Non-clay production and packaging Ochlocknee, Georgia Owned 398,000 Clay mining, manufacturing and packaging Ripley, Mississippi Owned 208,000 Clay mining, manufacturing and packaging Taft, California Owned 135,000 Clay mining, manufacturing and packaging Vernon Hills, Illinois Owned 19,100 Research and development Wisbech, United Kingdom Leased 66,850 Non-clay production and packaging The lease for the Alpharetta, Georgia facility expires in 2008. A portion of the Blue Mountain, Mississippi facility is leased by Oil-Dri from the Town of Blue Mountain in connection with industrial revenue bond financing obtained by Oil-Dri in 1988. See Note 4 of Notes to Consolidated Financial Statements. Upon expiration of the relevant leases in 2008 and full payment of the bonds, Oil-Dri has the right to purchase the leased property for $100. The lease for the Chicago, Illinois facility expires in 2018. The lease for the Wisbech, United Kingdom facility expires in 2031. The lease for the Coppet, Switzerland office is on a year-to-year basis. Item 3. Legal Proceedings The Company was named as a defendant in an action captioned PSN Illinois LLC v. Oil-Dri Corporation of America filed February 5, 2004 in the United States District Court for the Northern District of Illinois. The lawsuit alleged that most of the Company’s scoopable cat litter products infringed two patents owned by the plaintiff. The plaintiff was seeking monetary damages in an unspecified amount, treble damages if the alleged infringement is found to be willful, as well as injunctive relief. On August 12, 2004, the Company announced a settlement and dismissal of the plaintiff’s claims. Under terms of the settlement, the Company paid the plaintiff $1,250,000 and the plaintiff granted the Company paid-up licenses of the two patents involved in the litigation as well as a third patent owned by the plaintiff.
In April 2002, the Company filed parallel actions in state and federal courts in Nevada against Washoe County, Nevada, alleging that the County’s denial of a special use permit (sought by the Company in connection with its plan to build a manufacturing facility outside of Reno, Nevada) violated both federal and state law. The lawsuits seek damages resulting from the County’s improper denial of the special use permit, which caused the Company to abandon its plan to build the Reno facility. The federal court action has been dismissed on jurisdictional grounds, and the state court action is now proceeding. A hearing on the liability issues in the state court action took place in January 2004; however, no ruling has yet been issued. An adverse decision in the matter would not have a material adverse effect on the Company. The Company is involved in other ordinary routine litigation, none of which is material individually or in aggregate. Item 4. Submission of Matters to a Vote of Security Holders Not applicable.
11
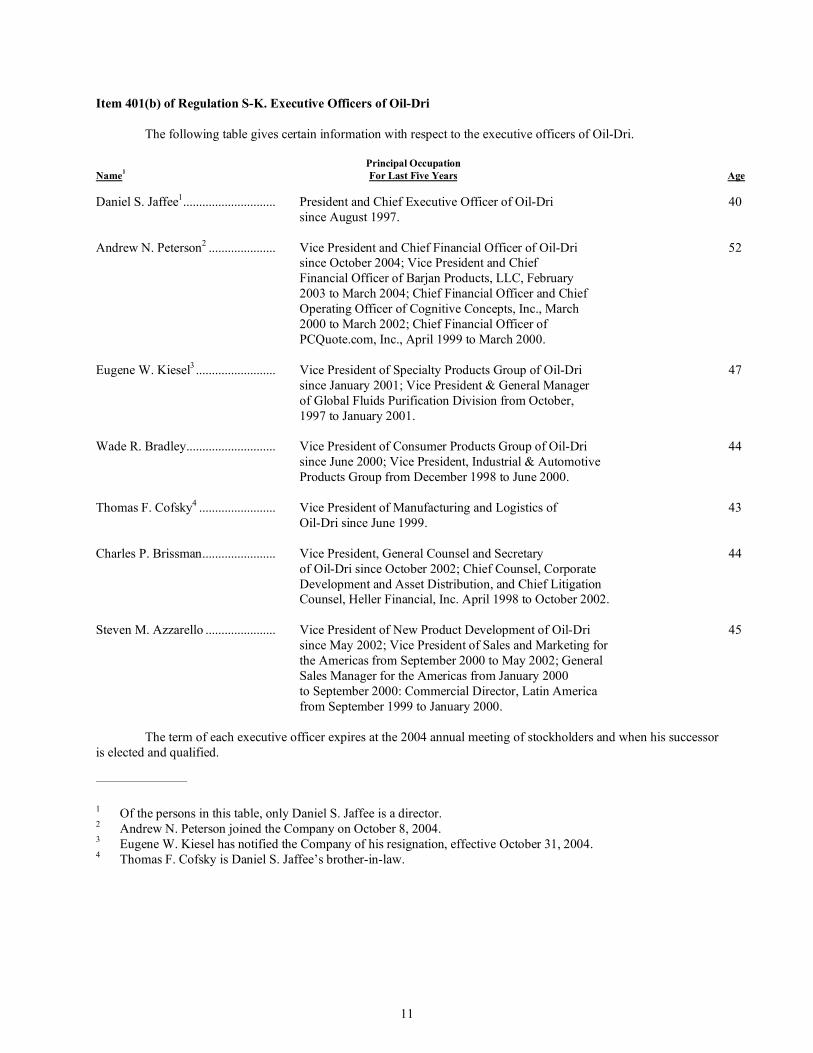
Item 401(b) of Regulation S-K. Executive Officers of Oil-Dri The following table gives certain information with respect to the executive officers of Oil-Dri. Principal Occupation Name1 For Last Five Years Age Daniel S. Jaffee1............................. President and Chief Executive Officer of Oil-Dri 40 since August 1997. Andrew N. Peterson2 ..................... Vice President and Chief Financial Officer of Oil-Dri 52 since October 2004; Vice President and Chief Financial Officer of Barjan Products, LLC, February 2003 to March 2004; Chief Financial Officer and Chief Operating Officer of Cognitive Concepts, Inc., March 2000 to March 2002; Chief Financial Officer of PCQuote.com, Inc., April 1999 to March 2000. Eugene W. Kiesel3 ......................... Vice President of Specialty Products Group of Oil-Dri 47 since January 2001; Vice President & General Manager of Global Fluids Purification Division from October, 1997 to January 2001. Wade R. Bradley............................ Vice President of Consumer Products Group of Oil-Dri 44 since June 2000; Vice President, Industrial & Automotive Products Group from December 1998 to June 2000. Thomas F. Cofsky4 ........................ Vice President of Manufacturing and Logistics of 43 Oil-Dri since June 1999. Charles P. Brissman....................... Vice President, General Counsel and Secretary 44 of Oil-Dri since October 2002; Chief Counsel, Corporate Development and Asset Distribution, and Chief Litigation Counsel, Heller Financial, Inc. April 1998 to October 2002. Steven M. Azzarello ...................... Vice President of New Product Development of Oil-Dri 45 since May 2002; Vice President of Sales and Marketing for the Americas from September 2000 to May 2002; General Sales Manager for the Americas from January 2000 to September 2000: Commercial Director, Latin America from September 1999 to January 2000. The term of each executive officer expires at the 2004 annual meeting of stockholders and when his successor is elected and qualified.
1 Of the persons in this table, only Daniel S. Jaffee is a director. 2 Andrew N. Peterson joined the Company on October 8, 2004. 3 Eugene W. Kiesel has notified the Company of his resignation, effective October 31, 2004. 4 Thomas F. Cofsky is Daniel S. Jaffee’s brother-in-law.
12
PART II
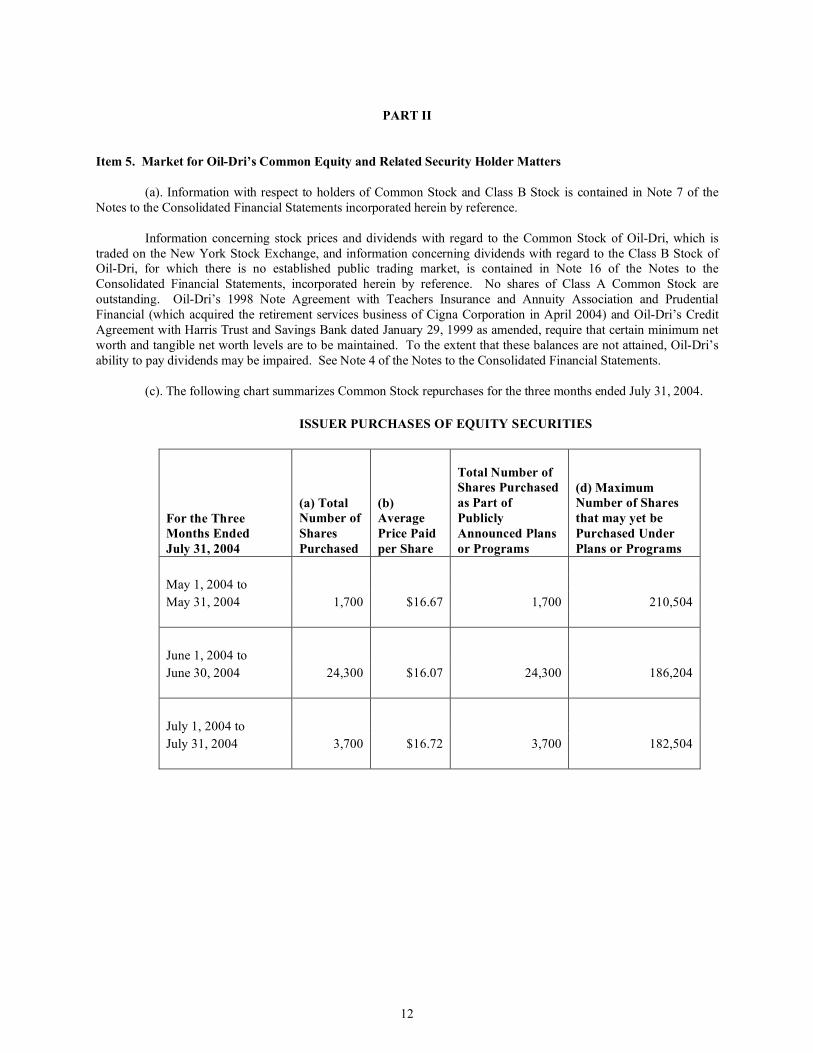
Item 5. Market for Oil-Dri’s Common Equity and Related Security Holder Matters (a). Information with respect to holders of Common Stock and Class B Stock is contained in Note 7 of the Notes to the Consolidated Financial Statements incorporated herein by reference. Information concerning stock prices and dividends with regard to the Common Stock of Oil-Dri, which is traded on the New York Stock Exchange, and information concerning dividends with regard to the Class B Stock of Oil-Dri, for which there is no established public trading market, is contained in Note 16 of the Notes to the Consolidated Financial Statements, incorporated herein by reference. No shares of Class A Common Stock are outstanding. Oil-Dri’s 1998 Note Agreement with Teachers Insurance and Annuity Association and Prudential Financial (which acquired the retirement services business of Cigna Corporation in April 2004) and Oil-Dri’s Credit Agreement with Harris Trust and Savings Bank dated January 29, 1999 as amended, require that certain minimum net worth and tangible net worth levels are to be maintained. To the extent that these balances are not attained, Oil-Dri’s ability to pay dividends may be impaired. See Note 4 of the Notes to the Consolidated Financial Statements. (c). The following chart summarizes Common Stock repurchases for the three months ended July 31, 2004. ISSUER PURCHASES OF EQUITY SECURITIES
For the Three Months Ended July 31, 2004
(a) Total Number of Shares Purchased
(b) Average Price Paid per Share
Total Number of Shares Purchased as Part of Publicly Announced Plans or Programs
(d) Maximum Number of Shares that may yet be Purchased Under Plans or Programs
May 1, 2004 to May 31, 2004 1,700 $16.67 1,700 210,504 June 1, 2004 to June 30, 2004 24,300 $16.07 24,300 186,204 July 1, 2004 to July 31, 2004 3,700 $16.72 3,700 182,504

13
(This page intentionally left blank.)
14
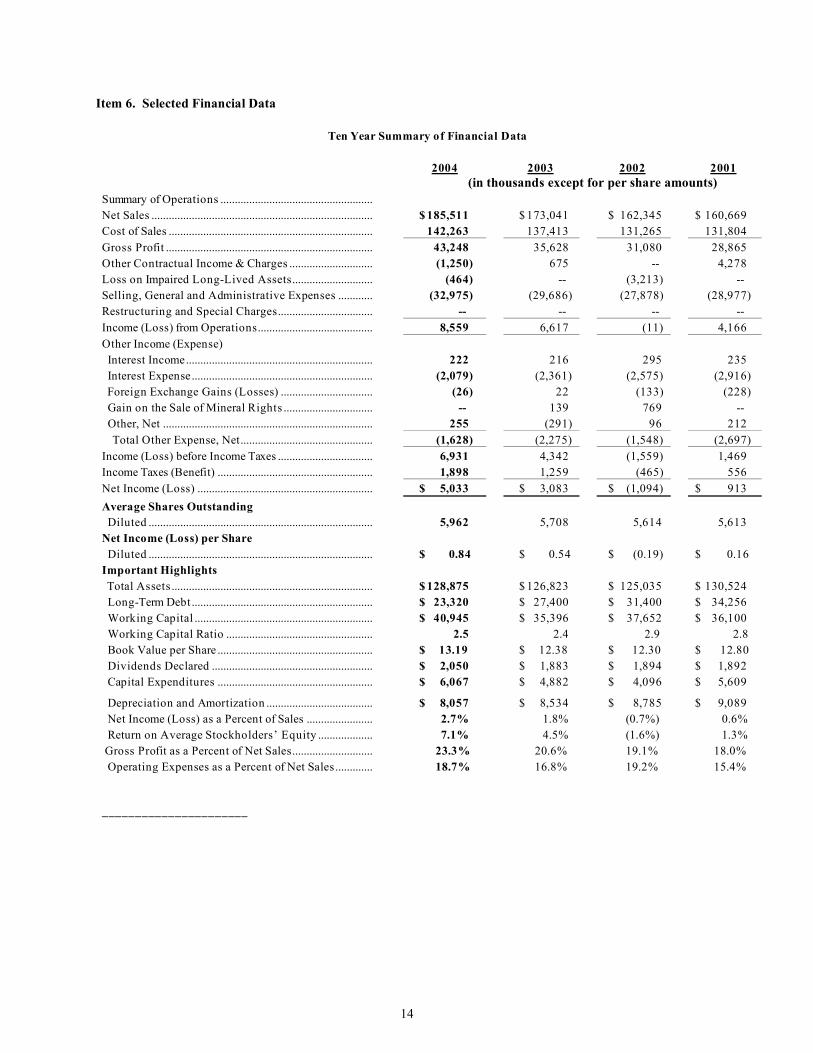
Item 6. Selected Financial Data
Ten Year Summary of Financial Data 2004 2003 2002 2001
(in thousands except for per share amounts) Summary of Operations ..................................................... Net Sales ............................................................................. $ 185,511 $ 173,041 $ 162,345 $ 160,669 Cost of Sales ....................................................................... 142,263 137,413 131,265 131,804 Gross Profit ........................................................................ 43,248 35,628 31,080 28,865 Other Contractual Income & Charges ............................. (1,250) 675 -- 4,278 Loss on Impaired Long-Lived Assets............................ (464) -- (3,213) -- Selling, General and Administrative Expenses ............ (32,975) (29,686) (27,878) (28,977) Restructuring and Special Charges................................. -- -- -- -- Income (Loss) from Operations........................................ 8,559 6,617 (11) 4,166 Other Income (Expense) Interest Income................................................................. 222 216 295 235 Interest Expense............................................................... (2,079) (2,361) (2,575) (2,916) Foreign Exchange Gains (Losses) ................................ (26) 22 (133) (228) Gain on the Sale of Mineral Rights ............................... -- 139 769 -- Other, Net ......................................................................... 255 (291) 96 212 Total Other Expense, Net.............................................. (1,628) (2,275) (1,548) (2,697) Income (Loss) before Income Taxes ................................. 6,931 4,342 (1,559) 1,469 Income Taxes (Benefit) ...................................................... 1,898 1,259 (465) 556 Net Income (Loss) ............................................................. $ 5,033 $ 3,083 $ (1,094) $ 913 Average Shares Outstanding Diluted .............................................................................. 5,962 5,708 5,614 5,613 Net Income (Loss) per Share Diluted .............................................................................. $ 0.84 $ 0.54 $ (0.19) $ 0.16 Important Highlights Total Assets ...................................................................... $ 128,875 $ 126,823 $ 125,035 $ 130,524 Long-Term Debt ............................................................... $ 23,320 $ 27,400 $ 31,400 $ 34,256 Working Capital .............................................................. $ 40,945 $ 35,396 $ 37,652 $ 36,100 Working Capital Ratio ................................................... 2.5 2.4 2.9 2.8 Book Value per Share ...................................................... $ 13.19 $ 12.38 $ 12.30 $ 12.80 Dividends Declared ........................................................ $ 2,050 $ 1,883 $ 1,894 $ 1,892 Capital Expenditures ...................................................... $ 6,067 $ 4,882 $ 4,096 $ 5,609
Depreciation and Amortization ..................................... $ 8,057 $ 8,534 $ 8,785 $ 9,089 Net Income (Loss) as a Percent of Sales ....................... 2.7% 1.8% (0.7%) 0.6% Return on Average Stockholders’ Equity ................... 7.1% 4.5% (1.6%) 1.3% Gross Profit as a Percent of Net Sales............................ 23.3% 20.6% 19.1% 18.0% Operating Expenses as a Percent of Net Sales ............. 18.7% 16.8% 19.2% 15.4%
______________________

15
Year Ended July 31 2000 1999 1998 1997 1996 1995
$164,044 $163,888 $ 152,194 $ 148,895 $ 144,210 $ 148,861 127,434 121,230 111,990 109,906 108,997 109,288 36,610 42,658 40,204 38,989 35,213 39,573 -- -- -- -- -- -- -- -- -- -- -- -- (29,617) (30,907) (28,646) (28,320) (28,309) (26,863) (1,239) -- (3,129) -- (921) -- 5,754 11,751 8,429 10,669 5,983 12,710 206 480 491 637 587 448 (3,185) (3,185) (2,049) (1,775) (1,917) (1,921) (173) (124) (146) -- (7) (5) -- -- -- -- -- -- 446 1,114 (119) (17) 137 (84) (2,706) (1,715) (1,823) (1,155) (1,200) (1,562) 3,048 10,036 6,606 9,514 4,783 11,148 821 2,860 1,883 2,721 1,409 3,145 $ 2,227 $ 7,176 $ 4,723 $ 6,793 $ 3,374 $ 8,003 5,677 5,996 6,165 6,599 6,807 6,936 $ 0.39 $ 1.20 $ 0.77 $ 1.03 $ 0.50 $ 1.15 $132,844 $133,750 $ 134,215 $ 114,558 $ 117,693 $ 116,988 $ 39,434 $ 38,150 $ 39,976 $ 17,052 $ 18,978 $ 20,422 $ 38,875 $ 37,141 $ 36,283 $ 31,165 $ 30,399 $ 33,074 3.6 3.3 3.1 3.0 2.7 3.1 $ 13.01 $ 13.00 $ 12.15 $ 12.03 $ 11.46 $ 11.35 $ 1,900 $ 1,904 $ 1,808 $ 1,936 $ 2,022 $ 2,047 $ 6,001 $ 8,495 $ 6,496 $ 5,395 $ 7,184 $ 7,032 $ 9,099 $ 8,497 $ 7,832 $ 7,587 $ 7,926 $ 7,808 1.4% 4.4% 3.1% 4.6% 2.3% 5.4% 3.0% 9.8% 6.3% 8.8% 4.3% 10.6% 22.3% 26.0% 26.4% 26.2% 24.4% 26.6% 18.8% 18.9% 20.9% 19.0% 20.3% 18.0%

16
Item 7. Management’s Discussion and Analysis of Financial Condition and Results of Operations Results of Operations Fiscal 2004 Compared to Fiscal 2003 Consolidated net sales for the year ended July 31, 2004 were $185,511,000, an increase of 7.2% from net sales of $173,041,000 in fiscal 2003. Net income for the year was $5,033,000, an increase of 63.3% compared to the profit reported in fiscal 2003 of $3,083,000. Diluted income per share was $0.84 in fiscal 2004, versus a diluted income per share of $0.54 in fiscal 2003. Fiscal 2004 net income was positively impacted by the additional gross profit associated with the 7.2% sales increase, foreign and domestic price increases and generally improved manufacturing performance. Fiscal 2004 income was negatively impacted by a $464,000 pre-tax loss on impaired assets, a $1,250,000 pre-tax charge to settle a patent infringement lawsuit and $700,000 of pre-tax defense costs associated with the Company’s settlement of the patent infringement litigation. Fiscal 2003 net income was positively impacted by a pre-tax gain of $139,000 on the sale of mineral rights, a pre-tax contractual payment of $675,000 from a customer that failed to meet minimum purchase requirements under a supply agreement with the Company, a pre-tax gain on real estate sales of $310,000, improved sales and reduced distribution costs. The increase in net income was partially offset by a pre-tax write-off associated with the closure of the Christmas Valley, Oregon production facility in the fourth quarter of $573,000, a pre-tax asset write-off of $385,000 and a pre-tax goodwill write-off of $350,000 related to an equity investment. See Note 2 of the Notes to the Consolidated Financial Statements for a discussion of the loss on impaired long-lived assets; the settlement of the patent infringement lawsuit; the gains on the sale of land and mineral rights, the other contractual income and the 2003 closure and write-off of the Christmas Valley production plant. Net sales of the Consumer Products Group for fiscal 2004 were $114,027,000, an increase of 8.5% from net sales of $105,108,000 in fiscal 2003. This segment’s operating income increased 31.4% from $13,343,000 in fiscal 2003 to $17,532,000 in fiscal 2004. The net sales increase was driven by a full year’s sales of the Jonny Cat® product line in fiscal 2004 (versus seven months in fiscal 2003), which also positively contributed to the segment’s increased gross profit. Also contributing to the sales and profit increases were sales increases in the Cat’s Pride scooping litters and private label litter for Wal-Mart. The improved performance was facilitated by price increases and lower purchasing costs on selected materials. Offsetting part of the gross profit increase associated with the increased sales were increases in commissions and advertising and trade spending expenses. The expense increases were incurred in an effort to stabilize the market share of the Jonny Cat product line and to continue to grow other product lines in this group. The Company’s sale of its dog treats business in the third quarter of fiscal 2004 did not have a material impact on this group’s sales or profitability. Net sales of the Specialty Products Group for fiscal 2004 were $27,759,000, an increase of 11.1% from net sales of $24,990,000 in fiscal 2003. This segment’s operating income increased 23.0% from $4,927,000 in fiscal 2003 to $6,058,000 in fiscal 2004. The profit increase was driven by improved sales in the animal health and nutrition market, led by Poultry Guard® litter amendments and ConditionAde® binding agents, and by price increases in animal health and nutrition and bleaching earth. The growth was attributable to new customers in Asia and Latin America as a result of an increased sales focus and enhanced training of distributors. Sales growth was also seen in the bleaching earth business in North America. Offsetting part of the gross profit increase were expense increases in outside services, travel and commissions to support the market expansion and increased technical services costs. Net sales of the Crop Production and Horticultural Products Group for fiscal 2004 were $21,006,000, a decrease of 3.7% from net sales of $21,820,000 in fiscal 2003. The net sales decrease resulted primarily from decreased sales of Agsorb® drying agents and agricultural carriers, and decreased sales of Pro’s Choice® sports field products. The agricultural carriers business softened in the second half of fiscal 2004 due to general concerns related to the future direction of genetically modified seeds. The sports field products sales have declined due to slower golf course construction sales. This segment’s operating income increased by 18.3% from $2,614,000 in fiscal 2003 to $3,092,000 in fiscal 2004. The increase in operating income was driven by price increases and by a reduction of freight costs due to a better geographical mix of customers close to the Company’s facilities.

17
Net sales of the Industrial and Automotive Products Group for fiscal 2004 were $22,719,000, an increase of 7.6% from net sales of $21,123,000 in fiscal 2003. An increase in sales of industrial absorbents was due to additional volume generated by a full year of production from the acquired production facility in Taft, California versus seven months in fiscal 2003. Also price increases in both clay and synthetic products and sales efforts focused on key growth accounts contributed to the increased net sales. This segment’s operating income improved from a loss of $826,000 in fiscal 2003 to a loss of $452,000 in fiscal 2004. The improvement was driven by increased volumes and prices. Consolidated gross profit as a percentage of net sales for fiscal 2004 increased to 23.3% from 20.6% in fiscal 2003 primarily as a result of a full year’s sales of the Jonny Cat product line in fiscal 2004 (versus seven months in fiscal 2003), lower purchasing costs on selected materials in the Consumer Products Group, increased sales of animal health and nutrition products in the Specialty Products Group, and price increases in all groups. Also contributing to the increased gross profit was a 2.6% reduction in non-fuel manufacturing costs. Gross profit was negatively impact by a 14% increase in fuel costs as compared to fiscal 2003. The Christmas Valley closure negatively impacted the overall gross profit in fiscal 2003. Approximately $484,000 of the $573,000 write-off was reflected in cost of goods sold. This adjustment reduced the gross profit percentage from 20.9% for the year, down to the final reported level of 20.6%. Operating expenses as a percentage of net sales for fiscal 2004 increased to 18.7% from the 16.8% reported in fiscal 2003. Excluding the other contractual income and charges in both fiscal 2004 and fiscal 2003 and the loss on impaired assets in fiscal 2004, operating expenses increased from 17.2% in fiscal 2003 to 17.8% in fiscal 2004. Most of this increase was due to expense increases discussed above in the Consumer Products and Specialty Products segments and the defense costs associated with the patent infringement litigation. Interest expense for fiscal 2004 decreased 11.9% from fiscal 2003 due to the reduction in outstanding debt of $4,000,000. The Company’s effective tax rate was 27.4% of pre-tax income in fiscal 2004 versus 29.0% in fiscal 2003. Contributing to the decrease in the effective tax rate for fiscal 2004 was a change in estimate in calculating the Company’s depletion deduction and the Company’s decision to change from a separate company federal tax filing to a consolidated company federal tax filing, which has allowed the Company to better utilize its various tax attributes. Negatively impacting the tax rate in fiscal 2004 was a $210,000 tax expense recorded on certain unremitted earnings of the Company’s Switzerland subsidiary. This charge was taken to reflect the estimated potential impact of repatriating certain cash balances held by that subsidiary. Total assets of the Company increased $2,052,000 or 1.6% during fiscal 2004. Current assets increased $7,351,000 or 12.1% from the fiscal 2003 year-end balances, primarily due to increases in cash and cash equivalents, investments in securities, accounts receivable, prepaid expenses. The increase in cash and investments was due the improved financial performance of the Company. Also, in fiscal 2003 the Company’s cash position was reduced by over $6,000,000 spent to consummate the purchase of the Jonny Cat brand from Clorox. See Note 5 of the Notes to the Consolidated Financial Statements. The increase in prepaid expenses was due to a reclassification of the deferred tax assets from long-term to current based on an analysis of the composition of the deferred tax assets. Offsetting some of the increase were decreases in inventories and prepaid overburden expense.
Property, plant and equipment, net of accumulated depreciation decreased $1,224,000, or 2.5%, from the year-end balance in fiscal 2003. The decrease in property, plant and equipment was due to normal depreciation expense exceeding capital investments. Offsetting part of this decrease was the adoption of EITF 04-02 “Whether Mineral Rights are Tangible or Intangible Assets,” which required the Company to reclassify $1,205,000 from intangible assets to property, plant and equipment. Total liabilities decreased $1,192,000, or 2.1%, during fiscal 2004. Current liabilities increased $1,802,000 or 7.1% during fiscal 2004, primarily due to increased salaries, wages and commissions payable, accrued trade promotions, and other accrued expenses. The settlement of patent infringement litigation, described in Note 2 of the Notes of the Consolidated Financial Statements, drove the increase in other accrued expenses. Offsetting some of the

18
increase was a decrease in accounts payable. Long-term debt decreased approximately $4,000,000 due to principal payments. Expectations The Company believes that sales for fiscal 2005 should show a one to three percent increase over those reported in fiscal 2004. The Company continues to focus on replacing low margin business with higher margin business, while also focusing on new product development. The Company anticipates continuing the progress made in lowering non-fuel manufacturing costs and improving branded product mix in fiscal 2005. Also, the Company does not expect any significant non-recurring charges in the upcoming fiscal year. Therefore, the Company estimates earnings per diluted share for fiscal 2005 to be in the range of $1.20 to $1.30. Liquidity and Capital Resources Working capital increased $5,549,000 during fiscal 2004 to $40,945,000, primarily due to increased cash and cash equivalents, investments in Treasury and debt securities, and prepaid expenses and other and decreased accounts payable. The increase in cash and investments was due to the improved financial performance of the Company and the fact that capital expenditures continued to be less than depreciation and amortization. In addition, the Company received $2,241,000 associated with the termination of two split-dollar life insurance plans and the $325,000 for the sale of its dog treats business. In fiscal 2003 the Company’s cash position was reduced by over $6,000,000 spent to consummate the purchase of the Jonny Cat brand from Clorox. Partially offsetting some of the increase in working capital were increases in other accrued expenses. These increases were driven in large part by increased legal expenses and settlement costs associated with the PSN lawsuit. Cash provided by operating activities was used to fund capital expenditures of $6,067,000, payments on long-term debt of $4,000,000, repurchases of treasury stock of $1,824,000 and dividend payments of $1,998,000. Total cash and investment balances held by the Company’s foreign subsidiaries at July 31, 2004 and July 31, 2003 were $3,633,000 and $2,557,000, respectively. The increase in foreign cash and investments was driven by the improved operating performance in the Company’s Canadian subsidiary. Accounts receivable, less allowance for doubtful accounts, increased by 1.7%, or $401,000 for fiscal 2004. During fiscal 2004 the Company experienced a decrease in bad debts expense, from the $387,000 in fiscal 2003 to $201,000 in fiscal 2004. The Company maintains policies and practices to monitor the creditworthiness of its customers. These policies include maintaining and monitoring a list of customers whose creditworthiness has diminished. The total balance of accounts receivable for accounts on that list represents approximately 1.8% and 1.4% of the Company’s outstanding receivables at July 31, 2004 and 2003 respectively. The table listed on the following page summarizes the Company’s contractual obligations and commercial commitments at July 31, 2004 for the timeframes listed: CONTRACTUAL OBLIGATIONS
Payments Due by Period Contractual Obligations Total Less Than 1 Year 1 – 3 Years 4 – 5 Years After 5 Years
Long-Term Debt $ 27,400,000 $ 4,080,000 $ 7,160,000 $ 8,160,000 $ 8,000,000 Operating Leases 12,900,000 1,656,000 2,651,000 2,170,000 6,423,000 Capital Leases 123,000 31,000 67,000 25,000
Unconditional Purchase Obligations
2,932,000
2,932,000
--
--
--
Total Contractual Cash Obligations
$ 43,355,000
$ 8,699,000
$ 9,878,000
$ 10,355,000
$ 14,423,000
19
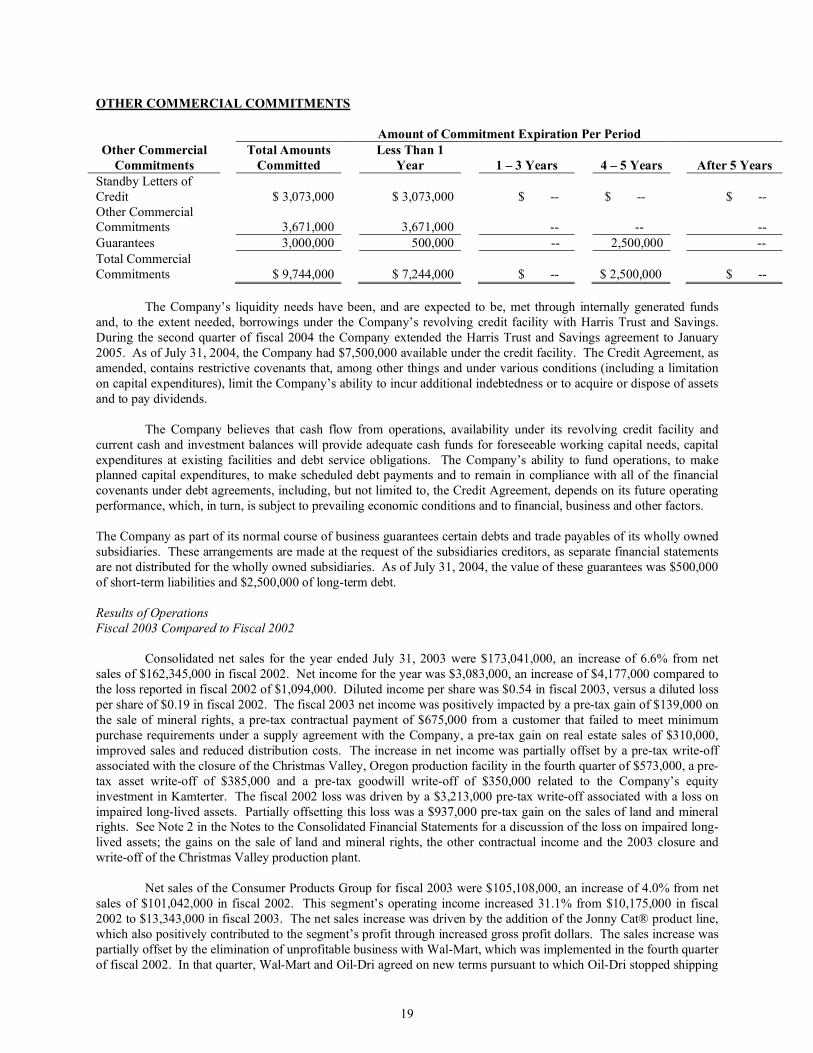
OTHER COMMERCIAL COMMITMENTS
Amount of Commitment Expiration Per Period Other Commercial
Commitments Total Amounts
Committed Less Than 1
Year 1 – 3 Years 4 – 5 Years After 5 Years Standby Letters of Credit
$ 3,073,000
$ 3,073,000
$ -- --
$ --
$ -- --
Other Commercial Commitments
3,671,000
3,671,000
-- --
--
-- --
Guarantees 3,000,000 500,000 -- 2,500,000 -- Total Commercial Commitments
$ 9,744,000
$ 7,244,000
$ -- --
$ 2,500,000
$ -- --
The Company’s liquidity needs have been, and are expected to be, met through internally generated funds and, to the extent needed, borrowings under the Company’s revolving credit facility with Harris Trust and Savings. During the second quarter of fiscal 2004 the Company extended the Harris Trust and Savings agreement to January 2005. As of July 31, 2004, the Company had $7,500,000 available under the credit facility. The Credit Agreement, as amended, contains restrictive covenants that, among other things and under various conditions (including a limitation on capital expenditures), limit the Company’s ability to incur additional indebtedness or to acquire or dispose of assets and to pay dividends. The Company believes that cash flow from operations, availability under its revolving credit facility and current cash and investment balances will provide adequate cash funds for foreseeable working capital needs, capital expenditures at existing facilities and debt service obligations. The Company’s ability to fund operations, to make planned capital expenditures, to make scheduled debt payments and to remain in compliance with all of the financial covenants under debt agreements, including, but not limited to, the Credit Agreement, depends on its future operating performance, which, in turn, is subject to prevailing economic conditions and to financial, business and other factors. The Company as part of its normal course of business guarantees certain debts and trade payables of its wholly owned subsidiaries. These arrangements are made at the request of the subsidiaries creditors, as separate financial statements are not distributed for the wholly owned subsidiaries. As of July 31, 2004, the value of these guarantees was $500,000 of short-term liabilities and $2,500,000 of long-term debt. Results of Operations Fiscal 2003 Compared to Fiscal 2002 Consolidated net sales for the year ended July 31, 2003 were $173,041,000, an increase of 6.6% from net sales of $162,345,000 in fiscal 2002. Net income for the year was $3,083,000, an increase of $4,177,000 compared to the loss reported in fiscal 2002 of $1,094,000. Diluted income per share was $0.54 in fiscal 2003, versus a diluted loss per share of $0.19 in fiscal 2002. The fiscal 2003 net income was positively impacted by a pre-tax gain of $139,000 on the sale of mineral rights, a pre-tax contractual payment of $675,000 from a customer that failed to meet minimum purchase requirements under a supply agreement with the Company, a pre-tax gain on real estate sales of $310,000, improved sales and reduced distribution costs. The increase in net income was partially offset by a pre-tax write-off associated with the closure of the Christmas Valley, Oregon production facility in the fourth quarter of $573,000, a pre-tax asset write-off of $385,000 and a pre-tax goodwill write-off of $350,000 related to the Company’s equity investment in Kamterter. The fiscal 2002 loss was driven by a $3,213,000 pre-tax write-off associated with a loss on impaired long-lived assets. Partially offsetting this loss was a $937,000 pre-tax gain on the sales of land and mineral rights. See Note 2 in the Notes to the Consolidated Financial Statements for a discussion of the loss on impaired long-lived assets; the gains on the sale of land and mineral rights, the other contractual income and the 2003 closure and write-off of the Christmas Valley production plant. Net sales of the Consumer Products Group for fiscal 2003 were $105,108,000, an increase of 4.0% from net sales of $101,042,000 in fiscal 2002. This segment’s operating income increased 31.1% from $10,175,000 in fiscal 2002 to $13,343,000 in fiscal 2003. The net sales increase was driven by the addition of the Jonny Cat® product line, which also positively contributed to the segment’s profit through increased gross profit dollars. The sales increase was partially offset by the elimination of unprofitable business with Wal-Mart, which was implemented in the fourth quarter of fiscal 2002. In that quarter, Wal-Mart and Oil-Dri agreed on new terms pursuant to which Oil-Dri stopped shipping

20
private label cat litter to Wal-Mart distribution centers where the freight cost (a cost borne by Oil-Dri) was prohibitive. This change caused sales to be reduced but profits to be increased in terms of both gross profit margin and absolute dollars. The expenses related to the addition of the Jonny Cat product line and subsequent marketing investments caused the segment’s operating expenses to increase, but that increase was more than offset by the gross profit increase. The marketing investments associated with the line are intended to stabilize the base Jonny Cat business and provide a platform for future growth. Net sales of the Specialty Products Group for fiscal 2003 were $24,990,000, an increase of 2.0% from net sales of $24,499,000 in fiscal 2002. This segment’s operating income increased 15.1% from $4,280,000 in fiscal 2002 to $4,927,000 in fiscal 2003. The profit increase was driven by improved sales of PelUnite® and PelUnite Plus™ animal feed binding agents and by improved pricing from the bleaching earth products due to changes in the geographical sales mix. Net sales of the Crop Production and Horticultural Products Group for fiscal 2003 were $21,820,000, an increase of 27.2% from net sales of $17,154,000 in fiscal 2002. The net sales increase resulted primarily from increased sales of Agsorb® drying agents and agricultural carriers, and increased sales of Pro’s Choice® sports field products. The agricultural carriers business has seen increased sales due to the spread of rotation resistant corn rootworm beetles. The sports field products have seen strong growth in the golf course market place. This segment’s operating income increased by 11.2% from $2,350,000 in fiscal 2002 to $2,614,000 in fiscal 2003. The increase in operating income was driven by the gross profit change from increased sales. Net sales of the Industrial and Automotive Products Group for fiscal 2003 were $21,123,000, an increase of 7.5% from net sales of $19,650,000 in fiscal 2002. This segment’s operating income decreased from a profit of $18,000 in fiscal 2002 to a loss of $826,000 in fiscal 2003. The loss was driven by higher manufacturing processing labor and expenses. Also, the fuel price increase seen in the second half of fiscal 2003 negatively impacted the income of this segment. Consolidated gross profit as a percentage of net sales for fiscal 2003 increased to 20.6% from 19.1% in fiscal 2002. A favorable sales mix led by the acquired Jonny Cat product line in the Consumer Products Group, improved sales of PelUnite Plus and price increases in the Specialty Product Group, increased sales of Agsorb and sports field products in Crop Production and Horticultural Products Group and the elimination of sales to unprofitable geographic areas all contributed to this increase. The Company’s year-to-date fuel costs are down approximately 4% as compared to fiscal 2002. While fuel was down for the year, rate increases in the second half of the year drove the overall expenses to be down only 4% compared to fiscal 2002. The Christmas Valley closure negatively impacted the overall gross profit. Approximately $484,000 of the $573,000 write-off was reflected in cost of goods sold. This adjustment reduced the gross profit percentage from 20.9% for the year, down to the final reported level of 20.6%. The remaining $89,000 of the write-off was reported as part of other income and expense. Operating expenses as a percentage of net sales for fiscal 2003 decreased to 16.8% from the 19.2% reported in fiscal 2002. Excluding the other contractual income in 2003 and the loss on impaired assets in 2002, operating expenses for 2003 would have remained flat at 17.2% for both years. A good portion of the absolute dollar value increase in operating expenses in 2003 was experienced in an effort to support the new Jonny Cat product line. The increased sales from this line offset the dollar value increase in expense and therefore led to the consistent expense ratio between the two years, after the contractual income and loss on impaired asset are excluded. Interest expense and interest income for fiscal 2003 decreased 5.9% from fiscal 2002 due to the reduction in debt. The Company’s effective tax rate was 29.0% of pre-tax income in fiscal 2003 versus 29.8% in fiscal 2002. The effective tax rate was consistent between the years. Total assets of the Company increased $1,788,000 or 1.4% during fiscal 2003. Current assets increased $3,086,000 or 5.4% from the fiscal 2002 year-end balances, primarily due to increases in accounts receivable, current deferred income taxes and inventory. The accounts receivable increase was related to the improved sales in the fourth quarter. Quarterly sales were up $5,449,000 or 13.9% from the fourth quarter of fiscal 2002. Offsetting some of the

21
increase were decreases in other receivables and prepaid overburden expense. Other receivables decreased due to a change from taxes receivable to taxes payable driven by the profitability of the Company. The prepaid overburden account was reduced by the extra overburden amortization that was incurred in fiscal 2003. See Note 2 in the Notes to the Consolidated Financial Statements for a discussion of this issue. Cash, cash equivalents and investments increased 2.7%, or $434,000, from fiscal 2002 despite the fact that the Company spent over $6,000,000 in cash to consummate the Purchase from a wholly owned subsidiary of Clorox. Positive operating cash flows drove the combined cash and investments in treasury securities balances to a higher level than reported for fiscal 2002. Property, plant and equipment, net of accumulated depreciation increased $404,000, or 0.8%, from the year-end balance in fiscal 2002. The increase in property, plant and equipment associated with the Purchase and other normal capital investments were substantially offset by normal depreciation expense on the Company’s pre-existing fixed asset base and the Christmas Valley, Oregon write-off. See Note 2 in the Notes to the Consolidated Financial Statements. Total liabilities increased $1,845,000, or 3.3%, during fiscal 2003. Current liabilities increased $5,342,000 or 26.9% during fiscal 2003, as a result of increases in current maturities of notes payable, accounts payable, freight payables, accrued trade promotions, and salaries, wages and commissions payable. The increased business activity in the fourth quarter helped drive increases in several of the payable balances. Long-term debt decreases $2,850,000 due to principal payments. Significant Accounting Policies Management’s discussion and analysis of the financial condition and results of operations are based upon the Company’s consolidated financial statements, which have been prepared in accordance with the generally accepted accounting principles of the United States. The Company annually reviews its financial reporting and disclosure practices and accounting policies to ensure that its financial reporting and disclosures provides accurate and transparent information relative to the current economic and business environment. The Company believes that of its significant accounting policies stated in Note 1 of the Notes to the Consolidated Financial Statements, the policies listed below involve a higher degree of judgment and/or complexity. The preparation of the financial statements in conformity with generally accepted accounting principles requires management to make estimates and assumptions that affect the reported amount of assets and liabilities, as well as the reported amounts of revenues and expenses during the reporting period. Significant estimates included inventory reserves, allowance for doubtful accounts and the amount of prepaid overburden. Actual results could differ from these estimates. Revenue Recognition. Under the terms of its sales agreements with customers, the Company recognizes revenue when title is transferred. Upon shipment an invoice is generated that sets the fixed and determinable price. Sales returns and allowances, which have historically not been material, are reviewed to determine if any additional reserve is necessary. Sales returns and allowances are not material due to the nature of the Company’s business. Allowance for doubtful accounts are evaluated by the Company utilizing a combination of a historical percentage of sales by division and specific customer account analysis. The Company maintains and monitors a list of customers whose creditworthiness has diminished. This list is used as part of the specific customer account analysis. Inventories. Inventories are valued at the lower of cost (first-in, first-out) or market. Inventory costs include the cost of raw materials, packaging supplies, labor and other overhead costs. The Company performs a detailed review of its inventory items to determine if an obsolescence reserve adjustment is necessary. The review surveys all of the Company’s operating facilities and sales divisions to ensure that both historical issues and new market trends are considered. The allowance not only considers specific items, but also takes into consideration the overall value of the inventory as of the balance sheet date. The inventory obsolescence reserve values at July 31, 2004, 2003 and 2002 were $641,000, $568,000 and $341,000 respectively. Prepaid Overburden Removal and Mining Costs. As part of its overall operations, the Company mines sorbent materials on property that it either owns or leases. A significant part of the Company’s overall mining cost is incurred during the process of removing the overburden (non-usable material) from the mine site, thus exposing the sorbent material that is then used in a majority of the Company’s production processes. The cost of the overburden removal is recorded in a prepaid expense account and, as the usable sorbent material is mined, the

22
prepaid overburden removal expense is amortized over the estimated available material. The Company had $2,407,000 and $2,492,000 of prepaid expense recorded on its consolidated balance sheet, as of July 31, 2004 and July 31, 2003, respectively. The Company amortized to current expense approximately $2,895,000 of previously recorded prepaid expense in fiscal 2004, $3,552,000 in fiscal 2003 and $3,918,000 in fiscal 2002. To determine the value of prepaid overburden, the Company’s mining personnel survey the individual mining areas. The estimation work is conducted utilizing a combination of manual and computerized survey tools. Once the survey data is recorded it is charted on numerous topographical maps of the mining areas. Finally based on the survey data, maps and professional judgment of the mining engineers’ estimates are developed. During the normal course of the Company’s overburden removal activities the Company performs on-going reclamation activities. As overburden is removed from a pit, it is hauled to a previously mined pit and used to refill the older site. This process allows the Company to continuously reclaim older pits and dispose of overburden simultaneously, therefore minimizing the liability for the reclamation function. Additionally, it is Oil-Dri’s policy to capitalize the purchase cost of land and mineral rights, including associated legal fees, survey fees and real estate fees. The costs of obtaining mineral patents, including legal fees and drilling expenses, are also capitalized. Development costs of determining the nature and amount of mineral reserves and any prepaid royalties that are offsetable against future royalties due upon extraction of the mineral are also capitalized. All exploration related costs are expensed as incurred.
Stock Based Compensations. The Company applies the intrinsic value method under Accounting Principles Board Opinion (“APB”) No. 25, “Accounting for Stock Issued to Employees”, and related other interpretations to account for its stock option plans. All the outstanding options issued under the plans have had exercise prices equal to the market value on the day of issue. Accordingly, the Company has not recorded any compensation expense associated with its issuance of stock options. The Company has recorded as expense the fair market value on the date of issue of any restricted stock awards granted. The fair value of the issued stock options is estimated on the grant date using the Black-Scholes Option Pricing Method. Had the Company accounted for stock-based compensation in accordance with SFAS No. 123, “Accounting for Stock-Based Compensation,” the Company would have reported in 2004, 2003 and 2002 additional employee compensation expense (net of related tax effect) of approximately $301,000, $686,000 and $769,000 respectively. Recently Issued Accounting Standards
In December 2003, the FASB issued a revision to Statement of Financial Accounting Standards (“SFAS”)
No. 132 (revised 2003), “Employers’ Disclosures about Pensions and Other Postretirement Benefits,” effective for fiscal periods beginning after December 15, 2003. This revised statement requires additional annual disclosures regarding types of plan assets, investment strategy, future plan contributions, expected benefit payments and other items. The statement also requires quarterly disclosure of the components of net periodic benefit cost and plan contributions. The Company has adopted SFAS No. 132 (revised 2003) in fiscal 2004.
In March of 2004, The Emerging Issues Task Force (EITF) issued EITF 04-02, “Whether Mineral Rights
are Tangible or Intangible Assets and Related Issues.” Under the provisions of EITF 04-02, mineral rights, as defined in the Issue, are tangible assets. The guidance in this EITF became effective for the first reporting period beginning after April 29, 2004. This guidance caused the Company to reclassify certain assets from intangible to tangible assets in the Consolidated Balance Sheet dated July 31, 2004 and prior years. The adoption of EITF 04-02 required the Company to reclassify $1,205,000 from intangible assets to property, plant and equipment.
In March 2004, the Emerging Issues Task Force (“EITF”) reached a consensus on Issue 03-06, “Participating Securities and the Two-Class Method under SFAS 128 on EPS” (“EITF 03-06”). EITF 03-06 provided guidance in determining when the “Two-Class” method, as defined in SFAS No. 128 “Earnings per Share” is to be utilized in calculating earnings per share. The Company was required to adopt EITF 03-06 for the quarter and year ended July 31, 2004. The Common Stock of the Company has a 33.3% dividend preference to the Class B Common Stock. The Class B Common Stock, which has ten votes per share as opposed to one vote per share for the Common Stock, may be converted at any time on a one for one basis for the Common Stock at the option of the holder of the Class B Common Stock. EITF 03-06 requires the income per share for each class of common stock to be calculated assuming 100% of the Company's earnings are distributed as dividends to each class of common stock.

23
The effective result of EITF 03-06 has been that the basic earnings per share for the Common Stock will be approximately 33% greater than the basic earnings per share of the Class B Common Stock. Foreign Operations Net sales by the Company’s foreign subsidiaries during fiscal 2004 were $13,397,000 or 7.2% of total Company sales. This represents an increase of 17.5% from fiscal 2003, in which foreign subsidiary sales were $11,400,000 or 6.6% of total Company sales. This increase in sales was seen largely in the Company’s Canadian operation where the addition of the Jonny Cat product line, positive currency movement of the Canadian dollar and price increases positively impact its results. For fiscal 2004, the foreign subsidiaries reported a gain of $615,000, an improvement of $334,000 from the $281,000 gain reported in fiscal 2003. The improvement for the year was due to improved sales and lower distribution costs at the Company’s Canadian operation. Identifiable assets of the Company’s foreign subsidiaries as of July 31, 2004 were $11,271,000 compared to $9,737,000 as of July 31, 2003. Most of the increase in identifiable assets was in cash and investments at the Company’s Canadian operation. Net sales by the Company’s foreign subsidiaries during fiscal 2003 were $11,400,000 or 6.6% of total Company sales. This represents an increase of 6.0% from fiscal 2002, in which foreign subsidiary sales were $10,754,000 or 6.6% of total Company sales. This increase in sales was seen largely in the Company’s Canadian operation where the addition of the Jonny Cat product line and price increases positively impacted its results. For fiscal 2003, the foreign subsidiaries reported a gain of $281,000, an improvement of $188,000 from the $93,000 gain reported in fiscal 2002. The improvement for the year was due to improved sales and lower material costs at the Company’s Canadian operation. Identifiable assets of the Company’s foreign subsidiaries as of July 31, 2003 were $9,737,000 compared to $9,542,000 as of July 31, 2002. Forward-Looking Statements Certain statements in this report, including, but not limited to, those under the heading “Expectations” and those statements elsewhere in this report that use forward-looking terminology such as “expect,” “would,” “could,” “should,” “estimates,” “anticipates” and “believes” are “forward-looking statements” within the meaning of that term in the Securities Exchange Act of 1934, as amended. Actual results may differ materially from those reflected in these forward-looking statements, due to uncertainties such as continued vigorous competition in the grocery, mass merchandiser and club markets and specialty product markets, the level of success of new products, and the cost of product introductions and promotions in the consumer market. Forward-looking statements are also subject to the risk of changes in market conditions in the overall economy, energy prices, the risk of war or international instability and, for the fluids purification and agricultural markets, changes in planting activity, crop quality and overall agricultural demand, including export demand, increasing regulation of the food chain and foreign exchange rate fluctuations. Other factors affecting these forward-looking statements may be detailed from time to time in other reports filed by the Company with the Securities and Exchange Commission.

24
Item 7a. Quantitative and Qualitative Disclosures About Market Risk The Company is exposed to interest rate risk and employs policies and procedures to manage its exposure to changes in the market risk of its cash equivalents and short-term investments. The Company had two interest rate swap agreements as of July 31, 2004. The Company believes that the market risk arising from holdings of its financial instruments is not material. The Company is exposed to currency risk as it relates to certain accounts receivables and the Company’s foreign operations. The Company has always determined that the currency risk is immaterial to the overall presentation of the financial statements. However, the Company began a program in fiscal 2004 of hedging certain receivable balances in a further attempt to minimize the risk. The Company is exposed to regulatory risk in the fluid purification and agricultural markets, principally as a result of the risk of increasing regulation of the food chain in the United States and Europe. The Company actively monitors developments in this area, both directly and through trade organizations of which it is a member. The Company is exposed to commodity price risk with respect to natural gas. The Company has contracted for a portion of its fuel needs for fiscal 2005 using forward purchase contracts to manage the volatility related to this exposure. These contracts will reduce the volatility in fuel prices, and the weighted average cost of these contracts has been estimated to be approximately 11.5% higher than the contracts for fiscal 2004. These contracts were entered into during the normal course of business and no contracts were entered into for speculative purposes. The table below provides information about the Company’s natural gas future contracts, which are sensitive to changes in commodity prices, specifically natural gas prices. For the future contracts the table presents the notional amounts in MMBtu’s, the weighted average contract prices, and the total dollar contract amount, which will mature by July 31, 2005. The Fair Value was determined using the “Most Recent Settle” price for the “Henry Hub Natural Gas” option contract prices as listed by the New York Mercantile Exchange on September 28, 2004.
Commodity Price Sensitivity Natural Gas Future Contracts
For the Year Ending July 31, 2005 Expected 2005 Maturity Fair Value
Natural Gas Future Volumes (MMBtu) 464,400
Weighted Average Price (Per MMBtu) $6.31
Contract Amount ($ U.S., in thousands) $2,932.5 $3,021.7 Factors that could influence the fair value of the natural gas contracts, include, but are not limited to, the creditworthiness of the Company’s natural gas suppliers, the overall general economy, developments in world events, and the general demand for natural gas by the manufacturing sector, seasonality and the weather patterns throughout the United States and the world. Some of these same events have allowed the Company to mitigate the impact of the natural gas contracts by the continued and in some cases expanded use of recycled oil in our manufacturing processes. Accurate estimates of the impact that these contracts may have on the Company’s fiscal 2004 financial results are difficult to make due to the inherent uncertainty of future fluctuations in option contract prices in the natural gas options market.
25
(This page intentionally left blank.)

26
Item 8. Financial Statements and Supplementary Data
CONSOLIDATED BALANCE SHEETS
July 31, ASSETS 2004 2003
(in thousands of dollars) Current Assets Cash and cash equivalents...................................................................... $ 6,348 $ 4,753 Investment in treasury securities............................................................ 13,942 11,917 Investment in debt securities.................................................................. 2,779 -- Accounts receivable, less allowance of $608 in 2004 and $441 in 2003 ........................................................................................ 24,169 23,768 Inventories ............................................................................................... 12,399 12,819 Prepaid overburden removal expense..................................................... 2,407 2,492 Deferred income taxes ............................................................................. 2,330 1,473 Prepaid expenses and other assets.......................................................... 3,607 3,408 Total Current Assets .............................................................. 67,981 60,630 Property, Plant and Equipment, at Cost Buildings and leasehold improvements ................................................ 22,319 21,928 Machinery and equipment ...................................................................... 94,215 93,078 Office furniture and equipment ............................................................... 10,722 10,137 Vehicles ................................................................................................... 4,368 4,739 131,624 129,882 Less accumulated depreciation and amortization .................................. (97,696) (92,250) 33,928 37,632 Construction in progress ........................................................................ 3,619 2,563 Land ......................................................................................................... 10,255 8,831 Total Property, Plant and Equipment, Net .......................... 47,802 49,026 Other Assets Goodwill .................................................................................................... 5,162 5,115 Intangibles (Net of accumulated amortization of $2,611 in 2004 and $2,474 in 2003).............................................. 2,389 3,869 Deferred income taxes................................................................................ 1,556 2,617 Other........................................................................................................... 3,985 5,566 Total Other Assets.................................................................. 13,092 17,167 Total Assets............................................................................................... $ 128,875 $ 126,823 The accompanying notes are an integral part of the consolidated financial statements.
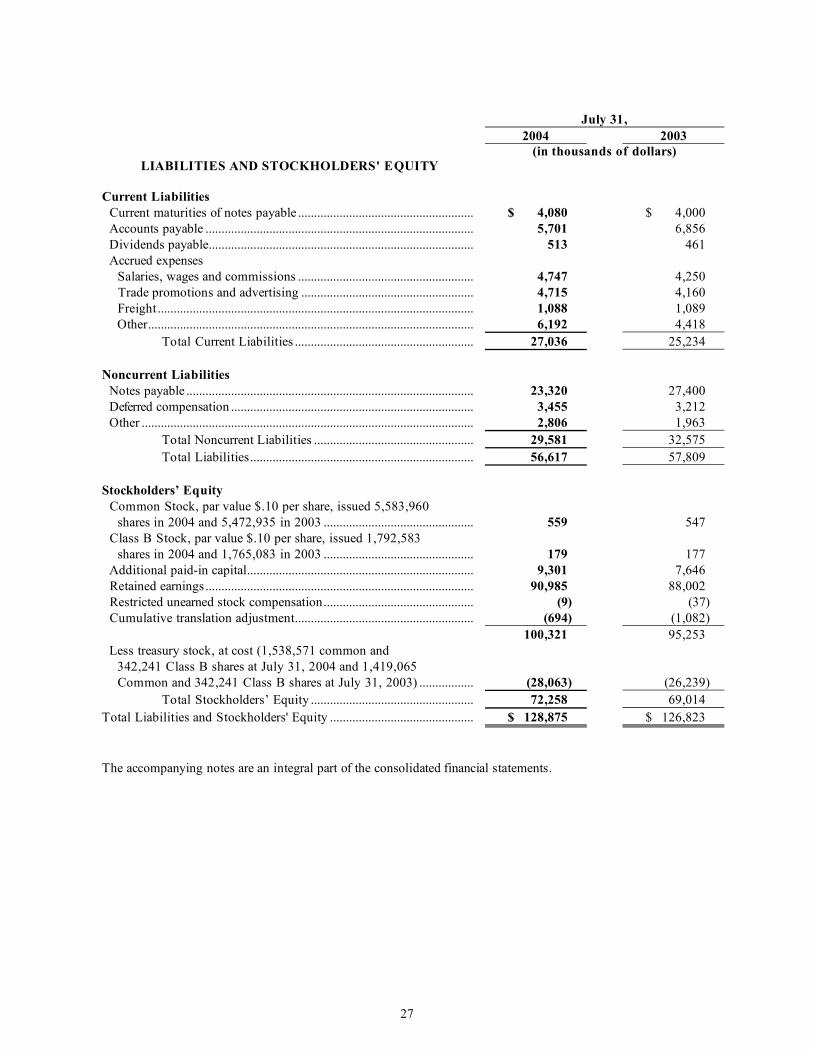
27
July 31,
2004 2003
LIABILITIES AND STOCKHOLDERS' EQUITY
(in thousands of dollars)
Current Liabilities Current maturities of notes payable ....................................................... $ 4,080 $ 4,000 Accounts payable .................................................................................... 5,701 6,856 Dividends payable................................................................................... 513 461 Accrued expenses Salaries, wages and commissions ....................................................... 4,747 4,250 Trade promotions and advertising ...................................................... 4,715 4,160 Freight................................................................................................... 1,088 1,089 Other...................................................................................................... 6,192 4,418 Total Current Liabilities ........................................................ 27,036 25,234 Noncurrent Liabilities Notes payable .......................................................................................... 23,320 27,400 Deferred compensation ............................................................................ 3,455 3,212 Other ........................................................................................................ 2,806 1,963 Total Noncurrent Liabilities .................................................. 29,581 32,575 Total Liabilities...................................................................... 56,617 57,809 Stockholders’ Equity Common Stock, par value $.10 per share, issued 5,583,960 shares in 2004 and 5,472,935 in 2003 ............................................... 559 547 Class B Stock, par value $.10 per share, issued 1,792,583 shares in 2004 and 1,765,083 in 2003 ............................................... 179 177 Additional paid-in capital....................................................................... 9,301 7,646 Retained earnings.................................................................................... 90,985 88,002 Restricted unearned stock compensation............................................... (9) (37) Cumulative translation adjustment........................................................ (694) (1,082) 100,321 95,253 Less treasury stock, at cost (1,538,571 common and 342,241 Class B shares at July 31, 2004 and 1,419,065 Common and 342,241 Class B shares at July 31, 2003) ................. (28,063) (26,239) Total Stockholders’ Equity ................................................... 72,258 69,014 Total Liabilities and Stockholders' Equity ............................................. $ 128,875 $ 126,823 The accompanying notes are an integral part of the consolidated financial statements.
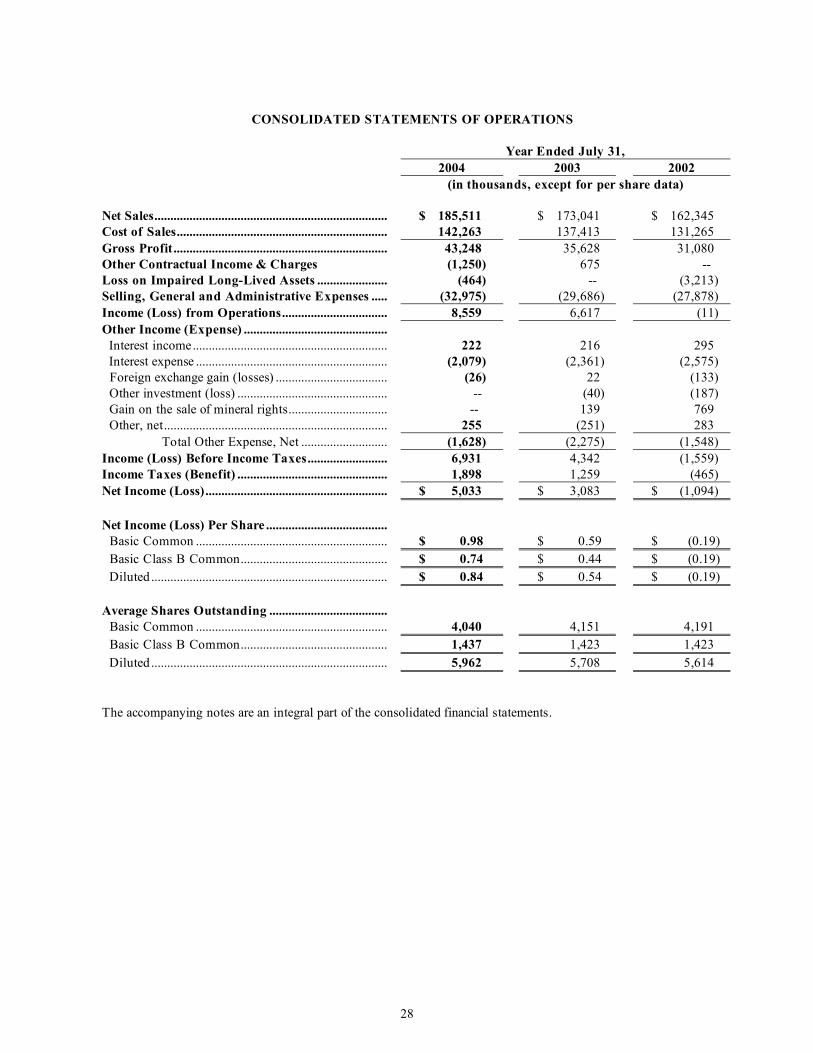
28
CONSOLIDATED STATEMENTS OF OPERATIONS
Year Ended July 31, 2004 2003 2002
(in thousands, except for per share data) Net Sales......................................................................... $ 185,511 $ 173,041 $ 162,345 Cost of Sales.................................................................. 142,263 137,413 131,265 Gross Profit................................................................... 43,248 35,628 31,080 Other Contractual Income & Charges (1,250) 675 -- Loss on Impaired Long-Lived Assets ...................... (464) -- (3,213) Selling, General and Administrative Expenses ..... (32,975) (29,686) (27,878) Income (Loss) from Operations................................. 8,559 6,617 (11) Other Income (Expense) ............................................. Interest income............................................................. 222 216 295 Interest expense ............................................................ (2,079) (2,361) (2,575) Foreign exchange gain (losses) ................................... (26) 22 (133) Other investment (loss) ............................................... -- (40) (187) Gain on the sale of mineral rights............................... -- 139 769 Other, net...................................................................... 255 (251) 283 Total Other Expense, Net ........................... (1,628) (2,275) (1,548) Income (Loss) Before Income Taxes......................... 6,931 4,342 (1,559) Income Taxes (Benefit) ............................................... 1,898 1,259 (465) Net Income (Loss)......................................................... $ 5,033 $ 3,083 $ (1,094) Net Income (Loss) Per Share ...................................... Basic Common ............................................................ $ 0.98 $ 0.59 $ (0.19) Basic Class B Common.............................................. $ 0.74 $ 0.44 $ (0.19) Diluted .......................................................................... $ 0.84 $ 0.54 $ (0.19) Average Shares Outstanding ..................................... Basic Common ............................................................ 4,040 4,151 4,191 Basic Class B Common.............................................. 1,437 1,423 1,423 Diluted .......................................................................... 5,962 5,708 5,614 The accompanying notes are an integral part of the consolidated financial statements.
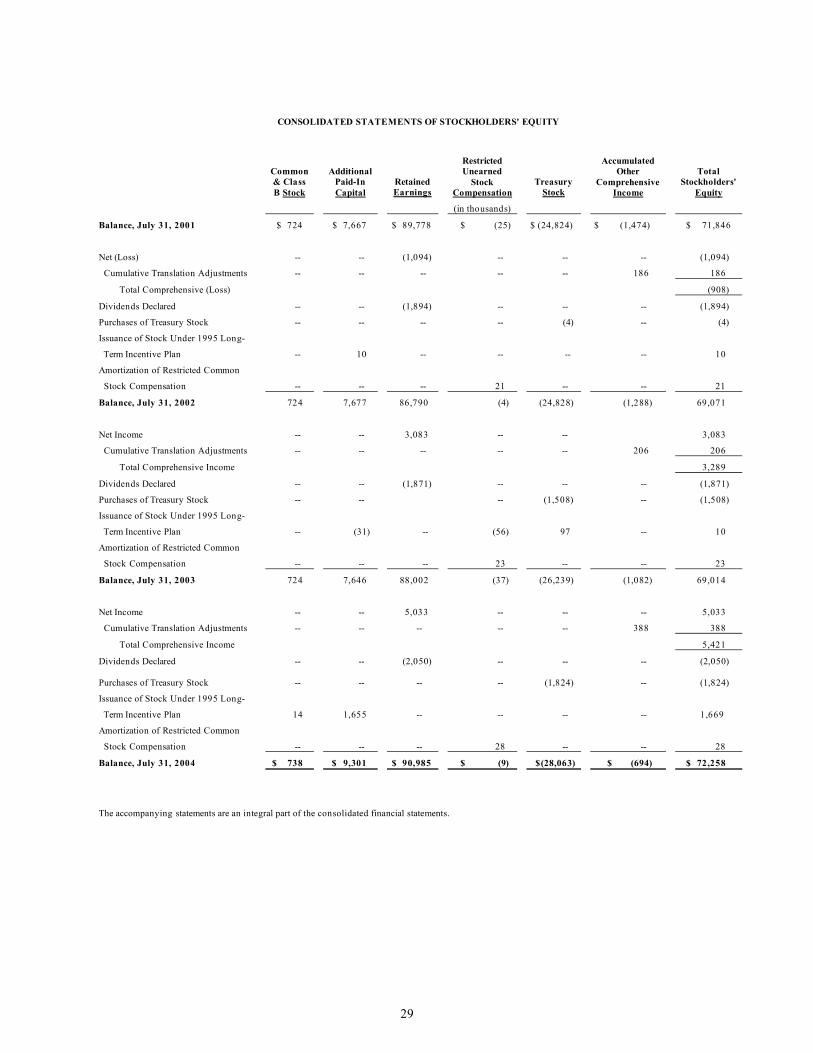
29
CONSOLIDATED STATEMENTS OF STOCKHOLDERS' EQUITY
Common & Class B Stock
Additional Paid-In Capital
Retained Earnings
Restricted Unearned
Stock Compensation
Treasury Stock
Accumulated Other
Comprehensive Income
Total Stockholders'
Equity
(in thousands)
Balance, July 31, 2001 $ 724 $ 7,667 $ 89,778 $ (25) $ (24,824) $ (1,474) $ 71,846
Net (Loss) -- -- (1,094) -- -- -- (1,094)
Cumulative Translation Adjustments -- -- -- -- -- 186 186
Total Comprehensive (Loss) (908)
Dividends Declared -- -- (1,894) -- -- -- (1,894)
Purchases of Treasury Stock -- -- -- -- (4) -- (4)
Issuance of Stock Under 1995 Long-
Term Incentive Plan -- 10 -- -- -- -- 10
Amortization of Restricted Common
Stock Compensation -- -- -- 21 -- -- 21
Balance, July 31, 2002 724 7,677 86,790 (4) (24,828) (1,288) 69,071
Net Income -- -- 3,083 -- -- 3,083
Cumulative Translation Adjustments -- -- -- -- -- 206 206
Total Comprehensive Income 3,289
Dividends Declared -- -- (1,871) -- -- -- (1,871)
Purchases of Treasury Stock -- -- -- (1,508) -- (1,508)
Issuance of Stock Under 1995 Long-
Term Incentive Plan -- (31) -- (56) 97 -- 10
Amortization of Restricted Common
Stock Compensation -- -- -- 23 -- -- 23
Balance, July 31, 2003 724 7,646 88,002 (37) (26,239) (1,082) 69,014
Net Income -- -- 5,033 -- -- -- 5,033
Cumulative Translation Adjustments -- -- -- -- -- 388 388
Total Comprehensive Income 5,421
Dividends Declared -- -- (2,050) -- -- -- (2,050)
Purchases of Treasury Stock -- -- -- -- (1,824) -- (1,824)
Issuance of Stock Under 1995 Long-
Term Incentive Plan 14 1,655 -- -- -- -- 1,669
Amortization of Restricted Common
Stock Compensation -- -- -- 28 -- -- 28
Balance, July 31, 2004 $ 738 $ 9,301 $ 90,985 $ (9) $(28,063) $ (694) $ 72,258
The accompanying statements are an integral part of the consolidated financial statements.

30
CONSOLIDATED STATEMENTS OF CASH FLOWS
Year Ended July 31,
2004 2003 2002 Cash Flows from Operating Activities (in thousands of dollars) Net Income (Loss) $ 5,033 $ 3,083 $ (1,094) Adjustments to reconcile net income (loss) to net cash provided by operating activities: Depreciation and amortization 8,057 8,534 8,785 Amortization of investment discounts (51) (113) (7) Deferred income taxes 204 (118) (817) Provision for bad debts 201 387 409 Loss on impaired assets 464 -- 3,213 Loss (gain) on the sale of fixed assets 398 549 (78) (Increase) decrease in: Accounts receivable (615) (2,737) 2,443 Other receivables -- 1,022 1,472 Inventories 108 486 3,647 Prepaid overburden removal expense 85 1,186 119 Prepaid expenses (199) 159 643 Other assets 1,775 229 (8) Increase (decrease) in: Accounts payable (823) 1,736 (671) Accrued expenses 2,825 2,470 220 Deferred compensation 243 258 185 Other liabilities 580 245 (292) Total Adjustments 13,252 14,293 19,263 Net Cash Provided by Operating Activities 18,285 17,376 18,169 Cash Flows from Investing Activities Capital expenditures (6,067) (4,882) (4,096) Proceeds from the sale of Phoebe Products Co. 325 -- -- Proceeds from sale of property, plant and equipment 311 679 319 Purchases of net assets -- (6,652) Purchases of investments in debt securities (5,217) -- -- Maturities of investments in debt securities 2,156 -- -- Purchases of investment securities (43,608) (39,197) (9,632) Dispositions of investment securities 41,672 36,475 1,814 Net Cash Used in Investing Activities (10,428) (13,577) (11,595) Cash Flows from Financing Activities Principal payments on long-term debt (4,000) (2,850) (2,156) Dividends paid (1,998) (1,883) (1,894) Purchase of treasury stock (1,824) (1,518) (14) Proceeds from issuance of common stock 1,337 10 10 Other, net 223 41 190 Net Cash Used in Financing Activities (6,262) (6,200) (3,864) Net Increase (Decrease) in Cash and Cash Equivalents 1,595 (2,401) 2,710 Cash and Cash Equivalents, Beginning of Year 4,753 7,154 4,444 Cash and Cash Equivalents, End of Year $ 6,348 $ 4,753 $ 7,154 The accompanying notes are an integral part of the consolidated financial statements.
31
NOTE 1 – Summary of Significant Accounting Policies Principles of Consolidation The consolidated financial statements include the accounts of Oil-Dri Corporation of America and its subsidiaries, all of which are wholly owned. All significant intercompany balances and transactions have been eliminated from the consolidated financial statements. Management Use of Estimates The preparation of financial statements in conformity with accounting principles generally accepted in the United States of America requires management to make estimates and assumptions that affect the reported amounts of assets and liabilities and disclosure of contingent assets and liabilities as of the date of the financial statements and the reported amounts of revenues and expenses during the reporting period. Actual results could differ from those estimates. Revenue Recognition Under the terms of its sales agreements with customers, the Company recognizes revenue when title is transferred. At the time of shipment an invoice is generated which sets the fixed and determinable price. Sales returns and allowances are not material due to the nature of the Company’s business. Trade Receivables Trade receivables are recognized when the risk of loss and title pass to the customer consistent with the Revenue Recognition policy. The company provides for an allowance for doubtful accounts based on its historical experience and a periodic review of its accounts receivable including a review of the overall aging of accounts and analysis of specific accounts. A customer is determined to be uncollectible when the Company has completed its internal collection procedures including termination of shipments, direct customer contact and formal demand of payment. Outside collection agencies are retained by the Company in its collection efforts. Past due status is determined based on contractual terms and customer payment history. Income Taxes Deferred income taxes reflect the impact of temporary differences between the assets and liabilities recognized for financial reporting purposes and amounts recognized for tax purposes. Historically no provision had been made for possible income taxes which may be paid on the distribution of approximately $22,608,000, $19,533,000 and $18,391,000 as of July 31, 2004, 2003 and 2002, respectively, of retained earnings of foreign subsidiaries, as substantially all such amounts were intended to be indefinitely invested in these subsidiaries or to be handled in such a way that no additional income taxes would be incurred when such earnings are distributed. It is generally not practicable to determine the amount of income taxes or withholding taxes that would be payable upon the remittance of assets that represent those earnings. However in 2004, a $210,000 tax expense was recorded on certain unremitted earnings of the foreign subsidiary in Switzerland. This charge was taken to reflect the estimated potential impact of repatriating certain cash balances held by that subsidiary. Translation of Foreign Currencies Assets and liabilities of foreign subsidiaries, where the local currency is the functional currency, are translated at the exchange rates in effect at period end. Income statement items are translated at the average exchange rate on a monthly basis. Resulting translation adjustments are recorded as a separate component of stockholders’ equity. Cash Equivalents and Investments in Treasury Securities Cash equivalents are highly liquid investments with maturities of three months or less when purchased. Investments in treasury securities are carried at cost, plus accrued interest, which approximates market.

32
NOTE 1 – Summary of Significant Accounting Policies (Continued)
Inventories
Inventories are valued at the lower of cost (first-in, first-out) or market. The Company recorded additional inventory obsolescence reserves of approximately $504,000, $441,000 and $275,000 for the years of 2004, 2003 and 2002 respectively. The composition of inventories as of July 31, 2004 is as follows:
2004 2003 (in thousands)
Finished goods...................................................................................................... $ 7,529 $ 7,821 Packaging.............................................................................................................. 3,130 3,718 Other ..................................................................................................................... 1,740 1,280
$ 12,399 $ 12,819 Prepaid Overburden Removal and Mining Costs As part of its overall operations, the Company mines sorbent materials on property that it either owns or leases. A significant part of the Company’s overall mining cost is incurred during the process of removing the overburden (non-usable material) from the mine site, thus exposing the sorbent material that is then used in a majority of the Company’s production processes. The cost of the overburden removal is recorded in a prepaid expense account and, as the usable sorbent material is mined, the prepaid overburden removal expense is amortized over the estimated available material. The Company had $2,407,000 and $2,492,000 of prepaid expense recorded on its consolidated balance sheet, as of July 31, 2004 and July 31, 2003, respectively. The Company amortized to current expense approximately $2,895,000 of previously recorded prepaid expense in fiscal 2004, $3,552,000 in fiscal 2003 and $3,918,000 in fiscal 2002. During the normal course of the Company’s overburden removal activities the Company performs on-going reclamation activities. As overburden is removed from a pit, it is hauled to a previously mined pit and used to refill the older site. This process allows the Company to continuously reclaim older pits and dispose of overburden simultaneously, therefore minimizing the liability for the reclamation function. Additionally, it is Oil-Dri’s policy to capitalize the purchase cost of land and mineral rights, including associated legal fees, survey fees and real estate fees. The costs of obtaining mineral patents, including legal fees and drilling expenses, are also capitalized. Development costs of determining the nature and amount of mineral reserves and any prepaid royalties that are offsetable against future royalties due upon extraction of the mineral are also capitalized. All exploration related costs are expensed as incurred. Concentration of Credit Risk Financial instruments, which potentially subject the Company to concentrations of credit risk, consist principally of cash investments and accounts receivable. The Company places its cash investments in government-backed instruments, both foreign and domestic, and with other quality institutions. Concentrations of credit risk with respect to accounts receivable are subject to the financial condition of certain major customers, principally the customer referred to in Note 3 of the Notes to the Consolidated Financial Statements. The Company generally does not require collateral to secure customer receivables.

33
NOTE 1 – Summary of Significant Accounting Policies (Continued) Property, Plant and Equipment Property, plant and equipment expenditures are generally depreciated using the straight-line method over their estimated useful lives which are listed below. Major improvements and betterments are capitalized while maintenance and repairs that do not extend the useful life of the applicable assets are expensed as incurred. Years
Buildings and leasehold improvements ............................................................... 5-30 Machinery and equipment.................................................................................... 2-20 Office furniture and equipment............................................................................ 2-10 Vehicles ................................................................................................................ 2-8
Shipping and Handling Costs Shipping and handling costs are included in the cost of goods sold and were $28,732,000, $27,568,000 and $28,717,000 for the years ended July 31, 2004, 2003 and 2002, respectively. Research and Development Research and development costs of $2,453,000, $1,923,000 and $1,955,000 were charged to expense as incurred for the years ended July 31, 2004, 2003 and 2002, respectively. Intangibles and Goodwill Intangibles are amortized on a straight-line basis over periods ranging from 7 to 35 years. The Company periodically reviews intangibles to assess recoverability from projected undiscounted cash flows of the related operating entities.

34
NOTE 1 – Summary of Significant Accounting Policies (Continued) Beginning in fiscal 2003, goodwill is no longer being amortized; instead it is tested annually for impairment. The Company tests the fair value of goodwill using methods such as discounted cash flow, stock market value and outside appraiser’s evaluations. No impairment adjustment was required during fiscal year 2004. Had SFAS No. 142 been in effect for fiscal 2002 net income and earnings per share, net of tax, would have been as follows:
Year Ended July 31,
2004 2003 2002 (in thousands, except for per share data) Net Income (Loss) Net as reported $ 5,033 $ 3,083 $ (1,094) Add back: Goodwill amortization --- --- 122 Adjusted Net Income (Loss) $ 5,033 $ 3,083 $ (972) Basic Earnings (Loss) per share Common Net as reported $ 0.98 $ 0.59 $ (0.19) Add back: Goodwill amortization --- --- 0.02 Adjusted Net Income (Loss) $ 0.98 $ 0.59 $ (0.17)
Basic Earnings (Loss) per share Class B Net as reported $ 0.74 $ 0.44 $ (0.19) Add back: Goodwill amortization --- --- 0.02 Adjusted Net Income (Loss) $ 0.74 $ 0.44 $ (0.17) Diluted Earnings (Loss) per share Net as reported $ 0.84 $ 0.54 $ (0.19) Add back: Goodwill amortization --- --- 0.02 Adjusted Net Income (Loss) $ 0.84 $ 0.54 $ (0.17) Weighted Average shares outstanding Basic Common 4,040 4,151 4,191 Basic Class B Common 1,437 1,423 1,423
Diluted 5,962 5,708 5,614 Advertising Costs The Company defers recognition of advertising production costs until the first time the advertising takes place; other advertising costs are expensed as incurred. Advertising expenses were $2,852,000, $1,907,000 and $1,227,000 for the years ended July 31, 2004, 2003 and 2002, respectively.

35
NOTE 1 – Summary of Significant Accounting Policies (Continued) Reclamation Obligations
The Company evaluated its potential reclamation liability at the end of fiscal 2004 in accordance with SFAS No. 143, “Accounting for Asset Retirement Obligations.” Based on that evaluation, the Company recorded estimated reclamation assets of approximately $263,000 and corresponding reclamation liabilities in the same amount. The value represents the discounted present value of the estimated future mining reclamation costs at the production plants. The assets will be depreciated over the estimated useful lives of the various mines. The liabilities will be increased based on a yearly accretion charge, once again over the estimated useful lives of the mines. Fair Value of Financial Instruments Non-derivative financial instruments included in the consolidated balance sheets are cash and cash equivalents, investment securities and notes payable. These instruments, except for notes payable, were carried at amounts approximating fair value as of July 31, 2004 and 2003. The fair value of notes payable was estimated based on future cash flows discounted at current interest rates available to the Company for debt with similar maturities and characteristics. The fair value of notes payable as of July 31, 2004 was greater than its carrying value by approximately $641,000 and greater than its carrying value by approximately $818,000 as of July 31, 2003. Stock Based Compensation
The Company applies the intrinsic value method under Accounting Principles Board Opinion (“APB”) No. 25, “Accounting for Stock Issued to Employees”, and related other interpretations to account for its stock option plans. All the outstanding options issued under the plans have had exercise prices equal to the market value on the day of issue. Accordingly, the Company has not recorded any compensation expense associated with its issuance of stock options. The Company has recorded as expense the fair market value on the date of issue of any restricted stock awards granted.
The following table details the effect on net income and earnings per share if compensation expense for the stock plans had been recorded based on the fair value method under SFAS 123, “Accounting for Stock Based Compensation.”
Year Ended (in thousands, except per share data) 2004 2003 2002 Reported net income $ 5,033 $ 3,083 $(1,094) Add: Total stock-based 20 13 14 employee compensation expense included in reported net income, net of related tax effects Deduct: Total stock-based (321) (699) (783) employee compensation expense determined under fair value method for all awards net of related tax effects Pro forma net income $ 4,732 $ 2,397 $(1,863) Earnings per share: Basic Common – as reported $0.98 $0.59 $(0.19) Basic Common – pro forma $0.92 $0.46 $(0.33) Basic Class B Common – as reported $0.74 $0.44 $(0.19) Basic Class B Common – pro forma $0.69 $0.35 $(0.33) Diluted – as reported $0.84 $0.54 $(0.19) Diluted – pro forma $0.79 $0.42 $(0.33)
36
NOTE 1 – Summary of Significant Accounting Policies (Continued) New Accounting Standards In December 2003, the FASB issued a revision to Statement of Financial Accounting Standards (“SFAS”) No. 132 (revised 2003), “Employers’ Disclosures about Pensions and Other Postretirement Benefits,” effective for fiscal periods beginning after December 15, 2003. This revised statement requires additional annual disclosures regarding types of plan assets, investment strategy, future plan contributions, expected benefit payments and other items. The statement also requires quarterly disclosure of the components of net periodic benefit cost and plan contributions. The Company has adopted SFAS No. 132 (revised 2003) in fiscal 2004 and is contained in Note 9 of the Notes of the Consolidated Financial Statements.
In March of 2004, The Emerging Issues Task Force (EITF) issued EITF 04-02, “Whether Mineral Rights are Tangible or Intangible Assets and Related Issues.” Under the provisions of EITF 04-02, mineral rights, as defined in the Issue, are tangible assets. The guidance in this EITF became effective for the first reporting period beginning after April 29, 2004. This guidance caused the Company to reclassify certain assets from intangible to tangible assets in the Consolidated Balance Sheet dated July 31, 2004 and prior years. The adoption of EITF 04-02 required the Company to reclassify $1,205,000 from intangible assets to property, plant and equipment.
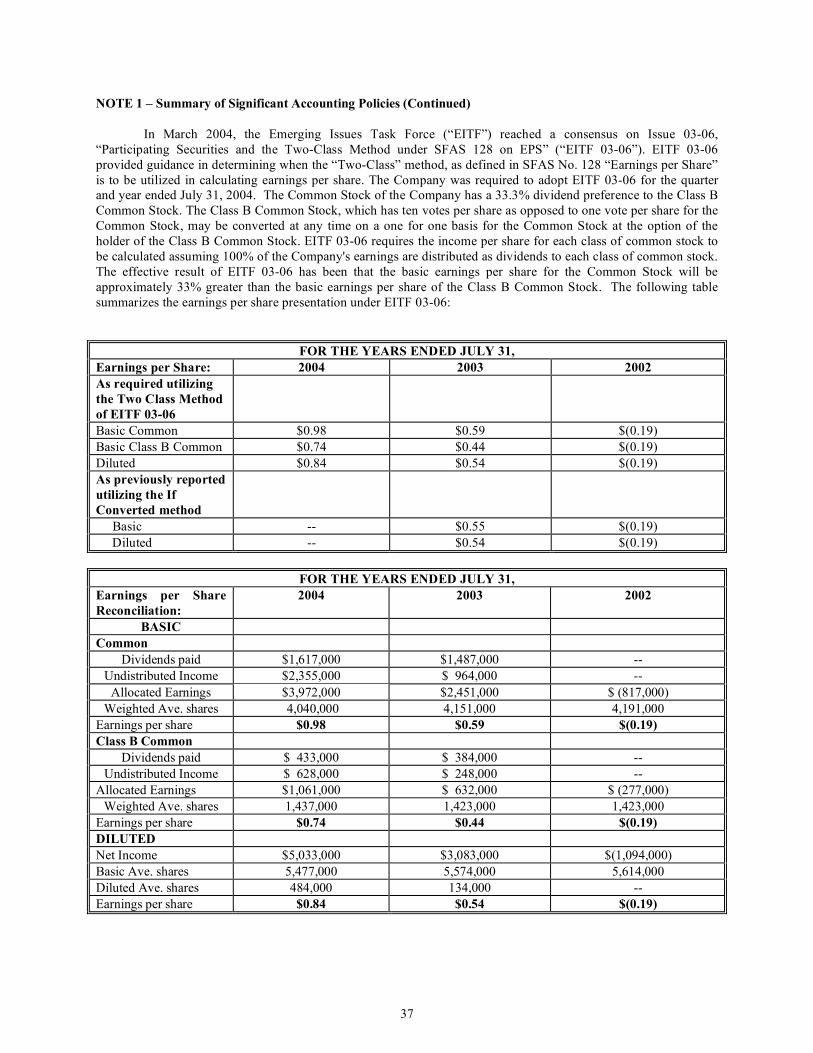
37
NOTE 1 – Summary of Significant Accounting Policies (Continued)
In March 2004, the Emerging Issues Task Force (“EITF”) reached a consensus on Issue 03-06, “Participating Securities and the Two-Class Method under SFAS 128 on EPS” (“EITF 03-06”). EITF 03-06 provided guidance in determining when the “Two-Class” method, as defined in SFAS No. 128 “Earnings per Share” is to be utilized in calculating earnings per share. The Company was required to adopt EITF 03-06 for the quarter and year ended July 31, 2004. The Common Stock of the Company has a 33.3% dividend preference to the Class B Common Stock. The Class B Common Stock, which has ten votes per share as opposed to one vote per share for the Common Stock, may be converted at any time on a one for one basis for the Common Stock at the option of the holder of the Class B Common Stock. EITF 03-06 requires the income per share for each class of common stock to be calculated assuming 100% of the Company's earnings are distributed as dividends to each class of common stock. The effective result of EITF 03-06 has been that the basic earnings per share for the Common Stock will be approximately 33% greater than the basic earnings per share of the Class B Common Stock. The following table summarizes the earnings per share presentation under EITF 03-06:
FOR THE YEARS ENDED JULY 31,
Earnings per Share: 2004 2003 2002 As required utilizing the Two Class Method of EITF 03-06
Basic Common $0.98 $0.59 $(0.19) Basic Class B Common $0.74 $0.44 $(0.19) Diluted $0.84 $0.54 $(0.19) As previously reported utilizing the If Converted method
Basic -- $0.55 $(0.19) Diluted -- $0.54 $(0.19)
FOR THE YEARS ENDED JULY 31, Earnings per Share Reconciliation:
2004 2003 2002
BASIC Common
Dividends paid $1,617,000 $1,487,000 -- Undistributed Income $2,355,000 $ 964,000 --
Allocated Earnings $3,972,000 $2,451,000 $ (817,000) Weighted Ave. shares 4,040,000 4,151,000 4,191,000
Earnings per share $0.98 $0.59 $(0.19) Class B Common
Dividends paid $ 433,000 $ 384,000 -- Undistributed Income $ 628,000 $ 248,000 --
Allocated Earnings $1,061,000 $ 632,000 $ (277,000) Weighted Ave. shares 1,437,000 1,423,000 1,423,000
Earnings per share $0.74 $0.44 $(0.19) DILUTED Net Income $5,033,000 $3,083,000 $(1,094,000) Basic Ave. shares 5,477,000 5,574,000 5,614,000 Diluted Ave. shares 484,000 134,000 -- Earnings per share $0.84 $0.54 $(0.19)

38
NOTE 2 – Special Charges, Fees and Changes in Accounting Estimates Other Charge – Patent Infringement Lawsuit The Company was named as a defendant in an action captioned PSN Illinois LLC v. Oil-Dri Corporation of America filed February 5, 2004 in the United States District Court for the Northern District of Illinois. The lawsuit alleged that most of the Company’s scoopable cat litter products infringed two patents owned by the plaintiff. The plaintiff was seeking monetary damages in an unspecified amount, treble damages if the alleged infringement is found to be willful, as well as injunctive relief. On August 12, 2004, the Company announced a settlement and dismissal of the plaintiff’s claims. Under terms of the settlement, the Company paid the plaintiff $1,250,000 and the plaintiff granted the Company paid-up licenses of the two patents involved in the litigation as well as a third patent owned by the plaintiff. The $1,250,000 pre-tax charge has been reflected as Other Contractual Income & Charges on the Consolidated Statement of Operations. Loss on Impaired Long-Lived Assets
During the second quarter of fiscal 2004, the Company recorded a loss on impaired assets of $464,000.
This loss, related to the write-off of a scoopable “box” product line located at the Company’s Georgia facility and the write-off of the remaining estimated held-for-sale value of a similar box line at one of the Company’s Mississippi facilities, resulted from the shift from boxed products to jug products and the long term direction of the Company. Both lines were previously used exclusively by the Consumer Product Group. Special Charges – Christmas Valley, Oregon Plant Closure On July 17, 2003 the Company announced a reorganization of service for its customers in the Pacific Northwest. On July 31, 2003 the Company closed its Christmas Valley, Oregon facility and transferred its existing customer base to the newly acquired plant in Taft, California and other Oil-Dri production facilities. The Company recorded a fourth quarter charge of $573,000, which is detailed below: 2003 (in thousands) Severance Costs $106 Write-off of Obsolete Inventory 198 Write-off of Fixed Assets 89 Reclamation Expense 180 Total $573
Of the $573,000, $484,000 was recorded as part of cost of goods sold for the fourth quarter 2003. The balance of the adjustment was recorded in other income and expense. During fiscal 2004 the Company recognized as operating expense (consistent with SFAS 146) the remaining costs associated with the final shutdown of the facility. These costs were immaterially different from the estimates reported in fiscal 2003.
39
NOTE 2 – Special Charges, Fees and Changes in Accounting Estimates (Continued) Change in Accounting Estimate for Prepaid Overburden Removal Expense During the second quarter of fiscal 2002, an internal review of the estimated amount of uncovered mineable clay took place at the Company’s Georgia production complex. The quantity of uncovered clay is one of the key elements in the amortization of the prepaid overburden removal account balance. The review led to a change in the estimated amount of uncovered clay. This estimate change then caused a change in the amortization of the prepaid overburden removal account. The impact of this estimate revision for fiscal 2003 and 2002 was an additional pre-tax charge to cost of goods sold of approximately $630,000 and $1,092,000 respectively, versus the previous estimate. The estimate change also increased the amortization rate approximately $1.31 per ton of uncovered mineable clay. The Company returned to using lower rates, more consistent with its historic experience at the Georgia complex, to amortize the overburden account at the end of the second quarter of fiscal 2003. Sale of Mineral Rights
During the first quarter of fiscal 2003, the Company recorded a $139,000 pre-tax gain from the sale of certain mineral leases on land in Tennessee. The land was geographically located in an area that the Company was not actively planning to develop. The mineral rights, had they been pursued, could have been associated with any or all of the operating segments.
During the third quarter of fiscal 2002, the Company reported a $769,000 pre-tax gain when it elected to sell certain mineral leases on land in northern Florida. The land contained minerals for a market that the Company was not actively planning to pursue. The mineral rights, had they been pursued, would have been associated with the Company’s Specialty Products Group. Other Contractual Income During the second quarter of fiscal 2003, the Company recorded $675,000 of other contractual pre-tax income as a result of a one-time payment from a customer who failed to meet minimum purchase requirements under a supply agreement with the Company. Reno Processing Plant During the latter part of the fourth quarter of fiscal 2002, the Company reviewed both properties in Washoe County, Nevada for possible long-term asset impairment. The decision to review the properties was driven by a combination of the February 26, 2002, County Commission decision and the successful completion in June of 2002 of a significant geographic distribution change with Wal-Mart. The accumulated cost of the Reno project that was reviewed for impairment was approximately $3,734,000. This value included the cost of purchased land, water and mineral rights, legal fees associated with the land and water rights purchases, consulting fees for the design of the proposed facility, fees associated with an environment impact study, various mining exploration costs, Company overhead costs for the project, machinery costs and finally various legal and consulting fees associated with the preparation and presentation of the special use permit. The accumulated cost of the other Washoe County property was approximately $1,114,000. This value included the purchase price of the land and associated costs and mineral exploration costs. Based on the February 26, 2002 determination of the County Commission and the geographic distribution change with Wal-Mart, the Company determined that a significant portion of the costs of both properties was impaired. Therefore, a pre-tax loss on impaired long-lived assets of $3,213,000 was recognized in the fourth quarter of fiscal 2002 to write down the accumulated costs associated with these projects and the reduction in the value of assets remaining to the current fair market value. The main business segment impacted by this impairment was the Company’s Consumer Products group.
40
NOTE 2 – Special Charges, Fees and Changes in Accounting Estimates (Continued)
In April 2002, the Company filed parallel actions in state and federal courts in Nevada against Washoe County, Nevada, alleging that the County’s denial of a special use permit (sought by the Company in connection with its plan to build a manufacturing facility outside of Reno, Nevada) violated both federal and state law. The lawsuits seek damages resulting from the County’s improper denial of the special use permit, which caused the Company to abandon its plan to build the Reno facility. The federal court action has been dismissed on jurisdictional grounds, and the state court action is now proceeding. A hearing on the liability issues in the state court action took place in January 2004; however, no ruling has yet been issued. An adverse decision in the matter would not have a material adverse effect on the Company.

41
NOTE 3 – Operating Segments SFAS No. 131, “Disclosures About Segments of an Enterprise and Related Information” establishes standards for reporting information about operating segments. Under this standard, the Company has four reportable operating segments: Consumer Products Group, Specialty Products Group, Crop Production and Horticultural Products Group, and Industrial and Automotive Products Group. These segments are managed separately because each business has different economic characteristics. The accounting policies of the segments are the same as those described in the summary of significant accounting policies. Management does not rely on any segment asset allocations and does not consider them meaningful because of the shared nature of the Company’s production facilities. However the Company has estimated the segment asset allocations as follows:
July 31, Assets 2004 2003 2002 (in thousands) Consumer Products Group $ 55,240 $ 54,307 $ 51,600 Specialty Products Group 14,594 17,251 15,813 Crop Production and Horticulture Group 11,452 12,383 11,043 Industrial and Automotive Products Group 8,646 8,539 8,417 Unallocated Assets 38,943 34,343 38,162 Total Assets $ 128,875 $ 126,823 $ 125,035
Year Ended July 31 Net Sales Income 2004 2003 2002 2004 2003 2002 (in thousands) Consumer Products Group $ 114,027 $ 105,108 $ 101,042 $ 17,532 $ 13,343 $ 10,175 Specialty Products Group 27,759 24,990 24,499 6,058 4,927 4,280 Crop Production and Horticulture Group 21,006 21,820 17,154 3,092 2,614 2,350 Industrial and Automotive Products Group 22,719 21,123 19,650 (452) (826) 18 Total Sales/Operating Income $ 185,511 $ 173,041 $ 162,345 26,230 20,058 16,823 Other Contractual Income and Charges2 (1,250) 675 -- Gain on the Sale of Mineral Rights1 -- 139 769 Less: Loss on Impaired Assets3 464 -- 3,213 Corporate Expenses 15,727 14,385 13,658 Interest Expense, net of interest Income 1,858 2,145 2,280 Income (Loss) before Income Taxes 6,931 4,342 (1,559) Income Taxes (Benefit) Provision 1,898 1,259 (465) Net Income (Loss) $ 5,033 $ 3,083 $ (1,094)
1 See Note 2 for a discussion of the gain on the sale of mineral rights. 2 See Note 2 for a discussion of other contractual income and charges. 3 See Note 2 for a discussion of the loss on impaired assets.

42
NOTE 3 – Operating Segments (Continued) The following is a summary of financial information by geographic region for the years ended July 31:
2004 2003 2002 (in thousands)
Sales to unaffiliated customers: Domestic .................................................................................. $ 172,114 $ 161,641 $ 151,591 Foreign subsidiaries ................................................................. $ 13,397 $ 11,400 $ 10,754 Sales or transfers between geographic areas: Domestic .................................................................................. $ 6,035 $ 5,346 $ 5,000 Income (Loss) before income taxes: Domestic .................................................................................. $ 5,968 $ 3,906 $ (1,614) Foreign subsidiaries ................................................................. $ 963 $ 436 $ 55 Net Income (Loss): Domestic .................................................................................. $ 4,418 $ 2,802 $ (1,187) Foreign subsidiaries ................................................................. $ 615 $ 281 $ 93 Identifiable assets: Domestic .................................................................................. $ 117,604 $ 117,086 $ 115,493 Foreign subsidiaries ................................................................. $ 11,271 $ 9,737 $ 9,542
The Company’s largest customer accounted for the following percentage of consolidated net sales and net accounts receivable under the Consumer Products segment:
2004 2003 2002 Sales for the years ended July 31 ........................................................ 18% 19% 22% Accounts receivable as of July 31 ....................................................... 27% 26% 26%
43
NOTE 4 – Notes Payable The composition of notes payable at July 31 is as follows: 2004 2003 (in thousands) Town of Blue Mountain, Mississippi Principal payable on October 1, 2008. Interest payable monthly at a variable interest rate reset weekly based on market conditions for similar instruments. The average annual rate was 1.23% and 1.52% in fiscal 2004 and 2003, respectively. Payment of these bonds by the Company is guaranteed by a letter of credit issued by Harris Trust and Savings Bank......................................................................................................... $ 2,500 $ 2,500 Teachers Insurance and Annuity Association of America Payable in annual principal installments on August 15: $2,500,000 in fiscal 2005. Interest is payable semiannually at an annual rate of 7.17% ......................................................................................................................... 2,500 5,000 Teachers Insurance and Annuity Association of America and Prudential Financial Payable in annual principal installments on April 15: $1,500,000 in fiscal 2005; $3,000,000 in fiscal 2006; $4,000,000 in fiscal 2007 and 2008; $1,500,000 in fiscal 2009; $3,000,000 in fiscal 2010; $2,000,000 in fiscal 2011; and $1,500,000 in fiscal 2012 and 2013. Interest is payable semiannually at an annual rate of 6.55% ..................................................................................... 22,000 23,500 Other ....................................................................................................................................................... 400 400 $ 27,400 $ 31,400 Less current maturities of notes payable .......................................................................................... (4,080) (4,000) $ 23,320 $ 27,400 On January 29, 1999, the Company entered into a Credit Agreement with Harris Trust and Savings Bank, which provides for up to $15,000,000 in committed unsecured revolving credit loans and/or letters of credit (not to exceed $5,000,000). In May 2002, the Company reduced this facility to $7,500,000 and amended the definition of Consolidated EBITDA used for covenant compliance purposes to exclude non-cash charges, up to $3,600,000 relating to the write-off of its equity investment in the Washoe County, Nevada, project and/or certain other costs associated with the write-off of the Company’s Christmas Valley, Oregon production facility. See Note 2 of the Notes to the Consolidated Financial Statements for the description of write-downs totaling $573,000 in fiscal 2003 and $3,213,000 in fiscal 2002. On November 22, 2002, the Company and Harris Trust and Savings Bank entered into a second amendment whereby for the purposes of the fixed charge coverage ratio, as defined, up to $6,000,000 of capital expenditures incurred by the Company related to its acquisition of the Taft, California facility and the Jonny Cat brand are excluded from the computation. During the second quarter of fiscal 2004 the Company extended the Harris Trust and Savings agreement to January 2005. There were not any outstanding borrowings against this facility at July 31, 2004 and 2003.
44
NOTE 4 – Notes Payable (Continued) In January 2001, the note agreement for the $25,000,000 private debt placement was amended to modify the fixed charges ratio covenant contained therein from the original ratio of 1.5 to 1.0 to new ratios as follows: (i) for the period ending November 1, 2000 through April 30, 2001 to 1.00 to 1.00; (ii) for the period ending May 1, 2001 through October 31, 2001 to 1.15 to 1.00; (iii) for the period ending November 1, 2001 through July 31, 2002 to 1.25 to 1.00; (iv) and for the period ending August 1, 2002 and thereafter to 1.50 to 1.00. Additionally, prior note agreements dated as of April 15, 1993 and April 15, 1991 with Teachers Insurance and Annuity Association have also been amended to add a fixed charges coverage ratio covenant at substantially the same terms as those in the note agreement dated as of April 15, 1998 as amended. In July 2002, the 1993 and 1998 note agreements were further amended to modify the fixed charge covenant ratio for periods beginning May 1, 2002, as follows: (i) for the period May 1, 2002 through July 31, 2002 the ratio test was waived by the noteholders; (ii) for the periods ending August 1, 2002 through January 31, 2002 to 1.00 to 1.00; (iii) for the periods ending February 1, 2003 through October 31, 2003 to 1.25 to 1.00; (iv) and for the periods ending November 1, 2003 and thereafter to 1.50 to 1.00. Also, for any fiscal quarter ending on or after July 31, 2002 an additional interest charge of 0.25% is imposed if the fixed charge coverage ratio is less than 1.25 to 1.00 for the quarter ended July 31, 2002 and 1.50 to 1.00 for periods thereafter. Finally, the definition of Consolidated Net Income for covenant compliance purposes also has been amended to exclude non-cash charges incurred by the Company on or before July 31, 2003, relating to the write-off of the Company’s equity investments in the Washoe County, Nevada projects and other costs associated with the write-off of the Company’s Christmas Valley, Oregon production facility. See Note 2 of the Notes to the Consolidated Financial Statements for a description of a write-down totaling $573,000 in fiscal 2003 and $3,213,000 in fiscal 2002. The aggregate amount of these write-offs cannot be in excess of $4,700,000. The agreements with the Town of Blue Mountain, Mississippi, Teachers Insurance and Annuity Association of America and Harris Trust and Savings Bank impose working capital requirements, dividend and financing limitations, minimum tangible net worth requirements and other restrictions. The Company's Credit Agreement with Harris Trust and Savings Bank indirectly restricts dividends by requiring the Company to maintain tangible net worth, as defined, in the amount of $50,000,000 plus 40% of cumulative annual earnings from July 31, 1998. In prior years, the Town of Blue Mountain, Mississippi issued long-term bonds to finance the purchase of substantially all of the assets of certain plant expansion projects, and leased the projects to the Company and various of its subsidiaries (with the Company and various of its wholly owned subsidiaries as guarantors) at rentals sufficient to pay the debt service on the bonds. The following is a schedule by year of future maturities of notes payable as of July 31, 2004: (in thousands)
2006............................................................................................................... $ 3,080 2007 .............................................................................................................. 4,080 2008............................................................................................................... 4,080 2009............................................................................................................... 4,080 Later years..................................................................................................... 8,000
$23,320

45
NOTE 5 – Purchase of Assets Related to the Jonny Cat® Brand of Cat Litter
On December 13, 2002, the Company completed the purchase, for $6,000,000 in cash, of assets related to the Jonny Cat® brand of cat litter (the “Purchase”) from a wholly owned subsidiary of Clorox (NYSE: CLX). The Company has also spent approximately $652,000 on various post-closing costs related to the Purchase. Included in the Purchase were inventories, trademarks, a manufacturing plant in Taft, California, and mineral reserves. The aggregate purchase price has been allocated as follows: Inventory $1,507,000 Prepaid Expenses 175,000 Property, Plant & Equipment 4,594,000 Trademarks & Trade Name 376,000 Purchase total $6,652,000
The Company has assessed the pro forma disclosure criteria of SFAS No. 141 and has determined that the
Purchase is not material under the asset, investment and income tests of the pronouncement. Based on that assessment, the Company has concluded that the pro forma results are not materially different from the results reported in the current filing. NOTE 6 – Income Taxes The provision for income tax expense consists of the following: 2004 2003 2002 (in thousands) Current Federal................................................................................... $ 1,220 $ 1,061 $ 425 Foreign.................................................................................. 297 45 (14) State ...................................................................................... 177 271 (59) 1,694 1,377 352 Deferred Federal................................................................................... 57 (256) 629 Tax effect of operating loss carryforward, net ..................... -- -- (1,629) Foreign.................................................................................. 51 110 -- State ...................................................................................... 96 28 183 204 (118) (817) Total Income Tax Provision (Benefit)...................................... $ 1,898 $ 1,259 $ (465)
Principal reasons for variations between the statutory federal rate and the effective rates for the years ended July 31 were as follows: 2004 2003 2002 U.S. federal income tax rate....................................................... 34.0% 34.0% (34.0)% Depletion deductions allowed for mining................................. (16.2) (7.4) (11.4) State income tax expense (benefit), net of federal tax (benefit)/expense ................................................. 2.6 4.3 (5.3) AMT ........................................................................................... 4.0 -- 22.9 Difference in effective tax rate of foreign subsidiaries................ 0.3 -- (2.1) Empowerment Zone Credits ...................................................... (1.1) (2.8) -- Unremitted foreign earnings....................................................... 3.0 Other............................................................................................ 0.8 0.9 0.1 27.4% 29.0% (29.8)%

46
NOTE 6 – Income Taxes (Continued) The consolidated balance sheets as of July 31 included the following tax effects of cumulative temporary differences: 2004 2003 Assets Liabilities Assets Liabilities (in thousands) Depreciation .................................................................... $ -- $ 1,071 $ -- $ 451 Deferred compensation ................................................... 1,533 -- 1,327 -- Postretirement benefits ................................................... 199 -- 175 -- Allowance for doubtful accounts.................................... 353 -- 265 -- Other assets ..................................................................... 437 -- 372 -- Accrued expenses............................................................ 1,734 -- 991 -- Tax credits ...................................................................... 2,066 -- 580 -- Amortization ................................................................... 224 -- 221 -- Inventory ......................................................................... 243 -- 217 -- Depletion......................................................................... -- 240 -- 53 Unremitted earnings of foreign subsidiaries.................. -- 210 -- -- Other assets – Foreign ................................................... -- 109 -- 58 Operating loss carryforward............................................ -- -- 861 -- 6,789 1,630 5,009 562 Valuation allowance ....................................................... (1,273) -- (357) -- Total deferred taxes ........................................................ $ 5,516 $ 1,630 $ 4,652 $ 562
As of July 31, 2004, for federal income tax purposes there were alternative minimum tax credit carryforwards of approximately $1,798,000. A valuation allowance has been established for $1,273,000 of the deferred tax benefit related to the AMT tax credits since it is more likely than not that the benefit will not be realized. The Company’s effective tax rate was 27.4% of pre-tax income in fiscal 2004 versus 29.0% in fiscal 2003. Contributing to the decrease in the effective tax rate for fiscal 2004 was a change in estimate in calculating the Company’s depletion deduction. NOTE 7 – Stockholders’ Equity The authorized capital stock of the Company at July 31, 2004 and 2003 consisted of 15,000,000 shares of Common Stock, 7,000,000 shares of Class B Stock and 30,000,000 shares of Class A Common Stock, each with a par value of $.10 per share. There are no Class A shares currently outstanding. The Common Stock and Class B Stock are equal, on a per share basis, in all respects except as to voting rights, conversion rights, cash dividends and stock splits or stock dividends. The Class A Common Stock is equal, on a per share basis, in all respects, to the Common Stock except as to voting rights and stock splits or stock dividends. In the case of voting rights, Common Stock is entitled to one vote per share and Class B Stock is entitled to ten votes per share, while Class A Common Stock generally has no voting rights. Common Stock and Class A Common Stock have no conversion rights. Class B Stock is convertible on a share-for-share basis into Common Stock at any time and is subject to mandatory conversion under certain circumstances. Common Stock is entitled to cash dividends, as and when declared or paid, must be equal to at least 133 1/3% on a per share basis of the cash dividend paid on Class B Stock. Class A Common Stock is entitled to cash dividends on a per share basis equal to the cash dividend on Common Stock. Additionally, while shares of Common Stock, Class A Common Stock and Class B Stock are outstanding, the sum of the per share cash dividend paid on shares of Common Stock and Class A Common Stock, must be equal to at least 133 1/3% of the sum of the per share cash dividend paid on Class B Stock and Class A Common Stock. See Note 4 of the Notes to the Consolidated Financial Statements regarding dividend restrictions.
47
NOTE 7 – Stockholders’ Equity (Continued) Shares of Common Stock, Class A Common Stock and Class B Stock are equal in respect of all rights to dividends (other than cash) and distributions in the form of stock or other property (including stock dividends and split-ups) in each case in the same ratio except in the case of a Special Stock Dividend. The Special Stock Dividend, which can be issued only once, is either a dividend of one share of Class A Common Stock for each share of Common Stock and Class B Stock outstanding or a recapitalization, in which half of each outstanding share of Common Stock and Class B Stock would be converted into a half share of Class A Common Stock. The Board of Directors of the Company has authorized the repurchase of 1,916,771 shares of the Company stock. As of July 31, 2004, 1,392,026 shares of Common Stock and 342,241 shares of Class B stock have been repurchased under the Board approved repurchase authorizations and 146,545 shares of Common Stock by other transactions authorized by management prior to the adoption of this plan. The number of holders of record of Common Stock and Class B stock on July 31, 2004 were 792 and 33, respectively, as reported by the Company’s transfer agent. The Company's Common Stock is traded on the New York Stock Exchange. There is no established trading market for the Class B Stock. NOTE 8 – Stock Option Plans The Company instituted the Oil-Dri Corporation of America 1995 Long Term Incentive Plan during the fiscal year ended July 31, 1996. Generally, other than grants to Richard M. Jaffee family members, shares of stock awarded under the 1995 Plan will be Class A Common Stock, except that, if there is no Class A Common Stock issued and publicly traded on a securities exchange when such awards are exercised, the shares awarded would be Common Stock. Grants to the Richard M. Jaffee family members are Class B shares. The Plan provides for various other types of awards. No restricted stock awards were made during the fiscal years ended July 31, 2002 and July 31, 2004. Awards of restricted stock in the amount of 7,000 shares were made during the fiscal year ended July 31, 2003. All stock option grants awarded to date under this plan have a term of ten years. Grants vest and become exercisable gradually between two and seven years. The Oil-Dri Corporation of America 1988 Stock Option Plan terminated on December 12, 1995, for purposes of future grants. The outstanding options under this plan will remain outstanding and exercisable in accordance with their respective terms. As of July 31, 2004, all options outstanding are vested and exercisable. All options exercisable as of July 31, 2004 under this plan expired in August, 2004. The Company instituted the Oil-Dri Corporation of America Outside Director’s Stock Plan on June 9, 1998. The Plan is administered by the Compensation Committee of the Company’s Board of Directors. All shares of stock issued under this plan will be shares of Common Stock issued from Treasury Stock. The Plan provides for stock option grants, restricted stock, stock awards and stock units. All awards to date under this plan are stock options that have a term of ten years and a vesting period of one year.

48
NOTE 8 – Stock Option Plans (Continued)
EQUITY COMPENSATION PLAN INFORMATION AS OF JULY 31, 2004
Plan category
Number of securities to be
issued upon exercise of
outstanding options, warrants
and rights (in thousands)
(a)
Weighted-average exercise price of
outstanding options, warrants
and rights (b)
Number of securities remaining
available for further issuance
under equity compensation
plans (excluding securities
reflected in column (a))
(in thousands) (c)
Equity compensation plans approved by security holders
1,300
$10.73
103
Equity compensation plans not approved by security holders Granted
175
$ 9.91
25
A summary of option transactions under the plans follows:
Number of Shares
(in thousands)
Weighted Average
Exercise Price Options outstanding at August 1, 2001 1,137 $ 11.74 Granted 310 $ 6.18 Exercised 1 $ 8.19 Canceled 45 $ 12.65 Options outstanding at August 1, 2002 1,401 $ 10.49 Granted 165 $ 10.01 Exercised 1 $ 8.19 Canceled 92 $ 10.92 Options outstanding at August 1, 2003 1,473 $ 10.41 Granted 196 $ 12.16 Exercised 139 $ 9.65 Canceled 55 $ 12.62 Options outstanding at August 1, 2004 1,475 $ 10.63
Options exercisable were 927,504, 760,512 and 576,151 as of July 31, 2004, 2003 and 2002, respectively. The weighted average exercise price of the options exercisable as of July 31, 2004, 2003 and 2002 was $11.13, $11.74 and $12.43 respectively. The Company had reserved 102,875, 255,750 and 350,626 shares, respectively, as of July 31, 2004, 2003 and 2002 under the Oil-Dri Corporation of America 1995 Long Term Incentive Plan. The Company had reserved 25,000, 15,000 and 5,000 shares of Common Stock, respectively, as of July 31, 2004, 2003 and 2002, under the Oil-Dri Corporation of America Outside Director’s Stock Plan.
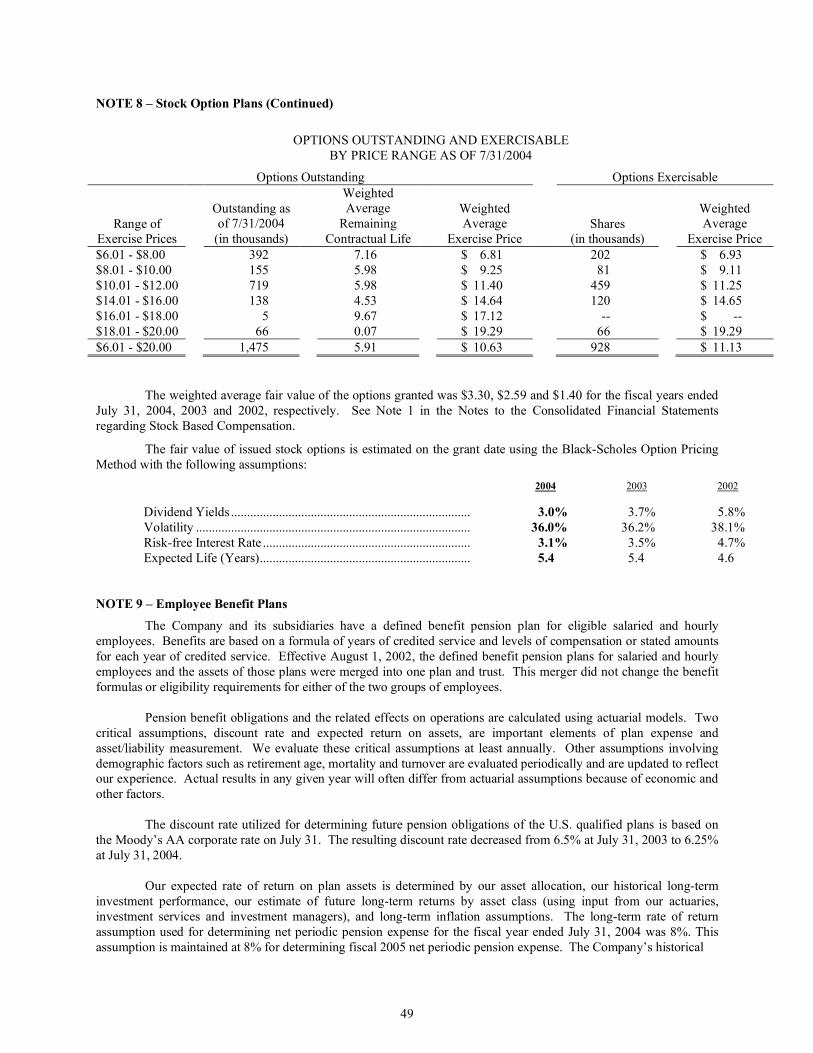
49
NOTE 8 – Stock Option Plans (Continued)
OPTIONS OUTSTANDING AND EXERCISABLE BY PRICE RANGE AS OF 7/31/2004
Options Outstanding Options Exercisable
Range of Exercise Prices
Outstanding as of 7/31/2004
(in thousands)
Weighted Average
Remaining Contractual Life
Weighted Average
Exercise Price Shares
(in thousands)
Weighted Average
Exercise Price $6.01 - $8.00 392 7.16 $ 6.81 202 $ 6.93 $8.01 - $10.00 155 5.98 $ 9.25 81 $ 9.11 $10.01 - $12.00 719 5.98 $ 11.40 459 $ 11.25 $14.01 - $16.00 138 4.53 $ 14.64 120 $ 14.65 $16.01 - $18.00 5 9.67 $ 17.12 -- $ -- $18.01 - $20.00 66 0.07 $ 19.29 66 $ 19.29 $6.01 - $20.00 1,475 5.91 $ 10.63 928 $ 11.13 The weighted average fair value of the options granted was $3.30, $2.59 and $1.40 for the fiscal years ended July 31, 2004, 2003 and 2002, respectively. See Note 1 in the Notes to the Consolidated Financial Statements regarding Stock Based Compensation.
The fair value of issued stock options is estimated on the grant date using the Black-Scholes Option Pricing Method with the following assumptions: 2004 2003 2002
Dividend Yields ........................................................................... 3.0% 3.7% 5.8% Volatility ...................................................................................... 36.0% 36.2% 38.1% Risk-free Interest Rate ................................................................. 3.1% 3.5% 4.7% Expected Life (Years).................................................................. 5.4 5.4 4.6
NOTE 9 – Employee Benefit Plans The Company and its subsidiaries have a defined benefit pension plan for eligible salaried and hourly employees. Benefits are based on a formula of years of credited service and levels of compensation or stated amounts for each year of credited service. Effective August 1, 2002, the defined benefit pension plans for salaried and hourly employees and the assets of those plans were merged into one plan and trust. This merger did not change the benefit formulas or eligibility requirements for either of the two groups of employees. Pension benefit obligations and the related effects on operations are calculated using actuarial models. Two critical assumptions, discount rate and expected return on assets, are important elements of plan expense and asset/liability measurement. We evaluate these critical assumptions at least annually. Other assumptions involving demographic factors such as retirement age, mortality and turnover are evaluated periodically and are updated to reflect our experience. Actual results in any given year will often differ from actuarial assumptions because of economic and other factors. The discount rate utilized for determining future pension obligations of the U.S. qualified plans is based on the Moody’s AA corporate rate on July 31. The resulting discount rate decreased from 6.5% at July 31, 2003 to 6.25% at July 31, 2004. Our expected rate of return on plan assets is determined by our asset allocation, our historical long-term investment performance, our estimate of future long-term returns by asset class (using input from our actuaries, investment services and investment managers), and long-term inflation assumptions. The long-term rate of return assumption used for determining net periodic pension expense for the fiscal year ended July 31, 2004 was 8%. This assumption is maintained at 8% for determining fiscal 2005 net periodic pension expense. The Company’s historical

50
NOTE 9 – Employee Benefit Plans (Continued) actual return averaged 10.5% for the ten-year period ending July 31, 2004. The actual rate of return in fiscal 2004 was 14.2%. Future actual pension expense will depend on future investment performance, changes in future discount rates and various other factors related to the population of participants in the Company’s pension plans. The investment objective for the pension plan is to secure the benefit obligations to participants at a reasonable cost to the Company. The goal is to optimize the long-term return on plan assets at a moderate level of risk. The allocation of plan assets is reviewed quarterly by the Company. The allocation of plan assets at July 31, 2004 was 53% fixed income, 45% equity and 2% cash and accrued income. The allocation of plan assets at July 31, 2003 was 60% fixed income, 34% equity and 6% cash and accrued income. The company is currently targeting a 50% fixed income and 50% equity funds allocation for fiscal 2005. There is no Oil-Dri common stock in the pension trust fund.
The net periodic pension cost for the years ended July 31 consists of the following: 2004 2003 2002 (in thousands)
Service cost .................................................................................................. $ 775 $ 600 $ 534 Interest cost on projected benefit obligations.............................................. 906 823 763 Expected return on plan assets .................................................................... (814) (740) (912) Amortization of: Net transition asset................................................................................ (27) (27) (27) Prior service costs ................................................................................. 50 50 50 Other actuarial loss ............................................................................... 60 -- 20 Net pension cost........................................................................................... $ 950 $ 706 $ 388
The measurement dates used to calculate the net periodic pension cost were August 1, 2003, 2002 and 2001 respectively. The funded status of the plans at July 31 is as follows: 2004 2003 (in thousands)
Fair Value of Plan Assets Less Than Projected Benefit Obligations................................. $ (3,705) $ (3,907) Unrecognized Net Loss....................................................................................................... 1,916 2,389 Unrecognized Prior Service Cost........................................................................................ 381 431 Unrecognized Net Asset at Transition................................................................................ (105) (132) Accrued Pension Included in Noncurrent Liabilities--Other ............................................. $ (1,513) $ (1,219)

51
NOTE 9 – Employee Benefit Plans (Continued) Reconciliation of the assets and liabilities of the plans at July 31 is as follows: 2004 2003 (in thousands)
Change in Plan Assets: Plan assets at fair value, beginning of year ................................................................. $ 10,224 $ 9,465 Actual return on plan assets......................................................................................... 1,447 740 Contributions ............................................................................................................... 655 484 Benefits paid ................................................................................................................ (483) (465) Plan assets at fair value, end of year............................................................................ $ 11,843 $ 10,224 Change in Projected Benefit Obligation: Projected benefit obligation, beginning of year .......................................................... $ 14,131 $ 11,624 Service cost .................................................................................................................. 775 600 Interest cost .................................................................................................................. 906 823 Plan amendments......................................................................................................... -- -- Actuarial loss ............................................................................................................... 219 1,549 Benefits paid ................................................................................................................ (483) (465) Projected benefit obligation, end of year .................................................................... $ 15,548 $ 14,131
Assumptions used in the previous calculations are as follows: 2004 2003
Discount rate........................................................................................................................ 6.25% 6.50% Rate of increase in compensation levels............................................................................. 4.00% 4.50% Long-term expected rate of return on assets....................................................................... 8.00% 8.00%
The Company has funded the plans based upon actuarially determined contributions that take into account the amount deductible for income tax purposes and the minimum contribution required under the Employee Retirement Income Security Act of 1974 (ERISA), as amended. The Company contributed $655,000 and $484,000 to the pension during the fiscal years ended July 31, 2004 and July 31, 2003, respectively. The Company is not required to make a contribution to the plan in fiscal 2005. However, the Company expects to make a contribution to the plan sufficient to fund the annual cost. An estimate of that contribution is $500,000. The accumulated benefit obligation for the pension plan was $12,739,000 as of July 31, 2004 and $11,269,000 as of July 31, 2003. The measurement dates for determining the accumulated benefit obligation at July 31 are July 31, 2004 and 2003, respectively. The measurement dates for determining the net periodic pension cost for fiscal years ended July 31, 2004 and 2003 are August 1, 2003 and 2002, respectively. Our estimated future benefit payments are as follows: Year ended July 31, 2005 2006 2007 2008 2009 2010-13 (in thousands) Estimated benefit payments $515 $517 $598 $643 $661 $4,215 For the years ended July 31, 2004, 2003 and 2002, the Company maintained a 401(k) savings plan under which the Company matches a portion of employee contributions. The plan is available to essentially all domestic employees following thirty or sixty days of employment. The Company's contributions to this plan, and to similar plans maintained by the Company's foreign subsidiaries, were $533,000, $509,000 and $435,000 for fiscal years 2004, 2003 and 2002, respectively.
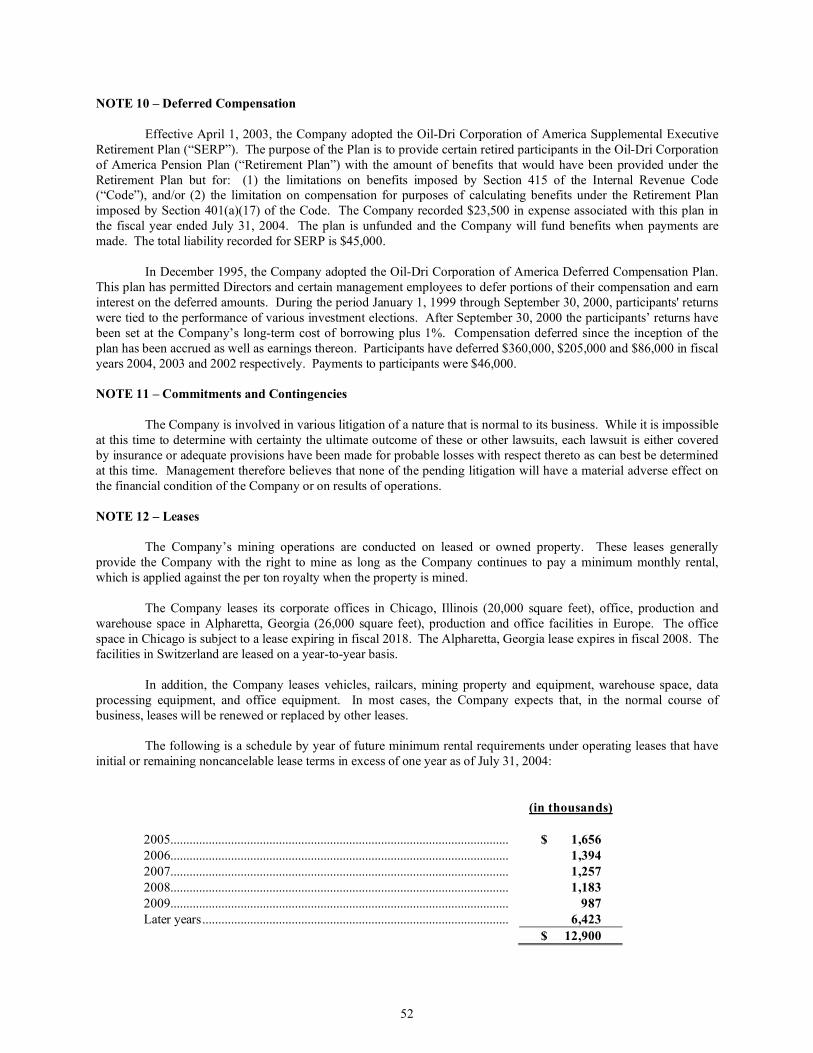
52
NOTE 10 – Deferred Compensation Effective April 1, 2003, the Company adopted the Oil-Dri Corporation of America Supplemental Executive Retirement Plan (“SERP”). The purpose of the Plan is to provide certain retired participants in the Oil-Dri Corporation of America Pension Plan (“Retirement Plan”) with the amount of benefits that would have been provided under the Retirement Plan but for: (1) the limitations on benefits imposed by Section 415 of the Internal Revenue Code (“Code”), and/or (2) the limitation on compensation for purposes of calculating benefits under the Retirement Plan imposed by Section 401(a)(17) of the Code. The Company recorded $23,500 in expense associated with this plan in the fiscal year ended July 31, 2004. The plan is unfunded and the Company will fund benefits when payments are made. The total liability recorded for SERP is $45,000. In December 1995, the Company adopted the Oil-Dri Corporation of America Deferred Compensation Plan. This plan has permitted Directors and certain management employees to defer portions of their compensation and earn interest on the deferred amounts. During the period January 1, 1999 through September 30, 2000, participants' returns were tied to the performance of various investment elections. After September 30, 2000 the participants’ returns have been set at the Company’s long-term cost of borrowing plus 1%. Compensation deferred since the inception of the plan has been accrued as well as earnings thereon. Participants have deferred $360,000, $205,000 and $86,000 in fiscal years 2004, 2003 and 2002 respectively. Payments to participants were $46,000. NOTE 11 – Commitments and Contingencies The Company is involved in various litigation of a nature that is normal to its business. While it is impossible at this time to determine with certainty the ultimate outcome of these or other lawsuits, each lawsuit is either covered by insurance or adequate provisions have been made for probable losses with respect thereto as can best be determined at this time. Management therefore believes that none of the pending litigation will have a material adverse effect on the financial condition of the Company or on results of operations. NOTE 12 – Leases The Company’s mining operations are conducted on leased or owned property. These leases generally provide the Company with the right to mine as long as the Company continues to pay a minimum monthly rental, which is applied against the per ton royalty when the property is mined. The Company leases its corporate offices in Chicago, Illinois (20,000 square feet), office, production and warehouse space in Alpharetta, Georgia (26,000 square feet), production and office facilities in Europe. The office space in Chicago is subject to a lease expiring in fiscal 2018. The Alpharetta, Georgia lease expires in fiscal 2008. The facilities in Switzerland are leased on a year-to-year basis. In addition, the Company leases vehicles, railcars, mining property and equipment, warehouse space, data processing equipment, and office equipment. In most cases, the Company expects that, in the normal course of business, leases will be renewed or replaced by other leases. The following is a schedule by year of future minimum rental requirements under operating leases that have initial or remaining noncancelable lease terms in excess of one year as of July 31, 2004:
(in thousands) 2005.......................................................................................................... $ 1,656 2006.......................................................................................................... 1,394 2007.......................................................................................................... 1,257 2008.......................................................................................................... 1,183 2009.......................................................................................................... 987 Later years................................................................................................ 6,423 $ 12,900

53
NOTE 12 – Leases (Continued) The following schedule shows the composition of total rental expense for all operating leases, including those with terms of one month or less which were not renewed, as of the years ended July 31:
2004 2003 2002 (in thousands) Vehicles and Railcars........................ $ 878 $ 884 $ 880 Office facilities ................................... 516 499 496 Warehouse facilities .......................... 253 231 379 Mining properties.............................. Minimum .................................... 91 91 181 Contingent................................... 678 556 516 Other .................................................. 902 883 859 $ 3,318 $ 3,144 $ 3,311
Contingent mining royalty payments are determined based on the tons of raw clay mined. NOTE 13 – Other Cash Flow Information Cash payments for interest and income taxes were as follows:
2004 2003 2002 (in thousands) Interest ............................................... $ 1,859 $ 2,147 $ 2,283 Income taxes...................................... $ 1,034 $ 672 $ 1,057
NOTE 14 – Post Retirement Health Benefits
Domestic salaried employees who retire prior to reaching age 65 and have at least 17 years of continuous service and whose age is at least 55 and whose age plus years of service equals at least 80 may elect to continue their health care coverage under the Oil-Dri Corporation of America Employee Benefits Plan until they reach the age of 65. The Company accrues the costs of such benefits during the employees’ active years of service. Net periodic postretirement cost for the years ended July 31, was as follows:
2004 2003 2002 (in thousands) Components of net periodic postretirement cost Service Cost $ 56 $ 40 $ 23 Interest Cost 45 43 37 Amortization of Net transition obligation 16 16 16 Amortization of Losses 5 -- -- Net periodic postretirement benefit cost $ 122 $ 99 $ 76
The accumulated postretirement benefit obligation assumptions were as follows:
2004 2003 Discount rate 6.25% 5.75% Medical trend 6% 7%
The medical trend rate going forward has been assumed constant at 6%.
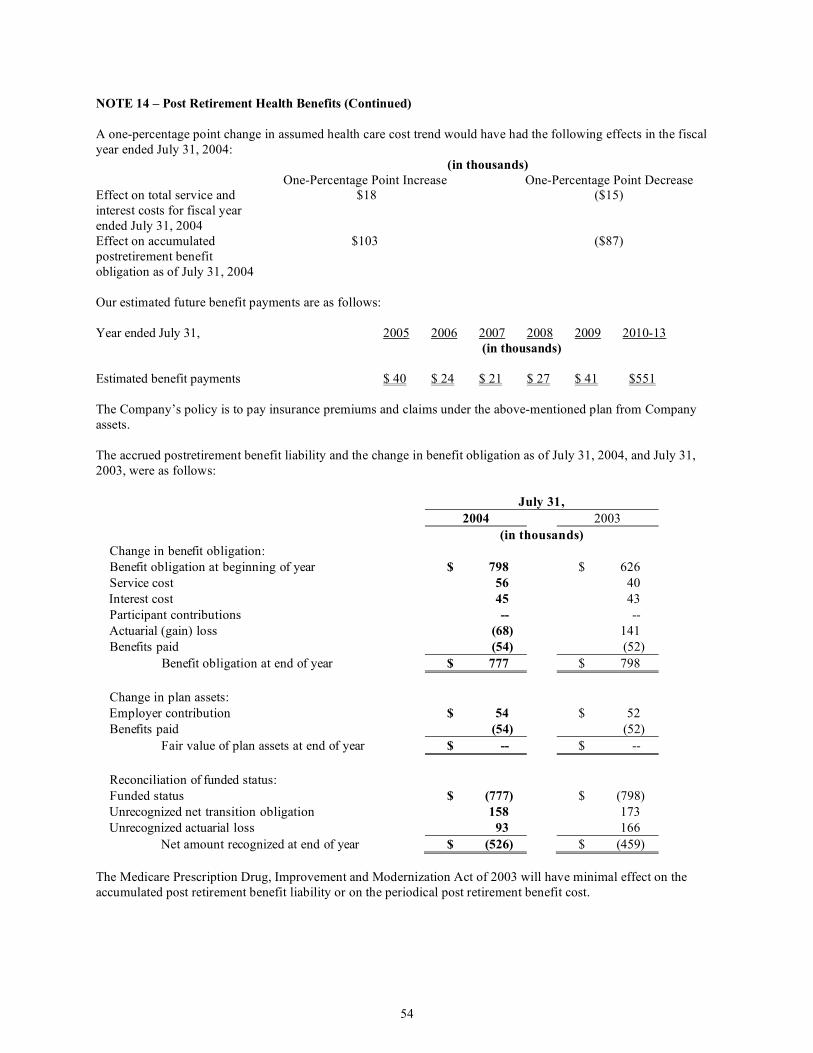
54
NOTE 14 – Post Retirement Health Benefits (Continued) A one-percentage point change in assumed health care cost trend would have had the following effects in the fiscal year ended July 31, 2004: (in thousands) One-Percentage Point Increase One-Percentage Point Decrease Effect on total service and interest costs for fiscal year ended July 31, 2004
$18 ($15)
Effect on accumulated postretirement benefit obligation as of July 31, 2004
$103 ($87)
Our estimated future benefit payments are as follows: Year ended July 31, 2005 2006 2007 2008 2009 2010-13 (in thousands) Estimated benefit payments $ 40 $ 24 $ 21 $ 27 $ 41 $551 The Company’s policy is to pay insurance premiums and claims under the above-mentioned plan from Company assets. The accrued postretirement benefit liability and the change in benefit obligation as of July 31, 2004, and July 31, 2003, were as follows:
July 31, 2004 2003
(in thousands) Change in benefit obligation: Benefit obligation at beginning of year $ 798 $ 626 Service cost 56 40 Interest cost 45 43 Participant contributions -- -- Actuarial (gain) loss (68) 141 Benefits paid (54) (52) Benefit obligation at end of year $ 777 $ 798 Change in plan assets: Employer contribution $ 54 $ 52 Benefits paid (54) (52) Fair value of plan assets at end of year $ -- $ -- Reconciliation of funded status: Funded status $ (777) $ (798) Unrecognized net transition obligation 158 173 Unrecognized actuarial loss 93 166 Net amount recognized at end of year $ (526) $ (459)
The Medicare Prescription Drug, Improvement and Modernization Act of 2003 will have minimal effect on the accumulated post retirement benefit liability or on the periodical post retirement benefit cost.

55
NOTE 15 – Derivative Instruments In 1998, the Company entered into two interest rate swap agreements. The notional amount of these agreements is $22,000,000 at July 31, 2004 and $23,500,000 at July 31, 2003, respectively. The swap agreements terminate on May 1, 2013. Changes in the fair value of the derivatives are recorded each period in current earnings or other comprehensive income, depending on whether a derivative is designated as part of a hedge transaction and, if it is, the type of hedge transaction. These derivatives do not qualify for hedge accounting and accordingly, the Company has recorded these derivative instruments and the associated assets or liabilities at their fair values with the related gains or losses recorded as other income or expense in the consolidated statements of operations. The Company recognized additional interest expense of $14,000, $15,000 and $15,000 in fiscal years 2004, 2003 and 2002 respectively, as a result of these contracts. NOTE 16 – Selected Quarterly Financial Data (Unaudited) A summary of selected information for 2004 and 2003 is as follows: Fiscal 2004 Quarter Ended October 31 January 31 April 30 July 31 Total (in thousands except per share amounts)
Net Sales .................................................. $ 46,292 $ 47,800 $ 46,616 $ 44,803 $ 185,511 Gross Profit .............................................. $ 10,878 $ 11,293 $ 11,068 $ 10,009 $ 43,248 Net Income (Loss) ................................... $ 1,718 $ 1,728 $ 1,824 $ (237) $ 5,033 Net Income (Loss) Per Share Basic Common................................. $ 0.34 $ 0.34 $ 0.36 $ (0.04) $ 0.98 Basic Class B Common ................... $ 0.25 $ 0.26 $ 0.27 $ (0.04) $ 0.74 Diluted .............................................. $ 0.30 $ 0.29 $ 0.30 $ (0.04) $ 0.84 Dividends Per Share Common........................................... $ 0.10 $ 0.10 $ 0.10 $ 0.10 $ 0.40 Class B.............................................. $ 0.08 $ 0.08 $ 0.08 $ 0.08 $ 0.30 Company Common Stock Price Range: High .................................................. $ 14.94 $ 17.40 $ 17.30 $ 17.00 Low................................................... $ 11.35 $ 14.26 $ 16.15 $ 15.20
Fiscal 2003 Quarter Ended October 31 January 31 April 30 July 31 Total (in thousands except per share amounts)
Net Sales .................................................. $ 37,730 $ 44,456 $ 46,125 $ 44,730 $ 173,041 Gross Profit .............................................. $ 7,753 $ 9,623 $ 9,915 $ 8,337 $ 35,628 Net Income (Loss) ................................... $ 411 $ 1,219 $ 977 $ 476 $ 3,083 Net Income (Loss) Per Share Basic Common................................. $ 0.08 $ 0.23 $ 0.19 $ 0.09 $ 0.59 Basic Class B Common ................... $ 0.06 $ 0.17 $ 0.14 $ 0.07 $ 0.44 Diluted .............................................. $ 0.07 $ 0.21 $ 0.17 $ 0.08 $ 0.54 Dividends Per Share Common........................................... $ 0.09 $ 0.09 $ 0.09 $ 0.09 $ 0.36 Class B.............................................. $ 0.07 $ 0.07 $ 0.07 $ 0.07 $ 0.27 Company Common Stock Price Range: High .................................................. $ 8.39 $ 9.65 $ 11.22 $ 12.35 Low................................................... $ 7.10 $ 7.00 $ 8.40 $ 10.10
56
REPORT OF INDEPENDENT REGISTERED PUBLIC ACCOUNTING FIRM
To the Board of Directors and Stockholders of Oil-Dri Corporation of America: In our opinion, the accompanying consolidated balance sheet and the related consolidated statements of operations, stockholders’ equity, and cash flows present fairly, in all material respects, the financial position of Oil-Dri Corporation of America at July 31, 2004 and 2003 and the results of their operations and their cash flows for each of the two years in the period ended July 31, 2004 in conformity with accounting principles generally accepted in the United States of America. These financial statements are the responsibility of the Company’s management. Our responsibility is to express an opinion on these financial statements based on our audits. We conducted our audits of these statements in accordance with the standards of the Public Company Accounting Oversight Board (United States). Those standards require that we plan and perform the audit to obtain reasonable assurance about whether the financial statements are free of material misstatement. An audit includes examining, on a test basis, evidence supporting the amounts and disclosures in the financial statements, assessing the accounting principles used and significant estimates made by management, and evaluating the overall financial statement presentation. We believe that our audits provide a reasonable basis for our opinion. The financial statements of the Company for the year ended July 31, 2002 were audited by other auditors whose report dated September 10, 2002 expressed an unqualified opinion on those statements. As disclosed in Note 1 in the financial statements, the Company changed the manner in which it accounts for goodwill and other intangible assets upon adoption of Statement of Financial Accounting Standards No. 142 “Goodwill and Other Intangible Assets” on October 1, 2002. /s/ PricewaterhouseCoopers LLP PricewaterhouseCoopers LLP Chicago, Illinois September 15, 2004 Item 9. Changes in and Disagreements with Accountants on Accounting and Financial Disclosure None.
57
PART III Item 10. Directors and Executive Officers of Oil-Dri The information required by this Item is (except for information set forth below concerning the Board of Directors and information in Part I hereof, concerning executive officers) contained in Oil-Dri’s Proxy Statement for its 2004 annual meeting of stockholders (“Proxy Statement”) under the caption “1. Election of Directors” and is incorporated herein by this reference. Board of Directors Richard M. Jaffee Thomas D. Kuczmarski Chairman of the Board of Directors Senior Partner and President, Kuczmarski & Associates, Inc. Daniel S. Jaffee President and Chief Executive Officer Joseph C. Miller Vice Chairman of the Board of Directors J. Steven Cole1 President, Cole & Associates Paul J. Miller Partner, Sonnenschein Nath & Rosenthal, LLP Arnold W. Donald Chairman, Merisant Company Allan H. Selig2 President and Chairman, Selig Lease Ronald B. Gordon Company President and Chief Operating Officer Commissioner of Major League Baseball Nice-Pak Products, Inc. 1Audit Committee Chair 2Compensation Committee Chair The Company has adopted a Code of Ethics and Business Conduct (the “Code”) which applies to all of its directors, officers (including the Company’s Chief Executive Officer and senior financial officers) and employees. The Code imposes special responsibilities on the Chief Executive Officer and the senior financial officers of the Company. The Code, the Company’s Corporate Governance Guidelines and the charter of its Audit Committee may be viewed on the Company’s website, www.oildri.com and are available in print to any person upon request to Investor Relations, Oil-Dri Corporation of America, 410 North Michigan Avenue, Suite 400, Chicago, Illinois 60611-4213, telephone (312) 706-3232. Any amendment to, or waiver of, a provision of the Code which applies to the Company’s Chief Executive Officer or senior financial officers and relates to the elements of a “code of ethics” as defined by the Securities and Exchange Commission will also be posted on the Company’s website. As allowed by the controlled company exemption to certain New York Stock Exchange rules, the Company does not have a nominating/corporate governance committee and its compensation committee does not have a charter. Item 11. Executive Compensation The information required by this Item is contained in Oil-Dri’s Proxy Statement under the captions “Executive Compensation,” “Report of the Compensation and the Stock Option Committees of Oil-Dri Corporation of America on Executive Compensation,” “Compensation Committee Interlocks and Insider Participation” and “Performance Graph” and is incorporated herein by this reference. Item 12. Security Ownership of Certain Beneficial Owners and Management The information required by this Item is contained in Oil-Dri’s Proxy Statement under the captions “General--Principal Stockholders” and “Security Ownership of Management” and is incorporated herein by this reference.

58
Item 13. Certain Relationships and Related Transactions The information required by this Item is contained in Oil-Dri’s Proxy Statement under the caption “Compensation Committee Interlocks and Insider Participation” and is incorporated herein by this reference. Item 14. Controls and Procedures
(a) Based on their evaluation within 90 days prior to the filing date of this Annual Report on Form 10-K, the Company’s Chief Executive Officer and Chief Financial Officer have concluded that the Company’s disclosure controls and procedures as defined in Rule 13a-14(c) under the Securities Exchange Act of 1934, as amended, are effective for gathering, analyzing, and disclosing the information the Company is required to disclose in reports filed under the Act.
(b) There were no significant changes in the Company’s internal controls or in other factors that could
significantly affect those controls since the date of last evaluation of those internal controls.

59
PART IV
Item 15. Exhibits, Financial Statement Schedules, and Reports on Form 8-K (a)(1) The following consolidated financial statements are contained herein. Consolidated Balance Sheets as of July 31, 2004 and July 31, 2003.
Consolidated Statements of Operations for the fiscal years ended July 31, 2004, July 31, 2003 and July 31, 2002.
Consolidated Statements of Stockholders' Equity for the fiscal years ended July 31, 2004, July 31, 2003
and July 31, 2002. Consolidated Statements of Cash Flows for the fiscal years ended July 31, 2004, July 31, 2003 and July
31, 2002.
Notes to Consolidated Financial Statements. Report of Independent Registered Public Accounting Firm. (a)(2) The following financial statement schedules are contained herein: Schedule to Financial Statements, as follows:
Schedule II--Valuation and Qualifying Accounts, years ended July 31, 2004, July 31, 2003 and July 31, 2002.
(a)(3) The following documents are exhibits to this Report: (3)(a)1 Articles of Incorporation of Oil-Dri, as amended. (3)(b)2 Bylaws of Oil-Dri, as amended June 16, 1995. (10)(c)(4)6 Memorandum of Agreement #1450 “Fresh Step”™, dated as of March 12, 2001 between
A&M Products Manufacturing Company and Registrant. (Confidential treatment of certain portions of this Exhibit has been granted.)
(10)(d)8 Description of 1987 Executive Deferred Compensation Program.* (10)(e)(1)9 Salary Continuation Agreement dated August 1, l989 between Richard M. Jaffee and Oil-Dri
(“1989 Agreement”).* (10)(e)(2)10 Extension and Amendment, dated October 9, 1998, to the 1989 Agreement.* (10)(e)(3)11 Second Amendment, Effective October 31, 2000, to the 1989 Agreement.* (10)(f)12 1988 Stock Option Plan.* (10)(h)14 Note Agreement, dated as of April 15, 1993, between Oil-Dri and Teacher's Insurance and
Annuity Association of America regarding $6,500,000 7.17% Senior Notes due August 15, 2004.
(10)(h)(1)13 First Amendment, dated as of January 15, 2001, to the Note Agreement dated as of April 15,
1993.
60
(10)(h)(2)25 Second Amendment dated July 15, 2002 to Note Agreement dated as of April 15, 1993. (10)(j)22 The Oil-Dri Corporation of America Deferred Compensation Plan adopted November 15,
1995, as amended and restated effective October 1, 2000.* (10)(j)(1)29 Restatement dated April 1, 2003 of the Oil-Dri Corporation of America November 15, 1995
Deferred Compensation Plan.* (10)(k)23 The Oil-Dri Corporation of America 1995 Long Term Incentive Plan as amended and restated
effective June 9, 2000.* (10)(l)30 Supplemental Executive Retirement Plan dated April 1, 2003. (10)(m)17 $25,000,000 Note Purchase Agreement dated as of April 15, 1998 between Oil-Dri and
Teachers Insurance and Annuity Association of America and Cigna Investments, Inc. (10)(m)(5)16 First Amendment, dated as of January 15, 2001 to the Note Agreement dated as of April 15,
1998. (10)(m)(6)26 Second Amendment dated as of July 15, 2002 to Note Agreement dated as of April 15, 1998. (10)(n)24 The Oil-Dri Corporation of America Outside Director Stock Plan as amended and restated
effective October 16, 1999.* (10)(o)18 $15,000,000 unsecured, committed line of credit agreement dated January 29, 1999 between
the Company and Harris Trust and Savings Bank. (10)(o)(1)27 First Amendment, dated May 30, 2002 to Credit Agreement dated as of January 29, 1999. (10)(o)(2)28 Second Amendment, dated November 22, 2002, to Credit Agreement dated as of January 29,
1999. (10)(o)(3) Third Amendment, dated November 24, 2003, to Credit Amendment dated as of January 29,
1999. (10)(r)21 Agreement (“Church & Dwight Agreement”) dated May 19, 1999 between Church & Dwight
Co., Inc. and Oil-Dri. (Confidential treatment of certain portions of this Exhibit has been granted.)
(b) Reports on Form 8-K.
The Company filed a Current Report on Form 8-K dated May 27, 2004, reporting that it had issued a press release announcing its third quarter and nine month earnings.
The Company filed a Current Report on Form 8-K dated August 13, 2004, reporting that it had issued a
press release announcing a patent licensing agreement for scoopable cat litter in settlement of patent infringement litigation.
(11) Statement re: Computation of Income per Share. (21) Subsidiaries of Oil-Dri. (23) Consents of PricewaterhouseCoopers LLP and Blackman Kallick Bartelstein, LLP. (31) Certifications pursuant to Rule 13a – 14(a).
61
(99) Certifications pursuant to Section 1350 of the Sarbanes-Oxley Act of 2002. _________________ * Management contract or compensatory plan or arrangement. 1 Incorporated by reference to Exhibit (4.1) to Oil-Dri’s Registration Statement on Form S-8 (Registration No.
333-57625), made effective on June 24, 1998. 2 Incorporated by reference to Exhibit (3)(b) to Oil-Dri’s Annual Report on Form 10-K for the fiscal year ended
July 31, 1995. 6 Incorporated by reference to Exhibit 10(s) to Registrant’s Current Report on Form 8-K dated May 1, 2001. 8 Incorporated by reference to Exhibit (10)(f) to Oil-Dri’s Annual Report on Form 10-K for the fiscal year
ended July 31, 1988. 9 Incorporated by reference to Exhibit (10)(g) to Oil-Dri’s Annual Report on Form 10-K for the fiscal year
ended July 31, 1989. 10 Incorporated by reference to Exhibit (10)(n) to Oil-Dri’s Annual Report on Form 10-K for the fiscal year
ended July 31, 1998. 11 Incorporated by reference to Exhibit 99.1 to Registrant’s Current Report on Form 8-K dated November 13,
2000. 12 Incorporated by reference to Exhibit (4)(a) to Oil-Dri’s Registration Statement on Form S-8 (Registration No.
33-29650), made effective on June 30, 1989. 13 Incorporated by reference to Exhibit (10)(m)(4) to Oil-Dri’s Quarterly Report on Form 10-Q for the quarter
ended January 31, 2001. 14 Incorporated by reference to Exhibit (10)(i) to Oil-Dri’s Annual Report on Form 10-K for the fiscal year
ended July 31, 1993. 16 Incorporated by reference to Exhibit (10)(m)(5) to Oil-Dri’s Quarterly Report on Form 10-Q for the quarter
ended January 31, 2001.
17 Incorporated by reference to Exhibit (10)(m) to Oil-Dri’s Quarterly Report on Form 10-Q for the quarter ended April 30, 1998.
18 Incorporated by reference to Exhibit (10)(o) to Oil-Dri’s Quarterly Report on Form 10-Q for the quarter ended January 31, 1999.
21 Incorporated by reference to Exhibit (10)(r) to Oil-Dri’s Annual Report on Form 10-K for the fiscal year
ended July 31, 1999. 22 Incorporated by reference to Exhibit (10)(j) to Oil-Dri’s Annual Report on Form 10-K for the fiscal year
ended July 31, 2001.
23 Incorporated by reference to Exhibit (10)(k) to Oil-Dri’s Annual Report on Form 10-K for the fiscal year ended July 31, 2001.
24 Incorporated by reference to Exhibit (10)(n) to Oil-Dri’s Annual Report on Form 10-K for the fiscal year ended July 31, 2001.
25 Incorporated by reference to Exhibit (10)(h)(2) to Oil-Dri’s Annual Report on Form 10-K for the fiscal year ended July 31, 2002.

62
26 Incorporated by reference to Exhibit (10)(m)(6) to Oil-Dri’s Annual Report on Form 10-K for the fiscal year ended July 31, 2002.
27 Incorporated by reference to Exhibit (10)(o)(1) to Oil-Dri’s Annual Report on Form 10-K for the fiscal year ended July 31, 2002.
28 Incorporated by reference to Exhibit (10)(o)(2) to Oil-Dri’s Quarterly Report on Form 10-Q for the quarter ended January 31, 2003.
29 Incorporated by reference to Exhibit (10)(j)(1) to Oil-Dri’s Quarterly Report on Form 10-Q for the quarter
ended April 30, 2003.
30 Incorporated by reference to Exhibit (10)(1) to Oil-Dri’s Quarterly Report on Form 10-Q for the quarter ended April 30, 2003.
Oil-Dri agrees to furnish the following agreements upon the request of the Commission: Exhibit (4)(b) Letter of Credit Agreement, dated as of October 1, 1988 between Harris Trust and Savings
Bank and Blue Mountain Production Company in the amount of $2,634,590 in connection with the issuance by Town of Blue Mountain, Mississippi of Variable/Fixed Rate Industrial Development Revenue Bonds, Series 1988 B (Blue Mountain Production Company Project) in the aggregate principal amount of $2,500,000 and related Indenture of Trust, Lease Agreement, Remarketing Agreement and Guaranties.
63
SIGNATURES
Pursuant to the requirements of Section 13 or 15(d) of the Securities Exchange Act of 1934, Oil-Dri has duly caused this report to be signed on its behalf by the undersigned, thereunto duly authorized. OIL-DRI CORPORATION OF AMERICA (Registrant) By /s/ Daniel S. Jaffee Daniel S. Jaffee President and Chief Executive Officer, Director Dated: October 28, 2004 Pursuant to the requirements of the Securities Exchange Act of 1934, this report has been signed below by the following persons on behalf of Oil-Dri and in the capacities and on the dates indicated: /s/ Richard M. Jaffee October 28, 2004 Richard M. Jaffee Chairman of the Board of Directors /s/ Andrew N. Peterson October 28, 2004 Andrew N. Peterson Vice President and Chief Financial Officer Principal Financial Officer /s/ Daniel T. Smith October 28, 2004 Daniel T. Smith Vice President and Controller Principal Accounting Officer /s/ J. Steven Cole October 28, 2004 J. Steven Cole Director /s/ Arnold W. Donald October 28, 2004 Arnold W. Donald Director /s/ Ronald B. Gordon October 28, 2004 Ronald B. Gordon Director /s/ Thomas D. Kuczmarski October 28, 2004 Thomas D. Kuczmarski Director
64
/s/ Joseph C. Miller October 28, 2004 Joseph C. Miller Vice Chairman of the Board of Directors /s/ Paul J. Miller October 28, 2004 Paul J. Miller Director /s/ Allan H. Selig October 28, 2004 Allan H. Selig Director

65
Report of Independent Registered Public Accounting Firm on
Financial Statement Schedules To the Board of Directors and Stockholders of Oil-Dri Corporation of America: Our audits of the consolidated financial statements referred to in our report, dated September 15, 2004, appearing in the 2004 Annual Report on Form 10-K of Oil-Dri Corporation of America (which report and consolidated financial statements are incorporated by reference in this Annual Report on Form 10-K) also included an audit of the financial statement schedules listed in Item 15(a)(2) of this Form 10-K. In our opinion, these financial statement schedules for the year ended July 31, 2004 and 2003, presents fairly, in all material respects, the information set forth herein when read in conjunction with the related consolidated financial statements. The financial statements schedules of the Company for the year ended July 31, 2002 were audited by other auditors whose report dated September 10, 2002 expressed an unqualified opinion on those statements. /s/ PricewaterhouseCoopers LLP PricewaterhouseCoopers LLP Chicago, Illinois September 15, 2004

66
SCHEDULE II
OIL-DRI CORPORATION OF AMERICA AND SUBSIDIARIES
VALUATION AND QUALIFYING ACCOUNTS
Year Ended July 31
2004 2003 2002 (in thousands)
Allowance for doubtful accounts: Beginning balance ....................................................................................... $ 441 $ 392 $ 455 Additions charged to expense...................................................................... 201 387 409 Deductions* ................................................................................................. 34 338 472 Balance at end of year.................................................................................. $ 608 $ 441 $ 392
* Net of recoveries. Valuation reserve for income taxes:
Beginning balance ....................................................................................... $ 357 $ 357 $ -- Additions charged to expense...................................................................... 916 -- 357 Deductions ................................................................................................... -- -- -- Balance at end of year.................................................................................. $ 1,273 $ 357 $ 357

67
EXHIBITS
Exhibit Number Exhibit 10(o)(3): Third Amendment, dated November 24, 2003, to Credit Amendment dated as of January 29, 1999 Exhibit 11: Statement Re: Computation of per share earnings Exhibit 21: Subsidiaries of Oil-Dri Exhibit 23: Consents of PricewaterhouseCoopers LLP and Blackman Kallick Bartelstein, LLP Exhibit 31: Certifications by Daniel S. Jaffee, President and Chief Executive Officer and Andrew N. Peterson,
Chief Financial Officer, required by Rule 13a-14(a) Exhibit 99: Certifications pursuant to Section 1350 of the Sarbanes-Oxley Act of 2002
Note: Stockholders may receive copies of the above listed exhibits, without fee, by written request to Investor
Relations, Oil-Dri Corporation of America, 410 North Michigan Avenue, Suite 400, Chicago, Illinois 60611-4213.

68
Exhibit 10(o)(3): Third Amendment, dated November 24, 2003, to Credit Amendment dated as of January 29, 1999.
THIRD AMENDMENT TO CREDIT AGREEMENT This Third Amendment to Credit Agreement (the “Amendment”) dated as of November 24, 2003, between Oil-Dri Corporation of America (the “Company”) and Harris Trust and Savings Bank (the “Bank”).
PRELIMINARY STATEMENTS
A. The Company and the Bank are parties to a Credit Agreement dated as of January 29, 1999, as amended (the “Credit Agreement”). All capitalized terms used herein without definition shall have the same meanings herein as such terms are defined in the Credit Agreement.
B. The Company has requested that the Bank extend the Termination Date to January 29, 2005, and the Bank is willing to do so under the terms and conditions set forth in this Amendment.
SECTION 1. AMENDMENT. Upon satisfaction of the conditions precedent contained in Section 3 below, the definition of Termination Date appearing in Section 4.1 of the Credit Agreement (Definitions) shall be and hereby is amended and restated in its entirety to read as follows:
“Termination Date” means January 29, 2005, or such earlier date on which the Revolving Credit Commitment is terminated in whole pursuant to Section 3.4, 8.2 or 8.3 hereof.
SECTION 2. REPRESENTATIONS. In order to induce the Bank to execute and deliver this Amendment, the Company hereby represents and warrants to the Bank that each of the representations and warranties set forth in Section 5 of the Credit Agreement is true and correct on and as of the date of this Amendment as if made on and as of the date hereof and as if each reference therein to the Credit Agreement referred to the Credit Agreement as amended hereby and no Default or Event of Default exists under the Credit Agreement or shall result after giving effect to this Amendment. SECTION 3. CONDITIONS PRECEDENT. This Amendment shall become effective upon satisfaction of the following conditions precedent:
3.1. The Company and the Bank shall have executed and delivered this Amendment.
3.2. Each Guarantor shall have executed and delivered its consent to this Amendment in the space provided for that purpose below.
3.3. Legal matters incident to the execution and delivery of this Amendment shall be satisfactory to the Bank and its counsel.
SECTION 4. MISCELLANEOUS. This Amendment may be executed in any number of counterparts and by different parties hereto on separate counterpart signature pages, each of which when so executed shall be an original but all of which shall constitute one and the same instrument. Except as specifically amended and modified hereby, all of the terms and conditions of the Credit Agreement and the other Loan Documents shall remain unchanged and in full force and effect. All references to the Credit Agreement in any document shall be deemed to be references to the Credit Agreement as reinstated and amended hereby. All capitalized terms used herein without definition shall have the same meaning herein as they have in the Credit Agreement. This Amendment shall be construed and governed by and in accordance with the internal laws of the State of Illinois.
69
This Third Amendment to Credit Agreement is dated as of the date first above written. OIL-DRI CORPORATION OF AMERICA By /s/ Jeffrey M. Libert_______________ Name Jeffrey M. Libert Title Vice President / CFO HARRIS TRUST AND SAVINGS BANK By ______________________________ Name _________________________ Title _________________________

70
GUARANTORS’ CONSENT Each of the undersigned has heretofore guaranteed the due and punctual payment of all present and future indebtedness of the Company evidenced by or arising out of the Loan Documents, including, without limitation, all Obligations, pursuant to Section 9 of the Credit Agreement and hereby consents to the amendment to the Credit Agreement set forth above and confirms that all of the obligations of the undersigned thereunder remain in full force and effect. Each of the undersigned further agrees that the consent of the undersigned to any further amendments to the Credit Agreement shall not be required as a result of this consent having been obtained. Each of the undersigned acknowledges that the Bank is relying on the assurances provided for herein and entering into this Third Amendment and maintaining credit outstanding to the Borrower under the Credit Agreement as so amended. OIL-DRI CORPORATION OF GEORGIA OIL-DRI PRODUCTION COMPANY By _______________________________ By ___________________________ Name Jeffrey M. Libert Name Richard Pietrowski Title Treasurer Title Treasurer MOUNDS PRODUCTION COMPANY, LLC MOUNDS MANAGEMENT, INC. By _______________________________ By ___________________________ Name Richard Pietrowski Name Richard Pietrowski Title Treasurer Title Treasurer BLUE MOUNTAIN PRODUCTION COMPANY OIL-DRI CORPORATION OF NEVADA By _______________________________ By ___________________________ Name Jeffrey M. Libert Name Jeffrey M. Libert Title Treasurer Title Treasurer PHOEBE PRODUCTS CO. By _______________________________ Name Daniel S. Jaffee Title President
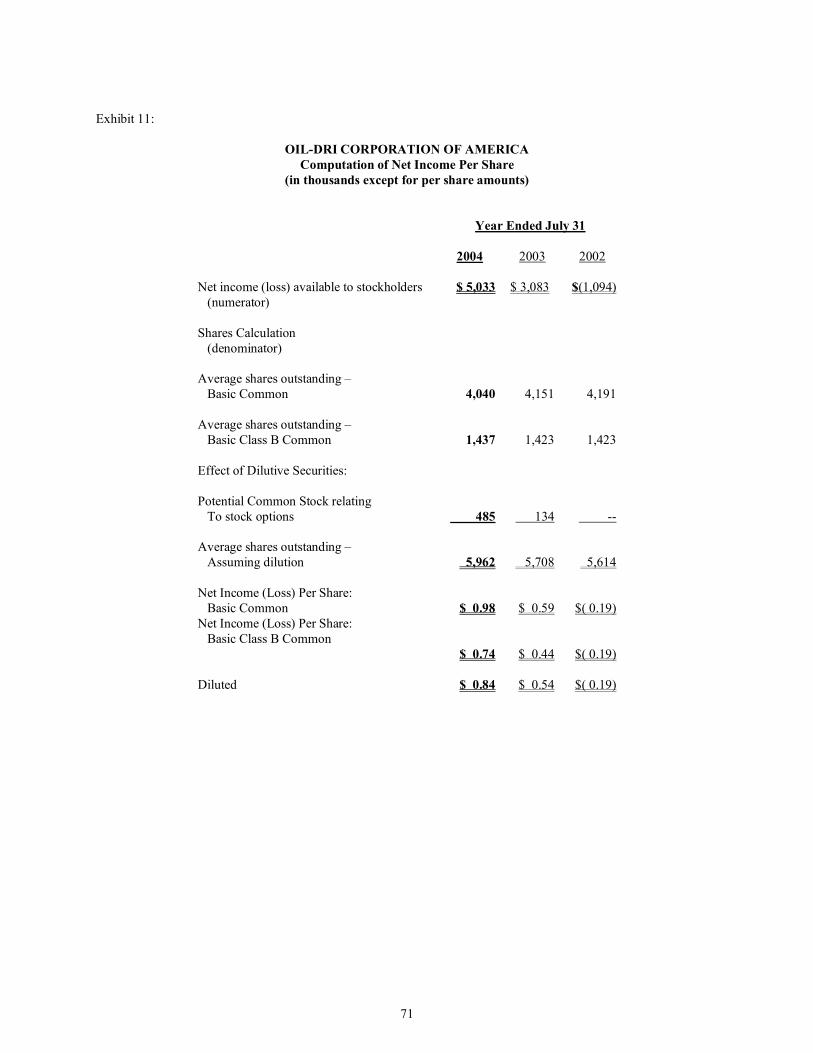
71
Exhibit 11:
OIL-DRI CORPORATION OF AMERICA
Computation of Net Income Per Share (in thousands except for per share amounts)
Year Ended July 31
2004 2003 2002 Net income (loss) available to stockholders (numerator)
$ 5,033
$ 3,083
$(1,094)
Shares Calculation (denominator)
Average shares outstanding – Basic Common
4,040
4,151
4,191 Average shares outstanding – Basic Class B Common
1,437
1,423
1,423 Effect of Dilutive Securities:
Potential Common Stock relating To stock options
485
134
--
Average shares outstanding – Assuming dilution
5,962
5,708
5,614 Net Income (Loss) Per Share: Basic Common
$ 0.98
$ 0.59
$( 0.19) Net Income (Loss) Per Share: Basic Class B Common
$ 0.74
$ 0.44
$( 0.19) Diluted
$ 0.84
$ 0.54
$( 0.19)

72
Exhibit 21:
SUBSIDIARIES OF OIL-DRI
Subsidiary
State or Country of Organization
Blue Mountain Production Company Mississippi Favorite Products Company, Ltd. Canada Mounds Management, Inc. Delaware Mounds Production Company, LLC Illinois Ochlocknee Holding Co., S.A. Spain Ochlocknee Mining Co., S.A. Spain ODC Acquisition Corp. Illinois Oil-Dri Corporation of Georgia Georgia Oil-Dri Corporation of Nevada Nevada Oil-Dri Production Company Mississippi Oil-Dri, S.A. Switzerland Oil-Dri (U.K.) Limited United Kingdom Taft Production Company Delaware
73
Exhibit 23:
CONSENT OF INDEPENDENT REGISTERED PUBLIC ACCOUNTING FIRM We hereby consent to the incorporation by reference in the Registration Statements on Form S-8 (No. 333-87008 and No. 333-87010) of Oil-Dri Corporation of America of our report dated September 15, 2004 relating to the financial statements and financial statement schedule, which appears in this Form 10-K. PricewaterhouseCoopers LLP Chicago, Illinois October 28, 2004
CONSENT OF INDEPENDENT PUBLIC ACCOUNTANTS
As independent public accountants, we hereby consent to the use of our reports and to all references to our Firm included in or by incorporation by reference made as part of the Annual Report on Form 10-K of Oil-Dri Corporation of America for the fiscal year ended July 31, 2002 and the Registration Statement on Form S-8 relating to the 1995 Long Term Incentive Plan and the 1988 Stock Option Plan. Blackman Kallick Bartelstein, LLP October 15, 2003

74
Exhibit 31: CERTIFICATIONS PURSUANT TO RULE 13a -14(a) UNDER THE SECURITIES EXCHANGE ACT OF 1934, AS AMENDED
I. I, Daniel S. Jaffee, Chief Executive Officer of Oil-Dri Corporation of America, certify that: 1. I have reviewed this annual report on Form 10-K of Oil-Dri Corporation of America (“Oil-Dri”); 2. Based on my knowledge, this annual report does not contain any untrue statement of a material fact or omit
to state a material fact necessary to make the statements made, in light of the circumstances under which such statements were made, not misleading with respect to the period covered by this annual report;
3. Based on my knowledge, the financial statements, and other financial information included in this annual
report, fairly present in all material respects the financial condition, results of operations and cash flows of Oil-Dri as of, and for, the periods presented in this annual report;
4. Oil-Dri’s other certifying officer and I are responsible for establishing and maintaining disclosure controls
and procedures (as defined in Exchange Act Rules 13a-15(e) and 15d-15(e)) and internal control over financial reporting (as defined in Exchange Act Rules 13a-15(f) and 15d-15(f)) for Oil-Dri and we have:
a. Designed such disclosure controls and procedures, or caused such disclosure controls and procedures
to be designed under our supervision, to ensure that material information relating to Oil-Dri, including its consolidated subsidiaries, is made known to us by others within those entities, particularly during the period in which this report is being prepared;
b. Designed such internal control over financial reporting, or caused such internal control over financial
reporting to be designed under our supervision, to provide reasonable assurance regarding the reliability of financial reporting and the preparation of financial statements for external purposes in accordance with generally accepted accounting principles;
c. Evaluated the effectiveness of Oil-Dri’s disclosure controls and procedures and presented in this
report our conclusions about the effectiveness of the disclosure controls and procedures, as of July 31, 2004 based on such evaluation; and
d. Disclosed in this report any change in Oil-Dri’s internal control over financial reporting that
occurred during Oil-Dri’s fourth fiscal quarter that has materially affected, or is reasonably likely to materially affect, Oil-Dri’s internal control over financial reporting; and
5. Oil-Dri’s other certifying officer and I have disclosed, based on our most recent evaluation of internal
control over financial reporting, to Oil-Dri’s auditors and the audit committee of Oil-Dri’s board of directors:
a. All significant deficiencies and material weaknesses in the design or operation of internal control
over financial reporting which are reasonably likely to adversely affect Oil-Dri’s ability to record, process, summarize and report financial information; and
b. Any fraud, whether or not material, that involves management or other employees who have a
significant role in Oil-Dri’s internal control over financial reporting.
Date: October 28, 2004 By:
/s/ Daniel S. Jaffee
Daniel S. Jaffee President and Chief Executive Officer

75
Exhibit 31: CERTIFICATIONS PURSUANT TO RULE 13a -14(a) UNDER THE SECURITIES EXCHANGE ACT OF 1934, AS AMENDED
I. I, Andrew N. Peterson, Chief Financial Officer of Oil-Dri Corporation of America, certify that: 1. I have reviewed this annual report on Form 10-K of Oil-Dri Corporation of America (“Oil-Dri”); 2. Based on my knowledge, this annual report does not contain any untrue statement of a material fact or omit
to state a material fact necessary to make the statements made, in light of the circumstances under which such statements were made, not misleading with respect to the period covered by this annual report;
3. Based on my knowledge, the financial statements, and other financial information included in this annual
report, fairly present in all material respects the financial condition, results of operations and cash flows of Oil-Dri as of, and for, the periods presented in this annual report;
4. Oil-Dri’s other certifying officer and I are responsible for establishing and maintaining disclosure controls
and procedures (as defined in Exchange Act Rules 13a-15(e) and 15d-15(e)) and internal control over financial reporting (as defined in Exchange Act Rules 13a-15(f) and 15d-15(f)) for Oil-Dri and we have:
a. Designed such disclosure controls and procedures, or caused such disclosure controls and procedures
to be designed under our supervision, to ensure that material information relating to Oil-Dri, including its consolidated subsidiaries, is made known to us by others within those entities, particularly during the period in which this report is being prepared;
b. Designed such internal control over financial reporting, or caused such internal control over financial
reporting to be designed under our supervision, to provide reasonable assurance regarding the reliability of financial reporting and the preparation of financial statements for external purposes in accordance with generally accepted accounting principles;
c. Evaluated the effectiveness of Oil-Dri’s disclosure controls and procedures and presented in this
report our conclusions about the effectiveness of the disclosure controls and procedures, as of July 31, 2004 based on such evaluation; and
d. Disclosed in this report any change in Oil-Dri’s internal control over financial reporting that
occurred during Oil-Dri’s fourth fiscal quarter that has materially affected, or is reasonably likely to materially affect, Oil-Dri’s internal control over financial reporting; and
5. Oil-Dri’s other certifying officer and I have disclosed, based on our most recent evaluation of internal
control over financial reporting, to Oil-Dri’s auditors and the audit committee of Oil-Dri’s board of directors:
a. All significant deficiencies and material weaknesses in the design or operation of internal control
over financial reporting which are reasonably likely to adversely affect Oil-Dri’s ability to record, process, summarize and report financial information; and
b. Any fraud, whether or not material, that involves management or other employees who have a
significant role in Oil-Dri’s internal control over financial reporting.
Date: October 28, 2004 By:
/s/ Andrew N. Peterson
Andrew N. Peterson Chief Financial Officer
76
Exhibit 99:
Certifications pursuant to 18 U.S.C. Section 1350 as adopted pursuant to
the Sarbanes-Oxley Act of 2002
Certification Pursuant to 18 U.S.C. Section 1350, the undersigned officer of Oil-Dri Corporation of America (the “Company”) hereby certifies that the Company’s Annual Report on Form 10-K for the year ended July 31, 2004 (the “Report”) fully complies with the requirements of Section 13(a) or 15(d), as applicable, of the Securities Exchange Act of 1934 and that the information contained in the Report fairly presents, in all material respects, the financial condition and results of operation of the Company. Dated: October 28, 2004 /s/ Daniel S. Jaffee ----------------------- Name: Daniel S. Jaffee Title: President and Chief Executive Officer A signed original of this written statement required by Section 906 has been provided to Oil-Dri Corporation of America and will be retained by Oil-Dri Corporation of America and furnished to the Securities and Exchange Commission or its staff upon request.
Certification Pursuant to 18 U.S.C. Section 1350, the undersigned officer of Oil-Dri Corporation of America (the “Company”) hereby certifies that the Company’s Annual Report on Form 10-K for the quarter ended July 31, 2004 (the “Report”) fully complies with the requirements of Section 13(a) or 15(d), as applicable, of the Securities Exchange Act of 1934 and that the information contained in the Report fairly presents, in all material respects, the financial condition and results of operation of the Company. Dated: October 28, 2004 /s/ Andrew N. Peterson ----------------------- Name: Andrew N. Peterson Title: Chief Financial Officer A signed original of this written statement required by Section 906 has been provided to Oil-Dri Corporation of America and will be retained by Oil-Dri Corporation of America and furnished to the Securities and Exchange Commission or its staff upon request.