Embed Size (px)
Citation preview

SYSCO CORP
FORM 10-K(Annual Report)
Filed 08/25/09 for the Period Ending 06/27/09
Address 1390 ENCLAVE PKWY
HOUSTON, TX 77077Telephone 2815841390
CIK 0000096021Symbol SYY
SIC Code 5140 - Groceries And Related ProductsIndustry Retail (Grocery)
Sector ServicesFiscal Year 07/28
http://www.edgar-online.com© Copyright 2013, EDGAR Online, Inc. All Rights Reserved.
Distribution and use of this document restricted under EDGAR Online, Inc. Terms of Use.

Table of Contents

Table of Contents
UNITED STATES SECURITIES AND EXCHANGE COMMISSION Washington, D.C. 20549
Form 10-K (Mark One)
For the fiscal year ended June 27, 2009
OR
Commission File Number 1-6544
Sysco Corporation (Exact name of registrant as specified in its charter)
Registrant’s Telephone Number, Including Area Code: (281) 584-1390
Securities Registered Pursuant to Section 12(b) of the Act:
Securities Registered Pursuant to Section 12(g) of the Act: None
Indicate by checkmark if the registrant is a well-known seasoned issuer, as defined in Rule 405 of the Securities Act. Yes � No �
Indicate by checkmark if the registrant is not required to file reports pursuant to Section 13 or Section 15(d) of the Act. Yes � No �
Indicate by check mark whether the registrant (1) has filed all reports required to be filed by Section 13 or 15(d) of the Securities Exchange Act of 1934 during the preceding 12 months (or for such shorter period that the registrant was required to file such reports), and (2) has been subject to such filing requirements for the past 90 days. Yes � No �
Indicate by check mark whether the registrant has submitted electronically and posted on its corporate Web site, if any, every Interactive Data File required to be submitted and posted pursuant to Rule 405 of Regulation S-T during the preceding 12 months (or for such shorter period that the registrant was required to submit and post such files). Yes � No �
Indicate by check mark if disclosure of delinquent filers pursuant to Item 405 of Regulation S-K is not contained herein, and will not be contained, to the best of registrant’s knowledge, in definitive proxy or information statements incorporated by reference in Part III of this Form 10-K or any amendment to this Form 10-K. �
Indicate by check mark whether the registrant is a large accelerated filer, an accelerated filer, a non-accelerated filer or a smaller reporting company. See definition of “large accelerated filer,” “accelerated filer” and “smaller reporting company” in Rule 12b-2 of the Exchange Act. (Check one):
� ANNUAL REPORT PURSUANT TO SECTION 13 OR 15(d) OF THE SECURITIES EXCHANGE ACT OF 1934
� TRANSITION REPORT PURSUANT TO SECTION 13 OR 15(d) OF THE SECURITIES EXCHANGE ACT OF 1934
Delaware 74-1648137
(State or other jurisdiction of incorporation or organization)
(IRS employer identification number)
1390 Enclave Parkway 77077-2099 Houston, Texas
(Address of principal executive offices) (Zip Code)
Name of each exchange on
Title of Each Class which registered Common Stock, $1.00 par value New York Stock Exchange

Indicate by check mark whether the registrant is a shell company (as defined in Rule 12b-2 of the Exchange Act). Yes � No �
The aggregate market value of the voting stock of the registrant held by stockholders who were not affiliates (as defined by regulations of the Securities and Exchange Commission) of the registrant was approximately $13,623,447,000 as of December 27, 2008 (based on the closing sales price on the New York Stock Exchange Composite Tape on December 26, 2008, as reported by The Wall Street Journal (Southwest Edition)). As of August 12, 2009, the registrant had issued and outstanding an aggregate of 591,015,830 shares of its common stock.
DOCUMENTS INCORPORATED BY REFERENCE:
Portions of the company’s 2009 Proxy Statement to be filed with the Securities and Exchange Commission no later than 120 days after the end of the fiscal year covered by this Form 10-K are incorporated by reference into Part III.
Large Accelerated Filer �
Accelerated Filer �
Non-accelerated Filer � (Do not check if a smaller reporting company)
Smaller Reporting Company �
TABLE OF CONTENTS
Page No.
PART I Item 1. Business 1 Item 1A. Risk Factors 5 Item 1B. Unresolved Staff Comments 8 Item 2. Properties 9 Item 3. Legal Proceedings 10 Item 4. Submission of Matters to a Vote of Security Holders 10
PART II Item 5. Market for Registrant’s Common Equity, Related Stockholder Matters and Issuer Repurchases of Equity Securities 10 Item 6. Selected Financial Data 13 Item 7. Management’s Discussion and Analysis of Financial Condition and Results of Operations 14 Item 7A. Quantitative and Qualitative Disclosures about Market Risk 34 Item 8. Financial Statements and Supplementary Data 37 Item 9. Changes in and Disagreements with Accountants on Accounting and Financial Disclosure 76 Item 9A. Controls and Procedures 76 Item 9B. Other Information 76
PART III Item 10. Directors and Executive Officers of the Registrant 76 Item 11. Executive Compensation 76 Item 12. Security Ownership of Certain Beneficial Owners and Management and Related Stockholder Matters 76 Item 13. Certain Relationships and Related Transactions 76 Item 14. Principal Accountant Fees and Services 76
PART IV Item 15. Exhibits 77 Signatures 82 EX-10.38 EX-10.44 EX-10.51 EX-10.60 EX-21.1 EX-23.1 EX-31.1 EX-32.1
Table of Contents
PART I
ITEM 1. Business
Unless this Form 10-K indicates otherwise or the context otherwise requires, the terms “we,” “our,” “us,” “Sysco,” or “the company” as used in this Form 10-K refer to Sysco Corporation together with its consolidated subsidiaries and divisions.
Overview
Sysco Corporation, acting through its subsidiaries and divisions, is the largest North American distributor of food and related products primarily to the foodservice or “food-away-from-home” industry. We provide products and related services to approximately 400,000 customers, including restaurants, healthcare and educational facilities, lodging establishments and other foodservice customers.
Founded in 1969, Sysco commenced operations as a public company in March 1970 when the stockholders of nine companies exchanged their stock for Sysco common stock. Since our formation, we have grown from $115 million to approximately $37 billion in annual sales, both through internal expansion of existing operations and through acquisitions.
Sysco Corporation is organized under the laws of Delaware. The address and telephone number of our executive offices are 1390 Enclave Parkway, Houston, Texas 77077-2099, (281) 584-1390. This annual report on Form 10-K, as well as all other reports filed or furnished by Sysco pursuant to Section 13(a) or 15(d) of the Securities Exchange Act of 1934, are available free of charge on Sysco’s website at www.sysco.com as soon as reasonably practicable after they are electronically filed with or furnished to the Securities and Exchange Commission.
Operating Segments
Sysco provides food and related products to the foodservice or “food-away-from-home” industry. Under the accounting provisions related to disclosures about segments of an enterprise, we have aggregated our operating companies into a number of segments, of which only Broadline and SYGMA are reportable segments as defined by accounting standards. Broadline operating companies distribute a full line of food products and a wide variety of non-food products to their customers. SYGMA operating companies distribute a full line of food products and a wide variety of non-food products to chain restaurant customer locations. “Other” financial information is attributable to our other segments, including our specialty produce, custom-cut meat and lodging industry products segments and a company that distributes to international customers. Specialty produce companies distribute fresh produce and, on a limited basis, other foodservice products. Specialty meat companies distribute custom-cut fresh steaks, other meat, seafood and poultry. Our lodging industry products company distributes personal care guest amenities, equipment, housekeeping supplies, room accessories and textiles to the lodging industry. Selected financial data for each of our reportable segments as well as financial information concerning geographic areas can be found in Note 20, Business Segment Information, in the Notes to Consolidated Financial Statements in Item 8.
Customers and Products
Sysco’s customers in the foodservice industry include restaurants, hospitals, schools, hotels and industrial caterers. Services to our customers are supported by similar physical facilities, vehicles, material handling equipment and techniques, and administrative and operating staffs.
The products we distribute include:
We also supply a wide variety of non-food items, including:
1
• a full line of frozen foods, such as meats, fully prepared entrees, fruits, vegetables and desserts;
• a full line of canned and dry foods;
• fresh meats;
• dairy products;
• beverage products;
• imported specialties; and
• fresh produce.
• paper products such as disposable napkins, plates and cups;
• tableware such as china and silverware;
• cookware such as pots, pans and utensils;
• restaurant and kitchen equipment and supplies; and
• cleaning supplies.
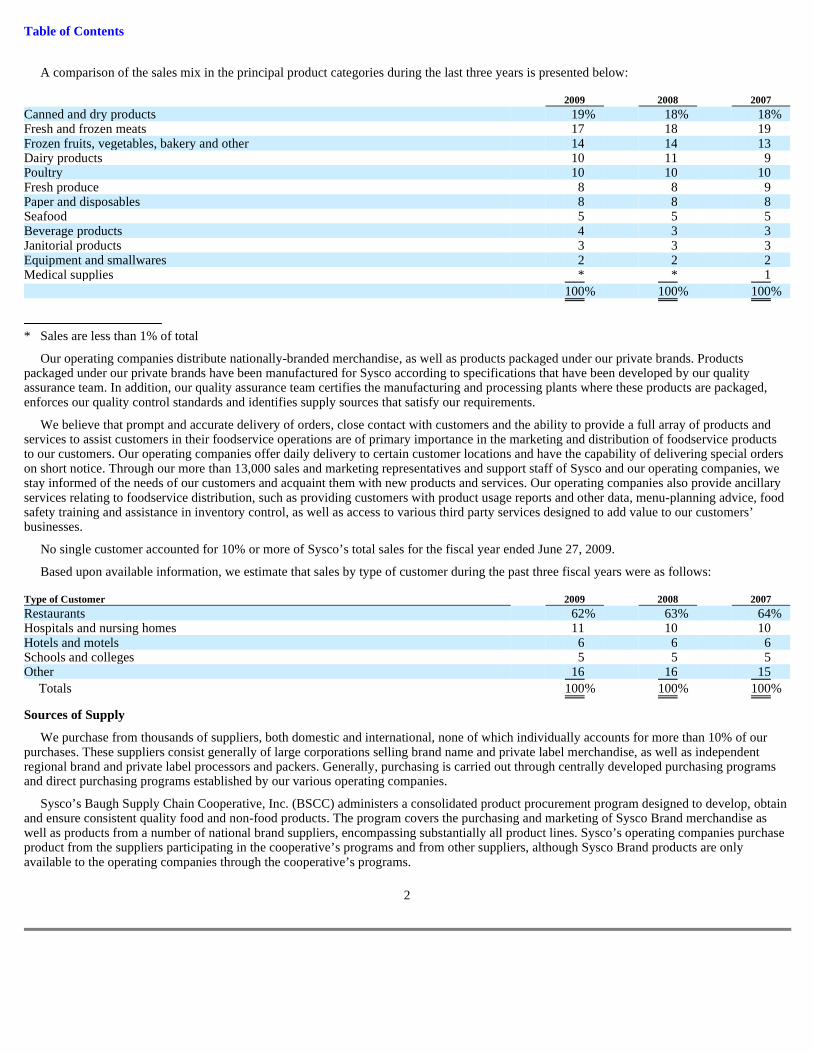
Table of Contents
A comparison of the sales mix in the principal product categories during the last three years is presented below:
* Sales are less than 1% of total
Our operating companies distribute nationally-branded merchandise, as well as products packaged under our private brands. Products packaged under our private brands have been manufactured for Sysco according to specifications that have been developed by our quality assurance team. In addition, our quality assurance team certifies the manufacturing and processing plants where these products are packaged, enforces our quality control standards and identifies supply sources that satisfy our requirements.
We believe that prompt and accurate delivery of orders, close contact with customers and the ability to provide a full array of products and services to assist customers in their foodservice operations are of primary importance in the marketing and distribution of foodservice products to our customers. Our operating companies offer daily delivery to certain customer locations and have the capability of delivering special orders on short notice. Through our more than 13,000 sales and marketing representatives and support staff of Sysco and our operating companies, we stay informed of the needs of our customers and acquaint them with new products and services. Our operating companies also provide ancillary services relating to foodservice distribution, such as providing customers with product usage reports and other data, menu-planning advice, food safety training and assistance in inventory control, as well as access to various third party services designed to add value to our customers’ businesses.
No single customer accounted for 10% or more of Sysco’s total sales for the fiscal year ended June 27, 2009.
Based upon available information, we estimate that sales by type of customer during the past three fiscal years were as follows:
Sources of Supply
We purchase from thousands of suppliers, both domestic and international, none of which individually accounts for more than 10% of our purchases. These suppliers consist generally of large corporations selling brand name and private label merchandise, as well as independent regional brand and private label processors and packers. Generally, purchasing is carried out through centrally developed purchasing programs and direct purchasing programs established by our various operating companies.
Sysco’s Baugh Supply Chain Cooperative, Inc. (BSCC) administers a consolidated product procurement program designed to develop, obtain and ensure consistent quality food and non-food products. The program covers the purchasing and marketing of Sysco Brand merchandise as well as products from a number of national brand suppliers, encompassing substantially all product lines. Sysco’s operating companies purchase product from the suppliers participating in the cooperative’s programs and from other suppliers, although Sysco Brand products are only available to the operating companies through the cooperative’s programs.
2
2009 2008 2007
Canned and dry products 19 % 18 % 18 % Fresh and frozen meats 17 18 19 Frozen fruits, vegetables, bakery and other 14 14 13 Dairy products 10 11 9 Poultry 10 10 10 Fresh produce 8 8 9 Paper and disposables 8 8 8 Seafood 5 5 5 Beverage products 4 3 3 Janitorial products 3 3 3 Equipment and smallwares 2 2 2 Medical supplies * * 1
100 % 100 % 100 %
Type of Customer 2009 2008 2007
Restaurants 62 % 63 % 64 % Hospitals and nursing homes 11 10 10 Hotels and motels 6 6 6 Schools and colleges 5 5 5 Other 16 16 15
Totals 100 % 100 % 100 %
Table of Contents
Sysco’s National Supply Chain group is focused on increasing profitability by lowering aggregate inventory levels, operating costs, and future facility expansion needs at our broadline operating companies while providing greater value to our suppliers and customers. One of the initiatives of this group is redistribution, which involves the construction and operation of regional distribution centers (RDCs), which aggregate inventory demand to optimize the supply chain activities for certain products for all Sysco broadline operating companies in the region. Currently, we have two RDCs in operation in Virginia and Florida, and we have purchased the land for a third RDC in Indiana.
Working Capital Practices
Our growth is funded through a combination of cash flow from operations, commercial paper issuances and long-term borrowings. See the discussion in Liquidity and Capital Resources under Management’s Discussion and Analysis of Financial Condition and Results of Operations at Item 7 regarding our liquidity, financial position and sources and uses of funds.
Credit terms we extend to our customers can vary from cash on delivery to 30 days or more based on our assessment of each customer’s credit worthiness. We monitor each customer’s account and will suspend shipments if necessary.
A majority of our sales orders are filled within 24 hours of when customer orders are placed. We generally maintain inventory on hand to be able to meet customer demand. The level of inventory on hand will vary by product depending on shelf-life, supplier order fulfillment lead times and customer demand. We also make purchases of additional volumes of certain products based on supply or pricing opportunities.
We take advantage of suppliers’ cash discounts where appropriate and otherwise generally receive payment terms from our suppliers ranging from weekly to 30 days or more.
Corporate Headquarters’ Services
Our corporate staff makes available a number of services to our operating companies. Members of the corporate staff possess experience and expertise in, among other areas, accounting and finance, treasury, cash management, information technology, employee benefits, engineering, risk management and insurance, sales and marketing, payroll, human resources, training and development, information technology and tax compliance services. The corporate office also makes available warehousing and distribution services, which provide assistance in operational best practices including space utilization, energy conservation, fleet management and work flow.
Capital Improvements
To maximize productivity and customer service, we continue to construct and modernize our distribution facilities. During fiscal 2009, 2008 and 2007, approximately $464,561,000, $515,963,000 and $603,242,000 respectively, were invested in facility expansions, fleet additions and other capital asset enhancements. We estimate our capital expenditures in fiscal 2010 should be in the range of $600,000,000 to $650,000,000. During the three years ended June 27, 2009, capital expenditures were financed primarily by internally generated funds, our commercial paper program and bank and other borrowings. We expect to finance our fiscal 2010 capital expenditures from the same sources.
Employees
As of June 27, 2009, we had approximately 47,000 full-time employees, approximately 18% of whom were represented by unions, primarily the International Brotherhood of Teamsters. Contract negotiations are handled by each individual operating company. Approximately 23% of our union employees are covered by collective bargaining agreements which have expired or will expire during fiscal 2010 and are subject to renegotiation. Since June 27, 2009, three contracts covering 440 of such employees have been renegotiated. We consider our labor relations to be satisfactory.
Competition
Sysco competes with numerous companies engaged in foodservice distribution. Our customers may also choose to purchase products directly from retail outlets. While we compete primarily with local and regional distributors, a few companies compete with us on a national basis. We believe that the principal competitive factors in the foodservice industry are effective customer contacts, the ability to deliver a wide range of quality products and related services on a timely and dependable basis and competitive prices. We consider our primary market to be the foodservice market in the United States and Canada and estimate that we serve about 17% of this approximately $215 billion annual market. We believe, based upon industry trade data, that our sales to the United States and Canada “food-away-from-home” industry were the highest of any foodservice distributor during fiscal 2009. While adequate industry statistics are not available, we believe that in most instances our local operations are among the leading distributors of food and related non-food products to foodservice customers in their respective trading areas. We believe our competitive advantages include our diversified product base, the diversity in the types of customers we serve, our
3

Table of Contents
economies of scale and our wide geographic presence in the United States and Canada, which allows us to minimize the impact of regional economic declines. We are the only publicly-traded distributor in the “food-away-from-home” industry in the United States. While our public company status provides us with some advantages, including access to capital, we believe it also provides us with some disadvantages that our competitors do not have in terms of additional costs related to complying with regulatory requirements.
Government Regulation
As a marketer and distributor of food products, we are subject to the U.S. Federal Food, Drug and Cosmetic Act and regulations promulgated thereunder by the U.S. Food and Drug Administration (FDA), as well as the Canadian Food and Drugs Act and the regulations thereunder.
The FDA regulates food safety through various statutory and regulatory mandates, including manufacturing and holding requirements for foods through good manufacturing practice regulations, hazard analysis and critical control point (HACCP) requirements for certain foods, and the food and color additive approval process. The agency also specifies the standards of identity for certain foods, prescribes the format and content of information required to appear on food product labels, and regulates food contact packaging and materials. For certain product lines, we are also subject to the Federal Meat Inspection Act, the Poultry Products Inspection Act, the Perishable Agricultural Commodities Act, the Packers and Stockyard Act and regulations promulgated by the U.S. Department of Agriculture (USDA) to interpret and implement these statutory provisions. The USDA imposes standards for product safety, quality and sanitation through the federal meat and poultry inspection program. The USDA reviews and approves the labeling of these products and also establishes standards for the grading and commercial acceptance of produce shipments from our suppliers. We are also subject to the Public Health Security and Bioterrorism Preparedness and Response Act of 2002, which imposes certain registration and record keeping requirements on facilities that manufacture, process, pack or hold food for human or animal consumption.
In Canada, the Canadian Food Inspection Agency administers and enforces the food safety and nutritional quality standards established by Health Canada under the Canadian Food and Drugs Act and under other related federal legislation, including the Canada Agricultural Products Act, the Meat Inspection Act, the Fish Inspection Act and the Consumer Packaging and Labeling Act (as it relates to food). These laws regulate the processing, storing, grading, packaging, marking, transporting and inspection of certain Sysco product lines as well as the packaging, labeling, sale, importation and advertising of pre-packaged and certain other products.
We and our products are also subject to state, provincial and local regulation through such measures as the licensing of our facilities; enforcement by state, provincial and local health agencies of state, provincial and local standards for our products; and regulation of our trade practices in connection with the sale of our products. Our facilities are subject to inspections and regulations issued pursuant to the U.S. Occupational Safety and Health Act by the U.S. Department of Labor, together with similar occupational health and safety laws in each Canadian province. These regulations require us to comply with certain manufacturing, health and safety standards to protect our employees from accidents and to establish hazard communication programs to transmit information on the hazards of certain chemicals present in products we distribute.
We are also subject to regulation by numerous U.S. and Canadian federal, state, provincial and local regulatory agencies, including, but not limited to, the U.S. Department of Labor and each Canadian provincial ministry of labour, which set employment practice standards for workers, and the U.S. Department of Transportation and the Canadian Transportation Agency, which regulate transportation of perishable and hazardous materials and waste, and similar state, provincial and local agencies.
Most of our distribution facilities have ammonia-based refrigeration systems and tanks for the storage of diesel fuel and other petroleum products which are subject to laws regulating such systems and storage tanks. Other U.S. and Canadian federal, state, provincial and local provisions relating to the protection of the environment or the discharge of materials do not materially impact the use or operation of our facilities.
Compliance with these laws has not had, and is not anticipated to have, a material effect on our capital expenditures, earnings or competitive position.
General
We have numerous trademarks which are of significant importance to the company. We believe that the loss of the Sysco(R) trademark would have a material adverse effect on our results of operations.
We are not engaged in material research and development activities relating to the development of new products or the improvement of existing products.
4
Table of Contents
Our sales do not generally fluctuate significantly on a seasonal basis; therefore, the business of the company is not deemed to be seasonal.
As of June 27, 2009, we operated 186 distribution facilities throughout the United States, Canada and Ireland.
Item 1A. Risk Factors
Deteriorating Economic Conditions and Heightened Uncertainty in the Financial Markets are Affecting Consumer Confidence, which is Currently Adversely Impacting our Business and We Expect These Conditions to Continue
The foodservice distribution industry is characterized by relatively high inventory turnover with relatively low profit margins and the foodservice industry is sensitive to national and regional economic conditions. The deteriorating economic conditions and heightened uncertainty in the financial markets continue to negatively affect consumer confidence and discretionary spending. This has led to reductions in the frequency of dining out and the amount spent by consumers for food prepared away from home. These conditions have, in turn, negatively impacted our sales, as noted by our declining sequential sales trend each quarter from a positive 8.5% in the first quarter of fiscal 2008 to a negative 6.6% in the fourth quarter of fiscal 2009, and have also negatively impacted our operating results for fiscal 2009. If these conditions do not improve, there will continue to be a negative impact on our operating results.
Increases in Fuel Costs and Inflation Affect our Costs and We May Not Be Able to Compensate for Increases in Such Costs
Volatile fuel prices and food costs have affected our industry during fiscal 2009. The cost of fuel affects the price paid by us for products as well as the costs incurred by us to deliver products to our customers. Although we have been able to pass along a portion of increased fuel costs to our customers, there is no guarantee that we can do so again if another period of high fuel costs occurs. In addition, prolonged periods of product cost inflation may have a negative impact on our profit margins and earnings to the extent that we are unable to pass on such product cost increases. Our estimate for the inflation in Sysco’s cost of goods was 4.7% in fiscal 2009, compared to 6.0% in fiscal 2008 and 3.4% in fiscal 2007. If fuel costs and product costs increase again in the future, we may experience difficulties in passing all or a portion of these costs along to our customers, which may have a negative impact on our business and our profitability.
Conditions Beyond our Control can Interrupt our Supplies and Increase our Product Costs
We obtain substantially all of our foodservice and related products from third party suppliers. For the most part, we do not have long-term contracts with our suppliers committing them to provide products to us. Although our purchasing volume can provide leverage when dealing with suppliers, suppliers may not provide the foodservice products and supplies needed by us in the quantities and at the prices requested. We are also subject to delays caused by interruption in production and increases in product costs based on conditions outside of our control. These conditions include work slowdowns, work interruptions, strikes or other job actions by employees of suppliers, weather, crop conditions, transportation interruptions, unavailability of fuel or increases in fuel costs, competitive demands and natural disasters or other catastrophic events (including, but not limited to food-borne illnesses). Our inability to obtain adequate supplies of foodservice and related products as a result of any of the foregoing factors or otherwise could mean that we could not fulfill our obligations to customers, and customers may turn to other distributors.
We Need Access to Borrowed Funds in Order to Grow and Any Default by Us Under our Indebtedness Could Have a Material Adverse Impact
Because a substantial part of our growth historically has been the result of acquisitions and capital expansion, our continued growth depends, in large part, on our ability to continue this expansion. As a result, our inability to finance acquisitions and capital expenditures through borrowed funds could restrict our ability to expand. Moreover, any default under the documents governing our indebtedness could have a significant adverse effect on our cash flows, as well as the market value of our common stock.
Product Liability Claims Could Materially Impact our Business
We, like any other seller of food, face the risk of exposure to product liability claims in the event that the use of products sold by Sysco causes injury or illness. With respect to product liability claims, we believe we have sufficient primary or excess umbrella liability insurance. However, this insurance may not continue to be available at a reasonable cost or, if available, may not be adequate to cover all of our liabilities. We generally seek contractual indemnification and insurance coverage from parties supplying our products, but this indemnification or insurance coverage is limited, as a practical matter, to the creditworthiness of the indemnifying party and the insured limits of any insurance provided by suppliers. If Sysco does not have adequate insurance or contractual indemnification available, product liability relating to defective products could materially reduce our net earnings and earnings per share.
5
Table of Contents
Adverse Publicity about us or Lack of Confidence in our Products Could Negatively Impact our Reputation and Reduce Earnings
Maintaining a good reputation and public confidence in the safety of the products we distribute is critical to our business, particularly to selling Sysco Brand products. Anything that damages that reputation or the public’s confidence in our products, whether or not justified, including adverse publicity about the quality, safety or integrity of our products, could quickly affect our revenues and profits. Reports, whether true or not, of food-borne illnesses, such as e-coli, avian flu, bovine spongiform encephalopathy, hepatitis A, trichinosis or salmonella, and injuries caused by food tampering could also severely injure our reputation or negatively impact the public’s confidence in our products. If patrons of our restaurant customers become ill from food-borne illnesses, our customers could be forced to temporarily close restaurant locations and our sales and profitability would be correspondingly decreased. In addition, instances of food-borne illnesses or food tampering or other health concerns, such as flu epidemics or other pandemics, even those unrelated to the use of Sysco products, or public concern regarding the safety of our products, can result in negative publicity about the food service distribution industry and cause our sales and profitability to decrease dramatically.
Failure to Successfully Renegotiate Union Contracts Could Result in Work Stoppages
As of June 27, 2009, approximately 8,400 employees at 54 operating companies were members of 57 different local unions associated with the International Brotherhood of Teamsters and other labor organizations. In fiscal 2010, 15 agreements covering approximately 1,900 employees have expired or will expire. Since June 27, 2009, three contracts covering 440 of the 1,900 employees have been renegotiated. Failure of our operating companies to effectively renegotiate these contracts could result in work stoppages. Although our operating subsidiaries have not experienced any significant labor disputes or work stoppages to date, and we believe they have satisfactory relationships with their unions, a work stoppage due to failure of multiple operating subsidiaries to renegotiate union contracts could have a material adverse effect on us.
A Shortage of Qualified Labor Could Negatively Impact our Business and Materially Reduce Earnings
Our operations rely heavily on our employees, particularly drivers, and any shortage of qualified labor could significantly affect our business. Our recruiting and retention efforts and efforts to increase productivity gains may not be successful and there may be a shortage of qualified drivers in future periods. Any such shortage would decrease Sysco’s ability to effectively serve our customers. Such a shortage would also likely lead to higher wages for employees and a corresponding reduction in our net earnings.
Our Funding Obligations with Respect to our Company-Sponsored Qualified Pension Plan may Increase Should Financial Markets Experience Further Declines
Our company-sponsored qualified pension plan (Retirement Plan) holds investments in both equity and fixed income securities. The amount of our annual contribution to the plan is dependent upon, among other things, the returns on the plan’s assets and discount rates used to calculate the plan’s liability. As a result of the decline in the financial markets in fiscal 2009, the value of the investments held by the Retirement Plan declined through June 27, 2009 as compared to June 28, 2008. These fluctuations in asset values have caused anticipated future contributions to the plan to increase, have caused pension expense for fiscal 2010 to increase and have resulted in a reduction in our shareholders’ equity as of June 27, 2009, which is when this plan’s funded status was last measured. Also, the projected liability of the plan will be impacted by the fluctuations of interest rates on high quality bonds in the public markets. Specifically, decreases in these interest rates may have an adverse impact on our results of operations. To the extent financial markets experience further declines, our future contributions, pension expense and funded status may be negatively affected for future years which could have an adverse impact on our liquidity and results of operations.
We may be Required to Pay Material Amounts Under Multi-Employer Defined Benefit Pension Plans
We contribute to several multi-employer defined benefit pension plans based on obligations arising under collective bargaining agreements covering union-represented employees. Approximately 12% of our current employees are participants in such multi-employer plans. In fiscal 2009, our total contributions to these plans, which include payments for voluntary withdrawals, were approximately $47,982,000.
We do not directly manage these multi-employer plans, which are generally managed by boards of trustees, half of whom are appointed by the unions and the other half by other contributing employers to the plan. Based upon the information available to us from plan administrators, we believe that several of these multi-employer plans are underfunded. In addition, the Pension Protection Act, enacted in August 2006, requires underfunded pension plans to improve their funding ratios within prescribed intervals based on the level of their underfunding. As a result, we expect our required contributions to these plans to increase in the future.
Under current law regarding multi-employer defined benefit plans, a plan’s termination, our voluntary withdrawal, or the mass withdrawal of all contributing employers from any underfunded multi-employer defined benefit plan would require us to
6
Table of Contents
make payments to the plan for our proportionate share of the multi-employer plan’s unfunded vested liabilities. Based on the information currently available from plan administrators, we estimate that our share of the aggregate withdrawal liability on most of the multi-employer plans we participate in, some of which appear to be underfunded, could be as much as $80,000,000 as of June 27, 2009 based on a voluntary withdrawal. Because the company is not provided with the information by plan administrators on a timely basis and the company expects that many multi-employer pension plans’ assets have declined due to recent financial market performance, we believe our share of the withdrawal liability could be greater. In addition, if a multi-employer defined benefit plan fails to satisfy certain minimum funding requirements, the Internal Revenue Service (IRS} may impose a nondeductible excise tax of 5% on the amount of the accumulated funding deficiency for those employers contributing to the fund. As of June 27, 2009, we had approximately $17,000,000 in liabilities recorded in total related to certain multi-employer defined benefit plans for which our voluntary withdrawal has already occurred, all of which are expected to be paid during fiscal 2010. Requirements to pay such increased contributions, withdrawal liability, and excise taxes could negatively impact our liquidity and results of operations.
Product Cost Deflation May Adversely Impact Future Operations
Our business may be adversely impacted by periods of prolonged product cost deflation. We make a significant portion of our sales at prices that are based on the cost of products we sell plus a percentage markup. As a result, our profit levels may be negatively impacted during periods of product cost deflation, even though our gross profit percentage may remain relatively constant.
We Must Finance and Integrate Acquired Businesses Effectively
Historically, a portion of our growth has come through acquisitions. If we are unable to integrate acquired businesses successfully or realize anticipated economic, operational and other benefits and synergies in a timely manner, our earnings per share may decrease. Integration of an acquired business may be more difficult when we acquire a business in a market in which we have limited expertise, or with a culture different from Sysco’s. A significant expansion of our business and operations, in terms of geography or magnitude, could strain our administrative and operational resources. Significant acquisitions may also require the issuance of material additional amounts of debt or equity, which could materially alter our debt to equity ratio, increase our interest expense and decrease earnings per share, and make it difficult for us to obtain favorable financing for other acquisitions or capital investments.
Expanding into International Markets Presents Unique Challenges, and our Expansion Efforts and International Operations may not be Successful
In addition to our domestic activities, an element of our strategy includes expansion of operations into new international markets. Our ability to successfully operate in international markets may be adversely affected by local laws and customs, legal and regulatory constraints, including compliance with the Foreign Corrupt Practices Act, political and economic conditions and currency regulations of the countries or regions in which we currently operate or intend to operate in the future. Risks inherent in our existing and future international operations also include, among others, the costs and difficulties of managing international operations, difficulties in identifying and gaining access to local suppliers, suffering possible adverse tax consequences, maintaining product quality and greater difficulty in enforcing intellectual property rights. Additionally, foreign currency exchange rates and fluctuations may have an impact on our future costs or on future sales and cash flows from our international operations.
Our Preferred Stock Provides Anti-Takeover Benefits that may not be Viewed as Beneficial to Stockholders
Under our Restated Certificate of Incorporation, Sysco’s Board of Directors is authorized to issue up to 1,500,000 shares of preferred stock without stockholder approval. Issuance of these shares could make it more difficult for anyone to acquire Sysco without approval of the Board of Directors, depending on the rights and preferences of the stock issued. In addition, if anyone attempts to acquire Sysco without approval of the Board of Directors of Sysco, the existence of this undesignated preferred stock could allow the Board of Directors to adopt a shareholder rights plan without obtaining stockholder approval, which could result in substantial dilution to a potential acquirer. As a result, hostile takeover attempts that might result in an acquisition of Sysco, that could otherwise have been financially beneficial to our stockholders, could be deterred.
Technology Dependence Could have a Material Negative Impact on our Business
Our ability to decrease costs and increase profits, as well as our ability to serve customers most effectively, depends on the reliability of our technology network. We use software and other technology systems, among other things, to generate and select orders, to load and route trucks and to monitor and manage our business on a day-to-day basis. Any disruption to these computer systems could adversely impact our customer service, decrease the volume of our business and result in increased costs. While Sysco has invested and continues to invest in technology security initiatives and disaster recovery plans, these measures cannot fully insulate us from technology disruption that could result in adverse effects on operations and profits.
7
Table of Contents
Our Design of an Enterprise-wide Software Integration Project may not be Implemented and in the Event of Implementation may Negatively Impact our Business, Results of Operations and Liquidity
We commenced the design of an enterprise-wide project to implement an integrated software system to support a majority of our business processes. These systems are commonly referred to as Enterprise Resource Planning (ERP) systems. When we have completed the design phase of this project, which we anticipate to occur by the end of calendar 2009, a decision will be made as to whether to build the system as designed and if so, the timing of implementation. ERP implementations are complex and time-consuming projects that involve substantial investments in system software and implementation activities over a multi-year timeframe. ERP implementations typically require transformation of business and financial processes in order to realize the benefits of the project. When the design phase is complete, if we reach a decision to discontinue the project, amounts invested will be written off which may negatively impact our results of operations at that time. If we reach a decision to continue with the project, our business and results of operations may be adversely affected if we experience operating problems and/or cost overages during the ERP implementation process. In addition, because the implementation is expected to involve a significant capital commitment, our business, results of operations and liquidity may be adversely affected if the ERP system, and the associated process changes, do not result in the benefits that we anticipate.
Item 1B. Unresolved Staff Comments
None.
8
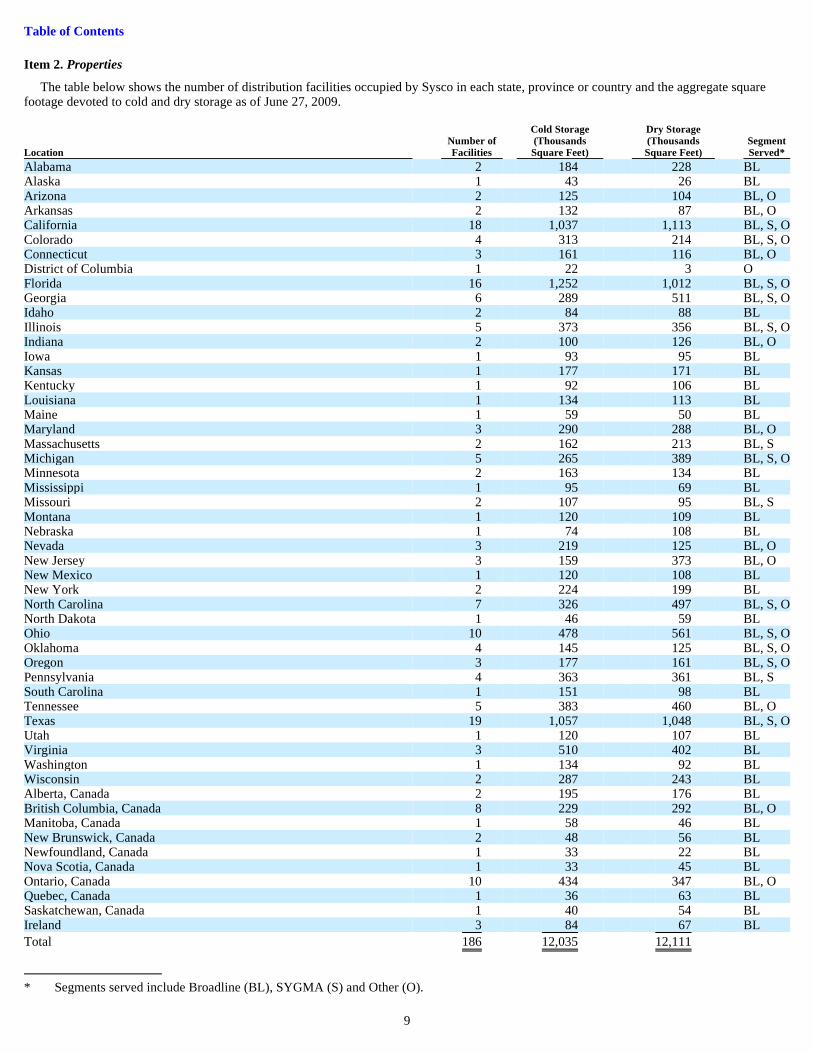
Table of Contents
Item 2. Properties
The table below shows the number of distribution facilities occupied by Sysco in each state, province or country and the aggregate square footage devoted to cold and dry storage as of June 27, 2009.
9
Cold Storage Dry Storage Number of (Thousands (Thousands Segment Location Facilities Square Feet) Square Feet) Served*
Alabama 2 184 228 BL Alaska 1 43 26 BL Arizona 2 125 104 BL, O Arkansas 2 132 87 BL, O California 18 1,037 1,113 BL, S, O Colorado 4 313 214 BL, S, O Connecticut 3 161 116 BL, O District of Columbia 1 22 3 O Florida 16 1,252 1,012 BL, S, O Georgia 6 289 511 BL, S, O Idaho 2 84 88 BL Illinois 5 373 356 BL, S, O Indiana 2 100 126 BL, O Iowa 1 93 95 BL Kansas 1 177 171 BL Kentucky 1 92 106 BL Louisiana 1 134 113 BL Maine 1 59 50 BL Maryland 3 290 288 BL, O Massachusetts 2 162 213 BL, S Michigan 5 265 389 BL, S, O Minnesota 2 163 134 BL Mississippi 1 95 69 BL Missouri 2 107 95 BL, S Montana 1 120 109 BL Nebraska 1 74 108 BL Nevada 3 219 125 BL, O New Jersey 3 159 373 BL, O New Mexico 1 120 108 BL New York 2 224 199 BL North Carolina 7 326 497 BL, S, O North Dakota 1 46 59 BL Ohio 10 478 561 BL, S, O Oklahoma 4 145 125 BL, S, O Oregon 3 177 161 BL, S, O Pennsylvania 4 363 361 BL, S South Carolina 1 151 98 BL Tennessee 5 383 460 BL, O Texas 19 1,057 1,048 BL, S, O Utah 1 120 107 BL Virginia 3 510 402 BL Washington 1 134 92 BL Wisconsin 2 287 243 BL Alberta, Canada 2 195 176 BL British Columbia, Canada 8 229 292 BL, O Manitoba, Canada 1 58 46 BL New Brunswick, Canada 2 48 56 BL Newfoundland, Canada 1 33 22 BL Nova Scotia, Canada 1 33 45 BL Ontario, Canada 10 434 347 BL, O Quebec, Canada 1 36 63 BL Saskatchewan, Canada 1 40 54 BL Ireland 3 84 67 BL
Total 186 12,035 12,111
* Segments served include Broadline (BL), SYGMA (S) and Other (O).

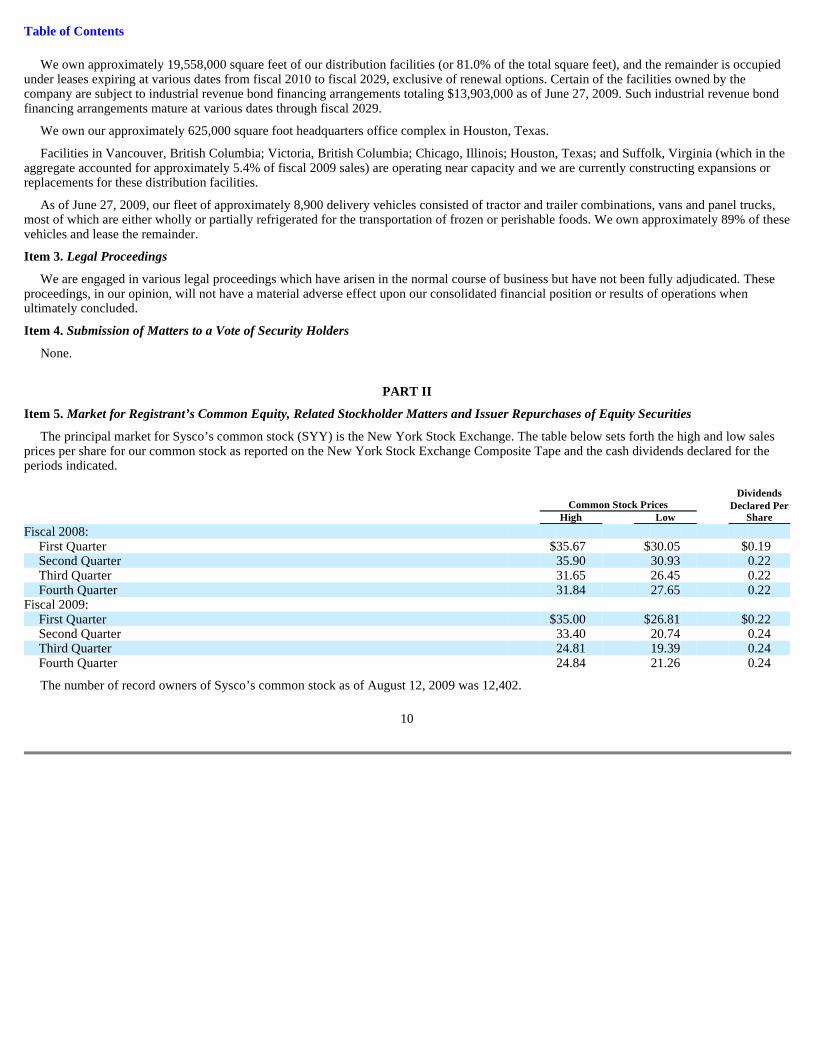
Table of Contents
We own approximately 19,558,000 square feet of our distribution facilities (or 81.0% of the total square feet), and the remainder is occupied under leases expiring at various dates from fiscal 2010 to fiscal 2029, exclusive of renewal options. Certain of the facilities owned by the company are subject to industrial revenue bond financing arrangements totaling $13,903,000 as of June 27, 2009. Such industrial revenue bond financing arrangements mature at various dates through fiscal 2029.
We own our approximately 625,000 square foot headquarters office complex in Houston, Texas.
Facilities in Vancouver, British Columbia; Victoria, British Columbia; Chicago, Illinois; Houston, Texas; and Suffolk, Virginia (which in the aggregate accounted for approximately 5.4% of fiscal 2009 sales) are operating near capacity and we are currently constructing expansions or replacements for these distribution facilities.
As of June 27, 2009, our fleet of approximately 8,900 delivery vehicles consisted of tractor and trailer combinations, vans and panel trucks, most of which are either wholly or partially refrigerated for the transportation of frozen or perishable foods. We own approximately 89% of these vehicles and lease the remainder.
Item 3. Legal Proceedings
We are engaged in various legal proceedings which have arisen in the normal course of business but have not been fully adjudicated. These proceedings, in our opinion, will not have a material adverse effect upon our consolidated financial position or results of operations when ultimately concluded.
Item 4. Submission of Matters to a Vote of Security Holders
None.
PART II
Item 5. Market for Registrant’s Common Equity, Related Stockholder Matters and Issuer Repurchases of Equity Securities
The principal market for Sysco’s common stock (SYY) is the New York Stock Exchange. The table below sets forth the high and low sales prices per share for our common stock as reported on the New York Stock Exchange Composite Tape and the cash dividends declared for the periods indicated.
The number of record owners of Sysco’s common stock as of August 12, 2009 was 12,402.
10
Dividends Common Stock Prices Declared Per High Low Share
Fiscal 2008: First Quarter $ 35.67 $ 30.05 $ 0.19 Second Quarter 35.90 30.93 0.22 Third Quarter 31.65 26.45 0.22 Fourth Quarter 31.84 27.65 0.22
Fiscal 2009: First Quarter $ 35.00 $ 26.81 $ 0.22 Second Quarter 33.40 20.74 0.24 Third Quarter 24.81 19.39 0.24 Fourth Quarter 24.84 21.26 0.24

Table of Contents
We made the following share repurchases during the fourth quarter of fiscal 2009:
ISSUER PURCHASES OF EQUITY SECURITIES
On September 22, 2008, we announced that the Board of Directors approved the repurchase of 20,000,000 shares. Pursuant to the repurchase program, shares may be acquired in the open market or in privately negotiated transactions at the company’s discretion, subject to market conditions and other factors.
In July 2004, the Board of Directors authorized us to enter into agreements from time to time to extend our ongoing repurchase program to include repurchases during company announced “blackout periods” of such securities in compliance with Rule 10b5-1 promulgated under the Exchange Act.
Stock Performance Graph
The following performance graph and related information shall not be deemed “soliciting material” or to be “filed” with the Securities and Exchange Commission, nor shall such information be incorporated by reference into any future filing under the Securities Act of 1933 or the Securities Exchange Act of 1934, each as amended, except to the extent that Sysco specifically incorporates such information by reference into such filing.
The following stock performance graph compares the performance of Sysco’s Common Stock to the S&P 500 Index and to the S&P 500 Food/Staple Retail Index for Sysco’s last five fiscal years.
The graph assumes that the value of the investment in our Common Stock, the S&P 500 Index, and the S&P 500 Food/Staple Index was $100 on the last trading day of fiscal 2004, and that all dividends were reinvested. Performance data for Sysco, the S&P 500 Index and the S&P 500 Food/Staple Retail Index is provided as of the last trading day of each of our last five fiscal years.
11
(c) Total Number of (d) Maximum Number Shares Purchased as of Shares that May Part of Publicly Yet Be Purchased (a) Total Number of (b) Average Price Announced Plans or Under the Plans or
Period Shares Purchased (1) Paid per Share Programs Programs Month #1 March 29 – April 25 — $ — — 9,386,600 Month #2 April 26 – May 23 3,079 22.82 — 9,386,600 Month #3 May 24 – June 27 3,116 23.76 — 9,386,600
Total 6,195 $ 23.29 — 9,386,600
(1) All shares purchased were shares tendered by individuals in connection with stock option exercises. There were no shares purchased as part of our publicly announced program during the fourth quarter of fiscal 2009.

Table of Contents
Comparison of 5 Year Cumulative Total Return Assumes Initial Investment of $100
June 2009
12
7/3/04 7/2/05 7/1/06 6/30/07 6/28/08 6/27/09 Sysco Corporation $ 100 $ 106 $ 91 $ 100 $ 88 $ 74 S&P 500 100 108 117 141 122 90 S&P 500 Food/Staple Retail Index 100 103 105 112 117 96

Table of Contents
Item 6. Selected Financial Data
13
Fiscal Year 2009 2008 2007 2006 (1) 2005 (In thousands except for share data) Sales $ 36,853,330 $ 37,522,111 $ 35,042,075 $ 32,628,438 $ 30,281,914 Earnings before income taxes 1,770,834 1,791,338 1,621,215 1,394,946 1,525,436 Income taxes 714,886 685,187 620,139 548,906 563,979
Earnings before cumulative effect of accounting change 1,055,948 1,106,151 1,001,076 846,040 961,457
Cumulative effect of accounting change — — — 9,285 —
Net earnings 1,055,948 1,106,151 1,001,076 855,325 961,457
Earnings before cumulative effect of accounting change: Basic earnings per share $ 1.77 $ 1.83 $ 1.62 $ 1.36 $ 1.51 Diluted earnings per share 1.77 1.81 1.60 1.35 1.47
Net earnings: Basic earnings per share $ 1.77 $ 1.83 $ 1.62 $ 1.38 $ 1.51 Diluted earnings per share 1.77 1.81 1.60 1.36 1.47
Dividends declared per share 0.94 0.85 0.74 0.66 0.58 Total assets $ 10,216,619 $ 10,082,293 $ 9,518,931 $ 8,992,025 $ 8,267,902 Capital expenditures 464,561 515,963 603,242 513,934 390,026 Current maturities of long-term debt $ 9,163 $ 4,896 $ 3,568 $ 106,265 $ 410,933 Long-term debt 2,467,486 1,975,435 1,758,227 1,627,127 956,177
Total long-term debt 2,476,649 1,980,331 1,761,795 1,733,392 1,367,110 Shareholders’ equity 3,449,702 3,408,986 3,278,400 3,052,284 2,758,839
Total capitalization $ 5,926,351 $ 5,389,317 $ 5,040,195 $ 4,785,676 $ 4,125,949
Ratio of long-term debt to capitalization 41.8 % 36.8 % 35.0 % 36.2 % 33.1 %
Our financial results are impacted by accounting changes and the adoption of various accounting standards. See “Accounting Changes” in Item 7 for further discussion.
(1) We adopted the fair value recognition provisions in current stock compensation accounting standards effective at the beginning of fiscal 2006. As a result, the results of operations for fiscal 2005 do not include incremental share-based compensation cost, as that year was covered by previous accounting standards.
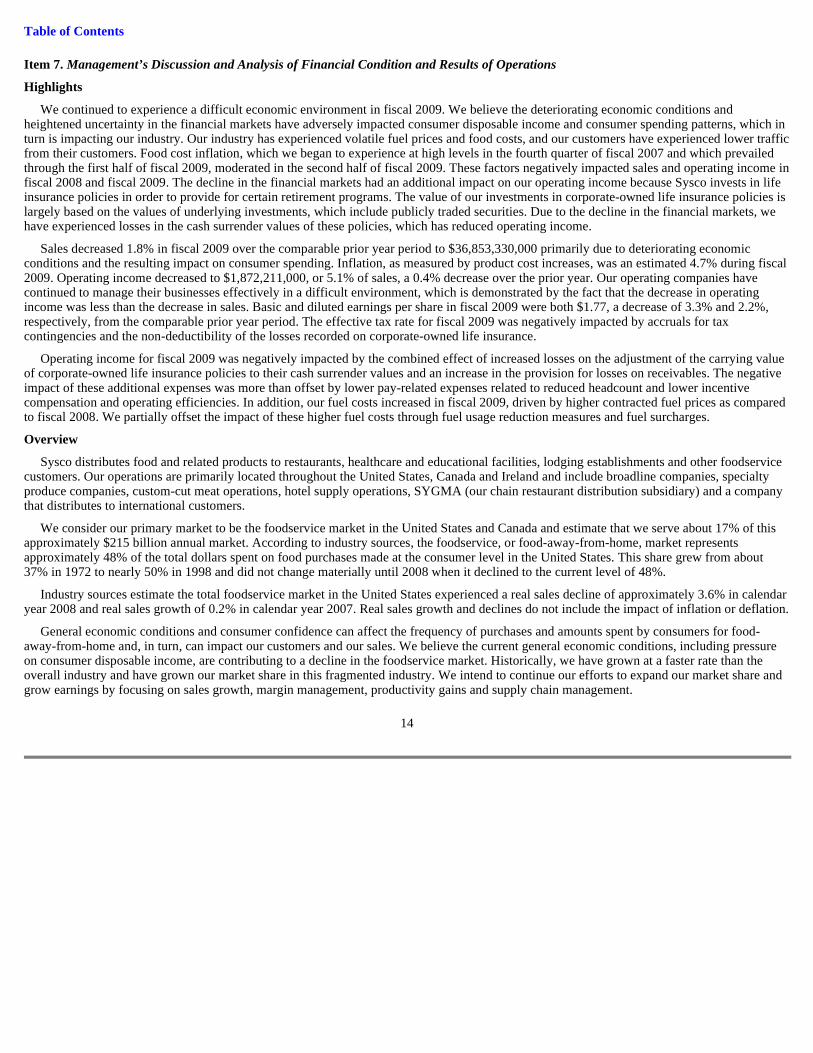
Table of Contents
Item 7. Management’s Discussion and Analysis of Financial Condition and Results of Operations
Highlights
We continued to experience a difficult economic environment in fiscal 2009. We believe the deteriorating economic conditions and heightened uncertainty in the financial markets have adversely impacted consumer disposable income and consumer spending patterns, which in turn is impacting our industry. Our industry has experienced volatile fuel prices and food costs, and our customers have experienced lower traffic from their customers. Food cost inflation, which we began to experience at high levels in the fourth quarter of fiscal 2007 and which prevailed through the first half of fiscal 2009, moderated in the second half of fiscal 2009. These factors negatively impacted sales and operating income in fiscal 2008 and fiscal 2009. The decline in the financial markets had an additional impact on our operating income because Sysco invests in life insurance policies in order to provide for certain retirement programs. The value of our investments in corporate-owned life insurance policies is largely based on the values of underlying investments, which include publicly traded securities. Due to the decline in the financial markets, we have experienced losses in the cash surrender values of these policies, which has reduced operating income.
Sales decreased 1.8% in fiscal 2009 over the comparable prior year period to $36,853,330,000 primarily due to deteriorating economic conditions and the resulting impact on consumer spending. Inflation, as measured by product cost increases, was an estimated 4.7% during fiscal 2009. Operating income decreased to $1,872,211,000, or 5.1% of sales, a 0.4% decrease over the prior year. Our operating companies have continued to manage their businesses effectively in a difficult environment, which is demonstrated by the fact that the decrease in operating income was less than the decrease in sales. Basic and diluted earnings per share in fiscal 2009 were both $1.77, a decrease of 3.3% and 2.2%, respectively, from the comparable prior year period. The effective tax rate for fiscal 2009 was negatively impacted by accruals for tax contingencies and the non-deductibility of the losses recorded on corporate-owned life insurance.
Operating income for fiscal 2009 was negatively impacted by the combined effect of increased losses on the adjustment of the carrying value of corporate-owned life insurance policies to their cash surrender values and an increase in the provision for losses on receivables. The negative impact of these additional expenses was more than offset by lower pay-related expenses related to reduced headcount and lower incentive compensation and operating efficiencies. In addition, our fuel costs increased in fiscal 2009, driven by higher contracted fuel prices as compared to fiscal 2008. We partially offset the impact of these higher fuel costs through fuel usage reduction measures and fuel surcharges.
Overview
Sysco distributes food and related products to restaurants, healthcare and educational facilities, lodging establishments and other foodservice customers. Our operations are primarily located throughout the United States, Canada and Ireland and include broadline companies, specialty produce companies, custom-cut meat operations, hotel supply operations, SYGMA (our chain restaurant distribution subsidiary) and a company that distributes to international customers.
We consider our primary market to be the foodservice market in the United States and Canada and estimate that we serve about 17% of this approximately $215 billion annual market. According to industry sources, the foodservice, or food-away-from-home, market represents approximately 48% of the total dollars spent on food purchases made at the consumer level in the United States. This share grew from about 37% in 1972 to nearly 50% in 1998 and did not change materially until 2008 when it declined to the current level of 48%.
Industry sources estimate the total foodservice market in the United States experienced a real sales decline of approximately 3.6% in calendar year 2008 and real sales growth of 0.2% in calendar year 2007. Real sales growth and declines do not include the impact of inflation or deflation.
General economic conditions and consumer confidence can affect the frequency of purchases and amounts spent by consumers for food-away-from-home and, in turn, can impact our customers and our sales. We believe the current general economic conditions, including pressure on consumer disposable income, are contributing to a decline in the foodservice market. Historically, we have grown at a faster rate than the overall industry and have grown our market share in this fragmented industry. We intend to continue our efforts to expand our market share and grow earnings by focusing on sales growth, margin management, productivity gains and supply chain management.
14

Table of Contents
Strategy
We intend to continue to expand our market share and grow earnings through strategies which include:
We will continue to use our strategies to leverage our market leadership position to continuously improve how we buy, handle and market products for our customers. Our primary focus is on growing and optimizing the core foodservice distribution business in North America; however, we will continue to explore and identify opportunities to grow our global capabilities in other markets. As a part of our ongoing strategic analysis, we regularly evaluate business opportunities, including potential acquisitions and sales of assets and businesses.
Results of Operations
The following table sets forth the components of our consolidated results of operations expressed as a percentage of sales for the periods indicated:
15
• Sales growth: We intend to grow sales by gaining an increased share of products purchased by existing customers, development of new customers, the use of foldouts (new operating companies created in established markets previously served by other Sysco operating companies), investment in new technologies and a disciplined acquisition program. Our business review program, which is designed to help our customers grow their business, and the size and expertise of our sales force are key factors in maintaining and growing sales.
• Lowering Procurement Costs: We intend to lower our cost of goods sold by leveraging Sysco’s purchasing power and procurement expertise and capitalizing on an end-to-end view of our supply chain. Our National Supply Chain initiative is focused on lowering inventory, inbound freight, product costs, operating costs, working capital requirements and future facility expansion needs at our operating companies while providing greater value to our suppliers and customers. A component of our National Supply Chain initiative is the use of redistribution centers (RDCs) which aggregate inventory demand to optimize the supply chain activities for certain products for all Sysco broadline operating companies in a geographic region. We currently have two RDCs located in Virginia and Florida and have purchased the land for a third RDC in Indiana.
• Productivity Gains: We intend to optimize warehouse and delivery activities across the corporation and manage energy consumption to achieve a more efficient delivery of products to our customers.
• Enhanced Technology Platform: During fiscal 2009, we commenced the design of an enterprise-wide project to implement an integrated software system to support the majority of our business processes. The goal of the project is to create a new technology platform that simplifies and standardizes our business model, which we believe will improve the efficiency and effectiveness of our operations.
2009 2008 2007
Sales 100.0 % 100.0 % 100.0 % Cost of sales 80.9 80.8 80.7
Gross margin 19.1 19.2 19.3 Operating expenses 14.0 14.2 14.4
Operating income 5.1 5.0 4.9 Interest expense 0.3 0.3 0.3 Other income, net (0.0 ) (0.1 ) (0.0 )
Earnings before income taxes 4.8 4.8 4.6 Income taxes 1.9 1.8 1.7
Net earnings 2.9 % 3.0 % 2.9 %
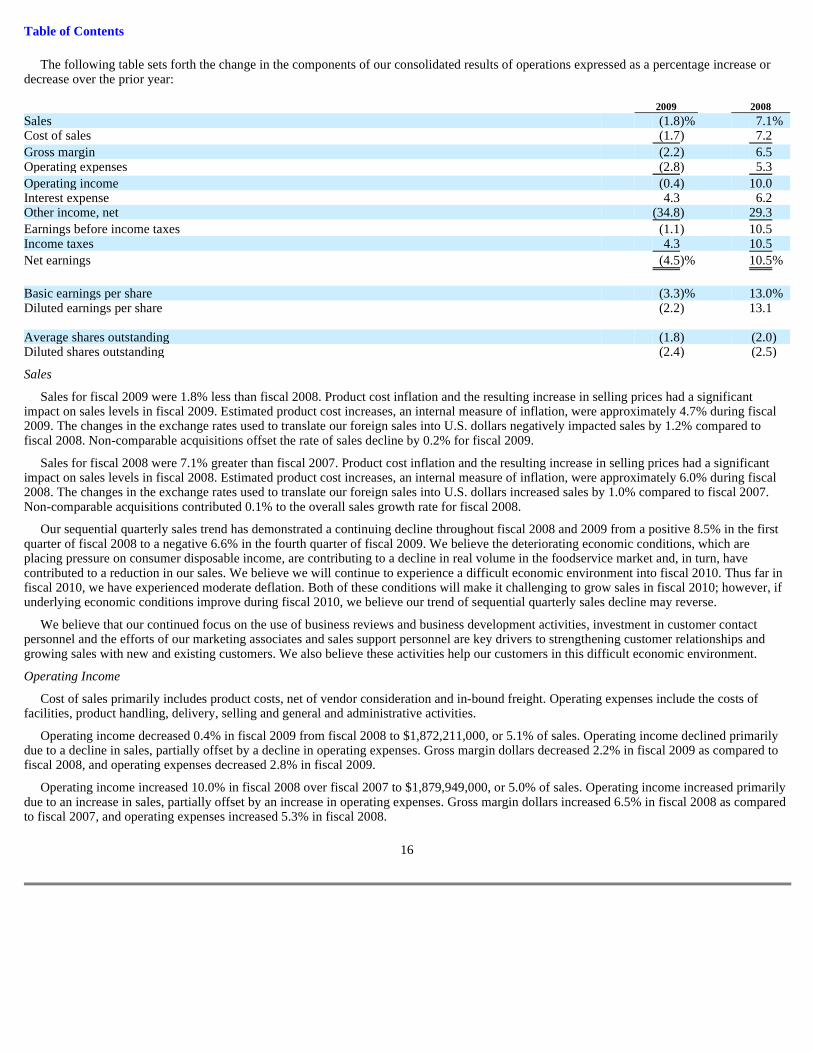
Table of Contents
The following table sets forth the change in the components of our consolidated results of operations expressed as a percentage increase or decrease over the prior year:
Sales
Sales for fiscal 2009 were 1.8% less than fiscal 2008. Product cost inflation and the resulting increase in selling prices had a significant impact on sales levels in fiscal 2009. Estimated product cost increases, an internal measure of inflation, were approximately 4.7% during fiscal 2009. The changes in the exchange rates used to translate our foreign sales into U.S. dollars negatively impacted sales by 1.2% compared to fiscal 2008. Non-comparable acquisitions offset the rate of sales decline by 0.2% for fiscal 2009.
Sales for fiscal 2008 were 7.1% greater than fiscal 2007. Product cost inflation and the resulting increase in selling prices had a significant impact on sales levels in fiscal 2008. Estimated product cost increases, an internal measure of inflation, were approximately 6.0% during fiscal 2008. The changes in the exchange rates used to translate our foreign sales into U.S. dollars increased sales by 1.0% compared to fiscal 2007. Non-comparable acquisitions contributed 0.1% to the overall sales growth rate for fiscal 2008.
Our sequential quarterly sales trend has demonstrated a continuing decline throughout fiscal 2008 and 2009 from a positive 8.5% in the first quarter of fiscal 2008 to a negative 6.6% in the fourth quarter of fiscal 2009. We believe the deteriorating economic conditions, which are placing pressure on consumer disposable income, are contributing to a decline in real volume in the foodservice market and, in turn, have contributed to a reduction in our sales. We believe we will continue to experience a difficult economic environment into fiscal 2010. Thus far in fiscal 2010, we have experienced moderate deflation. Both of these conditions will make it challenging to grow sales in fiscal 2010; however, if underlying economic conditions improve during fiscal 2010, we believe our trend of sequential quarterly sales decline may reverse.
We believe that our continued focus on the use of business reviews and business development activities, investment in customer contact personnel and the efforts of our marketing associates and sales support personnel are key drivers to strengthening customer relationships and growing sales with new and existing customers. We also believe these activities help our customers in this difficult economic environment.
Operating Income
Cost of sales primarily includes product costs, net of vendor consideration and in-bound freight. Operating expenses include the costs of facilities, product handling, delivery, selling and general and administrative activities.
Operating income decreased 0.4% in fiscal 2009 from fiscal 2008 to $1,872,211,000, or 5.1% of sales. Operating income declined primarily due to a decline in sales, partially offset by a decline in operating expenses. Gross margin dollars decreased 2.2% in fiscal 2009 as compared to fiscal 2008, and operating expenses decreased 2.8% in fiscal 2009.
Operating income increased 10.0% in fiscal 2008 over fiscal 2007 to $1,879,949,000, or 5.0% of sales. Operating income increased primarily due to an increase in sales, partially offset by an increase in operating expenses. Gross margin dollars increased 6.5% in fiscal 2008 as compared to fiscal 2007, and operating expenses increased 5.3% in fiscal 2008.
16
2009 2008
Sales (1.8 )% 7.1 % Cost of sales (1.7 ) 7.2
Gross margin (2.2 ) 6.5 Operating expenses (2.8 ) 5.3
Operating income (0.4 ) 10.0 Interest expense 4.3 6.2 Other income, net (34.8 ) 29.3
Earnings before income taxes (1.1 ) 10.5 Income taxes 4.3 10.5
Net earnings (4.5 )% 10.5 %
Basic earnings per share (3.3 )% 13.0 % Diluted earnings per share (2.2 ) 13.1 Average shares outstanding (1.8 ) (2.0 ) Diluted shares outstanding (2.4 ) (2.5 )

Table of Contents
Beginning in the fourth quarter of fiscal 2007, Sysco began experiencing high levels of product cost increases in numerous product categories. These increases persisted throughout fiscal 2008 at levels approximating 6.0% and rose even higher to 7.6% in the first 26 weeks of fiscal 2009. The level of product cost increases began moderating during the third quarter of fiscal 2009 and was 0.5% in the fourth quarter of fiscal 2009. Generally, Sysco attempts to pass increased costs to its customers; however, because of contractual and competitive reasons, we are not able to pass along all of the product cost increases immediately. Prolonged periods of high inflation, such as those we have recently experienced, have a negative impact on our customers, as high food costs and fuel costs can reduce consumer spending in the food-prepared-away-from home market. As a result, these factors may negatively impact our sales, gross margins and earnings. We may also be negatively impacted by periods of prolonged product cost deflation because we make a significant portion of our sales at prices that are based on the cost of products we sell plus a percentage markup. As a result, our profit levels may be negatively impacted during periods of product cost deflation, even though our gross profit percentage may remain relatively constant.
We believe the operating expense performance for fiscal 2009 compared to fiscal 2008 was aided by operating efficiencies and lower payroll expense related to reduced headcount and lower incentive compensation. The positive impact of these expense reductions was partially offset by the combined effect of increased losses on the adjustment of the carrying value of corporate-owned life insurance policies to their cash surrender values and an increase in the provision for losses on receivables. In addition, our fuel costs increased during fiscal 2009 compared to fiscal 2008.
Operating expenses in fiscal 2008 compared to fiscal 2007 were negatively impacted by the combined impact of losses on the adjustment of the carrying value of corporate-owned life insurance policies to their cash surrender values and increased provisions related to multi-employer pension plans. The negative impact of these expense increases was partially offset by lower share-based compensation expense and lower company-sponsored pension expenses. In addition, our fuel costs increased during fiscal 2008 compared to fiscal 2007. We increased our use of fuel surcharges to offset a portion of these increased costs, thereby partially reducing the impact to operating income.
We adjust the carrying values of our corporate-owned life insurance policies to their cash surrender values on an ongoing basis. The cash surrender values of these policies are largely based on the values of underlying investments, which include publicly traded securities. As a result, the cash surrender values of these policies will fluctuate with changes in the market value of such securities. The performance in the financial markets resulted in losses for these policies of $43,812,000 in fiscal 2009, losses of $8,718,000 in fiscal 2008 and gains of $23,922,000 in fiscal 2007. The performance of the financial markets will continue to influence the cash surrender values of our corporate-owned life insurance policies, which could cause volatility in operating income, net earnings and earnings per share.
The provision for losses on receivables included within operating expenses increased by $42,454,000 in fiscal 2009 over fiscal 2008. The current economic conditions and related decrease in consumer demand combined with tightening credit markets have impacted the liquidity of some of our customers, resulting in an increase in delinquent payments on accounts receivable. Customer accounts written off, net of recoveries, were $71,877,000, or 0.20% of sales, $32,367,000, or 0.09% of sales, and $26,010,000 or 0.07% of sales, for fiscal 2009, 2008 and 2007, respectively. The increase in our provision for losses on receivables is related to customer accounts across our customer base without concentration in any specific location. We continue to monitor our customer account balances and our credit policies and believe continued strong credit practices will be necessary to avoid significant increases in our provision for losses on receivables. However, if the difficult economic environment persists, we expect to continue to experience higher levels of provision for losses on receivables and higher levels of write-offs, such as those experienced in fiscal 2009, in fiscal 2010.
Pay-related expenses decreased by $192,086,000 in fiscal 2009 from fiscal 2008. The reduction was due to a combination of reduced headcount and lower incentive compensation. Headcount declines occurred due to both productivity improvements and workforce reductions commensurate with lower sales. The criteria for paying annual bonuses to our corporate officers and certain portions of operating company management bonuses are tied to overall company performance. The overall company performance criteria for payment of such bonuses for fiscal 2009 were not met; therefore corporate executive officers will not receive bonuses for fiscal 2009 and operating company management bonuses are at lower levels for fiscal 2009 as compared to fiscal 2008.
Sysco’s fuel costs increased by $33,154,000 in fiscal 2009 over fiscal 2008 primarily due to increased contracted diesel prices. Our fuel costs increased by $34,023,000 in fiscal 2008 over fiscal 2007 due to increased market diesel prices. Sysco’s costs per gallon increased 18.6% in fiscal 2009 over fiscal 2008 and 18.7% in fiscal 2008 over fiscal 2007. Sysco’s activities to manage increased fuel costs include reducing miles driven by our trucks through improved routing techniques, improving fleet utilization by adjusting idling time and maximum speeds and using fuel surcharges. Fuel surcharges were approximately $5,000,000 higher in fiscal 2009 over fiscal 2008 and $27,000,000 higher in fiscal 2008 than in fiscal 2007. Usage of these surcharges was greater in the second half of fiscal 2008 and first half of fiscal 2009, due to sustained, increased market diesel prices during that period. Fuel surcharges are reflected within sales and gross margins.
17
Table of Contents
We periodically enter into forward purchase commitments for a portion of our projected monthly diesel fuel requirements. In fiscal 2009, the forward purchase commitments resulted in an estimated $68,000,000 of additional fuel costs as the fixed price contracts were higher than market prices for the contracted volumes. In fiscal 2008, the forward purchase commitments resulted in an estimated $21,000,000 of avoided fuel costs as the fixed price contracts were generally lower than market prices for the contracted volumes. In fiscal 2007, the forward purchase commitments resulted in prices that were comparable to market prices.
As of June 27, 2009, we had forward diesel fuel commitments totaling approximately $64,000,000 through March 2010. In July 2009, we entered additional forward purchase commitments totaling approximately $16,000,000 at a fixed price through June 2010. Together, these contracts will lock in the price of approximately 40% of our fuel purchase needs for fiscal 2010. Our commitments through August 2009 were entered into at prevailing rates from mid-July through mid-August 2008. As a result, these contracts are at fixed prices greater than both the prices incurred during same periods in the previous fiscal year and current market prices. The remainder of our outstanding contracts were entered into at the prevailing rates in March, April and July 2009 and thus the fixed price on these contracts reflects the lower current market price for diesel.
Fuel costs in fiscal 2010, exclusive of any amounts recovered through fuel surcharges, are expected to decrease by approximately $50,000,000 to $80,000,000 as compared to fiscal 2009. Our estimate is based upon the prevailing market prices for diesel in mid-August 2009, the cost committed to in our forward fuel purchase agreements currently in place for fiscal 2010 and estimates of fuel consumption. Actual fuel costs could vary from our estimates if any of these assumptions change, in particular if future fuel prices vary significantly from our current estimates. We continue to evaluate all opportunities to offset potential increases in fuel expense, including the use of fuel surcharges and overall expense management. However, consistent with the lower current market price for diesel, we expect fuel surcharge revenue to be significantly lower in fiscal 2010 as compared to fiscal 2009, declining by as much as $60,000,000.
Share-based compensation cost in fiscal 2009 was $24,620,000 less than in fiscal 2008. Share-based compensation expense decreased $17,335,000 in fiscal 2008 from fiscal 2007. Contributing to the decrease in both years was a reduction in the level of option grants being awarded compared to previous years, resulting in reduced compensation expenses being recognized. Also affecting the decrease in fiscal 2009 was the removal of the previous stock award component from the Management Incentive Plan annual bonus awards beginning with fiscal 2009. As a result, the share-based compensation expense related to the stock award component of the incentive bonuses recorded in previous years was not incurred in fiscal 2009, and overall share-based compensation expense was reduced as compared to the prior year. Beginning in fiscal 2010, we expect to replace the stock award component of the incentive bonuses with annual discretionary grants of restricted equity awards subject to time-based vesting. Share-based compensation expense in fiscal 2010 is expected to increase by $5,000,000 to $15,000,000 relative to fiscal 2009 due primarily to the anticipated discretionary grant of restricted awards in fiscal 2010.
Net company-sponsored pension costs in fiscal 2009 were $22,877,000 higher than fiscal 2008, due primarily to the recognition of actuarial losses from lower returns on assets of Sysco’s company-sponsored qualified pension plan (Retirement Plan) during fiscal 2008 and the merging of participants from a multi-employer pension plan the Retirement Plan (see Multi-Employer Pension Plans at “Liquidity and Capital Resources, Other Considerations”), partially offset by a decrease in expense due to an increase in the discount rates used to calculate the plan’s liabilities and amendments to our Supplemental Executive Retirement Plan (SERP). Net company-sponsored pension costs decreased $8,754,000 in fiscal 2008 over the prior year, due primarily to the funding status and the projected asset performance of the Retirement Plan at that time. Net company-sponsored pension costs in fiscal 2010 are expected to increase by approximately $37,000,000 over fiscal 2009 due primarily to lower returns on assets of the Retirement Plan during fiscal 2009, partially offset by an increase in the discount rates used to calculate our projected benefit obligation and related pension expense for fiscal 2010.
We recorded provisions related to multi-employer pension plans of $9,585,000 in fiscal 2009, $22,284,000 in fiscal 2008 and $4,700,000 in fiscal 2007. See additional discussion of multi-employer pension plans at “Liquidity and Capital Resources, Other Considerations.”
Net Earnings
Net earnings declined 4.5% in fiscal 2009 from fiscal 2008 due primarily to the impact of changes in income taxes discussed below, as well as the factors discussed above. Net earnings increased 10.5% in fiscal 2008 over fiscal 2007 due primarily to the factors discussed above, as well as the impact of changes in income taxes discussed below.
The effective tax rate was 40.37% in fiscal 2009, 38.25% in fiscal 2008 and 38.25% in fiscal 2007.
The effective tax rate for fiscal 2009 was negatively impacted primarily by two factors. First, the company recorded tax adjustments related to federal and state tax contingencies of $31,000,000. Second, the loss of $43,812,000, which had a tax effect of $16,824,000, recorded to adjust the carrying value of corporate-owned life insurance policies to their cash surrender values was non-deductible for income tax purposes and had the impact of increasing the effective tax rate for the period. The effective tax rate for fiscal 2009 was favorably impacted by the reversal of valuation allowances of $7,800,000 previously recorded on Canadian net operating loss deferred tax assets.
18

Table of Contents
The effective tax rate for fiscal 2008 was favorably impacted by tax benefits of approximately $7,700,000 resulting from the recognition of a net operating loss deferred tax asset which arose due to a state tax law change, $8,600,000 related to the reversal of valuation allowances previously recorded on Canadian net operating loss deferred tax assets and $5,500,000 related to the reduction in net Canadian deferred tax liabilities due to a federal tax rate reduction. The effective tax rate for fiscal 2008 was negatively impacted by the recording of tax and interest related to uncertain tax positions, share-based compensation expense and the recognition of losses of $8,718,000, which had a tax effect of $3,348,000, recorded to adjust the carrying value of corporate-owned life insurance policies to their cash surrender values.
The effective tax rate for fiscal 2007 was favorably impacted by the recognition of gains of $23,922,000, which had a tax effect of $9,186,000, recorded to adjust the carrying value of corporate-owned life insurance policies to their cash surrender values. The effective tax rate for fiscal 2007 was negatively impacted by the recognition of tax and interest for tax contingencies.
Sysco’s affiliate, Baugh Supply Chain Cooperative (BSCC), is a cooperative taxed under subchapter T of the United States Internal Revenue Code the operation of which has resulted in a deferral of tax payments. The Internal Revenue Service (IRS), in connection with its audits of our 2003 through 2006 federal income tax returns proposed adjustments that would have accelerated amounts that we had previously deferred and would have resulted in the payment of interest on those deferred amounts. Sysco reached a settlement with the IRS on August 21, 2009 to cease paying U.S. federal taxes related to BSCC on a deferred basis, pay the amounts currently recorded within deferred taxes related to BSCC over a three year period and make a one-time payment of $41,000,000, of which approximately $39,000,000 is non-deductible. The settlement addresses the BSCC deferred tax issue as it relates to the IRS audit of our 2003 through 2006 federal income tax returns, and settles the matter for all subsequent periods, including the 2007 and 2008 federal income tax returns already under audit. We had previously accrued interest during the period of appeals and as a result of the settlement with the IRS, Sysco will record an income tax benefit of approximately $30,000,000 in the first quarter of fiscal 2010.
Earnings Per Share
Basic earnings per share and diluted earnings per share decreased 3.3% and 2.2%, respectively, in fiscal 2009 from the prior year. Basic earnings per share and diluted earnings per share increased 13.0% and 13.1%, respectively, in fiscal 2008 over the prior year. These changes were primarily the result of factors discussed above, as well as a net reduction in shares outstanding. The net reduction in average shares outstanding was primarily due to share repurchases. The net reduction in diluted shares outstanding was primarily due to share repurchases and an increase in the number of anti-dilutive options excluded from the diluted shares calculation.
As a result of the IRS settlement noted above, Sysco will record an income tax benefit of approximately $30,000,000 in the first quarter of fiscal 2010. We expect this to positively impact our diluted earnings per share by approximately $0.05 per share.
Segment Results
We have aggregated our operating companies into a number of segments, of which only Broadline and SYGMA are reportable segments as defined in accounting provisions related to disclosures about segments of an enterprise. The accounting policies for the segments are the same as those disclosed by Sysco within the Financial Statements and Supplementary Data within Part II Item 8 of this Form 10-K. Intersegment sales generally represent specialty produce and meat company products distributed by the Broadline and SYGMA operating companies. The segment results include certain centrally incurred costs for shared services that are charged to our segments. These centrally incurred costs are charged based upon the relative level of service used by each operating company consistent with how management views the performance of its operating segments.
Management evaluates the performance of each of our operating segments based on its respective operating income results, which include the allocation of certain centrally incurred costs. While a segment’s operating income may be impacted in the short term by increases or decreases in margins, expenses, or a combination thereof, over the long-term each business segment is expected to increase its operating income at a greater rate than sales growth. This is consistent with our long-term goal of leveraging earnings growth at a greater rate than sales growth.
19

Table of Contents
The following table sets forth the operating income of each of our reportable segments and the other segment expressed as a percentage of each segment’s sales for each period reported and should be read in conjunction with Business Segment Information in Note 20 to the Consolidated Financial Statements in Item 8:
The following table sets forth the change in the selected financial data of each of our reportable segments and the other segment expressed as a percentage increase over the prior year and should be read in conjunction with Business Segment Information in Note 20 to the Consolidated Financial Statements in Item 8:
The following table sets forth sales and operating income of each of our reportable segments, the other segment, and intersegment sales, expressed as a percentage of aggregate segment sales, including intersegment sales, and operating income, respectively. For purposes of this statistical table, operating income of our segments excludes corporate expenses and consolidated adjustments of $219,300,000 in fiscal 2009, $196,726,000 in fiscal 2008 and $207,361,000 in fiscal 2007 that are not charged to our segments. This information should be read in conjunction with Business Segment Information in Note 20 to the Consolidated Financial Statements in Item 8:
Included in corporate expenses and consolidated adjustments, among other items, are:
Broadline Segment
Broadline operating companies distribute a full line of food products and a wide variety of non-food products to customers. Broadline operations have significantly higher operating margins than the rest of Sysco’s operations. In fiscal 2009, the Broadline operating results represented approximately 79% of Sysco’s overall sales and 94% of the aggregate operating income of Sysco’s segments, which excludes corporate expenses and consolidated adjustments.
There are several factors which contribute to these higher operating results as compared to the SYGMA and Other operating segments. We have invested substantial amounts in assets, operating methods, technology and management expertise in this segment. The breadth of its sales force, geographic reach of its distribution area and its purchasing power allow us to leverage this segment’s earnings.
Sales
Sales for fiscal 2009 were 2.0% less than fiscal 2008. The changes in the exchange rates used to translate our foreign sales into U.S. dollars negatively impacted sales by 1.5% compared to fiscal 2008. Non-comparable acquisitions contributed 0.2% to the overall sales comparison for fiscal 2009. Case volume declines attributable to the impact of the current business
20
Operating Income as a Percentage of Sales 2009 2008 2007
Broadline 6.7 % 6.5 % 6.4 % SYGMA 0.6 0.2 0.3 Other 3.1 3.8 3.8
2009 2008 Operating Operating Sales Income Sales Income
Broadline (2.0 )% 1.5 % 8.1 % 9.0 % SYGMA 5.8 265.5 (1) 4.4 (23.8 ) Other (9.7 ) (25.8 ) 1.5 3.0
(1) SYGMA had operating income of $30,193,000 in fiscal 2009 and $8,261,000 in fiscal 2008.
2009 2008 2007 Segment Segment Segment Operating Operating Operating Sales Income Sales Income Sales Income
Broadline 79.4 % 93.7 % 79.5 % 93.0 % 78.7 % 92.5 % SYGMA 13.1 1.4 12.2 0.4 12.5 0.6 Other 8.8 4.9 9.6 6.6 10.1 6.9 Intersegment sales (1.3 ) — (1.3 ) — (1.3 ) —
Total 100.0 % 100.0 % 100.0 % 100.0 % 100.0 % 100.0 %
• Gains and losses recognized to adjust corporate-owned life insurance policies to their cash surrender values;
• Share-based compensation expense related to stock option grants, restricted stock, issuances of stock pursuant to the Employees’ Stock Purchase Plan and stock grants to non-employee directors; and
• Corporate-level depreciation and amortization expense.

Table of Contents
environment caused a decline in sales in fiscal 2009 as compared to fiscal 2008. Product cost inflation, which led to increases in selling prices, partially offset case volume declines in fiscal 2009.
Sales for fiscal 2008 were 8.1% greater than fiscal 2007. The changes in the exchange rates used to translate our foreign sales into U.S. dollars increased sales by 1.3% compared to fiscal 2007. Non-comparable acquisitions did not have a material impact on the overall sales growth rate for fiscal 2008. Product cost inflation, and the resulting increases in selling prices, was the primary contributor to sales growth. In addition, fiscal 2008 growth was realized both from increased sales to multi-unit customers and marketing associate-served customers primarily through continued focus on customer account penetration through the efforts of our marketing associates and the use of business reviews with customers.
Operating Income
The increase in operating income in fiscal 2009 over fiscal 2008 was primarily due to effective management of operations in the current economic environment. Effective management was also evidenced by margins declining at a lower rate than our sales decline and by decreasing expenses as compared to the comparable prior year periods. Gross margin dollars decreased 1.7% while operating expenses decreased 3.2% in fiscal 2009 as compared to fiscal 2008. Expense performance for fiscal 2009 was aided by lower payroll-related expenses related to reduced headcount and lower incentive compensation and operating efficiencies, partially offset by an increase in the provision for losses on receivables.
The increase in operating income in fiscal 2008 over fiscal 2007 was primarily due to gross margin dollars increasing at a faster pace than expenses. We were able to manage our business effectively in the inflationary environment that existed in fiscal 2008 by managing margins and improving operating efficiencies. Gross margin dollars increased 7.0% while operating expenses increased 6.0% in fiscal 2008 over fiscal 2007.
The high cost of fuel also impacted our Broadline segment’s results for fiscal 2009 and fiscal 2008. Fuel costs were $28,818,000 higher in fiscal 2009 over fiscal 2008. Fuel costs for fiscal 2008 were $21,575,000 higher than fiscal 2007. We attempt to mitigate increased fuel costs by reducing miles driven, improving fleet consumption by adjusting idling time and maximum speeds and using fuel surcharges. In the second half of fiscal 2008 and first half of fiscal 2009, our usage of fuel surcharges increased due to sustained increased market diesel prices. Fuel surcharges were approximately $9,000,000 higher in fiscal 2009 than in fiscal 2008 and $21,000,000 higher in fiscal 2008 than in fiscal 2007. Consistent with the lower current market price for diesel, we expect fuel costs and fuel surcharges for our Broadline segment to be lower in fiscal 2010 as compared to fiscal 2009.
We recorded provisions related to multi-employer pension plans of $9,585,000 in fiscal 2009, $22,284,000 in fiscal 2008 and $4,700,000 in fiscal 2007.
SYGMA Segment
SYGMA operating companies distribute a full line of food products and a wide variety of non-food products to certain chain restaurant customer locations. SYGMA operations have traditionally had lower operating income as a percentage of sales than Sysco’s other segments. This segment of the foodservice industry has generally been characterized by lower overall operating margins as the volume that these customers command allows them to negotiate for reduced margins. These operations service chain restaurants through contractual agreements that are typically structured on a fee per case delivered basis.
Sales
Sales for fiscal 2009 were 5.8% greater than fiscal 2008 and 4.4% greater in fiscal 2008 than fiscal 2007. Although our SYGMA segment has been negatively impacted by deteriorating economic conditions, it achieved sales growth in both fiscal 2009 and fiscal 2008, primarily due to significant contracts with new customers and product cost increases, which led to increases in selling prices. These increases were partially offset by lost sales due to the elimination of unprofitable business and lower case volumes due to difficult economic conditions impacting SYGMA’s existing customer base.
One chain restaurant customer (Wendy’s/Arby’s Group, Inc.) accounted for approximately 33% of the SYGMA segment sales for the fiscal year ended June 27, 2009. SYGMA maintains multiple regional contracts with varied expiration dates with this customer. While the loss of this customer would have a material adverse effect on SYGMA, we do not believe that the loss of this customer would have a material adverse effect on Sysco as a whole.
Operating Income
Operating income increased in fiscal 2009 as compared to fiscal 2008. Gross margin dollars increased 0.4% while operating expenses decreased 5.1% in fiscal 2009 as compared to fiscal 2008. Expense reductions were accomplished by operational efficiencies in both delivery and warehouse areas, as well as lower payroll expense related to headcount reductions.
21
Table of Contents
Operating income in fiscal 2008 decreased as compared to fiscal 2007. In fiscal 2008, SYGMA expensed $5,587,000 related to the write-off of software development costs. In addition, some of SYGMA’s customers experienced a slowdown in their business resulting in lower cases per delivery and therefore reduced gross margin dollars per stop. Expense reductions were accomplished by consolidating regional offices, reducing headcounts and not renewing unprofitable customer contracts.
The high cost of fuel also impacted our SYGMA segment’s results for fiscal 2009 and fiscal 2008. Fuel costs were $2,028,000 higher in fiscal 2009 over fiscal 2008. Fuel costs for fiscal 2008 were $8,888,000 higher than fiscal 2007. SYGMA was able to partially offset these costs through increases in the fees charged to customers, including fuel surcharges, and by reducing expenses. Fuel surcharges were approximately $5,000,000 lower in fiscal 2009 than in fiscal 2008 and $6,000,000 higher in fiscal 2008 than in fiscal 2007. Consistent with the lower current market price for diesel, we expect fuel costs and fuel surcharges for our SYGMA segment to be lower in fiscal 2010 as compared to fiscal 2009.
Other Segment
“Other” financial information is attributable to our other operating segments, including our specialty produce, custom-cut meat and lodging industry products and a company that distributes to international customers. These operating segments are discussed on an aggregate basis as they do not represent reportable segments under segment accounting literature.
On an aggregate basis, our “Other” segment has had a lower operating income as a percentage of sales than Sysco’s Broadline segment. Sysco has acquired the operating companies within these segments in relatively recent years. These operations generally operate in a niche within the foodservice industry. These operations are also generally smaller in sales and scope than an average Broadline operation and each of these segments is considerably smaller in sales and overall scope than the Broadline segment. In fiscal 2009, in the aggregate, the “Other” segment represented approximately 8.8% of Sysco’s overall sales and 4.9% of the aggregate operating income of Sysco’s segments, which excludes corporate expenses and consolidated adjustments.
Operating income decreased 25.8% for fiscal 2009 over fiscal 2008. The decrease in operating income was caused primarily by reduced sales in all segments attributable to the deteriorating economic environment.
Operating income increased 3.0% for fiscal 2008 over fiscal 2007. The increase in operating income was generated primarily by improved results in the specialty produce and the lodging industry segments offset by reduced sales and operating income in the custom-cut meat segment.
Liquidity and Capital Resources
Sysco’s strategic objectives require continuing investment. Our resources include cash provided by operations and access to capital from financial markets. Our operations historically have produced significant cash flow. Cash generated from operations is first allocated to working capital requirements; investments in facilities, systems, fleet and other equipment; cash dividends; and acquisitions compatible with our overall growth strategy. In addition, this cash will be used to satisfy the requirements of the IRS settlement over the next three years. Any remaining cash generated from operations may be invested in high-quality, short-term instruments or applied toward a portion of the cost of the share repurchase program. As a part of our on-going strategic analysis, we regularly evaluate business opportunities, including potential acquisitions and sales of assets and businesses, and our overall capital structure. These transactions may materially impact our liquidity, borrowing capacity, leverage ratios and capital availability.
We believe that our cash flows from operations, the availability of additional capital under our existing commercial paper programs and bank lines of credit and our ability to access capital from financial markets in the future, including issuances of debt securities under our shelf registration statement filed with the Securities and Exchange Commission (SEC), will be sufficient to meet our anticipated cash requirements over at least the next twelve months, while maintaining sufficient liquidity for normal operating purposes. During the recent tightening of the credit markets, we have continued to maintain the highest credit rating available for commercial paper. We believe that we will continue to be able to access the commercial paper market effectively. We also issued long-term senior notes totaling $500,000,000 under our shelf registration statement during the third quarter of fiscal 2009 in order to take advantage of the interest rates available to us at that time and to enhance our liquidity position. We believe that we will continue to be able to access the long-term capital market effectively.
Operating Activities
We generated $1,582,341,000 in cash flow from operations in fiscal 2009, $1,596,129,000 in fiscal 2008 and $1,402,922,000 in fiscal 2007. Cash flow from operations in fiscal 2009 was primarily due to net income, reduced by decreases in accounts payable balances and accrued expenses, offset by decreases in accounts receivable balances and inventory balances and an increase in accrued income taxes. Cash flow from operations in fiscal 2008 was primarily due to net income, reduced by decreases in accrued income taxes and increases in accounts receivable balances and inventory balances, partially offset by a decrease in prepaid expenses and other current assets. Cash flow from operations in fiscal 2007 was primarily due to net
22
Table of Contents
income, reduced by decreases in accrued income taxes and increases in accounts receivable balances, inventory balances and prepaid expenses and other current assets, partially offset by increases in accrued expenses and accounts payable balances.
The decrease in accounts receivable and inventory balances in fiscal 2009 was primarily due to the sales decline. The increases in accounts receivable and inventory balances in fiscal 2008 and fiscal 2007 were primarily due to sales growth. The decrease in accounts payable balances in fiscal 2009 was primarily from inventory decreases resulting from the sales decline. The increases in accounts payable balances in fiscal 2008 and fiscal 2007 were primarily due to inventory increases resulting from sales growth. Accounts payable balances are impacted by many factors, including changes in product mix, cash discount terms and changes in payment terms with vendors.
Cash flow from operations was negatively impacted by decreases in accrued expenses of $120,314,000 during fiscal 2009 and $22,721,000 during fiscal 2008 and positively impacted by an increase in accrued expenses of $132,936,000 during fiscal 2007. The decrease in accrued expenses during fiscal 2009 was primarily due to the payment of prior year annual incentive bonuses, offset by lower accruals for current year incentive bonuses. The decrease in accrued expenses during fiscal 2008 was primarily due to the reversal of a product liability claim which is further explained below. This decrease was partially offset by increased accrued interest due to fixed-rate debt issued in fiscal 2008 and an increase to a provision related to a multi-employer pension plan. See additional discussion of multi-employer pension plans at “Liquidity and Capital Resources, Other Considerations.” The increase in accrued expenses during fiscal 2007 was primarily due to increased accruals for fiscal 2007 incentive bonuses due to improved operating results over fiscal 2006.
In fiscal 2007, we recorded a liability for a product liability claim of $50,296,000 and the corresponding insurance receivable of $48,296,000, included within prepaid expenses and other current assets. In fiscal 2008, these amounts were reversed as our insurance carrier and other parties paid the full amount of the judgment in excess of our deductible. See further discussion of the product liability claim under Note 19, Commitments and Contingencies, in the Notes to Consolidated Financial Statements in Item 8.
Other long-term liabilities and prepaid pension cost, net, decreased $48,380,000 during fiscal 2009, increased $13,459,000 during fiscal 2008 and decreased $14,817,000 in fiscal 2007. The decrease in fiscal 2009 is primarily attributable to a decrease in our liability for uncertain tax benefits. See additional discussion of an IRS settlement at “Liquidity and Capital Resources, Other Considerations.” The decrease was partially offset by a combination of the recording of net company-sponsored pension costs and incentive compensation deferrals. The increase for fiscal 2008 was primarily attributable to a combination of the recording of net company-sponsored pension costs, incentive compensation deferrals and a net increase to our liability for unrecognized tax benefits, partially offset by pension contributions to our company-sponsored plans. The decrease in fiscal 2007 was due to pension contributions to our company-sponsored plans exceeding the amount of net company-sponsored pension costs recognized during the year. We recorded net company-sponsored pension costs of $88,714,000, $65,837,000 and $74,591,000 during fiscal 2009, fiscal 2008 and fiscal 2007, respectively. Our contributions to our company-sponsored defined benefit plans were $95,776,000, $92,670,000 and $91,163,000 during fiscal 2009, fiscal 2008 and fiscal 2007, respectively. We expect to contribute approximately $160,000,000 to our company-sponsored defined benefit plans in fiscal 2010.
Investing Activities
Fiscal 2009 capital expenditures included:
Fiscal 2008 capital expenditures included:
Fiscal 2007 capital expenditures included:
23
• construction of a fold-out facility in Longview, Texas;
• replacement or significant expansion of facilities in Victoria, British Columbia; Chicago, Illinois; Pittsburgh, Pennsylvania and Houston, Texas;
• land purchases for future fold-out facilities; and
• investments in our project to enhance our technology platform.
• construction of fold-out facilities in Knoxville, Tennessee and Longview, Texas;
• replacement or significant expansion of facilities in Atlanta, Georgia; Chicago, Illinois; Peterborough, Ontario and Houston, Texas;
• completion of the Southeast RDC in Alachua, Florida; and
• completion of work on the corporate headquarters expansion.
• construction of a fold-out facility in Raleigh, North Carolina;
• replacement or significant expansion of facilities in Edmonton, Alberta; Los Angeles, California; Miami, Florida; Albuquerque, New Mexico and Columbia, South Carolina;
• the Southeast RDC in Alachua, Florida; and
• continuing work on the corporate headquarters expansion.

Table of Contents
We expect total capital expenditures in fiscal 2010 to be in the range of $600,000,000 to $650,000,000. Fiscal 2010 expenditures will include the continuation of the fold-out program; facility, fleet and other equipment replacements and expansions; and investments in technology.
During fiscal 2009, in the aggregate, the company paid cash of $218,075,000 for operations acquired during fiscal 2009 and for contingent consideration related to operations acquired in previous fiscal years. During fiscal 2009, we acquired for cash broadline foodservice operations in Ireland, Los Angeles, California and Boston, Massachusetts, as well as a produce distributor in Toronto, Ontario.
Financing Activities
Equity
We traditionally have engaged in Board-approved share repurchase programs. The number of shares acquired and their cost during the past three fiscal years were 16,951,200 shares for $438,843,000 in fiscal 2009, 16,769,900 shares for $529,179,000 in fiscal 2008 and 16,231,200 shares for $550,865,000 in fiscal 2007. As of August 12, 2009, there was a remaining authorization by our Board of Directors to repurchase up to 9,386,600 shares. We expect to repurchase significantly fewer shares in fiscal 2010 than in previous years.
Dividends paid were $548,246,000, or $0.92 per share, in fiscal 2009, $497,467,000, or $0.82 per share, in fiscal 2008 and $445,416,000, or $0.72 per share, in fiscal 2007. In May 2009, we declared our regular quarterly dividend for the first quarter of fiscal 2010 of $0.24 per share, which was paid in July 2009.
In November 2000, we filed with the SEC a shelf registration statement covering 30,000,000 shares of common stock to be offered from time to time in connection with acquisitions. As of August 12, 2009, 29,477,835 shares remained available for issuance under this registration statement.
Short-term Borrowings
We have uncommitted bank lines of credit, which provided for unsecured borrowings for working capital of up to $88,000,000, of which none was outstanding as of June 27, 2009 or August 12, 2009.
Our Irish subsidiary, Pallas Foods Limited, has a € 20,000,000 (Euro) committed facility for unsecured borrowings for working capital, which expires March 31, 2010. There were no borrowings outstanding under this facility as of June 27, 2009 or August 12, 2009.
Commercial Paper
We have a Board-approved commercial paper program allowing us to issue short-term unsecured notes in an aggregate amount not to exceed $1,300,000,000.
Sysco and one of our subsidiaries, Sysco International, Co., have a revolving credit facility supporting our U.S. and Canadian commercial paper programs. The facility, in the amount of $1,000,000,000, expires on November 4, 2012, but is subject to extension.
During fiscal 2009, 2008 and 2007, aggregate outstanding commercial paper issuances and short-term bank borrowings ranged from approximately zero to $164,998,000, zero to $1,133,241,000, $356,804,000 to $755,180,000, respectively. There were no commercial paper issuances outstanding as of June 27, 2009 or August 12, 2009.
Fixed Rate Debt
In April 2007, we repaid at maturity our 7.25% senior notes totaling $100,000,000 utilizing a combination of cash flow from operations and commercial paper issuances.
In January 2008, the SEC granted our request to terminate our then existing shelf registration statement that was filed with the SEC in April 2005 for the issuance of debt securities. In February 2008, we filed an automatically effective well-known seasoned issuer shelf registration statement for the issuance of up to $1,000,000,000 in debt securities with the SEC.
In February 2008, we issued 4.20% senior notes totaling $250,000,000 due February 12, 2013 (the 2013 notes) and 5.25% senior notes totaling $500,000,000 due February 12, 2018 (the 2018 notes) under our February 2008 shelf registration. The 2013 and 2018 notes, which were priced at 99.835% and 99.310% of par, respectively, are unsecured, are not subject to any sinking fund requirement and include a redemption provision which allows us to retire the notes at any time prior to maturity at
24

Table of Contents
the greater of par plus accrued interest or an amount designed to ensure that the noteholders are not penalized by the early redemption. Proceeds from the notes were utilized to retire commercial paper issuances outstanding as of February 2008.
In February 2009, we deregistered the securities remaining unsold under our then existing shelf registration statement that was filed with the SEC in February 2008 for the issuance of debt securities. In February 2009, Sysco filed with the SEC an automatically effective well-known seasoned issuer shelf registration statement for the issuance of an indeterminate amount of debt securities that may be issued from time to time.
In March 2009, Sysco issued 5.375% senior notes totaling $250,000,000 due March 17, 2019 (the 2019 notes) and 6.625% senior notes totaling $250,000,000 due March 17, 2039 (the 2039 notes) under our February 2009 shelf registration. The 2019 and 2039 notes, which were priced at 99.321% and 98.061% of par, respectively, are unsecured, are not subject to any sinking fund requirement and include a redemption provision which allows Sysco to retire the notes at any time prior to maturity at the greater of par plus accrued interest or an amount designed to ensure that the noteholders are not penalized by early redemption. Proceeds from the notes will be utilized over a period of time for general corporate purposes, which may include acquisitions, refinancing of debt, working capital, share repurchases and capital expenditures.
Total Debt
Total debt as of June 27, 2009 was $2,476,649,000, of which approximately 99% was at fixed rates with a weighted average of 5.6% and the remainder was at floating rates with a weighted average of 1.3%. Certain loan agreements contain typical debt covenants to protect noteholders, including provisions to maintain our long-term debt to total capital ratio below a specified level. We were in compliance with all debt covenants as of June 27, 2009.
Other
As part of normal business activities, we issue letters of credit through major banking institutions as required by certain vendor and insurance agreements. As of June 27, 2009 and June 28, 2008, letters of credit outstanding were $74,679,000 and $35,785,000, respectively.
Other Considerations
Multi -Employer Pension Plans
As discussed in Note 19, Commitments and Contingencies, to the Consolidated Financial Statements in Item 8, we contribute to several multi-employer defined benefit pension plans based on obligations arising under collective bargaining agreements covering union-represented employees.
Under current law regarding multi-employer defined benefit plans, a plan’s termination, our voluntary withdrawal or the mass withdrawal of all contributing employers from any underfunded multi-employer defined benefit plan would require us to make payments to the plan for our proportionate share of the multi-employer plan’s unfunded vested liabilities. Based on the most recent information available from plan administrators, our share of withdrawal liability on most of the multi-employer plans we participate in, some of which appear to be underfunded, was estimated to be $80,000,000 as of June 27, 2009 based on a voluntary withdrawal. Because we are not provided the information by the plan administrators on a timely basis and we expect that many multi-employer pension plans’ assets have declined due to recent stock market performance, we believe our share of the withdrawal liability could be greater.
Required contributions to multi-employer plans could increase in the future as these plans strive to improve their funding levels. In addition, the Pension Protection Act, enacted in August 2006, requires underfunded pension plans to improve their funding ratios within prescribed intervals based on the level of their underfunding. We believe that any unforeseen requirements to pay such increased contributions, withdrawal liability and excise taxes would be funded through cash flow from operations, borrowing capacity or a combination of these items. As of June 27, 2009, we have approximately $17,000,000 in liabilities recorded in total related to certain multi-employer defined benefit plans for which our voluntary withdrawal has already occurred, all of which are expected to be paid in fiscal 2010.
During fiscal 2008, we obtained information that a multi-employer pension plan we participated in failed to satisfy minimum funding requirements for certain periods and concluded that it was probable that additional funding would be required as well as the payment of excise tax. As a result, during fiscal 2008, we recorded a liability of approximately $16,500,000 related to our share of the minimum funding requirements and related excise tax for these periods. During the first quarter of fiscal 2009, we effectively withdrew from this multi-employer pension plan in an effort to secure benefits for our employees that were participants in the plan and to manage our exposure to this under-funded plan. We agreed to pay $15,000,000 to the plan, which included the minimum funding requirements. In connection with this withdrawal agreement, we merged active participants from this plan into Sysco’s company-sponsored Retirement Plan and assumed $26,704,000 in liabilities. The payment to the plan was made in the early part of the second quarter of fiscal 2009. If this plan were to undergo a mass
25
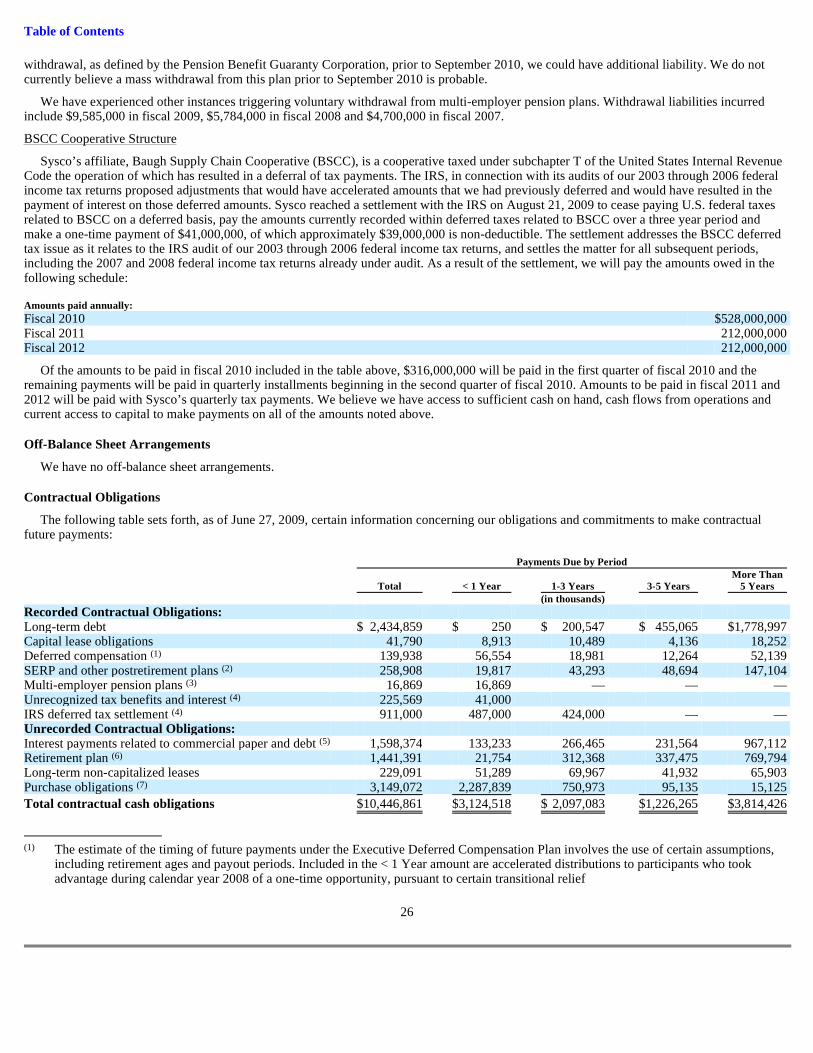
Table of Contents
withdrawal, as defined by the Pension Benefit Guaranty Corporation, prior to September 2010, we could have additional liability. We do not currently believe a mass withdrawal from this plan prior to September 2010 is probable.
We have experienced other instances triggering voluntary withdrawal from multi-employer pension plans. Withdrawal liabilities incurred include $9,585,000 in fiscal 2009, $5,784,000 in fiscal 2008 and $4,700,000 in fiscal 2007.
BSCC Cooperative Structure
Sysco’s affiliate, Baugh Supply Chain Cooperative (BSCC), is a cooperative taxed under subchapter T of the United States Internal Revenue Code the operation of which has resulted in a deferral of tax payments. The IRS, in connection with its audits of our 2003 through 2006 federal income tax returns proposed adjustments that would have accelerated amounts that we had previously deferred and would have resulted in the payment of interest on those deferred amounts. Sysco reached a settlement with the IRS on August 21, 2009 to cease paying U.S. federal taxes related to BSCC on a deferred basis, pay the amounts currently recorded within deferred taxes related to BSCC over a three year period and make a one-time payment of $41,000,000, of which approximately $39,000,000 is non-deductible. The settlement addresses the BSCC deferred tax issue as it relates to the IRS audit of our 2003 through 2006 federal income tax returns, and settles the matter for all subsequent periods, including the 2007 and 2008 federal income tax returns already under audit. As a result of the settlement, we will pay the amounts owed in the following schedule:
Of the amounts to be paid in fiscal 2010 included in the table above, $316,000,000 will be paid in the first quarter of fiscal 2010 and the remaining payments will be paid in quarterly installments beginning in the second quarter of fiscal 2010. Amounts to be paid in fiscal 2011 and 2012 will be paid with Sysco’s quarterly tax payments. We believe we have access to sufficient cash on hand, cash flows from operations and current access to capital to make payments on all of the amounts noted above.
Off-Balance Sheet Arrangements
We have no off-balance sheet arrangements.
Contractual Obligations
The following table sets forth, as of June 27, 2009, certain information concerning our obligations and commitments to make contractual future payments:
26
Amounts paid annually: Fiscal 2010 $ 528,000,000 Fiscal 2011 212,000,000 Fiscal 2012 212,000,000
Payments Due by Period More Than Total < 1 Year 1-3 Years 3-5 Years 5 Years (in thousands) Recorded Contractual Obligations: Long-term debt $ 2,434,859 $ 250 $ 200,547 $ 455,065 $ 1,778,997 Capital lease obligations 41,790 8,913 10,489 4,136 18,252 Deferred compensation (1) 139,938 56,554 18,981 12,264 52,139 SERP and other postretirement plans (2) 258,908 19,817 43,293 48,694 147,104 Multi -employer pension plans (3) 16,869 16,869 — — — Unrecognized tax benefits and interest (4) 225,569 41,000 IRS deferred tax settlement (4) 911,000 487,000 424,000 — — Unrecorded Contractual Obligations: Interest payments related to commercial paper and debt (5) 1,598,374 133,233 266,465 231,564 967,112 Retirement plan (6) 1,441,391 21,754 312,368 337,475 769,794 Long-term non-capitalized leases 229,091 51,289 69,967 41,932 65,903 Purchase obligations (7) 3,149,072 2,287,839 750,973 95,135 15,125
Total contractual cash obligations $ 10,446,861 $ 3,124,518 $ 2,097,083 $ 1,226,265 $ 3,814,426
(1) The estimate of the timing of future payments under the Executive Deferred Compensation Plan involves the use of certain assumptions, including retirement ages and payout periods. Included in the < 1 Year amount are accelerated distributions to participants who took advantage during calendar year 2008 of a one-time opportunity, pursuant to certain transitional relief
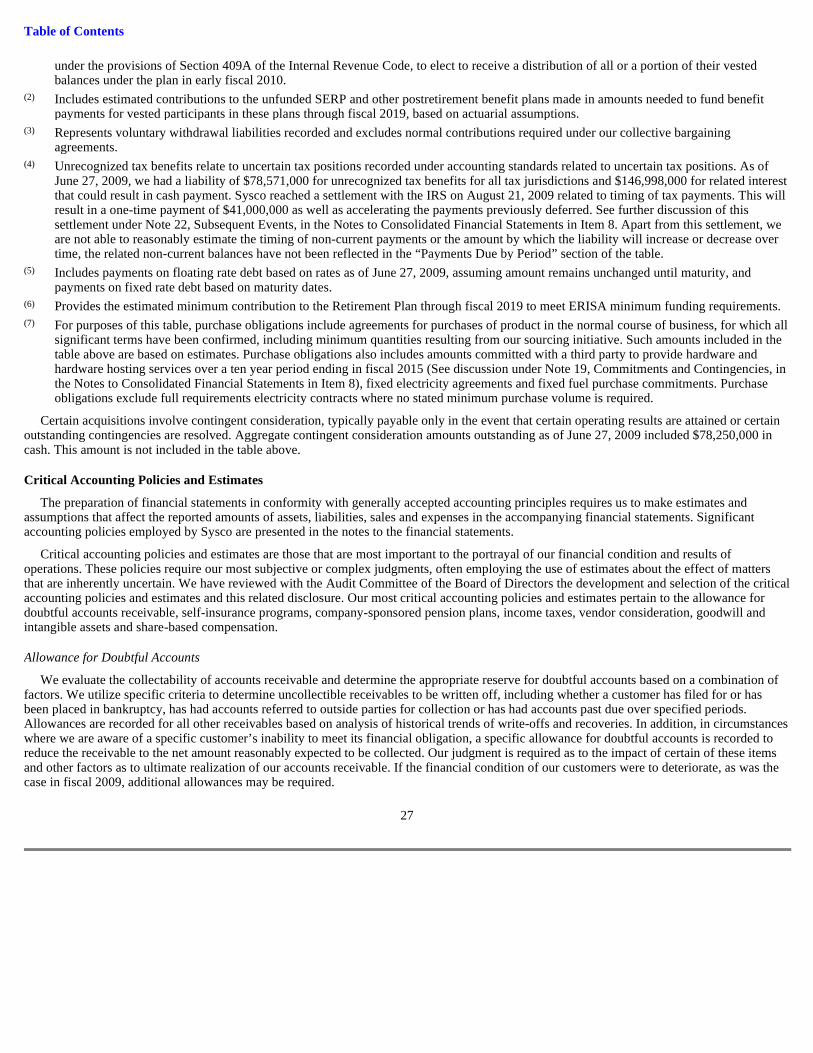
Table of Contents
Certain acquisitions involve contingent consideration, typically payable only in the event that certain operating results are attained or certain outstanding contingencies are resolved. Aggregate contingent consideration amounts outstanding as of June 27, 2009 included $78,250,000 in cash. This amount is not included in the table above.
Critical Accounting Policies and Estimates
The preparation of financial statements in conformity with generally accepted accounting principles requires us to make estimates and assumptions that affect the reported amounts of assets, liabilities, sales and expenses in the accompanying financial statements. Significant accounting policies employed by Sysco are presented in the notes to the financial statements.
Critical accounting policies and estimates are those that are most important to the portrayal of our financial condition and results of operations. These policies require our most subjective or complex judgments, often employing the use of estimates about the effect of matters that are inherently uncertain. We have reviewed with the Audit Committee of the Board of Directors the development and selection of the critical accounting policies and estimates and this related disclosure. Our most critical accounting policies and estimates pertain to the allowance for doubtful accounts receivable, self-insurance programs, company-sponsored pension plans, income taxes, vendor consideration, goodwill and intangible assets and share-based compensation.
Allowance for Doubtful Accounts
We evaluate the collectability of accounts receivable and determine the appropriate reserve for doubtful accounts based on a combination of factors. We utilize specific criteria to determine uncollectible receivables to be written off, including whether a customer has filed for or has been placed in bankruptcy, has had accounts referred to outside parties for collection or has had accounts past due over specified periods. Allowances are recorded for all other receivables based on analysis of historical trends of write-offs and recoveries. In addition, in circumstances where we are aware of a specific customer’s inability to meet its financial obligation, a specific allowance for doubtful accounts is recorded to reduce the receivable to the net amount reasonably expected to be collected. Our judgment is required as to the impact of certain of these items and other factors as to ultimate realization of our accounts receivable. If the financial condition of our customers were to deteriorate, as was the case in fiscal 2009, additional allowances may be required.
27
under the provisions of Section 409A of the Internal Revenue Code, to elect to receive a distribution of all or a portion of their vested balances under the plan in early fiscal 2010.
(2) Includes estimated contributions to the unfunded SERP and other postretirement benefit plans made in amounts needed to fund benefit payments for vested participants in these plans through fiscal 2019, based on actuarial assumptions.
(3) Represents voluntary withdrawal liabilities recorded and excludes normal contributions required under our collective bargaining agreements.
(4) Unrecognized tax benefits relate to uncertain tax positions recorded under accounting standards related to uncertain tax positions. As of June 27, 2009, we had a liability of $78,571,000 for unrecognized tax benefits for all tax jurisdictions and $146,998,000 for related interest that could result in cash payment. Sysco reached a settlement with the IRS on August 21, 2009 related to timing of tax payments. This will result in a one-time payment of $41,000,000 as well as accelerating the payments previously deferred. See further discussion of this settlement under Note 22, Subsequent Events, in the Notes to Consolidated Financial Statements in Item 8. Apart from this settlement, we are not able to reasonably estimate the timing of non-current payments or the amount by which the liability will increase or decrease over time, the related non-current balances have not been reflected in the “Payments Due by Period” section of the table.
(5) Includes payments on floating rate debt based on rates as of June 27, 2009, assuming amount remains unchanged until maturity, and payments on fixed rate debt based on maturity dates.
(6) Provides the estimated minimum contribution to the Retirement Plan through fiscal 2019 to meet ERISA minimum funding requirements.
(7) For purposes of this table, purchase obligations include agreements for purchases of product in the normal course of business, for which all significant terms have been confirmed, including minimum quantities resulting from our sourcing initiative. Such amounts included in the table above are based on estimates. Purchase obligations also includes amounts committed with a third party to provide hardware and hardware hosting services over a ten year period ending in fiscal 2015 (See discussion under Note 19, Commitments and Contingencies, in the Notes to Consolidated Financial Statements in Item 8), fixed electricity agreements and fixed fuel purchase commitments. Purchase obligations exclude full requirements electricity contracts where no stated minimum purchase volume is required.

Table of Contents
Self-Insurance Program
We maintain a self-insurance program covering portions of workers’ compensation, general liability and vehicle liability costs. The amounts in excess of the self-insured levels are fully insured by third party insurers. We also maintain a fully self-insured group medical program. Liabilities associated with these risks are estimated in part by considering historical claims experience, medical cost trends, demographic factors, severity factors and other actuarial assumptions. Projections of future loss expenses are inherently uncertain because of the random nature of insurance claims occurrences and could be significantly affected if future occurrences and claims differ from these assumptions and historical trends. In an attempt to mitigate the risks of workers’ compensation, vehicle and general liability claims, safety procedures and awareness programs have been implemented.
Company-Sponsored Pension Plans
Amounts related to defined benefit plans recognized in the financial statements are determined on an actuarial basis. Three of the more critical assumptions in the actuarial calculations are the discount rate for determining the current value of plan benefits, the assumption for the rate of increase in future compensation levels and the expected rate of return on plan assets.
For guidance in determining the discount rates, we calculate the implied rate of return on a hypothetical portfolio of high-quality fixed-income investments for which the timing and amount of cash outflows approximates the estimated payouts of the pension plan. The discount rate assumption is reviewed annually and revised as deemed appropriate. The discount rate for determining fiscal 2009 net pension costs for the Retirement Plan, which was determined as of the June 28, 2008 measurement date, increased 0.16% to 6.94%. The discount rate for determining fiscal 2009 net pension costs for the SERP, which was determined as of the June 28, 2008 measurement date, increased 0.39% to 7.03%. The combined effect of these discount rate changes was a decrease in our net company-sponsored pension costs for all plans for fiscal 2009 by an estimated $8,692,000. The discount rate for determining fiscal 2010 net pension costs for the Retirement Plan, which was determined as of the June 27, 2009 measurement date, increased 1.08% to 8.02%. The discount rate for determining fiscal 2010 net pension costs for the SERP, which was determined as of the June 27, 2009 measurement date, increased 0.11% to 7.14%. The combined effect of these discount rate changes will decrease our net company-sponsored pension costs for all plans for fiscal 2010 by an estimated $38,600,000. A 1.0% increase in the discount rates for fiscal 2010 would decrease Sysco’s net company-sponsored pension cost by $34,100,000, while a 1.0% decrease in the discount rates would increase pension cost by $40,000,000. The impact of a 1.0% increase in the discount rates differs from the impact of a 1.0% decrease in discount rates because the liabilities are less sensitive to change at higher discount rates. Therefore, a 1.0% increase in the discount rate will not generate the same magnitude of change as a 1.0% decrease in the discount rate. As of June 27, 2009, our net actuarial losses from our company-sponsored pension plans were $534,892,000, an increase of $183,688,000. We estimate the amortization of net actuarial losses will increase our fiscal 2010 pension expense by approximately $23,000,000 as compared to fiscal 2009.
We look to actual plan experience in determining the rates of increase in compensation levels. We used a plan specific age-related set of rates for the Retirement Plan, which are equivalent to a single rate of 5.21% as of June 27, 2009 and 6.17% as of June 28, 2008. For determining the benefit obligations as of June 27, 2009, the SERP calculations use an age-graded salary growth assumption with reductions taken for determining fiscal 2010 pay due to base salary freezes in effect for fiscal 2010. As of June 28, 2008, the SERP assumes various levels of base salary increase and decrease for determining pay for fiscal 2009 depending upon the participant’s position with the company and a 7% salary growth assumption for all participants for fiscal 2010 and thereafter.
The expected long-term rate of return on plan assets of the Retirement Plan was 8.00% for fiscal 2009 and 8.50% for fiscal 2008. In fiscal 2009, the expected long-term rate of return on plan assets assumption was changed to a net return on assets assumption, which contributed to the 0.50% decrease in the assumption to 8.00% in fiscal 2009. Prior to fiscal 2009, this assumption represented gross return on assets, and plan expenses were reflected within service cost. The expectations of future returns are derived from a mathematical asset model that incorporates assumptions as to the various asset class returns, reflecting a combination of historical performance analysis and the forward-looking views of the financial markets regarding the yield on long-term bonds and the historical returns of the major stock markets. Although not determinative of future returns, the effective annual rate of return on plan assets, developed using geometric/compound averaging, was approximately 7.4%, 2.0%, 0.5% and (29.4)% over the 20-year, 10-year, 5-year and 1-year periods ended December 31, 2008, respectively. In addition, in eight of the last 15 years, the actual return on plan assets has exceeded 10.0%. The rate of return assumption is reviewed annually and revised as deemed appropriate.
The expected return on plan assets impacts the recorded amount of net pension costs. The expected long-term rate of return on plan assets of the Retirement Plan is 8.00% for fiscal 2010. A 1.0% increase (decrease) in the assumed rate of return for fiscal 2010 would decrease (increase) Sysco’s net company-sponsored pension costs for fiscal 2010 by approximately $13,100,000.
Pension accounting standards require the recognition of the funded status of our defined benefit plans in the statement of financial position, with a corresponding adjustment to accumulated other comprehensive income, net of tax. The amount reflected in accumulated other comprehensive loss as of June 28, 2008 was a charge, net of tax, of $220,913,000, which
28

Table of Contents
represented the net actuarial losses, prior service costs and transition obligation remaining from the initial adoption of previous pension accounting standards as of that date. The amount reflected in accumulated other comprehensive loss related to the recognition of the funded status of our defined benefit plans as of June 27, 2009 was a charge, net of tax, of $346,107,000.
Changes in the assumptions, including changes to the discount rate discussed above, together with the normal growth of the plans, the impact of actuarial losses from prior periods and the timing and amount of contributions, increased net company-sponsored pension costs by approximately $25,800,000 in fiscal 2009. Increasing the net company-sponsored pension costs by approximately $4,300,000 in fiscal 2009 were additional costs related to the merger of participants from a multi-employer pension plan into Sysco’s company-sponsored Retirement Plan (see Multi-Employer Pension Plans under Other Considerations for further discussion). Decreasing the net company-sponsored pension costs by approximately $7,200,000 in fiscal 2009 was a change in the SERP design. The net impact of all of these changes was a net increase in fiscal 2009 in company-sponsored pension costs of $22,877,000. Changes in the assumptions, including changes to the discount rate discussed above, together with the normal growth of the plans, the impact of actuarial losses from prior periods and the timing and amount of contributions are expected to increase net company-sponsored pension costs in fiscal 2010 by approximately $37,000,000.
We made cash contributions to our company-sponsored pension plans of $95,776,000 and $92,670,000 in fiscal years 2009 and 2008, respectively, including voluntary contributions to the Retirement Plan of $80,000,000 and $80,000,000 in fiscal 2009 and fiscal 2008, respectively. Our minimum required contribution to the Retirement Plan for the calendar 2009 plan year is estimated at $95,000,000 to meet ERISA minimum funding requirements. Sysco will be required to pay quarterly contributions for the calendar 2010 plan year, the first installment of which must be made in fiscal 2010. We anticipate we will make $140,000,000 of contributions to the Retirement Plan in fiscal 2010. The estimated fiscal 2010 contributions to fund benefit payments for the SERP and other post-retirement plans together are approximately $19,817,000.
Income Taxes
The determination of our provision for income taxes requires significant judgment, the use of estimates and the interpretation and application of complex tax laws. Our provision for income taxes primarily reflects a combination of income earned and taxed in the various U.S. federal and state, as well as foreign jurisdictions. Jurisdictional tax law changes, increases or decreases in permanent differences between book and tax items, accruals or adjustments of accruals for unrecognized tax benefits or valuation allowances, and our change in the mix of earnings from these taxing jurisdictions all affect the overall effective tax rate.
Prior to fiscal 2008, in evaluating the exposures connected with the various tax filing positions, we established an accrual when, despite our belief that our tax return positions were supportable, we believed that certain positions may be successfully challenged and a loss was probable. When facts and circumstances changed, these accruals were adjusted. Beginning in fiscal 2008, we adopted a new accounting standard, which changed our accounting for uncertain tax positions. This accounting standard provides that a tax benefit from an uncertain tax position must be recognized when it is more likely than not that the position will be sustained upon examination, including resolutions of any related appeals or litigation processes, based on the technical merits of the position. The amount recognized is measured as the largest amount of tax benefit that has a greater than 50% likelihood of being realized upon settlement. (See discussion under Note 17, Income Taxes, in the Notes to Consolidated Financial Statements in Item 8).
Our liability for unrecognized tax benefits contains uncertainties because management is required to make assumptions and to apply judgment to estimate the exposures associated with our various filing positions. We believe that the judgments and estimates discussed herein are reasonable; however, actual results could differ, and we may be exposed to losses or gains that could be material. To the extent we prevail in matters for which a liability has been established, or pay amounts in excess of recorded liabilities, our effective income tax rate in a given financial statement period could be materially affected. An unfavorable tax settlement generally would require use of our cash and may result in an increase in our effective income tax rate in the period of resolution. A favorable tax settlement may be recognized as a reduction in our effective income tax rate in the period of resolution.
Vendor Consideration
We recognize consideration received from vendors when the services performed in connection with the monies received are completed and when the related product has been sold by Sysco. There are several types of cash consideration received from vendors. In many instances, the vendor consideration is in the form of a specified amount per case or per pound. In these instances, we will recognize the vendor consideration as a reduction of cost of sales when the product is sold. In the situations where the vendor consideration is not related directly to specific product purchases, we will recognize these as a reduction of cost of sales when the earnings process is complete, the related service is performed and the amounts realized. In certain of these latter instances, the vendor consideration represents a reimbursement of a specific incremental identifiable cost incurred by Sysco. In these cases, we classify the consideration as a reduction of those costs with any excess funds classified as a reduction of cost of sales and recognize these in the period in which the costs are incurred and related services performed.
29

Table of Contents
Goodwill and Intangible Assets
Goodwill and intangible assets represent the excess of consideration paid over the fair value of tangible net assets acquired. Certain assumptions and estimates are employed in determining the fair value of assets acquired, including goodwill and other intangible assets, as well as determining the allocation of goodwill to the appropriate reporting unit.
In addition, annually or more frequently as needed, we assess the recoverability of goodwill and indefinite-lived intangibles by determining whether the fair values of the applicable reporting units exceed the carrying values of these assets. The reporting units used in assessing goodwill impairment are our six operating segments as described in Note 20, Business Segment Information, to the Consolidated Financial Statements in Item 8. The components within each of our six operating segments have similar economic characteristics and therefore are aggregated into six reporting units.
We arrive at our estimates of fair value using a combination of discounted cash flow and earnings multiple models. The results from each of these models are then weighted and combined into a single estimate of fair value for each of our six operating segments. The primary assumptions used in these various models include estimated earnings multiples of comparable acquisitions in the industry including control premiums, earnings multiples on acquisitions completed by Sysco in the past, future cash flow estimates of the reporting units, which are dependent on internal forecasts and projected growth rates, and weighted average cost of capital, along with working capital and capital expenditure requirements. We update our projections used in our discounted cash flow model based on historical performance and changing business conditions for each of our reporting units.
Actual results could differ from these assumptions and projections, resulting in the company revising its assumptions and, if required, recognizing an impairment loss. There were no impairments of goodwill or indefinite-lived intangibles recorded in fiscal 2009, 2008 or 2007. Our past estimates of fair value for fiscal 2009, 2008 and 2007 have not been materially different when revised to include subsequent years’ actual results. Sysco has not made any material changes in its impairment assessment methodology during the past three fiscal years. We do not believe the estimates used in the analysis are reasonably likely to change materially in the future but we will continue to assess the estimates in the future based on the expectations of the reporting units. In fiscal 2009, the reporting units’ fair values would have had to have been lower by 16% compared to the fair values estimated in our impairment analysis before additional analysis would have been indicated to determine if an impairment existed for any of our reporting units.
The Other (specialty produce, custom-cut meat, lodging industry products and international distribution operations) operating segments have a greater proportion of goodwill recorded to estimated fair value as compared to the Broadline or SYGMA reporting units. This is primarily due to these businesses having been recently acquired, and as a result there has been less history of organic growth than in the Broadline and SYGMA segments. In addition, these businesses also have lower levels of cash flow than the Broadline segment. As such, these Other operating segments have a greater risk of future impairment if their operations were to suffer a significant downturn.
Share-Based Compensation
We provide compensation benefits to employees and non-employee directors under several share-based payment arrangements including various employee stock incentive plans, the Employees’ Stock Purchase Plan, the Management Incentive Plan and various non-employee director plans.
As of June 27, 2009, there was $63,746,000 of total unrecognized compensation cost related to share-based compensation arrangements. That cost is expected to be recognized over a weighted-average period of 2.97 years.
The fair value of each option award is estimated on the date of grant using a Black-Scholes option pricing model. Expected volatility is based on historical volatility of Sysco’s stock, implied volatilities from traded options on Sysco’s stock and other factors. We utilize historical data to estimate option exercise and employee termination behavior within the valuation model; separate groups of employees that have similar historical exercise behavior are considered separately for valuation purposes. Expected dividend yield is estimated based on the historical pattern of dividends and the average stock price for the year preceding the option grant. The risk-free rate for the expected term of the option is based on the U.S. Treasury yield curve in effect at the time of grant.
The fair value of the stock issued under the Employee Stock Purchase Plan is calculated as the difference between the stock price and the employee purchase price. The fair value of restricted stock granted to employees is based on the stock price on grant date. The application of a discount to the fair value of a restricted stock grant is dependent upon whether or not each individual grant contains a post-vesting restriction. The fair value of the stock issued under the Management Incentive Plans with respect to years prior to fiscal 2009 was based on the stock price on the last day of the fiscal year less a 12% discount for post-vesting restrictions. The discount for post-vesting restrictions was estimated based on restricted stock studies and by calculating the cost of a hypothetical protective put option over the restriction period. The stock award component of the Management Incentive Plan bonus awards was removed beginning in fiscal 2009.
30
Table of Contents
The compensation cost related to these share-based awards is recognized over the requisite service period. The requisite service period is generally the period during which an employee is required to provide service in exchange for the award.
The compensation cost related to stock issuances resulting from awards under the Management Incentive Plan through fiscal 2008 was accrued over the fiscal year to which the incentive bonus related. The compensation cost related to stock issuances resulting from employee purchases of stock under the Employees’ Stock Purchase Plan is recognized during the quarter in which the employee payroll withholdings are made.
Certain of our option awards are generally subject to graded vesting over a service period. In those cases, we will recognize compensation cost on a straight-line basis over the requisite service period for the entire award. In other cases, certain of our option awards provide for graded vesting over a service period but include a performance-based provision allowing for the vesting to accelerate. In these cases, if it is probable that the performance condition will be met, we recognize compensation cost on a straight-line basis over the shorter performance period; otherwise, we recognize compensation cost over the probable longer service period.
In addition, certain of our options provide that if the optionee retires at certain age and years of service thresholds, the options continue to vest as if the optionee continued to be an employee or director. In these cases, for awards granted prior to July 2, 2005 (our adoption date for the fair value recognition provisions in current stock compensation accounting standards), we will recognize the compensation cost for such awards over the remaining service period and accelerate any remaining unrecognized compensation cost when the employee retires. For awards granted subsequent to July 3, 2005, we will recognize compensation cost for such awards over the period from the date of grant to the date the employee first becomes eligible to retire with his options continuing to vest after retirement.
Our option grants include options that qualify as incentive stock options for income tax purposes. In the period the compensation cost related to incentive stock options is recorded, a corresponding tax benefit is not recorded as it is assumed that we will not receive a tax deduction related to such incentive stock options. We may be eligible for tax deductions in subsequent periods to the extent that there is a disqualifying disposition of the incentive stock option. In such cases, we would record a tax benefit related to the tax deduction in an amount not to exceed the corresponding cumulative compensation cost recorded in the financial statements on the particular options multiplied by the statutory tax rate.
Accounting Changes
SFAS 165 Adoption
In May 2009, the FASB issued SFAS No. 165, “Subsequent Events” ( SFAS 165), which establish general standards of accounting for and disclosure of events that occur after the balance sheet date but before financial statements are issued or are available to be issued. Specifically, the standard sets forth the period after the balance sheet date during which management should evaluate events or transactions that may occur for potential recognition or disclosure in the financial statements, the circumstances under which an entity should recognize events or transactions occurring after the balance sheet date in its financial statements, and the disclosures that an entity should make about events or transactions that occurred after the balance sheet date. This standard became effective for Sysco for its fiscal year ending June 27, 2009. We have included the required disclosures for this standard in Note 1 to the Consolidated Financial Statements in Item 8.
SFAS 161 Adoption
As of the third quarter of fiscal 2009, SFAS No. 161, “Disclosure about Derivative Instruments and Hedging Activities, an amendment of FASB Statement No. 133” (SFAS 161) became effective for Sysco. SFAS 161 requires enhanced disclosures about an entity’s derivative and hedging activities and thereby improves the transparency of financial reporting. The company has determined that no additional disclosures were necessary upon adoption but will continue to assess the need for additional disclosures in future periods.
SFAS 157 Adoption
As of June 29, 2008, Sysco adopted the provisions of FASB Statement No. 157, “ Fair Value Measurements” (SFAS 157), for financial assets and liabilities carried at fair value and non-financial assets and liabilities that are recognized or disclosed at fair value on a recurring basis. SFAS 157 establishes a common definition for fair value under generally accepted accounting principles, establishes a framework for measuring fair value and expands disclosure requirements about such fair value measurements. The adoption of SFAS 157 for financial assets and liabilities carried at fair value and non-financial assets and liabilities that are recognized or disclosed at fair value on a recurring basis did not have a material impact on the company’s financial statements. See also the discussion of FASB Staff Position 157-2, “Effective Date of FASB Statement No. 157,” under New Accounting Standards below.
31
Table of Contents
FIN 48 Adoption
As of July 1, 2007, we adopted FASB Interpretation No. 48, “Accounting for Uncertainty in Income Taxes – an Interpretation of FASB Statement No. 109” (FIN 48), which clarifies the accounting for uncertainty in income taxes recognized in accordance with SFAS No. 109, “Accounting for Income Taxes” (SFAS 109). FIN 48 clarifies the application of SFAS 109 by defining criteria that an individual tax position must meet for any part of the benefit of that position to be recognized in the financial statements. Additionally, FIN 48 provides guidance on the measurement, derecognition, classification and disclosure of tax positions, along with accounting for the related interest and penalties. As a result of this adoption, we recognized, as a cumulative effect of change in accounting principle, a $91,635,000 decrease in our beginning retained earnings on our July 1, 2007 balance sheet.
SFAS 158
In September 2006, the FASB issued SFAS No. 158, “Employers’ Accounting for Defined Benefit Pension and Other Postretirement Plans – an amendment of FASB Statements No. 87, 88, 106, and 132(R)” (SFAS 158). SFAS 158 has two major provisions: the recognition and disclosure provision and the measurement date provision. We previously adopted SFAS 158’s recognition and disclosure requirements as of June 30, 2007. The measurement date provision requires an employer to measure a plan’s assets and obligations as of the end of the employer’s fiscal year. We elected to early adopt the measurement date provision as of June 30, 2007 in order to adopt both provisions of this accounting standard at the same time. As a result, beginning in fiscal 2008, the measurement date for all plans returned to correspond with fiscal year-end. We performed measurements as of May 31, 2007 and June 30, 2007 of the plan assets and benefit obligations. We recorded a charge to beginning retained earnings on July 1, 2007 of $3,572,000, net of tax, for the impact of the difference in our company-sponsored pension expense between the two measurement dates. We also recorded a benefit to beginning accumulated other comprehensive income (loss) on July 1, 2007 of $22,780,000, net of tax, for the impact of the difference in the recognition provision between the two measurement dates.
New Accounting Standards
SFAS 141(R)
In December 2007, the FASB issued SFAS No. 141(R), “Business Combinations” (SFAS 141(R)), which establishes principles and requirements for how an acquirer recognizes and measures in its financial statements the identifiable assets acquired, the liabilities assumed and any noncontrolling interest in a business combination. This statement also establishes recognition and measurement principles for the goodwill acquired in a business combination and disclosure requirements to enable financial statement users to evaluate the nature and financial effects of the business combination. We will apply this statement primarily on a prospective basis for business combinations beginning in fiscal 2010. Earlier application of the standard was prohibited.
FSP 157-2
In February 2008, the FASB issued FASB Staff Position 157-2, “Effective Date of FASB Statement No. 157” (FSP 157-2), which partially deferred the effective date of SFAS No. 157 for one year for non-financial assets and liabilities that are recognized or disclosed at fair value in the financial statements on a non-recurring basis. As a result of the deferral, SFAS 157 is effective in fiscal 2010 for non-recurring, non-financial assets and liabilities that are recognized or disclosed at fair value. Our only non-recurring, non-financial asset fair value measurements are those used in our annual test of recoverability of goodwill and indefinite-lived intangibles, in which we determine whether estimated fair values of our applicable reporting units exceed their carrying values. We will apply the provisions of SFAS 157 in fiscal 2010 to this fair value estimation.
FSP EITF 03-06-1
In June 2008, the FASB issued FASB Staff Position No. EITF 03-06-1, “Determining Whether Instruments Granted in Share-Based Payment Transactions Are Participating Securities” (FSP EITF 03-06-1). FSP EITF 03-06-1 addresses whether instruments granted in share-based payment transactions are participating securities prior to vesting and, therefore, need to be included in the earnings allocation in computing earnings per share under the two-class method described in FASB Statement No. 128, “Earnings per Share.” This standard will be effective for Sysco beginning in fiscal 2010 and interim periods within that year. All prior-period earnings per share data presented in filings subsequent to adoption must be adjusted retrospectively to conform with the provisions of this standard. Early application of FSP EITF 03-06-1 was not permitted. We are currently evaluating the impact the adoption of FSP EITF 03-06-1 will have on our consolidated financial statements.
32

Table of Contents
FSP FAS 132(R)-1
In December 2008, the FASB issued FASB Staff Position No. FAS 132(R)-1, “Employers’ Disclosures about Postretirement Benefit Plan Assets” (FSP FAS 132(R)-1). FSP FAS 132(R)-1 amends SFAS No. 132(R), “Employers’ Disclosures about Pensions and Other Postretirement Benefits,” to require additional disclosures about assets held in an employer’s defined benefit pension or other postretirement plan. This standard will be effective for Sysco in fiscal 2010, although early application of the standard is permitted. Upon initial application, the information required by FSP FAS 132(R)-1 is not required for earlier periods that are presented for comparative purposes. We will adopt this standard in fiscal 2010 and are currently evaluating the impact the adoption of FSP FAS 132(R)-1 will have on our annual financial statement disclosures.
FSP FAS 141(R)-1
In April 2009, the FASB issued FASB Staff Position No. FAS 141(R)-1, “Accounting for Assets and Liabilities Assumed in a Business Combination That Arise From Contingencies” (FSP FAS 141(R)-1). FSP FAS 141(R)-1 amends and clarifies SFAS No. 141(R), “Business Combinations,” to address application issues raised by preparers, auditors, and members of the legal profession on initial recognition and measurement, subsequent measurement and accounting, and disclosure of assets and liabilities arising from contingencies in a business combination. We will apply this standard on a prospective basis for business combinations beginning in fiscal 2010.
FSP FAS 107-1 and APB 28-1
In April 2009, the FASB issued FASB Staff Position No. FAS 107-1 and APB 28-1, “Interim Disclosures about Fair Value of Financial Instruments” (FSP FAS 107-1 and APB 28-1). FSP FAS 107-1 and APB 28-1 amend FASB Statement No. 107, “Disclosures about Fair Value of Financial Instruments,” and APB Opinion No. 28, “Interim Financial Reporting,” to require disclosures about the fair value of financial instruments for interim reporting periods of publicly traded companies. Prior disclosure requirements only applied to annual financial statements. This standard is effective for interim reporting periods ending after June 15, 2009, which is the first quarter of fiscal 2010 for Sysco. We will provide the disclosures about the fair value of financial instruments required by FSP FAS 107-1 and APB 28-1 in our interim financial statement disclosures beginning in fiscal 2010.
Forward-Looking Statements
Certain statements made herein that look forward in time or express management’s expectations or beliefs with respect to the occurrence of future events are forward-looking statements under the Private Securities Litigation Reform Act of 1995. They include statements about Sysco’s ability to increase its sales and market share and grow earnings, the continuing impact of economic conditions on consumer confidence and our business, sales and expense trends, anticipated multi-employer pension related liabilities and contributions to various multi-employer pension plans, the estimated impact of the IRS settlement, the impact of ongoing legal proceedings, the loss of SYGMA’s largest customer not having a material adverse effect on Sysco as a whole, compliance with laws and government regulations not having a material effect on our capital expenditures, earnings or competitive position, anticipated capital expenditures and the sources of financing for those capital expenditures, continued competitive advantages and positive results from strategic initiatives, anticipated company-sponsored pension plan liabilities, the availability and adequacy of insurance to cover liabilities, the impact of future adoption of accounting pronouncements, predictions regarding the impact of changes in estimates used in impairment analyses, the anticipated impact of changes in foreign currency exchange rates and Sysco’s ability to meet future cash requirements and remain profitable.
These statements are based on management’s current expectations and estimates; actual results may differ materially due in part to the risk factors discussed at Item 1.A. above and elsewhere. In addition, the success of Sysco’s strategic initiatives could be affected by conditions in the economy and the industry and internal factors such as the ability to control expenses, including fuel costs. Company-sponsored pension plan liabilities are impacted by a number of factors including the discount rate for determining the current value of plan benefits, the assumption for the rate of increase in future compensation levels and the expected rate of return on plan assets. Legal proceedings are impacted by events, circumstances and individuals beyond the control of Sysco. The need for additional borrowing or other capital is impacted by factors that include capital expenditures or acquisitions in excess of those currently anticipated, stock repurchases at historical levels, or other unexpected cash requirements. The diluted earnings per share impact of the settlement is impacted by share repurchases and the number of anti-dilutive stock options excluded from the diluted shares calculation. The diluted earnings per share impact of the IRS settlement is impacted by share repurchases and the number of anti-dilutive stock options excluded from the diluted shares calculation. Predictions regarding the future adoption of accounting pronouncements involve estimates without the benefit of precedent, and if our estimates turn out to be materially incorrect, our assessment of the impact of the pronouncement could prove incorrect, as well. The anticipated impact of compliance with laws and regulations also involves the risk that estimates may turn out to be materially incorrect, and laws and regulations, as well as methods of enforcement, are subject to change.
33

Table of Contents
Interest Rate Risk
We do not utilize financial instruments for trading purposes. Our use of debt directly exposes us to interest rate risk. Floating rate debt, where the interest rate fluctuates periodically, exposes us to short-term changes in market interest rates. Fixed rate debt, where the interest rate is fixed over the life of the instrument, exposes us to changes in market interest rates reflected in the fair value of the debt and to the risk that we may need to refinance maturing debt with new debt at higher rates.
We manage our debt portfolio to achieve an overall desired position of fixed and floating rates and may employ interest rate swaps as a tool to achieve that goal. The major risks from interest rate derivatives include changes in the interest rates affecting the fair value of such instruments, potential increases in interest expense due to market increases in floating interest rates and the creditworthiness of the counterparties in such transactions.
Fiscal 2009
As of June 27, 2009, we had no commercial paper outstanding. Our long-term debt obligations as of June 27, 2009 were $2,476,649,000, of which approximately 99% were at fixed rates of interest. We had no interest rate swaps outstanding as of June 27, 2009.
The following table presents our interest rate position as of June 27, 2009. All amounts are stated in U.S. dollar equivalents.
Fiscal 2008
As of June 28, 2008, we had no commercial paper outstanding. Our long-term debt obligations as of June 28, 2008 were $1,980,331,000, of which approximately 99% were at fixed rates of interest. We had no interest rate swaps outstanding as of June 28, 2008.
The following table presents our interest rate position as of June 28, 2008. All amounts are stated in U.S. dollar equivalents.
Foreign Currency Exchange Rate Risk
The majority of our foreign subsidiaries use their local currency as their functional currency. To the extent that business transactions are not denominated in a foreign subsidiary’s functional currency, we are exposed to foreign currency exchange rate risk. We will also incur gains and losses within our shareholders’ equity due to the translation of our financial statements from foreign currencies into U.S. dollars. Our income statement trends may be impacted by the translation of the income statements
34
Item 7A. Quantitative and Qualitative Disclosures About Market Risk
Interest Rate Position as of June 27, 2009 Principal Amount by Expected Maturity Average Interest Rate 2010 2011 2012 2013 2014 Thereafter Total Fair Value (In thousands) U.S. $ Denominated: Fixed Rate Debt $ 6,311 $ 5,073 $ 203,428 $ 251,583 $ 206,097 $ 1,765,629 $ 2,438,121 $ 2,509,602
Average Interest Rate 4.3 % 4.5 % 6.1 % 4.3 % 4.1 % 5.8 % 5.5 % Floating Rate Debt $ — $ — $ — $ — $ — $ 13,600 $ 13,600 $ 13,600
Average Interest Rate — — — — — 1.3 % 1.2 % Canadian $ Denominated: Fixed Rate Debt $ 659 $ 652 $ 738 $ 731 $ 790 $ 18,020 $ 21,590 $ 22,223
Average Interest Rate 8.1 % 8.4 % 8.6 % 9.6 % 9.8 % 9.8 % 9.7 % Euro € Denominated: Fixed Rate Debt $ 2,193 $ 921 $ 224 $ — $ — $ — $ 3,338 $ 3,436
Average Interest Rate 7.7 % 7.7 % 7.7 % — — — 7.7 %
Interest Rate Position as of June 28, 2008 Principal Amount by Expected Maturity Average Interest Rate 2009 2010 2011 2012 2013 Thereafter Total Fair Value (In thousands) U.S. $ Denominated: Fixed Rate Debt $ 4,437 $ 3,366 $ 2,318 $ 201,205 $ 251,055 $ 1,478,309 $ 1,940,690 $ 1,889,602
Average Interest Rate 3.7 % 3.8 % 4.2 % 6.1 % 4.3 % 5.5 % 5.4 % Floating Rate Debt $ — $ — $ — $ — $ — $ 15,000 $ 15,000 $ 15,000
Average Interest Rate — — — — — 2.2 % 2.2 % Canadian $ Denominated: Fixed Rate Debt $ 459 $ 506 $ 637 $ 744 $ 818 $ 21,477 $ 24,641 $ 23,992
Average Interest Rate 9.8 % 9.8 % 9.8 % 9.8 % 9.8 % 9.8 % 9.8 %
Table of Contents
of our foreign subsidiaries into U.S. dollars. The changes in the exchange rates used to translate our foreign sales into U.S. dollars negatively impacted sales by 1.2% in fiscal 2009 compared to fiscal 2008 and increased sales 1.0% in fiscal 2008 compared to fiscal 2007. The impact to our operating income, net earnings and earnings per share was not material in fiscal 2009 and fiscal 2008. A 10% unfavorable change in the fiscal 2009 year-end exchange rate and the resulting impact on our financial statements would have negatively impacted fiscal 2009 sales by an additional 0.8% and would not have materially impacted our operating income, net earnings and earnings per share. We do not routinely enter into material agreements to hedge foreign currency exchange rate risks.
Our Canadian financing subsidiary has the U.S. dollar as its functional currency and has notes denominated in U.S. dollars. We have the potential to create taxable income in Canada when this debt is paid due to changes in the exchange rate from the inception of the debt through the payment date. A 10% unfavorable change in the fiscal 2009 year-end exchange rate and the resulting increase in the tax liability associated with these notes would not have a material impact on our results of operations.
Fuel Price Risk
The price and availability of diesel fuel fluctuates due to changes in production, seasonality and other market factors generally outside of our control. Increased fuel costs may have a negative impact on our results of operations in three areas. First, the high cost of fuel can negatively impact consumer confidence and discretionary spending and thus reduce the frequency and amount spent by consumers for food prepared away from home. Second, the high cost of fuel can increase the price we pay for product purchases and we may not be able to pass these costs fully to our customers. Third, increased fuel costs impact the costs we incur to deliver product to our customers. During fiscal 2009, 2008 and 2007, fuel costs related to outbound deliveries represented approximately 0.8%, 0.7% and 0.6% of sales, respectively. Fuel costs, excluding any amounts recovered through fuel surcharges, incurred by Sysco increased by approximately $33,154,000 in fiscal 2009 over fiscal 2008 and $34,023,000 in fiscal 2008 over fiscal 2007.
From time to time, we will enter into forward purchase commitments for a portion of our projected monthly diesel fuel requirements. As of June 27, 2009, we had forward diesel fuel commitments totaling approximately $64,000,000 through March 2010. In July 2009, we entered additional forward purchase commitments totaling approximately $16,000,000 at a fixed price through June 2010. Together, these contracts will lock in the price of approximately 40% of our fuel purchase needs for fiscal 2010. Our commitments through August 2009 were entered into at prevailing rates from mid-July through mid-August 2008. As a result, these contracts are at fixed prices greater than both the prices incurred during same periods in the previous fiscal year and current market prices. The remainder of our outstanding contracts were entered into at the prevailing rates in March, April and July 2009 and thus the fixed price on these contracts reflects the lower current market price for diesel.
Fuel costs in fiscal 2010, exclusive of any amounts recovered through fuel surcharges, are expected to decrease by approximately $50,000,000 to $80,000,000 as compared to fiscal 2009. Our estimate is based upon the prevailing market prices for diesel in mid-August 2009, the cost committed to in our forward fuel purchase agreements currently in place for fiscal 2010 and estimates of fuel consumption. Actual fuel costs could vary from our estimates if any of these assumptions change, in particular if future fuel prices vary significantly from our current estimates. A 10% unfavorable change in diesel prices from the market price used in our estimates above would change the range of potential decrease to $40,000,000 to $70,000,000.
Investment Risk
Sysco invests in corporate-owned life insurance policies in order to fund certain retirement programs which are subject to market risk. The value of our investments in corporate-owned life insurance policies is largely based on the values of underlying investments, which include publicly traded securities. Therefore, the value of these policies will be adjusted each period based on the performance of the underlying securities which could result in volatility in our earnings. Due to the declines in the financial markets in fiscal 2009 and fiscal 2008, we have experienced significant losses in adjusting the carrying value of these policies to their cash surrender values in these periods. Should the financial markets decline, we would take charges to adjust the carrying value of our corporate-owned life insurance, and if the market declines are significant, these charges could reasonably be expected to have a material adverse impact on our operating expenses, net income and earnings per share. A 10% unfavorable change in publicly traded securities held within our investments in corporate-owned life insurance would not have a material impact on our operating expenses, net income and earnings per share.
Our company-sponsored qualified pension plan (Retirement Plan) holds investments in both equity and fixed income securities. The amount of our annual contribution to the plan is dependent upon, among other things, the return on the plan’s assets and discount rates used to calculate the plan’s liability. As a result of the declines in the financial markets in fiscal 2009, the value of the investments held by the Retirement Plan declined as of June 27, 2009 as compared to June 28, 2008. These fluctuations in asset values have caused the amount of our anticipated future contributions to the plan to increase, have caused pension expense for fiscal 2010 to increase and have resulted in a reduction to shareholders’ equity on our balance sheet as of June 27, 2009, which is when this plan’s funded status was last measured. Also, the projected liability of the plan will be impacted by the fluctuations of interest rates on high quality bonds in the public markets. Specifically, decreases in these interest rates may have a material impact on our results of operations. To the extent the financial markets experience further
35

Table of Contents
declines, our anticipated future contributions, pension expense and funded status will be affected for future years as well. A 10% unfavorable change in the value of the investments held by our company-sponsored Retirement Plan at the plan’s fiscal year end (December 31, 2008) would not have a material impact on our anticipated future contributions for fiscal 2010; however, this unfavorable change would increase our pension expense for fiscal 2010 by $23,700,000 and would reduce our shareholders’ equity on our balance sheet as of June 27, 2009 by $76,630,000.
36
Table of Contents
SYSCO CORPORATION AND SUBSIDIARIES
INDEX TO CONSOLIDATED FINANCIAL STATEMENTS
All schedules are omitted because they are not applicable or the information is set forth in the consolidated financial statements or notes thereto.
37
Item 8. Financial Statements and Supplementary Data
Page Consolidated Financial Statements:
Report of Management on Internal Control Over Financial Reporting 38 Report of Independent Registered Public Accounting Firm on Internal Control Over Financial Reporting 39 Report of Independent Registered Public Accounting Firm on Consolidated Financial Statements 40 Consolidated Balance Sheets 41 Consolidated Results of Operations 42 Consolidated Shareholders’ Equity 43 Consolidated Cash Flows 44 Notes to Consolidated Financial Statements 45
Table of Contents
REPORT OF MANAGEMENT ON INTERNAL CONTROL OVER FINAN CIAL REPORTING
The management of Sysco Corporation (“Sysco”) is responsible for establishing and maintaining adequate internal control over financial reporting for the company. Sysco’s internal control system is designed to provide reasonable assurance regarding the reliability of financial reporting and the preparation and fair presentation of published financial statements. All internal control systems, no matter how well designed, have inherent limitations. Therefore, even those systems determined to be effective can provide only reasonable assurance with respect to financial statement preparation and presentation.
Sysco’s management assessed the effectiveness of Sysco’s internal control over financial reporting as of June 27, 2009. In making this assessment, it used the criteria set forth by the Committee of Sponsoring Organizations of the Treadway Commission in Internal Control — Integrated Framework. Based on this assessment, management concluded that, as of June 27, 2009, Sysco’s internal control over financial reporting was effective based on those criteria.
Ernst & Young LLP has issued an audit report on the effectiveness of Sysco’s internal control over financial reporting as of June 27, 2009.
38

Table of Contents
REPORT OF INDEPENDENT REGISTERED PUBLIC ACCOUNTING FIRM ON INTERNAL CONTROL OVER FINANCIAL REPORTING
To the Board of Directors and Shareholders Sysco Corporation
We have audited Sysco Corporation (a Delaware Corporation) and its subsidiaries’ (the “Company”) internal control over financial reporting as of June 27, 2009, based on criteria established in Internal Control—Integrated Framework issued by the Committee of Sponsoring Organizations of the Treadway Commission (the COSO criteria). Sysco Corporation’s management is responsible for maintaining effective internal control over financial reporting, and for its assessment of the effectiveness of internal control over financial reporting, included in the accompanying Report of Management on Internal Control Over Financial Reporting. Our responsibility is to express an opinion on the Company’s internal control over financial reporting based on our audit.
We conducted our audit in accordance with the standards of the Public Company Accounting Oversight Board (United States). Those standards require that we plan and perform the audit to obtain reasonable assurance about whether effective internal control over financial reporting was maintained in all material respects. Our audit included obtaining an understanding of internal control over financial reporting, assessing the risk that a material weakness exists, testing and evaluating the design and operating effectiveness of internal control based on the assessed risk, and performing such other procedures as we considered necessary in the circumstances. We believe that our audit provides a reasonable basis for our opinion.
A company’s internal control over financial reporting is a process designed to provide reasonable assurance regarding the reliability of financial reporting and the preparation of financial statements for external purposes in accordance with generally accepted accounting principles. A company’s internal control over financial reporting includes those policies and procedures that (1) pertain to the maintenance of records that, in reasonable detail, accurately and fairly reflect the transactions and dispositions of the assets of the company; (2) provide reasonable assurance that transactions are recorded as necessary to permit preparation of financial statements in accordance with generally accepted accounting principles, and that receipts and expenditures of the company are being made only in accordance with authorizations of management and directors of the company; and (3) provide reasonable assurance regarding prevention or timely detection of unauthorized acquisition, use or disposition of the company’s assets that could have a material effect on the financial statements.
Because of its inherent limitations, internal control over financial reporting may not prevent or detect misstatements. Also, projections of any evaluation of effectiveness to future periods are subject to the risk that controls may become inadequate because of changes in conditions, or that the degree of compliance with the policies or procedures may deteriorate.
In our opinion, Sysco Corporation and its subsidiaries maintained, in all material respects, effective internal control over financial reporting as of June 27, 2009, based on the COSO criteria.
We also have audited, in accordance with the standards of the Public Company Accounting Oversight Board (United States), the consolidated balance sheets as of June 27, 2009 and June 28, 2008 and the related consolidated results of operations, shareholders’ equity and cash flows for each of the three years in the period ended June 27, 2009 of Sysco Corporation and its subsidiaries and our report dated August 25, 2009 expressed an unqualified opinion thereon.
Houston, Texas August 25, 2009
39
/s/ Ernst & Young LLP
Table of Contents
REPORT OF INDEPENDENT REGISTERED PUBLIC ACCOUNTING FIRM ON CONSOLIDATED FINANCIAL STATEMENTS
To the Board of Directors and Shareholders Sysco Corporation
We have audited the accompanying consolidated balance sheets of Sysco Corporation (a Delaware Corporation) and subsidiaries (the “Company”) as of June 27, 2009 and June 28, 2008, and the related consolidated results of operations, shareholders’ equity, and cash flows for each of the three years in the period ended June 27, 2009. These financial statements are the responsibility of the Company’s management. Our responsibility is to express an opinion on these financial statements based on our audits.
We conducted our audits in accordance with the standards of the Public Company Accounting Oversight Board (United States). Those standards require that we plan and perform the audit to obtain reasonable assurance about whether the financial statements are free of material misstatement. An audit includes examining, on a test basis, evidence supporting the amounts and disclosures in the financial statements. An audit also includes assessing the accounting principles used and significant estimates made by management, as well as evaluating the overall financial statement presentation. We believe that our audits provide a reasonable basis for our opinion.
In our opinion, the financial statements referred to above present fairly, in all material respects, the consolidated financial position of the Company at June 27, 2009 and June 28, 2008, and the consolidated results of their operations and their cash flows for each of the three years in the period ended June 27, 2009, in conformity with U.S. generally accepted accounting principles.
As discussed in Note 2 to the consolidated financial statements, the Company adopted the recognition and disclosure provisions, effective June 30, 2007, and the change in measurement date provision, effective July 1, 2007, of Statement of Financial Accounting Standard (SFAS) No. 158, “Employers’ Accounting for Defined Benefit Pension and Other Postretirement Plans – an amendment of FASB Statements No. 87, 88, 106, and 132(R)”. Also, discussed in Note 2 to the consolidated financial statements, effective July 1, 2007, Sysco Corporation adopted FASB Interpretation No. 48, “Accounting for Uncertainty in Income Taxes — an Interpretation of FASB Statement No. 109” (FIN 48), which clarifies the accounting for uncertainty in income taxes recognized in accordance with SFAS No. 109, “Accounting for Income Taxes” (SFAS 109).
We also have audited, in accordance with the standards of the Public Company Accounting Oversight Board (United States), Sysco Corporation and its subsidiaries’ internal control over financial reporting as of June 27, 2009, based on criteria established in Internal Control-Integrated Framework issued by the Committee of Sponsoring Organizations of the Treadway Commission and our report dated August 25, 2009 expressed an unqualified opinion thereon.
Houston, Texas August 25, 2009
40
/s/ Ernst & Young LLP
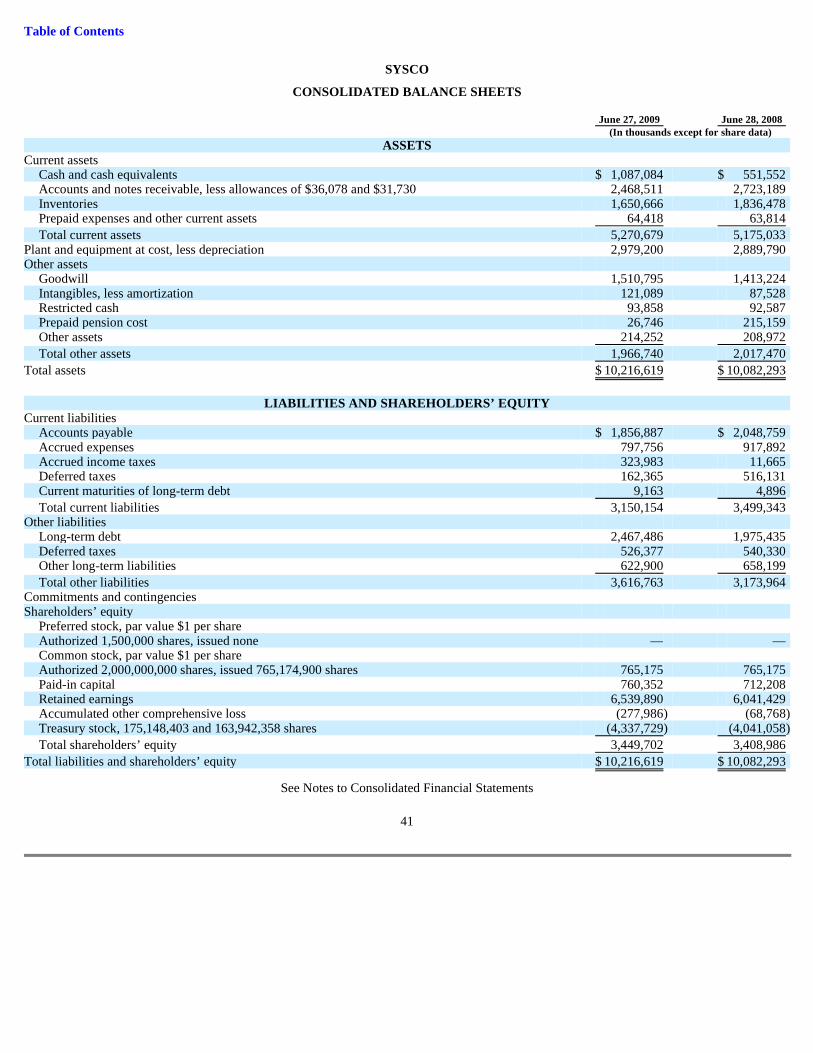
Table of Contents
SYSCO
CONSOLIDATED BALANCE SHEETS
See Notes to Consolidated Financial Statements
41
June 27, 2009 June 28, 2008 (In thousands except for share data)
ASSETS Current assets
Cash and cash equivalents $ 1,087,084 $ 551,552 Accounts and notes receivable, less allowances of $36,078 and $31,730 2,468,511 2,723,189 Inventories 1,650,666 1,836,478 Prepaid expenses and other current assets 64,418 63,814
Total current assets 5,270,679 5,175,033 Plant and equipment at cost, less depreciation 2,979,200 2,889,790 Other assets
Goodwill 1,510,795 1,413,224 Intangibles, less amortization 121,089 87,528 Restricted cash 93,858 92,587 Prepaid pension cost 26,746 215,159 Other assets 214,252 208,972
Total other assets 1,966,740 2,017,470
Total assets $ 10,216,619 $ 10,082,293
LIABILITIES AND SHAREHOLDERS ’ EQUITY
Current liabilities Accounts payable $ 1,856,887 $ 2,048,759 Accrued expenses 797,756 917,892 Accrued income taxes 323,983 11,665 Deferred taxes 162,365 516,131 Current maturities of long-term debt 9,163 4,896
Total current liabilities 3,150,154 3,499,343 Other liabilities
Long-term debt 2,467,486 1,975,435 Deferred taxes 526,377 540,330 Other long-term liabilities 622,900 658,199
Total other liabilities 3,616,763 3,173,964 Commitments and contingencies Shareholders’ equity
Preferred stock, par value $1 per share Authorized 1,500,000 shares, issued none — — Common stock, par value $1 per share Authorized 2,000,000,000 shares, issued 765,174,900 shares 765,175 765,175 Paid-in capital 760,352 712,208 Retained earnings 6,539,890 6,041,429 Accumulated other comprehensive loss (277,986 ) (68,768 ) Treasury stock, 175,148,403 and 163,942,358 shares (4,337,729 ) (4,041,058 )
Total shareholders’ equity 3,449,702 3,408,986
Total liabilities and shareholders’ equity $ 10,216,619 $ 10,082,293
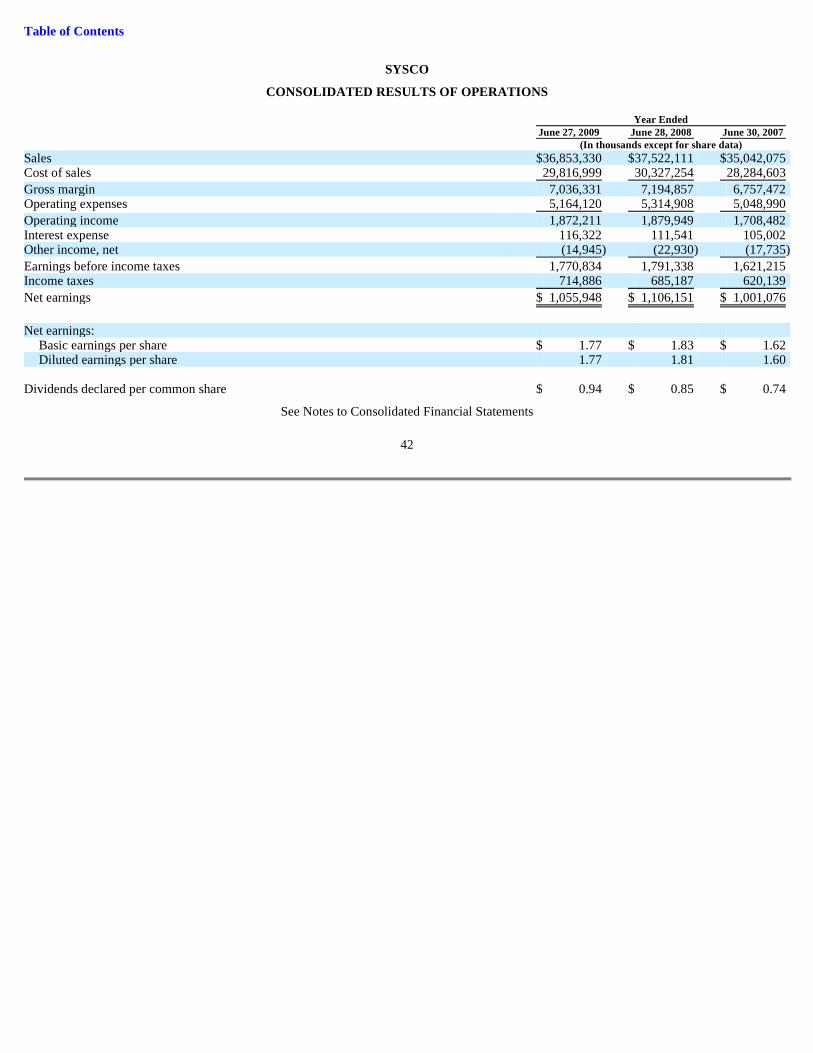
Table of Contents
SYSCO
CONSOLIDATED RESULTS OF OPERATIONS
See Notes to Consolidated Financial Statements
42
Year Ended June 27, 2009 June 28, 2008 June 30, 2007 (In thousands except for share data) Sales $ 36,853,330 $ 37,522,111 $ 35,042,075 Cost of sales 29,816,999 30,327,254 28,284,603
Gross margin 7,036,331 7,194,857 6,757,472 Operating expenses 5,164,120 5,314,908 5,048,990
Operating income 1,872,211 1,879,949 1,708,482 Interest expense 116,322 111,541 105,002 Other income, net (14,945 ) (22,930 ) (17,735 )
Earnings before income taxes 1,770,834 1,791,338 1,621,215 Income taxes 714,886 685,187 620,139
Net earnings $ 1,055,948 $ 1,106,151 $ 1,001,076
Net earnings:
Basic earnings per share $ 1.77 $ 1.83 $ 1.62 Diluted earnings per share 1.77 1.81 1.60
Dividends declared per common share $ 0.94 $ 0.85 $ 0.74
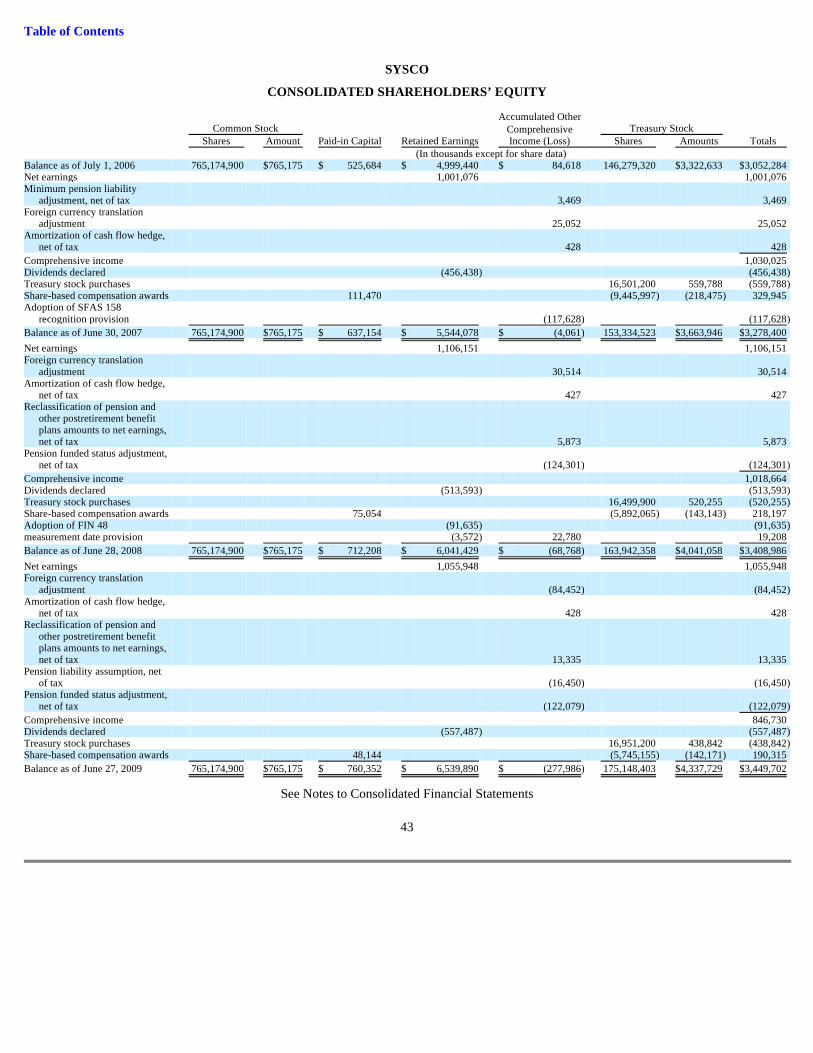
Table of Contents
SYSCO
CONSOLIDATED SHAREHOLDERS’ EQUITY
See Notes to Consolidated Financial Statements
43
Accumulated Other Common Stock Comprehensive Treasury Stock Shares Amount Paid-in Capital Retained Earnings Income (Loss) Shares Amounts Totals (In thousands except for share data) Balance as of July 1, 2006 765,174,900 $ 765,175 $ 525,684 $ 4,999,440 $ 84,618 146,279,320 $ 3,322,633 $ 3,052,284 Net earnings 1,001,076 1,001,076 Minimum pension liability
adjustment, net of tax 3,469 3,469 Foreign currency translation
adjustment 25,052 25,052 Amortization of cash flow hedge,
net of tax 428 428
Comprehensive income 1,030,025 Dividends declared (456,438 ) (456,438 ) Treasury stock purchases 16,501,200 559,788 (559,788 ) Share-based compensation awards 111,470 (9,445,997 ) (218,475 ) 329,945 Adoption of SFAS 158
recognition provision (117,628 ) (117,628 )
Balance as of June 30, 2007 765,174,900 $ 765,175 $ 637,154 $ 5,544,078 $ (4,061 ) 153,334,523 $ 3,663,946 $ 3,278,400
Net earnings 1,106,151 1,106,151 Foreign currency translation
adjustment 30,514 30,514 Amortization of cash flow hedge,
net of tax 427 427 Reclassification of pension and
other postretirement benefit plans amounts to net earnings, net of tax 5,873 5,873
Pension funded status adjustment, net of tax (124,301 ) (124,301 )
Comprehensive income 1,018,664 Dividends declared (513,593 ) (513,593 ) Treasury stock purchases 16,499,900 520,255 (520,255 ) Share-based compensation awards 75,054 (5,892,065 ) (143,143 ) 218,197 Adoption of FIN 48 (91,635 ) (91,635 ) measurement date provision (3,572 ) 22,780 19,208
Balance as of June 28, 2008 765,174,900 $ 765,175 $ 712,208 $ 6,041,429 $ (68,768 ) 163,942,358 $ 4,041,058 $ 3,408,986
Net earnings 1,055,948 1,055,948 Foreign currency translation
adjustment (84,452 ) (84,452 ) Amortization of cash flow hedge,
net of tax 428 428 Reclassification of pension and
other postretirement benefit plans amounts to net earnings, net of tax 13,335 13,335
Pension liability assumption, net of tax (16,450 ) (16,450 )
Pension funded status adjustment, net of tax (122,079 ) (122,079 )
Comprehensive income 846,730 Dividends declared (557,487 ) (557,487 ) Treasury stock purchases 16,951,200 438,842 (438,842 ) Share-based compensation awards 48,144 (5,745,155 ) (142,171 ) 190,315
Balance as of June 27, 2009 765,174,900 $ 765,175 $ 760,352 $ 6,539,890 $ (277,986 ) 175,148,403 $ 4,337,729 $ 3,449,702
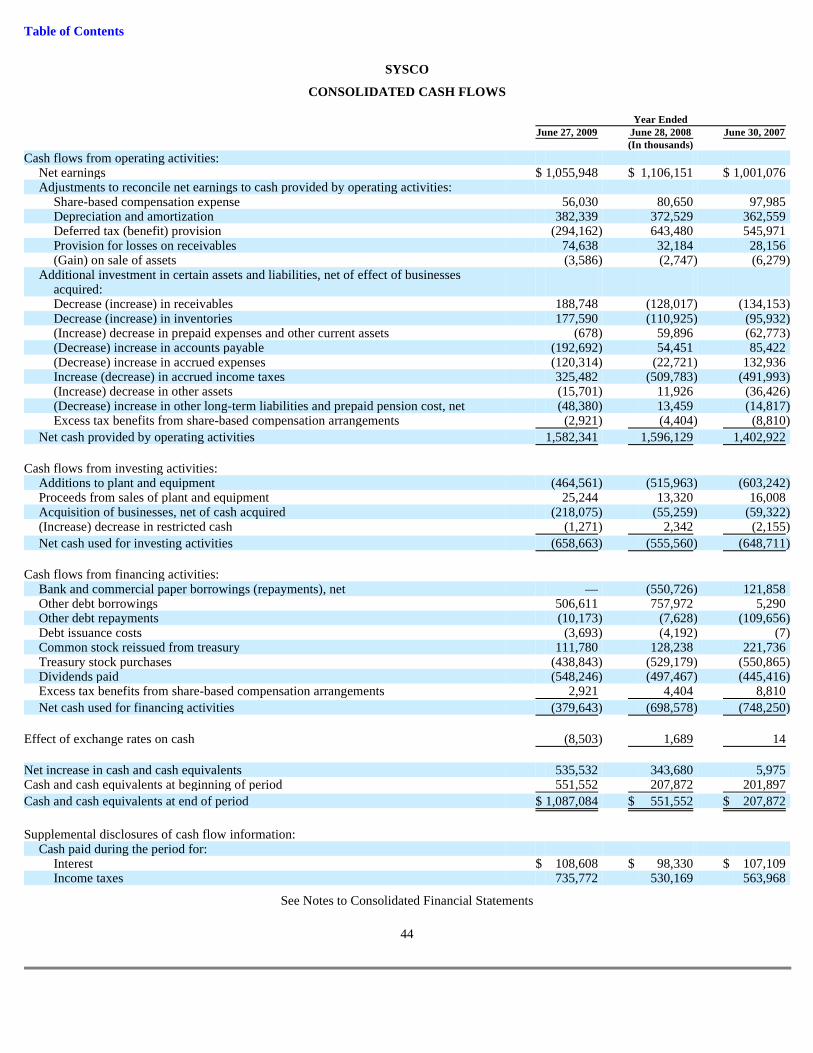
Table of Contents
SYSCO
CONSOLIDATED CASH FLOWS
See Notes to Consolidated Financial Statements
44
Year Ended June 27, 2009 June 28, 2008 June 30, 2007 (In thousands) Cash flows from operating activities:
Net earnings $ 1,055,948 $ 1,106,151 $ 1,001,076 Adjustments to reconcile net earnings to cash provided by operating activities:
Share-based compensation expense 56,030 80,650 97,985 Depreciation and amortization 382,339 372,529 362,559 Deferred tax (benefit) provision (294,162 ) 643,480 545,971 Provision for losses on receivables 74,638 32,184 28,156 (Gain) on sale of assets (3,586 ) (2,747 ) (6,279 )
Additional investment in certain assets and liabilities, net of effect of businesses acquired: Decrease (increase) in receivables 188,748 (128,017 ) (134,153 ) Decrease (increase) in inventories 177,590 (110,925 ) (95,932 ) (Increase) decrease in prepaid expenses and other current assets (678 ) 59,896 (62,773 ) (Decrease) increase in accounts payable (192,692 ) 54,451 85,422 (Decrease) increase in accrued expenses (120,314 ) (22,721 ) 132,936 Increase (decrease) in accrued income taxes 325,482 (509,783 ) (491,993 ) (Increase) decrease in other assets (15,701 ) 11,926 (36,426 ) (Decrease) increase in other long-term liabilities and prepaid pension cost, net (48,380 ) 13,459 (14,817 ) Excess tax benefits from share-based compensation arrangements (2,921 ) (4,404 ) (8,810 )
Net cash provided by operating activities 1,582,341 1,596,129 1,402,922
Cash flows from investing activities:
Additions to plant and equipment (464,561 ) (515,963 ) (603,242 ) Proceeds from sales of plant and equipment 25,244 13,320 16,008 Acquisition of businesses, net of cash acquired (218,075 ) (55,259 ) (59,322 ) (Increase) decrease in restricted cash (1,271 ) 2,342 (2,155 )
Net cash used for investing activities (658,663 ) (555,560 ) (648,711 )
Cash flows from financing activities:
Bank and commercial paper borrowings (repayments), net — (550,726 ) 121,858 Other debt borrowings 506,611 757,972 5,290 Other debt repayments (10,173 ) (7,628 ) (109,656 ) Debt issuance costs (3,693 ) (4,192 ) (7 ) Common stock reissued from treasury 111,780 128,238 221,736 Treasury stock purchases (438,843 ) (529,179 ) (550,865 ) Dividends paid (548,246 ) (497,467 ) (445,416 ) Excess tax benefits from share-based compensation arrangements 2,921 4,404 8,810
Net cash used for financing activities (379,643 ) (698,578 ) (748,250 )
Effect of exchange rates on cash (8,503 ) 1,689 14
Net increase in cash and cash equivalents 535,532 343,680 5,975 Cash and cash equivalents at beginning of period 551,552 207,872 201,897
Cash and cash equivalents at end of period $ 1,087,084 $ 551,552 $ 207,872
Supplemental disclosures of cash flow information:
Cash paid during the period for: Interest $ 108,608 $ 98,330 $ 107,109 Income taxes 735,772 530,169 563,968
Table of Contents
NOTES TO CONSOLIDATED FINANCIAL STATEMENTS
1. SUMMARY OF ACCOUNTING POLICIES
Business and Consolidation
Sysco Corporation, acting through its subsidiaries and divisions, (Sysco or the company), is engaged in the marketing and distribution of a wide range of food and related products primarily to the foodservice or “food-away-from-home” industry. These services are performed for approximately 400,000 customers from 186 distribution facilities located throughout the United States, Canada and Ireland.
The accompanying financial statements include the accounts of Sysco and its consolidated subsidiaries. All significant intercompany transactions and account balances have been eliminated.
The preparation of financial statements in conformity with generally accepted accounting principles requires management to make estimates that affect the reported amounts of assets, liabilities, sales and expenses. Actual results could differ from the estimates used.
Subsequent Events
Sysco has evaluated subsequent events through the date these financial statements were issued, August 25, 2009. See Note 22, Subsequent Events.
Cash and Cash Equivalents
For cash flow purposes, cash includes cash equivalents such as time deposits, certificates of deposit, short-term investments and all highly liquid instruments with original maturities of three months or less, which are recorded at fair value.
Accounts Receivable
Accounts receivable consist primarily of trade receivables from customers and receivables from suppliers for marketing or incentive programs. Sysco determines the past due status of trade receivables based on contractual terms with each customer. Sysco evaluates the collectability of accounts receivable and determines the appropriate reserve for doubtful accounts based on a combination of factors. The company utilizes specific criteria to determine uncollectible receivables to be written off including whether a customer has filed for or been placed in bankruptcy, has had accounts referred to outside parties for collection or has had accounts past due over specified periods. Allowances are recorded for all other receivables based on an analysis of historical trends of write-offs and recoveries. In addition, in circumstances where the company is aware of a specific customer’s inability to meet its financial obligation to Sysco, a specific allowance for doubtful accounts is recorded to reduce the receivable to the net amount reasonably expected to be collected. In addition, allowances are recorded for all other receivables based on an analysis of historical trends of write-offs and recoveries.
Inventories
Inventories consisting primarily of finished goods include food and related products and lodging products held for resale and are valued at the lower of cost (first-in, first-out method) or market. Elements of costs include the purchase price of the product and freight charges to deliver the product to the company’s warehouses and are net of certain cash or non-cash consideration received from vendors (see “Vendor Consideration”).
Plant and Equipment
Capital additions, improvements and major replacements are classified as plant and equipment and are carried at cost. Depreciation is recorded using the straight-line method, which reduces the book value of each asset in equal amounts over its estimated useful life, and is included within operating expenses in the consolidated results of operations. Maintenance, repairs and minor replacements are charged to earnings when they are incurred. Upon the disposition of an asset, its accumulated depreciation is deducted from the original cost, and any gain or loss is reflected in current earnings.
Applicable interest charges incurred during the construction of new facilities and development of software for internal use are capitalized as one of the elements of cost and are amortized over the assets’ estimated useful lives. Interest capitalized for the past three fiscal years was $3,531,000 in 2009, $6,805,000 in 2008 and $3,955,000 in 2007.
Long-Lived Assets
Management reviews long-lived assets, including finite-lived intangibles, for indicators of impairment whenever events or changes in circumstances indicate that the carrying value may not be recoverable. Cash flows expected to be generated by the related assets are estimated over the asset’s useful life based on updated projections. If the evaluation indicates that the carrying
45
Table of Contents
value of the asset may not be recoverable, the potential impairment is measured based on a projected discounted cash flow model.
Goodwill and Intangibles
Goodwill and intangibles represent the excess of cost over the fair value of tangible net assets acquired. Goodwill and intangibles with indefinite lives are not amortized. Intangibles with definite lives are amortized on a straight-line basis over their useful lives, which generally range from three to ten years.
Goodwill is assigned to the reporting units that are expected to benefit from the synergies of a business combination. The recoverability of goodwill and indefinite-lived intangibles is assessed annually, or more frequently as needed when events or changes have occurred that would suggest an impairment of carrying value, by determining whether the fair values of the applicable reporting units exceed their carrying values. The reporting units used to assess goodwill impairment are the company’s six operating segments as described in Note 20, Business Segment Information. The components within each of the six operating segments have similar economic characteristics and therefore are aggregated into six reporting units. The evaluation of fair value requires the use of projections, estimates and assumptions as to the future performance of the operations in performing a discounted cash flow analysis, as well as assumptions regarding sales and earnings multiples that would be applied in comparable acquisitions.
Derivative Financial Instruments
All derivatives are recognized as assets or liabilities within the consolidated balance sheets at fair value. Gains or losses on derivative financial instruments designated as fair value hedges are recognized immediately in the consolidated results of operations, along with the offsetting gain or loss related to the underlying hedged item.
Gains or losses on derivative financial instruments designated as cash flow hedges are recorded as a separate component of shareholders’ equity at their settlement, whereby gains or losses are reclassified to the Consolidated Results of Operations in conjunction with the recognition of the underlying hedged item.
In the normal course of business, Sysco enters into forward purchase agreements for the procurement of fuel, electricity and product commodities related to Sysco’s business. These agreements meet the definition of a derivative. However, the company elected to use the normal purchase and sale exemption available under derivatives accounting literature; therefore, these agreements are not recorded at fair value.
Investments in Corporate-Owned Life Insurance
Investments in corporate-owned life insurance policies are recorded at their cash surrender values as of each balance sheet date. Changes in the cash surrender value during the period are recorded as a gain or loss within operating expenses. The company does not record deferred tax balances related to cash surrender value gains or losses, as Sysco has the intent to hold these policies to maturity. The total amounts related to the company’s investments in corporate-owned life insurance policies included in other assets in the consolidated balance sheets were $177,996,000 and $178,731,000 at June 27, 2009 and June 28, 2008, respectively.
Treasury Stock
The company records treasury stock purchases at cost. Shares removed from treasury are valued at cost using the average cost method.
Foreign Currency Translation
The assets and liabilities of all foreign subsidiaries are translated at current exchange rates. Related translation adjustments are recorded as a component of accumulated other comprehensive income (loss).
Revenue Recognition
The company recognizes revenue from the sale of a product when it is considered to be realized or realizable and earned. The company determines these requirements to be met at the point at which the product is delivered to the customer. The company grants certain customers sales incentives such as rebates or discounts and treats these as a reduction of sales at the time the sale is recognized. Sales tax collected from customers is not included in revenue but rather recorded as a liability due to the respective taxing authorities. Purchases and sales of inventory with the same counterparty that are entered into in contemplation of one another are considered to be a single nonmonetary transaction. As such, the company records the net effect of such transactions in the consolidated results of operations within sales.
46

Table of Contents
Vendor Consideration
Sysco recognizes consideration received from vendors when the services performed in connection with the monies received are completed and when the related product has been sold by Sysco as a reduction to cost of sales. There are several types of cash consideration received from vendors. In many instances, the vendor consideration is in the form of a specified amount per case or per pound. In these instances, Sysco will recognize the vendor consideration as a reduction of cost of sales when the product is sold. In the situations in which the vendor consideration is not related directly to specific product purchases, Sysco will recognize these as a reduction of cost of sales when the earnings process is complete, the related service is performed and the amounts are realized. In certain of these latter instances, the vendor consideration represents a reimbursement of a specific incremental identifiable cost incurred by Sysco. In these cases, Sysco classifies the consideration as a reduction of those costs, with any excess funds classified as a reduction of cost of sales and recognizes these in the period in which the costs are incurred and related services performed.
Shipping and Handling Costs
Shipping and handling costs include costs associated with the selection of products and delivery to customers. Included in operating expenses are shipping and handling costs of approximately $2,136,836,000 in fiscal 2009, $2,155,794,000 in fiscal 2008, and $1,977,516,000 in fiscal 2007.
Insurance Program
Sysco maintains a self-insurance program covering portions of workers’ compensation, general and vehicle liability costs. The amounts in excess of the self-insured levels are fully insured by third party insurers. The company also maintains a fully self-insured group medical program. Liabilities associated with these risks are estimated in part by considering historical claims experience, medical cost trends, demographic factors, severity factors and other actuarial assumptions.
Share-Based Compensation
Sysco recognizes expense for its share-based compensation based on the fair value of the awards that are granted. The fair value of the stock options is estimated at the date of grant using the Black-Scholes option pricing model. Option pricing methods require the input of highly subjective assumptions, including the expected stock price volatility. The fair value of restricted stock awards is based on the company’s stock price on the date of grant. Measured compensation cost is recognized ratably over the vesting period of the related share-based compensation award. Cash flows resulting from tax deductions in excess of the compensation cost recognized for those options (excess tax benefits) are classified as financing cash flows on the consolidated cash flows statements.
Acquisitions
Acquisitions of businesses are accounted for using the purchase method of accounting, and the financial statements include the results of the acquired operations from the respective dates of acquisition.
The purchase price of the acquired entities is allocated to the net assets acquired and liabilities assumed based on the estimated fair value at the dates of acquisition, with any excess of cost over the fair value of net assets acquired, including intangibles, recognized as goodwill. The balances included in the consolidated balance sheets related to recent acquisitions are based upon preliminary information and are subject to change when final asset and liability valuations are obtained. Material changes to the preliminary allocations are not anticipated by management.
2. CHANGES IN ACCOUNTING
SFAS 165 Adoption
In May 2009, the FASB issued SFAS No. 165, “Subsequent Events” ( SFAS 165), which established general standards of accounting for and disclosure of events that occur after the balance sheet date but before financial statements are issued or are available to be issued. Specifically, the standard sets forth the period after the balance sheet date during which management should evaluate events or transactions that may occur for potential recognition or disclosure in the financial statements, the circumstances under which an entity should recognize events or transactions occurring after the balance sheet date in its financial statements, and the disclosures that an entity should make about events or transactions that occurred after the balance sheet date. This standard became effective for Sysco for its fiscal year ending June 27, 2009. The company has included the required disclosures for this standard in Note 1, “Summary of Accounting Policies.”
SFAS 161
As of the third quarter of fiscal 2009, SFAS No. 161, “Disclosure about Derivative Instruments and Hedging Activities, an amendment of FASB Statement No. 133” (SFAS 161) became effective for Sysco. SFAS 161 requires enhanced disclosures about an entity’s derivative and hedging activities and thereby improves the transparency of financial reporting. The company
47
Table of Contents
has determined that no additional disclosures were necessary upon adoption but will continue to assess the need for additional disclosures in future periods.
SFAS 157
As of June 29, 2008, Sysco adopted the provisions of FASB Statement No. 157, “ Fair Value Measurements” (SFAS 157), for financial assets and liabilities carried at fair value and non-financial assets and liabilities that are recognized or disclosed at fair value on a recurring basis. SFAS 157 establishes a common definition for fair value under generally accepted accounting principles, establishes a framework for measuring fair value and expands disclosure requirements about such fair value measurements. The adoption of SFAS 157 for financial assets and liabilities carried at fair value and non-financial assets and liabilities that are recognized or disclosed at fair value on a recurring basis did not have a material impact on the company’s financial statements. See also the discussion of FASB Staff Position 157-2, “Effective Date of FASB Statement No. 157,” in Note 3, New Accounting Standards.
FIN 48
Effective July 1, 2007, Sysco adopted FASB Interpretation No. 48, “Accounting for Uncertainty in Income Taxes – an Interpretation of FASB Statement No. 109” (FIN 48), which clarifies the accounting for uncertainty in income taxes recognized in accordance with SFAS No. 109, “Accounting for Income Taxes” (SFAS 109). FIN 48 clarifies the application of SFAS 109 by defining criteria that an individual tax position must meet for any part of the benefit of that position to be recognized in the financial statements. Additionally, FIN 48 provides guidance on the measurement, derecognition, classification and disclosure of tax positions, along with accounting for the related interest and penalties. The impact of adopting this standard is discussed in Note 17, Income Taxes.
SFAS 158
In September 2006, the FASB issued SFAS No. 158, “Employers’ Accounting for Defined Benefit Pension and Other Postretirement Plans – an amendment of FASB Statements No. 87, 88, 106, and 132(R)” (SFAS 158). SFAS 158 has two major provisions: the recognition and disclosure provision and the measurement date provision. Sysco previously adopted SFAS 158’s recognition and disclosure requirements as of June 30, 2007. The measurement date provision requires an employer to measure a plan’s assets and obligations as of the end of the employer’s fiscal year. Sysco elected to early adopt the measurement date provision as of June 30, 2007 in order to adopt both provisions of this accounting standard at the same time. As a result, beginning in fiscal 2008, the measurement date for all plans returned to correspond with fiscal year-end. The company performed measurements as of May 31, 2007 and June 30, 2007 of the plan assets and benefit obligations. Sysco recorded a charge to beginning retained earnings on July 1, 2007 of $3,572,000, net of tax, for the impact of the difference in our company-sponsored pension expense between the two measurement dates. The company also recorded a benefit to beginning accumulated other comprehensive income (loss) on July 1, 2007 of $22,780,000, net of tax, for the impact of the difference in the recognition provision between the two measurement dates.
3. NEW ACCOUNTING STANDARDS
SFAS 141(R)
In December 2007, the FASB issued SFAS No. 141(R), “Business Combinations” (SFAS 141(R)), which establishes principles and requirements for how an acquirer recognizes and measures in its financial statements the identifiable assets acquired, the liabilities assumed and any noncontrolling interest in a business combination. This statement also establishes recognition and measurement principles for the goodwill acquired in a business combination and disclosure requirements to enable financial statement users to evaluate the nature and financial effects of the business combination. Sysco will apply this statement primarily on a prospective basis for business combinations beginning in fiscal 2010. Earlier application of the standard was prohibited.
FSP 157-2
In February 2008, the FASB issued FASB Staff Position 157-2, “Effective Date of FASB Statement No. 157” (FSP 157-2), which partially deferred the effective date of SFAS No. 157 for one year for non-financial assets and liabilities that are recognized or disclosed at fair value in the financial statements on a non-recurring basis. As a result of the deferral, SFAS 157 is effective in fiscal 2010 for non-recurring, non-financial assets and liabilities that are recognized or disclosed at fair value. Sysco’s only non-recurring, non-financial asset fair value measurements are those used in its annual test of recoverability of goodwill and indefinite-lived intangibles, in which it determines whether estimated fair values of the applicable reporting units exceed their carrying values. The company will apply the provisions of SFAS 157 in fiscal 2010 to this fair value estimation.
48
Table of Contents
FSP EITF 03-06-1
In June 2008, the FASB issued FASB Staff Position No. EITF 03-06-1, “Determining Whether Instruments Granted in Share-Based Payment Transactions Are Participating Securities” (FSP EITF 03-06-1). FSP EITF 03-06-1 addresses whether instruments granted in share-based payment transactions are participating securities prior to vesting and, therefore, need to be included in the earnings allocation in computing earnings per share under the two-class method described in FASB Statement No. 128, “Earnings per Share.” This standard will be effective for Sysco beginning in fiscal 2010 and interim periods within that year. All prior-period earnings per share data presented in filings subsequent to adoption must be adjusted retrospectively to conform with the provisions of this standard. Early application of FSP EITF 03-06-1 was not permitted. Sysco is currently evaluating the impact the adoption of FSP EITF 03-06-1 will have on its consolidated financial statements.
FSP FAS 132(R)-1
In December 2008, the FASB issued FASB Staff Position No. FAS 132(R)-1, “Employers’ Disclosures about Postretirement Benefit Plan Assets” (FSP FAS 132(R)-1). FSP FAS 132(R)-1 amends SFAS No. 132(R), “Employers’ Disclosures about Pensions and Other Postretirement Benefits,” to require additional disclosures about assets held in an employer’s defined benefit pension or other postretirement plan. This standard will be effective for Sysco in fiscal 2010, although early application of the standard is permitted. Upon initial application, the information required by FSP FAS 132(R)-1 is not required for earlier periods that are presented for comparative purposes. The company will adopt this standard in fiscal 2010 and is currently evaluating the impact the adoption of FSP FAS 132(R)-1 will have on its annual financial statement disclosures.
FSP FAS 141(R)-1
In April 2009, the FASB issued FASB Staff Position No. FAS 141(R)-1, “Accounting for Assets and Liabilities Assumed in a Business Combination That Arise From Contingencies” (FSP FAS 141(R)-1). FSP FAS 141(R)-1 amends and clarifies SFAS No. 141(R), “Business Combinations,” to address application issues raised by preparers, auditors, and members of the legal profession on initial recognition and measurement, subsequent measurement and accounting, and disclosure of assets and liabilities arising from contingencies in a business combination. Sysco will apply this standard on a prospective basis for business combinations beginning in fiscal 2010.
FSP FAS 107-1 and APB 28-1
In April 2009, the FASB issued FASB Staff Position No. FAS 107-1 and APB 28-1, “Interim Disclosures about Fair Value of Financial Instruments” (FSP FAS 107-1 and APB 28-1). FSP FAS 107-1 and APB 28-1 amend FASB Statement No. 107, “Disclosures about Fair Value of Financial Instruments,” and APB Opinion No. 28, “Interim Financial Reporting,” to require disclosures about the fair value of financial instruments for interim reporting periods of publicly traded companies. Prior disclosure requirements only applied to annual financial statements. This standard is effective for interim reporting periods ending after June 15, 2009, which is the first quarter of fiscal 2010 for Sysco. The company will provide the disclosures about the fair value of financial instruments required by FSP FAS 107-1 and APB 28-1 in its interim financial statement disclosures beginning in fiscal 2010.
4. FAIR VALUE MEASUREMENTS
Cash equivalents primarily include time deposits, certificates of deposit, short-term investments and all highly liquid instruments with original maturities of three months or less. The fair values of cash equivalents reflected in the consolidated balance sheets were $839,554,000 and $341,958,000 as of June 27, 2009 and June 28, 2008, respectively. Pursuant to SFAS 157, the fair value of the company’s cash equivalents is determined based on “Level 1” inputs, which consist of quoted prices in active markets for identical assets. As of these dates, the company held no other assets or liabilities requiring fair value measurement or disclosure.
The fair value of Sysco’s total long-term debt is estimated based on the quoted market prices for the same or similar issues or on the current rates offered to the company for debt of the same remaining maturities. The fair value of total long-term debt approximated $2,548,861,000 as of June 27, 2009 and $1,928,595,000 as of June 28, 2008, respectively. See further discussion of the carrying value of Sysco’s total-long-term debt at Note 11, Debt.
49
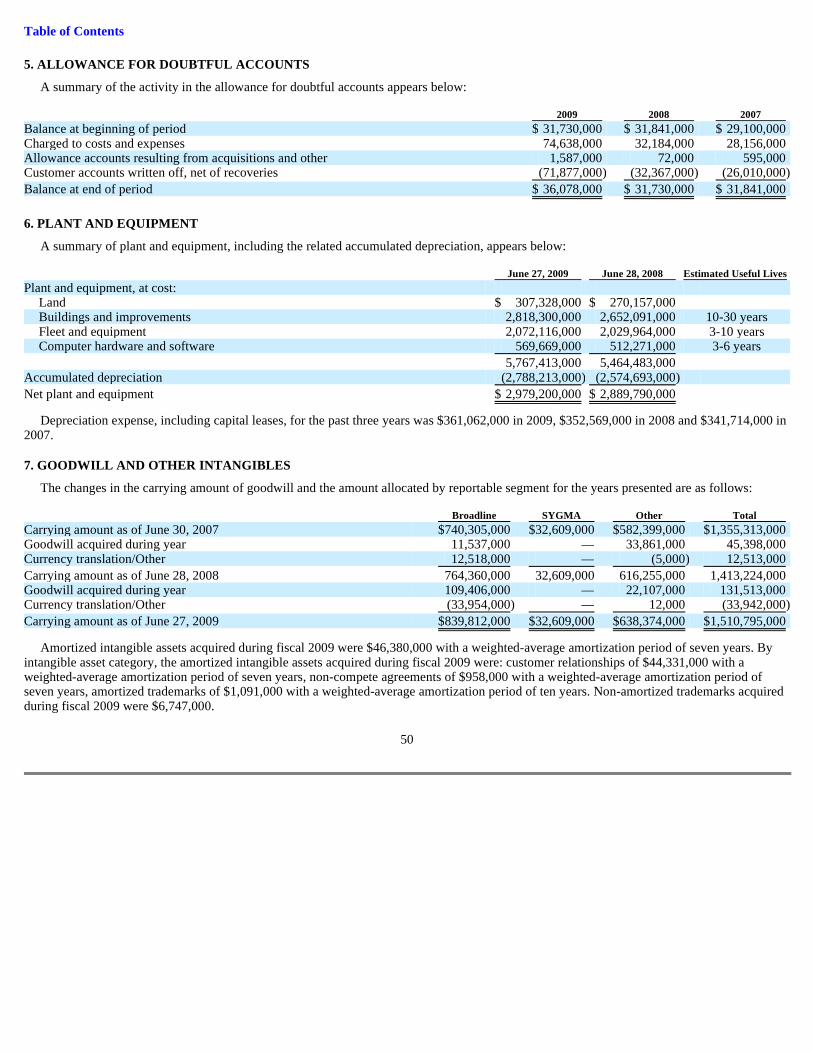
Table of Contents
5. ALLOWANCE FOR DOUBTFUL ACCOUNTS
A summary of the activity in the allowance for doubtful accounts appears below:
6. PLANT AND EQUIPMENT
A summary of plant and equipment, including the related accumulated depreciation, appears below:
Depreciation expense, including capital leases, for the past three years was $361,062,000 in 2009, $352,569,000 in 2008 and $341,714,000 in 2007.
7. GOODWILL AND OTHER INTANGIBLES
The changes in the carrying amount of goodwill and the amount allocated by reportable segment for the years presented are as follows:
Amortized intangible assets acquired during fiscal 2009 were $46,380,000 with a weighted-average amortization period of seven years. By intangible asset category, the amortized intangible assets acquired during fiscal 2009 were: customer relationships of $44,331,000 with a weighted-average amortization period of seven years, non-compete agreements of $958,000 with a weighted-average amortization period of seven years, amortized trademarks of $1,091,000 with a weighted-average amortization period of ten years. Non-amortized trademarks acquired during fiscal 2009 were $6,747,000.
50
2009 2008 2007 Balance at beginning of period $ 31,730,000 $ 31,841,000 $ 29,100,000 Charged to costs and expenses 74,638,000 32,184,000 28,156,000 Allowance accounts resulting from acquisitions and other 1,587,000 72,000 595,000 Customer accounts written off, net of recoveries (71,877,000 ) (32,367,000 ) (26,010,000 )
Balance at end of period $ 36,078,000 $ 31,730,000 $ 31,841,000
June 27, 2009 June 28, 2008 Estimated Useful Lives Plant and equipment, at cost:
Land $ 307,328,000 $ 270,157,000 Buildings and improvements 2,818,300,000 2,652,091,000 10-30 years Fleet and equipment 2,072,116,000 2,029,964,000 3-10 years Computer hardware and software 569,669,000 512,271,000 3-6 years
5,767,413,000 5,464,483,000 Accumulated depreciation (2,788,213,000 ) (2,574,693,000 )
Net plant and equipment $ 2,979,200,000 $ 2,889,790,000
Broadline SYGMA Other Total Carrying amount as of June 30, 2007 $ 740,305,000 $ 32,609,000 $ 582,399,000 $ 1,355,313,000 Goodwill acquired during year 11,537,000 — 33,861,000 45,398,000 Currency translation/Other 12,518,000 — (5,000 ) 12,513,000
Carrying amount as of June 28, 2008 764,360,000 32,609,000 616,255,000 1,413,224,000 Goodwill acquired during year 109,406,000 — 22,107,000 131,513,000 Currency translation/Other (33,954,000 ) — 12,000 (33,942,000 )
Carrying amount as of June 27, 2009 $ 839,812,000 $ 32,609,000 $ 638,374,000 $ 1,510,795,000

Table of Contents
The following table presents details of the company’s other intangible assets:
Intangible assets that have been fully amortized have been removed in the schedule above in the period full amortization is reached. Amortization expense for the past three years was $15,746,000 in 2009, $13,865,000 in 2008 and $12,711,000 in 2007. The estimated future amortization expense for the next five fiscal years on intangible assets outstanding as of June 27, 2009 is shown below:
8. RESTRICTED CASH
Sysco is required by its insurers to collateralize a part of the self-insured portion of its workers’ compensation and liability claims. Sysco has chosen to satisfy these collateral requirements by depositing funds in insurance trusts or by issuing letters of credit. All amounts in restricted cash at June 27, 2009 and June 28, 2008 represented funds deposited in insurance trusts.
9. DERIVATIVE FINANCIAL INSTRUMENTS
Sysco manages its debt portfolio by targeting an overall desired position of fixed and floating rates and may employ interest rate swaps from time to time to achieve this goal. The company does not use derivative financial instruments for trading or speculative purposes.
In March 2005, Sysco entered into a forward-starting interest rate swap with a notional amount of $350,000,000. In accordance with derivatives accounting literature, the company designated this derivative as a cash flow hedge of the variability in the cash outflows of interest payments on $350,000,000 of the September 2005 forecasted debt issuance due to changes in the benchmark interest rate. In September 2005, in conjunction with the issuance of the 5.375% senior notes, Sysco settled the $350,000,000 notional amount forward-starting interest rate swap. Upon settlement, Sysco paid cash of $21,196,000, which represented the fair value of the swap agreement at the time of settlement. This amount is being amortized as interest expense over the 30-year term of the debt, and the unamortized balance is reflected as a loss, net of tax, in other comprehensive income (loss).
10. SELF-INSURED LIABILITIES
Sysco maintains a self-insurance program covering portions of workers’ compensation, general and vehicle liability costs. The amounts in excess of the self-insured levels are fully insured by third party insurers. The company also maintains a fully self-insured group medical program. A summary of the activity in self-insured liabilities appears below:
51
June 27, 2009 June 28, 2008 Gross Carrying Accumulated Gross Carrying Accumulated Amount Amortization Net Amount Amortization Net Amortized intangible assets:
Customer relationships $ 162,652,000 $ 56,192,000 $ 106,460,000 $ 123,605,000 $ 43,756,000 $ 79,849,000 Non-compete agreements 3,733,000 1,981,000 1,752,000 4,163,000 2,443,000 1,720,000 Trademarks 1,547,000 471,000 1,076,000 500,000 220,000 280,000
Total amortized intangible assets 167,932,000 58,644,000 109,288,000 128,268,000 46,419,000 81,849,000 Unamortized intangible assets:
Trademarks 11,801,000 — 11,801,000 5,679,000 — 5,679,000
Total $ 179,733,000 $ 58,644,000 $ 121,089,000 $ 133,947,000 $ 46,419,000 $ 87,528,000
Amount
2010 $ 20,055,000 2011 19,569,000 2012 19,005,000 2013 17,048,000 2014 15,994,000
2009 2008 2007 Balance at beginning of period $ 117,725,000 $ 125,844,000 $ 115,557,000 Charged to costs and expenses 353,252,000 306,571,000 302,812,000 Payments (338,426,000 ) (314,690,000 ) (292,525,000 )
Balance at end of period $ 132,551,000 $ 117,725,000 $ 125,844,000

Table of Contents
11. DEBT AND OTHER FINANCING ARRANGEMENTS
Sysco’s debt consists of the following:
The principal payments required to be made during the next five fiscal years on debt outstanding as of June 27, 2009 are shown below:
Short-term Borrowings
As of June 27, 2009, Sysco had uncommitted bank lines of credit, which provided for unsecured borrowings for working capital of up to $88,000,000, of which none was outstanding. As of June 28, 2008, Sysco had uncommitted bank lines of credit, which provided for unsecured borrowings of working capital of up to $145,000,000, of which none was outstanding.
The company’s Irish subsidiary, Pallas Foods Limited, has a € 20,000,000 (Euro) committed facility for unsecured borrowings for working capital, which expires March 31, 2010. There were no borrowings outstanding under this facility as of June 27, 2009.
Commercial Paper
Sysco has a Board-approved commercial paper program allowing the company to issue short-term unsecured notes in an aggregate amount not to exceed $1,300,000,000.
Sysco and one of its subsidiaries, Sysco International, Co., have a revolving credit facility supporting the company’s U.S. and Canadian commercial paper programs. The facility in the amount of $1,000,000,000 expires on November 4, 2012, but is subject to extension.
During fiscal 2009, 2008 and 2007, aggregate outstanding commercial paper issuances and short-term bank borrowings ranged from approximately zero to $164,998,000, zero to $1,113,241,000, and $356,804,000 to $755,180,000, respectively. There were no commercial paper issuances outstanding as of June 27, 2009 and June 28, 2008, respectively.
Fixed Rate Debt
In April 2007, Sysco repaid the 7.25% senior notes totaling $100,000,000 at maturity utilizing a combination of cash flow from operations and commercial paper issuances.
In January 2008, the SEC granted our request to terminate our then existing shelf registration statement that was filed with the SEC in April 2005 for the issuance of debt securities. In February 2008, we filed an automatically effective well-known seasoned issuer shelf registration statement for the issuance of up to $1,000,000,000 in debt securities with the SEC.
52
June 27, 2009 June 28, 2008 Senior notes, interest at 6.1%, maturing in fiscal 2012 $ 200,279,000 $ 200,372,000 Senior notes, interest at 4.2%, maturing in fiscal 2013 249,702,000 249,619,000 Senior notes, interest at 4.6%, maturing in fiscal 2014 205,219,000 206,331,000 Senior notes, interest at 5.25%, maturing in fiscal 2018 497,028,000 496,683,000 Senior notes, interest at 5.375%, maturing in fiscal 2019 248,351,000 — Debentures, interest at 7.16%, maturing in fiscal 2027 50,000,000 50,000,000 Debentures, interest at 6.5%, maturing in fiscal 2029 224,546,000 224,522,000 Senior notes, interest at 5.375%, maturing in fiscal 2036 499,611,000 499,596,000 Senior notes, interest at 6.625%, maturing in fiscal 2039 245,199,000 — Industrial Revenue Bonds and other debt, interest averaging 5.9% as of June 27, 2009 and 6.2% as of
June 28, 2008, maturing at various dates to fiscal 2026 56,714,000 53,208,000
Total debt 2,476,649,000 1,980,331,000 Less current maturities and short-term debt (9,163,000 ) (4,896,000 )
Net long-term debt $ 2,467,486,000 $ 1,975,435,000
Amount
2010 $ 9,163,000 2011 6,646,000 2012 204,390,000 2013 252,314,000 2014 206,887,000

Table of Contents
In February 2008, we issued 4.20% senior notes totaling $250,000,000 due February 12, 2013 (the 2013 notes) and 5.25% senior notes totaling $500,000,000 due February 12, 2018 (the 2018 notes) under our February 2008 shelf registration. The 2013 and 2018 notes, which were priced at 99.835% and 99.310% of par, respectively, are unsecured, are not subject to any sinking fund requirement and include a redemption provision which allows us to retire the notes at any time prior to maturity at the greater of par plus accrued interest or an amount designed to ensure that the note holders are not penalized by the early redemption. Proceeds from the notes were utilized to retire commercial paper issuances outstanding as of February 2008.
In February 2009, Sysco deregistered the securities remaining unsold under its then existing shelf registration statement that was filed with the Securities and Exchange Commission (SEC) in February 2008 for the issuance of debt securities. In February 2009, Sysco filed with the SEC an automatically effective well-known seasoned issuer shelf registration statement for the issuance of an indeterminate amount of debt securities that may be issued from time to time.
In March 2009, Sysco issued 5.375% senior notes totaling $250,000,000 due March 17, 2019 (the 2019 notes) and 6.625% senior notes totaling $250,000,000 due March 17, 2039 (the 2039 notes) under its February 2009 shelf registration. The 2019 and 2039 notes, which were priced at 99.321% and 98.061% of par, respectively, are unsecured, are not subject to any sinking fund requirement and include a redemption provision which allows Sysco to retire the notes at any time prior to maturity at the greater of par plus accrued interest or an amount designed to ensure that the noteholders are not penalized by early redemption. Proceeds from the notes will be utilized over a period of time for general corporate purposes, which may include acquisitions, refinancing of debt, working capital, share repurchases and capital expenditures.
The 4.60% senior notes due March 15, 2014 and the 6.5% debentures due August 1, 2028 are unsecured, are not subject to any sinking fund requirement and include a redemption provision that allows Sysco to retire the debentures and notes at any time prior to maturity at the greater of par plus accrued interest or an amount designed to ensure that the debenture and note holders are not penalized by the early redemption.
The 7.16% debentures due April 15, 2027 are unsecured, are not subject to any sinking fund requirement and are no longer redeemable prior to maturity.
The 6.10% senior notes due June 1, 2012, issued by Sysco International, Co., a wholly-owned subsidiary of Sysco, are fully and unconditionally guaranteed by Sysco Corporation, are not subject to any sinking fund requirement, and include a redemption provision which allows Sysco International, Co. to retire the notes at any time prior to maturity at the greater of par plus accrued interest or an amount designed to ensure that the note holders are not penalized by the early redemption.
Sysco’s Industrial Revenue Bonds have varying structures. Final maturities range from two to 17 years and certain of the bonds provide Sysco the right to redeem the bonds at various dates. These redemption provisions generally provide the bondholder a premium in the early redemption years, declining to par value as the bonds approach maturity.
Total Debt
Total debt as of June 27, 2009 was $2,476,649,000, of which approximately 99% was at fixed rates with a weighted average of 5.6% and an average life of 15 years, and the remainder was at floating rates with a weighted average of 1.3%. Certain loan agreements contain typical debt covenants to protect note holders, including provisions to maintain the company’s long-term debt to total capital ratio below a specified level. Sysco was in compliance with all debt covenants as of June 27, 2009.
Other
As of June 27, 2009 and June 28, 2008 letters of credit outstanding were $74,679,000 and $35,785,000, respectively.
12. LEASES
Although Sysco normally purchases assets, it has obligations under capital and operating leases for certain distribution facilities, vehicles and computers. Total rental expense under operating leases was $83,674,000, $95,315,000, and $94,163,000 in fiscal 2009, 2008 and 2007, respectively. Contingent rentals, subleases and assets and obligations under capital leases are not significant.
53
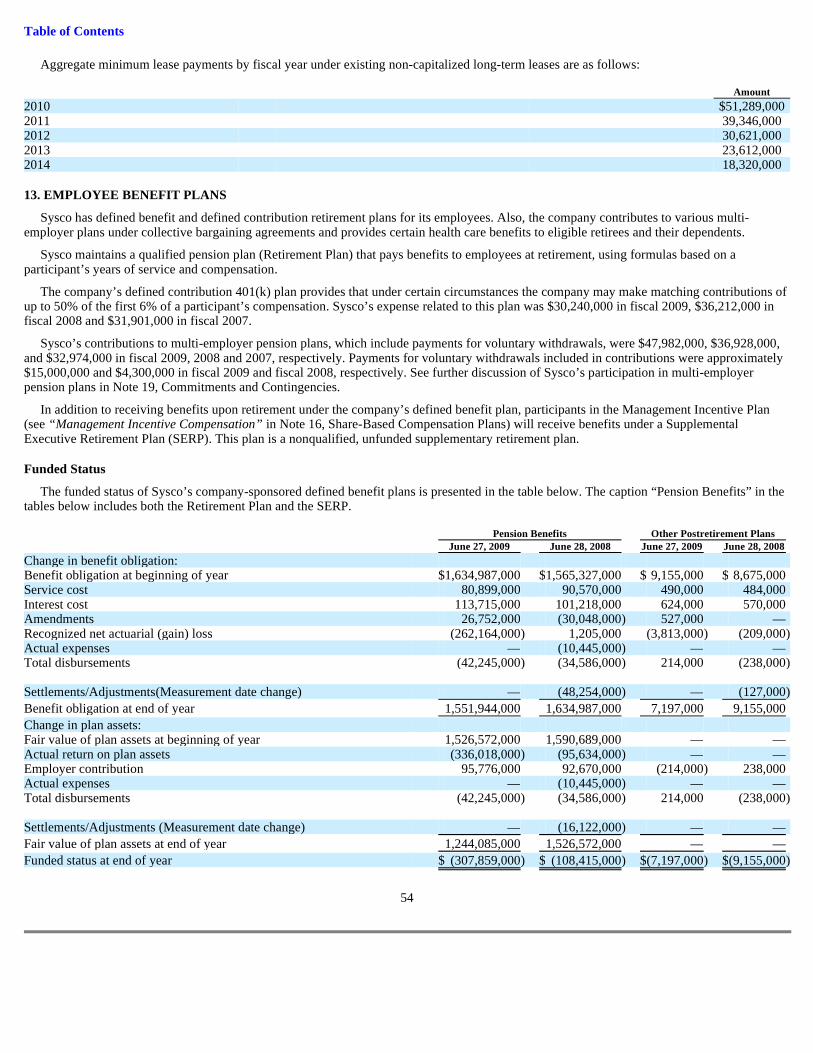
Table of Contents
Aggregate minimum lease payments by fiscal year under existing non-capitalized long-term leases are as follows:
13. EMPLOYEE BENEFIT PLANS
Sysco has defined benefit and defined contribution retirement plans for its employees. Also, the company contributes to various multi-employer plans under collective bargaining agreements and provides certain health care benefits to eligible retirees and their dependents.
Sysco maintains a qualified pension plan (Retirement Plan) that pays benefits to employees at retirement, using formulas based on a participant’s years of service and compensation.
The company’s defined contribution 401(k) plan provides that under certain circumstances the company may make matching contributions of up to 50% of the first 6% of a participant’s compensation. Sysco’s expense related to this plan was $30,240,000 in fiscal 2009, $36,212,000 in fiscal 2008 and $31,901,000 in fiscal 2007.
Sysco’s contributions to multi-employer pension plans, which include payments for voluntary withdrawals, were $47,982,000, $36,928,000, and $32,974,000 in fiscal 2009, 2008 and 2007, respectively. Payments for voluntary withdrawals included in contributions were approximately $15,000,000 and $4,300,000 in fiscal 2009 and fiscal 2008, respectively. See further discussion of Sysco’s participation in multi-employer pension plans in Note 19, Commitments and Contingencies.
In addition to receiving benefits upon retirement under the company’s defined benefit plan, participants in the Management Incentive Plan (see “Management Incentive Compensation” in Note 16, Share-Based Compensation Plans) will receive benefits under a Supplemental Executive Retirement Plan (SERP). This plan is a nonqualified, unfunded supplementary retirement plan.
Funded Status
The funded status of Sysco’s company-sponsored defined benefit plans is presented in the table below. The caption “Pension Benefits” in the tables below includes both the Retirement Plan and the SERP.
54
Amount
2010 $51,289,000 2011 39,346,000 2012 30,621,000 2013 23,612,000 2014 18,320,000
Pension Benefits Other Postretirement Plans June 27, 2009 June 28, 2008 June 27, 2009 June 28, 2008 Change in benefit obligation: Benefit obligation at beginning of year $ 1,634,987,000 $ 1,565,327,000 $ 9,155,000 $ 8,675,000 Service cost 80,899,000 90,570,000 490,000 484,000 Interest cost 113,715,000 101,218,000 624,000 570,000 Amendments 26,752,000 (30,048,000 ) 527,000 — Recognized net actuarial (gain) loss (262,164,000 ) 1,205,000 (3,813,000 ) (209,000 ) Actual expenses — (10,445,000 ) — — Total disbursements (42,245,000 ) (34,586,000 ) 214,000 (238,000 ) Settlements/Adjustments(Measurement date change) — (48,254,000 ) — (127,000 )
Benefit obligation at end of year 1,551,944,000 1,634,987,000 7,197,000 9,155,000
Change in plan assets: Fair value of plan assets at beginning of year 1,526,572,000 1,590,689,000 — — Actual return on plan assets (336,018,000 ) (95,634,000 ) — — Employer contribution 95,776,000 92,670,000 (214,000 ) 238,000 Actual expenses — (10,445,000 ) — — Total disbursements (42,245,000 ) (34,586,000 ) 214,000 (238,000 ) Settlements/Adjustments (Measurement date change) — (16,122,000 ) — —
Fair value of plan assets at end of year 1,244,085,000 1,526,572,000 — —
Funded status at end of year $ (307,859,000 ) $ (108,415,000 ) $ (7,197,000 ) $ (9,155,000 )
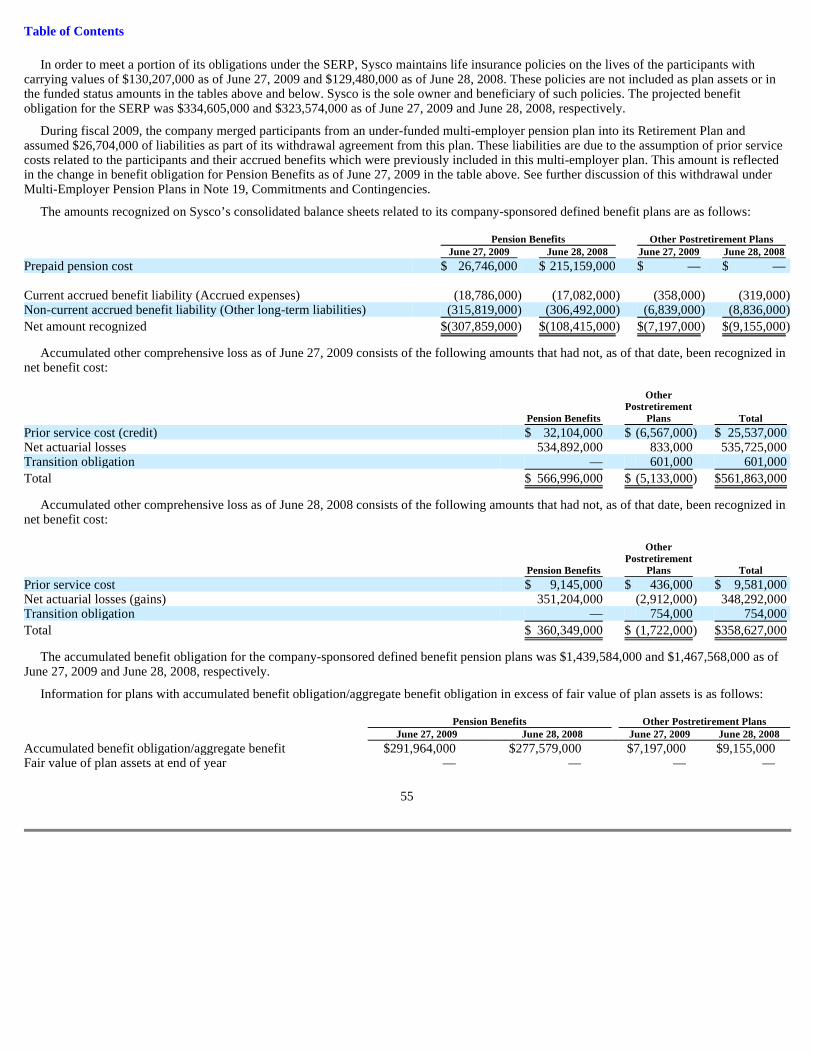
Table of Contents
In order to meet a portion of its obligations under the SERP, Sysco maintains life insurance policies on the lives of the participants with carrying values of $130,207,000 as of June 27, 2009 and $129,480,000 as of June 28, 2008. These policies are not included as plan assets or in the funded status amounts in the tables above and below. Sysco is the sole owner and beneficiary of such policies. The projected benefit obligation for the SERP was $334,605,000 and $323,574,000 as of June 27, 2009 and June 28, 2008, respectively.
During fiscal 2009, the company merged participants from an under-funded multi-employer pension plan into its Retirement Plan and assumed $26,704,000 of liabilities as part of its withdrawal agreement from this plan. These liabilities are due to the assumption of prior service costs related to the participants and their accrued benefits which were previously included in this multi-employer plan. This amount is reflected in the change in benefit obligation for Pension Benefits as of June 27, 2009 in the table above. See further discussion of this withdrawal under Multi-Employer Pension Plans in Note 19, Commitments and Contingencies.
The amounts recognized on Sysco’s consolidated balance sheets related to its company-sponsored defined benefit plans are as follows:
Accumulated other comprehensive loss as of June 27, 2009 consists of the following amounts that had not, as of that date, been recognized in net benefit cost:
Accumulated other comprehensive loss as of June 28, 2008 consists of the following amounts that had not, as of that date, been recognized in net benefit cost:
The accumulated benefit obligation for the company-sponsored defined benefit pension plans was $1,439,584,000 and $1,467,568,000 as of June 27, 2009 and June 28, 2008, respectively.
Information for plans with accumulated benefit obligation/aggregate benefit obligation in excess of fair value of plan assets is as follows:
55
Pension Benefits Other Postretirement Plans June 27, 2009 June 28, 2008 June 27, 2009 June 28, 2008 Prepaid pension cost $ 26,746,000 $ 215,159,000 $ — $ — Current accrued benefit liability (Accrued expenses) (18,786,000 ) (17,082,000 ) (358,000 ) (319,000 ) Non-current accrued benefit liability (Other long-term liabilities) (315,819,000 ) (306,492,000 ) (6,839,000 ) (8,836,000 )
Net amount recognized $ (307,859,000 ) $ (108,415,000 ) $ (7,197,000 ) $ (9,155,000 )
Other Postretirement Pension Benefits Plans Total Prior service cost (credit) $ 32,104,000 $ (6,567,000 ) $ 25,537,000 Net actuarial losses 534,892,000 833,000 535,725,000 Transition obligation — 601,000 601,000
Total $ 566,996,000 $ (5,133,000 ) $ 561,863,000
Other Postretirement Pension Benefits Plans Total Prior service cost $ 9,145,000 $ 436,000 $ 9,581,000 Net actuarial losses (gains) 351,204,000 (2,912,000 ) 348,292,000 Transition obligation — 754,000 754,000
Total $ 360,349,000 $ (1,722,000 ) $ 358,627,000
Pension Benefits Other Postretirement Plans June 27, 2009 June 28, 2008 June 27, 2009 June 28, 2008
Accumulated benefit obligation/aggregate benefit $ 291,964,000 $ 277,579,000 $ 7,197,000 $ 9,155,000 Fair value of plan assets at end of year — — — —

Table of Contents
Components of Net Benefit Costs and Other Comprehensive Income
The components of net company-sponsored pension costs for each fiscal year are as follows:
The components of other postretirement benefit costs for each fiscal year are as follows:
Net company-sponsored pension costs increased $22,877,000 in fiscal 2009 due primarily to the recognition of actuarial losses from lower returns on assets of the Retirement Plan during fiscal 2008 and the merging of participants from a multi-employer pension plan in the Retirement Plan (see Multi-Employer Pension Plans in Note 19, Commitments and Contingencies for further discussion), partially offset by a decrease in expense due to an increase in the discount rates used to calculate the Retirement Plan’s projected benefit obligation and amendments to our SERP. Net company-sponsored pension costs in fiscal 2010 are expected to increase by approximately $37,000,000 over fiscal 2009 due primarily to lower returns on assets of the Retirement Plan during fiscal 2009, partially offset by an increase in the discount rates used to calculate our projected benefit obligation and related pension expense for fiscal 2010.
Other changes in plan assets and benefit obligations recognized in other comprehensive loss related to company-sponsored pension plans for each fiscal year are as follows:
Other changes in benefit obligations recognized in other comprehensive loss related to other postretirement plans for each fiscal year are as follows:
56
Pension Benefits 2009 2008 2007 Service cost $ 80,899,000 $ 90,570,000 $ 84,654,000 Interest cost 113,715,000 101,218,000 91,311,000 Expected return on plan assets (127,422,000 ) (135,345,000 ) (116,744,000 ) Amortization of prior service cost 3,793,000 5,985,000 5,684,000 Amortization of net actuarial loss 17,729,000 3,409,000 9,686,000
Net pension costs $ 88,714,000 $ 65,837,000 $ 74,591,000
Other Postretirement Plans 2009 2008 2007 Service cost $ 490,000 $ 484,000 $ 451,000 Interest cost 624,000 570,000 531,000 Amortization of prior service cost 130,000 143,000 201,000 Amortization of net actuarial gain (158,000 ) (156,000 ) (132,000 ) Amortization of transition obligation 153,000 153,000 154,000
Net other postretirement benefit costs $ 1,239,000 $ 1,194,000 $ 1,205,000
Pension Benefits 2009 2008 Amortization of prior service cost $ 3,793,000 $ 5,985,000 Amortization of net actuarial loss 17,729,000 3,409,000 Pension liability assumption (prior service cost) (26,704,000 ) — Prior service (cost) credit arising in current year (48,000 ) 30,048,000 Net actuarial loss arising in current year (201,417,000 ) (232,044,000 )
Net pension costs $ (206,647,000 ) $ (192,602,000 )
Other Postretirement Plans 2009 2008 Amortization of prior service cost $ 130,000 $ 143,000 Amortization of net actuarial gain (158,000 ) (156,000 ) Amortization of transition obligation 153,000 153,000 Prior service cost arising in current year (527,000 ) — Net actuarial gain arising in current year 3,813,000 208,000
Net pension costs $ 3,411,000 $ 348,000

Table of Contents
Amounts included in accumulated other comprehensive loss as of June 27, 2009 that are expected to be recognized as components of net company-sponsored benefit cost during fiscal 2010 are:
Employer Contributions
The company made cash contributions to its company-sponsored pension plans of $95,776,000 and $92,670,000 in fiscal years 2009 and 2008, respectively, including $80,000,000 in voluntary contributions to the Retirement Plan in both fiscal 2009 and 2008, respectively. Sysco’s minimum required contribution to the Retirement Plan for the calendar 2009 plan year is estimated at $95,000,000 to meet ERISA minimum funding requirements. Sysco will be required to pay quarterly contributions for the calendar 2010 plan year, the first installment of which must be made in fiscal 2010. The company anticipates it will make $140,000,000 of contributions to the Retirement Plan in fiscal 2010. The company’s contributions to the SERP and other post-retirement plans are made in the amounts needed to fund current year benefit payments. The estimated fiscal 2010 contributions to fund benefit payments for the SERP and other postretirement plans are $19,445,000 and $372,000, respectively.
Estimated Future Benefit Payments
Estimated future benefit payments for vested participants, based on actuarial assumptions, are as follows:
Assumptions
Weighted-average assumptions used to determine benefit obligations as of year-end were:
For determining the benefit obligations as of June 27, 2009, the SERP calculations use an age-graded salary growth assumption with reductions taken for determining fiscal 2010 pay due to base salary freezes in effect for fiscal 2010. For determining the benefit obligations as of June 28, 2008, the SERP calculations assumed various levels of base salary increase and decrease for determining pay for fiscal 2009 depending upon the participant’s position with the company and a 7% salary growth assumption for all participants for fiscal 2010 and thereafter.
Weighted-average assumptions used to determine net company-sponsored pension costs and other postretirement benefit costs for each fiscal year were:
57
Other Postretirement Pension Benefits Plans Total Amortization of prior service cost $ 4,209,000 $ 185,000 $ 4,394,000 Amortization of net actuarial losses (gains) 40,526,000 (490,000 ) 40,036,000 Amortization of transition obligation — 153,000 153,000
Total $ 44,735,000 $ (152,000 ) $ 44,583,000
Other Postretirement Pension Benefits Plans
2010 $ 50,222,000 $ 372,000 2011 55,503,000 469,000 2012 61,974,000 562,000 2013 69,983,000 618,000 2014 78,548,000 715,000 Subsequent five years 546,763,000 4,484,000
June 27, 2009 June 28, 2008
Discount rate — Retirement Plan and Other Postretirement Plans 8.02 % 6.94 % Discount rate — SERP 7.14 7.03 Rate of compensation increase — Retirement Plan 5.21 6.17
2009 2008 2007
Discount rate — Retirement Plan and Other Postretirement Plans 6.94 % 6.78 % 6.73 % Discount rate — SERP 7.03 6.64 6.73 Expected rate of return — Retirement Plan 8.00 8.50 9.00 Rate of compensation increase — Retirement Plan 6.17 6.17 6.17
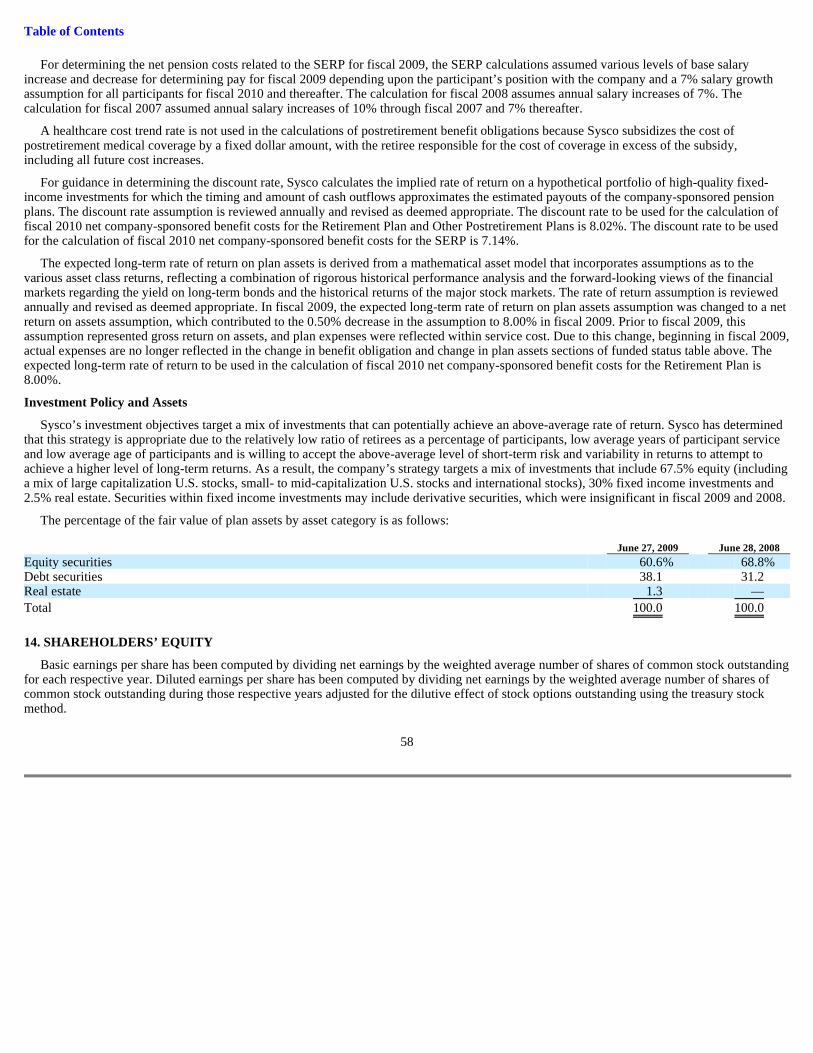
Table of Contents
For determining the net pension costs related to the SERP for fiscal 2009, the SERP calculations assumed various levels of base salary increase and decrease for determining pay for fiscal 2009 depending upon the participant’s position with the company and a 7% salary growth assumption for all participants for fiscal 2010 and thereafter. The calculation for fiscal 2008 assumes annual salary increases of 7%. The calculation for fiscal 2007 assumed annual salary increases of 10% through fiscal 2007 and 7% thereafter.
A healthcare cost trend rate is not used in the calculations of postretirement benefit obligations because Sysco subsidizes the cost of postretirement medical coverage by a fixed dollar amount, with the retiree responsible for the cost of coverage in excess of the subsidy, including all future cost increases.
For guidance in determining the discount rate, Sysco calculates the implied rate of return on a hypothetical portfolio of high-quality fixed-income investments for which the timing and amount of cash outflows approximates the estimated payouts of the company-sponsored pension plans. The discount rate assumption is reviewed annually and revised as deemed appropriate. The discount rate to be used for the calculation of fiscal 2010 net company-sponsored benefit costs for the Retirement Plan and Other Postretirement Plans is 8.02%. The discount rate to be used for the calculation of fiscal 2010 net company-sponsored benefit costs for the SERP is 7.14%.
The expected long-term rate of return on plan assets is derived from a mathematical asset model that incorporates assumptions as to the various asset class returns, reflecting a combination of rigorous historical performance analysis and the forward-looking views of the financial markets regarding the yield on long-term bonds and the historical returns of the major stock markets. The rate of return assumption is reviewed annually and revised as deemed appropriate. In fiscal 2009, the expected long-term rate of return on plan assets assumption was changed to a net return on assets assumption, which contributed to the 0.50% decrease in the assumption to 8.00% in fiscal 2009. Prior to fiscal 2009, this assumption represented gross return on assets, and plan expenses were reflected within service cost. Due to this change, beginning in fiscal 2009, actual expenses are no longer reflected in the change in benefit obligation and change in plan assets sections of funded status table above. The expected long-term rate of return to be used in the calculation of fiscal 2010 net company-sponsored benefit costs for the Retirement Plan is 8.00%.
Investment Policy and Assets
Sysco’s investment objectives target a mix of investments that can potentially achieve an above-average rate of return. Sysco has determined that this strategy is appropriate due to the relatively low ratio of retirees as a percentage of participants, low average years of participant service and low average age of participants and is willing to accept the above-average level of short-term risk and variability in returns to attempt to achieve a higher level of long-term returns. As a result, the company’s strategy targets a mix of investments that include 67.5% equity (including a mix of large capitalization U.S. stocks, small- to mid-capitalization U.S. stocks and international stocks), 30% fixed income investments and 2.5% real estate. Securities within fixed income investments may include derivative securities, which were insignificant in fiscal 2009 and 2008.
The percentage of the fair value of plan assets by asset category is as follows:
14. SHAREHOLDERS’ EQUITY
Basic earnings per share has been computed by dividing net earnings by the weighted average number of shares of common stock outstanding for each respective year. Diluted earnings per share has been computed by dividing net earnings by the weighted average number of shares of common stock outstanding during those respective years adjusted for the dilutive effect of stock options outstanding using the treasury stock method.
58
June 27, 2009 June 28, 2008
Equity securities 60.6 % 68.8 % Debt securities 38.1 31.2 Real estate 1.3 —
Total 100.0 100.0

Table of Contents
A reconciliation of the numerators and the denominators of the basic and diluted earnings per share computations for the periods presented follows:
The number of options that were not included in the diluted earnings per share calculation because the effect would have been anti-dilutive was approximately 63,000,000, 33,400,000 and 21,900,000 for fiscal 2009, 2008 and 2007, respectively.
Dividends declared were $557,487,000, $513,593,000 and $456,438,000 in fiscal 2009, 2008 and 2007, respectively. Included in dividends declared for each year were dividends declared but not yet paid at year-end of approximately $142,000,000, $132,000,000 and $116,000,000 in fiscal 2009, 2008 and 2007, respectively.
15. COMPREHENSIVE INCOME
Comprehensive income is net earnings plus certain other items that are recorded directly to shareholders’ equity. Comprehensive income was $846,730,000, $1,018,664,000 and $1,030,025,000 in fiscal 2009, 2008 and 2007, respectively.
A summary of the components of other comprehensive income (loss) and the related tax effects for each of the years presented is as follows:
59
2009 2008 2007 Numerator:
Net earnings $ 1,055,948,000 $ 1,106,151,000 $ 1,001,076,000
Denominator:
Weighted-average basic shares outstanding 595,127,577 605,905,545 618,332,752 Dilutive effect of employee and director stock options 941,627 5,065,238 8,034,046
Weighted-average diluted shares outstanding 596,069,204 610,970,783 626,366,798
Basic earnings per share: $ 1.77 $ 1.83 $ 1.62
Diluted earnings per share: $ 1.77 $ 1.81 $ 1.60
2009 Before-Tax Amount Income Tax After- Tax Amount Foreign currency translation adjustment $ (84,452,000 ) $ — $ (84,452,000 ) Amortization of cash flow hedge 694,000 266,000 428,000 Amortization of prior service cost 3,923,000 1,505,000 2,418,000 Amortization of net actuarial loss (gain), net 17,571,000 6,747,000 10,824,000 Amortization of transition obligation 153,000 60,000 93,000 Pension liability assumption (26,704,000 ) (10,254,000 ) (16,450,000 ) Prior service cost arising in current year (575,000 ) (221,000 ) (354,000 ) Net actuarial (loss) gain, net arising in current year (197,604,000 ) (75,879,000 ) (121,725,000 )
Other comprehensive loss $ (286,994,000 ) $ (77,776,000 ) $ (209,218,000 )
2008 Before-Tax Amount Income Tax After- Tax Amount Foreign currency translation adjustment $ 30,514,000 $ — $ 30,514,000 Amortization of cash flow hedge 693,000 266,000 427,000 Amortization of prior service cost 6,128,000 2,351,000 3,777,000 Amortization of net actuarial loss (gain), net 3,253,000 1,250,000 2,003,000 Amortization of transition obligation 153,000 60,000 93,000 Prior service credit arising in current year 30,048,000 11,538,000 18,510,000 Net actuarial (loss) gain, net arising in current year (231,836,000 ) (89,025,000 ) (142,811,000 )
Other comprehensive loss $ (161,047,000 ) $ (73,560,000 ) $ (87,487,000 )
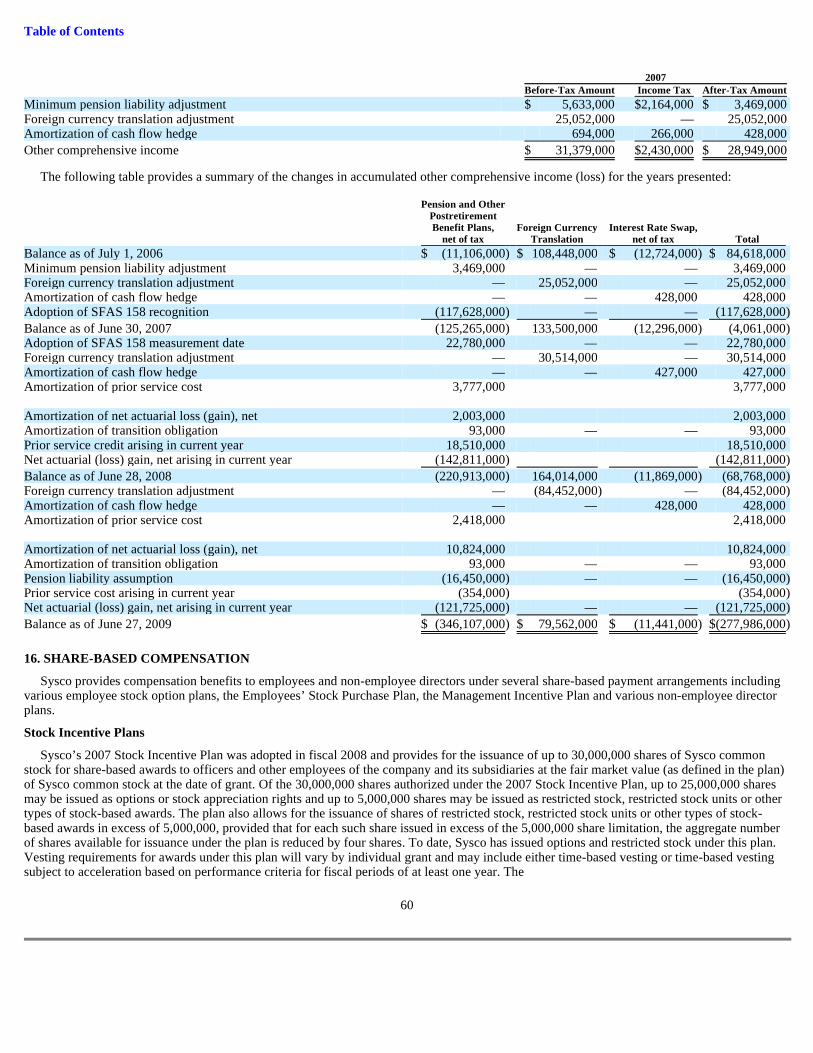
Table of Contents
The following table provides a summary of the changes in accumulated other comprehensive income (loss) for the years presented:
16. SHARE-BASED COMPENSATION
Sysco provides compensation benefits to employees and non-employee directors under several share-based payment arrangements including various employee stock option plans, the Employees’ Stock Purchase Plan, the Management Incentive Plan and various non-employee director plans.
Stock Incentive Plans
Sysco’s 2007 Stock Incentive Plan was adopted in fiscal 2008 and provides for the issuance of up to 30,000,000 shares of Sysco common stock for share-based awards to officers and other employees of the company and its subsidiaries at the fair market value (as defined in the plan) of Sysco common stock at the date of grant. Of the 30,000,000 shares authorized under the 2007 Stock Incentive Plan, up to 25,000,000 shares may be issued as options or stock appreciation rights and up to 5,000,000 shares may be issued as restricted stock, restricted stock units or other types of stock-based awards. The plan also allows for the issuance of shares of restricted stock, restricted stock units or other types of stock-based awards in excess of 5,000,000, provided that for each such share issued in excess of the 5,000,000 share limitation, the aggregate number of shares available for issuance under the plan is reduced by four shares. To date, Sysco has issued options and restricted stock under this plan. Vesting requirements for awards under this plan will vary by individual grant and may include either time-based vesting or time-based vesting subject to acceleration based on performance criteria for fiscal periods of at least one year. The
60
2007 Before-Tax Amount Income Tax After -Tax Amount Minimum pension liability adjustment $ 5,633,000 $ 2,164,000 $ 3,469,000 Foreign currency translation adjustment 25,052,000 — 25,052,000 Amortization of cash flow hedge 694,000 266,000 428,000
Other comprehensive income $ 31,379,000 $ 2,430,000 $ 28,949,000
Pension and Other Postretirement Benefit Plans, Foreign Currency Interest Rate Swap, net of tax Translation net of tax Total Balance as of July 1, 2006 $ (11,106,000 ) $ 108,448,000 $ (12,724,000 ) $ 84,618,000 Minimum pension liability adjustment 3,469,000 — — 3,469,000 Foreign currency translation adjustment — 25,052,000 — 25,052,000 Amortization of cash flow hedge — — 428,000 428,000 Adoption of SFAS 158 recognition (117,628,000 ) — — (117,628,000 )
Balance as of June 30, 2007 (125,265,000 ) 133,500,000 (12,296,000 ) (4,061,000 ) Adoption of SFAS 158 measurement date 22,780,000 — — 22,780,000 Foreign currency translation adjustment — 30,514,000 — 30,514,000 Amortization of cash flow hedge — — 427,000 427,000 Amortization of prior service cost 3,777,000 3,777,000 Amortization of net actuarial loss (gain), net 2,003,000 2,003,000 Amortization of transition obligation 93,000 — — 93,000 Prior service credit arising in current year 18,510,000 18,510,000 Net actuarial (loss) gain, net arising in current year (142,811,000 ) (142,811,000 )
Balance as of June 28, 2008 (220,913,000 ) 164,014,000 (11,869,000 ) (68,768,000 ) Foreign currency translation adjustment — (84,452,000 ) — (84,452,000 ) Amortization of cash flow hedge — — 428,000 428,000 Amortization of prior service cost 2,418,000 2,418,000 Amortization of net actuarial loss (gain), net 10,824,000 10,824,000 Amortization of transition obligation 93,000 — — 93,000 Pension liability assumption (16,450,000 ) — — (16,450,000 ) Prior service cost arising in current year (354,000 ) (354,000 ) Net actuarial (loss) gain, net arising in current year (121,725,000 ) — — (121,725,000 )
Balance as of June 27, 2009 $ (346,107,000 ) $ 79,562,000 $ (11,441,000 ) $ (277,986,000 )
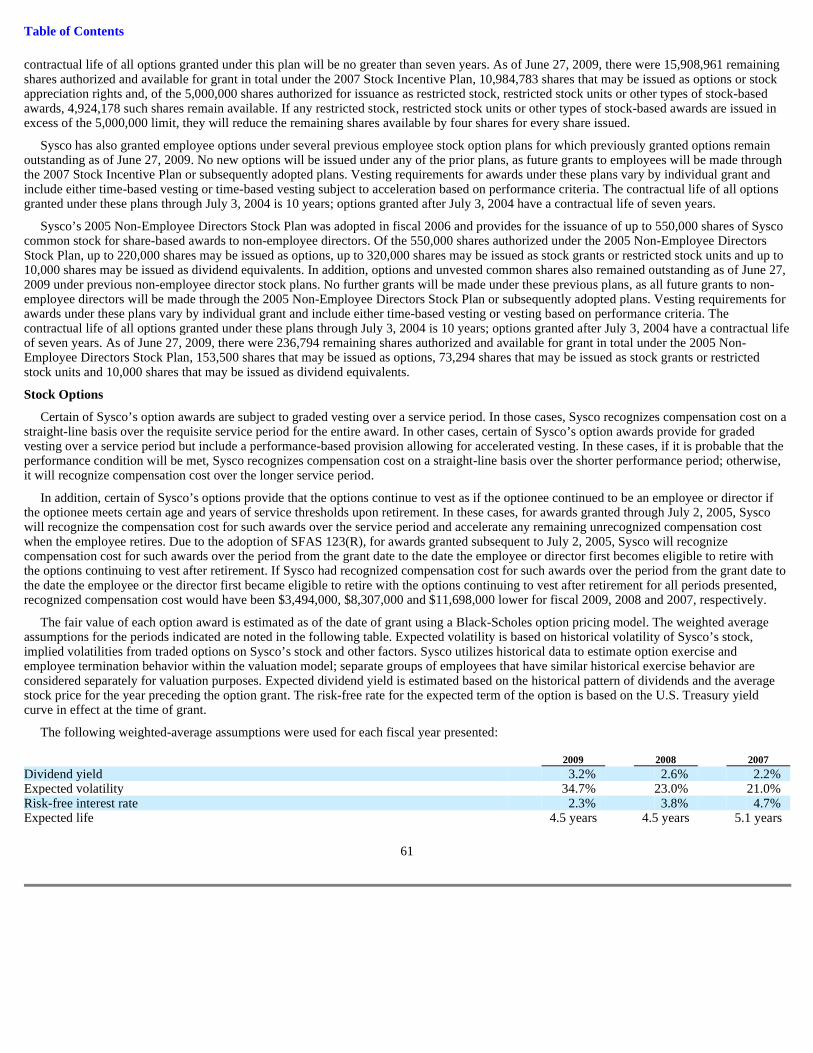
Table of Contents
contractual life of all options granted under this plan will be no greater than seven years. As of June 27, 2009, there were 15,908,961 remaining shares authorized and available for grant in total under the 2007 Stock Incentive Plan, 10,984,783 shares that may be issued as options or stock appreciation rights and, of the 5,000,000 shares authorized for issuance as restricted stock, restricted stock units or other types of stock-based awards, 4,924,178 such shares remain available. If any restricted stock, restricted stock units or other types of stock-based awards are issued in excess of the 5,000,000 limit, they will reduce the remaining shares available by four shares for every share issued.
Sysco has also granted employee options under several previous employee stock option plans for which previously granted options remain outstanding as of June 27, 2009. No new options will be issued under any of the prior plans, as future grants to employees will be made through the 2007 Stock Incentive Plan or subsequently adopted plans. Vesting requirements for awards under these plans vary by individual grant and include either time-based vesting or time-based vesting subject to acceleration based on performance criteria. The contractual life of all options granted under these plans through July 3, 2004 is 10 years; options granted after July 3, 2004 have a contractual life of seven years.
Sysco’s 2005 Non-Employee Directors Stock Plan was adopted in fiscal 2006 and provides for the issuance of up to 550,000 shares of Sysco common stock for share-based awards to non-employee directors. Of the 550,000 shares authorized under the 2005 Non-Employee Directors Stock Plan, up to 220,000 shares may be issued as options, up to 320,000 shares may be issued as stock grants or restricted stock units and up to 10,000 shares may be issued as dividend equivalents. In addition, options and unvested common shares also remained outstanding as of June 27, 2009 under previous non-employee director stock plans. No further grants will be made under these previous plans, as all future grants to non-employee directors will be made through the 2005 Non-Employee Directors Stock Plan or subsequently adopted plans. Vesting requirements for awards under these plans vary by individual grant and include either time-based vesting or vesting based on performance criteria. The contractual life of all options granted under these plans through July 3, 2004 is 10 years; options granted after July 3, 2004 have a contractual life of seven years. As of June 27, 2009, there were 236,794 remaining shares authorized and available for grant in total under the 2005 Non-Employee Directors Stock Plan, 153,500 shares that may be issued as options, 73,294 shares that may be issued as stock grants or restricted stock units and 10,000 shares that may be issued as dividend equivalents.
Stock Options
Certain of Sysco’s option awards are subject to graded vesting over a service period. In those cases, Sysco recognizes compensation cost on a straight-line basis over the requisite service period for the entire award. In other cases, certain of Sysco’s option awards provide for graded vesting over a service period but include a performance-based provision allowing for accelerated vesting. In these cases, if it is probable that the performance condition will be met, Sysco recognizes compensation cost on a straight-line basis over the shorter performance period; otherwise, it will recognize compensation cost over the longer service period.
In addition, certain of Sysco’s options provide that the options continue to vest as if the optionee continued to be an employee or director if the optionee meets certain age and years of service thresholds upon retirement. In these cases, for awards granted through July 2, 2005, Sysco will recognize the compensation cost for such awards over the service period and accelerate any remaining unrecognized compensation cost when the employee retires. Due to the adoption of SFAS 123(R), for awards granted subsequent to July 2, 2005, Sysco will recognize compensation cost for such awards over the period from the grant date to the date the employee or director first becomes eligible to retire with the options continuing to vest after retirement. If Sysco had recognized compensation cost for such awards over the period from the grant date to the date the employee or the director first became eligible to retire with the options continuing to vest after retirement for all periods presented, recognized compensation cost would have been $3,494,000, $8,307,000 and $11,698,000 lower for fiscal 2009, 2008 and 2007, respectively.
The fair value of each option award is estimated as of the date of grant using a Black-Scholes option pricing model. The weighted average assumptions for the periods indicated are noted in the following table. Expected volatility is based on historical volatility of Sysco’s stock, implied volatilities from traded options on Sysco’s stock and other factors. Sysco utilizes historical data to estimate option exercise and employee termination behavior within the valuation model; separate groups of employees that have similar historical exercise behavior are considered separately for valuation purposes. Expected dividend yield is estimated based on the historical pattern of dividends and the average stock price for the year preceding the option grant. The risk-free rate for the expected term of the option is based on the U.S. Treasury yield curve in effect at the time of grant.
The following weighted-average assumptions were used for each fiscal year presented:
61
2009 2008 2007
Dividend yield 3.2 % 2.6 % 2.2 % Expected volatility 34.7 % 23.0 % 21.0 % Risk-free interest rate 2.3 % 3.8 % 4.7 % Expected life 4.5 years 4.5 years 5.1 years

Table of Contents
The following summary presents information regarding outstanding options as of June 27, 2009 and changes during the fiscal year then ended with regard to options under all stock option plans:
The total number of employee options granted was 8,089,750, 6,438,968 and 6,504,200 in fiscal years 2009, 2008 and 2007, respectively. During fiscal 2009, 1,395,000 options were granted to 12 executive officers and 6,694,750 options were granted to approximately 1,700 other key employees. During fiscal 2008, 699,000 options were granted to 12 executive officers and 5,739,968 options were granted to approximately 1,500 other key employees. During fiscal 2007, 594,000 options were granted to 9 executive officers and 5,910,200 options were granted to approximately 1,600 other key employees.
The weighted average grant-date fair value of options granted in fiscal 2009, 2008 and 2007 was $5.88, $6.50 and $6.85, respectively. The total intrinsic value of options exercised during fiscal 2009, 2008 and 2007 was $24,418,000, $33,601,000 and $73,124,000, respectively.
Restricted Stock
In fiscal 2009, 75,822 shares of restricted stock were granted to an executive officer from the 2007 Stock Incentive Plan. The fair value of these shares was $23.74 per share, which was based on the stock price on the grant date. These shares will vest one-third each year over a three-year period. All of these shares remain unvested at June 27, 2009.
Employees’ Stock Purchase Plan
Sysco has an Employees’ Stock Purchase Plan that permits employees to invest in Sysco common stock by means of periodic payroll deductions at 85% of the closing price on the last business day of each calendar quarter. In November 2007, the Employees’ Stock Purchase Plan was amended to reserve an additional 6,000,000 shares of Sysco common stock for issuance under the plan. Including the additional 6,000,000 shares reserved in fiscal 2008, the total number of shares which may be sold pursuant to the plan may not exceed 74,000,000 shares, of which 5,384,982 remained available as of June 27, 2009.
During fiscal 2009, 2,031,695 shares of Sysco common stock were purchased by the participants as compared to 1,769,421 shares purchased in fiscal 2008 and 1,708,250 shares purchased in fiscal 2007. In July 2009, 540,517 shares were purchased by participants.
The weighted average fair value of employee stock purchase rights issued pursuant to the Employees’ Stock Purchase Plan was $3.85, $4.81 and $5.02 per share during fiscal 2009, 2008 and 2007, respectively. The fair value of the stock purchase rights was calculated as the difference between the stock price at date of issuance and the employee purchase price.
Management Incentive Compensation
Sysco’s Management Incentive Plan compensates key management personnel for specific performance achievements. With respect to bonuses for fiscal 2008 and earlier years, the bonuses earned and expensed under this plan were paid in the following fiscal year in both cash and stock or deferred for payment in future years at the election of each participant. The stock awards under this plan immediately vested upon issuance; however, participants are restricted from selling, transferring, giving or otherwise conveying the shares for a period of two years from the date of issuance of such shares. The fair value of the stock issued under the Management Incentive Plan was based on the stock price less a 12% discount for post-vesting restrictions. The discount for post-vesting restrictions is estimated based on restricted stock studies and by calculating the cost of a hypothetical protective put option over the restriction period. In May 2008, the Management Incentive Plan was amended to remove the stock component of the bonus structure. Therefore, there will be no stock award component for the fiscal 2009 bonus or any future bonuses under this plan.
A total of 672,087 shares, 588,143 shares and 323,822 shares at a fair value of $28.22, $32.99 and $30.56, respectively, were issued pursuant to this plan in fiscal 2009, 2008 and 2007, respectively, for bonuses earned in the preceding fiscal years.
62
Weighted Average Weighted Average Remaining Exercise Price Per Contractual Term (in Aggregate Intrinsic Shares Under Option Share years) Value Outstanding as of June 28, 2008 65,244,300 $ 30.05 Granted 8,089,750 24.93 Exercised (3,074,147 ) 23.91 Forfeited (723,601 ) 29.76 Expired (1,104,790 ) 30.55
Outstanding as of June 27, 2009 68,431,512 $ 29.72 3.58 $ 9,236,000
Vested or expected to vest as of June 27, 2009 66,866,317 $ 29.72 3.55 $ 9,236,000
Exercisable as of June 27, 2009 48,437,040 $ 29.78 2.95 $ 9,072,000
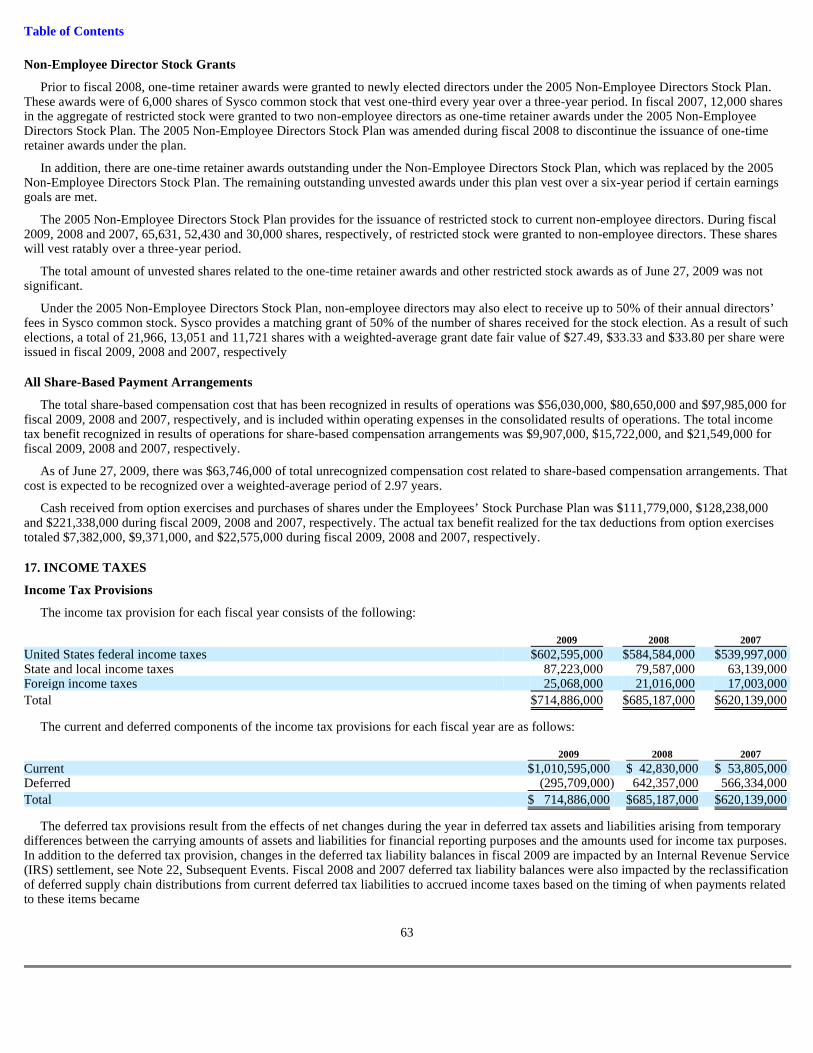
Table of Contents
Non-Employee Director Stock Grants
Prior to fiscal 2008, one-time retainer awards were granted to newly elected directors under the 2005 Non-Employee Directors Stock Plan. These awards were of 6,000 shares of Sysco common stock that vest one-third every year over a three-year period. In fiscal 2007, 12,000 shares in the aggregate of restricted stock were granted to two non-employee directors as one-time retainer awards under the 2005 Non-Employee Directors Stock Plan. The 2005 Non-Employee Directors Stock Plan was amended during fiscal 2008 to discontinue the issuance of one-time retainer awards under the plan.
In addition, there are one-time retainer awards outstanding under the Non-Employee Directors Stock Plan, which was replaced by the 2005 Non-Employee Directors Stock Plan. The remaining outstanding unvested awards under this plan vest over a six-year period if certain earnings goals are met.
The 2005 Non-Employee Directors Stock Plan provides for the issuance of restricted stock to current non-employee directors. During fiscal 2009, 2008 and 2007, 65,631, 52,430 and 30,000 shares, respectively, of restricted stock were granted to non-employee directors. These shares will vest ratably over a three-year period.
The total amount of unvested shares related to the one-time retainer awards and other restricted stock awards as of June 27, 2009 was not significant.
Under the 2005 Non-Employee Directors Stock Plan, non-employee directors may also elect to receive up to 50% of their annual directors’ fees in Sysco common stock. Sysco provides a matching grant of 50% of the number of shares received for the stock election. As a result of such elections, a total of 21,966, 13,051 and 11,721 shares with a weighted-average grant date fair value of $27.49, $33.33 and $33.80 per share were issued in fiscal 2009, 2008 and 2007, respectively
All Share-Based Payment Arrangements
The total share-based compensation cost that has been recognized in results of operations was $56,030,000, $80,650,000 and $97,985,000 for fiscal 2009, 2008 and 2007, respectively, and is included within operating expenses in the consolidated results of operations. The total income tax benefit recognized in results of operations for share-based compensation arrangements was $9,907,000, $15,722,000, and $21,549,000 for fiscal 2009, 2008 and 2007, respectively.
As of June 27, 2009, there was $63,746,000 of total unrecognized compensation cost related to share-based compensation arrangements. That cost is expected to be recognized over a weighted-average period of 2.97 years.
Cash received from option exercises and purchases of shares under the Employees’ Stock Purchase Plan was $111,779,000, $128,238,000 and $221,338,000 during fiscal 2009, 2008 and 2007, respectively. The actual tax benefit realized for the tax deductions from option exercises totaled $7,382,000, $9,371,000, and $22,575,000 during fiscal 2009, 2008 and 2007, respectively.
17. INCOME TAXES
Income Tax Provisions
The income tax provision for each fiscal year consists of the following:
The current and deferred components of the income tax provisions for each fiscal year are as follows:
The deferred tax provisions result from the effects of net changes during the year in deferred tax assets and liabilities arising from temporary differences between the carrying amounts of assets and liabilities for financial reporting purposes and the amounts used for income tax purposes. In addition to the deferred tax provision, changes in the deferred tax liability balances in fiscal 2009 are impacted by an Internal Revenue Service (IRS) settlement, see Note 22, Subsequent Events. Fiscal 2008 and 2007 deferred tax liability balances were also impacted by the reclassification of deferred supply chain distributions from current deferred tax liabilities to accrued income taxes based on the timing of when payments related to these items became
63
2009 2008 2007 United States federal income taxes $ 602,595,000 $ 584,584,000 $ 539,997,000 State and local income taxes 87,223,000 79,587,000 63,139,000 Foreign income taxes 25,068,000 21,016,000 17,003,000
Total $ 714,886,000 $ 685,187,000 $ 620,139,000
2009 2008 2007 Current $ 1,010,595,000 $ 42,830,000 $ 53,805,000 Deferred (295,709,000 ) 642,357,000 566,334,000
Total $ 714,886,000 $ 685,187,000 $ 620,139,000

Table of Contents
payable. This reclassification was $575,248,000 in fiscal 2008. In fiscal 2008, deferred supply chain distributions were classified as current or deferred tax liabilities based on when the related income tax payments were payable.
Deferred Tax Assets and Liabilities
Significant components of Sysco’s deferred tax assets and liabilities are as follows:
The company had state and Canadian net operating tax losses as of June 27, 2009 and June 28, 2008. The net operating tax losses outstanding as of June 27, 2009 expire in fiscal years 2010 through 2029. A valuation allowance of $24,994,000 was recorded for the state tax loss carryforwards as of June 27, 2009, as management believes that it is more likely than not that a portion of the benefits of these state tax loss carryforwards will not be realized. As of June 28, 2008, valuation allowances recorded were $39,020,000 for both state and Canadian tax loss carryforwards. Both the net operating tax loss carryforwards and the valuation allowances were impacted by the company’s adoption of FIN 48 by a reduction of $14,705,000 at the date of adoption on July 1, 2008.
Effective Tax Rates
Reconciliations of the statutory federal income tax rate to the effective income tax rates for each fiscal year are as follows:
The effective tax rate for fiscal 2009 was negatively impacted primarily by two factors. First, the company recorded tax adjustments related to federal and state uncertain tax positions of $31,000,000. Second, the loss of $43,812,000, which had a tax effect of $16,824,000, recorded to adjust the carrying value of corporate-owned life insurance to their cash surrender values was non-deductible for income tax purposes and had the impact of increasing the effective tax rate for the period. The effective tax rate for fiscal 2009 was favorably impacted by the reversal of valuation allowances of $7,800,000 previously recorded on Canadian net operating loss deferred tax assets.
64
June 27, 2009 June 28, 2008 Deferred tax liabilities:
Deferred supply chain distributions $ 750,755,000 $ 1,054,190,000 Excess tax depreciation and basis differences of assets 395,656,000 369,203,000 Other 14,190,000 20,601,000
Total deferred tax liabilities 1,160,601,000 1,443,994,000 Deferred tax assets:
Net operating tax loss carryforwards 75,079,000 73,481,000 Benefit on unrecognized tax benefits 55,609,000 73,837,000 Pension 156,809,000 76,500,000 Deferred compensation 54,485,000 54,805,000 Self-insured liabilities 40,912,000 41,390,000 Receivables 44,799,000 30,650,000 Inventory 39,491,000 40,355,000 Other 29,669,000 35,535,000
Total deferred tax assets 496,853,000 426,553,000
Valuation allowances 24,994,000 39,020,000
Total net deferred tax liabilities $ 688,742,000 $ 1,056,461,000
2009 2008 2007 United States statutory federal income tax rate 35.00 % 35.00 % 35.00 % State, local and foreign income taxes, net of any applicable federal income tax benefit 1.63 1.14 2.15 Impact of provisions for uncertain tax benefits 1.75 0.64 — Impact of adjusting carrying value of corporate-owned life insurance policies to their cash
surrender values 0.95 0.19 (0.52 ) Impact of share-based compensation 0.59 0.85 0.93 Other 0.45 0.43 0.69
40.37 % 38.25 % 38.25 %

Table of Contents
The effective tax rate for fiscal 2008 was favorably impacted by tax benefits of approximately $7,700,000 resulting from the recognition of a net operating loss deferred tax asset which arose due to a state tax law change, $8,600,000 related to the reversal of valuation allowances previously recorded on Canadian net operating loss deferred tax assets and $5,500,000 related to the reduction in net Canadian deferred tax liabilities due to a federal tax rate reduction. The effective tax rate for fiscal 2008 was negatively impacted by the recording of tax and interest related to uncertain tax positions, share-based compensation expense and the recognition of losses of $8,718,000, which had a tax effect of $3,348,000, recorded to adjust the carrying value of corporate-owned life insurance policies to their cash surrender values.
The effective tax rate for fiscal 2007 was favorably impacted by the recognition of gains of $23,922,000, which had a tax effect of $9,186,000, recorded to adjust the carrying value of corporate-owned life insurance policies to their cash surrender values. The effective tax rate for fiscal 2007 was negatively impacted by the recognition of tax and interest for tax contingencies.
Sysco’s option grants include options that qualify as incentive stock options for income tax purposes. The treatment of the potential tax deduction, if any, related to incentive stock may cause variability in the company’s effective tax rate. In the period the compensation cost related to incentive stock options is recorded, a corresponding tax benefit is not recorded as it is assumed that the company will not receive a tax deduction related to such incentive stock options. The company may be eligible for tax deductions in subsequent periods to the extent that there is a disqualifying disposition of the incentive stock option. In such cases, the company would record a tax benefit related to the tax deduction in an amount not to exceed the corresponding cumulative compensation cost recorded in the financial statements on the particular options multiplied by the statutory tax rate.
Sysco recorded a tax benefit of $9,907,000 or 17.7% of the $56,030,000 in share-based compensation expense recorded in fiscal 2009. Sysco recorded a tax benefit of $15,722,000 or 19.5% of the $80,650,000 in share-based compensation expense recorded in fiscal 2008. Sysco recorded a tax benefit of $21,549,000 or 22.0% of the $97,985,000 in share-based compensation expense recorded in fiscal 2007.
Uncertain Tax Positions
Prior to fiscal 2008, in evaluating the exposures connected with the various tax filing positions, the company established an accrual when, despite management’s belief that the company’s tax return positions are supportable, management believed that certain positions may be successfully challenged and a loss was probable. When facts and circumstances changed, these accruals were adjusted.
As discussed in Note 2, Changes in Accounting, the company adopted FIN 48 effective July 1, 2007. FIN 48 provides that a tax benefit from an uncertain tax position is recognized when it is more likely than not that the position will be sustained upon examination, including resolutions of any related appeals or litigation processes, based on the technical merits of the position. The amount recognized is measured as the largest amount of tax benefit that has a greater than 50% likelihood of being realized upon settlement. As a result of this adoption, the company recognized, as a cumulative effect of change in accounting principle, a $91,635,000 decrease in its beginning retained earnings on its July 1, 2007 balance sheet. A reconciliation of the beginning and ending amount of gross unrecognized tax benefits, excluding interest and penalties, is as follows:
As of June 27, 2009, the gross amount of accrued interest liabilities related to unrecognized tax benefits was $146,998,000, of which $41,000,000 is classified within accrued income taxes as payment is anticipated during fiscal 2010. See further discussion in Note 22, Subsequent Events. The amount of recorded interest expense related to unrecognized tax benefits in fiscal 2009 was $18,693,000. The company does not have any accrued liabilities for penalties related to unrecognized tax benefits and did not record any expense related to penalties in fiscal 2009. As of June 28, 2008, the gross amount of accrued interest liabilities was $138,207,000 related to unrecognized tax benefits and recorded interest expense of $12,287,000 in fiscal 2008. The company does not have any accrued liabilities for penalties related to unrecognized tax benefits and did not record any expense related to penalties in fiscal 2008. To the extent interest and penalties may be assessed by taxing authorities on any underpayment of income tax, estimated amounts required under FIN 48 have been accrued and are classified as a
65
2009 2008 Unrecognized tax benefits at beginning of year $ 87,929,000 $ 82,639,000 Additions for tax positions related to prior years 21,645,000 — Reductions for tax positions related to prior years (1,959,000 ) (138,000 ) Additions for tax positions related to the current year 10,935,000 7,912,000 Reductions for tax positions related to the current year — — Reductions due to settlements with taxing authorities (24,817,000 ) (223,000 ) Reductions due to lapse of applicable statute of limitations (1,588,000 ) (2,261,000 )
Unrecognized tax benefits at end of year $ 92,145,000 $ 87,929,000
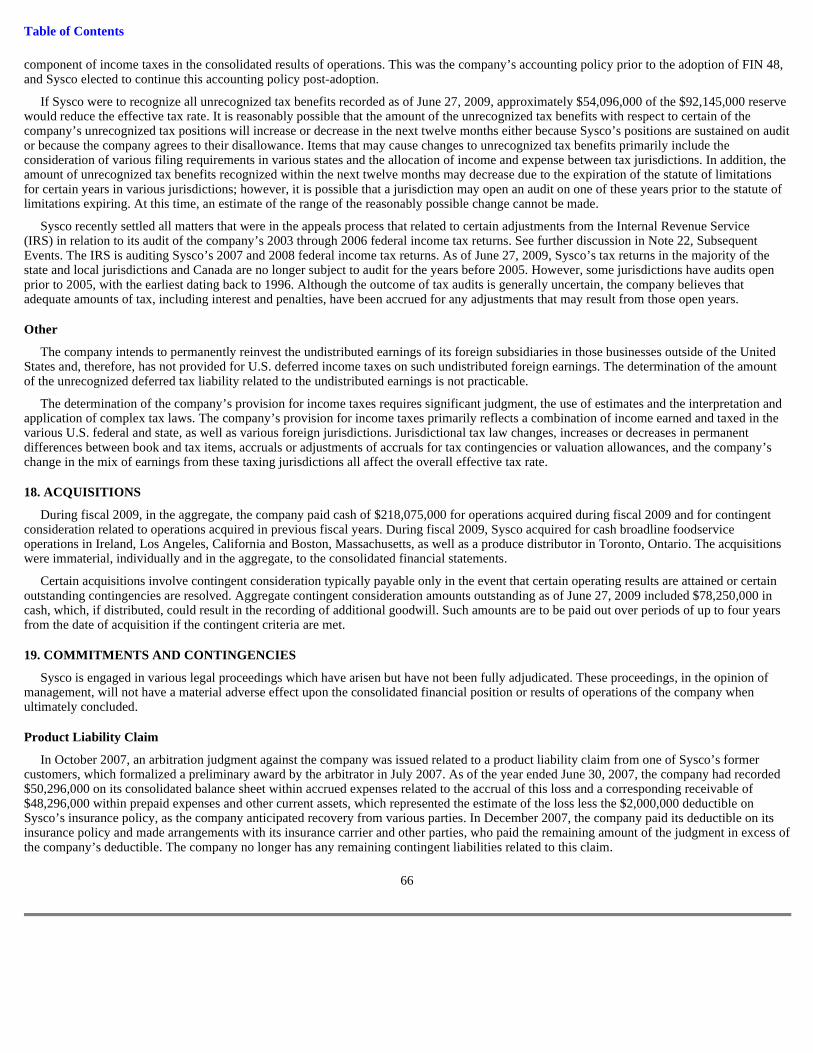
Table of Contents
component of income taxes in the consolidated results of operations. This was the company’s accounting policy prior to the adoption of FIN 48, and Sysco elected to continue this accounting policy post-adoption.
If Sysco were to recognize all unrecognized tax benefits recorded as of June 27, 2009, approximately $54,096,000 of the $92,145,000 reserve would reduce the effective tax rate. It is reasonably possible that the amount of the unrecognized tax benefits with respect to certain of the company’s unrecognized tax positions will increase or decrease in the next twelve months either because Sysco’s positions are sustained on audit or because the company agrees to their disallowance. Items that may cause changes to unrecognized tax benefits primarily include the consideration of various filing requirements in various states and the allocation of income and expense between tax jurisdictions. In addition, the amount of unrecognized tax benefits recognized within the next twelve months may decrease due to the expiration of the statute of limitations for certain years in various jurisdictions; however, it is possible that a jurisdiction may open an audit on one of these years prior to the statute of limitations expiring. At this time, an estimate of the range of the reasonably possible change cannot be made.
Sysco recently settled all matters that were in the appeals process that related to certain adjustments from the Internal Revenue Service (IRS) in relation to its audit of the company’s 2003 through 2006 federal income tax returns. See further discussion in Note 22, Subsequent Events. The IRS is auditing Sysco’s 2007 and 2008 federal income tax returns. As of June 27, 2009, Sysco’s tax returns in the majority of the state and local jurisdictions and Canada are no longer subject to audit for the years before 2005. However, some jurisdictions have audits open prior to 2005, with the earliest dating back to 1996. Although the outcome of tax audits is generally uncertain, the company believes that adequate amounts of tax, including interest and penalties, have been accrued for any adjustments that may result from those open years.
Other
The company intends to permanently reinvest the undistributed earnings of its foreign subsidiaries in those businesses outside of the United States and, therefore, has not provided for U.S. deferred income taxes on such undistributed foreign earnings. The determination of the amount of the unrecognized deferred tax liability related to the undistributed earnings is not practicable.
The determination of the company’s provision for income taxes requires significant judgment, the use of estimates and the interpretation and application of complex tax laws. The company’s provision for income taxes primarily reflects a combination of income earned and taxed in the various U.S. federal and state, as well as various foreign jurisdictions. Jurisdictional tax law changes, increases or decreases in permanent differences between book and tax items, accruals or adjustments of accruals for tax contingencies or valuation allowances, and the company’s change in the mix of earnings from these taxing jurisdictions all affect the overall effective tax rate.
18. ACQUISITIONS
During fiscal 2009, in the aggregate, the company paid cash of $218,075,000 for operations acquired during fiscal 2009 and for contingent consideration related to operations acquired in previous fiscal years. During fiscal 2009, Sysco acquired for cash broadline foodservice operations in Ireland, Los Angeles, California and Boston, Massachusetts, as well as a produce distributor in Toronto, Ontario. The acquisitions were immaterial, individually and in the aggregate, to the consolidated financial statements.
Certain acquisitions involve contingent consideration typically payable only in the event that certain operating results are attained or certain outstanding contingencies are resolved. Aggregate contingent consideration amounts outstanding as of June 27, 2009 included $78,250,000 in cash, which, if distributed, could result in the recording of additional goodwill. Such amounts are to be paid out over periods of up to four years from the date of acquisition if the contingent criteria are met.
19. COMMITMENTS AND CONTINGENCIES
Sysco is engaged in various legal proceedings which have arisen but have not been fully adjudicated. These proceedings, in the opinion of management, will not have a material adverse effect upon the consolidated financial position or results of operations of the company when ultimately concluded.
Product Liability Claim
In October 2007, an arbitration judgment against the company was issued related to a product liability claim from one of Sysco’s former customers, which formalized a preliminary award by the arbitrator in July 2007. As of the year ended June 30, 2007, the company had recorded $50,296,000 on its consolidated balance sheet within accrued expenses related to the accrual of this loss and a corresponding receivable of $48,296,000 within prepaid expenses and other current assets, which represented the estimate of the loss less the $2,000,000 deductible on Sysco’s insurance policy, as the company anticipated recovery from various parties. In December 2007, the company paid its deductible on its insurance policy and made arrangements with its insurance carrier and other parties, who paid the remaining amount of the judgment in excess of the company’s deductible. The company no longer has any remaining contingent liabilities related to this claim.
66

Table of Contents
Multi-Employer Pension Plans
Sysco contributes to several multi-employer defined benefit pension plans based on obligations arising under collective bargaining agreements covering union-represented employees. Approximately 12% of Sysco’s current employees are participants in such multi-employer plans. In fiscal 2009, total contributions to these plans were approximately $47,982,000.
Sysco does not directly manage these multi-employer plans, which are generally managed by boards of trustees, half of whom are appointed by the unions and the other half by other employers contributing to the plan. Based upon the information available from plan administrators, management believes that several of these multi-employer plans are underfunded. In addition, the Pension Protection Act, enacted in August 2006, requires underfunded pension plans to improve their funding ratios within prescribed intervals based on the level of their underfunding. As a result, Sysco expects its contributions to these plans to increase in the future.
Under current law regarding multi-employer defined benefit plans, a plan’s termination, Sysco’s voluntary withdrawal, or the mass withdrawal of all contributing employers from any underfunded multi-employer defined benefit plan would require Sysco to make payments to the plan for Sysco’s proportionate share of the multi-employer plan’s unfunded vested liabilities. Based on the information available from plan administrators, Sysco estimates that its share of withdrawal liability on most of the multi-employer plans it participates in could be as much as $80,000,000 as of June 27, 2009 based on a voluntary withdrawal. Because the company is not provided with the information by plan administrators on a timely basis and the company expects that many multi-employer pension plans’ assets have declined due to recent financial market performance, management believes our share of the withdrawal liability could be greater. In addition, if a multi-employer defined benefit plan fails to satisfy certain minimum funding requirements, the IRS may impose a nondeductible excise tax of 5% on the amount of the accumulated funding deficiency for those employers contributing to the fund. As of June 27, 2009, Sysco had approximately $17,000,000 in liabilities recorded in total related to certain multi-employer defined benefit plans for which Sysco’s voluntary withdrawal has already occurred, all of which are expected to be paid during fiscal 2010.
During fiscal 2008, the company obtained information that a multi-employer pension plan it participated in failed to satisfy minimum funding requirements for certain periods and concluded that it was probable that additional funding would be required as well as the payment of excise tax. As a result, during fiscal 2008, Sysco recorded a liability of approximately $16,500,000 related to its share of the minimum funding requirements and related excise tax for these periods. During the first quarter of fiscal 2009, Sysco effectively withdrew from this multi-employer pension plan in an effort to secure benefits for Sysco’s employees that were participants in the plan and to manage the company’s exposure to this under-funded plan. Sysco agreed to pay $15,000,000 to the plan, which included the minimum funding requirements. In connection with this withdrawal agreement, Sysco merged participants from this plan into its company-sponsored Retirement Plan and assumed $26,704,000 in liabilities. The payment to the plan was made in the second quarter of fiscal 2009. If this plan were to undergo a mass withdrawal, as defined by the Pension Benefit Guaranty Corporation, prior to September 2010, the company could have additional liability. The company does not currently believe a mass withdrawal from this plan prior to September 2010 is probable.
Sysco has experienced other instances triggering voluntary withdrawal from multi-employer pension plans. Withdrawal liabilities incurred include $9,585,000 in fiscal 2009, $5,784,000 in fiscal 2008 and $4,700,000 in fiscal 2007.
Fuel Commitments
From time to time, Sysco may enter into forward purchase commitments for a portion of its projected diesel fuel requirements. As of June 27, 2009, we had forward diesel fuel commitments totaling approximately $64,000,000 through March 2010. In July 2009, we entered additional forward purchase commitments totaling approximately $16,000,000 at a fixed price through June 2010.
Other Commitments
Sysco has committed to product purchases for resale in order to leverage the company’s purchasing power. A majority of these agreements expire within one year, however certain agreements have terms through fiscal 2012. These agreements commit the company to a minimum volume at various pricing terms, including fixed pricing, variable pricing or a combination thereof. Minimum amounts committed to as of June 27, 2009 totaled approximately $2,074,738,000. Minimum amounts committed to by year are as follows: $1,434,622,000 in fiscal 2010, $535,978,000 in fiscal 2011 and $104,138,000 in fiscal 2012.
Sysco has committed with a third party service provider to provide hardware and hardware hosting services. The services are to be provided over a ten year period beginning in fiscal 2005 and ending in fiscal 2015. The total cost of the services over that period is expected to be approximately $510,000,000. This amount may be reduced by Sysco utilizing less than estimated resources and can be increased by Sysco utilizing more than estimated resources and the adjustments for inflation provided for in the agreements. Sysco may also cancel a portion or all of the services provided subject to termination fees which decrease
67
Table of Contents
over time. If Sysco were to terminate all of the services in fiscal 2010, the estimated termination fee incurred in fiscal 2010 would be approximately $9,700,000.
20. BUSINESS SEGMENT INFORMATION
The company has aggregated its operating companies into a number of segments, of which only Broadline and SYGMA are reportable segments as defined in SFAS No. 131, “Disclosures about Segments of an Enterprise and Related Information.” Broadline operating companies distribute a full line of food products and a wide variety of non-food products to its customers. SYGMA operating companies distribute a full line of food products and a wide variety of non-food products to certain chain restaurant customer locations. “Other” financial information is attributable to the company’s other operating segments, including the company’s specialty produce, custom-cut meat and lodging industry segments and a company that distributes to international customers.
The accounting policies for the segments are the same as those disclosed by Sysco. Intersegment sales represent specialty produce and meat company products distributed by the Broadline and SYGMA operating companies. The segment results include certain centrally incurred costs for shared services that are charged to our segments. These centrally incurred costs are charged based upon the relative level of service used by each operating company consistent with how Sysco’s management views the performance of its operating segments. Management evaluates the performance of each of our operating segments based on its respective operating income results, which include the allocation of certain centrally incurred costs.
Included in corporate expenses and consolidated adjustments, among other items, are:
68
• Gains and losses recognized to adjust corporate-owned life insurance policies to their cash surrender values;
• Share-based compensation expense related to stock option grants, restricted stock, issuances of stock pursuant to the Employees’ Stock Purchase Plan and stock grants to non-employee directors; and
• Corporate-level depreciation and amortization expense.

Table of Contents
The following table sets forth the financial information for Sysco’s business segments:
69
Fiscal Year 2009 2008 2007 (In thousands) Sales: Broadline $ 29,234,199 $ 29,824,553 $ 27,593,723 SYGMA 4,839,036 4,574,880 4,380,955 Other 3,242,115 3,590,738 3,537,865 Intersegment sales (462,020 ) (468,060 ) (470,468 )
Total $ 36,853,330 $ 37,522,111 $ 35,042,075
Operating income: Broadline $ 1,959,963 $ 1,931,881 $ 1,772,493 SYGMA 30,193 8,261 10,842 Other 101,355 136,533 132,508
Total segments 2,091,511 2,076,675 1,915,843 Corporate expenses and consolidated adjustments (219,300 ) (196,726 ) (207,361 )
Total operating income 1,872,211 1,879,949 1,708,482
Interest expense 116,322 111,541 105,002 Other income, net (14,945 ) (22,930 ) (17,735 )
Earnings before income taxes $ 1,770,834 $ 1,791,338 $ 1,621,215
Depreciation and amortization: Broadline $ 265,526 $ 258,171 $ 249,409 SYGMA 26,753 30,467 29,740 Other 37,629 36,692 30,368
Total segments 329,908 325,330 309,517 Corporate 52,431 47,199 53,042
Total $ 382,339 $ 372,529 $ 362,559
Capital expenditures: Broadline $ 342,550 $ 393,067 $ 405,015 SYGMA 5,053 4,977 41,596 Other 40,857 36,565 55,750
Total segments 388,460 434,609 502,361 Corporate 76,101 81,354 100,881
Total $ 464,561 $ 515,963 $ 603,242
Assets: Broadline $ 5,706,431 $ 5,880,738 $ 5,584,626 SYGMA 366,539 414,044 385,470 Other 914,764 1,005,740 918,025
Total segments 6,987,734 7,300,522 6,888,121 Corporate 3,228,885 2,781,771 2,630,810
Total $ 10,216,619 $ 10,082,293 $ 9,518,931
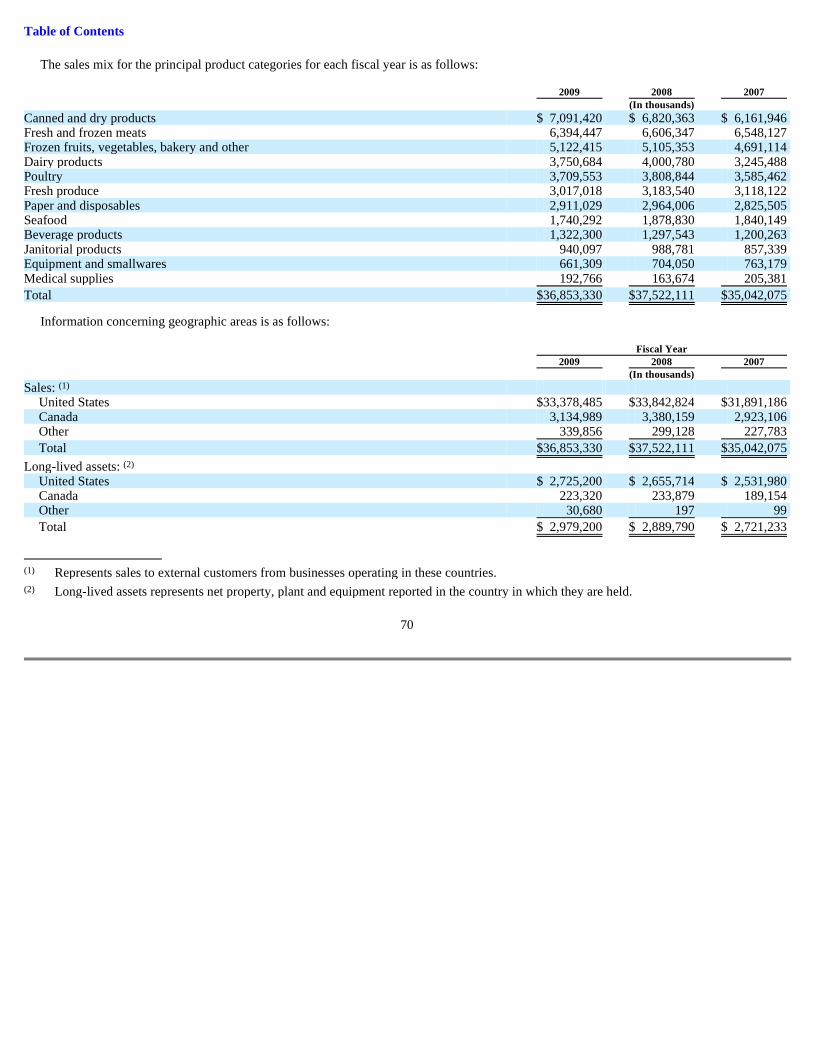
Table of Contents
The sales mix for the principal product categories for each fiscal year is as follows:
Information concerning geographic areas is as follows:
70
2009 2008 2007 (In thousands) Canned and dry products $ 7,091,420 $ 6,820,363 $ 6,161,946 Fresh and frozen meats 6,394,447 6,606,347 6,548,127 Frozen fruits, vegetables, bakery and other 5,122,415 5,105,353 4,691,114 Dairy products 3,750,684 4,000,780 3,245,488 Poultry 3,709,553 3,808,844 3,585,462 Fresh produce 3,017,018 3,183,540 3,118,122 Paper and disposables 2,911,029 2,964,006 2,825,505 Seafood 1,740,292 1,878,830 1,840,149 Beverage products 1,322,300 1,297,543 1,200,263 Janitorial products 940,097 988,781 857,339 Equipment and smallwares 661,309 704,050 763,179 Medical supplies 192,766 163,674 205,381
Total $ 36,853,330 $ 37,522,111 $ 35,042,075
Fiscal Year 2009 2008 2007 (In thousands) Sales: (1)
United States $ 33,378,485 $ 33,842,824 $ 31,891,186 Canada 3,134,989 3,380,159 2,923,106 Other 339,856 299,128 227,783
Total $ 36,853,330 $ 37,522,111 $ 35,042,075
Long-lived assets: (2) United States $ 2,725,200 $ 2,655,714 $ 2,531,980 Canada 223,320 233,879 189,154 Other 30,680 197 99
Total $ 2,979,200 $ 2,889,790 $ 2,721,233
(1) Represents sales to external customers from businesses operating in these countries.
(2) Long-lived assets represents net property, plant and equipment reported in the country in which they are held.

Table of Contents
21. SUPPLEMENTAL GUARANTOR INFORMATION
Sysco International, Co. is an unlimited liability company organized under the laws of the Province of Nova Scotia, Canada and is a wholly-owned subsidiary of Sysco. In May 2002, Sysco International, Co. issued, in a private offering, $200,000,000 of 6.10% notes due in 2012 (see Note 11, Debt). In December 2002, these notes were exchanged for substantially identical notes in an exchange offer registered under the Securities Act of 1933. These notes are fully and unconditionally guaranteed by Sysco. Sysco International, Co. is a holding company with no significant sources of income or assets, other than its equity interests in its subsidiaries and interest income from loans made to its subsidiaries. The proceeds from the issuance of the 6.10% notes were used to repay commercial paper issued to fund the fiscal 2002 acquisition of a Canadian broadline foodservice operation.
The following condensed consolidating financial statements present separately the financial position, results of operations and cash flows of the parent guarantor (Sysco), the subsidiary issuer (Sysco International) and all other non-guarantor subsidiaries of Sysco (Other Non-Guarantor Subsidiaries) on a combined basis and eliminating entries.
71
Condensed Consolidating Balance Sheet June 27, 2009 Other Non-Guarantor Sysco Sysco International Subsidiaries Eliminations Consolidated Totals (In thousands) Current assets $ 937,335 $ 36 $ 4,333,308 $ — $ 5,270,679 Investment in subsidiaries 13,293,437 403,363 165,197 (13,861,997 ) — Plant and equipment, net 264,657 — 2,714,543 — 2,979,200 Other assets 421,371 830 1,544,539 — 1,966,740
Total assets $ 14,916,800 $ 404,229 $ 8,757,587 $ (13,861,997 ) $ 10,216,619
Current liabilities $ 380,195 $ 954 $ 2,769,005 $ — $ 3,150,154 Intercompany payables (receivables) 8,533,159 54,785 (8,587,944 ) — — Long-term debt 2,219,655 199,816 48,015 — 2,467,486 Other liabilities 413,651 — 735,626 — 1,149,277 Shareholders’ equity 3,370,140 148,674 13,792,885 (13,861,997 ) 3,449,702
Total liabilities and shareholders’ equity $ 14,916,800 $ 404,229 $ 8,757,587 $ (13,861,997 ) $ 10,216,619
Condensed Consolidating Balance Sheet June 28, 2008 Other Non-Guarantor Sysco Sysco International Subsidiaries Eliminations Consolidated Totals (In thousands) Current assets $ 526,109 $ — $ 4,648,924 $ — $ 5,175,033 Investment in subsidiaries 14,202,506 398,065 118,041 (14,718,612 ) — Plant and equipment, net 202,778 — 2,687,012 — 2,889,790 Other assets 593,699 1,262 1,422,509 — 2,017,470
Total assets $ 15,525,092 $ 399,327 $ 8,876,486 $ (14,718,612 ) $ 10,082,293
Current liabilities $ 412,042 $ 986 $ 3,086,315 $ — $ 3,499,343 Intercompany payables (receivables) 9,670,465 100,027 (9,770,492 ) — — Long-term debt 1,729,401 199,752 46,282 — 1,975,435 Other liabilities 468,213 — 730,316 — 1,198,529 Shareholders’ equity 3,244,971 98,562 14,784,065 (14,718,612 ) 3,408,986
Total liabilities and shareholders’ equity $ 15,525,092 $ 399,327 $ 8,876,486 $ (14,718,612 ) $ 10,082,293
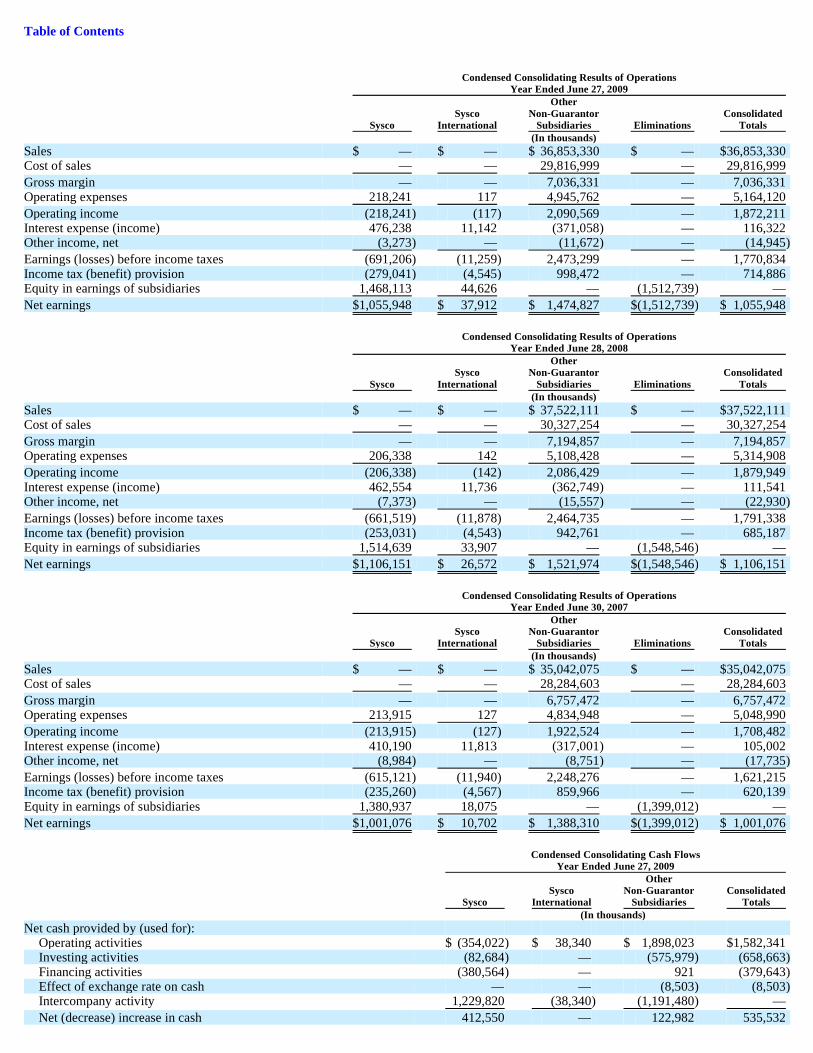
Table of Contents
Condensed Consolidating Results of Operations Year Ended June 27, 2009 Other Sysco Non-Guarantor Consolidated Sysco International Subsidiaries Eliminations Totals (In thousands) Sales $ — $ — $ 36,853,330 $ — $ 36,853,330 Cost of sales — — 29,816,999 — 29,816,999
Gross margin — — 7,036,331 — 7,036,331 Operating expenses 218,241 117 4,945,762 — 5,164,120
Operating income (218,241 ) (117 ) 2,090,569 — 1,872,211 Interest expense (income) 476,238 11,142 (371,058 ) — 116,322 Other income, net (3,273 ) — (11,672 ) — (14,945 )
Earnings (losses) before income taxes (691,206 ) (11,259 ) 2,473,299 — 1,770,834 Income tax (benefit) provision (279,041 ) (4,545 ) 998,472 — 714,886 Equity in earnings of subsidiaries 1,468,113 44,626 — (1,512,739 ) —
Net earnings $ 1,055,948 $ 37,912 $ 1,474,827 $ (1,512,739 ) $ 1,055,948
Condensed Consolidating Results of Operations Year Ended June 28, 2008 Other Sysco Non-Guarantor Consolidated Sysco International Subsidiaries Eliminations Totals (In thousands) Sales $ — $ — $ 37,522,111 $ — $ 37,522,111 Cost of sales — — 30,327,254 — 30,327,254
Gross margin — — 7,194,857 — 7,194,857 Operating expenses 206,338 142 5,108,428 — 5,314,908
Operating income (206,338 ) (142 ) 2,086,429 — 1,879,949 Interest expense (income) 462,554 11,736 (362,749 ) — 111,541 Other income, net (7,373 ) — (15,557 ) — (22,930 )
Earnings (losses) before income taxes (661,519 ) (11,878 ) 2,464,735 — 1,791,338 Income tax (benefit) provision (253,031 ) (4,543 ) 942,761 — 685,187 Equity in earnings of subsidiaries 1,514,639 33,907 — (1,548,546 ) —
Net earnings $ 1,106,151 $ 26,572 $ 1,521,974 $ (1,548,546 ) $ 1,106,151
Condensed Consolidating Results of Operations Year Ended June 30, 2007 Other Sysco Non-Guarantor Consolidated Sysco International Subsidiaries Eliminations Totals (In thousands) Sales $ — $ — $ 35,042,075 $ — $ 35,042,075 Cost of sales — — 28,284,603 — 28,284,603
Gross margin — — 6,757,472 — 6,757,472 Operating expenses 213,915 127 4,834,948 — 5,048,990
Operating income (213,915 ) (127 ) 1,922,524 — 1,708,482 Interest expense (income) 410,190 11,813 (317,001 ) — 105,002 Other income, net (8,984 ) — (8,751 ) — (17,735 )
Earnings (losses) before income taxes (615,121 ) (11,940 ) 2,248,276 — 1,621,215 Income tax (benefit) provision (235,260 ) (4,567 ) 859,966 — 620,139 Equity in earnings of subsidiaries 1,380,937 18,075 — (1,399,012 ) —
Net earnings $ 1,001,076 $ 10,702 $ 1,388,310 $ (1,399,012 ) $ 1,001,076
Condensed Consolidating Cash Flows Year Ended June 27, 2009 Other Sysco Non-Guarantor Consolidated Sysco International Subsidiaries Totals (In thousands) Net cash provided by (used for):
Operating activities $ (354,022 ) $ 38,340 $ 1,898,023 $ 1,582,341 Investing activities (82,684 ) — (575,979 ) (658,663 ) Financing activities (380,564 ) — 921 (379,643 ) Effect of exchange rate on cash — — (8,503 ) (8,503 ) Intercompany activity 1,229,820 (38,340 ) (1,191,480 ) —
Net (decrease) increase in cash 412,550 — 122,982 535,532

72
Cash at the beginning of the period 486,646 — 64,906 551,552
Cash at the end of the period $ 899,196 $ — $ 187,888 $ 1,087,084
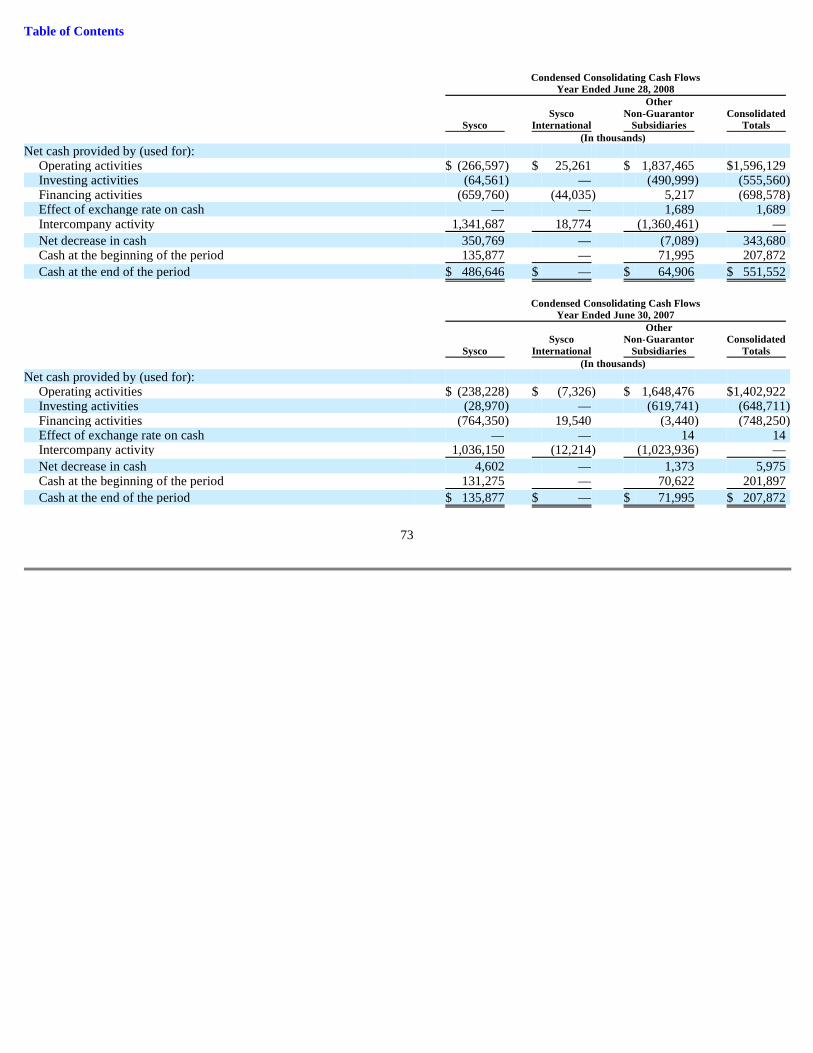
Table of Contents
73
Condensed Consolidating Cash Flows Year Ended June 28, 2008 Other Sysco Non-Guarantor Consolidated Sysco International Subsidiaries Totals (In thousands) Net cash provided by (used for):
Operating activities $ (266,597 ) $ 25,261 $ 1,837,465 $ 1,596,129 Investing activities (64,561 ) — (490,999 ) (555,560 ) Financing activities (659,760 ) (44,035 ) 5,217 (698,578 ) Effect of exchange rate on cash — — 1,689 1,689 Intercompany activity 1,341,687 18,774 (1,360,461 ) —
Net decrease in cash 350,769 — (7,089 ) 343,680 Cash at the beginning of the period 135,877 — 71,995 207,872
Cash at the end of the period $ 486,646 $ — $ 64,906 $ 551,552
Condensed Consolidating Cash Flows Year Ended June 30, 2007 Other Sysco Non-Guarantor Consolidated Sysco International Subsidiaries Totals (In thousands) Net cash provided by (used for):
Operating activities $ (238,228 ) $ (7,326 ) $ 1,648,476 $ 1,402,922 Investing activities (28,970 ) — (619,741 ) (648,711 ) Financing activities (764,350 ) 19,540 (3,440 ) (748,250 ) Effect of exchange rate on cash — — 14 14 Intercompany activity 1,036,150 (12,214 ) (1,023,936 ) —
Net decrease in cash 4,602 — 1,373 5,975 Cash at the beginning of the period 131,275 — 70,622 201,897
Cash at the end of the period $ 135,877 $ — $ 71,995 $ 207,872
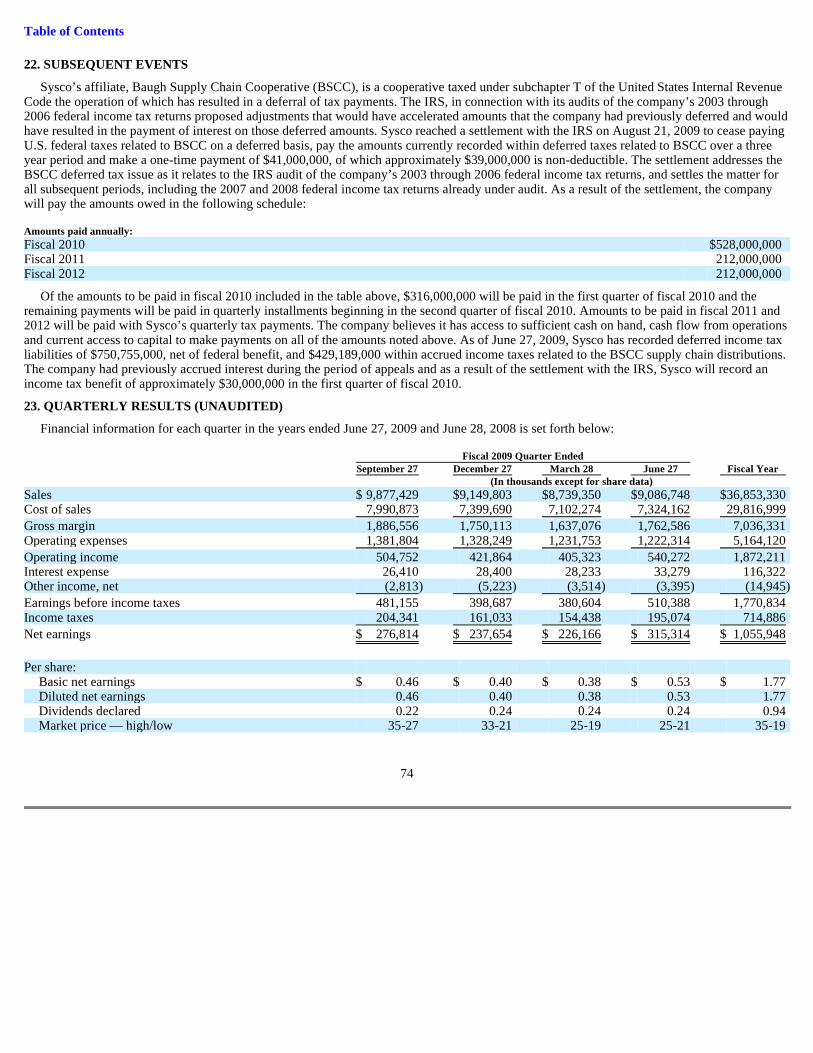
Table of Contents
22. SUBSEQUENT EVENTS
Sysco’s affiliate, Baugh Supply Chain Cooperative (BSCC), is a cooperative taxed under subchapter T of the United States Internal Revenue Code the operation of which has resulted in a deferral of tax payments. The IRS, in connection with its audits of the company’s 2003 through 2006 federal income tax returns proposed adjustments that would have accelerated amounts that the company had previously deferred and would have resulted in the payment of interest on those deferred amounts. Sysco reached a settlement with the IRS on August 21, 2009 to cease paying U.S. federal taxes related to BSCC on a deferred basis, pay the amounts currently recorded within deferred taxes related to BSCC over a three year period and make a one-time payment of $41,000,000, of which approximately $39,000,000 is non-deductible. The settlement addresses the BSCC deferred tax issue as it relates to the IRS audit of the company’s 2003 through 2006 federal income tax returns, and settles the matter for all subsequent periods, including the 2007 and 2008 federal income tax returns already under audit. As a result of the settlement, the company will pay the amounts owed in the following schedule:
Of the amounts to be paid in fiscal 2010 included in the table above, $316,000,000 will be paid in the first quarter of fiscal 2010 and the remaining payments will be paid in quarterly installments beginning in the second quarter of fiscal 2010. Amounts to be paid in fiscal 2011 and 2012 will be paid with Sysco’s quarterly tax payments. The company believes it has access to sufficient cash on hand, cash flow from operations and current access to capital to make payments on all of the amounts noted above. As of June 27, 2009, Sysco has recorded deferred income tax liabilities of $750,755,000, net of federal benefit, and $429,189,000 within accrued income taxes related to the BSCC supply chain distributions. The company had previously accrued interest during the period of appeals and as a result of the settlement with the IRS, Sysco will record an income tax benefit of approximately $30,000,000 in the first quarter of fiscal 2010.
23. QUARTERLY RESULTS (UNAUDITED)
Financial information for each quarter in the years ended June 27, 2009 and June 28, 2008 is set forth below:
74
Amounts paid annually: Fiscal 2010 $ 528,000,000 Fiscal 2011 212,000,000 Fiscal 2012 212,000,000
Fiscal 2009 Quarter Ended September 27 December 27 March 28 June 27 Fiscal Year (In thousands except for share data) Sales $ 9,877,429 $ 9,149,803 $ 8,739,350 $ 9,086,748 $ 36,853,330 Cost of sales 7,990,873 7,399,690 7,102,274 7,324,162 29,816,999
Gross margin 1,886,556 1,750,113 1,637,076 1,762,586 7,036,331 Operating expenses 1,381,804 1,328,249 1,231,753 1,222,314 5,164,120
Operating income 504,752 421,864 405,323 540,272 1,872,211 Interest expense 26,410 28,400 28,233 33,279 116,322 Other income, net (2,813 ) (5,223 ) (3,514 ) (3,395 ) (14,945 )
Earnings before income taxes 481,155 398,687 380,604 510,388 1,770,834 Income taxes 204,341 161,033 154,438 195,074 714,886
Net earnings $ 276,814 $ 237,654 $ 226,166 $ 315,314 $ 1,055,948
Per share:
Basic net earnings $ 0.46 $ 0.40 $ 0.38 $ 0.53 $ 1.77 Diluted net earnings 0.46 0.40 0.38 0.53 1.77 Dividends declared 0.22 0.24 0.24 0.24 0.94 Market price — high/low 35-27 33-21 25-19 25-21 35-19
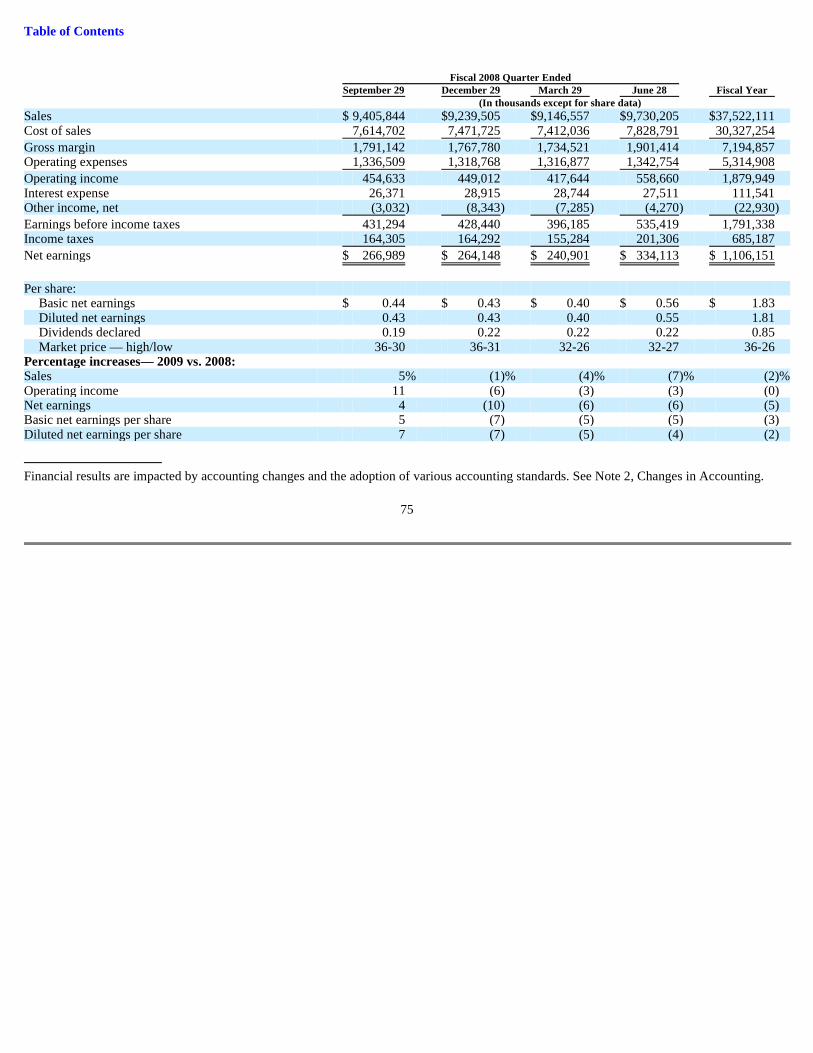
Table of Contents
75
Fiscal 2008 Quarter Ended September 29 December 29 March 29 June 28 Fiscal Year (In thousands except for share data) Sales $ 9,405,844 $ 9,239,505 $ 9,146,557 $ 9,730,205 $ 37,522,111 Cost of sales 7,614,702 7,471,725 7,412,036 7,828,791 30,327,254
Gross margin 1,791,142 1,767,780 1,734,521 1,901,414 7,194,857 Operating expenses 1,336,509 1,318,768 1,316,877 1,342,754 5,314,908
Operating income 454,633 449,012 417,644 558,660 1,879,949 Interest expense 26,371 28,915 28,744 27,511 111,541 Other income, net (3,032 ) (8,343 ) (7,285 ) (4,270 ) (22,930 )
Earnings before income taxes 431,294 428,440 396,185 535,419 1,791,338 Income taxes 164,305 164,292 155,284 201,306 685,187
Net earnings $ 266,989 $ 264,148 $ 240,901 $ 334,113 $ 1,106,151
Per share:
Basic net earnings $ 0.44 $ 0.43 $ 0.40 $ 0.56 $ 1.83 Diluted net earnings 0.43 0.43 0.40 0.55 1.81 Dividends declared 0.19 0.22 0.22 0.22 0.85 Market price — high/low 36-30 36-31 32-26 32-27 36-26
Percentage increases— 2009 vs. 2008: Sales 5 % (1 )% (4 )% (7 )% (2 )% Operating income 11 (6 ) (3 ) (3 ) (0 ) Net earnings 4 (10 ) (6 ) (6 ) (5 ) Basic net earnings per share 5 (7 ) (5 ) (5 ) (3 ) Diluted net earnings per share 7 (7 ) (5 ) (4 ) (2 )
Financial results are impacted by accounting changes and the adoption of various accounting standards. See Note 2, Changes in Accounting.
Table of Contents
Item 9. Changes in and Disagreements with Accountants on Accounting and Financial Disclosure
None.
Item 9A. Controls and Procedures
Sysco’s management, with the participation of our chief executive officer and chief financial officer, evaluated the effectiveness of our disclosure controls and procedures as of June 27, 2009. The term “disclosure controls and procedures,” as defined in Rules 13a-15(e) and 15d-15(e) under the Exchange Act, means controls and other procedures of a company that are designed to ensure that information required to be disclosed by a company in the reports that it files or submits under the Exchange Act is recorded, processed, summarized and reported, within the time periods specified in the SEC’s rules and forms. Disclosure controls and procedures include, without limitation, controls and procedures designed to ensure that information required to be disclosed by a company in the reports that it files or submits under the Exchange Act is accumulated and communicated to the company’s management, including its principal executive and principal financial officers, as appropriate to allow timely decisions regarding the required disclosure. Management recognizes that any controls and procedures, no matter how well designed and operated, can provide only reasonable assurance of achieving their objectives and management necessarily applies its judgment in evaluating the cost-benefit relationship of possible controls and procedures. Based on the evaluation of our disclosure controls and procedures as of June 27, 2009, our chief executive officer and chief financial officer concluded that, as of such date, Sysco’s disclosure controls and procedures were effective at the reasonable assurance level.
Management’s report on internal control over financial reporting is included in the financial statement pages at page 38.
No change in our internal control over financial reporting (as defined in Rules 13a-15(f) and 15d-15(f) under the Exchange Act) occurred during the fiscal quarter ended June 27, 2009 that has materially affected, or is reasonably likely to materially affect, our internal control over financial reporting.
Item 9B. Other Information
None.
PART III
Item 10. Directors and Executive Officers of the Registrant
The information required by this item will be included in our proxy statement for the 2009 Annual Meeting of Stockholders under the following captions, and is incorporated herein by reference thereto: “Election of Directors,” “Executive Officers,” “Section 16(a) Beneficial Ownership Reporting Compliance,” “Report of the Audit Committee” and “Corporate Governance and Board of Directors Matters.”
Item 11. Executive Compensation
The information required by this item will be included in our proxy statement for the 2009 Annual Meeting of Stockholders under the following captions, and is incorporated herein by reference thereto: “Compensation Discussion and Analysis,” “Compensation Committee Report,” “Director Compensation” and “Executive Compensation.”
Item 12. Security Ownership of Certain Beneficial Owners and Management and Related Stockholder Matters
The information required by this item will be included in our proxy statement for the 2009 Annual Meeting of Stockholders under the following captions, and is incorporated herein by reference thereto: “Stock Ownership” and “Equity Compensation Plan Information.”
Item 13. Certain Relationships and Related Transactions
The information required by this item will be included in our proxy statement for the 2009 Annual Meeting of Stockholders under the following caption, and is incorporated herein by reference thereto: “Certain Relationships and Related Transactions” and “Director Independence.”
Item 14. Principal Accountant Fees and Services
The information required by this item will be included in our proxy statement for the 2009 Annual Meeting of Stockholders under the following caption, and is incorporated herein by reference thereto: “Fees Paid to Independent Registered Public Accounting Firm.”
76
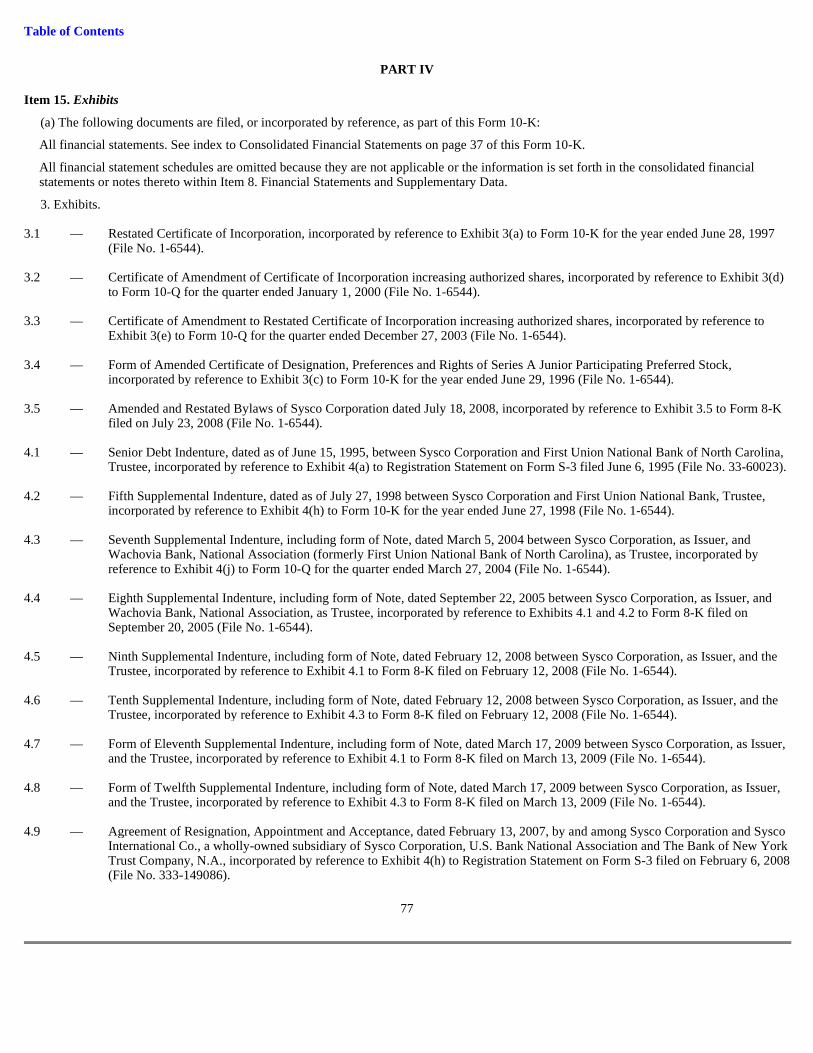
Table of Contents
PART IV
Item 15. Exhibits
(a) The following documents are filed, or incorporated by reference, as part of this Form 10-K:
All financial statements. See index to Consolidated Financial Statements on page 37 of this Form 10-K.
All financial statement schedules are omitted because they are not applicable or the information is set forth in the consolidated financial statements or notes thereto within Item 8. Financial Statements and Supplementary Data.
3. Exhibits.
77
3.1
—
Restated Certificate of Incorporation, incorporated by reference to Exhibit 3(a) to Form 10-K for the year ended June 28, 1997 (File No. 1-6544).
3.2
—
Certificate of Amendment of Certificate of Incorporation increasing authorized shares, incorporated by reference to Exhibit 3(d) to Form 10-Q for the quarter ended January 1, 2000 (File No. 1-6544).
3.3
—
Certificate of Amendment to Restated Certificate of Incorporation increasing authorized shares, incorporated by reference to Exhibit 3(e) to Form 10-Q for the quarter ended December 27, 2003 (File No. 1-6544).
3.4
—
Form of Amended Certificate of Designation, Preferences and Rights of Series A Junior Participating Preferred Stock, incorporated by reference to Exhibit 3(c) to Form 10-K for the year ended June 29, 1996 (File No. 1-6544).
3.5
—
Amended and Restated Bylaws of Sysco Corporation dated July 18, 2008, incorporated by reference to Exhibit 3.5 to Form 8-K filed on July 23, 2008 (File No. 1-6544).
4.1
—
Senior Debt Indenture, dated as of June 15, 1995, between Sysco Corporation and First Union National Bank of North Carolina, Trustee, incorporated by reference to Exhibit 4(a) to Registration Statement on Form S-3 filed June 6, 1995 (File No. 33-60023).
4.2
—
Fifth Supplemental Indenture, dated as of July 27, 1998 between Sysco Corporation and First Union National Bank, Trustee, incorporated by reference to Exhibit 4(h) to Form 10-K for the year ended June 27, 1998 (File No. 1-6544).
4.3
—
Seventh Supplemental Indenture, including form of Note, dated March 5, 2004 between Sysco Corporation, as Issuer, and Wachovia Bank, National Association (formerly First Union National Bank of North Carolina), as Trustee, incorporated by reference to Exhibit 4(j) to Form 10-Q for the quarter ended March 27, 2004 (File No. 1-6544).
4.4
—
Eighth Supplemental Indenture, including form of Note, dated September 22, 2005 between Sysco Corporation, as Issuer, and Wachovia Bank, National Association, as Trustee, incorporated by reference to Exhibits 4.1 and 4.2 to Form 8-K filed on September 20, 2005 (File No. 1-6544).
4.5
—
Ninth Supplemental Indenture, including form of Note, dated February 12, 2008 between Sysco Corporation, as Issuer, and the Trustee, incorporated by reference to Exhibit 4.1 to Form 8-K filed on February 12, 2008 (File No. 1-6544).
4.6
—
Tenth Supplemental Indenture, including form of Note, dated February 12, 2008 between Sysco Corporation, as Issuer, and the Trustee, incorporated by reference to Exhibit 4.3 to Form 8-K filed on February 12, 2008 (File No. 1-6544).
4.7
—
Form of Eleventh Supplemental Indenture, including form of Note, dated March 17, 2009 between Sysco Corporation, as Issuer, and the Trustee, incorporated by reference to Exhibit 4.1 to Form 8-K filed on March 13, 2009 (File No. 1-6544).
4.8
—
Form of Twelfth Supplemental Indenture, including form of Note, dated March 17, 2009 between Sysco Corporation, as Issuer, and the Trustee, incorporated by reference to Exhibit 4.3 to Form 8-K filed on March 13, 2009 (File No. 1-6544).
4.9
—
Agreement of Resignation, Appointment and Acceptance, dated February 13, 2007, by and among Sysco Corporation and Sysco International Co., a wholly-owned subsidiary of Sysco Corporation, U.S. Bank National Association and The Bank of New York Trust Company, N.A., incorporated by reference to Exhibit 4(h) to Registration Statement on Form S-3 filed on February 6, 2008 (File No. 333-149086).

Table of Contents
78
4.10
—
Indenture dated May 23, 2002 between Sysco International, Co., Sysco Corporation and Wachovia Bank, National Association, incorporated by reference to Exhibit 4.1 to Registration Statement on Form S-4 filed August 21, 2002 (File No. 333-98489).
4.11
—
Letter Regarding Appointment of New Trustee from Sysco Corporation to U.S. Bank National Association, incorporated by reference to Exhibit 4.7 to Form 10-Q for the quarter ended December 29, 2007 filed on February 5, 2008 (File No. 1-6544).
10.1
—
Credit Agreement dated November 4, 2005 between Sysco Corporation, Sysco International, Co., JP Morgan Chase Bank, N.A., and certain Lenders party thereto, incorporated by reference to Exhibit 99.1 to Form 8-K filed on November 10, 2005 (File No. 1-6544).
10.2
—
Form of Commitment Increase Agreement dated September 25, 2007 by and among Sysco Corporation, JPMorgan Chas Bank, individually and as Administrative Agent, the Co-Syndication Agents named therein and the other financial institutions party thereto relating to the Credit Agreement dated November 4, 2005, incorporated by reference to Exhibit 10.1 to Form 10-Q for the quarter ended September 29, 2007 filed on November 8, 2007 (File No. 1-6544).
10.3
—
Form of Extension Agreement effective September 21, 2007 by and among Sysco Corporation, JPMorgan Chase Bank, individually and as Administrative Agent, the Co-Syndication Agents named therein and the other financial institutions party thereto relating to the Credit Agreement dated November 4, 2005, incorporated by reference to Exhibit 10.2 to Form 10-Q for the quarter ended September 29, 2007 filed on November 8, 2007 (File No. 1-6544).
10.4
—
Amended and Restated Issuing and Paying Agency Agreement, dated as of April 13, 2006, between Sysco Corporation and JPMorgan Chase Bank, National Association, incorporated by reference to Exhibit 10.1 to Form 8-K filed on April 19, 2006 (File No. 1-6544).
10.5
—
Commercial Paper Dealer Agreement, dated as of April 13, 2006, between Sysco Corporation and J.P. Morgan Securities Inc., incorporated by reference to Exhibit 10.2 to Form 8-K filed on April 19, 2006 (File No. 1-6544).
10.6
—
Commercial Paper Dealer Agreement, dated as of April 13, 2006, between Sysco Corporation and Goldman, Sachs & Co., incorporated by reference to Exhibit 10.3 to Form 8-K filed on April 19, 2006 (File No. 1-6544).
10.7†
—
Fifth Amended and Restated Sysco Corporation Executive Deferred Compensation Plan, incorporated by reference to Exhibit 10.8 to Form 10-K for the year ended July 28, 2008 filed on August 26, 2008 (File No. 1-6544).
10.8†
—
First Amendment to the Fifth Amended and Restated Sysco Corporation Executive Deferred Compensation Plan, incorporated by reference to Exhibit 10.1 to Form 10-Q for the quarter ended December 27, 2008 filed on February 3, 2009 (File No. 1-6544).
10.9†
—
Eighth Amended and Restated Sysco Corporation Supplemental Executive Retirement Plan, incorporated by reference to Exhibit 10.2 to Form 10-Q for the quarter ended December 27, 2008 filed on February 3, 2009 (File No. 1-6544).
10.10†
—
Sysco Corporation 1991 Stock Option Plan, incorporated by reference to Exhibit 10(e) to Form 10-K for the year ended July 3, 1999 (File No. 1-6544).
10.11†
—
Amendments to Sysco Corporation 1991 Stock Option Plan dated effective September 4, 1997, incorporated by reference to Exhibit 10(f) to Form 10-K for the year ended June 28, 1997 (File No. 1-6544).
10.12†
—
Amendments to Sysco Corporation 1991 Stock Option Plan dated effective November 5, 1998, incorporated by reference to Exhibit 10(g) to Form 10-K for the year ended July 3, 1999 (File No. 1-6544).
10.13†
—
Form of Stock Option Grant Agreement issued to executive officers on September 2, 1999 under the 1991 Stock Option Plan, incorporated by reference to Exhibit 10(tt) to Form 10-K for the year ended July 3, 2004 filed on September 16, 2004 (File No. 1-6544).
10.14†
—
Form of Stock Option Grant Agreement issued to executive officers on September 7, 2000 under the 1991 Stock Option Plan, incorporated by reference to Exhibit 10(uu) to Form 10-K for the year ended July 3, 2004 filed on September 16, 2004 (File No. 1-6544).
10.15†
—
2000 Stock Incentive Plan, incorporated by reference to Appendix B to Proxy Statement filed on September 25, 2000 (File No. 1-6544).
10.16†
—
Form of Stock Option Grant Agreement issued to executive officers on September 11, 2001 under the 2000 Stock Incentive Plan, incorporated by reference to Exhibit 10(vv) to Form 10-K for the year ended July 3, 2004 filed on September 16, 2004 (File No. 1-6544).


Table of Contents
10.17†
—
Form of Stock Option Grant Agreement issued to executive officers on September 11, 2001 under the 2000 Stock Incentive Plan, incorporated by reference to Exhibit 10(ww) to Form 10-K for the year ended July 3, 2004 filed on September 16, 2004 (File No. 1-6544).
10.18†
—
Form of Stock Option Grant Agreement issued to executive officers on September 12, 2002 under the 2000 Stock Incentive Plan, incorporated by reference to Exhibit 10(xx) to Form 10-K for the year ended July 3, 2004 filed on September 16, 2004 (File No. 1-6544).
10.19†
—
Form of Stock Option Grant Agreement issued to executive officers on September 11, 2003 under the 2000 Stock Incentive Plan, incorporated by reference to Exhibit 10(yy) to Form 10-K for the year ended July 3, 2004 filed on September 16, 2004 (File No. 1-6544).
10.20†
—
Form of Stock Option Grant Agreement issued to executive officers on September 2, 2004 under the 2000 Stock Incentive Plan, incorporated by reference to Exhibit 10(a) to Form 8-K filed on September 9, 2004 (File No. 1-6544).
10.21†
—
2004 Stock Option Plan, incorporated by reference to Appendix B to the Sysco Corporation Proxy Statement filed September 24, 2004 (File No. 1-6544).
10.22†
—
First Amendment to the 2004 Stock Option Plan, incorporated by reference to Exhibit 10.2 to Form 10-Q for the quarter ended March 29, 2008 filed on May 6, 2008 (File No. 1-6544).
10.23†
—
Form of Stock Option Grant Agreement issued to executive officers on September 8, 2005 and September 7, 2006 under the 2004 Stock Option Plan, incorporated by reference to Exhibit 99.1 to Form 8-K filed on September 14, 2005 (File No. 1-6544).
10.24†
—
2007 Stock Incentive Plan, incorporated by reference to Annex A to the Sysco Corporation Proxy Statement filed on September 26, 2007 (File No. 1-6544).
10.25†
—
First Amendment to the 2007 Stock Incentive Plan dated January 17, 2009, incorporated by reference to Exhibit 10.2 to Form 10-Q for the quarter ended March 28, 2009 filed on May 5, 2009 (File No. 1-6544).
10.26†
—
Form of Stock Option Grant Agreement issued to executive officers under the 2007 Stock Incentive Plan, incorporated by reference to Exhibit 10.6 to Form 10-Q for the quarter ended December 29, 2007 filed on February 5, 2008 (File No. 1-6544).
10.27†
—
Restricted Stock Award Agreement issued to Kenneth F. Spitler on January 17, 2009 under the 2007 Stock Incentive Plan, incorporated by reference to Exhibit 10.3 to Form 10-Q for the quarter ended March 28, 2009 filed on May 5, 2009 (File No. 1-6544).
10.28†
—
Amended and Restated 2004 Cash Performance Unit Plan (formerly known as the 2004 Long-Term Incentive Cash Plan and the 2004 Mid-Term Incentive Plan), incorporated by reference to Exhibit 10.4 to Form 10-Q for the quarter ended December 29, 2007 filed on February 5, 2008 (File No. 1-6544).
10.29†
—
First Amendment to the Fiscal Year 2008 Mid-Term Incentive Program dated September 11, 2008, incorporated by reference to Exhibit 10.1 to Form 10-Q for the quarter ended September 27, 2008 filed on November 4, 2008 (File No. 1-6544).
10.30†
—
Form of Performance Unit Grant Agreement issued to executive officers effective September 28, 2007 under the 2004 Mid-Term Incentive Plan, as corrected with respect to certain typographical errors by the Compensation Committee of the Board of Directors on February 11, 2009, incorporated by reference to Exhibit 10.4 to Form 10-Q for the quarter ended March 28, 2009 filed on May 5, 2009 (File No. 1-6544).
10.31†
—
Form of Performance Unit Grant Agreement issued to executive officers effective October 16, 2008, under the 2004 Cash Performance Unit Plan, incorporated by reference to Exhibit 10.2 to Form 10-Q for the quarter ended September 27, 2008 filed on November 4, 2008 (File No. 1-6544).
10.32†
—
Sysco Corporation 2008 Cash Performance Unit Plan, incorporated by reference to Annex A to the Sysco Corporation Proxy Statement filed October 7, 2008 (File No. 1-6544).
10.33†
—
2005 Management Incentive Plan, incorporated by reference to Annex B to the Sysco Corporation Proxy Statement for the November 11, 2005 Annual Meeting of Stockholders (File No. 1-6544).
10.34†
—
First Amendment to 2005 Management Incentive Plan dated July 13, 2007, incorporated by reference to Exhibit 10.33 to Form 10-K for the year ended June 30, 2007 filed on August 28, 2007 (File No. 1-6544).
10.35† — Form of Fiscal Year 2008 Bonus Award for the Chief Executive Officer, President, Chief Financial Officer, Executive Vice
Presidents and Senior Vice Presidents (excluding Senior Vice Presidents of Operations) under the 2005 Management Incentive Plan, incorporated by reference to Exhibit 10.36 to Form 10-K for the year ended June 30, 2007 filed on August 28, 2007 (File

79
No. 1-6544).
Table of Contents
80
10.36†
—
First Amended and Restated 2005 Management Incentive Plan, incorporated by reference to Exhibit 10.34 to Form 10-K for the year ended July 28, 2008 filed on August 26, 2008 (File No. 1-6544).
10.37†
—
Form of Fiscal Year 2009 Bonus Award for the Chief Executive Officer, President, Chief Financial Officer and Executive Vice Presidents under the First Amended and Restated 2005 Management Incentive Plan, incorporated by reference to Exhibit 10.35 to Form 10-K for the year ended July 28, 2008 filed on August 26, 2008 (File No. 1-6544).
10.38†#
—
Form of Fiscal Year 2010 Bonus Award for the Chief Executive Officer and Chief Financial Officer, President and Chief Operating Officer, and Executive Vice Presidents under the First Amended and Restated 2005 Management Incentive Plan.
10.39†
—
Form of Fiscal Year 2009 Supplemental Bonus Agreement for the Chief Executive Officer and the President, incorporated by reference to Exhibit 10.40 to Form 10-K for the year ended July 28, 2008 filed on August 26, 2008 (File No. 1-6544).
10.40†
—
Form of Executive Severance Agreement between Sysco Corporation and Kenneth F. Spitler dated July 14, 2004, incorporated by reference to Exhibit 10(jj) to Form 10-K for the year ended July 3, 2004 filed on September 16, 2004 (File No. 1-6544).
10.41†
—
Form of First Amendment dated September 3, 2004 to Executive Severance Agreement between Sysco Corporation and Kenneth F. Spitler, incorporated by reference to Exhibit 10(kk) to Form 10-K for the year ended July 3, 2004 filed on September 16, 2004 (File No. 1-6544).
10.42†
—
First Amended and Restated Executive Severance Agreement dated December 23, 2008 between Sysco Corporation and Kenneth F. Spitler, incorporated by reference to Exhibit 10.5 to Form 10-Q for the quarter ended December 27, 2008 filed on February 3, 2009 (File No. 1-6544).
10.43†
—
Transition and Retirement Agreement between Sysco Corporation and Richard J. Schnieders dated January 19, 2009, incorporated by reference to Exhibit 10.1 to Form 10-Q for the quarter ended March 28, 2009 filed on May 5, 2009 (File No. 1-6544).
10.44†# — Description of Compensation Arrangements with Named Executive Officers. 10.45†
—
Sysco Corporation Amended and Restated Non-Employee Directors Stock Option Plan, incorporated by reference to Exhibit 10(g) to Form 10-K for the year ended June 28, 1997 (File No. 1-6544).
10.46†
—
Amendment to the Amended and Restated Non-Employee Directors Stock Option Plan dated effective November 5, 1998, incorporated by reference to Exhibit 10(i) to Form 10-K for the year ended July 3, 1999 (File No. 1-6544).
10.47†
—
Amended and Restated Non-Employee Directors Stock Plan, incorporated by reference to Appendix B to Proxy Statement filed on September 24, 2001 (File No. 1-6544).
10.48†
—
Form of Stock Option Grant Agreement issued to non-employee directors on September 3, 2004 under the Non-Employee Directors Stock Plan, incorporated by reference to Exhibit 10(b) to Form 8-K field on September 9, 2004 (File No. 1-6544).
10.49†
—
Form of Retainer Stock Agreement for issuance to Non-Employee Directors under the Non-Employee Directors Stock Plan, incorporated by reference to Exhibit 10(a) to Form 10-Q for the quarter ended January 1, 2005 filed on February 10, 2005 (File No. 1-6544).
10.50†
—
Amended and Restated 2005 Non-Employee Directors Stock Plan, incorporated by reference to Exhibit 10.1 to Form 10-Q for the quarter ended December 29, 2007 filed on February 5, 2008 (File No. 1-6544).
10.51†# — First Amendment to the Amended and Restated 2005 Non-Employee Directors Stock Plan effective June 28, 2009. 10.52†
—
Form of Option Grant Agreement under the 2005 Non-Employee Directors Stock Plan, incorporated by reference to Exhibit 10(i) to Form 10-Q for the quarter ended December 31, 2005 filed on February 9, 2006 (File No. 1-6544).
10.53†
—
Form of Restricted Stock Grant Agreement under the 2005 Non-Employee Directors Stock Plan, incorporated by reference to Exhibit 10(j) to Form 10-Q for the quarter ended December 31, 2005 filed on February 9, 2006 (File No. 1-6544).
10.54†
—
Form of Restricted Stock Agreement under the Amended and Restated 2005 Non-Employee Directors Stock Plan, incorporated by reference to Exhibit 10.1 to Form 10-Q for the quarter ended March 29, 2008 filed on May 6, 2008 (File No. 1-6544).
10.55†
—
Form of Retainer Stock Award Agreement under the 2005 Non-Employee Directors Stock Plan, incorporated by reference to Exhibit 10.1 to Form 8-K filed on November 15, 2006 (File No. 1-6544).

Table of Contents
81
10.56†
—
Second Amended and Restated Board of Directors Deferred Compensation Plan dated April 1, 2002, incorporated by reference to Exhibit 10(aa) to Form 10-K for the year ended June 29, 2002 filed on September 25, 2002 (File No. 1-6544).
10.57†
—
First Amendment to Second Amended and Restated Board of Directors Deferred Compensation Plan dated July 12, 2002, incorporated by reference to Exhibit 10(bb) to Form 10-K for the year ended June 29, 2002 filed on September 25, 2002 (File No. 1-6544).
10.58†
—
Second Amendment to the Second Amended and Restated Sysco Corporation Board of Directors Deferred Compensation Plan, incorporated by reference to Exhibit 10(k) to Form 10-Q for the quarter ended December 31, 2005 filed on February 9, 2006 (File No. 1-6544).
10.59†
—
Second Amended and Restated Sysco Corporation 2005 Board of Directors Deferred Compensation Plan, incorporated by reference to Exhibit 10.59 to Form 10-K for the year ended July 28, 2008 filed on August 26, 2008 (File No. 1-6544).
10.60†# — Description of Compensation Arrangements with Non-Employee Directors, including the Non-Executive Chairman. 10.61†
—
Form of Indemnification Agreement with Non-Employee Directors, incorporated by reference to Exhibit 10.61 to Form 10-K for the year ended July 28, 2008 filed on August 26, 2008 (File No. 1-6544).
14.1
—
Code of Business Conduct and Ethics, incorporated by reference to Exhibit 14.1 to Form 8-K filed on July 19, 2007 (File No. 1-6544).
21.1# — Subsidiaries of the Registrant. 23.1# — Consent of Independent Registered Public Accounting Firm. 31.1# — CEO and CFO Certification Pursuant to Section 302 of the Sarbanes-Oxley Act of 2002. 32.1# — CEO and CFO Certification Pursuant to Section 906 of the Sarbanes-Oxley Act of 2002.
† Executive Compensation Arrangement pursuant to 601(b)(10)(iii)(A) of Regulation S-K
# Filed Herewith

Table of Contents
SIGNATURES
Pursuant to the requirements of Section 13 or 15(d) of the Securities Exchange Act of 1934, Sysco Corporation has duly caused this Form 10-K to be signed on its behalf by the undersigned, thereunto duly authorized, on this 25th day of August, 2009.
Pursuant to the requirements of the Securities Exchange Act of 1934, this report has been signed below by the following persons on behalf of the Registrant in the capacities indicated and on the date indicated above.
PRINCIPAL EXECUTIVE, FINANCIAL & ACCOUNTING OFFICER S:
DIRECTORS:
82
SYSCO CORPORATION
By /s/ WILLIAM J. DELANEY
William J. DeLaney
Chief Executive Officer and Chief Financial Officer
/s/ WILLIAM J. DELANEY
Chief Executive Officer and Chief Financial Officer William J. DeLaney (principal executive and principal financial officer)
/s/ G. MITCHELL ELMER
Senior Vice President, Controller and Chief Accounting Officer G. Mitchell Elmer (principal accounting officer)
/s/ JOHN M. CASSADAY /s/ HANS-JOACHIM KOERBER
John M. Cassaday Hans-Joachim Koerber
/s/ JUDITH B. CRAVEN /s/ NANCY S. NEWCOMB
Judith B. Craven Nancy S. Newcomb
/s/ WILLIAM J. DELANEY /s/ PHYLLIS S. SEWELL
William J. DeLaney Phyllis S. Sewell
/s/ MANUEL A. FERNANDEZ /s/ KENNETH F. SPITLER
Manuel A. Fernandez Kenneth F. Spitler
/s/ JONATHAN GOLDEN /s/ RICHARD G. TILGHMAN
Jonathan Golden Richard G. Tilghman
/s/ JOSEPH A. HAFNER, JR. /s/ JACKIE M. WARD
Joseph A. Hafner, Jr. Jackie M. Ward
Table of Contents
EXHIBIT INDEX
Exhibits.
3.1
—
Restated Certificate of Incorporation, incorporated by reference to Exhibit 3(a) to Form 10-K for the year ended June 28, 1997 (File No. 1-6544).
3.2
—
Certificate of Amendment of Certificate of Incorporation increasing authorized shares, incorporated by reference to Exhibit 3(d) to Form 10-Q for the quarter ended January 1, 2000 (File No. 1-6544).
3.3
—
Certificate of Amendment to Restated Certificate of Incorporation increasing authorized shares, incorporated by reference to Exhibit 3(e) to Form 10-Q for the quarter ended December 27, 2003 (File No. 1-6544).
3.4
—
Form of Amended Certificate of Designation, Preferences and Rights of Series A Junior Participating Preferred Stock, incorporated by reference to Exhibit 3(c) to Form 10-K for the year ended June 29, 1996 (File No. 1-6544).
3.5
—
Amended and Restated Bylaws of Sysco Corporation dated July 18, 2008, incorporated by reference to Exhibit 3.5 to Form 8-K filed on July 23, 2008 (File No. 1-6544).
4.1
—
Senior Debt Indenture, dated as of June 15, 1995, between Sysco Corporation and First Union National Bank of North Carolina, Trustee, incorporated by reference to Exhibit 4(a) to Registration Statement on Form S-3 filed June 6, 1995 (File No. 33-60023).
4.2
—
Fifth Supplemental Indenture, dated as of July 27, 1998 between Sysco Corporation and First Union National Bank, Trustee, incorporated by reference to Exhibit 4(h) to Form 10-K for the year ended June 27, 1998 (File No. 1-6544).
4.3
—
Seventh Supplemental Indenture, including form of Note, dated March 5, 2004 between Sysco Corporation, as Issuer, and Wachovia Bank, National Association (formerly First Union National Bank of North Carolina), as Trustee, incorporated by reference to Exhibit 4(j) to Form 10-Q for the quarter ended March 27, 2004 (File No. 1-6544).
4.4
—
Eighth Supplemental Indenture, including form of Note, dated September 22, 2005 between Sysco Corporation, as Issuer, and Wachovia Bank, National Association, as Trustee, incorporated by reference to Exhibits 4.1 and 4.2 to Form 8-K filed on September 20, 2005 (File No. 1-6544).
4.5
—
Ninth Supplemental Indenture, including form of Note, dated February 12, 2008 between Sysco Corporation, as Issuer, and the Trustee, incorporated by reference to Exhibit 4.1 to Form 8-K filed on February 12, 2008 (File No. 1-6544).
4.6
—
Tenth Supplemental Indenture, including form of Note, dated February 12, 2008 between Sysco Corporation, as Issuer, and the Trustee, incorporated by reference to Exhibit 4.3 to Form 8-K filed on February 12, 2008 (File No. 1-6544).
4.7
—
Form of Eleventh Supplemental Indenture, including form of Note, dated March 17, 2009 between Sysco Corporation, as Issuer, and the Trustee, incorporated by reference to Exhibit 4.1 to Form 8-K filed on March 13, 2009 (File No. 1-6544).
4.8
—
Form of Twelfth Supplemental Indenture, including form of Note, dated March 17, 2009 between Sysco Corporation, as Issuer, and the Trustee, incorporated by reference to Exhibit 4.3 to Form 8-K filed on March 13, 2009 (File No. 1-6544).
4.9
—
Agreement of Resignation, Appointment and Acceptance, dated February 13, 2007, by and among Sysco Corporation and Sysco International Co., a wholly-owned subsidiary of Sysco Corporation, U.S. Bank National Association and The Bank of New York Trust Company, N.A., incorporated by reference to Exhibit 4(h) to Registration Statement on Form S-3 filed on February 6, 2008 (File No. 333-149086).
4.10
—
Indenture dated May 23, 2002 between Sysco International, Co., Sysco Corporation and Wachovia Bank, National Association, incorporated by reference to Exhibit 4.1 to Registration Statement on Form S-4 filed August 21, 2002 (File No. 333-98489).
4.11
—
Letter Regarding Appointment of New Trustee from Sysco Corporation to U.S. Bank National Association, incorporated by reference to Exhibit 4.7 to Form 10-Q for the quarter ended December 29, 2007 filed on February 5, 2008 (File No. 1-6544).
Table of Contents
10.1
—
Credit Agreement dated November 4, 2005 between Sysco Corporation, Sysco International, Co., JP Morgan Chase Bank, N.A., and certain Lenders party thereto, incorporated by reference to Exhibit 99.1 to Form 8-K filed on November 10, 2005 (File No. 1-6544).
10.2
—
Form of Commitment Increase Agreement dated September 25, 2007 by and among Sysco Corporation, JPMorgan Chas Bank, individually and as Administrative Agent, the Co-Syndication Agents named therein and the other financial institutions party thereto relating to the Credit Agreement dated November 4, 2005, incorporated by reference to Exhibit 10.1 to Form 10-Q for the quarter ended September 29, 2007 filed on November 8, 2007 (File No. 1-6544).
10.3
—
Form of Extension Agreement effective September 21, 2007 by and among Sysco Corporation, JPMorgan Chase Bank, individually and as Administrative Agent, the Co-Syndication Agents named therein and the other financial institutions party thereto relating to the Credit Agreement dated November 4, 2005, incorporated by reference to Exhibit 10.2 to Form 10-Q for the quarter ended September 29, 2007 filed on November 8, 2007 (File No. 1-6544).
10.4
—
Amended and Restated Issuing and Paying Agency Agreement, dated as of April 13, 2006, between Sysco Corporation and JPMorgan Chase Bank, National Association, incorporated by reference to Exhibit 10.1 to Form 8-K filed on April 19, 2006 (File No. 1-6544).
10.5
—
Commercial Paper Dealer Agreement, dated as of April 13, 2006, between Sysco Corporation and J.P. Morgan Securities Inc., incorporated by reference to Exhibit 10.2 to Form 8-K filed on April 19, 2006 (File No. 1-6544).
10.6
—
Commercial Paper Dealer Agreement, dated as of April 13, 2006, between Sysco Corporation and Goldman, Sachs & Co., incorporated by reference to Exhibit 10.3 to Form 8-K filed on April 19, 2006 (File No. 1-6544).
10.7†
—
Fifth Amended and Restated Sysco Corporation Executive Deferred Compensation Plan, incorporated by reference to Exhibit 10.8 to Form 10-K for the year ended July 28, 2008 filed on August 26, 2008 (File No. 1-6544).
10.8†
—
First Amendment to the Fifth Amended and Restated Sysco Corporation Executive Deferred Compensation Plan, incorporated by reference to Exhibit 10.1 to Form 10-Q for the quarter ended December 27, 2008 filed on February 3, 2009 (File No. 1-6544).
10.9†
—
Eighth Amended and Restated Sysco Corporation Supplemental Executive Retirement Plan, incorporated by reference to Exhibit 10.2 to Form 10-Q for the quarter ended December 27, 2008 filed on February 3, 2009 (File No. 1-6544).
10.10†
—
Sysco Corporation 1991 Stock Option Plan, incorporated by reference to Exhibit 10(e) to Form 10-K for the year ended July 3, 1999 (File No. 1-6544).
10.11†
—
Amendments to Sysco Corporation 1991 Stock Option Plan dated effective September 4, 1997, incorporated by reference to Exhibit 10(f) to Form 10-K for the year ended June 28, 1997 (File No. 1-6544).
10.12†
—
Amendments to Sysco Corporation 1991 Stock Option Plan dated effective November 5, 1998, incorporated by reference to Exhibit 10(g) to Form 10-K for the year ended July 3, 1999 (File No. 1-6544).
10.13†
—
Form of Stock Option Grant Agreement issued to executive officers on September 2, 1999 under the 1991 Stock Option Plan, incorporated by reference to Exhibit 10(tt) to Form 10-K for the year ended July 3, 2004 filed on September 16, 2004 (File No. 1-6544).
10.14†
—
Form of Stock Option Grant Agreement issued to executive officers on September 7, 2000 under the 1991 Stock Option Plan, incorporated by reference to Exhibit 10(uu) to Form 10-K for the year ended July 3, 2004 filed on September 16, 2004 (File No. 1-6544).
10.15†
—
2000 Stock Incentive Plan, incorporated by reference to Appendix B to Proxy Statement filed on September 25, 2000 (File No. 1-6544).
10.16†
—
Form of Stock Option Grant Agreement issued to executive officers on September 11, 2001 under the 2000 Stock Incentive Plan, incorporated by reference to Exhibit 10(vv) to Form 10-K for the year ended July 3, 2004 filed on September 16, 2004 (File No. 1-6544).
10.17†
—
Form of Stock Option Grant Agreement issued to executive officers on September 11, 2001 under the 2000 Stock Incentive Plan, incorporated by reference to Exhibit 10(ww) to Form 10-K for the year ended July 3, 2004 filed on September 16, 2004 (File No. 1-6544).
10.18†
—
Form of Stock Option Grant Agreement issued to executive officers on September 12, 2002 under the 2000 Stock Incentive Plan, incorporated by reference to Exhibit 10(xx) to Form 10-K for the year ended July 3, 2004 filed on September 16, 2004 (File No. 1-6544).


Table of Contents
10.19†
—
Form of Stock Option Grant Agreement issued to executive officers on September 11, 2003 under the 2000 Stock Incentive Plan, incorporated by reference to Exhibit 10(yy) to Form 10-K for the year ended July 3, 2004 filed on September 16, 2004 (File No. 1-6544).
10.20†
—
Form of Stock Option Grant Agreement issued to executive officers on September 2, 2004 under the 2000 Stock Incentive Plan, incorporated by reference to Exhibit 10(a) to Form 8-K filed on September 9, 2004 (File No. 1-6544).
10.21†
—
2004 Stock Option Plan, incorporated by reference to Appendix B to the Sysco Corporation Proxy Statement filed September 24, 2004 (File No. 1-6544).
10.22†
—
First Amendment to the 2004 Stock Option Plan, incorporated by reference to Exhibit 10.2 to Form 10-Q for the quarter ended March 29, 2008 filed on May 6, 2008 (File No. 1-6544).
10.23†
—
Form of Stock Option Grant Agreement issued to executive officers on September 8, 2005 and September 7, 2006 under the 2004 Stock Option Plan, incorporated by reference to Exhibit 99.1 to Form 8-K filed on September 14, 2005 (File No. 1-6544).
10.24†
—
2007 Stock Incentive Plan, incorporated by reference to Annex A to the Sysco Corporation Proxy Statement filed on September 26, 2007 (File No. 1-6544).
10.25†
—
First Amendment to the 2007 Stock Incentive Plan dated January 17, 2009, incorporated by reference to Exhibit 10.2 to Form 10-Q for the quarter ended March 28, 2009 filed on May 5, 2009 (File No. 1-6544).
10.26†
—
Form of Stock Option Grant Agreement issued to executive officers under the 2007 Stock Incentive Plan, incorporated by reference to Exhibit 10.6 to Form 10-Q for the quarter ended December 29, 2007 filed on February 5, 2008 (File No. 1-6544).
10.27†
—
Restricted Stock Award Agreement issued to Kenneth F. Spitler on January 17, 2009 under the 2007 Stock Incentive Plan, incorporated by reference to Exhibit 10.3 to Form 10-Q for the quarter ended March 28, 2009 filed on May 5, 2009 (File No. 1-6544).
10.28†
—
Amended and Restated 2004 Cash Performance Unit Plan (formerly known as the 2004 Long-Term Incentive Cash Plan and the 2004 Mid-Term Incentive Plan), incorporated by reference to Exhibit 10.4 to Form 10-Q for the quarter ended December 29, 2007 filed on February 5, 2008 (File No. 1-6544).
10.29†
—
First Amendment to the Fiscal Year 2008 Mid-Term Incentive Program dated September 11, 2008, incorporated by reference to Exhibit 10.1 to Form 10-Q for the quarter ended September 27, 2008 filed on November 4, 2008 (File No. 1-6544).
10.30†
—
Form of Performance Unit Grant Agreement issued to executive officers effective September 28, 2007 under the 2004 Mid-Term Incentive Plan, as corrected with respect to certain typographical errors by the Compensation Committee of the Board of Directors on February 11, 2009, incorporated by reference to Exhibit 10.4 to Form 10-Q for the quarter ended March 28, 2009 filed on May 5, 2009 (File No. 1-6544).
10.31†
—
Form of Performance Unit Grant Agreement issued to executive officers effective October 16, 2008, under the 2004 Cash Performance Unit Plan, incorporated by reference to Exhibit 10.2 to Form 10-Q for the quarter ended September 27, 2008 filed on November 4, 2008 (File No. 1-6544).
10.32†
—
Sysco Corporation 2008 Cash Performance Unit Plan, incorporated by reference to Annex A to the Sysco Corporation Proxy Statement filed October 7, 2008 (File No. 1-6544).
10.33†
—
2005 Management Incentive Plan, incorporated by reference to Annex B to the Sysco Corporation Proxy Statement for the November 11, 2005 Annual Meeting of Stockholders (File No. 1-6544).
10.34†
—
First Amendment to 2005 Management Incentive Plan dated July 13, 2007, incorporated by reference to Exhibit 10.33 to Form 10-K for the year ended June 30, 2007 filed on August 28, 2007 (File No. 1-6544).
10.35†
—
Form of Fiscal Year 2008 Bonus Award for the Chief Executive Officer, President, Chief Financial Officer, Executive Vice Presidents and Senior Vice Presidents (excluding Senior Vice Presidents of Operations) under the 2005 Management Incentive Plan, incorporated by reference to Exhibit 10.36 to Form 10-K for the year ended June 30, 2007 filed on August 28, 2007 (File No. 1-6544).
10.36†
—
First Amended and Restated 2005 Management Incentive Plan, incorporated by reference to Exhibit 10.34 to Form 10-K for the year ended July 28, 2008 filed on August 26, 2008 (File No. 1-6544).
10.37†
—
Form of Fiscal Year 2009 Bonus Award for the Chief Executive Officer, President, Chief Financial Officer and Executive Vice Presidents under the First Amended and Restated 2005 Management Incentive Plan, incorporated by reference to Exhibit 10.35 to Form 10-K for the year ended July 28, 2008 filed on August 26, 2008 (File No. 1-6544).


Table of Contents
10.38†#
—
Form of Fiscal Year 2010 Bonus Award for the Chief Executive Officer and Chief Financial Officer, President and Chief Operating Officer, and Executive Vice Presidents under the First Amended and Restated 2005 Management Incentive Plan.
10.39†
—
Form of Fiscal Year 2009 Supplemental Bonus Agreement for the Chief Executive Officer and the President, incorporated by reference to Exhibit 10.40 to Form 10-K for the year ended July 28, 2008 filed on August 26, 2008 (File No. 1-6544).
10.40†
—
Form of Executive Severance Agreement between Sysco Corporation and Kenneth F. Spitler dated July 14, 2004, incorporated by reference to Exhibit 10(jj) to Form 10-K for the year ended July 3, 2004 filed on September 16, 2004 (File No. 1-6544).
10.41†
—
Form of First Amendment dated September 3, 2004 to Executive Severance Agreement between Sysco Corporation and Kenneth F. Spitler, incorporated by reference to Exhibit 10(kk) to Form 10-K for the year ended July 3, 2004 filed on September 16, 2004 (File No. 1-6544).
10.42†
—
First Amended and Restated Executive Severance Agreement dated December 23, 2008 between Sysco Corporation and Kenneth F. Spitler, incorporated by reference to Exhibit 10.5 to Form 10-Q for the quarter ended December 27, 2008 filed on February 3, 2009 (File No. 1-6544).
10.43†
—
Transition and Retirement Agreement between Sysco Corporation and Richard J. Schnieders dated January 19, 2009, incorporated by reference to Exhibit 10.1 to Form 10-Q for the quarter ended March 28, 2009 filed on May 5, 2009 (File No. 1-6544).
10.44†# — Description of Compensation Arrangements with Named Executive Officers. 10.45†
—
Sysco Corporation Amended and Restated Non-Employee Directors Stock Option Plan, incorporated by reference to Exhibit 10(g) to Form 10-K for the year ended June 28, 1997 (File No. 1-6544).
10.46†
—
Amendment to the Amended and Restated Non-Employee Directors Stock Option Plan dated effective November 5, 1998, incorporated by reference to Exhibit 10(i) to Form 10-K for the year ended July 3, 1999 (File No. 1-6544).
10.47†
—
Amended and Restated Non-Employee Directors Stock Plan, incorporated by reference to Appendix B to Proxy Statement filed on September 24, 2001 (File No. 1-6544).
10.48†
—
Form of Stock Option Grant Agreement issued to non-employee directors on September 3, 2004 under the Non-Employee Directors Stock Plan, incorporated by reference to Exhibit 10(b) to Form 8-K field on September 9, 2004 (File No. 1-6544).
10.49†
—
Form of Retainer Stock Agreement for issuance to Non-Employee Directors under the Non-Employee Directors Stock Plan, incorporated by reference to Exhibit 10(a) to Form 10-Q for the quarter ended January 1, 2005 filed on February 10, 2005 (File No. 1-6544).
10.50†
—
Amended and Restated 2005 Non-Employee Directors Stock Plan, incorporated by reference to Exhibit 10.1 to Form 10-Q for the quarter ended December 29, 2007 filed on February 5, 2008 (File No. 1-6544).
10.51†# — First Amendment to the Amended and Restated 2005 Non-Employee Directors Stock Plan effective June 28, 2009. 10.52†
—
Form of Option Grant Agreement under the 2005 Non-Employee Directors Stock Plan, incorporated by reference to Exhibit 10(i) to Form 10-Q for the quarter ended December 31, 2005 filed on February 9, 2006 (File No. 1-6544).
10.53†
—
Form of Restricted Stock Grant Agreement under the 2005 Non-Employee Directors Stock Plan, incorporated by reference to Exhibit 10(j) to Form 10-Q for the quarter ended December 31, 2005 filed on February 9, 2006 (File No. 1-6544).
10.54†
—
Form of Restricted Stock Agreement under the Amended and Restated 2005 Non-Employee Directors Stock Plan, incorporated by reference to Exhibit 10.1 to Form 10-Q for the quarter ended March 29, 2008 filed on May 6, 2008 (File No. 1-6544).
10.55†
—
Form of Retainer Stock Award Agreement under the 2005 Non-Employee Directors Stock Plan, incorporated by reference to Exhibit 10.1 to Form 8-K filed on November 15, 2006 (File No. 1-6544).
10.56†
—
Second Amended and Restated Board of Directors Deferred Compensation Plan dated April 1, 2002, incorporated by reference to Exhibit 10(aa) to Form 10-K for the year ended June 29, 2002 filed on September 25, 2002 (File No. 1-6544).
Table of Contents
10.57†
—
First Amendment to Second Amended and Restated Board of Directors Deferred Compensation Plan dated July 12, 2002, incorporated by reference to Exhibit 10(bb) to Form 10-K for the year ended June 29, 2002 filed on September 25, 2002 (File No. 1-6544).
10.58†
—
Second Amendment to the Second Amended and Restated Sysco Corporation Board of Directors Deferred Compensation Plan, incorporated by reference to Exhibit 10(k) to Form 10-Q for the quarter ended December 31, 2005 filed on February 9, 2006 (File No. 1-6544).
10.59†
—
Second Amended and Restated Sysco Corporation 2005 Board of Directors Deferred Compensation Plan, incorporated by reference to Exhibit 10.59 to Form 10-K for the year ended July 28, 2008 filed on August 26, 2008 (File No. 1-6544).
10.60†# — Description of Compensation Arrangements with Non-Employee Directors, including the Non-Executive Chairman. 10.61†
—
Form of Indemnification Agreement with Non-Employee Directors, incorporated by reference to Exhibit 10.61 to Form 10-K for the year ended July 28, 2008 filed on August 26, 2008 (File No. 1-6544).
14.1
—
Code of Business Conduct and Ethics, incorporated by reference to Exhibit 14.1 to Form 8-K filed on July 19, 2007 (File No. 1-6544).
21.1# — Subsidiaries of the Registrant. 23.1# — Consent of Independent Registered Public Accounting Firm. 31.1# — CEO and CFO Certification Pursuant to Section 302 of the Sarbanes-Oxley Act of 2002. 32.1# — CEO and CFO Certification Pursuant to Section 906 of the Sarbanes-Oxley Act of 2002.
† Executive Compensation Arrangement pursuant to 601(b)(10)(iii)(A) of Regulation S-K
# Filed Herewith
Exhibit 10.38
[Form Agreement for CEO, COO, and EVPs]
FISCAL YEAR 2010 2005 MANAGEMENT INCENTIVE PLAN
BONUS AGREEMENT
This SYSCO CORPORATION FISCAL YEAR 2010 MANAGEMENT INCEN TIVE PLAN BONUS AGREEMENT (this “ Agreement ”) was adopted by the Plan Committee pursuant to the First Amended and Restated Sysco Corporation 2005 Management Incentive Plan (the “ Plan ”) (a copy of which is attached as Exhibit 1 ) and agreed to by the Company and _______(“ Executive ”) effective June 27, 2009. This Agreement is effective for the fiscal year ending July 3, 2010 (the “ Plan Year ”). Capitalized terms used but not otherwise defined herein shall have the meanings given them in the Plan.
1. Calculation of Bonus . Subject to the further adjustments, limitations and additions provided for in the Plan and this Agreement, Executive’s bonus under this Agreement shall be equal to the product of: (i) Executive’s MIP Salary; and (B) the Table B Percentage. Notwithstanding the foregoing, Executive will be entitled to a bonus under this Agreement only if the Company achieves an Increase in Earnings per Share of at least four percent (4%) for the Plan Year and a 3-Year Average Return on Capital of at least ten percent (10%) for the three fiscal years ending with the Plan Year.
(b) General Rules Regarding Bonus Calculation .
(i) Consistent Accounting . In determining whether or not Executive is entitled to a bonus under this Agreement, the Company’s accounting practice and generally accepted accounting principles shall be applied on a basis consistent with prior periods, and such determination shall be based on the calculations made by the Company, approved by the Plan Compensation Committee and binding on Executive. Notwithstanding the foregoing, if there is any material change in GAAP during a Plan Year that results in a material change in accounting for the revenues or expenses of the Company the calculations of the Table B Percentage for the Plan Year (the “ GAAP Change Year ”) shall be made as if such change in GAAP had not occurred during the GAAP Change Year. In determining the Increase in Earnings Per Share for the Company in the year following the GAAP Change Year, the calculation shall be made after taking into account such change in GAAP. In determining the 3-Year Average Return on Capital of the Company in the year following the GAAP Change Year, the calculation shall be made as if such accounting rules were in effect for the entire calculation period.
(ii) Maximum Bonus . Nothing contained in the Plan or this Agreement shall be construed to allow the payment of a bonus under this Agreement based on a percentage in excess of the maximum percentage set forth on Table B , attached hereto. Notwithstanding any other provision in this Agreement to the contrary, in no event shall the Executive be entitled to a bonus amount for the Plan Year in excess of 1% of the Company’s earnings before income taxes as publicly disclosed in the “Consolidated Results of Operations” section of the financial statements contained in the Company’s annual report to the Securities and Exchange Commission on Form 10-K for the Plan Year.
(iii) Tax Law Changes . If the Internal Revenue Code is amended during the Plan Year and, as a result of such amendment(s), the effective tax rate applicable to the earnings of the Company (as described in the Income Taxes footnote to the financial statements contained in the Company’s annual report to the Securities and Exchange Commission on Form 10-K for the Plan Year) changes during the year, the calculation of Table B Percentage for such Plan Year (the “ Rate Change Year ”) shall be made as if such rate change had not occurred during the Rate Change Year. In determining the Increase in Earnings Per Share for the Company in the year following the Rate Change Year, the calculation shall be made after taking into account such rate change. In determining the 3-Year Average Return on Capital for the Company in the year following the Rate Change Year, the calculation shall be made as if such rate change were in effect for the entire calculation period.
2. Extraordinary Events . If, during the Plan Year, the Company experiences an Extraordinary Event(s) that results in the Company recognizing a net after-tax gain or net after-tax income (on a consolidated basis) with respect to such Extraordinary Event(s) (“ Extraordinary Income ”), the Plan

Committee may reduce the Company Performance Bonus payable to Executive under this Agreement in its sole and absolute discretion; provided however, that the Plan Committee may not reduce the bonus payable to Executive under this Agreement to an amount less than the bonus Executive would have earned if the Company did not include the Extraordinary Income in the calculation of Executive’s bonus for the Plan Year.
3. Payment . Within ninety (90) days following the end of the Plan Year, the Company shall determine and the Plan Committee shall approve the amount of any bonus earned by Executive under this Agreement. Such bonus shall be payable in the manner, at the times and in the amounts provided in the Plan.
4. Clawback of Bonus . In accordance with the Company’s incentive payment clawback policy, in the event of a restatement of financial results (other than a restatement due to a change in accounting policy) within thirty-six (36) months of the payment of a bonus under this Agreement, if the Plan Committee determines in its sole and absolute discretion, that the bonus paid to Executive under this Agreement for the Plan Year would have been lower had it been calculated based on such restated results (the “ Adjusted MIP Bonus ”), then the Plan Committee shall, subject to applicable governing law, recoup from Executive, in such form and at such time as the Plan Committee determines in its sole and absolute discretion, the difference between the amount previously paid to Executive pursuant to this Agreement (without regard to amounts deferred by Executive under the Company’s executive benefit plans) and the Adjusted MIP Bonus (the “ Excess Payment ”). Executive hereby agrees that Executive shall promptly repay to the Company the amount of any Excess Payment received by Executive pursuant to this Agreement at the time or times and in the form determined by the Plan Committee.
5. Definitions
(a) For Calculations Regarding Table B :
(i) Total Capital : – for any given fiscal year, and with respect to the Company, the sum of the following:
(ii) Return on Capital : – the Return on Capital for the Company is expressed as a percentage and is computed by dividing the Company’s net after-tax earnings for the relevant fiscal year by the Company’s Total Capital for the relevant fiscal year.
(iii) 3-Year Average Return on Capital : – the average Return on Capital for the Company for the three fiscal years ending with the Program Year.
(iv) Increase in Earnings Per Share : – expressed as a percentage increase of the net after-tax fully diluted earnings per share of the Company for the year over the prior fiscal year’s net after-tax fully diluted earnings per share of the Company.
(v) Table B Percentage : – the percentage determined from Table B attached hereto which coincides with the 3-Year Average Return on Capital and Increase in Earnings Per Share for the Company as a whole.
(A) Stockholder’s Equity : – the average of the amounts outstanding for the Company (as determined under Section 5(c)) at the end of each fiscal quarter for which the computation is being made (quarterly average basis).
(B) Long-Term Debt : – the average of the long-term portion of the debt of the Company (as determined under Section 5(c)) outstanding at the end of each fiscal quarter for which the computation is being made (quarterly average basis).
(b) Extraordinary Event. The sale or exchange of an operating division or subsidiary of the Company.
(c) Method of Calculating Quarterly Averages: — In determining the average amount outstanding of stockholders’ equity, and long-term debt under paragraphs 5(a)(i)(A) and 5(a)(i)(B), above, such averages shall be determined by dividing five (5) into the sum of the amounts outstanding of the relevant category at the end of each of the four quarters of the relevant fiscal year plus the amount outstanding of the relevant category at the beginning of the relevant fiscal year.
(d) MIP Salary – Executive’s base salary as of the end of the Plan Year.
6. Term of Agreement . This Agreement shall be effective only for the Plan Year.
7. No Employment Arrangement Implied . Nothing in this Agreement or the Plan shall imply any right of employment for Executive, and except as set forth in Section 9 of the Plan with respect to a Change of Control or as otherwise determined by the Committee, in its discretion, if Executive is terminated, voluntarily or involuntarily, with or without cause, prior to the end of the Plan Year, Executive shall not be entitled to any bonus for the Plan Year regardless of whether or not such bonus had been or would have been earned in whole or in part, but any unpaid bonus earned with respect to a prior fiscal year shall not be affected.
8. Plan Provisions shall Govern . This Agreement is subject to and governed by the Plan and in the case of any conflict between the terms of this Agreement and the contents of the Plan, the terms of the Plan will control.
9. Governing Law . The interpretation, construction and performance of this Agreement shall be governed by and construed and enforced in accordance with the internal laws of the State of Delaware without regard to the principle of conflict of laws.
10. Counterparts . This Agreement may be executed in counterparts, each of which shall be deemed to be an original and all of which together shall constitute one and the same instrument.
11. Severability . Provided the other provisions of this Agreement do not frustrate the purpose and intent of the law, in the event that any portion of this Agreement shall be determined to be invalid or unenforceable to any extent, the same shall to that extent be deemed severable from this Agreement, and the invalidity or unenforceability thereof shall not affect the validity and enforceability of the remaining portion of this Agreement.
12. Amendment and Termination . The Company may amend this Agreement at any time without the approval of Executive up to and until the day that is ninety (90) days after the beginning of the Plan Year. The Company may amend this Agreement at any time that is more than ninety (90) days after the beginning of the Plan Year without the approval of the Executive; provided however no amendments will be permitted to this Agreement that would directly or indirectly cause the compensation under this Agreement to fail to qualify as “performance based compensation” as that term is defined in Section 162(m) of the Code. Notwithstanding anything to the contrary contained in this Agreement, the Company may terminate this Agreement at any time during the Plan Year and Executive shall not be entitled to any bonus under this Agreement for the Plan Year regardless of when during the Plan Year this Agreement is terminated.
[Signatures on Following Page]

IN WITNESS WHEREOF, the Company has caused this Agreement to be executed by a duly authorized officer of the Company and Executive has executed this Agreement as of the day and year first written above.
SYSCO CORPORATION EXECUTIVE By: ________________________ ______________________________________________________________________ Michael C. Nichols Sr. Vice President, General Counsel and Corporate Secretary
[Name of Executive]

EXHIBIT 1 “PLAN”

TABLE B MANAGEMENT INCENTIVE PLAN
OVERALL COMPANY PERFORMANCE
3-YR AVG
RETURN ON PERCENTAGE INCREASE IN EARNINGS PER SHARE
CAPITAL 4-5% 5-6% 6-7% 7-8% 8-9% 9-10% 10-11% 11-12% 12-13% 13-14% 14-15% 15-16% 16-17% 17-18% 18-19% 19-20% 20%+
10% 20 40 60 70 80 90 100 110 120 130 140 150 160 165 170 175 180 11% 30 50 70 80 90 100 110 120 130 140 150 160 170 175 180 185 190 12% 40 60 80 90 100 110 120 130 140 150 160 170 180 185 190 195 200 13% 50 70 90 100 110 120 130 140 150 160 170 180 190 195 200 205 210 14% 60 80 100 110 120 130 140 150 160 170 180 190 200 205 210 215 220 15% 70 90 110 120 130 140 150 160 170 180 190 200 210 215 220 225 230 16% 80 100 120 130 140 150 160 170 180 190 200 210 220 225 230 235 240 17% 90 110 130 140 150 160 170 180 190 200 210 220 230 235 240 245 250 18% 100 120 140 150 160 170 180 190 200 210 220 230 240 245 250 255 260 19% 100 120 140 160 170 180 190 200 210 220 230 240 250 255 260 265 270 20% 100 120 140 160 180 190 200 210 220 230 240 250 260 265 270 275 280 21% 100 120 140 160 180 200 210 220 230 240 250 260 270 275 280 285 290 22% 100 120 140 160 180 200 220 230 240 250 260 270 280 285 290 295 300 23% 100 120 140 160 180 200 220 240 250 260 270 280 290 295 300 305 310 24% 100 120 140 160 180 200 220 240 260 270 280 290 300 305 310 315 320
25%+ 100 120 140 160 180 200 220 240 260 280 290 300 310 315 320 325 330

Exhibit 10.44
Summary of Compensation Arrangements with Named Executive Officers (As of August 15, 2009)
The following summarizes, as of August 15, 2009, the cash compensation and benefits received by the Company’s Chief Executive Officer and the other officers who will be named in the Summary Compensation Table in the proxy statement for the Company’s upcoming Annual Meeting of Stockholders (collectively, the “Named Executive Officers”), excluding our previous Chief Executive Officer, Mr. Schnieders, who will be named in the Summary Compensation Table in the proxy statement but is no longer an employee of the Company. The following is a summary of existing oral at-will arrangements, and does not provide any additional rights.
The executive officers of the Company serve at the discretion of the Board of Directors. The Compensation Committee of the Board (the “Committee”) reviews and determines the compensation and benefits that are paid to the Company’s executive officers, including the Named Executive Officers.
The current salaries of the Named Executive Officers are as follows:
The Named Executive Officers are also eligible to participate in the Company’s executive and regular benefit plans and programs, as described below. All executive benefit plans and agreements are filed as exhibits to the Company’s Exchange Act filings. Information regarding these plans and agreements, as well as compensation paid or earned during fiscal 2009, will be included in the Company’s 2009 Proxy Statement.
William J. DeLaney Chief Executive Officer and Chief Financial Officer
$ 800,000
Kenneth F. Spitler Vice Chairman of the Board, President and Chief Operating Officer
$ 730,000
Larry G. Pulliam Executive Vice President, Foodservice Operations
$ 532,000
Stephen W. Smith Executive Vice President, South and West U.S. Foodservice Operations
$ 494,000
Michael W. Green Executive Vice President, Northeast and North Central U.S. Foodservice Operations
$ 494,000
Management Incentive Plan
The Named Executive Officers are eligible to receive an annual incentive bonus under the Sysco Corporation Management Incentive Plan (the “MIP”).
Deferred Compensation Election
MIP participants, including the Named Executive Officers, may defer up to 40% of their annual incentive bonus under the Executive Deferred Compensation Plan (“EDCP”). They may also elect to defer all or a portion of their salary under the EDCP. For deferrals of up to 20% of the annual incentive bonus, the EDCP provides for Sysco to credit the participant’s deferred compensation account in an amount equal to 15% of the amount deferred.
Stock Options and Restricted Stock
The Named Executive Officers are eligible to receive options under Sysco’s stock option plans, including the 2007 Stock Incentive Plan, in such amounts and with such terms and conditions as determined by the Committee at the time of grant. The 2007 Stock Incentive Plan also allows for the issuance of restricted stock grants and restricted stock units.
Cash Performance Unit Plan
The Named Executive Officers are eligible to participate in the Sysco Corporation 2008 Cash Performance Unit Plan.
Supplemental Executive Retirement Plan
The Named Executive Officers are also eligible to participate in a Supplemental Executive Retirement Plan (the “SERP”).
Severance Agreements
Mr. Spitler has a severance agreement with the Company.
Other Benefits
The Named Executive Officers also participate in Sysco’s regular employee benefit programs, which include a defined benefit retirement plan, a 401(k) plan with Company match, group medical and dental coverage, group life insurance and other group benefit plans. They are also provided with additional life insurance benefits, as well as long-term disability coverage and certain perquisites and personal benefits.
Exhibit 10.51
FIRST AMENDMENT TO THE SYSCO CORPORATION AMENDED AND RESTATED
2005 NON-EMPLOYEE DIRECTORS STOCK PLAN
Section 3.1 of the Sysco Corporation Amended and Restated 2005 Non-Employee Directors Stock Plan (the “Plan”) is hereby amended by deleting it in its entirety and replacing it with the following:
S ECTION 3.1 Eligibility . A Non-Employee Director who is otherwise eligible to receive cash payment for services provided as a Director may elect to receive up to 50% of his or her annual retainer fee (exclusive of any fees or other amounts payable for attendance at the meetings of the Board or for service on any committee thereof and exclusive of any additional retainer fee paid to the Non-Executive Chairman of the Board for his or her service in such capacity), in 10% increments, in the form of Common Stock (a “Stock Election”), subject to the following terms of this Article 3. The amount of the fee which a Non-Employee Director elects to receive in Common Stock is referred to herein as the “Elected Amount.” The Elected Amount shall be deducted ratably from the quarterly payments of the annual retainer fee payable to such Non-Employer Director in that fiscal year in which the Elected Amount would have been paid but for the Stock Election.
Sections 3.2 and 3.4 of the Plan are hereby amended so that all references therein to “Stock Election” are capitalized.
IN WITNESS WHEREOF, the Company has caused this First Amendment to be executed, effective as of the 28th day of June, 2009.
SYSCO CORPORATION By: /s/ Michael C. Nichols
Name: Michael C. Nichols Title: Sr. Vice President, General Counsel and Secretary

Exhibit 10.60
Summary of Compensation Arrangements with Non-Employee Directors, including the Non-Executive Chairman (As of August 15, 2009)
The following summarizes, as of August 15, 2009, the current cash compensation and benefits received by the Company’s non-employee directors, including Mr. Fernandez, the Company’s Non-Executive Chairman of the Board of Directors (the “Chairman”). The following is a summary of existing oral, at will, arrangements, and does not provide any additional rights.
Retainer Fees
The Company pays non-employee directors who serve as committee chairpersons $85,000 per year and all other non-employee directors $70,000 per year. The Chairman also receives an additional $250,000 in cash for his or her role as Chairman (the “Chairman’s Retainer”).
Non-employee directors also receive the following fees for attendance at meetings:
All non-employee directors are entitled to receive reimbursements of expenses for all services as a director, including committee participation or special assignments.
Directors Deferred Compensation Plan
Non-employee directors may defer all or a portion of their annual retainer, including the Chairman’s Retainer, and meeting attendance fees under the Directors Deferred Compensation Plan. With respect to amounts deferred, non-employee directors may choose from a variety of investment options, including Moody’s Average Corporate Bond Yield plus 1% for amounts deferred or matched prior to July 2, 2008 and Moody’s Average Corporate Bond Yield without the additional 1% for amounts deferred or matched on or after July 2, 2008. Such deferred amounts will be credited with investment
• For committee meetings held in conjunction with regular Board meetings, committee chairpersons who attend in person (or who participate by telephone because of illness or the inability to travel) will receive $1,750 and committee members who attend in person (or who participate by telephone because of illness or the inability to travel) will receive $1,500;
• For special committee meetings (not held in conjunction with regular Board meetings), committee chairpersons who attend in person or who participate by telephone will receive $1,750 and committee members who attend in person or who participate by telephone will receive $1,500; and
• For special Board meetings, all non-employee directors who attend in person or who participate by telephone will receive $1,500.
gains or losses until the non-employee director’s retirement from the Board or until the occurrence of certain other events.
Non-Employee Directors Stock Plan
The 2005 Non-Employee Directors Stock Plan provides for grants of stock options, restricted stock, restricted stock units and elected shares in lieu of a portion of the annual retainer.
Options . Under the Plan, non-employee directors are eligible to receive stock options at the discretion of the Board. The size of individual grants and vesting terms will be set by the Board at the time of grant.
Elected Shares . The Plan also permits each non-employee director to elect to receive up to one-half of his or her annual retainer in Common Stock, in which case the Company will provide a matching grant of 50% of the number of shares received as a portion of the retainer. The portion of the annual fee represented by the Chairman’s Retainer is not currently eligible for the election and matching grant described in this paragraph.
Restricted Stock . Under the Plan, the Board is authorized to issue restricted stock and restricted stock units to non-employee directors on terms set forth in the Plan.
The Directors Deferred Compensation Plan and Non-Employee Directors Stock Plan, as amended, have been filed as exhibits to the Company’s Exchange Act filings. Additional information regarding these plans, and the Company’s proposed 2009 Non-Employee Directors Stock Plan, will be included in the Company’s 2009 Proxy Statement.
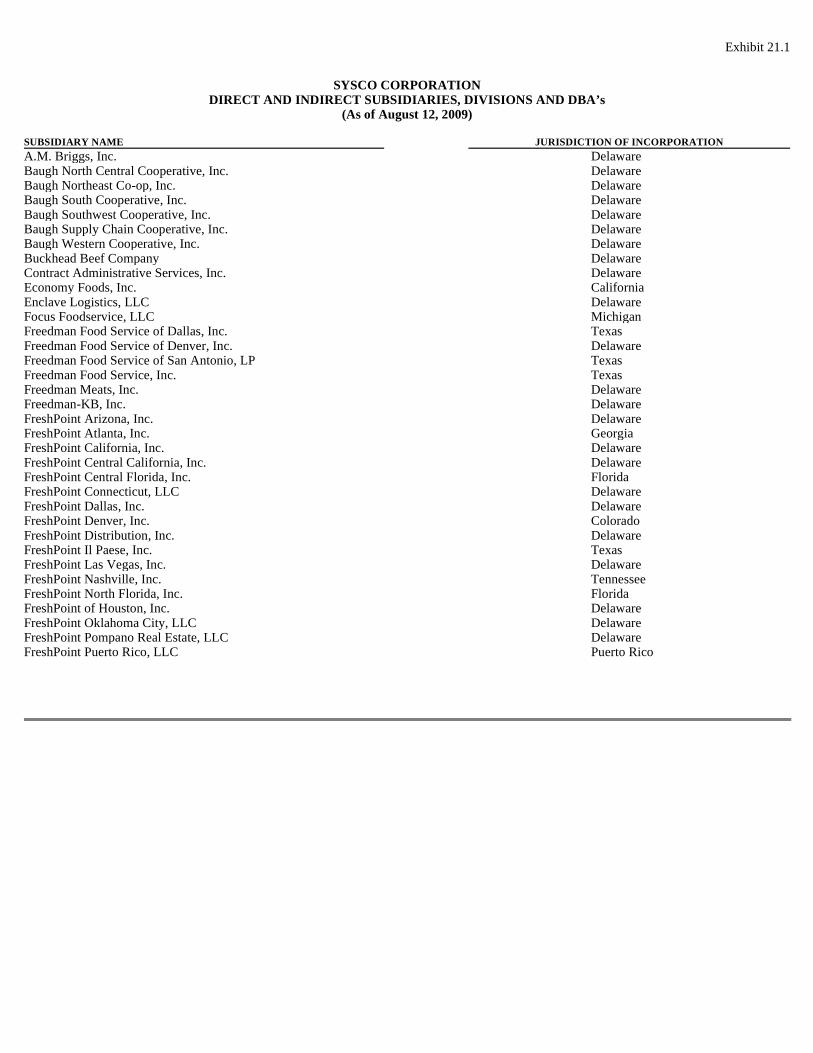
Exhibit 21.1
SYSCO CORPORATION DIRECT AND INDIRECT SUBSIDIARIES, DIVISIONS AND DBA ’s
(As of August 12, 2009)
SUBSIDIARY NAME JURISDICTION OF INCORPORATION
A.M. Briggs, Inc. Delaware Baugh North Central Cooperative, Inc. Delaware Baugh Northeast Co-op, Inc. Delaware Baugh South Cooperative, Inc. Delaware Baugh Southwest Cooperative, Inc. Delaware Baugh Supply Chain Cooperative, Inc. Delaware Baugh Western Cooperative, Inc. Delaware Buckhead Beef Company Delaware Contract Administrative Services, Inc. Delaware Economy Foods, Inc. California Enclave Logistics, LLC Delaware Focus Foodservice, LLC Michigan Freedman Food Service of Dallas, Inc. Texas Freedman Food Service of Denver, Inc. Delaware Freedman Food Service of San Antonio, LP Texas Freedman Food Service, Inc. Texas Freedman Meats, Inc. Delaware Freedman-KB, Inc. Delaware FreshPoint Arizona, Inc. Delaware FreshPoint Atlanta, Inc. Georgia FreshPoint California, Inc. Delaware FreshPoint Central California, Inc. Delaware FreshPoint Central Florida, Inc. Florida FreshPoint Connecticut, LLC Delaware FreshPoint Dallas, Inc. Delaware FreshPoint Denver, Inc. Colorado FreshPoint Distribution, Inc. Delaware FreshPoint Il Paese, Inc. Texas FreshPoint Las Vegas, Inc. Delaware FreshPoint Nashville, Inc. Tennessee FreshPoint North Florida, Inc. Florida FreshPoint of Houston, Inc. Delaware FreshPoint Oklahoma City, LLC Delaware FreshPoint Pompano Real Estate, LLC Delaware FreshPoint Puerto Rico, LLC Puerto Rico
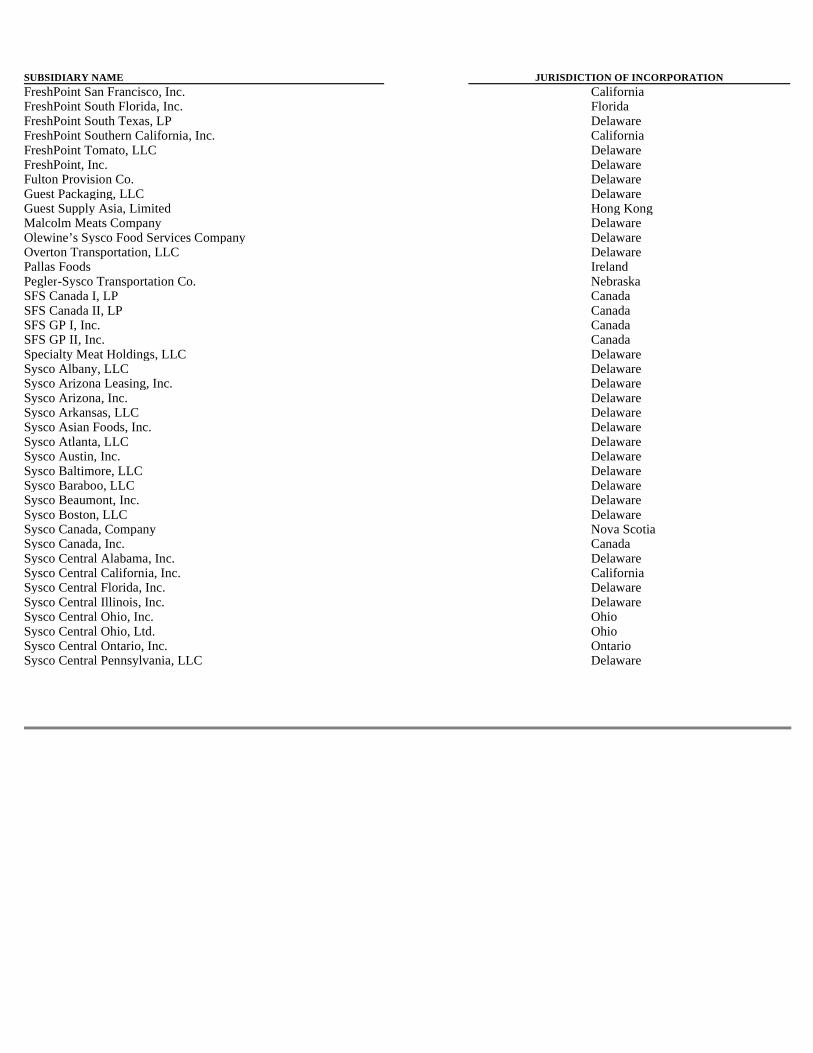
SUBSIDIARY NAME JURISDICTION OF INCORPORATION
FreshPoint San Francisco, Inc. California FreshPoint South Florida, Inc. Florida FreshPoint South Texas, LP Delaware FreshPoint Southern California, Inc. California FreshPoint Tomato, LLC Delaware FreshPoint, Inc. Delaware Fulton Provision Co. Delaware Guest Packaging, LLC Delaware Guest Supply Asia, Limited Hong Kong Malcolm Meats Company Delaware Olewine’s Sysco Food Services Company Delaware Overton Transportation, LLC Delaware Pallas Foods Ireland Pegler-Sysco Transportation Co. Nebraska SFS Canada I, LP Canada SFS Canada II, LP Canada SFS GP I, Inc. Canada SFS GP II, Inc. Canada Specialty Meat Holdings, LLC Delaware Sysco Albany, LLC Delaware Sysco Arizona Leasing, Inc. Delaware Sysco Arizona, Inc. Delaware Sysco Arkansas, LLC Delaware Sysco Asian Foods, Inc. Delaware Sysco Atlanta, LLC Delaware Sysco Austin, Inc. Delaware Sysco Baltimore, LLC Delaware Sysco Baraboo, LLC Delaware Sysco Beaumont, Inc. Delaware Sysco Boston, LLC Delaware Sysco Canada, Company Nova Scotia Sysco Canada, Inc. Canada Sysco Central Alabama, Inc. Delaware Sysco Central California, Inc. California Sysco Central Florida, Inc. Delaware Sysco Central Illinois, Inc. Delaware Sysco Central Ohio, Inc. Ohio Sysco Central Ohio, Ltd. Ohio Sysco Central Ontario, Inc. Ontario Sysco Central Pennsylvania, LLC Delaware

SUBSIDIARY NAME JURISDICTION OF INCORPORATION
Sysco Charlotte, LLC Delaware Sysco Chicago, Inc. Delaware Sysco Cincinnati, LLC Delaware Sysco Cleveland, Inc. Delaware Sysco Columbia, LLC Delaware Sysco Connecticut, LLC Delaware Sysco Corporation Delaware Sysco Dallas, Inc. Delaware Sysco Denver, Inc. Colorado Sysco Detroit, LLC Delaware Sysco Disaster Relief Foundation, Inc. Texas Sysco East Texas, LLC Delaware Sysco Eastern Maryland, LLC Delaware Sysco Eastern Wisconsin, LLC Delaware Sysco Fine Meats Vancouver, Inc. Ontario Sysco Fine Meats Vancouver, Inc. Ontario Sysco Foundation, Inc. Texas Sysco Four Seasons Produce Ltd. British Columbia Sysco Freshcut Produce Toronto Inc. Canada Sysco George Town Limited Cayman Islands Sysco Global Holdings, B.V. Netherlands Sysco Global Resources, LLC Delaware Sysco Global Services, LLC Delaware Sysco Grand Cayman Company Cayman Islands Sysco Grand Rapids, LLC Delaware Sysco Guest Supply Europe Limited United Kingdom Sysco Guest Supply, LLC Delaware Sysco Gulf Coast, Inc. Delaware Sysco Hampton Roads, Inc. Delaware Sysco Holdings Limited New Brunswick Sysco Holdings of B.C., Inc. Canada Sysco Holdings of Kelowna, Inc. Canada Sysco Houston, Inc. Delaware Sysco Idaho, Inc. Idaho Sysco Indianapolis, LLC Delaware Sysco Intermountain, Inc. Delaware Sysco International Food Group, Inc. Florida Sysco International, Co. Nova Scotia Sysco Iowa, Inc. Delaware Sysco Jackson, LLC Delaware

SUBSIDIARY NAME JURISDICTION OF INCORPORATION
Sysco Jacksonville, Inc. Delaware Sysco Jamestown, LLC Delaware Sysco Kansas City, Inc. Missouri Sysco Kelowna Ltd. New Brunswick Sysco Knoxville, LLC Delaware Sysco Las Vegas, Inc. Delaware Sysco Lincoln, Inc. Nebraska Sysco Long Island, LLC Delaware Sysco Los Angeles, Inc. Delaware Sysco Louisville, Inc. Delaware Sysco Memphis, LLC Delaware Sysco Merger Ohio II, Inc. Delaware Sysco Metro New York, LLC Delaware Sysco Milton, Inc. Ontario Sysco Minnesota, Inc. Delaware Sysco Montana, Inc. Delaware Sysco Nashville, LLC Delaware Sysco Netherlands Partners, LLC Delaware Sysco New Mexico, LLC Delaware Sysco New Orleans, LLC Delaware Sysco Newport Meat Company Delaware Sysco North Central Florida, Inc. Delaware Sysco North Dakota, Inc. Delaware Sysco Northern New England, Inc. Maine Sysco Oklahoma, LLC Delaware Sysco Philadelphia, LLC Delaware Sysco Pittsburgh, LLC Delaware Sysco Portland, Inc. Delaware Sysco Raleigh, LLC Delaware Sysco Resources Hong Kong Limited Hong Kong Sysco Resources Midwest, Inc. Delaware Sysco Resources Northeast, Inc. Delaware Sysco Resources Southeast, Inc. Delaware Sysco Resources Southwest, Inc. Delaware Sysco Resources West, Inc. Delaware Sysco Resources, Inc. Delaware Sysco Riverside, Inc. Delaware Sysco Sacramento, Inc. Delaware Sysco San Antonio, Inc. Delaware Sysco San Diego, Inc. Delaware
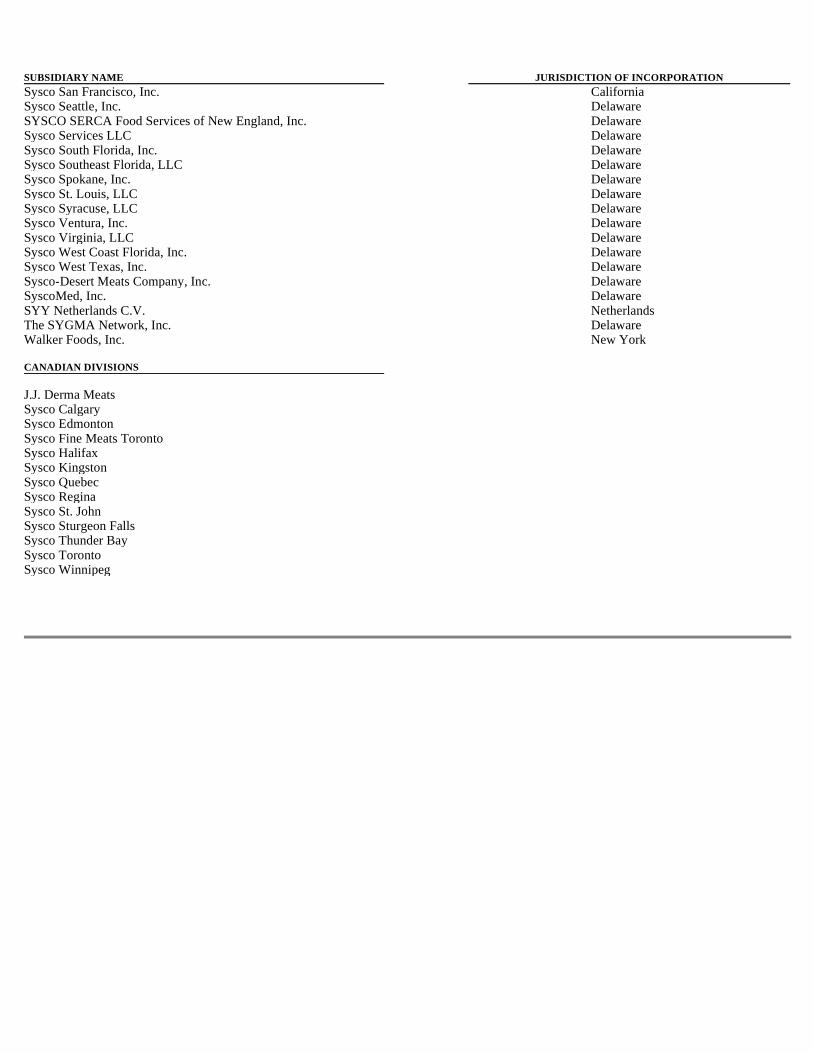
SUBSIDIARY NAME JURISDICTION OF INCORPORATION
Sysco San Francisco, Inc. California Sysco Seattle, Inc. Delaware SYSCO SERCA Food Services of New England, Inc. Delaware Sysco Services LLC Delaware Sysco South Florida, Inc. Delaware Sysco Southeast Florida, LLC Delaware Sysco Spokane, Inc. Delaware Sysco St. Louis, LLC Delaware Sysco Syracuse, LLC Delaware Sysco Ventura, Inc. Delaware Sysco Virginia, LLC Delaware Sysco West Coast Florida, Inc. Delaware Sysco West Texas, Inc. Delaware Sysco-Desert Meats Company, Inc. Delaware SyscoMed, Inc. Delaware SYY Netherlands C.V. Netherlands The SYGMA Network, Inc. Delaware Walker Foods, Inc. New York CANADIAN DIVISIONS
J.J. Derma Meats Sysco Calgary Sysco Edmonton Sysco Fine Meats Toronto Sysco Halifax Sysco Kingston Sysco Quebec Sysco Regina Sysco St. John Sysco Sturgeon Falls Sysco Thunder Bay Sysco Toronto Sysco Winnipeg
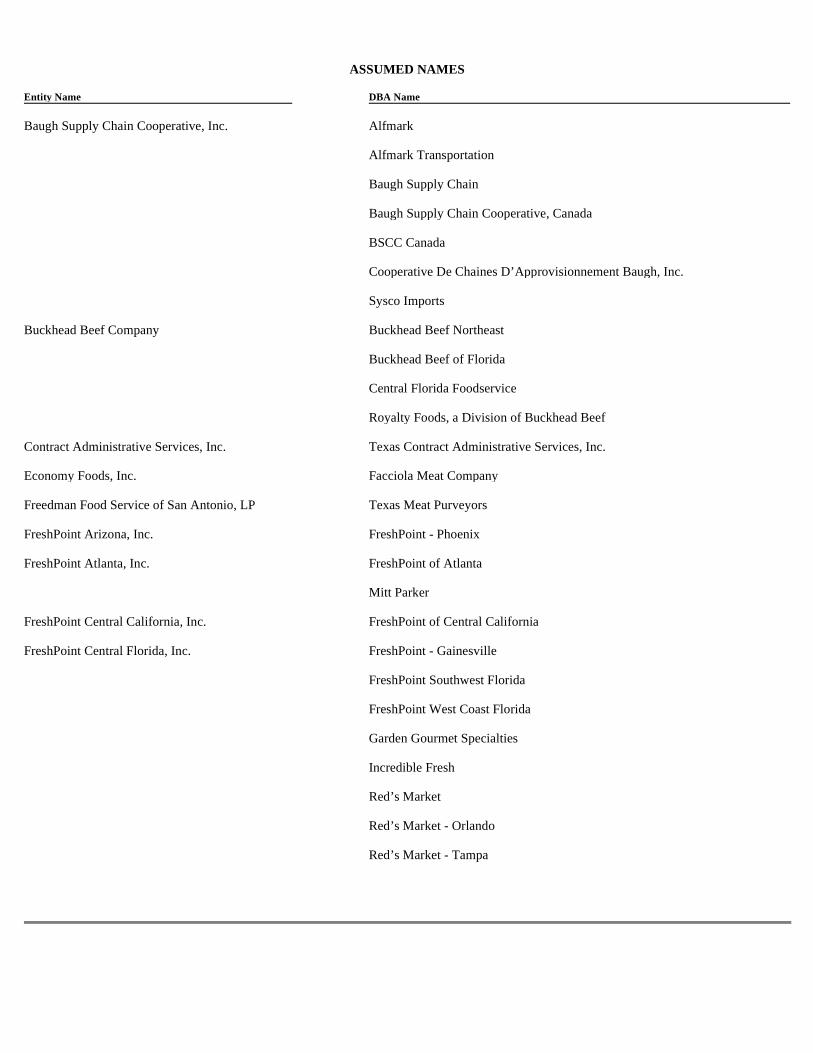
ASSUMED NAMES
Entity Name DBA Name
Baugh Supply Chain Cooperative, Inc. Alfmark Alfmark Transportation Baugh Supply Chain Baugh Supply Chain Cooperative, Canada BSCC Canada Cooperative De Chaines D’Approvisionnement Baugh, Inc. Sysco Imports Buckhead Beef Company Buckhead Beef Northeast Buckhead Beef of Florida Central Florida Foodservice Royalty Foods, a Division of Buckhead Beef Contract Administrative Services, Inc. Texas Contract Administrative Services, Inc. Economy Foods, Inc. Facciola Meat Company Freedman Food Service of San Antonio, LP Texas Meat Purveyors FreshPoint Arizona, Inc. FreshPoint - Phoenix FreshPoint Atlanta, Inc. FreshPoint of Atlanta Mitt Parker FreshPoint Central California, Inc. FreshPoint of Central California FreshPoint Central Florida, Inc. FreshPoint - Gainesville FreshPoint Southwest Florida FreshPoint West Coast Florida Garden Gourmet Specialties Incredible Fresh Red’s Market Red’s Market - Orlando Red’s Market - Tampa
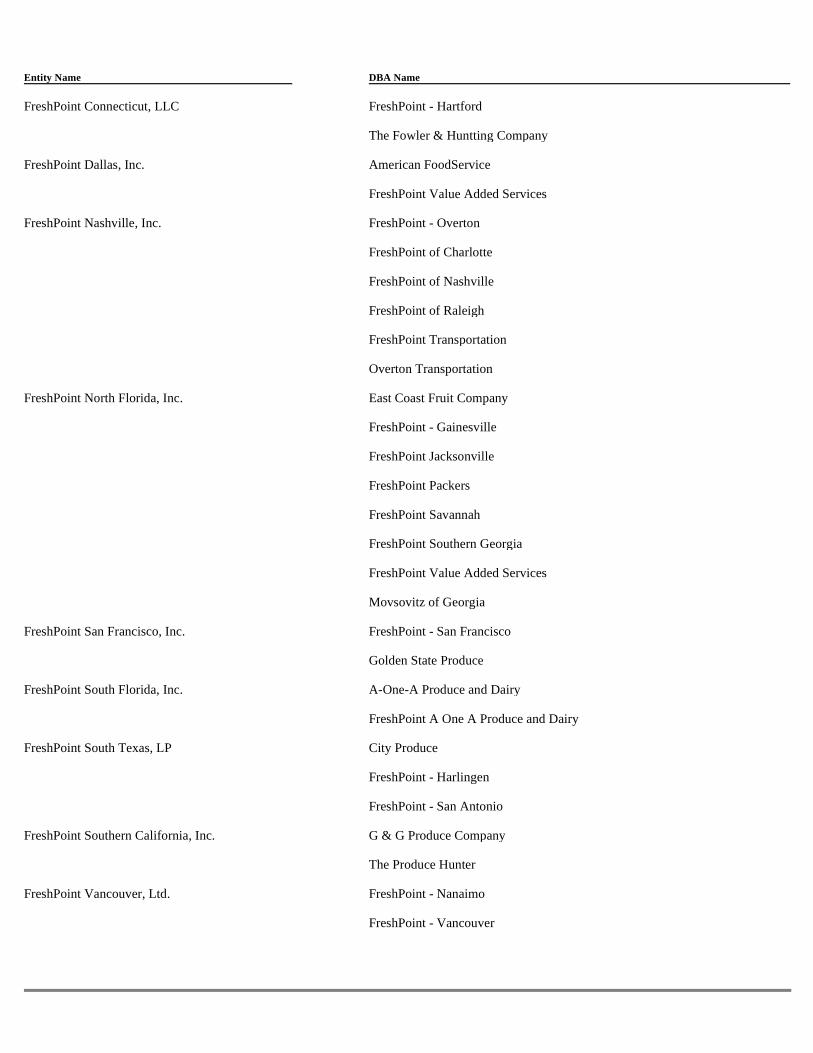
Entity Name DBA Name
FreshPoint Connecticut, LLC FreshPoint - Hartford The Fowler & Huntting Company FreshPoint Dallas, Inc. American FoodService FreshPoint Value Added Services FreshPoint Nashville, Inc. FreshPoint - Overton FreshPoint of Charlotte FreshPoint of Nashville FreshPoint of Raleigh FreshPoint Transportation Overton Transportation FreshPoint North Florida, Inc. East Coast Fruit Company FreshPoint - Gainesville FreshPoint Jacksonville FreshPoint Packers FreshPoint Savannah FreshPoint Southern Georgia FreshPoint Value Added Services Movsovitz of Georgia FreshPoint San Francisco, Inc. FreshPoint - San Francisco Golden State Produce FreshPoint South Florida, Inc. A-One-A Produce and Dairy FreshPoint A One A Produce and Dairy FreshPoint South Texas, LP City Produce FreshPoint - Harlingen FreshPoint - San Antonio FreshPoint Southern California, Inc. G & G Produce Company The Produce Hunter FreshPoint Vancouver, Ltd. FreshPoint - Nanaimo FreshPoint - Vancouver
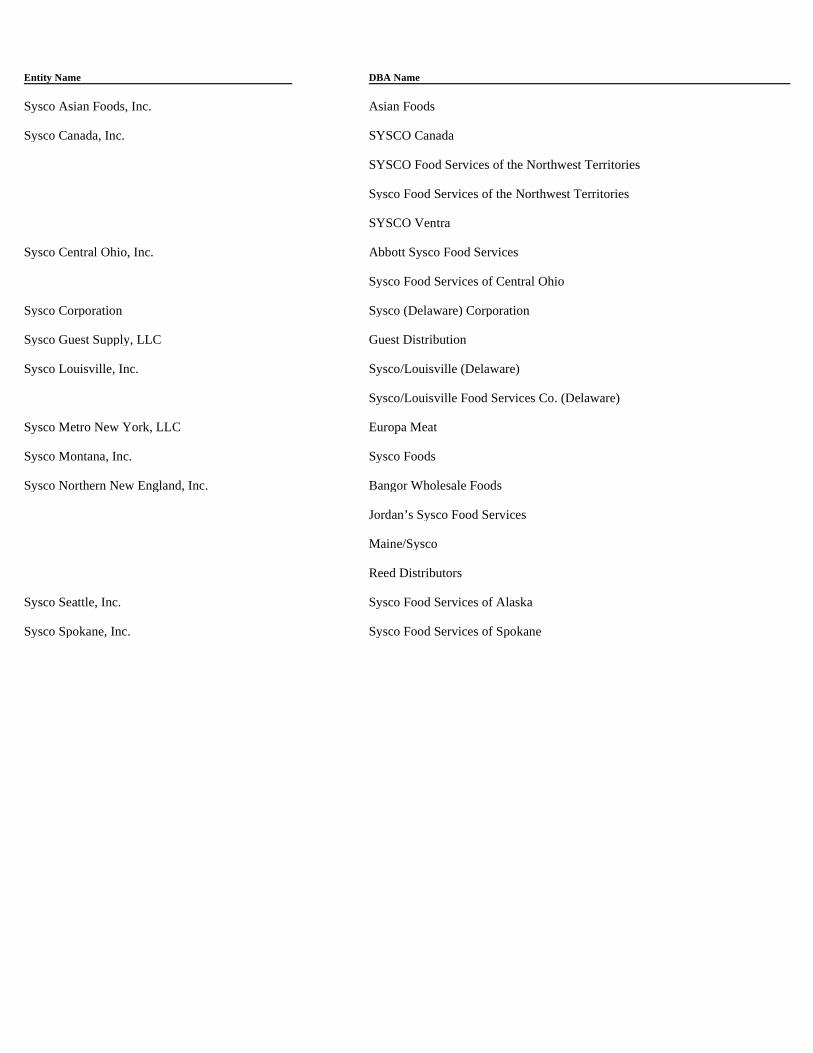
Entity Name DBA Name
Sysco Asian Foods, Inc. Asian Foods Sysco Canada, Inc. SYSCO Canada SYSCO Food Services of the Northwest Territories Sysco Food Services of the Northwest Territories SYSCO Ventra Sysco Central Ohio, Inc. Abbott Sysco Food Services Sysco Food Services of Central Ohio Sysco Corporation Sysco (Delaware) Corporation Sysco Guest Supply, LLC Guest Distribution Sysco Louisville, Inc. Sysco/Louisville (Delaware) Sysco/Louisville Food Services Co. (Delaware) Sysco Metro New York, LLC Europa Meat Sysco Montana, Inc. Sysco Foods Sysco Northern New England, Inc. Bangor Wholesale Foods Jordan’s Sysco Food Services Maine/Sysco Reed Distributors Sysco Seattle, Inc. Sysco Food Services of Alaska Sysco Spokane, Inc. Sysco Food Services of Spokane
Exhibit 23.1
CONSENT OF INDEPENDENT REGISTERED PUBLIC ACCOUNTING FIRM
We consent to the incorporation by reference of our reports dated August 25, 2009, with respect to the consolidated financial statements and the effectiveness of internal control over financial reporting of Sysco Corporation, included in this Annual Report (Form 10-K) for the year ended June 27, 2009, in the following registration statements and related prospectuses.
Houston, Texas August 25, 2009
Sysco Corporation Form S-3 File No. 333-126199 Sysco Corporation Form S-3 File No. 333-157413 Sysco Corporation Form S-4 File No. 333-50842 Sysco Corporation Form S-8 File No. 333-147338 Sysco Corporation Form S-8 File No. 33-45820 Sysco Corporation Form S-8 File No. 333-01259 Sysco Corporation Form S-8 File No. 333-01255 Sysco Corporation Form S-8 File No. 333-66987 Sysco Corporation Form S-8 File No. 333-49840 Sysco Corporation Form S-8 File No. 333-58276 Sysco Corporation Form S-8 File No. 333-122947 Sysco Corporation Form S-8 File No. 333-129671 /s/ Ernst & Young LLP
Exhibit 31.1
CERTIFICATION
I, William J. DeLaney, certify that:
Date: August 25, 2009
1. I have reviewed this annual report on Form 10-K of Sysco Corporation;
2. Based on my knowledge, this report does not contain any untrue statement of a material fact or omit to state a material fact necessary to make the statements made, in light of the circumstances under which such statements were made, not misleading with respect to the period covered by this report;
3. Based on my knowledge, the financial statements, and other financial information included in this report, fairly present in all material respects the financial condition, results of operations and cash flows of the registrant as of, and for, the periods presented in this report;
4. I am responsible for establishing and maintaining disclosure controls and procedures (as defined in Exchange Act Rules 13a-15(e) and 15d-15(e)) and internal control over financial reporting (as defined in Exchange Act Rules 13a-15(f) and 15d-15(f)) for the registrant and have:
(a) Designed such disclosure controls and procedures, or caused such disclosure controls and procedures to be designed under my supervision, to ensure that material information relating to the registrant, including its consolidated subsidiaries, is made known to me by others within those entities, particularly during the period in which this report is being prepared;
(b) Designed such internal control over financial reporting, or caused such internal control over financial reporting to be designed under my supervision, to provide reasonable assurance regarding the reliability of financial reporting and the preparation of financial statements for external purposes in accordance with generally accepted accounting principles;
(c) Evaluated the effectiveness of the registrant’s disclosure controls and procedures and presented in this report my conclusions about the effectiveness of the disclosure controls and procedures, as of the end of the period covered by this report based on such evaluation; and
(d) Disclosed in this report any change in the registrant’s internal control over financial reporting that occurred during the registrant’s most recent fiscal quarter (the registrant’s fourth fiscal quarter in the case of an annual report) that has materially affected, or is reasonably likely to materially affect, the registrant’s internal control over financial reporting; and
5. I have disclosed, based on my most recent evaluation of internal control over financial reporting, to the registrant’s auditors and the audit committee of the registrant’s board of directors (or persons performing the equivalent functions):
(a) All significant deficiencies and material weaknesses in the design or operation of internal control over financial reporting which are reasonably likely to adversely affect the registrant’s ability to record, process, summarize and report financial information; and
(b) Any fraud, whether or not material, that involves management or other employees who have a significant role in the registrant’s internal control over financial reporting.
/s/ WILLIAM J. DELANEY William J. DeLaney
Chief Executive Officer and Chief Financial Officer
Exhibit 32.1
CERTIFICATION PURSUANT TO SECTION 906 OF THE SARBANES-OXLEY ACT OF 2002
I, William J. DeLaney, Chief Executive Officer and Chief Financial Officer, of Sysco Corporation (the “company”), certify, pursuant to 18 U.S.C. Section 1350, as adopted pursuant to Section 906 of the Sarbanes-Oxley Act of 2002, that, to the best of my knowledge:
Date: August 25, 2009
1. The company’s Annual Report on Form 10-K for the fiscal year ended June 27, 2009 (“Annual Report” ) fully complies with the requirements of Section 13(a) of the Securities Exchange Act of 1934; and
2. All of the information contained in the Annual Report fairly presents, in all material respects, the financial condition and results of operations of the company.
/s/ WILLIAM J. DELANEY William J. DeLaney
Chief Executive Officer and Chief Financial Officer