Embed Size (px)
Citation preview

UNITED STATES
SECURITIES AND EXCHANGE COMMISSIONWashington, D.C. 20549
FORM 10-K(Mark One)
☒ ANNUAL REPORT PURSUANT TO SECTION 13 OR 15(d)OF THE SECURITIES EXCHANGE ACT OF 1934
For the fiscal year ended August 31, 2019OR
☐ TRANSITION REPORT PURSUANT TO SECTION 13 OR 15(d)OF THE SECURITIES EXCHANGE ACT OF 1934
For the Transition period from to to Commission File No. 1-11288
ACTUANT CORPORATION(Exact name of Registrant as specified in its charter)
Wisconsin 39-0168610(State or other jurisdiction of
incorporation or organization) (I.R.S. Employer
Identification No.)
N86 W12500 WESTBROOK CROSSINGMENOMONEE FALLS, WISCONSIN 53051
Mailing address: P.O. Box 3241, Milwaukee, Wisconsin 53201(Address of principal executive offices)
(262) 293-1500(Registrant’s telephone number, including area code)Securities registered pursuant to Section 12(b) of the Act:
Title of each class Ticker Symbol(s) Name of each exchange on which registered Class A common stock, $0.20 par value per share EPAC NYSE
Securities registered pursuant to Section 12(g) of the Act: NoneIndicate by checkmark if the registrant is a well-known seasoned issuer, as defined in Rule 405 of the Securities Act. Yes ☒ No ☐Indicate by check mark if the registrant is not required to file reports pursuant to Section 13 or Section 15d of the Act. Yes ☐ No ☒Indicate by check mark whether the Registrant (1) has filed all reports required to be filed by Section 13 or 15(d) of the Securities Exchange Act of 1934 during the
preceding 12 months, and (2) has been subject to such filing requirements for the past 90 days. Yes ☒ No ☐Indicate by check mark whether the registrant has submitted electronically every Interactive Data File required to be submitted pursuant to Rule 405 of Regulation S-T
(§232.405 of this chapter) during the preceding 12 months (or for such shorter period that the registrant was required to submit and post such files). Yes ☒ No ☐Indicate by check mark whether the registrant is a large accelerated filer, an accelerated filer, a non-accelerated filer, a smaller reporting company, or emerging growth
company. See definition of “accelerated filer,” “large accelerated filer,” “smaller reporting company” and "emerging growth company" in Rule 12b-2 of the Exchange Act.
Large accelerated filer ☒ Accelerated filer ☐Non-accelerated filer ☐ Smaller reporting company ☐Emerging growth company ☐
If an emerging growth company, indicate by check mark if the registrant has elected not to use the extended transition period for complying with any new or revisedfinancial accounting standards provided pursuant to Section 13(a) of the Exchange Act. Yes ☐ No ☐
Indicate by check mark whether the registrant is a shell company (as defined in Rule 12b-2 of the Exchange Act.): Yes ☐ No ☒
As of February 28, 2019, the end of the Registrant's second fiscal quarter, the aggregate market value of the shares of Common Stock (based upon the closing price on theNew York Stock Exchange on February 28, 2019) held by non-affiliates of the Registrant was approximately $1.50 billion.
There were 60,536,922 shares of the Registrant’s Class A Common Stock outstanding as of September 30, 2019.
DOCUMENTS INCORPORATED BY REFERENCEPortions of the definitive Proxy Statement for the Annual Meeting of Shareholders to be held on January 28, 2020 are incorporated by reference into Part III
hereof.

TABLE OF CONTENTS
PART I
Item 1. Business 1Item 1A. Risk Factors 5Item 1B. Unresolved Staff Comments 10Item 2. Properties 10Item 3. Legal Proceedings 11Item 4. Mine Safety Disclosures 11
PART II
Item 5. Market for Registrant’s Common Equity, Related Stockholder Matters, and Issuer Purchases of Equity Securities 12Item 6. Selected Financial Data 14Item 7. Management’s Discussion and Analysis of Financial Condition and Results of Operations 15Item 7A. Quantitative and Qualitative Disclosures About Market Risk 24Item 8. Financial Statements and Supplementary Data 26Item 9. Changes in and Disagreements with Accountants on Accounting and Financial Disclosure 69Item 9A. Controls and Procedures 69Item 9B. Other Information 69
PART III
Item 10. Directors; Executive Officers and Corporate Governance 70Item 11. Executive Compensation 70Item 12. Security Ownership of Certain Beneficial Owners and Management and Related Stockholder Matters 70Item 13. Certain Relationships and Related Transactions, and Director Independence 70Item 14. Principal Accounting Fees and Services 70
PART IV
Item 15. Exhibits and Financial Statement Schedules 71Item 16. Form 10-K Summary 71
Actuant Corporation, doing business as "Enerpac Tool Group", provides free-of-charge access to our annual report on Form 10-K, quarterly reports on Form 10-Q, currentreports on Form 8-K, and all amendments thereto, through our website, www.enerpactoolgroup.com, as soon as reasonably practical after such reports are electronically filedwith the Securities and Exchange Commission.

FORWARD LOOKING STATEMENTS AND CAUTIONARY FACTORS
This annual report on Form 10-K contains certain statements that constitute forward-looking statements within the meaning of the Private Securities LitigationReform Act of 1995 that involve risks and uncertainties. The terms “may,” “should,” “could,” “anticipate,” “believe,” “estimate,” “expect,” “objective,” “plan,”“project” and similar expressions are intended to identify forward-looking statements. Such forward-looking statements are subject to inherent risks anduncertainties that may cause actual results or events to differ materially from those contemplated by such forward-looking statements. In addition to the assumptionsand other factors referred to specifically in connection with such statements, factors that may cause actual results or events to differ materially from thosecontemplated by such forward-looking statements include, without limitation, general economic uncertainty, market conditions in the industrial, oil & gas, energy,power generation, infrastructure, commercial construction, truck and automotive industries, market acceptance of existing and new products, successful integrationof acquisitions, divestitures and related restructuring, operating margin risk due to competitive pricing and operating efficiencies, supply chain risk, material, labor,or overhead cost increases, foreign currency risk, interest rate risk, commodity risk, the impact of geopolitical activity, tariffs, litigation matters, impairment ofgoodwill or other intangible assets, the Company’s ability to access capital markets and other factors that may be referred to or noted in the Company’s reports filedwith the Securities and Exchange Commission from time to time, including those described under "Item 1A. Risk Factors" of this annual report on Form 10-K. Wedisclaim any obligation to publicly update or revise any forward-looking statements as a result of new information, future events or any other reason.
When used herein, the terms “Actuant,” “we,” “us,” “our,” and the “Company” refer to Actuant Corporation and its subsidiaries.
PART I Item 1. Business
GeneralActuant Corporation, doing business as Enerpac Tool Group, is a premier industrial tools and services company serving a broad and diverse set of customers in more than
90 countries. The Company is a global leader in the engineering and manufacturing of high pressure hydraulic tools, controlled force products and solutions for precisepositioning of heavy loads that help customers safely and reliably tackle some of the most challenging jobs around the world. The Company was founded in 1910 and isheadquartered in Menomonee Falls, Wisconsin.
During the fourth quarter of fiscal 2019, the Company’s financial reporting segments were modified to reflect changes in our reporting structure as a result of entering intoa Securities Purchase Agreement ("SPA") to sell the remaining businesses within our legacy Engineered Components & Systems segment exclusive of Cortland U.S. TheCompany now has three operating segments; Industrial Tools & Services ("IT&S"), Other, and Engineered Components and Systems ("EC&S"). The IT&S segment remainsunchanged from our previous segment structure and represents the only reportable segment. All prior period disclosures have been adjusted to reflect the one reportablesegment. The IT&S reportable segment is primarily engaged in the design, manufacture and distribution of branded hydraulic and mechanical tools as well as providing servicesand tool rentals to the industrial, maintenance, infrastructure, oil & gas, energy and other markets. The Other operating segment is comprised of Cortland U.S., along with theViking business which was divested on the first day of the second quarter of fiscal 2018. These two operating segments represent continuing operations within our consolidatedfinancial statements. The EC&S segment, after the change in reporting structure, represents the businesses currently subject to the SPA with an anticipated closure date in thefourth calendar quarter of 2019, as well as the Cortland Fibron and Precision Hayes International ("PHI") businesses which were divested in fiscal 2019. As the pendingdivestiture of the remaining businesses within the EC&S segment in combination with the divestiture of Cortland Fibron and PHI represent a strategic shift in our operations, theEC&S segment consists entirely of businesses that are considered discontinued operations. All prior period financial statements have been adjusted to reflect this change.Financial information related to the Company's reportable segment is included in Note 15, "Business Segment, Geographic and Customer Information" in the notes to theconsolidated financial statements.
Our Business ModelOur long-term goal is to grow diluted earnings per share faster than our peers. We intend to leverage our strong brand, our market positions, and our dealer and
distribution networks to generate organic core sales growth that exceeds end-market growth rates. Organic growth is accomplished through a combination of share capture,product innovation and market expansion into emerging industries and geographic regions. In addition to organic growth, we also focus on profit margin expansion by utilizingcontinuous improvement techniques to drive productivity and lower costs and by enacting routine pricing initiatives to offset commodity and tariff increases. Finally, cash flowgeneration is critical to achieving our financial
1

and long-term strategic objectives. Strong cash flow generation is achieved by maximizing returns on assets and minimizing primary working capital needs. The cash flow thatresults from efficient asset management, improved profitability and loyal customers is used to fund internal growth opportunities, strategic acquisitions and opportunisticcommon stock repurchases.
Description of Business SegmentsIndustrial Tools & Services Reportable SegmentThe IT&S segment is a global supplier of both products and services to a broad array of end markets, including industrial, energy, mining and production automation
markets. Our primary products include branded tools, highly engineered heavy lifting technology solutions and hydraulic torque wrenches. On the services side of the segment,we provide energy maintenance and manpower services to meet customer-specific needs and rental capabilities for certain of our products. Our branded tools and services areprimarily marketed primarily through the Enerpac, Hydratight, Larzep and Simplex brand names.
Our IT&S segment includes high-force hydraulic and mechanical tools (cylinders, pumps, valves and specialty tools) which are designed to allow users to apply controlledforce and motion to increase productivity, reduce labor costs and make work safer and easier to perform. Our products also include bolt tensioners and other miscellaneousproducts. These tools operate at very high pressures of approximately 5,000 to 12,000 pounds per square inch. With our products used in a wide variety of end markets, they areoften deployed in harsh operating conditions, such as oil & gas production, machining and infrastructure maintenance and repair, where safety is a key differentiator. As aresult, we hold ourselves to a world class safety standard to ensure both our employees and our customers are safe.
In addition to providing a comprehensive line of tools and other products, the IT&S segment sustains a services and rental network providing highly trained technicians toperform bolting, machining and joint integrity work for our customers.
The segment delivers products and services primarily through our world-class, global network of distributors, as well as, direct sales to OEM's and select end users.Examples of industrial distributors include W.W. Grainger, MSC and Blackwoods.
Other Operating SegmentIn light of the disposition of the Viking business during fiscal 2018, the remaining operations of the Other operating segment are those of our Cortland U.S. business,
which primarily designs and manufactures high performance synthetic ropes and biomedical assemblies. The Other operating segment does not meet the quantitative orqualitative thresholds to be considered a reportable segment. Therefore, the results are not disclosed separately as would be required if considered a reportable segment and asthe business is not closely related to the IT&S segment, results are not aggregated to be included in the results of the IT&S reportable segment. Certain information related tothe Other operating segment will be disclosed within Note 15, "Business Segment, Geographic, and Customer Information" in order to comply with US GAAP requirements toreconcile certain required disclosures to the Consolidated Financial Statements.
Acquisitions and DivestituresFor a summary of recent acquisition and divestiture transactions impacting continuing operations, see footnote 2 to the table included in Item 6 Financial Data, as well as
Note 4, "Acquisitions" and Note 5, "Divestiture Activities" in the notes to the consolidated financial statements.
International BusinessThe products and services for our continuing operations are generally available globally, with our principal markets outside the United States being Europe and Asia. In
fiscal 2019, we derived 38% of our net sales from continuing operations from the United States, 20% from Europe, 13% from the Middle East, 12% from Asia and 17% fromother geographic areas. We have operations around the world that allows us to draw on the skills of a global workforce, provides flexibility to our operations, allows us to driveeconomies of scale, provides revenue streams that may help offset economic trends that are specific to individual countries and offers us an opportunity to access new markets.Although international operations are subject to certain risks, we continue to believe that a global presence is key to maintaining strong relationships with many of our globalcustomers. Financial information related to the Company's geographic footprint of our continuing operations is included in Note 15, "Business Segment, Geographic andCustomer Information" in the notes to the consolidated financial statements.
2

Product Development and EngineeringWe conduct research and development activities to develop new products and to enhance the functionality, effectiveness, ease of use and reliability of our existing
products. We believe that our engineering and research and development efforts have been and continue to be key drivers of our success in the marketplace. Our advanceddesign and engineering capabilities contribute to the development of innovative and highly engineered products, maintain our technological leadership and enhance our abilityto provide customers with unique and customized solutions and products. We anticipate that we will continue to make significant expenditures for research and development aswe seek to provide new innovative tools and services to grow our market share. Research and development ("R&D") costs are expensed as incurred. For continuing operations,R&D costs were $9.3 million in fiscal 2019, an increase of 7% from $8.7 million in fiscal 2018 and an increase of 5% from $8.9 million in fiscal 2017. We target 10% ofconsolidated sales annually to be from new product development as a result of our research and development activities.
We also incur costs in connection with fulfilling custom orders and developing unique solutions for distinct customer needs, which are not included in these expensetotals.
The Company holds numerous patents and trademarks; however, no individual patent or trademark is believed to be of such importance that its termination would have amaterial adverse effect on our business.
CompetitionThe markets for our products are highly competitive. We provide a diverse and broad range of industrial products and services to numerous global end markets, many of
which are highly fragmented. Although we face larger competitors in several served markets, some of our competition is comprised of smaller companies which may lack theglobal footprint or financial resources to serve global customers. We compete for business principally on the basis of customer service, product quality and availability,engineering, along with research and development expertise. In addition, we believe that our cost structure, strategic global sourcing capabilities and global distribution supportour competitive position.
Manufacturing and OperationsWhile we do have extensive manufacturing capabilities including machining and fabrication, our manufacturing consists primarily of light assembly of components we
source from a network of global suppliers. We have implemented single piece flow processes in most of our plants, which reduces inventory levels, lowers “re-work” costs andshortens lead times to customers. Components are built to our highly engineered specifications by a variety of suppliers, including those in low cost countries such as China andIndia. We have built strong relationships with our key suppliers and, while we single source certain of our components, in most cases there are several qualified alternativesources.
Raw Material Costs and InflationWe source materials and components from a network of global suppliers. These items are typically available from multiple suppliers. Raw materials that go into the
components we source, such as steel, aluminum and plastic resin, are subject to price fluctuations and tariffs, which could have an impact on our results. While no meaningfulmeasures of inflation specific to our products are available because we have significant operations in countries with diverse rates of inflation and currency rate movements, wehave more than offset the impact of inflation in recent years with manufacturing efficiencies, cost reductions and pricing actions. In addition, several of our products havecomponents from China subject to tariffs, however, to date we have been able to offset the majority of additional costs from tariffs through price increases to portions of ourcustomer base. Furthermore, some of our components not sourced in China but for products manufactured in China are subject to Chinese tariffs. We have activities underwayto mitigate these additional costs through identification of local Chinese suppliers.
Order Backlogs and SeasonalityOur operating segments that make up continuing operations have a relatively short order-to-ship cycle. We had order backlogs from continuing operations of $42 million
and $51 million at August 31, 2019 and 2018, respectively. Substantially all orders are expected to be filled within twelve months. While we typically experience a strongersecond half to our fiscal year, our consolidated sales are not subject to significant seasonal fluctuations.
3

Percentages of Sales from Continuing Operations by Fiscal Quarter
2019 2018 Quarter 1 (September - November) 24% 24% Quarter 2 (December - February) 24% 23% Quarter 3 (March - May) 27% 27% Quarter 4 (June - August) 25% 26% 100% 100%
EmployeesAt August 31, 2019, we had approximately 4,700 employees, of which approximately 40% are expected to transition out of the Company as part of the EC&S divestiture.
Our employees generally are not subject to collective bargaining agreements, with the exception of approximately 300 U.S. production employees and certain internationalemployees covered by government mandated collective labor agreements. We believe we have a good working relationship with our employees globally.
Environmental MattersOur operations, like those of most industrial businesses, are subject to federal, state, local and foreign laws and regulations relating to the protection of the environment,
including those regulating discharges of hazardous materials into the air and water, the storage and disposal of such hazardous materials and the clean-up of soil andgroundwater contamination. We believe that we are in material compliance with applicable environmental regulations. Compliance with these laws requires expenditures on anongoing basis. However, environmental expenditures over the last three years have not been material. Soil and groundwater contamination has been identified at certainfacilities that we operate or formerly owned or operated. We are also a party to certain state and local environmental matters, have provided environmental indemnifications forcertain divested businesses and retain responsibility for certain potential environmental liabilities.
Executive Officers of the RegistrantThe names, ages and positions of all of the executive officers of the Company as of October 15, 2019 are listed below.
Name Age PositionRandal W. Baker 56 President and Chief Executive OfficerRick T. Dillon 48 Executive Vice President and Chief Financial OfficerFabrizio R. Rasetti 53 Executive Vice President—General Counsel, Secretary and Global Human ResourcesRoger A. Roundhouse 54 Executive Vice President—Engineered Components & Systems SegmentJ. Jeffrey Schmaling 60 Executive Vice President—Industrial Tools & Services SegmentBarbara G. Bolens 58 Executive Vice President—Chief Strategy Officer
Randal W. Baker, President, Chief Executive Officer. Mr. Baker was appointed President and Chief Executive Officer of the Company in March 2016. Prior to joining theCompany, Mr. Baker held multiple roles during a six year tenure at Joy Global, including most recently as Chief Operating Officer. Prior to Joy Global, Mr. Baker was anexecutive with Case New Holland Inc., holding a variety of roles including President and CEO of its agricultural equipment business. Mr. Baker also held diverse leadershiproles in marketing, sales, product development and engineering at Komatsu America Corporation, Ingersoll-Rand and Sandvik Corporation.
Rick T. Dillon, Executive Vice President and Chief Financial Officer, joined the Company in December 2016. Prior to joining the Company, Mr. Dillon served asExecutive Vice President and Chief Financial Officer of Century Aluminum Co. Prior to that, Mr. Dillon served as Vice President-Finance Global Surface Mining Group andVice President-Controller and Chief Accounting Officer of Joy Global Inc. from 2009 to 2014. Prior to Joy Global, Mr. Dillon served as Vice President-Business Planning andAnalysis and Vice President-Controller and Chief Accounting Officer at Newell Brands, and Vice President-Controller and Chief Accounting Officer at Briggs & StrattonCorporation.
Fabrizio R. Rasetti, Executive Vice President—General Counsel, Secretary and Global Human Resources, joined Actuant in May 2018 from Boart Longyear where heheld the position of Senior Vice President, General Counsel and Secretary since 2006. For the ten years prior he worked at SPX Corporation in roles of increasing responsibilityincluding Segment General Counsel & Vice President, Business Development, Flow Segment. Earlier in his career he worked in private law practice.
Roger A. Roundhouse, Executive Vice President—Engineered Components & Systems segment. Mr. Roundhouse joined the Company in 2014, from General Cable,where he most recently held the position of Senior Vice President and General Manager Utility Products. Mr. Roundhouse brings extensive automotive, industrial and OEMknowledge, as well as over 20
4

years of experience with global operations and mergers & acquisitions. Upon completion of the EC&S divestiture, Mr. Roundhouse will be transitioning out of the Company.J. Jeffrey Schmaling, Executive Vice President—Industrial Tools & Services segment, joined Actuant in his current role in February 2018. Prior to Actuant he held the
position of President, North America for Komatsu Mining Corporation (formerly Joy Global Inc.) since 2010. Prior to that, he served as Senior Director Dealer Developmentand Account Management at Case International Harvester, a Division of Fiat S.p.A. Earlier in his 30 plus year career he held various sales, marketing and product developmentroles.
Barbara G. Bolens, Executive Vice President—Chief Strategy Officer, joined the Company in August 2018 as Vice President of Investor Relations and CorporateStrategy and was appointed Executive Vice President—Chief Strategy Officer in October 2019. Prior to joining the Company, Ms. Bolens spent over six years at KomatsuMining Corporation (formerly Joy Global Inc.) as its VP and Treasurer. Prior to Komatsu, she held financial leadership positions of progressive responsibility at several othermultinational corporations as well as early career leadership roles in sales and marketing.
Item 1A. Risk Factors
The risks and uncertainties described below are those that we have identified as material, but are not the only risks and uncertainties facing the Company. If any of theevents contemplated by the following risks actually occurs, our business, financial condition, or results of operations could be materially adversely affected. Additional risksand uncertainties not currently known to us or that we currently believe are immaterial also may adversely impact our business.
Deterioration of, or instability in, the domestic and international economy and challenging end market conditions could impact our ability to grow the business andadversely impact our financial condition, results of operations and cash flows.
Our businesses and operating results have been, and will continue to be, affected by domestic and international economic conditions. The level of demand for our productsdepends, in part, on general economic conditions in our served end markets. A substantial portion of our revenues are derived from customers in cyclical industries (industrialand oil & gas) that typically are adversely affected by downward economic cycles. As global economic uncertainty continues, our customers may experience deterioration oftheir businesses, which may delay or lengthen sales cycles. Beginning in fiscal 2016, we experienced challenging and inconsistent demand in several of our served markets,including oil & gas and infrastructure markets. As a result of these and other factors, we implemented various restructuring initiatives aimed at reducing our cost structure andimproving operational performance. While we have seen recovery in those end markets, we are still executing on restructuring initiatives previously announced. Further, wemay implement additional restructuring initiatives in response to further market challenges to achieve additional efficiencies. Such initiatives could result in restructuring costs,including facility consolidations, workforce reductions and structural realignment. Although we expect that the related cost savings and realization of efficiencies will offset therestructuring related costs over time, we may not achieve the desired net benefits of these efforts (see Note 3, "Restructuring Charges" and "Business Update" within Item 7 forfurther discussion of our restructuring activities and future anticipated cost savings).
If we fail to develop new products, or customers do not accept our new products, our business could be adversely affected.Our ability to develop innovative new products can affect our competitive position and often requires the investment of significant resources. Difficulties or delays in
research, development, production or commercialization of new products, or failure to gain market acceptance of new products and technologies, may reduce future sales andadversely affect our competitive position. Operational excellence processes including effective product sourcing, lean manufacturing, acquisition integration and leadershipdevelopment, along with other continuous improvement activities, are utilized to improve our businesses. There can be no assurance that we will have sufficient resources tomake such investments, that we will be able to make the technological advances necessary to maintain competitive advantages or that we can recover major research anddevelopment expenses. If we fail to make innovations, launch products with quality problems, experience development cost overruns, or the market does not accept our newproducts, then our financial condition, results of operations, cash flows and liquidity could be adversely affected.
Divestitures and discontinued operations could negatively impact our business, and retained liabilities from businesses that we sell could adversely affect ourfinancial results.
In connection with the execution of our strategy to become a pure-play industrial tools and services company, we have or are in the process of executing severaldivestitures, including the anticipated divestiture of the remaining businesses within the EC&S segment by the end of calendar 2019. These divestitures pose risks andchallenges that could negatively impact our business, including required separation or carve-out activities and costs, disputes with buyers or potential impairment charges.
5

After reaching an agreement with a buyer for the disposition of a business, we are also subject to satisfaction of pre-closing conditions, as well as necessary regulatory andgovernmental approvals on acceptable terms, which may prevent us from completing a transaction. Dispositions may also involve continued financial involvement, as we maybe required to retain responsibility for, or agree to indemnify buyers against contingent liabilities related to businesses sold, such as lawsuits, tax liabilities, lease payments,product liability claims or environmental matters. Under these types of arrangements, performance by the divested businesses or other conditions outside of our control couldaffect future financial results. Further, with respect to the EC&S divestiture, we are required to perform certain transition services which, based on the uncertainty of the timeperiod for which we will perform them, may inhibit our ability to timely execute the necessary actions to reduce our corporate cost structure to a level appropriate to the size ofour remaining operations.
If we do not realize the expected benefits or synergies of any divestiture transaction, our consolidated financial position, results of operations and cash flows could benegatively impacted. Any divestiture may result in a dilutive impact to our future earnings if we are unable to offset the dilutive impact from the loss of revenue and profitsassociated with the divestiture, as well as significant write-offs, including those related to goodwill and other intangible assets, which could have a material adverse effect on ourresults of operations and financial condition.
Our growth strategy includes strategic acquisitions. We may not be able to consummate future acquisitions or successfully integrate them.A significant portion of our growth has come from strategic acquisitions of businesses. We plan to continue making acquisitions to enhance our global market position
and broaden our industrial tools product offerings. Our ability to successfully execute acquisitions will be impacted by a number of factors, including the availability offinancing on terms acceptable to us, our ability to identify acquisition candidates that meet our valuation parameters and increased competition for acquisitions. The process ofintegrating acquired businesses into our existing operations also may result in unforeseen operating difficulties and may require additional financial resources and attention frommanagement that would otherwise be available for the ongoing development or expansion of our existing operations. Although we expect to successfully integrate any acquiredbusinesses, we may not achieve the desired net benefit in the time-frame planned. Failure to effectively execute our acquisition strategy or successfully integrate the acquiredbusinesses could have an adverse effect on our financial condition, results of operations, cash flows and liquidity.
We may not be able to realize planned benefits from acquired companies.We may not be able to realize planned benefits from acquired companies. Achieving those benefits depends on the timely, efficient and successful execution of a number
of post-acquisition events, including integrating the acquired business into the Company. Factors that could affect our ability to achieve these benefits include:
• difficulties in integrating and managing personnel, financial reporting and other systems used by the acquiredbusinesses;
• the failure of acquired businesses to perform in accordance with ourexpectations;
• failure to achieve anticipated synergies between our business units and the business units of acquiredbusinesses;
• the loss of customers of acquiredbusinesses;
• the loss of key managers of acquired businesses;or
• other material adverse events in the acquiredbusinesses.
If acquired businesses do not operate as we anticipate, it could materially impact our business, financial condition and results of operations. In addition, acquiredbusinesses may operate in niche markets in which we have little or no experience. In such instances, we will be highly dependent on existing managers and employees tomanage those businesses, and the loss of any key managers or employees of the acquired business could have a material adverse effect on our financial condition, results ofoperations, cash flows and liquidity.
The indemnification provisions of acquisition agreements may result in unexpected liabilities.Certain acquisition agreements from past and current acquisitions require the former owners to indemnify us against certain liabilities related to the operation of each of
their companies. In most of these agreements, the liability of the former owners is limited to specific warranties given in the agreement, as well as, in amount and duration andcertain former owners may not be able to meet their indemnification responsibilities. These indemnification provisions may not fully protect us, and as a result we may faceunexpected liabilities that adversely affect our profitability and financial position.
6
Our goodwill and other intangible assets represent a substantial amount of our total assets.Our total assets reflect substantial intangible assets, primarily goodwill. At August 31, 2019, goodwill and other intangible assets totaled $313 million, or 28% of our total
assets. The goodwill results from acquisitions, representing the excess of the purchase price over the fair value of the net tangible and other identifiable intangible assets we haveacquired. We assess annually whether there has been impairment in the value of our goodwill or indefinite-lived intangible assets. If future operating performance at one ormore of our reporting units were to fall below current levels, we could be required to recognize a non-cash charge to operating earnings to impair the related goodwill or otherintangible assets. With respect to continuing operations, we recognized $22 million in non-cash impairment charges in fiscal 2019 related to the goodwill and intangible assetsof several of our businesses (see Note 6, "Goodwill, Intangible Assets and Long-Lived Assets" and "Critical Accounting Policies" for further discussion on goodwill, intangibleasset and long-lived asset impairments). Any future goodwill or intangible asset impairments could negatively affect our financial condition and results of operations.Uncertainty over global tariffs, or the financial impact of tariffs, may negatively affect our results.
Changes in U.S. domestic and global tariff frameworks have increased our costs of producing goods and resulted in additional risks to our supply chain. More tariffchanges also are possible. We have developed and implemented strategies thus far to mitigate previously implemented and, in some cases, proposed tariff increases, but there isno assurance we will be able to continue to mitigate prolonged tariffs. Further, uncertainties about future tariff changes could result in mitigation actions that prove to bedetrimental to our business.
Our indebtedness could harm our operating flexibility and competitive position.We have incurred, and may in the future incur, significant indebtedness in connection with acquisitions or other strategic growth initiatives. We have, and will continue to
have, a substantial amount of debt which requires interest and principal payments. Our level of debt and the limitations imposed on us by our debt agreements could adverselyaffect our operating flexibility and put us at a competitive disadvantage.
Our ability to make scheduled principal and interest payments, refinance our indebtedness and satisfy our other debt and lease obligations will depend upon our futureoperating performance and credit market conditions, which could be adversely affected by factors beyond our control. In addition, there can be no assurance that futureborrowings or equity financings will be available to us on favorable terms, or at all, for the payment or refinancing of our indebtedness. If we are unable to service ourindebtedness, our business, financial condition and results of operations will be adversely affected.
The financial and other covenants in our debt agreements may adversely affect us.Our senior credit agreement and our other debt agreement contain financial and other restrictive covenants. These covenants could adversely affect us by limiting our
financial and operating flexibility as well as our ability to plan for and react to market conditions and to meet our capital needs. Our failure to comply with these covenants couldresult in events of default which, if not cured or waived, could result in us being required to repay indebtedness before its due date and we may not have the financial resourcesor be able to arrange alternative financing to do so. Borrowings under our senior credit facility are secured by most domestic personal property assets and are guaranteed bymost of our domestic subsidiaries and by a pledge of the stock of most of our domestic and certain foreign subsidiaries. If borrowings under our senior credit facility weredeclared or became due and payable immediately as the result of an event of default and we were unable to repay or refinance those borrowings, the lenders could foreclose onthe pledged assets and stock. Any event that requires us to repay any of our debt before it is due could require us to borrow additional amounts at unfavorable borrowing terms,cause a significant reduction in our liquidity and impair our ability to pay amounts due on our indebtedness. Moreover, if we are required to repay any of our debt before itbecomes due, we may be unable to borrow additional amounts or otherwise obtain the cash necessary to repay that debt, when due, which could materially adversely affect ourbusiness, financial condition and liquidity.
Our businesses operate in highly competitive markets, so we may be forced to cut prices or incur additional costs.Our businesses generally face substantial competition, domestically and internationally, in each of their respective markets. We may lose market share in certain
businesses or be forced to reduce prices or incur increased costs to maintain existing business. We compete globally on the basis of product design, quality, availability,performance and customer service. Present or future competitors in our markets may have greater financial, technical or other resources which could put us at a competitivedisadvantage. In addition, some of our competitors may be willing to reduce prices and accept lower margins in order to compete with us.
7

Our international operations pose currency and other risks.We continue to focus on penetrating global markets as part of our overall growth strategy and expect sales from and into foreign markets to continue to represent a
significant portion of our revenue. Approximately 60% of our net sales from continuing operations in fiscal 2019 were outside the United States. In addition, many of ourmanufacturing operations and suppliers are located outside the United States. Our international operations present special risks, primarily from currency exchange ratefluctuations, exposure to local economic and political conditions, export and import restrictions and controls on repatriation of cash. Changes in foreign currency exchange rateswill continue to add volatility as over one-third of our sales from continuing operations are generated outside of the United States in currencies other than the U.S. dollar. Inaddition, United States tax reform has significantly changed how foreign operations are taxed in the United States. Therefore we continue to review how to transform ourorganizational structure in response. We earn a substantial portion of our income from international operations and therefore changes to where income is generated may have amaterial adverse effect on our liquidity and results of operations. To the extent that we expand our international presence, these risks may increase.
Geopolitical unrest and terrorist activities may cause the economic conditions in the U.S. or abroad to deteriorate, which could harm our business.Terrorist attacks against targets in the U.S. or abroad, rumors or threats of war, other geopolitical activity or trade disruptions may cause general economic conditions in
the U.S. or abroad to deteriorate. The occurrence of any of these events could result in a prolonged economic slowdown or recession in the U.S. or in other areas and could havea significant impact on our business, financial condition or results of operations.
Our significant reliance on third-party suppliers for components for the manufacture, assembly and sale of our products involves risks.We rely on suppliers to secure component products and finished goods required for the manufacture and assembly of our products. A disruption in deliveries to or from
key suppliers, or decreased availability of components or commodities, could have an adverse effect on our ability to meet our commitments to customers or increase ouroperating costs. Further, poor supplier quality or an insecure supply chain could adversely affect the reliability, performance and reputation of our products. Additionally, ifdemand for our products is less than we expect, we may experience excess inventories and be forced to incur additional charges and our profitability may suffer. Our business,competitive position, results of operations or financial condition could be negatively impacted if supply is insufficient for our operations, if we experience excess inventories orif we are unable to adjust our production schedules or our purchases from suppliers to reflect changes in customer demand and market fluctuations on a timely basis.
A material disruption at a significant manufacturing facility could adversely affect our ability to generate sales and result in increased costs that we cannot recover.Our financial performance could be adversely affected as a result of our inability to meet customer demand for our products in the event of a material disruption at one of
our significant manufacturing facilities. Equipment failures, natural disasters, power outages, fires, explosions, terrorism, adverse weather conditions, labor disputes or otherinfluences could create a material disruption. Interruptions to production could increase our cost of sales, harm our reputation and adversely affect our ability to attract or retainour customers. Our business continuity plans may not be sufficient to address disruptions attributable to such risks. Any interruption in production capability could require us tomake substantial capital expenditures to remedy the situation, which could adversely affect our financial condition and results of operations.
Large or rapid increases in the costs of commodities and raw materials, including impact of tariffs, or substantial decreases in their availability could adversely affectour operations.
The primary raw materials that are used in our products include steel, plastic resin, brass, steel wire and rubber. Most of our suppliers are not currently parties to long-term contracts with us. Consequently, we are vulnerable to fluctuations in prices of such raw materials, including the impact of tariffs. Factors such as supply and demand,freight costs and transportation availability, inventory levels, the level of imports and general economic conditions may affect the prices of raw materials that we need. If weexperience a significant increase in raw material prices, or if we are unable to pass along increases in raw material prices to our customers, our results of operations could beadversely affected. In addition, an increasing portion of our products are sourced from low-cost regions. Changes in export regulations, taxes, tariffs and disruptions intransportation routes from regions that we source commodities and raw materials could adversely impact our results of operations.
8

We are subject to a wide variety of laws and regulations that may change in ways that are detrimental to our competitiveness or results.Our businesses are subject to regulation under a broad range of U.S. and foreign laws and regulations. There is no assurance that such laws, regulations and policies will
not be changed in ways that will require us to modify our business models and objectives or affect our results by restricting existing activities and products, subjecting them toescalating costs or prohibiting them outright. Particular legislative, regulatory or other areas that may have an effect on our structure, operations, markets, sales, liquidity, taxrate or the results of our businesses include export and import controls, anti-corruption law, competition law, data privacy regulations, currency controls and economic orpolitical sanctions.
Costs and liabilities arising from legal proceedings could be material and adversely impact our financial results.We are subject to a variety of legal and regulatory proceedings. We maintain insurance and have established reserves for these matters as appropriate and in accordance
with applicable accounting standards and practices. Insurance coverage, to the extent it is available, may not cover all losses arising from such contingencies. Also, estimatinglegal reserves or possible losses involves significant judgment and may not reflect the full range of uncertainties and unpredictable outcomes inherent in litigation andinvestigations and the actual losses arising from particular matters may exceed our current estimates and adversely affect our results of operations. We also expect thatadditional legal proceedings and other contingencies will arise from time to time, and we cannot predict the magnitude and outcome of such additional matters. Moreover, weoperate in jurisdictions where claims involving us may be adjudicated within legal systems that are less developed and less reliable than those of the U.S. or other moredeveloped markets, and this can create additional uncertainty about the outcome of proceedings before courts or other governmental bodies in such markets.
Legal compliance risks could result in significant costs to our business or cause us to restrict current activities or curtail growth plans.We and our representatives operate in industries, markets and jurisdictions in which we are exposed to inherent compliance risks and that are subject to significant scrutiny
by regulators, governmental authorities and other persons. We continue to strengthen our risk management and compliance programs to mitigate such risks and operate incompliance with applicable laws, but the global and diverse nature of our operations, the complex and high-risk nature of some of our markets and the current enforcementenvironment mean that legal and compliance risks will continue to exist throughout our operations. The consequences of compliance risks could include enforcement actions orprivate litigation resulting in significant defense and investigation costs, fines and penalties, and a broad range of remedial actions, including potential restrictions on ouroperations and other adverse changes to our business plans. See Note 16, "Commitments and Contingencies" in the notes to the consolidated financial statements for additionalinformation about compliance risks.
Health, Safety and Environmental laws and regulations may result in additional costs.We are subject to federal, state, local and foreign laws and regulations governing public and worker health and safety. Violations of these laws could cause us to incur
unanticipated liabilities that could harm our operating results. Pursuant to such laws, governmental authorities have required us to contribute to the cost of investigating orremediating certain matters at current or previously owned and operated sites. In addition, we provided environmental indemnities in connection with the sale of certainbusinesses and product lines. Liability as an owner or operator, or as an arranger for the treatment or disposal of hazardous substances, can be joint and several and can beimposed without regard to fault. There is a risk that costs relating to these matters could be greater than what we currently expect or exceed our insurance coverage, or thatadditional remediation and compliance obligations could arise which require us to make material expenditures. In particular, more stringent environmental laws, unanticipatedremediation requirements or the discovery of previously unknown conditions could materially harm our financial condition and operating results. We are also required tocomply with various environmental laws and maintain permits, some of which are subject to discretionary renewal from time to time, for many of our businesses, and ourbusiness operations could be restricted if we are unable to renew existing permits or to obtain any additional permits that we may require.
Our inability to attract, develop and retain qualified employees could have a material adverse impact on our operations.Our ability to deliver financial results and drive growth and pursue competitive advantages in our business substantially depends on our ability to retain key employees
and continually attract new talent to the business. If we experience losses of key employees, such as our Chief Executive Officer and Chief Financial Officer, or experiencesignificant delays or difficulty in replacing them, our operations, competitive positions and financial results may be adversely affected. Competition for highly qualifiedpersonnel is intense and our competitors and others can be expected to attempt to hire our skilled employees from time to time. Additionally, we need qualified managers andskilled employees with technical and manufacturing industry experience to operate our businesses successfully. From time to time there may be shortages of skilled labor whichmay make it more difficult and expensive for us to attract and retain qualified employees or lead to increased labor costs.
9

Cyber security vulnerabilities, threats and more sophisticated and targeted computer crime could pose a risk to our systems, networks, products, solutions, servicesand data.
Increased global cyber security vulnerabilities, threats, computer viruses and more sophisticated and targeted cyber-related attacks, as well as cyber security failuresresulting from human error and technological errors, pose a risk to our systems, products and data as well as potentially to our employees’, customers', partners', suppliers' andthird-party service providers' data. An attack could result in security breaches, theft, lost or corrupted data, misappropriation of sensitive, confidential or personal data orinformation, loss of trade secrets and commercially valuable information, production downtimes and operational disruptions. We attempt to mitigate these risks by employing anumber of measures, including employee training, monitoring and testing, and maintenance of protective systems and contingency plans, but we remain potentially vulnerableto additional known or unknown threats. There is no assurance the financial or operational impact from such threats will not be material.
Our intellectual property portfolio may not prevent competitors from developing products and services similar to or duplicative to ours, and the value of ourintellectual property may be negatively impacted by external dependencies.
Our patents, trademarks and other intellectual property may not prevent competitors from independently developing or selling products and services similar to orduplicative of ours or that our intellectual property portfolio will adequately deter misappropriation or improper use of our innovations and technology. In addition, further stepswe take to protect our intellectual property, including non-disclosure agreements, may not prevent the misappropriation of our business critical secrets and information. In suchcircumstances, our competitive position and the value of our brand may be negatively impacted.
Our competitors or other persons could assert that we have infringed their intellectual property rights.We may be the target of enforcement of patents or other intellectual property rights by third parties. Regardless of the merit of such claims, responding to infringement
claims can be expensive and time consuming. If we are found to infringe any third-party rights, we could be required to pay substantial damages or we could be enjoined fromoffering some of our current products and services.
Our customers and other business partners often require terms and conditions that expose us to significant risks and liabilities.We operate in end-markets and industries in which our customers and business partners seek to contractually shift significant risks associated with their operations or
projects to us. We continue to review and improve our commercial and contracting practices to manage the risks we are assuming, but we cannot assure that material liabilitieswill not arise from our contracts with our business partners. Also, as we impose more stringent contracting standards on our operations, we may experience market share lossesor the reduction in growth opportunities.
Item 1B. Unresolved Staff CommentsNone.
Item 2. Properties
As of August 31, 2019, we owned or leased the following facilities (square footage in thousands):
Number of Locations Square Footage
Distribution /Sales /Admin
Manufacturing Total Owned Leased TotalIndustrial Tools & Services 14 34 48 147 1,103 1,250Engineered Components & Systems* 11 4 15 335 854 1,189Corporate and Other 5 6 11 353 385 738
30 44 74 835 2,342 3,177* These owned locations are currently classified as "Assets from discontinued operations" on our Consolidated Balance Sheet and we anticipate divesting these facilities prior to the end ofcalendar 2019. The leases associated with these facilities will be assumed or bought out by the buyer of the EC&S segment.
We consider our facilities suitable and adequate for the purposes for which they are used and do not anticipate difficulty in renewing existing leases as they expire or infinding alternative facilities. Our largest facilities associated with our continuing operations are located in the United States, China, the United Kingdom, the Netherlands andSpain. We also maintain a presence in Australia, Azerbaijan, Brazil, Germany, India, Italy, Japan, Kazakhstan, Singapore, South Africa, South Korea and
10

the United Arab Emirates. See Note 10, “Leases” in the notes to the consolidated financial statements for information regarding our lease commitments.
Item 3. Legal Proceedings
We are a party to various legal proceedings that have arisen in the normal course of business. These legal proceedings typically include product liability, breaches ofcontract, employment, personal injury and other disputes.
We have recorded reserves for estimated losses based on the specific circumstances of each case. Such reserves are recorded when it is probable that a loss has beenincurred as of the balance sheet date and the amount of the loss can be reasonably estimated. In our opinion, the resolution of these contingencies is not likely to have a materialadverse effect on our financial condition, results of operations or cash flows. For further information refer to Note 16, “Commitments and Contingencies” in the notes to theconsolidated financial statements.
Item 4. Mine Safety DisclosuresNot applicable.
11

PART II
Item 5. Market for Registrant’s Common Equity, Related Shareholder Matters and Issuer Purchases of Equity
SecuritiesThe Company’s Class A common stock is traded on the New York Stock Exchange under the symbol EPAC. At September 30, 2019, there were 1,193 shareholders of
record of the Company's Class A common stock.
DividendsIn fiscal 2019, the Company declared a dividend of $0.04 per common share payable on October 14, 2019 to shareholders of record on September 27, 2019. In fiscal 2018,
the Company declared a dividend of $0.04 per common share payable on October 15, 2018 to shareholders of record on September 28, 2018.
Share RepurchasesThe Company's Board of Directors has authorized the repurchase of shares of the Company's common stock under publicly announced share repurchase programs. Since
the inception of the initial share repurchase program in fiscal 2012, the Company has repurchased 21,455,568 shares of common stock for $640 million. The following tablesummarizes share repurchases during the fourth quarter of fiscal 2019, all of which were purchased under publicly announced share repurchase programs.
Period Shares Repurchased Average Price Paidper Share
Maximum Number of Shares That May Yet BePurchased Under the Program
June 1 to June 30, 2019 — $ — 7,560,566July 1 to July 31, 2019 426,935 22.79 7,133,631August 1 to August 31, 2019 589,199 21.59 6,544,432
1,016,134 $ 22.09
Securities Authorized for Issuance under Equity Compensation PlansThe information required by Item 201(d) of Regulation S-K is provided under Item 12, Security Ownership of Certain Beneficial Owners and Management and Related
Stockholder Matters, which is incorporated herein by reference.
12

Performance Graph:The graph below compares the cumulative 5-year total return of the Company's Class A common stock with the cumulative total returns of the S&P 500 index and the
Dow Jones US Diversified Industrials index. The graph tracks the performance of a $100 investment in our Class A common stock and in each of the indexes (assuming thereinvestment of all dividends) from August 31, 2014 to August 31, 2019.
Copyright© 2019 Standard & Poor's, a division of S&P Global. All rights reserved.Copyright© 2019 S&P Dow Jones Indices LLC, a division of S&P Global. All rights reserved.
8/14 8/15 8/16 8/17 8/18 8/19Actuant Corporation $ 100.00 $ 63.64 $ 70.90 $ 71.68 $ 87.91 $ 66.39S&P 500 100.00 100.48 113.09 131.45 157.30 161.89Dow Jones US Diversified Industrials 100.00 99.88 126.40 124.97 112.01 100.78
The stock price performance included in this graph is not necessarily indicative of future stock price performance.
13

Item 6. Selected Financial DataThe following selected historical financial data have been derived from the consolidated financial statements of the Company. The data should be read in conjunction
with these financial statements and “Management’s Discussion and Analysis of Financial Condition and Results of Operations.”
Year Ended August 31,
2019 2018 2017 2016 2015 (in millions, except per share data)Statement of Operations Data(1)(2): Net sales $ 655 $ 641 $ 617 $ 687 $ 737Gross profit 293 283 261 291 330Selling, administrative and engineering expenses 209 210 208 203 222Amortization of intangible assets 9 9 9 11 12Director & officer transition charges — — 8 — —Restructuring charges 4 11 3 9 —Impairment & divestiture charges 23 3 117 130 64Operating profit (loss) 48 50 (84) (62) 32Earnings (loss) from continuing operations 8 5 (95) (62) 9 Diluted earnings (loss) per share from continuing operations $ 0.13 $ 0.08 $ (1.60) $ (1.05) $ 0.15Cash dividends per share declared $ 0.04 $ 0.04 $ 0.04 $ 0.04 $ 0.04 Diluted weighted average common shares 61,607 61,028 59,436 59,010 62,055
Balance Sheet Data (at end of period)(2): Cash $ 211 $ 250 $ 230 $ 180 $ 169Assets 1,124 1,485 1,517 1,439 1,637Debt 460 533 562 580 588Net debt (debt less cash) 249 283 332 400 419 _______________________
(1) Results are from continuing operations and exclude the financial results of businesses classified as "Assets from discontinued operations" and "Liabilities from discontinuedoperations" on the Consolidated Balance Sheets and of previously divested businesses reported as discontinued operations.
(2) We have completed various acquisitions and divestitures that impact the comparability of the selected financial data specifically related to earnings (loss) from continuing operations.The results of operations for these acquisitions and divestitures are included in our financial results for all periods subsequent to their acquisition or prior to their divestiture date. Thefollowing tables summarize the acquisitions and divestitures that were completed during the last five fiscal years (amounts in millions):
Acquisition Segment Date Completed Sales (a) Purchase Price
Equalizer Industrial Tools & Services May 2018 $ 6 $ 6Mirage Machines Industrial Tools & Services December 2017 12 17
Pipeline and Process Services (b) Industrial Tools & Services March 2016 32 66Larzep, S.A. Industrial Tools & Services February 2016 8 16 _______________________
(a) Represents approximate annual sales at the time of the acquisition.(b) Acquired the Middle East, Caspian and North Africa operations of Four Quest Energy Inc.
Divestiture Segment Date Completed Sales (a) Proceeds from Sale
Viking Business Other December 2017 $ 19 $ 9(a) Represents annual sales in fiscal year prior to divestiture.
14

Item 7. Management’s Discussion and Analysis of Financial Condition and Results of OperationsBackground
As discussed in Item 1, “Business,” during the fourth quarter of fiscal 2019, we realigned our Company’s financial reporting segments to reflect changes in our strategyrelated to the strategic disposition of the businesses comprising the EC&S segment. Therefore, we currently have only one reportable segment, IT&S. This segment is primarilyengaged in the design, manufacture and distribution of branded hydraulic and mechanical tools, as well as providing services and tool rental to the industrial, maintenance,infrastructure, oil & gas, energy and other markets. Financial information related to the Company's reportable segment is included in Note 15, "Business Segment, Geographicand Customer Information" in the notes to the consolidated financial statements.
Business Update
Our businesses provide an array of products and services across multiple markets and geographies which results in significant diversification. The IT&S segmentcontinues to have exposure within the broad industrial landscape, mining and infrastructure markets. Due to economic uncertainties driven by geopolitical uncertainties, such asChina tariffs and Brexit, we expect deceleration in demand for the majority of fiscal 2020. As a result, we expect consolidated fiscal 2020 adjusted core sales (sales growthexcluding the impact of acquisitions, divestitures, strategic exits of non-profitable product and service lines and changes in foreign currency exchange rates) growth of (3%) to1%.
We remain focused on pursuing both organic and acquisition-related growth opportunities aligned with our strategic objectives. This includes the advancement of ourcommercial effectiveness initiatives along with new product development efforts. We also remain focused on our lean efforts across our manufacturing, assembly and serviceoperations. Our IT&S segment is focused on accelerating global sales growth through new product introductions, a continued emphasis on sales and marketing efforts, andregional growth via second tier brands. In addition, we remain focused on reducing our concentration in the oil & gas vertical markets by growing sales of critical products,rentals, and services with new and existing customers in other attractive vertical markets including power generation, rescue, and mining. We expect IT&S segment year-over-year adjusted core sales growth of (3%) to 1% in fiscal 2020.
On January 24, 2019, the Company announced its intent to divest the remaining businesses within the EC&S segment to pursue an overall strategy as a pure-playindustrial tools and services company and on July 9, 2019, entered into a SPA to sell these businesses at a sales price of approximately $214.5 million. We expect the divestiturewill close in the fourth calendar quarter of 2019. We plan to use the divestiture proceeds to continue to execute our capital allocation strategy through debt reduction, sharerepurchases and strategic acquisition opportunities.
On March 21, 2019, we announced a new restructuring plan focused on i) the integration of the Enerpac and Hydratight businesses (IT&S segment), ii) the strategic exitof certain commodity type services in our North America Services operation (IT&S segment), and iii) driving efficiencies within the overall corporate structure. Totalrestructuring charges associated with the new restructuring plan were $4 million in fiscal 2019 related primarily to headcount reductions and facility consolidations(predominantly related to the exit of certain non-profitable North America Service operations). Pre-tax cost savings realized from the fiscal 2019 announced restructuring plantotaled approximately $1 million benefiting the IT&S segment. The Company expects to achieve a total of $12-$15 million of annual savings with total restructuring costs of$15-$20 million and we anticipate completing the majority of these actions within fiscal 2020. The annual benefit of these gross cost savings may be impacted by a number offactors, including sales and production volume variances and annual incentive compensation differentials.
Total restructuring charges associated with previously announced restructuring initiatives, related to continuing operations, were $11 million and $3 million in fiscal 2018and 2017, respectively. These restructuring costs related primarily to facility consolidations, headcount reductions and operational improvements throughout fiscal 2016 - 2018.Pre-tax cost savings, related to continuing operations, realized from executing the prior restructuring plans totaled approximately $25 million through fiscal 2019. Realized costsavings were comprised of $13 million within the IT&S segment, $8 million within the other operating segments and $3 million within Corporate.
15
Historical Financial Data (in millions)
Year Ended August 31,
2019 2018 2017Statements of Earnings Data: (1) Net sales $ 655 100 % $ 641 100 % $ 617 100 %Cost of products sold 362 55 % 358 56 % 356 58 %
Gross profit 293 45 % 283 44 % 261 42 %Selling, administrative and engineering expenses 209 32 % 210 33 % 208 34 %Amortization of intangible assets 9 1 % 9 1 % 9 1 %Director & officer transition charges — 0 % — 0 % 8 1 %Restructuring charges 4 1 % 11 2 % 3 0 %Impairment & divestiture charges 23 4 % 3 0 % 117 19 %
Operating profit 48 7 % 50 8 % (84) (14)%Financing costs, net 28 4 % 31 5 % 29 5 %Other expense, net 1 0 % — 0 % 4 1 %
Earnings (loss) before income tax expense (benefit) 19 3 % 19 3 % (117) (19)%Income tax expense (benefit) 11 2 % 14 2 % (23) (4)%
Net earnings (loss) from continuing operations 8 1 % 5 1 % (94) (15)%(Loss) earnings from discontinued operations, net of income taxes (257) (39)% (26) (4)% 29 5 %
Net loss $ (249) (38)% $ (21) (3)% $ (66) (11)%
Other Financial Data: (1) Depreciation $ 11 $ 11 $ 14 Capital expenditures 15 11 17
(1) Results are from continuing operations and exclude the financial results of businesses classified as "Assets from discontinued operations" and "Liabilities from discontinued operations" onthe Consolidated Balance Sheets and of previously divested businesses reported as discontinued operations.
Fiscal 2019 compared to Fiscal 2018Consolidated sales from continuing operations in fiscal 2019 were $655 million, 2% higher than the prior year sales of $641 million. Core sales increased 4% due to solid
core sales growth in the IT&S segment (5%). Changes in foreign currency exchange rates unfavorably impacted sales comparisons by 2%. Gross profit margins remainedrelatively consistent year-over-year. We benefited from our strategic exit of highly customized heavy lifting projects which provided lower gross profit margins, offset fromhigher service & rental sales which provide lower gross profit margins. Operating profit was lower in fiscal 2019 as compared to fiscal 2018 as a result of increased impairmentand divestiture charges. In fiscal 2019, we incurred $14 million of goodwill impairment charges associated with triggering events impacting Cortland U.S., $6 million ofimpairment & divestiture charges associated with the impairment of a customer relationship intangible in connection with the strategic exit of certain North America serviceofferings and $3 million of trade name impairment & divestiture charges associated with a re-branding strategy which will ultimately eliminate the use of certain secondarybrands within the IT&S segment that were previously determined to be indefinite lived. In fiscal 2018, we incurred $3 million of impairment & divestiture charges associatedwith the divestiture of our Viking business. Financing costs also decreased in fiscal 2019 as a result of the execution of our capital allocation strategy to utilize cash to reduceour debt by $73 million over the course of fiscal 2019 in addition to reduced interest costs on our new Senior Credit Facility. Our income tax expense also decreased in fiscal2019 as discussed in further detail within the Income Tax Expense section below.
16

Fiscal 2018 compared to Fiscal 2017Consolidated sales from continuing operations in fiscal 2018 were $641 million, 4% higher than the prior year sales of $617 million. Core sales were up $18 million (3%),
as a result of a 3% core sales increase in the IT&S segment. Changes in foreign currency exchange rates also favorably impacted sales comparisons by $14 million, while the netimpact from the Mirage and Equalizer acquisitions, net of the Viking divestiture, reduced core sales by $7 million. Gross profit margins increased from 42% in fiscal 2017 to44% in fiscal 2018 as a result of a higher net sales and the realization of benefits from restructuring activities which were offset by project overruns and productioninefficiencies. Additionally, fiscal 2018 results included $3 million of impairment & divestiture charges related to the sale of our Viking business, while fiscal 2017 resultsincluded $8 million of director and officer transition charges as well as $117 million of impairment and divestiture charges related to the then pending sale of Viking. Fiscal2018 included an increase in our effective income tax rate compared to the prior year due to provisional tax charges for U.S. tax reform act enacted in December 2017, the non-recurrence of fiscal 2017 income tax planning benefits and the deductibility and timing related to impairment and divestiture charges in both comparable years.
Segment Results
Industrial Tools & Services Segment
The IT&S segment is a global supplier of branded hydraulic and mechanical tools and services to a broad array of end markets, including industrial, energy, mining andproduction automation markets. Its primary products include branded tools, highly engineered heavy lifting technology solutions, connectors for oil & gas, as well as hydraulictorque wrenches (Product product line). On the services side, we provide energy maintenance and manpower services to meet customer-specific needs and rental capabilities forcertain of our products (Service & Rental product line). The following table sets forth the results of operations for the IT&S segment (in millions):
Year Ended August 31,
2019 2018 2017Net Sales $ 610 $ 591 $ 553Operating Profit 101 99 96Operating Profit % 16.6% 16.8% 17.3%
Fiscal 2019 compared to Fiscal 2018Fiscal 2019 IT&S segment net sales increased by $19 million (3%) from fiscal 2018 to $610 million. Changes in foreign currency exchange rates unfavorably impacted
sales comparisons by 3%, while the Mirage and Equalizer acquisitions increased net sales by 1%. The IT&S segment core sales increased $28 million (5%) on a year-over-yearbasis. Flat core sales for the Product product line reflected changing macroeconomic environments over the course of our fiscal year as strong growth in our core sales over thefirst three quarters of the fiscal year outweighed the strategic focus to exit heavy lifting technology projects which historically were at low margins, whereas the fourth quartersaw decelerating demand globally which was most reflected in our European operations. The core sales increase of 19% in the Service & Rental product line was the result ofhigher global maintenance activity levels as compared to the prior year, predominantly in our Middle East operations. Operating profit margins decreased from 16.8% in fiscal2018 to 16.6% in fiscal 2019 primarily due to additional impairment & divestiture charges in fiscal 2019 as compared to 2018 (impairment & divestiture charges of $9 millionrelated to tradename and customer relationship intangible impairments in 2019 with no impairment & divestiture charges in fiscal 2018) and sales mix, specifically the increasedrevenues from Middle East service & rental which have lower gross profit margins than our product sales, partially offset by increased margins in our product sales as a resultof our strategic focus to exit heavy lifting technology projects which historically were at low margins. Restructuring charges were $4 million in both fiscal 2019 and 2018.
17
Fiscal 2018 compared to Fiscal 2017Fiscal 2018 IT&S segment net sales increased by $39 million (7%) from fiscal 2017 to $591 million. Changes in foreign currency exchange rates favorably impacted sales
comparisons by 2%, while the Mirage and Equalizer acquisitions increased net sales by 2%. The IT&S segment core sales increased 3% on a year-over-year basis. The core salesincrease of 6% for the Product product line reflected broad based industrial tool demand across all major geographies and end markets and contributions from our commercialeffectiveness and new product development efforts. This increase was offset by a core sales decrease of 4% in the Service & Rental product line as global maintenance activitylevels declined from prior year. Operating profit margins decreased from 17.3% in fiscal 2017 to 16.8% in fiscal 2018, due to production inefficiencies and ongoing investmentsin commercial and engineering activities which were partially offset by the margin expansion impact of incremental volume. Restructuring charges were $4 million and $3million in fiscal 2018 and 2017, respectively.
CorporateCorporate consists of selling and administrative costs and expenses including executive, legal, finance, and technology that are not allocated to the segments based on
their nature, as well as corporate costs previously allocated to the EC&S segment that must be excluded from discontinued operations based on their nature. Corporate expenseswere $42 million in fiscal 2019 compared to $44 million in fiscal 2018. A decrease in annual incentive amounts and restructuring charges of $5 million in fiscal 2018 (norestructuring costs in fiscal 2019) partially offset by increased outsourced consulting fees resulted in a $2 million year-over-year cost reduction. Non-recurring director andofficer transition charges of $8 million in fiscal 2017 were the primary reason for the $7 million decrease in fiscal 2018 from $50 million in fiscal 2017.
Financing Costs, NetNet financing costs were $28 million, $31 million and $29 million in fiscal 2019, 2018 and 2017, respectively. Fiscal 2019 net financing costs decreased primarily from
fiscal 2018 as a result of the $73 million of term loan principal payments made throughout fiscal 2019 and lower interest rates resulting from our March 2019 Senior CreditFacility refinancing. Fiscal 2018 net financing costs increased from fiscal 2017 resulting from increases in interest rates on our variable rate debt.
Income Tax ExpenseThe Company's income tax expense or benefit is impacted by a number of factors, including the amount of taxable earnings generated in foreign jurisdictions with tax
rates that are different than the U.S. federal statutory rate, permanent items, state tax rates, changes in tax laws, acquisitions and divestitures and the ability to utilize various taxcredits and net operating loss carryforwards. The Company's global operations, acquisition activity and specific tax attributes provide opportunities for continuous global taxplanning initiatives to maximize tax credits and deductions. Income tax expense also includes the impact of provision to tax return adjustments, changes in valuation allowancesand reserve requirements for unrecognized tax benefits. Pre-tax earnings (loss), income tax expense (benefit) and effective income tax rate from continuing operations for thepast three years were as follows (in thousands):
Year Ended August 31,
2019 2018 2017Earnings (loss) from continuing operations before income tax expense (benefit) $ 18,724 $ 19,196 $ (117,889)Income tax expense (benefit) 10,657 14,450 (22,614)Effective income tax rate 56.9% 75.3% 19.2%
The comparability of pre-tax earnings (loss), income tax expense (benefit) and the related effective income tax rates are impacted by impairment and other divestiturecharges as well as the Tax Cuts and Jobs Act (the “Act”), which was enacted on December 22, 2017. Fiscal 2019 results included $23 million of impairment and divestiturecharges, while fiscal 2018 and 2017 results included $3 million and $117 million, respectively. A substantial portion of these charges do not result in tax benefits. The fiscal2019 tax provision included tax benefits of $2 million related to legislative changes and additional guidance related to the Act. The fiscal 2018 tax provision included net taxexpense of approximately $6 million related to the revaluation of U.S. deferred taxes as a result of the Act and the establishment of valuation allowances against foreign taxcredit carryforwards and net deferred tax assets of various jurisdictions.
Both the current and prior year income tax provisions were impacted by the mix of earnings in foreign jurisdictions with income tax rates different than the U.S. federalincome tax rate and income tax benefits from global tax planning initiatives. The Company’s earnings (loss) before income taxes from continuing operations, excludingimpairment and other divestiture charges, included approximately 80% of earnings from foreign jurisdictions for fiscal 2019 compared to 76% in fiscal 2018
18

which results in an effective tax rate that is higher than the current U.S. statutory tax rate of 21%. Excluding the impairment and divestiture charges, the fiscal 2019 effective taxrate was 30.2%, which increased from the fiscal 2018 effective tax rate of 22.8% due to one-time tax benefits related to the Act in fiscal 2018 that will not repeat in futureperiods.
Items Impacting ComparabilityOn December 1, 2017, the Company completed the sale of the Viking business which had net sales from continuing operations of $3 million and $19 million million for
the years ended August 31, 2018 and 2017, respectively.In fiscal 2018, the Company acquired the stock and certain assets of Mirage Machines, Ltd. ("Mirage") and the stock of Equalizer International, Limited ("Equalizer").
The acquired businesses generated combined net sales of $14 million and $9 million for the years ended August 31, 2019 and 2018, respectively.
Liquidity and Capital Resources
At August 31, 2019, cash and cash equivalents were $211 million, comprised of $163 million of cash held by foreign subsidiaries and $48 million held domestically. Weperiodically utilize income tax safe harbor provisions to make temporary short-term intercompany advances from our foreign subsidiaries to our U.S. parent. There were notemporary intercompany advances outstanding at August 31, 2019 and 2018. We had $5 million in temporary intercompany advances outstanding at August 31, 2017. Thefollowing table summarizes the cash flow attributable to operating, investing and financing activities (in millions):
Year Ended August 31,
2019 2018 2017Net cash provided by operating activities $ 54 $ 106 $ 89Net cash provided by (used in) investing activities 11 (63) (28)Net cash used in financing activities (100) (18) (15)Effect of exchange rate changes on cash (5) (4) 4
Net (decrease) increase in cash and cash equivalents $ (40) $ 21 $ 50
Cash flow provided by operations was $54 million in fiscal 2019, a decrease of $52 million from the prior year due primarily to higher cash taxes paid, higher incentivecompensation payouts in fiscal 2019 from 2018 results, a change in the timing of our 401(k) plan Company match funding and additional cash usage associated with divestiturecosts. We utilized the cash flow from operations, along with $36 million of cash from the sale of our PHI and Cortland Fibron businesses and excess cash on hand, for $73million of principal payments on our outstanding term term loan ($43 million more than our required commitment as of August 31, 2018), $27 million of capital expendituresand to repurchase approximately 1 million shares of our outstanding common stock for approximately $22 million.
Cash flow from operations in fiscal 2018 was $106 million, an increase of $18 million from the prior year due to higher cash earnings and reduced net cash tax payments.We utilized the cash flow from operations to fund $23 million of business acquisitions, $21 million of capital expenditures, and $30 million of principal repayments on our termloan. In addition, in order to facilitate the sale of our Viking business, we used cash of approximately $27 million to buy out leases of rental assets.
On March 29, 2019, the Company refinanced its Senior Credit Facility, which is comprised of a $400 million revolving line of credit and a $200 million term loan (seeNote 7, "Debt" in the notes to the consolidated financial statements for further details of the new Senior Credit Facility). The unused credit line and amount available forborrowing under the revolver was $399 million at August 31, 2019.
The $200 million term loan is required to be repaid in principal installments of $1.25 million per quarter beginning on August 31, 2019, increasing to $2.5 million perquarter beginning on May 31, 2020, increasing to $3.75 million per quarter beginning on May 31, 2021, and increasing to $5 million per quarter beginning on May 31, 2022,with the remaining balance due at maturity (March 29, 2024).
Borrowings under the Senior Credit Facility bear interest based on LIBOR or a base rate, with interest rate spreads above LIBOR or the base rate being subject toadjustments based on the Company’s net leverage ratio, ranging from 1.125% to 2.00% in the case of loans bearing interest at LIBOR and from 0.125% to 1.00% in the case ofloans bearing interest at the base rate. In addition, a non-use fee is payable quarterly on the average unused revolving credit facility ranging from 0.15% to 0.30% per annum,based on the Company’s net leverage ratio.
The agreement governing the Senior Credit Facility contains customary limits and restrictions concerning investments, sales of assets, liens on assets and dividends andincludes two financial covenants-a maximum net leverage ratio of 3.75:1.00
19

and a minimum interest coverage ratio of 3.50:1.00, in each case subject to adjustment in connection with certain transactions, including reduction of the minimum interestcoverage ratio to 3.00:1.00 for any fiscal quarter ending within 12 months after the sale of the principal businesses comprising the EC&S segment and an increase to theleverage ratio from 3.75:1.00 to 4.25: 1.00 during the four fiscal quarters after a significant acquisition.
Subsequent to the refinancing of the Senior Credit Facility, in addition to the required term loan principal payment of $1 million, the Company utilized excess cash toprepay a total of $24 million, reducing the remaining principal due to $175 million at August 31, 2019.
We believe that the revolver, combined with our existing cash on hand and anticipated operating cash flows, will be adequate to meet operating, debt service, acquisitionand capital expenditure funding requirements for the foreseeable future.
Primary Working Capital ManagementWe use primary working capital as a percentage of sales as a key metric for working capital efficiency. We define this metric as the sum of net accounts receivable and net
inventory less accounts payable, divided by the past three months' sales annualized. The following table shows the components of our primary working capital (in millions):
August 31, 2019 August 31, 2018
$ PWC % $ PWC %Accounts receivable, net $ 126 20 % $ 123 19 %Inventory, net 77 12 % 72 11 %Accounts payable (77) (12)% (70) (11)%
Net primary working capital $ 126 20 % $ 125 19 %
Total primary working capital was $126 million at August 31, 2019 which stayed relatively consistent with the $125 million at August 31, 2018. Primary working capitalincreased slightly due to increased accounts receivable as a result of significant sales growth in the Middle East which has longer payment terms, increased inventory levelsresulting from lower fourth quarter fiscal 2019 sales due to recent decelerating demand, offset by an increase in accounts payable as we continue to work with our supply chainto extend payment terms to be commensurate with those of our customers.
Our accounts receivable are derived from a diverse customer base spread across a number of industries, with our largest single customer generating approximately 3% offiscal 2019 net sales from continuing operations.
Capital ExpendituresThe majority of our manufacturing activities consist of assembly operations. We believe that our capital expenditure requirements are not as extensive as other industrial
companies given the nature of our operations. Capital expenditures associated with continuing operations were $15 million, $11 million and $17 million in fiscal 2019, 2018and 2017, respectively. Capital expenditures for fiscal 2020 are expected to be $10-$12 million, but could vary depending on business performance, changes in foreign currencyexchange rates, growth opportunities and the amount of assets leased instead of purchased.
Commitments and Contingencies
Given our desire to allocate cash flow and revolver availability to fund growth initiatives, we have historically leased most of our operating equipment and facilities. Welease certain facilities, computers, equipment and vehicles under various operating lease agreements, generally over periods ranging from one to twenty years. Under mostarrangements, we pay the property taxes, insurance, maintenance and expenses related to the leased property. Many of our leases include provisions that enable us to renew theleases based upon fair value rental rates on the date of expiration of the initial leases.
We are contingently liable for certain lease payments under leases within businesses we previously divested or spun-off. If any of these businesses do not fulfill theirfuture lease payment obligations under a lease, we could be liable for such obligations. As of August 31, 2019, the present value of future minimum lease payments, using aweighted average discount rate of 1.89%, on previously divested or spun-off businesses was as follows: $2 million in each fiscal year for fiscal 2020 through 2024 and less than$1 million in aggregate thereafter.
We had outstanding letters of credit totaling $18 million and $24 million at August 31, 2019 and 2018, respectively, the majority of which relate to commercial contractsand self-insured workers' compensation programs.
20

Contractual ObligationsThe timing of payments due under our contractual commitments is as follows (in millions):
Payments Due
2020 2021 2022 2023 2024 Thereafter TotalDebt (short-term and long-term) $ 8 $ 12 $ 305 $ 20 $ 118 $ — $ 463Interest on long-term debt 22 22 19 4 3 — 70Operating leases* 23 19 16 10 7 35 110
$ 53 $ 53 $ 340 $ 34 $ 128 $ 35 $ 643
*Table includes contractual obligations associated with leases of the EC&S segment held for sale as of August 31, 2019. Certain leases are currently in the name of Actuant Corporation or operatingsubsidiaries that will not be divested, and we are working proactively with the buyer to transfer leases into the name of a subsidiary to be divested or to buy out the lease with reimbursement of the cost fromthe buyer.
Interest on long-term debt assumes the current interest rate environment and revolver borrowings consistent with August 31, 2019 debt levels.
Our contractual obligations generally relate to amounts due under contracts with third-party service providers. These contracts are primarily for real estate leases,information technology services and telecommunications services. Only those obligations that are not cancelable are included in the table.
As part of our global sourcing strategy, we have entered into agreements with certain suppliers that require the supplier to maintain minimum levels of inventory tosupport certain products for which we require a short lead time to fulfill customer orders. We have the ability to notify the supplier that they no longer need to maintain theminimum level of inventory should we discontinue manufacture of a product during the contract period, however, we must purchase the remaining minimum inventory levelsthe supplier was required to maintain within a defined period of time. As these contracts allow for us to terminate with appropriate notice so long as we utilize the remaininginventory on hand at the supplier and there are no overall minimum volumes in these contracts other than what the supplier is required to maintain on hand at any given point intime, these contracts are excluded from the table above.
We have long-term obligations related to our deferred compensation, pension and postretirement plans that are excluded from this table and summarized in Note 11,“Employee Benefit Plans” in the notes to the consolidated financial statements.
Our liability for unrecognized tax benefits was $24 million at August 31, 2019, but is not included in the table of contractual obligations because the timing of the potentialsettlements of these uncertain tax positions cannot be reasonably estimated.
Critical Accounting Estimates
We prepare our consolidated financial statements in conformity with U.S. generally accepted accounting principles (“GAAP”). This requires management to makeestimates and assumptions that affect reported amounts and related disclosures. Actual results could differ from those estimates. The following estimates are considered bymanagement to be the most critical in understanding judgments involved in the preparation of our consolidated financial statements and uncertainties that could impact ourresults of operations, financial position and cash flow.
Inventories: Inventory cost is determined using the last-in, first-out (“LIFO”) method for a portion of U.S. owned inventory (approximately 48% and 41% of totalinventories at August 31, 2019 and 2018, respectively). If the LIFO method were not used, inventory balances would be higher than amounts presented in the consolidatedbalance sheet by $10 million and $5 million at August 31, 2019 and 2018, respectively. We perform an analysis on historical sales usage of individual inventory items on handand record a reserve to adjust inventory cost to market value. The inventory valuation assumptions used are based on historical experience. We believe that such estimates aremade based on consistent and appropriate methods; however, actual results may differ from these estimates under different assumptions or conditions.
21

Goodwill and Long-lived Assets:
Goodwill Impairment Review and Estimates: A considerable amount of management judgment is required in performing the impairment tests, principally in determiningthe fair value of each reporting unit and the indefinite lived intangible assets. While we believe our judgments and assumptions are reasonable, different assumptions couldchange the estimated fair values and, therefore, impairment charges could be required. Significant negative industry or economic trends, disruptions to the Company's business,loss of significant customers, inability to effectively integrate acquired businesses, unexpected significant changes or planned changes in use of the assets or in entity structureand divestitures may adversely impact the assumptions used in the valuations and ultimately result in future impairment charges.
In estimating the fair value of a reporting unit, we generally use a discounted cash flow model, which calculates fair value as the sum of the projected discounted cashflows over a discrete seven-year period plus an estimated terminal value. Significant assumptions include forecasted revenues, operating profit margins, and discount ratesapplied to the future cash flows based on the respective reporting unit's estimated weighted average cost of capital. In certain circumstances, we also review a market approachin which a trading multiple is applied to either forecasted EBITDA (earnings before interest, income taxes, depreciation and amortization) or anticipated proceeds of thereporting unit to arrive at the estimated fair value. If the fair value of a reporting unit is less than its carrying value, an impairment loss is recorded. The estimated fair valuerepresents the amount we believe a reporting unit could be bought or sold for in a current transaction between willing parties on an arms-length basis.
Fiscal 2019 Impairment Charges: As a result of a triggering event in fiscal 2019, we recorded a $14 million goodwill impairment charge associated with the Cortland U.S.reporting unit. See Note 6, "Goodwill, Intangible Assets, and Long-Lived Assets" in the notes to the consolidated financial statements for further discussion.
In addition, as a result of the EC&S reporting unit being held for sale as of August 31, 2019, we recorded a $210 million impairment charge representing the excess of thenet book value of the net assets of the reporting unit as compared to the anticipated proceeds less costs to sell which is recorded within "(Loss) earnings from discontinuedoperations" within the Consolidated Statements of Operations.
The annual review of the reporting units representing continuing operations did not result in any reporting units having an estimated fair value that exceeded the carryingvalue (expressed as a percentage of the carrying value) by less than 30%.
Fiscal 2018 Impairment Charges: Our fourth quarter fiscal 2018 impairment review resulted in a review of the recoverability of the goodwill and long-lived assets of tworeporting units (Cortland and PHI) for which the results of those assessments below are included in the results of discontinued operations.
Cortland Reporting Unit: The Cortland reporting unit recognized impairment charges in conjunction with Cortland Fibron’s held for sale classification, resulting in a $10million impairment charge representing the excess of net book value of assets held for sale over anticipated proceeds. This impairment charge included $4 million relatedto goodwill. The impairment charge is recorded within "(Loss) earnings from discontinued operations" within the Consolidated Statements of Operations. See Note 5,“Divestiture Activities” in the notes to the consolidated financial statements for further discussion.
PHI Reporting Unit: The PHI business primarily designs, manufactures and distributes concrete tensioning products. Changes in certain assumptions used in our annualgoodwill impairment analysis, which are linked, in part, to recent market share losses, resulted in a fair value estimate of the reporting unit lower than its carrying value.As a result, we recognized a $17 million impairment charge related to the goodwill of the PHI business, which represented the entire goodwill balance of the reportingunit. The impairment charge is recorded within "(Loss) earnings from discontinued operations" within the Consolidated Statements of Operations. See Note 5,“Divestiture Activities” in the notes to the consolidated financial statements for further discussion.
Fiscal 2017 Year-End Impairment Test: Our annual fiscal 2017 impairment review resulted in one reporting unit (Cortland) having an estimated fair value that exceededthe carrying value (expressed as a percentage of the carrying value) by less than 30%, however the test did not result in the need to record an impairment charge.
Indefinite-lived intangibles (tradenames): Indefinite-lived intangible assets are also subject to annual impairment testing. On an annual basis or more frequently if atriggering event occurs, the fair value of indefinite lived assets, based on a relief of royalty valuation approach, are evaluated to determine if an impairment charge is required.We recognized an impairment charge of $3 million in the fourth quarter of fiscal 2019 as a result of our determination that two secondary tradenames which were previouslyassumed to have an indefinite life would be phased out over the next 12-15 months and be re-branded with the Enerpac tradename.
22
The fiscal 2019 annual impairment review of the remaining indefinite-lived intangible assets (that represented components of continuing operations) did not result in anyindefinite-lived assets having an estimated fair value that exceeded the carrying value (expressed as a percentage of the carrying value) by less than 30%.
We recognized impairment charges during the fourth quarter of fiscal 2018 to write-down the value of tradenames by $7 million in relation to the Cortland Fibron held forsale treatment (impairment charge recorded as a component of "(Loss) earnings from discontinued operations" within the Consolidated Statements of Operations).
A considerable amount of management judgment is required in performing impairment tests, principally in determining the fair value of each reporting unit and theindefinite-lived intangible assets. While we believe our judgments and assumptions are reasonable, different assumptions could change the estimated fair values and, therefore,future additional impairment charges could be required. Weakening industry or economic trends, disruptions to our business, loss of significant customers, inability toeffectively integrate acquired businesses, unexpected significant changes or planned changes in the use of the assets or in entity structure and divestitures may adversely impactthe assumptions used in the valuations and ultimately result in future impairment charges.
Long-lived assets (fixed assets and amortizable intangible assets): We also review long-lived assets for impairment when events or changes in business circumstancesindicate that the carrying amount of the assets may not be fully recoverable. If such indicators are present, we perform undiscounted operating cash flow analyses to determine ifimpairment exists. If impairment is determined to exist, any related impairment loss is calculated based on fair value.
In the fourth quarter of fiscal 2019, in connection with our North America service restructuring within the IT&S segment, we identified one customer relationshipintangible asset associated with the component of the service business we intend to exit. As a result of our assessment, for which the primary assumption is the anticipatedrevenues associated with those customers, we determined that the fair value of the intangible asset was less than its carrying value, and therefore, recorded a $6 millionimpairment charge. See Note 6, "Goodwill, Intangible Assets, and Long-Lived Assets" in the notes to the consolidated financial statements for further discussion.
Also in the fourth quarter of fiscal 2019, in connection with the held-for-sale treatment of the remaining businesses within the EC&S segment, we recognized a $54 millionimpairment charge related to the recognition in earnings of the cumulative effect of foreign currency rate changes since acquisition of those businesses which is recorded in "(Loss) earnings from discontinued operations" within the Consolidated Statements of Operations. See Note 5, "Divestiture Activities" in the notes to the consolidated financialstatements for further discussion.
In the fourth quarter of fiscal 2018, related to the held-for-sale treatment of our Cortland Fibron business, we recognized a $46 million long-lived asset impairment,representing the excess of net book value of assets held for sale over anticipated proceeds which consisted of i) $35 million related to the recognition in earnings of thecumulative effect of foreign currency rate changes since acquisition; ii) $10 million representing the excess of the net book value of assets held for sale to the anticipatedproceeds and iii) $1 million of other divestiture charges. These charges are recorded as a component of "(Loss) earnings from discontinued operations" within the ConsolidatedStatements of Operations. See Note 5, "Divestiture Activities" in the notes to the consolidated financial ftatements for further discussion.
During the fourth quarter of fiscal 2018, the undiscounted operating cash flows of our PHI business did not exceed the carrying value of the net assets of the business,resulting in a long-lived asset impairment charge of $6 million (recorded as a component of "(Loss) earnings from discontinued operations" on the Consolidated Statements ofOperations), consisting of charges of $5 million and $1 million on amortizable intangible assets and fixed assets (primarily machinery and equipment), respectively. See Note 5,"Divestiture Activities" in the notes to the consolidated financial statements for further discussion.
In the fourth quarter of fiscal 2017, related to the pending sale of our Viking business, we recognized an $85 million long-lived asset impairment, representing the excessof the net book value of assets held for sale over the anticipated proceeds which included $69 million related to the recognition in earnings of the cumulative effect of foreigncurrency rate changes since acquisition. See Note 5, "Divestiture Activities" in the notes to the consolidated financial statements for further discussion.
Significant management judgment is required in performing impairment tests, principally in determining the fair value of long-lived assets. While we believe ourjudgments and assumptions are reasonable, different assumptions could change the estimated fair values and, therefore, future additional impairment charges could be required.Weakening industry or economic trends, disruptions to our business, loss of significant customers, inability to effectively integrate acquired businesses, unexpected significantchanges or planned changes in the use of the assets or in entity structure and divestitures may adversely impact the assumptions used in the valuations and ultimately result infuture impairment charges.
23
Business Combinations and Purchase Accounting: Business combinations are accounted for using the acquisition method of accounting, and accordingly, the assets andliabilities of the acquired business are recorded at their respective fair values. The excess of the purchase price over the estimated fair value is recorded as goodwill. Assigningfair market values to the assets acquired and liabilities assumed at the date of an acquisition requires knowledge of current market values and the values of assets in use, andoften requires the application of judgment regarding estimates and assumptions. While the ultimate responsibility resides with management, for certain acquisitions we retainthe services of certified valuation specialists to assist with assigning estimated values to certain acquired assets and assumed liabilities, including intangible assets and tangiblelong-lived assets. Acquired intangible assets, excluding goodwill, are valued using discounted cash flow methodology based on future cash flows specific to the type ofintangible asset purchased. This methodology incorporates various estimates and assumptions, the most significant being projected revenue growth rates, profit margins andforecasted cash flows based on discount rates and terminal growth rates.
Employee Benefit Plans: We provide a variety of benefits to employees and former employees including, in some cases, pensions and postretirement health care. Planassets and obligations are recorded based on an August 31 measurement date utilizing various actuarial assumptions such as discount rates, assumed rates of return on planassets and health care cost trend rates. We determine the discount rate assumptions by referencing high-quality, long-term bond rates that are matched to the duration of ourbenefit obligations, with appropriate consideration of local market factors, participant demographics and benefit payment forecasts. At August 31, 2019 and 2018, the discountrates on domestic benefit plans were 2.90% and 4.05%, respectively. In estimating the expected return on plan assets, we consider historical returns, forward-lookingconsiderations, inflation assumptions and the asset-allocation strategy in investing such assets. Domestic benefit plan assets consist primarily of participating units in mutualfunds, index funds and bond funds. The expected return on domestic benefit plan assets was 5.75% and 7% for the fiscal years ended August 31, 2019 and 2018, respectively. A25 basis point change in the assumptions for the discount rate or expected return on plan assets would not have materially changed the fiscal 2019 domestic benefit planexpense.
We review actuarial assumptions on an annual basis and make modifications based on current rates and trends, when appropriate. As required by GAAP, the effects of anymodifications are recorded currently or amortized over future periods. Based on information provided by independent actuaries and other relevant sources, we believe that theassumptions used are reasonable; however, changes in these assumptions could impact our financial position, results of operations or cash flow. See Note 11, “Employee BenefitPlans” in the notes to the consolidated financial statements for further discussion.
Income Taxes: Judgment is required to determine the annual effective income tax rate, deferred tax assets and liabilities, reserves for unrecognized tax benefits and anyvaluation allowances recorded against net deferred tax assets. Our effective income tax rate is based on annual income, statutory tax rates, tax planning opportunities availablein the various jurisdictions in which we operate and other adjustments. Our annual effective income tax rate includes the impact of discrete income tax matters includingadjustments to reserves for uncertain tax positions and the benefits of various income tax planning activities. Tax regulations require items to be included in our tax returns atdifferent times than these same items reflected in our consolidated financial statements. As a result, the effective income tax rate in our consolidated financial statements differsfrom that reported in our tax returns. Some of these differences are permanent, such as expenses that are not tax deductible, while others are temporary differences, such asamortization and depreciation expenses.
Temporary differences create deferred tax assets and liabilities, which are measured using enacted tax rates expected to apply to taxable income in the years in whichthose temporary differences are expected to be recovered or settled. We establish valuation allowances for our deferred tax assets when the amount of expected future taxableincome is not large enough to utilize the entire deduction or credit. Relevant factors in determining the realizability of deferred tax assets include future taxable income, theexpected timing of the reversal of temporary differences, tax planning strategies and the expiration dates of the various tax attributes.
Item 7A. Quantitative and Qualitative Disclosures About Market RiskWe are exposed to market risk from changes in foreign currency exchange rates and interest rates and, to a lesser extent, commodities. To reduce such risks, we
selectively use financial instruments and other proactive management techniques. All hedging transactions are authorized and executed pursuant to clearly defined policies andprocedures, which strictly prohibit the use of financial instruments for trading or speculative purposes. A discussion of our accounting policies for derivative financialinstruments is included within Note 9, “Derivatives” in the notes to the consolidated financial statements.
Foreign Currency Risk—We maintain operations in the U.S. and various foreign countries. Our non-U.S. operations, the largest of which are located in the Netherlands(and other countries whose functional currency is the Euro), the United Kingdom, Australia, the United Arab Emirates and China, have foreign currency risk relating to receiptsfrom customers, payments to suppliers and intercompany transactions denominated in foreign currencies. Under certain conditions, we enter into hedging transactions, primarilyforward foreign currency swaps, that enable us to mitigate the potential adverse impact of
24

foreign currency exchange rate risk (see Note 9, “Derivatives” in the notes to the consolidated financial statements for further information). We do not engage in trading or otherspeculative activities with these transactions, as established policies require that these hedging transactions relate to specific currency exposures.
The strengthening of the U.S. dollar can have an unfavorable impact on our results of operations and financial position as foreign denominated operating results aretranslated into U.S. dollars. To illustrate the potential impact of changes in foreign currency exchange rates on the translation of our results of operations, annual sales andoperating profit were remeasured assuming a ten percent reduction in foreign exchange rates compared to the U.S. dollar. Under this assumption, annual sales would have been$26 million lower and operating profit would have been $3 million higher for the twelve months ended August 31, 2019. This sensitivity analysis assumes that each exchangerate would change in the same direction relative to the U.S. dollar and excludes the potential effects that changes in foreign currency exchange rates may have on actual sales orprice levels. Similarly, a ten percent decline in foreign currency exchange rates relative to the U.S. dollar on our August 31, 2019 financial position would result in a $35 millionreduction to equity (accumulated other comprehensive loss), as a result of non U.S. dollar denominated assets and liabilities being translated into U.S. dollars, our reportingcurrency.
Interest Rate Risk—We manage interest expense using a mixture of fixed-rate and variable-rate debt. A change in interest rates impacts the fair value of our 5.625%Senior Notes, but not our earnings or cash flow because the interest rate on such debt is fixed. Our variable-rate debt obligations consist primarily of revolver and term loanborrowings under our Senior Credit Facility. A ten percent increase in the average cost of our variable rate debt would have resulted in an approximate $1 million increase infinancing costs for the year-ended August 31, 2019.
Commodity Risk—We source a wide variety of materials and components from a network of global suppliers. While such materials are typically available from numeroussuppliers, commodity raw materials, such as steel and plastic resin, are subject to price fluctuations which could have a negative impact on our results. We strive to timely passalong such commodity price increases to customers to avoid profit margin erosion.
25

Item 8. Financial Statements and Supplementary Data
Page
INDEX TO CONSOLIDATED FINANCIAL STATEMENTS Report of Independent Registered Public Accounting Firm 27 Consolidated Statements of Operations for the years ended August 31, 2019, 2018 and 2017 29 Consolidated Statements of Comprehensive (Loss) Income for the years ended August 31, 2019, 2018 and 2017 30 Consolidated Balance Sheets as of August 31, 2019 and 2018 31 Consolidated Statements of Cash Flows for the years ended August 31, 2019, 2018 and 2017 32 Consolidated Statements of Shareholders’ Equity for the years ended August 31, 2019, 2018 and 2017 33 Notes to consolidated financial statements 34 INDEX TO FINANCIAL STATEMENT SCHEDULE Schedule II—Valuation and Qualifying Accounts for the years ended August 31, 2019, 2018 and 2017 68
All other schedules are omitted because they are not applicable, not required or because the required information is included in the consolidated financial statements or notesthereto.
26

Report of Independent Registered Public Accounting Firm
To the Board of Directors and Shareholders of Actuant Corporation
Opinions on the Financial Statements and Internal Control over Financial Reporting
We have audited the accompanying consolidated balance sheets of Actuant Corporation and its subsidiaries (the “Company”) as of August 31, 2019 and 2018, and the relatedconsolidated statements of operations, comprehensive (loss) income, changes in shareholders’ equity and cash flows for each of the three years in the period ended August 31,2019, including the related notes and financial statement schedule listed in the accompanying index (collectively referred to as the “consolidated financial statements”). We alsohave audited the Company's internal control over financial reporting as of August 31, 2019, based on criteria established in Internal Control - Integrated Framework (2013)issued by the Committee of Sponsoring Organizations of the Treadway Commission (COSO).
In our opinion, the consolidated financial statements referred to above present fairly, in all material respects, the financial position of the Company as of August 31, 2019 and2018, and the results of its operations and its cash flows for each of the three years in the period ended August 31, 2019 in conformity with accounting principles generallyaccepted in the United States of America. Also in our opinion, the Company maintained, in all material respects, effective internal control over financial reporting as of August31, 2019, based on criteria established in Internal Control - Integrated Framework (2013) issued by the COSO.
Basis for Opinions
The Company's management is responsible for these consolidated financial statements, for maintaining effective internal control over financial reporting, and for its assessmentof the effectiveness of internal control over financial reporting, included in Management’s Report on Internal Control over Financial Reporting appearing under Item 9A. Ourresponsibility is to express opinions on the Company’s consolidated financial statements and on the Company's internal control over financial reporting based on our audits. Weare a public accounting firm registered with the Public Company Accounting Oversight Board (United States) (PCAOB) and are required to be independent with respect to theCompany in accordance with the U.S. federal securities laws and the applicable rules and regulations of the Securities and Exchange Commission and the PCAOB.
We conducted our audits in accordance with the standards of the PCAOB. Those standards require that we plan and perform the audits to obtain reasonable assurance aboutwhether the consolidated financial statements are free of material misstatement, whether due to error or fraud, and whether effective internal control over financial reporting wasmaintained in all material respects.
Our audits of the consolidated financial statements included performing procedures to assess the risks of material misstatement of the consolidated financial statements, whetherdue to error or fraud, and performing procedures that respond to those risks. Such procedures included examining, on a test basis, evidence regarding the amounts anddisclosures in the consolidated financial statements. Our audits also included evaluating the accounting principles used and significant estimates made by management, as wellas evaluating the overall presentation of the consolidated financial statements. Our audit of internal control over financial reporting included obtaining an understanding ofinternal control over financial reporting, assessing the risk that a material weakness exists, and testing and evaluating the design and operating effectiveness of internal controlbased on the assessed risk. Our audits also included performing such other procedures as we considered necessary in the circumstances. We believe that our audits provide areasonable basis for our opinions.
Definition and Limitations of Internal Control over Financial Reporting
A company’s internal control over financial reporting is a process designed to provide reasonable assurance regarding the reliability of financial reporting and the preparation offinancial statements for external purposes in accordance with generally accepted accounting principles. A company’s internal control over financial reporting includes thosepolicies and procedures that (i) pertain to the maintenance of records that, in reasonable detail, accurately and fairly reflect the transactions and dispositions of the assets of thecompany; (ii) provide reasonable assurance that transactions are recorded as necessary to permit preparation of financial statements in accordance with generally acceptedaccounting principles, and that receipts and expenditures of the company are being made only in accordance with authorizations of management and directors of the company;and (iii) provide reasonable assurance regarding prevention or timely detection of unauthorized acquisition, use, or disposition of the company’s assets that could have amaterial effect on the financial statements.
27
Because of its inherent limitations, internal control over financial reporting may not prevent or detect misstatements. Also, projections of any evaluation of effectiveness tofuture periods are subject to the risk that controls may become inadequate because of changes in conditions, or that the degree of compliance with the policies or proceduresmay deteriorate.
Critical Audit Matters
The critical audit matter communicated below is a matter arising from the current period audit of the consolidated financial statements that was communicated or required to becommunicated to the audit committee and that (i) relates to accounts or disclosures that are material to the consolidated financial statements and (ii) involved our especiallychallenging, subjective, or complex judgments. The communication of critical audit matters does not alter in any way our opinion on the consolidated financial statements, takenas a whole, and we are not, by communicating the critical audit matter below, providing a separate opinion on the critical audit matter or on the accounts or disclosures to whichit relates.
Goodwill Impairment Assessment - Cortland U.S. Reporting Unit
As described in Notes 1 and 6 to the consolidated financial statements, the Company’s consolidated goodwill balance was $260.4 million as of August 31, 2019, and thegoodwill associated with the Other segment was $17.5 million, which includes the Cortland U.S. reporting unit. Management tests goodwill for impairment annually, during thefourth quarter, or more frequently if events or changes in circumstances indicate that goodwill might be impaired. If the carrying value of a reporting unit exceeds its fair value,an impairment loss is recorded. In estimating fair value, management utilizes a discounted cash flow model, which is dependent on a number of assumptions includingforecasted revenues, operating profit margins, and the weighted average costs of capital.
The principal considerations for our determination that performing procedures relating to the goodwill impairment assessment of the Cortland U.S. reporting unit is a criticalaudit matter are there was significant judgment by management when developing the fair value measurement of the reporting unit. This in turn led to a high degree of auditorjudgment, subjectivity, and effort in performing procedures and evaluating management’s significant assumptions, including the forecasted revenues, operating profit margins,and weighted average costs of capital. In addition, the audit effort involved the use of professionals with specialized skill and knowledge to assist in performing theseprocedures and evaluating the audit evidence obtained from these procedures.
Addressing the matter involved performing procedures and evaluating audit evidence in connection with forming our overall opinion on the consolidated financial statements.These procedures included testing the effectiveness of controls relating to management’s goodwill impairment assessment, including controls over the valuation of theCompany’s reporting unit. These procedures also included, among others, testing management’s process for developing the fair value estimate; evaluating the appropriateness ofthe discounted cash flow model; testing the completeness, accuracy, and relevance of underlying data used in the model; and evaluating the reasonableness of significantassumptions used by management, including the forecasted revenues, operating profit margins, and weighted average costs of capital. Evaluating management’s assumptionsrelated to the forecasted revenues and operating profit margins involved evaluating whether the assumptions used by management were reasonable considering (i) the currentand past performance of the reporting unit, (ii) the consistency with external market and industry data, and (iii) whether these assumptions were consistent with evidenceobtained in other areas of the audit. Professionals with specialized skill and knowledge were used to assist in the evaluation of the Company’s discounted cash flow model, andcertain significant assumptions, including the weighted average cost of capital.
/s/ PricewaterhouseCoopers LLP
Milwaukee, WisconsinOctober 28, 2019
We have served as the Company’s auditor since 1997.
28

ACTUANT CORPORATIONCONSOLIDATED STATEMENTS OF OPERATIONS
(in thousands, except per share amounts)
Year Ended August 31,
2019 2018 2017
Net sales Product 478,946 489,623 460,390Service & rental 175,812 151,680 156,201
Total net sales 654,758 641,303 616,591Cost of products sold
Product 247,771 264,878 261,888Service & rental 114,335 93,141 94,333
Total cost of products sold 362,106 358,019 356,221Gross profit 292,652 283,284 260,370
Selling, administrative and engineering expenses 209,231 210,256 208,128Amortization of intangible assets 8,922 9,280 9,097Director & officer transition charges — — 7,784Restructuring charges 4,156 10,555 3,234Impairment & divestiture charges 22,827 2,987 116,979
Operating profit (loss) 47,516 50,206 (84,852)Financing costs, net 28,163 30,872 29,221Other expense, net 629 138 3,816
Earnings (loss) before income tax expense (benefit) 18,724 19,196 (117,889)Income tax expense (benefit) 10,657 14,450 (22,614)
Net earnings (loss) from continuing operations 8,067 4,746 (95,275)(Loss) earnings from discontinued operations, net of income taxes (257,212) (26,394) 29,062Net loss (249,145) (21,648) (66,213)
Earnings (loss) per share from continuing operations Basic $ 0.13 $ 0.08 $ (1.60)Diluted $ 0.13 $ 0.08 $ (1.60)
(Loss) earnings per share from discontinued operations Basic (4.21) (0.44) 0.49Diluted (4.18) (0.43) 0.49
Loss per share Basic (4.07) (0.36) (1.11)Diluted (4.04) (0.35) (1.11)
Weighted average common shares outstanding Basic 61,151 60,441 59,436Diluted 61,607 61,028 59,436
The accompanying notes are an integral part of these consolidated financial statements.
29
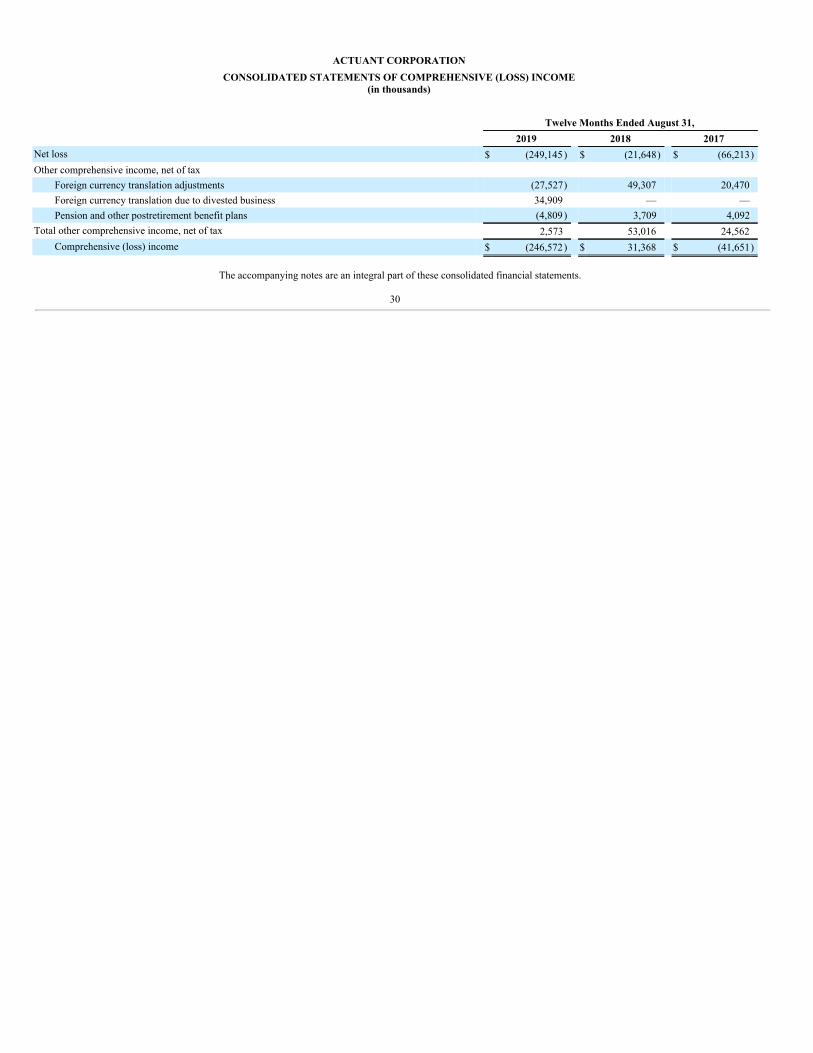
ACTUANT CORPORATIONCONSOLIDATED STATEMENTS OF COMPREHENSIVE (LOSS) INCOME
(in thousands)
Twelve Months Ended August 31, 2019 2018 2017Net loss $ (249,145) $ (21,648) $ (66,213)Other comprehensive income, net of tax
Foreign currency translation adjustments (27,527) 49,307 20,470Foreign currency translation due to divested business 34,909 — —Pension and other postretirement benefit plans (4,809) 3,709 4,092
Total other comprehensive income, net of tax 2,573 53,016 24,562Comprehensive (loss) income $ (246,572) $ 31,368 $ (41,651)
The accompanying notes are an integral part of these consolidated financial statements.
30

ACTUANT CORPORATIONCONSOLIDATED BALANCE SHEETS
(in thousands, except share and per share amounts)
August 31,
2019 2018A S S E T S
Current assets Cash and cash equivalents $ 211,151 $ 250,490Accounts receivable, net 125,883 123,261Inventories, net 77,187 72,020Assets from discontinued operations 285,578 568,933Other current assets 30,526 32,529
Total current assets 730,325 1,047,233Property, plant and equipment, net 56,729 54,974Goodwill 260,415 280,132Other intangible assets, net 52,375 71,657Other long-term assets 24,430 31,221
Total assets $ 1,124,274 $ 1,485,217
L I A B I L I T I E S A N D S H A R E H O L D E R S’ E Q U I T Y
Current Liabilities Trade accounts payable $ 76,914 $ 69,584Accrued compensation and benefits 26,421 35,992Current maturities of debt 7,500 30,000Income taxes payable 4,838 4,091Liabilities from discontinued operations 143,763 160,573Other current liabilities 40,965 53,768
Total current liabilities 300,401 354,008Long-term debt, net 452,945 502,695Deferred income taxes 1,564 3,947Pension and postretirement benefit liabilities 20,213 13,957Other long-term liabilities 47,972 51,898
Total liabilities 823,095 926,505Commitments and contingencies (Note 16) Shareholders’ equity
Class A common stock, $0.20 par value per share, authorized 168,000,000 shares, issued 81,920,679 and 81,423,584 shares,respectively 16,384 16,285Additional paid-in capital 181,213 167,448Treasury stock, at cost, 21,455,568 and 20,439,434 shares, respectively (640,212) (617,731)Retained earnings 915,466 1,166,955Accumulated other comprehensive loss (171,672) (174,245)Stock held in trust (3,070) (2,450)Deferred compensation liability 3,070 2,450
Total shareholders' equity 301,179 558,712Total liabilities and shareholders' equity $ 1,124,274 $ 1,485,217
The accompanying notes are an integral part of these consolidated financial statements.
31

ACTUANT CORPORATIONCONSOLIDATED STATEMENTS OF CASH FLOWS
(in thousands)
Year Ended August 31,
2019 2018 2017Operating Activities
Net loss $ (249,145) $ (21,648) $ (66,213)Less: Net (loss) earnings from discontinued operations (257,212) (26,394) 29,062
Net earnings (loss) from continuing operations 8,067 4,746 (95,275)Adjustments to reconcile net earnings to net cash provided by operating activities - continuing operations:
Impairment & divestiture charges, net of tax effect 20,930 12,385 108,860Depreciation and amortization 20,217 20,405 22,925Stock-based compensation expense 10,882 11,333 14,939Provision (benefit) for deferred income taxes 3,955 5,588 (8,706)Amortization of debt issuance costs 1,200 2,399 1,657Other non-cash adjustments 405 285 505
Changes in components of working capital and other, excluding acquisitions and divestitures: Accounts receivable (4,993) (7,462) 11,230Inventories (7,760) (1,142) (4,502)Trade accounts payable 6,858 (1,872) 3,128Prepaid expenses and other assets 5,269 (3,868) (5,026)Income tax accounts (913) 17,354 (5,085)Accrued compensation and benefits (8,368) 1,609 283Other accrued liabilities (14,846) 10,156 3,159
Cash provided by operating activities - continuing operations 40,903 71,916 48,092Cash provided by operating activities - discontinued operations 12,942 34,177 40,407
Cash provided by operating activities 53,845 106,093 88,499 Investing Activities
Capital expenditures (14,923) (11,021) (17,238)Proceeds from sale of property, plant and equipment 1,462 104 448Rental asset buyout for Viking divestiture — (27,718) —Proceeds from sale of business, net of transaction costs — 8,902 —Cash paid for business acquisitions, net of cash acquired — (23,218) —
Cash used in investing activities - continuing operations (13,461) (52,951) (16,790)Cash provided by (used in) investing activities - discontinued operations 24,507 (9,800) (10,835)
Cash provided by (used in) investing activities 11,046 (62,751) (27,625) Financing Activities
Payment for redemption of term loan (200,000) — —Proceeds from issuance of term loan 200,000 — —Principal repayments on term loan (72,500) (30,000) (18,750)Redemption of 5.625% senior notes — — (500)Purchase of treasury shares (22,481) — —Taxes paid related to the net share settlement of equity awards (1,872) (1,284) (1,065)Stock option exercises & other 1,900 15,681 8,265Payment of cash dividend (2,439) (2,390) (2,358)Payment of debt issuance costs (2,125) — —
Cash used in financing activities - continuing operations (99,517) (17,993) (14,408)Cash used in financing activities - discontinued operations — — (742)
Cash used in financing activities (99,517) (17,993) (15,150) Effect of exchange rate changes on cash (4,713) (4,430) 4,243Net (decrease) increase in cash and cash equivalents (39,339) 20,919 49,967Cash and cash equivalents - beginning of period 250,490 229,571 179,604Cash and cash equivalents - end of period $ 211,151 $ 250,490 $ 229,571
The accompanying notes are an integral part of these consolidated financial statements.
32

ACTUANT CORPORATION
CONSOLIDATED STATEMENTS OF SHAREHOLDERS’ EQUITY(in thousands)
Common Stock Additional
Paid-inCapital
TreasuryStock
RetainedEarnings
AccumulatedOther
ComprehensiveLoss
StockHeld inTrust
DeferredCompensation
Liability
TotalShareholders’
Equity IssuedShares Amount
Balance at August 31, 2016 79,393 $ 15,879 $ 114,980 $(617,731) $1,259,645 $ (251,823) $ (2,646) $ 2,646 $ 520,950Net loss — — — — (66,213) — — — (66,213)Other comprehensive income, net of tax — — — — — 24,562 — — 24,562Stock contribution to employee benefitplans and other 17 3 890 — — — — — 893Restricted stock awards 397 79 (79) — — — — — —Cash dividend ($0.04 per share) — — — — (2,390) — — — (2,390)Stock based compensation expense — — 16,733 — — — — — 16,733Stock option exercises 374 75 7,687 — — — — — 7,762Tax effect of stock option exercises andrestricted stock vesting — — (2,042) — — — — — (2,042)Stock issued to, acquired for anddistributed from rabbi trust 19 4 280 — — — (50) 50 284
Balance at August 31, 2017 80,200 16,040 138,449 (617,731) 1,191,042 (227,261) (2,696) 2,696 500,539Net loss — — — — (21,648) — — — (21,648)Other comprehensive income, net of tax — — — — — 53,016 — — 53,016Stock contribution to employee benefitplans and other 20 4 535 — — — — — 539Restricted stock awards 400 80 (80) — — — — — —Cash dividend ($0.04 per share) — — — — (2,439) — — — (2,439)Stock based compensation expense — — 14,457 — — — — — 14,457Stock option exercises 780 156 14,984 — — — — — 15,140Tax effect related to net share settlementof equity awards — — (1,281) — — — — — (1,281)Stock issued to, acquired for anddistributed from rabbi trust 25 5 384 — — — 246 (246) 389
Balance at August 31, 2018 81,424 16,285 167,448 (617,731) 1,166,955 (174,245) (2,450) 2,450 558,712Net loss — — — — (249,145) — — — (249,145)
Other comprehensive income, net of tax — — — — — 2,573 — — 2,573Stock contribution to employee benefitplans and other 20 4 492 — — — — — 496Restricted stock awards 375 75 (75) — — — — — —Cash dividend ($0.04 per share) — — — — (2,419) — — — (2,419)Treasury stock repurchases — — — (22,481) — — — — (22,481)Stock based compensation expense — — 13,318 — — — — — 13,318Stock option exercises 65 13 1,391 — — — — — 1,404Tax effect related to net share settlementof equity awards — — (1,872) — — — — — (1,872)Stock issued to, acquired for anddistributed from rabbi trust 35 7 511 — — — (620) 620 518Adoption of accounting standard (Note 1) — — — — 75 — — — 75
Balance at August 31, 2019 81,919 $ 16,384 $ 181,213 $(640,212) $ 915,466 $ (171,672) $ (3,070) $ 3,070 $ 301,179
The accompanying notes are an integral part of these consolidated financial statements.
33

Table of Contents
ACTUANT CORPORATION
NOTES TO CONSOLIDATED FINANCIAL STATEMENTS
Note 1. Summary of Significant Accounting Policies
Nature of Operations: Actuant Corporation, doing business as Enerpac Tool Group (“Actuant” or the “Company”), is a global manufacturer of a broad range of industrialproducts and solutions, organized into three operating segments. The Industrial Tools & Services segment ("IT&S"), the Company's only reportable segment, is primarilyengaged in the design, manufacture and distribution of branded hydraulic and mechanical tools and in providing services and tool rental to the industrial, maintenance,infrastructure, oil & gas, energy and other markets.
Consolidation and Presentation: The consolidated financial statements include the accounts of the Company and its subsidiaries, all of which are wholly owned. Theresults of companies acquired or disposed of during the year are included in the consolidated financial statements from the effective date of acquisition or until the date ofdivestiture. All intercompany balances, transactions and profits have been eliminated in consolidation. Certain prior year amounts have been reclassified to conform to currentyear presentation, as discussed in the New Accounting Pronouncements section.
During the fourth quarter of fiscal 2019, the Company’s financial reporting segments were modified to reflect changes in our reporting structure as a result of entering intoa Securities Purchase Agreement ("SPA") to sell the remaining businesses within our legacy Engineered Components & Systems segment exclusive of Cortland U.S. TheCompany now has three operating segments; Industrial Tools & Services ("IT&S"), Other, and Engineered Components and Systems ("EC&S"). The IT&S segment remainsunchanged from our previous segment structure and represents the only reportable segment. All prior period disclosures have been adjusted to reflect the one reportablesegment. The IT&S reportable segment is primarily engaged in the design, manufacture and distribution of branded hydraulic and mechanical tools as well as providing servicesand tool rentals to the industrial, maintenance, infrastructure, oil & gas, energy and other markets. The Other operating segment is comprised of Cortland U.S., along with theViking business which was divested on the first day of the second quarter of fiscal 2018. These two operating segments represent continuing operations within our consolidatedfinancial statements. The EC&S segment, after the change in reporting structure, represents the businesses currently subject to the SPA with an anticipated closure date in thefourth calendar quarter of 2019, as well as the Cortland Fibron and Precision Hayes International ("PHI") businesses which were divested in fiscal 2019. As the pendingdivestiture of the remaining businesses within the EC&S segment in combination with the divestiture of Cortland Fibron and PHI represent a strategic shift in our operations, theresults of operations for the EC&S segment are classified in "(Loss) earnings from discontinued operations" within the Consolidated Statements of Operations for all periodspresented. In addition, the Consolidated Balance Sheets have been recast such that the assets and liabilities of the EC&S segment are classified as "Assets from discontinuedoperations" and "Liabilities from discontinued operations", respectively, for both periods presented. Furthermore, all disclosures within these footnotes to the financialstatements have also been recast to coincide with our updated segmentation.
Cash Equivalents: The Company considers all highly liquid investments with original maturities of 90 days or less to be cash equivalents.
Inventories: Inventories are comprised of material, direct labor and manufacturing overhead, and are stated at the lower of cost or market. Inventory cost is determinedusing the last-in, first-out (“LIFO”) method for a portion of the U.S. owned inventory (47.9% and 40.7% of total inventories in 2019 and 2018, respectively). The first-in, first-out or average cost methods are used for all other inventories. If the LIFO method were not used, inventory balances would be higher than reported amounts in the consolidatedbalance sheets by $10.3 million and $5.4 million at August 31, 2019 and 2018, respectively.
The nature of the Company’s products is such that they generally have a very short production cycle. Consequently, the amount of work-in-process at any point in time isminimal. In addition, many parts or components are ultimately either sold individually or assembled with other parts making a distinction between raw materials and finishedgoods impractical to determine. Certain locations maintain and manage their inventories using a job cost system where the distinction of categories of inventory by state ofcompletion is also not available. As a result of these factors, it is neither practical nor cost effective to segregate the amounts of raw materials, work-in-process or finished goodsinventories at the respective balance sheet dates, as segregation would only be possible as the result of physical inventories which are taken at dates different from the balancesheet dates.
Property, Plant and Equipment: Property, plant and equipment are stated at cost. Plant and equipment are depreciated on a straight-line basis over the estimated usefullives of the assets, ranging from ten to forty years for buildings and improvements and two to fifteen years for machinery and equipment. Equipment includes assets (jointintegrity tools) which are rented to customers of our IT&S segment. Leasehold improvements are amortized over the life of the related asset or the term of the lease, whicheveris shorter. Depreciation expense was $11.3 million, $11.1 million and $13.8 million for the years ended August
34

ACTUANT CORPORATIONNOTES TO CONSOLIDATED FINANCIAL STATEMENTS-(Continued)
31, 2019, 2018 and 2017, respectively. The following is a summary of the Company's components of property, plant and equipment (in thousands):
August 31, 2019 August 31, 2018Land, buildings and improvements $ 29,661 $ 30,296Machinery and equipment 140,083 131,716
Gross property, plant and equipment 169,744 162,012Less: Accumulated depreciation (113,015 ) (107,038 )
Property, plant and equipment, net $ 56,729 $ 54,974
Goodwill and Other Intangible Assets: Goodwill and other intangible assets with indefinite lives are not subject to amortization, but are subject to annual impairmenttesting. Other intangible assets with definite lives, consisting primarily of purchased customer relationships, patents, trademarks and non-compete agreements, are amortizedover periods from one to twenty-five years.
The Company’s goodwill is tested for impairment annually, during the fourth quarter, or more frequently if events or changes in circumstances indicate that goodwillmight be impaired. The Company performs impairment reviews for its reporting units using a fair value method based on management’s judgments and assumptions. Inestimating the fair value, the Company utilizes a discounted cash flow model, which is dependent on a number of assumptions, most significantly forecasted revenues andoperating profit margins, and the weighted average cost of capital. The estimated fair value of the reporting unit is compared to the carrying amount of the reporting unit,including goodwill. If the carrying value of the reporting unit exceeds its fair value, an impairment loss is recorded and should not exceed the total amount of the goodwillallocated to the reporting unit. Indefinite lived intangible assets are also subject to an annual impairment test. On an annual basis, or more frequently if events or changes incircumstances indicate that the asset might be impaired, the fair value of the indefinite-lived intangible assets are evaluated by the Company to determine if an impairmentcharge is required. A considerable amount of management judgment is required in performing impairment tests, principally in determining the fair value of each reporting unitand the indefinite lived intangible assets.
Product Warranty Costs: The Company generally offers its customers an assurance warranty on products sold, although warranty periods may vary by product type andapplication. The reserve for future warranty claims, which is recorded within the "Other current liabilities" line on the Consolidated Balance Sheets, is based on historical claimrates and current warranty cost experience. The following is a rollforward of the changes in product warranty reserves for fiscal years 2019 and 2018 (in thousands):
2019 2018Beginning balance $ 931 $ 1,353Provision for warranties 1,326 962Warranty payments and costs incurred (1,077) (1,388)Impact of changes in foreign currency rates (35) 4
Ending balance $ 1,145 $ 931
Revenue from Contracts with Customers: The Company recognizes revenue when it satisfies a performance obligation in a contract by transferring control of a distinctgood or service to a customer. A contract’s transaction price is allocated to each distinct performance obligation and revenue is measured based on the consideration that theCompany expects to be entitled to in exchange for the goods or services transferred. When contracts include multiple products or services to be delivered to the customer, theconsideration for each element is generally allocated on the standalone transaction prices of the separate performance obligations, using the adjusted market assessmentapproach.
Under normal circumstances, the Company invoices the customer once transfer of control has occurred and has a right to payment. The typical payment terms vary basedon the customer and the types of goods and services in the contract. The period of time between invoicing and when payment is due is not significant, as our standard paymentterms are less than one year. Amounts billed and due from customers are classified as receivables on the balance sheet.
Customer sales are recorded net of allowances for returns and discounts, which are recognized as a deduction from sales at the time of sale. The Company commits to one-time or on-going trade discounts and promotions with customers that require the Company to estimate and accrue the ultimate costs of such programs.The Company generallydoes not require collateral or
35

ACTUANT CORPORATIONNOTES TO CONSOLIDATED FINANCIAL STATEMENTS-(Continued)
other security for receivables and provides for an allowance for doubtful accounts based on historical experience and a review of its existing receivables. Accounts receivableare stated net of an allowance for doubtful accounts of $5.1 million and $5.0 million at August 31, 2019 and 2018, respectively.
Taxes Collected: Taxes collected by the Company from a customer concurrent with revenue-producing activities are excluded from "Net sales" within the ConsolidatedStatements of Operations.
Shipping and Handling Costs: The Company records costs associated with shipping its products after control over a product has transferred to a customer and areaccounted for as fulfillment costs. These costs are reported in the Consolidated Statements of Operations in "Cost of products sold."
Research and Development Costs: Research and development costs consist primarily of an allocation of overall engineering and development resources and are expensedas incurred. Such costs incurred in the development of new products or significant improvements to existing products were $9.3 million, $8.7 million and $8.9 million in fiscal2019, 2018 and 2017, respectively. The Company also incurs significant costs in connection with fulfilling custom orders and developing solutions for unique customer needswhich are not included in these research and development expense totals.
Other Income/Expense: Other income and expense primarily consists of net foreign currency exchange transaction losses of $0.2 million and $3.6 million in fiscal 2019and 2017, respectively, with a gain of less than $0.1 million in fiscal 2018.
Financing Costs: Financing costs represent interest expense, financing fees and amortization of debt issuance costs, net of interest income. Interest income was $0.7million for fiscal 2019 and $1.2 million for both fiscal 2018 and 2017.
Income Taxes: The provision for income taxes includes federal, state, local and non-U.S. taxes on income. Tax credits, primarily for non-U.S. earnings, are recognized asa reduction of the provision for income taxes in the year in which they are available for U.S. tax purposes. Deferred taxes are provided on temporary differences between assetsand liabilities for financial and tax reporting purposes as measured by enacted tax rates expected to apply when temporary differences are settled or realized. Future tax benefitsare recognized to the extent that realization of those benefits is considered to be more likely than not. A valuation allowance is established for deferred tax assets for whichrealization is not more likely than not of being realized. The Company has not provided for any residual U.S. income taxes on unremitted earnings of non-U.S. subsidiaries, assuch earnings are intended to be indefinitely reinvested. The Company recognizes interest and penalties related to unrecognized tax benefits in income tax expense.
Foreign Currency Translation: The financial statements of the Company’s foreign operations are translated into U.S. dollars using the exchange rate at each balance sheetdate for assets and liabilities and an appropriate weighted average exchange rate for each applicable period within the Consolidated Statements of Operations. Translationadjustments are reflected in the Consolidated Balance Sheets and Consolidated Statements of Shareholders' Equity caption “Accumulated other comprehensive loss.”
Accumulated Other Comprehensive Loss: The following is a summary of the components included within accumulated other comprehensive loss (in thousands):
August 31,
2019 2018Foreign currency translation adjustments $ 151,115 $ 158,497Pension and other postretirement benefit plans, net of tax 20,557 15,748
Accumulated other comprehensive loss $ 171,672 $ 174,245
Use of Estimates: The preparation of financial statements in conformity with GAAP requires management to make estimates and assumptions that affect the reportedamounts of assets and liabilities, the disclosure of contingent assets and liabilities at the date of the financial statements, and the reported amounts of revenues and expensesduring the reporting periods. The Company regularly evaluates the estimates and assumptions related to the allowance for doubtful accounts, inventory valuation, warrantyreserves, fair value of stock-based awards, goodwill, intangible and long-lived asset valuations, employee benefit plan liabilities, over time revenue recognition, income taxliabilities, deferred tax assets and related valuation allowances, uncertain tax positions, restructuring reserves, and litigation and other loss contingencies. Actual results coulddiffer materially and adversely from those estimates and assumptions, and such results could materially affect the Company’s consolidated net income, financial position, orcash flows.
36

ACTUANT CORPORATIONNOTES TO CONSOLIDATED FINANCIAL STATEMENTS-(Continued)
With the divestiture of the EC&S segment the Company now meets the threshold requirements of Regulation S-X 5-03(1) to breakout sales and cost of sales by variouscategories on the Statements of Operations. The Company manages the profitability of its product and service & rental categories on a combined basis given the complexity ofthe business model. This model includes providing integrated product and service solutions resulting in facilities that generate revenues from both product and service & rentalcategories, which also have significant indirect and facility overhead costs included in cost of sales. As such, significant judgment and estimates are required to disaggregateproduct and service & rental cost of sales including allocating indirect and facility overhead costs between cost of product sales and the cost of service & rental sales. Changes inthese judgments and estimates could materially change the allocation of the indirect and facility overhead costs to the different sales categories and the resulting ratio of cost ofsales to net sales by category. Because the sales mix heavily favors the product category, a change in the mix of cost of sales between the sales categories would have a moresignificant impact on the ratio of cost of sales to net sales for the service & rental category. In addition, due to the recent changes in our business model, which includes theintegration of the Enerpac and Hydratight businesses within the IT&S segment, the decision to exit certain non-strategic businesses and product lines, and the restructuringactions taken by the Company, the historical ratios of cost of sales to net sales by category may not be indicative of future ratios of cost of sales to net sales by category.
Subsequent Events: Subsequent to August 31, 2019, the Company divested certain assets and liabilities of two non-core product lines for cash proceeds of $8.5 million.
New Accounting Pronouncements
In May 2014, the FASB issued ASU 2014-09, Revenue from Contracts with Customers. Under ASU 2014-09 and subsequent updates included in ASU 2016-10, ASU2016-12, ASU 2017-13 and ASU 2017-14 (collectively referred to as Accounting Standards Codification 606 “ASC 606”), an entity will recognize revenue when it transferspromised goods or services to customers in an amount that reflects what it expects to receive in exchange for the goods or services. It also requires more detailed disclosures toenable users of financial statements to understand the nature, amount, timing, and uncertainty of revenue and cash flows arising from contracts with customers. This guidancewas adopted by the Company on September 1, 2018 using the modified retrospective method and was applied to contracts that were not completed or substantially complete asof September 1, 2018. Results for the reporting period beginning after September 1, 2018 are presented under ASC 606, while prior year amounts have not been adjusted andcontinue to be reported in accordance with the Company’s historical accounting policy in accordance with ASC 605 Revenue Recognition. The Company reported a net increaseto opening retained earnings of $0.1 million on September 1, 2018 as a result of the cumulative impact of adopting ASC 606. See Note 2, “Revenue from Contracts withCustomers,” for further discussion of the adoption of ASC 606.
In March 2017, the FASB issued ASU 2017-07, Compensation-Retirement Benefits (Topic 715): Improving the Presentation of Net Periodic Pension Cost and NetPeriodic Postretirement Benefit Cost, which changes how employers that sponsor defined benefit pension or other postretirement benefit plans present the net periodic benefitcost in the income statement. The new guidance requires the service cost component of net periodic benefit cost to be presented in the same income statement line items as otheremployee compensation costs arising from services rendered during the period. Other components of the net periodic benefit cost are to be stated separately from service costand outside of operating income. This guidance was adopted by the Company on September 1, 2018. Due to a majority of the Company's defined benefit pension and otherpostretirement benefit plans being frozen and the net periodic benefit pension cost not being significant, the adoption of this guidance did not have a material impact on thefinancial statements of the Company. However, prior year amounts have been retrospectively adjusted to reflect this change in accounting principle.
In August 2016, the FASB issued ASU 2016‑15, Statement of Cash Flows (Topic 230), Classification of Certain Cash Receipts and Cash Payments, to address howcertain cash receipts and cash payments are presented and classified in the statement of cash flows. This update addresses eight specific cash flow issues with the objective ofreducing the existing diversity in practice. This guidance was adopted on September 1, 2018. The adoption did not have an impact on the financial statements of the Company.
In February 2016, the FASB issued ASU 2016-02, Leases (and subsequently ASU 2018-01 and ASU 2019-01), to increase transparency and comparability amongorganizations by recognizing all lease transactions on the balance sheet as a lease liability and a right-of-use asset. This guidance is effective for fiscal years beginning afterDecember 15, 2018 including interim periods within those fiscal years. The Company will adopt this standard in the first quarter of fiscal year ending November 30, 2019 (fiscal2020) using a modified retrospective approach and through implementing selected third-party lease software utilized as a central repository for all leases. We will make certainelections including the package of practical expedients allowing us to not reassess whether any expired or existing contracts contain leases, the lease classification for anyexpired or
37

ACTUANT CORPORATIONNOTES TO CONSOLIDATED FINANCIAL STATEMENTS-(Continued)
existing leases, and initial direct costs for any existing leases. In addition, we will elect not to recognize right of use (“ROU”) assets or lease liabilities for leases containingterms of 12 months or less, and the Company will elect to not separate lease components from non-lease components for all asset classes. As of September 1, 2019, theCompany anticipates additions to the balance sheet of right-of-use assets, offset by the associated liabilities, of approximately $55 million to $65 million. We do not expectadoption to have a significant impact on our consolidated statements of operations or consolidated statements of cash flows. The Company is finalizing its accounting policies,controls, processes, and disclosures that will change as a result of adopting the new standard.
In addition, as a result of sale leaseback transactions in previous years for which gains were deferred which under the new standard would have been recognized, theCompany will record an increase to retained earnings of $0.2 million in the first quarter of fiscal 2020 which represents the recognition of these previously deferred gains.
In February 2018, the FASB issued ASU 2018-02, Income Statement-Reporting Comprehensive Income (Topic 220): Reclassification of Certain Tax Effects from AccumulatedOther Comprehensive Income, which allows companies to reclassify stranded income tax effects resulting from the Tax Cuts and Jobs Act from accumulated othercomprehensive income to retained earnings in their consolidated financial statements. This guidance is effective for fiscal years beginning after December 15, 2018 (fiscal 2020for the Company), including interim periods within those fiscal years. The Company will adopt the guidance in the first quarter of fiscal 2020 which will result in an increase toretained earnings with an offsetting increase in accumulated other comprehensive loss of $3.5 million.
Note 2. Revenue from Contracts with Customers
Nature of Goods and Services
The Company generates its revenue under two principal activities, which are discussed below:
Product Sales: Sales of tools, heavy-lifting solutions, and rope and cable solutions are recorded when control is transferred to the customer (i.e. performance obligationhas been satisfied). For the majority of the Company’s product sales, revenue is recognized at a point in time when control of the product is transferred to the customer, whichgenerally occurs when the product is shipped from the Company to the customer. Due to the highly customized nature and limited alternative use of certain products, for whichthe Company has an enforceable right of reimbursement for performance completed to date, revenue is recognized over time. We consider the input measure (efforts-expendedor cost-to-cost) or output measure as a fair measure of progress for the recognition of over time revenue associated with these custom products. For a majority of the Company’scustom products, machine hours and labor hours (efforts-expended measurement) are used as a measure of progress.
Service & Rental Sales: Service contracts consist of providing highly trained technicians to perform bolting, technical services, machining and joint integrity work for ourcustomers. These revenues are recognized over time as our customers simultaneously receive and consume the benefits provided by the Company. We consider the inputmeasure (efforts-expended or cost-to-cost) or output measure as a fair measure of progress for the recognition of over time revenue associated with service contracts. For amajority of the Company’s service contracts, labor hours (efforts-expended measurement) is used as the measure of progress when it is determined to be a better depiction of thetransfer of control to the customer due to the timing and pattern of labor hours incurred. Revenue from rental contracts (less than a year and non-customized products) isgenerally recognized ratably over the contract term, depicting the customer’s consumption of the benefit related to the rental equipment.
Disaggregated Revenue and Performance Obligations
The Company disaggregates revenue from contracts with customers by reportable segment and product line and by the timing of when goods and services are transferred.See Note 15, "Business Segment, Geographic and Customer Information" for information regarding our revenue disaggregation by reportable segment and product line.
The following table presents information regarding revenues disaggregated by the timing of when goods and services are transferred for the fiscal year ended August 31,2019 (in thousands):
Revenues recognized at point in time $ 453,427Revenues recognized over time 201,331
Total $ 654,758
Contract Balances
The Company's contract assets and liabilities are as follows (in thousands):
38

August 31,
2019 2018Receivables, which are included in accounts receivable, net $ 125,883 $ 123,261Contract assets, which are included in other current assets 3,747 6,367Contract liabilities, which are included in other current liabilities 3,707 12,937
Receivables: The Company performs its obligations under a contract with a customer by transferring goods or services in exchange for consideration from the customer.The Company typically invoices its customers as soon as control of an asset is transferred and a receivable for the Company is established.
Contract Assets: Contract assets relate to the Company’s rights to consideration for work completed but not billed as of the reporting date on contracts with customers. Thecontract assets are transferred to receivables when the rights become unconditional. The Company has contract assets on contracts that are generally long-term and haverevenues that are recognized over time. The decrease in this balance from August 31, 2018 to August 31, 2019 is a result of our strategic exit of certain low profit margin, heavylifting solution work that was still in progress as of August 31, 2018.
Contract Liabilities: As of August 31, 2019, the Company had certain contracts where there were unsatisfied performance obligations and the Company had received cashconsideration from customers before the performance obligations were satisfied. The majority of these contracts relate to long-term customer contracts (project durations ofgreater than three months) and are recognized over time. The Company estimates that the $3.7 million will be recognized in net sales from satisfying those performanceobligations within the next twelve months with an immaterial amount recognized in periods thereafter. The decrease in the balance from August 31, 2018 to August 31, 2019was a result of several large contracts that were in their early stages at August 31, 2018 where similar volumes of orders with prepayment terms were not in our backlog atAugust 31, 2019.
Significant Judgments
Timing of Performance Obligations Satisfied at a Point in Time: The Company evaluates when the customer obtains control of the product based on shipping terms, ascontrol will transfer, depending upon such terms, at different points between the Company's manufacturing facility or warehouse and the customer’s location. The Companyconsiders control to have transferred upon shipment or delivery because (i) the Company has a present right to payment at that time; (ii) the legal title has been transferred tothe customer; (iii) the Company has transferred physical possession of the product to the customer; and (iv) the customer has significant risks and rewards of ownership of theproduct.
Variable Consideration: The Company estimates whether it will be subject to variable consideration under the terms of the contract and includes its estimate of variableconsideration in the transaction price based on the expected value method when it is deemed probable of being realized based on historical experience and trends. Types ofvariable consideration may include rebates, incentives and discounts, among others, which are recorded as a reduction to net sales at the time when control of a performanceobligation is transferred to the customer.
Practical Expedients & Exemptions: The Company elected to expense the incremental cost to obtaining a contract when the amortization period for such contracts wouldbe one year or less. The Company does not disclose the value of unperformed obligations for (i) contracts with an original expected length of one year or less and (ii) contractsfor which it recognizes revenue at the amount to which it has the right to invoice for services performed.
Note 3. Restructuring Charges
The Company has undertaken or committed to various restructuring initiatives including workforce reductions; leadership changes; plant consolidations to reducemanufacturing overhead; satellite office closures; the continued movement of production and product sourcing to low-cost alternatives; and the centralization andstandardization of certain administrative functions. Liabilities for severance will generally be paid within twelve months, while future lease payments related to facilitiesvacated as a result of restructuring will be paid over the underlying remaining lease terms. During fiscal 2019, the Company announced a new restructuring plan focused on i)the integration of the Enerpac and Hydratight businesses (IT&S segment), ii) the strategic exit of certain commodity type services in our North America Services operations(IT&S segment) and iii) driving efficiencies within the overall corporate structure. Total restructuring charges associated with this new restructuring plan were $4.2 million forthe year ended August 31, 2019, with no additional charges associated with the previously announced restructuring initiatives.
39

ACTUANT CORPORATIONNOTES TO CONSOLIDATED FINANCIAL STATEMENTS-(Continued)
Total restructuring charges associated with previously announced restructuring initiatives were $11.4 million for the year-ended August 31, 2018 with approximately $0.9million of the restructuring charges recognized for the year ended August 31, 2018 being reported in the Consolidated Statements of Operations in "Cost of products sold," withthe balance of the charges reported in "Restructuring charges." The year ended August 31, 2018 included $2.6 million of restructuring expenses related to Cortland U.S. andViking. Restructuring reserves for Cortland U.S. and Viking (Other Segment) were $0.9 million and $1.9 million for the year ended August 31, 2019 and 2018, respectively.
The following rollforwards summarize restructuring reserve activity for the IT&S reportable segment and corporate (in thousands):
Year Ended August 31, 2018
Industrial Tools & Services Corporate TotalBalance as of August 31, 2017 $ 1,499 $ 232 $ 1,731Restructuring charges 4,286 4,524 8,810Cash payments (3,375 ) (2,483 ) (5,858 )Other non-cash uses of reserve (1) (635 ) (2,227 ) (2,862 )Impact of changes in foreign currency rates (88 ) — (88 )
Balance as of August 31, 2018 $ 1,687 $ 46 $ 1,733(1) Majority of non-cash uses of reserve represents accelerated equity vesting with employee severance agreements.
Year Ended August 31, 2019
Industrial Tools &
Services Corporate TotalBalance as of August 31, 2018 $ 1,687 $ 46 $ 1,733Restructuring charges 4,161 — 4,161Cash payments (2,954 ) (46 ) (3,000 )Other non-cash uses/reclasses of reserve 54 — 54Impact of changes in foreign currency rates (36 ) — (36 )
Balance as of August 31, 2019 $ 2,912 $ — $ 2,912
Note 4. AcquisitionsDuring fiscal 2018, the Company completed two acquisitions which resulted in the recognition of goodwill in the Company’s consolidated financial statements because
their purchase prices reflected the future earnings and cash flow potential of the acquired companies, as well as the complementary strategic fit and resulting synergies. TheCompany makes an initial allocation of the purchase price, at the date of acquisition, based upon the fair value of the acquired assets and assumed liabilities. The Companyobtains this information during due diligence and through other sources. If additional information is obtained about these assets and liabilities within the measurement period(not to exceed one year from the date of acquisition), the Company will refine its estimates of fair value and adjust the purchase price allocation as appropriate.
The Company acquired the stock and certain assets of Mirage Machines, Ltd. ("Mirage") on December 1, 2017 for a purchase price of $17.4 million, net of cash acquired.This IT&S segment tuck-in acquisition is a provider of industrial and energy maintenance tools. The final purchase price allocation resulted in $10.3 million of goodwill (whichis not deductible for tax purposes) and $4.1 million of intangible assets. The intangible assets were comprised of $2.3 million of indefinite-lived tradenames and $1.8 million ofamortizable customer relationships.
The Company acquired the stock of Equalizer International, Limited ("Equalizer") on May 11, 2018 for a purchase price of $5.8 million, net of cash acquired. This IT&Ssegment tuck-in acquisition is a provider of industrial and energy maintenance tools, expanding our pipe and flange alignment offerings. The final purchase price allocationresulted in $2.4 million of goodwill (a portion of which is not deductible for tax purposes) and $2.1 million of intangible assets. The intangible assests were comprised of $0.8million of indefinite lived tradenames and $1.3 million of amortizable customer relationships and patents.
The Company incurred acquisition transaction costs of $1.1 million for the year ended August 31, 2018 (included in "Selling, administrative and engineering expenses" inthe Consolidated Statements of Operations) related to these acquisitions.
The acquired businesses generated combined net sales of $14.1 million and $9.4 million for the year ended August 31, 2019 and 2018, respectively. The acquisitionsindividually and in the aggregate do not meet the significance tests to require pro forma financial information otherwise required for acquisitions.
40

Note 5. Divestiture ActivitiesOn July 9, 2019, as part of our overall strategy to become a pure-play industrial tools and services company, the Company entered into a SPA to divest the remaining
businesses within the EC&S segment at a purchase price of approximately $214.5 million (which includes approximately $3.0 million to be paid in four quarterly installmentsafter closing). At August 31, 2019, the EC&S segment met the criteria for assets held for sale treatment. As a result, the Company recognized impairment & divestiture chargesin fiscal 2019 of $264.5 million which consisted of $210.0 million representing the excess net book value of the net assets over the anticipated sales proceeds less costs to selland $54.5 million representing the recognition in earnings of the cumulative effect of foreign currency exchange losses previously recorded in equity since acquisition.
On December 31, 2018, the Company completed the sale of the PHI business for $23.6 million cash, net of final transaction costs, working capital adjustments, acceleratedvesting of equity compensation, retention bonuses and other adjustments. The Company recorded $9.5 million of impairment & divestiture charges during the fiscal yearrepresenting the excess of the net book value of the assets held for sale less the anticipated proceeds, less costs to sell. During the fourth quarter of fiscal 2018, the Companyrecognized impairment & divestiture charges of $23.7 million relating to the excess of net book value of assets over anticipated proceeds which consisted of i) $17.5 millionrelated to goodwill, ii) $5.0 million related to amortizable intangible assets and ii) $1.2 million related to fixed asset impairment.
The Company also completed the sale of the Cortland Fibron business on December 19, 2018 for $12.5 million in cash. The Company recognized $1.7 million ofimpairment & divestiture charges in fiscal 2019 representing the excess net book value of the net assets less the proceeds from sale, net of transaction costs. Additionally, due tothe business meeting the criteria for asset held for sale treatment at August 31, 2018, the Company recognized impairment & divestiture charges in fiscal 2018 of $46.3 millionwhich consisted of i) $35.3 million related to the recognition in earnings of the cumulative effect of foreign currency rate changes since acquisition; ii) $10.5 millionrepresenting the excess of the net book value of assets held for sale to the anticipated proceeds and iii) $0.5 million of other divestiture charges.
As the aforementioned divestitures were a part of our strategic shift to become a pure-play industrial tools and services company, the results of their operations (includingthe stated impairment & divestiture charges) are recorded as a component of "(Loss) earnings from discontinued operations" in the Consolidated Statements of Operations forall periods presented. In addition, their assets and liabilities are recorded as "Assets from discontinued operations" and "Liabilities from discontinued operations", respectively,within the Consolidated Balance Sheets for each period presented.
The following is a summary of the assets and liabilities of discontinued operations (in thousands):
August 31,
2019 2018Accounts receivable, net $ 52,802 $ 67,412Inventories, net 76,825 86,933Other current assets 8,058 13,467Property, plant & equipment, net 32,172 37,432Goodwill 16,862 233,779Other intangible assets, net 93,314 120,344Other long-term assets 5,545 9,566
Assets of discontinued operations $ 285,578 $ 568,933
Trade accounts payable $ 43,628 $ 65,169Accrued compensation and benefits 12,101 19,930Reserve for cumulative translation adjustment 54,469 35,346Other current liabilities 12,101 14,800Deferred income taxes 20,029 24,145Pension and postretirement benefit liabilities 1,344 912Other long-term liabilities 91 271
Liabilities of discontinued operations $ 143,763 $ 160,573
41
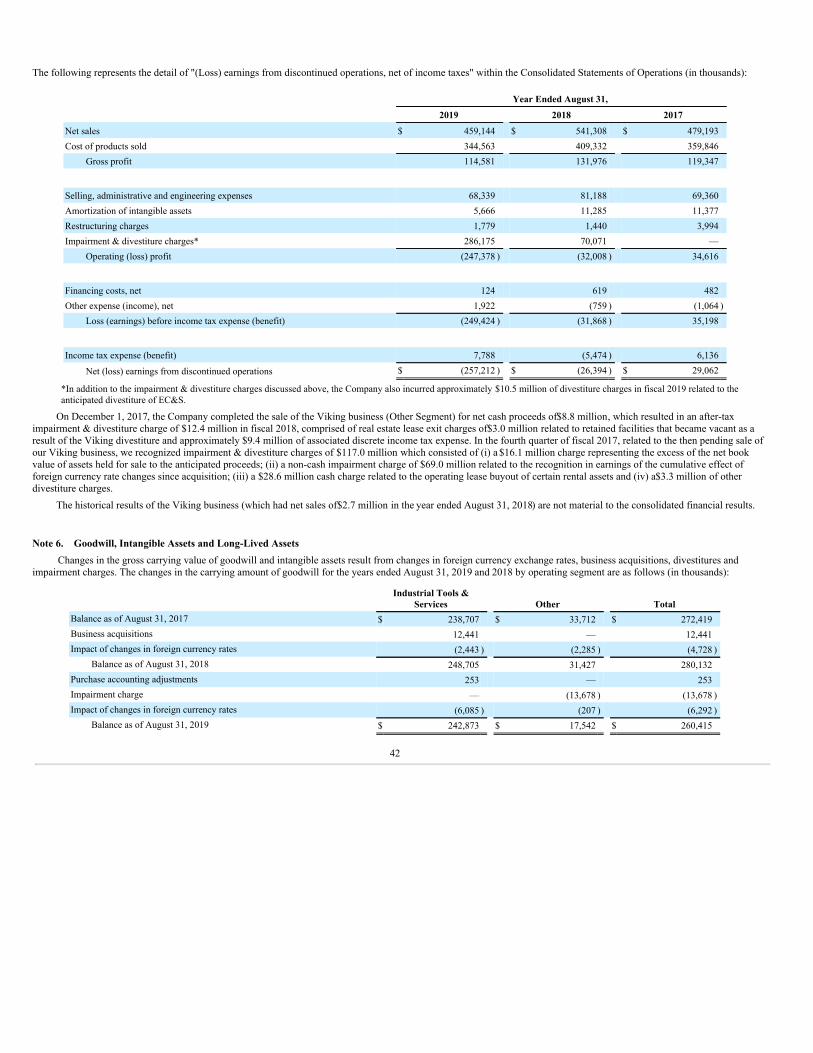
The following represents the detail of "(Loss) earnings from discontinued operations, net of income taxes" within the Consolidated Statements of Operations (in thousands):
Year Ended August 31,
2019 2018 2017
Net sales $ 459,144 $ 541,308 $ 479,193Cost of products sold 344,563 409,332 359,846
Gross profit 114,581 131,976 119,347
Selling, administrative and engineering expenses 68,339 81,188 69,360Amortization of intangible assets 5,666 11,285 11,377Restructuring charges 1,779 1,440 3,994Impairment & divestiture charges* 286,175 70,071 —
Operating (loss) profit (247,378 ) (32,008 ) 34,616
Financing costs, net 124 619 482Other expense (income), net 1,922 (759 ) (1,064 )
Loss (earnings) before income tax expense (benefit) (249,424 ) (31,868 ) 35,198
Income tax expense (benefit) 7,788 (5,474 ) 6,136
Net (loss) earnings from discontinued operations $ (257,212 ) $ (26,394 ) $ 29,062
*In addition to the impairment & divestiture charges discussed above, the Company also incurred approximately $10.5 million of divestiture charges in fiscal 2019 related to theanticipated divestiture of EC&S.
On December 1, 2017, the Company completed the sale of the Viking business (Other Segment) for net cash proceeds of $8.8 million, which resulted in an after-taximpairment & divestiture charge of $12.4 million in fiscal 2018, comprised of real estate lease exit charges of $3.0 million related to retained facilities that became vacant as aresult of the Viking divestiture and approximately $9.4 million of associated discrete income tax expense. In the fourth quarter of fiscal 2017, related to the then pending sale ofour Viking business, we recognized impairment & divestiture charges of $117.0 million which consisted of (i) a $16.1 million charge representing the excess of the net bookvalue of assets held for sale to the anticipated proceeds; (ii) a non-cash impairment charge of $69.0 million related to the recognition in earnings of the cumulative effect offoreign currency rate changes since acquisition; (iii) a $28.6 million cash charge related to the operating lease buyout of certain rental assets and (iv) a $3.3 million of otherdivestiture charges.
The historical results of the Viking business (which had net sales of $2.7 million in the year ended August 31, 2018) are not material to the consolidated financial results.
Note 6. Goodwill, Intangible Assets and Long-Lived AssetsChanges in the gross carrying value of goodwill and intangible assets result from changes in foreign currency exchange rates, business acquisitions, divestitures and
impairment charges. The changes in the carrying amount of goodwill for the years ended August 31, 2019 and 2018 by operating segment are as follows (in thousands):
Industrial Tools &
Services Other TotalBalance as of August 31, 2017 $ 238,707 $ 33,712 $ 272,419Business acquisitions 12,441 — 12,441Impact of changes in foreign currency rates (2,443 ) (2,285 ) (4,728 )
Balance as of August 31, 2018 248,705 31,427 280,132Purchase accounting adjustments 253 — 253Impairment charge — (13,678 ) (13,678 )Impact of changes in foreign currency rates (6,085 ) (207 ) (6,292 )
Balance as of August 31, 2019 $ 242,873 $ 17,542 $ 260,415
42

ACTUANT CORPORATIONNOTES TO CONSOLIDATED FINANCIAL STATEMENTS-(Continued)
The changes in the carrying amount of goodwill included within "Assets from discontinued operations" on the Consolidated Balance Sheets for the years endedAugust 31, 2019 and 2018 are as follows (in thousands):
Balance as of August 31, 2017 $ 257,662Impairment charge (21,227 )Impact of changes in foreign currency rates (2,655 )
Balance as of August 31, 2018 233,780Impairment charge (209,489 )Impact of changes in foreign currency rates (7,429 )
Balance as of August 31, 2019 $ 16,862
The gross carrying value and accumulated amortization of the Company’s intangible assets are as follows (in thousands):
WeightedAverage
AmortizationPeriod (Year)
August 31, 2019 August 31, 2018
Gross AccumulatedAmortization
Net BookValue Gross
AccumulatedAmortization
Net BookValue
Amortizable intangible assets: Customer relationships 14 $ 126,229 $ 96,817 $ 29,412 $ 128,561 $ 84,029 $ 44,532Patents 12 13,227 12,276 951 13,324 11,915 1,409Trademarks and tradenames 16 4,513 2,921 1,592 4,275 2,826 1,449Non-compete agreements & other 3 4,835 4,835 — 4,942 4,813 129
Indefinite lived intangible assets: Tradenames N/A 20,420 — 20,420 24,138 — 24,138
$ 169,224 $ 116,849 $ 52,375 $ 175,240 $ 103,583 $ 71,657
The Company estimates that amortization expense for future years is estimated to be $7.6 million in fiscal year 2020, $6.7 million in fiscal 2021, $5.9 million in fiscal2022, $4.4 million in fiscal 2023, $2.7 million in fiscal 2024 and $4.7 million in aggregate thereafter. The future amortization expense amounts represent estimates and may beimpacted by future acquisitions, divestitures or changes in foreign currency exchange rates, among other causes.
Fiscal 2019 Impairment Charges
During fiscal 2019, within the Other segment, the Company recognized a $13.7 million Goodwill impairment charge related to Cortland U.S. in conjunction withtriggering events identified during the fiscal year.
In the fourth quarter of fiscal 2019, the Company's branding strategy was revised such that two secondary tradenames previously considered to have indefinite lives are tobe phased out and re-branded within 12-15 months. As such, the Company recorded an impairment & divestiture charge of $2.6 million based on the estimated remaining fairvalue of the respective tradenames. In addition, based on restructuring actions taken in the fourth quarter related to the North America Services operations, the Companyconcluded that the fair value of a customer relationship intangible was less than the current net book value, and therefore, a $6.2 million impairment & divestiture charge wasrecorded. The tradename and customer relationships impairments both related to assets within the IT&S segment.
43

ACTUANT CORPORATION
NOTES TO CONSOLIDATED FINANCIAL STATEMENTS-(Continued)
Note 7. DebtThe following is a summary of the Company’s long-term indebtedness (in thousands):
August 31,
2019 2018Previous Senior Credit Facility
Revolver $ — $ —Term Loan — 247,500
Total Previous Senior Credit Facility — 247,500New Senior Credit Facility
Revolver — —Term Loan 175,000 —
Total New Senior Credit Facility 175,000 —5.625% Senior Notes 287,559 287,559
Total Senior Indebtedness 462,559 535,059Less: Current maturities of long-term debt (7,500) (30,000)
Debt issuance costs (2,114) (2,364)Total long-term debt, less current maturities $ 452,945 $ 502,695
Senior Credit Facility
Prior to the refinancing of the Company's Senior Credit Facility on March 29, 2019, the Company’s previous Senior Credit Facility matured on May 8, 2020, and provideda $300 million revolver, a $300 million term loan and a $450 million expansion option, subject to certain conditions. Borrowings were subject to a pricing grid, which couldresult in increases or decreases to the borrowing spread, depending on the Company’s leverage ratio, ranging from a spread of 1.00% to 2.25% in the case of loans bearinginterest at LIBOR and from 0.00% to 1.25% in the case of loans bearing interest at the base rate. In addition, a non-use fee was payable quarterly on the average unused creditline under the revolver ranging from 0.15% to 0.35% per annum.
On March 29, 2019, the Company refinanced its Senior Credit Facility resulting in a new $600 million Senior Credit Facility, comprised of a $400 million revolving lineof credit and a $200 million term loan. The new facility, which matures in March 2024, includes a reduction in pricing and expands the revolving credit facility from $300million to $400 million. Borrowings under the new Senior Credit Facility bear interest based on LIBOR or a base rate, with interest rate spreads above LIBOR or the base ratebeing subject to adjustments based on the Company's net leverage ratio, ranging from 1.125% to 2.00% in the case of loans bearing interest at LIBOR and from 1.25% to 1.00%in the case of loans bearing interest at the base rate. In addition, a non-use fee is payable quarterly in the average unused revolving credit facility ranging from 0.15% to 0.30%per annum, based on the Company's net leverage ratio. Quarterly term loan principal payments of $1.25 million began on August 31, 2019, will escalate to $5.0 million byMay 31, 2022, with the remaining principal due at maturity. During fiscal 2019 and in line with its capital allocation strategy, the Company electively prepaid $23.8 millionagainst the remaining principal balance of the term loan subsequent to the refinancing.
The new Senior Credit Facility contains financial covenants that are consistent with the prior facility, with enhancements that improve overall liquidity, and provides theoption for future expansion through a $300 million accordion on the revolver. The two financial covenants included are a maximum leverage ratio of 3.75:1 and a minimuminterest coverage ratio of 3.50:1. For each covenant, certain transactions lead to adjustments to the underlying ratio, including a reduction of the minimum interest coverage ratiofrom 3.5 to 3.0 for any fiscal quarter ending within twelve months after the sale of the EC&S segment and an increase to the leverage ratio from 3.75 to 4.25 during the fourfiscal quarters after a significant acquisition.
Borrowings under the credit agreement are secured by substantially all personal property assets of the Company and its domestic subsidiary guarantors and certain equityinterests owned by the foreign law pledgors. In preparation for the divestiture of the EC&S segment, the Company needed to transfer certain assets between guarantor and non-guarantor entities. While this action was contemplated in the new Senior Credit Facility, the Company did not timely notify the lendors of these transactions, and as such, theCompany was not in technical compliance with this restrictive covenant at August 31, 2019. However, the Company subsequently obtained the necessary waivers from thelendors to be in compliance as of the date of this report. The Company was in compliance with all financial covenants at August 31, 2019.
44

ACTUANT CORPORATIONNOTES TO CONSOLIDATED FINANCIAL STATEMENTS-(Continued)
As of August 31, 2019, the variable borrowing rate on the outstanding term loan balance was 3.50% and the unused credit line and amount available for borrowing underthe revolver was $398.8 million.
Senior Notes
On April 16, 2012, the Company issued $300 million of 5.625% Senior Notes due 2022 (the “Senior Notes”) of which $287.6 million remain outstanding. The SeniorNotes require no principal installments prior to their June 15, 2022 maturity, require semiannual interest payments in December and June of each year and contain certainfinancial and non-financial covenants. The Senior Notes include a call feature that allows the Company to repurchase them anytime on or after June 15, 2017 at statedredemption prices currently at 100.9% and reducing to 100.0% on June 15, 2020, plus accrued and unpaid interest. The Company repurchased $0.5 million of the Senior Notesduring fiscal 2017.
The Company made cash interest payments of $26.3 million, $28.8 million and $27.1 million in fiscal 2019, 2018 and 2017, respectively.As of August 31, 2019, future debt maturities for each of the next five fiscal years were as follows (in thousands):
Fiscal Year Term Loan Senior Notes Total
2020 $ 7,500 $ — $ 7,5002021 12,500 — 12,5002022 17,500 287,559 305,0592023 20,000 — 20,0002024 117,500 — 117,500
$ 175,000 $ 287,559 $ 462,559
Note 8. Fair Value MeasurementsThe Company assesses the inputs used to measure the fair value of financial assets and liabilities using a three-tier hierarchy. Level 1 inputs include unadjusted quoted
prices for identical instruments and are the most observable. Level 2 inputs include quoted prices for similar assets and observable inputs such as interest rates, foreign currencyexchange rates, commodity rates and yield curves. Level 3 inputs are not observable in the market and include management’s own judgments about the assumptions marketparticipants would use in pricing an asset or liability.
The fair value of the Company’s cash and cash equivalents, accounts receivable, accounts payable and variable rate long-term debt approximated book value at bothAugust 31, 2019 and 2018 due to their short-term nature and the fact that the interest rates approximated market rates. Foreign currency exchange contracts are recorded at fairvalue. The fair value of the Company's foreign currency exchange contracts was a net asset of less than $0.1 million at August 31, 2019 and a net asset of $0.4 million atAugust 31, 2018. The fair value of the foreign currency exchange contracts was based on quoted inactive market prices and is therefore classified as Level 2 within the valuationhierarchy. The fair value of the Company’s outstanding Senior Notes was $291.5 million and $293.5 million at August 31, 2019 and 2018, respectively. The fair value of theSenior Notes was based on quoted inactive market prices and are therefore classified as Level 2 within the valuation hierarchy.
As discussed in Note 6, “Goodwill, Intangible Assets and Long-Lived Assets”, the Company recorded impairment on indefinite-lived tradenames and customerrelationships in the fourth quarter of fiscal 2019. The fair value of the tradenames and customer relationships were determined utilizing generally accepted valuation techniques,specifically, forecasting future revenues and/or using a market royalty rate. These valuations represent Level 3 assets measured at fair value on a nonrecurring basis.
Note 9. Derivatives
All derivatives are recognized in the balance sheet at their estimated fair value. The Company does not enter into derivatives for speculative purposes. Changes in thevalue of derivatives (not designated as hedges) are recorded in earnings along with the gain or loss on the hedged asset or liability, while changes in the value of derivativesdesignated as cash flow hedges are recorded in accumulated other comprehensive loss, until earnings are affected by the variability of cash flows.
The Company is exposed to market risk for changes in foreign currency exchange rates due to the global nature of its operations. In order to manage this risk, theCompany utilizes foreign currency exchange contracts to reduce the exchange rate risk associated with recognized non-functional currency balances. The effects of changes inexchange rates are reflected concurrently in earnings for both the fair value of the foreign currency exchange contracts and the related non-functional currency asset or liability.These derivative gains and losses offset foreign currency gains and losses from the related
45

revaluation of non-functional currency assets and liabilities (amounts included in "Other expense" in the Consolidated Statements of Operations). The U.S. dollar equivalentnotional value of these short duration foreign currency exchange contracts (cash flow hedges or non-designated hedges) was $13.3 million and $11.9 million at August 31, 2019and 2018, respectively. The fair value of outstanding foreign currency exchange contracts was an asset of less than $0.1 million at August 31, 2019 and an asset of $0.4 millionat August 31, 2018. Net foreign currency (losses) gains (included in "Other expense" in the Consolidated Statements of Operations) related to these derivative instruments are asfollows (in thousands):
Year Ended August 31,
2019 2018 2017Foreign Currency (losses) gains $ (292 ) $ 249 $ (3,113 )
Note 10. LeasesThe Company leases certain facilities, computers, equipment and vehicles under various lease agreements generally over periods of one to twenty years. Under most
arrangements, the Company pays the property taxes, insurance, maintenance and expenses related to the leased property. Many of the leases include provisions that enable theCompany to renew the lease based upon fair value rental rates on the date of expiration of the initial lease.
As of August 31, 2019, future obligations under non-cancelable operating leases associated with continuing operations were as follows: $15.8 million in fiscal 2020; $12.3million in fiscal 2021; $10.1 million in fiscal 2022; $6.9 million in fiscal 2023; $5.2 million in fiscal 2024; and $21.6 million in aggregate thereafter. Total rental expense underoperating leases was $26.5 million, $24.3 million and $27.6 million in fiscal 2019, 2018 and 2017, respectively.
As discussed in Note 16, “Commitments and Contingencies” the Company remains contingently liable for lease payments under leases of businesses that it previouslydivested or spun off. Further, the Company continues to work with the buyer in the pending divestiture of the EC&S segment and the respective lessors of certain assets leasedwithin those businesses (but in the name of Actuant Corporation or a retained subsidiary) to either transfer the lease to the name of the buyer or buyout existing leases.
Note 11. Employee Benefit Plans
U.S. Defined Benefit Pension PlansAll of the U.S. defined benefit pension plans are frozen, and as a result, plan participants no longer earn additional benefits. The following table provides detail of changes
in the projected benefit obligations, the fair value of plan assets and the funded status of the Company’s U.S. defined benefit pension plans as of the respective August 31measurement date (in thousands):
2019 2018Reconciliation of benefit obligations: Benefit obligation at beginning of year $ 43,280 $ 46,806Interest cost 1,694 1,633Actuarial loss/(gain) 5,339 (2,330 )Benefits paid (2,913 ) (2,829 )
Benefit obligation at end of year $ 47,400 $ 43,280Reconciliation of plan assets: Fair value of plan assets at beginning of year $ 40,244 $ 40,027Actual return on plan assets 2,972 2,938Company contributions 108 108Benefits paid from plan assets (2,912 ) (2,829 )
Fair value of plan assets at end of year 40,412 40,244Funded status of the plans (underfunded) $ (6,988 ) $ (3,036 )
46
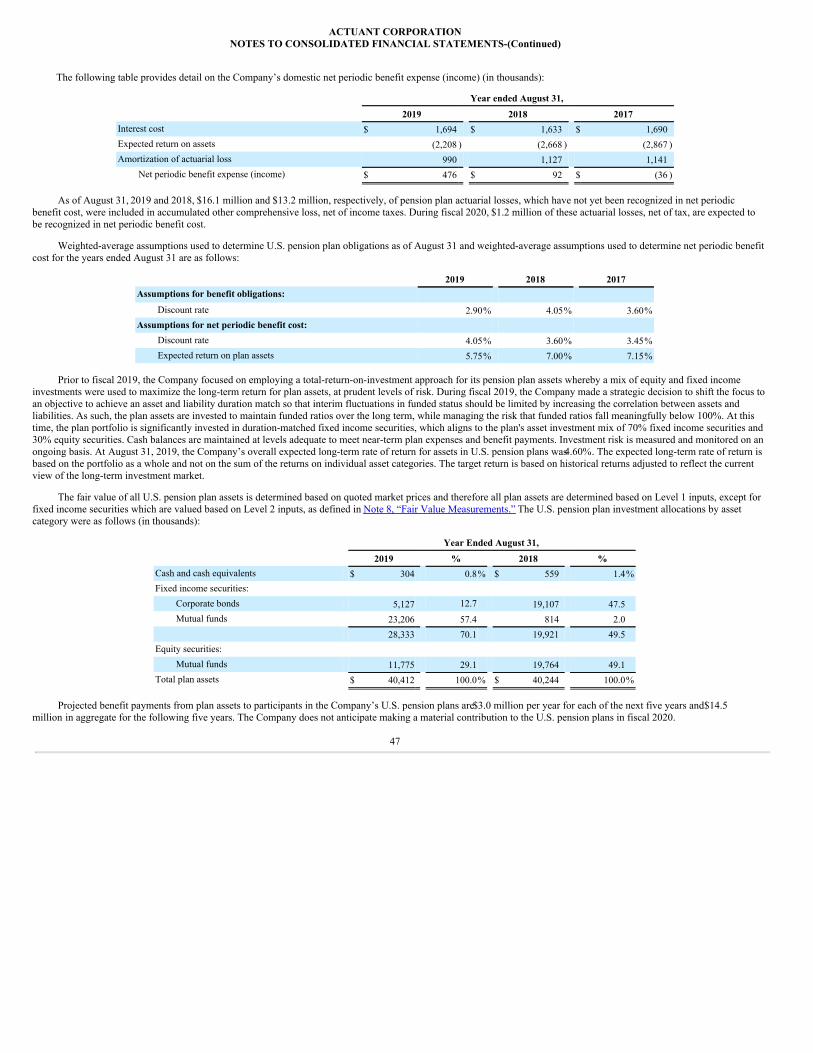
ACTUANT CORPORATIONNOTES TO CONSOLIDATED FINANCIAL STATEMENTS-(Continued)
The following table provides detail on the Company’s domestic net periodic benefit expense (income) (in thousands):
Year ended August 31,
2019 2018 2017Interest cost $ 1,694 $ 1,633 $ 1,690Expected return on assets (2,208 ) (2,668 ) (2,867 )Amortization of actuarial loss 990 1,127 1,141
Net periodic benefit expense (income) $ 476 $ 92 $ (36 )
As of August 31, 2019 and 2018, $16.1 million and $13.2 million, respectively, of pension plan actuarial losses, which have not yet been recognized in net periodicbenefit cost, were included in accumulated other comprehensive loss, net of income taxes. During fiscal 2020, $1.2 million of these actuarial losses, net of tax, are expected tobe recognized in net periodic benefit cost.
Weighted-average assumptions used to determine U.S. pension plan obligations as of August 31 and weighted-average assumptions used to determine net periodic benefitcost for the years ended August 31 are as follows:
2019 2018 2017Assumptions for benefit obligations:
Discount rate 2.90% 4.05% 3.60%Assumptions for net periodic benefit cost:
Discount rate 4.05% 3.60% 3.45%Expected return on plan assets 5.75% 7.00% 7.15%
Prior to fiscal 2019, the Company focused on employing a total-return-on-investment approach for its pension plan assets whereby a mix of equity and fixed income
investments were used to maximize the long-term return for plan assets, at prudent levels of risk. During fiscal 2019, the Company made a strategic decision to shift the focus toan objective to achieve an asset and liability duration match so that interim fluctuations in funded status should be limited by increasing the correlation between assets andliabilities. As such, the plan assets are invested to maintain funded ratios over the long term, while managing the risk that funded ratios fall meaningfully below 100%. At thistime, the plan portfolio is significantly invested in duration-matched fixed income securities, which aligns to the plan's asset investment mix of 70% fixed income securities and30% equity securities. Cash balances are maintained at levels adequate to meet near-term plan expenses and benefit payments. Investment risk is measured and monitored on anongoing basis. At August 31, 2019, the Company’s overall expected long-term rate of return for assets in U.S. pension plans was 4.60%. The expected long-term rate of return isbased on the portfolio as a whole and not on the sum of the returns on individual asset categories. The target return is based on historical returns adjusted to reflect the currentview of the long-term investment market.
The fair value of all U.S. pension plan assets is determined based on quoted market prices and therefore all plan assets are determined based on Level 1 inputs, except forfixed income securities which are valued based on Level 2 inputs, as defined in Note 8, “Fair Value Measurements.” The U.S. pension plan investment allocations by assetcategory were as follows (in thousands):
Year Ended August 31,
2019 % 2018 %Cash and cash equivalents $ 304 0.8% $ 559 1.4%Fixed income securities:
Corporate bonds 5,127 12.7 19,107 47.5Mutual funds 23,206 57.4 814 2.0
28,333 70.1 19,921 49.5Equity securities:
Mutual funds 11,775 29.1 19,764 49.1Total plan assets $ 40,412 100.0% $ 40,244 100.0%
Projected benefit payments from plan assets to participants in the Company’s U.S. pension plans are $3.0 million per year for each of the next five years and $14.5million in aggregate for the following five years. The Company does not anticipate making a material contribution to the U.S. pension plans in fiscal 2020.
47

ACTUANT CORPORATIONNOTES TO CONSOLIDATED FINANCIAL STATEMENTS-(Continued)
Foreign Defined Benefit Pension PlansThe Company has eight foreign defined benefit pension plans which cover certain existing and former employees of businesses outside the U.S. Most of the participants
in the foreign defined benefit pension plans are current employees and are earning additional benefits. The following table provides detail of changes in the projected benefitobligations, the fair value of plan assets and the funded status of the Company’s foreign defined benefit pension plans as of the respective August 31 measurement date (inthousands):
2019 2018Reconciliation of benefit obligations: Benefit obligation at beginning of year $ 13,056 $ 13,423Employer Service Costs 450 440Interest cost 257 278Actuarial loss/(gain) 2,594 (337 )Benefits paid (421 ) (555 )Plan amendments 89 —Curtailments (107 ) —Currency impact (815 ) (193 )
Benefit obligation at end of year $ 15,103 $ 13,056Reconciliation of plan assets: Fair value of plan assets at beginning of year $ 7,902 $ 7,904Actual return on plan assets 752 32Company contributions 374 588Benefits paid from plan assets (421 ) (555 )Currency impact (489 ) (67 )
Fair value of plan assets at end of year 8,118 7,902Funded status of the plans (underfunded) $ (6,985 ) $ (5,154 )
The following table provides detail on the Company’s foreign net periodic benefit expense (in thousands):
Year ended August 31,
2019 2018 2017Employer service costs $ 450 $ 440 $ 413Interest cost 257 278 239Expected return on assets (345 ) (366 ) (379 )Amortization of net prior service credit (65 ) (69 ) (61 )Amortization of net loss 263 306 438(Income) or cost of special events (56 ) 18 268
Net periodic benefit expense $ 504 $ 607 $ 918
The weighted average discount rate utilized for determining the benefit obligation at August 31, 2019 and 2018 was 1.1% and 2.0%, respectively. The plan assets of theseforeign pension plans consist primarily of participating units in fixed income and equity securities and insurance contracts. The Company’s overall expected long-term rate ofreturn on these investments is 4.2%. During fiscal 2020, the Company anticipates contributing $0.3 million to these pension plans.
Projected benefit payments to participants in the these foreign plans are $0.2 million for fiscal 2020, $0.3 million for fiscal 2021, $0.4 million for fiscal 2022, $0.3 millionfor both fiscal 2023 and fiscal 2024 and $1.9 million in aggregate for the following five years.
Other Postretirement Health Benefit PlansThe Company provides other postretirement health benefits (“OPEB”) to certain existing and former employees of domestic businesses it acquired, who were entitled to
such benefits prior to acquisition. These unfunded plans had a benefit obligation of $3.1 million and $2.9 million at August 31, 2019 and 2018, respectively. These obligationsare determined
48

ACTUANT CORPORATIONNOTES TO CONSOLIDATED FINANCIAL STATEMENTS-(Continued)
utilizing assumptions consistent with those used for our U.S. pension plans and a health care cost trend rate of 6.8%, trending downward to 5.0% by the year 2026, andremaining level thereafter. Net periodic benefit costs for other postretirement benefits was income of $0.1 million for the year-ended August 31, 2019 and expense of $0.1million and $0.2 million for the year-ended August 31, 2018 and 2017, respectively. Benefit payments from the plan are funded through participant contributions and Companycontributions, which are projected to be $0.2 million in fiscal 2020.
Defined Contribution Benefit PlansThe Company maintains a 401(k) plan for substantially all full time U.S. employees (the “401(k) Plan”). Under plan provisions, the Company can fund either cash or
issue new shares of Class A common stock for its contributions. Amounts are allocated to accounts set aside for each employee’s retirement. Employees generally maycontribute up to 50% of their compensation to individual accounts within the 401(k) Plan. While contributions vary, prior to fiscal 2019, the Company generally made corecontributions to employee accounts equal to 3% of each employee’s eligible annual cash compensation, subject to IRS limitations. In addition, the Company matchedapproximately 25% of each employee’s contribution up to 6% of the employee’s eligible compensation. The Company also maintains a Restoration Plan that allows eligiblehighly compensated employees (as defined by the Internal Revenue Code) to receive a core contribution as if no IRS limits were in place. Company contributions to theRestoration Plan were made in the form of its Class A common stock and contributed into each eligible participant’s deferred compensation plan account. Effective September1, 2018, the Company changed the method of employer contributions. The Company's match contribution is $0.50 for every $1 contributed by employees, up to 8% of theemployees' eligible pay. These match contributions are made on every payroll run, meaning the contribution is immediately 100% vested. In addition, the Company may makean annual, discretionary contribution of up to 3% of employees' eligible pay to employees employed as of end of the plan year. The discretionary contribution has a three yearvesting period. The Company elected not to provide a discretionary contribution for the year ended August 31, 2019. Expense recognized related to the 401(k) plan totaled $2.7million, $3.1 million and $3.2 million for the year ended August 31, 2019, 2018 and 2017, respectively.
In addition to the 401(k) plan, the Company sponsors a non-qualified supplemental executive retirement plan (“the SERP Plan”). The SERP Plan is an unfunded definedcontribution plan that covers certain current and former executive employees and has an annual contribution formula based on age and years of service (with Companycontributions ranging from 3% to 6% of eligible wages). This unfunded plan had a $1.6 million and $1.7 million obligation at August 31, 2019 and 2018, respectively. Expenserecognized for the SERP Plan was $0.4 million for fiscal 2019 and $0.3 million for both 2018 and 2017.
Deferred Compensation PlanThe Company maintains a deferred compensation plan to allow eligible U.S. employees to defer receipt of current cash compensation in order to provide future savings
benefits. Eligibility is limited to employees that earn compensation that exceeds certain pre-defined levels. Participants have the option to invest their deferrals in a fixed incomeinvestment, in Company common stock, or a combination of the two. The fixed income portion of the plan is unfunded, and therefore all compensation deferred under the planis held by the Company and commingled with its general assets. Liabilities of $18.4 million and $20.1 million are included in the consolidated balance sheets at August 31,2019 and 2018, respectively, to reflect the unfunded portion of the deferred compensation liability. The Company recorded expense in "Financing costs, net" of $1.4 million,$1.5 million and $1.6 million for the years ended August 31, 2019, 2018 and 2017, respectively, for non-funded interest on participant deferrals in the fixed income investmentoption. Company common stock contributions to fund the plan are held in a rabbi trust, accounted for in a manner similar to treasury stock and are recorded at cost in “Stockheld in trust” within shareholders’ equity on the Consolidated Balance Sheets with the corresponding deferred compensation liability also recorded within shareholders’ equityon the Consolidated Balance Sheets. Since no investment diversification is permitted within the trust, changes in fair value of Actuant common stock are not recognized.
49
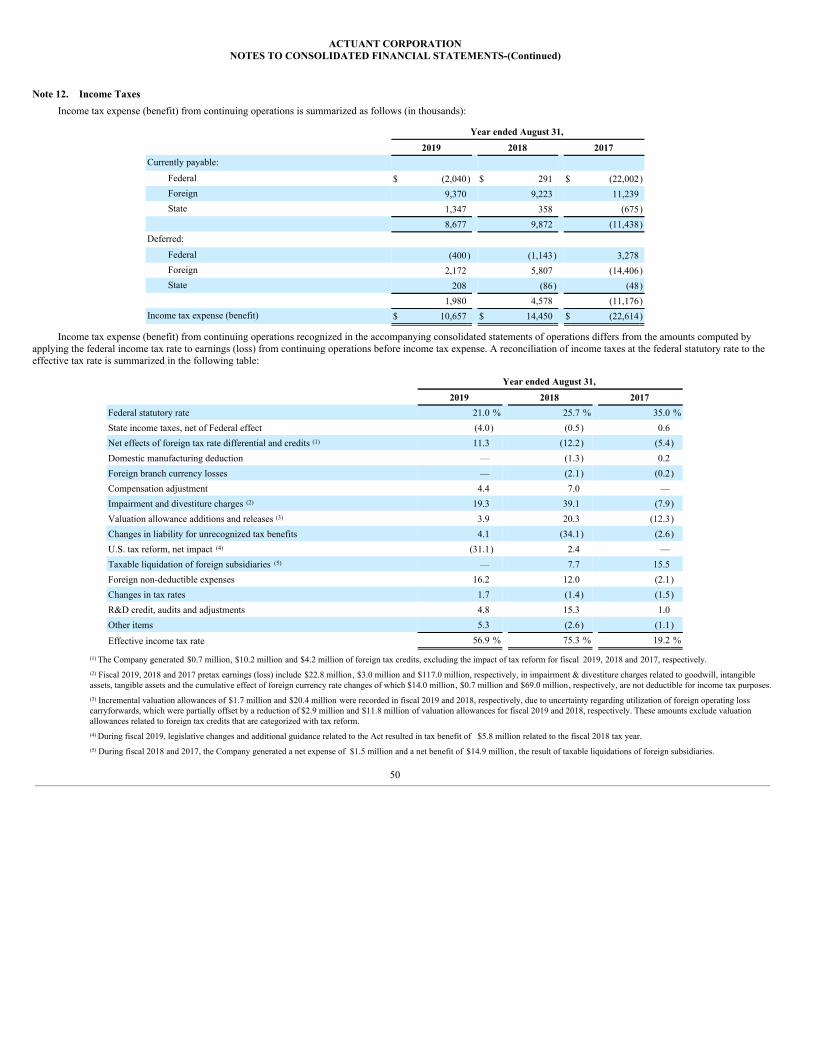
ACTUANT CORPORATION
NOTES TO CONSOLIDATED FINANCIAL STATEMENTS-(Continued)
Note 12. Income TaxesIncome tax expense (benefit) from continuing operations is summarized as follows (in thousands):
Year ended August 31,
2019 2018 2017Currently payable:
Federal $ (2,040) $ 291 $ (22,002)Foreign 9,370 9,223 11,239State 1,347 358 (675)
8,677 9,872 (11,438)Deferred:
Federal (400) (1,143) 3,278Foreign 2,172 5,807 (14,406)State 208 (86) (48)
1,980 4,578 (11,176)Income tax expense (benefit) $ 10,657 $ 14,450 $ (22,614)
Income tax expense (benefit) from continuing operations recognized in the accompanying consolidated statements of operations differs from the amounts computed byapplying the federal income tax rate to earnings (loss) from continuing operations before income tax expense. A reconciliation of income taxes at the federal statutory rate to theeffective tax rate is summarized in the following table:
Year ended August 31,
2019 2018 2017Federal statutory rate 21.0 % 25.7 % 35.0 %State income taxes, net of Federal effect (4.0) (0.5) 0.6Net effects of foreign tax rate differential and credits (1) 11.3 (12.2) (5.4)Domestic manufacturing deduction — (1.3) 0.2Foreign branch currency losses — (2.1) (0.2)Compensation adjustment 4.4 7.0 —Impairment and divestiture charges (2) 19.3 39.1 (7.9)Valuation allowance additions and releases (3) 3.9 20.3 (12.3)Changes in liability for unrecognized tax benefits 4.1 (34.1) (2.6)U.S. tax reform, net impact (4) (31.1) 2.4 —Taxable liquidation of foreign subsidiaries (5) — 7.7 15.5Foreign non-deductible expenses 16.2 12.0 (2.1)Changes in tax rates 1.7 (1.4) (1.5)R&D credit, audits and adjustments 4.8 15.3 1.0Other items 5.3 (2.6) (1.1)
Effective income tax rate 56.9 % 75.3 % 19.2 %
(1) The Company generated $0.7 million, $10.2 million and $4.2 million of foreign tax credits, excluding the impact of tax reform for fiscal 2019, 2018 and 2017, respectively. (2) Fiscal 2019, 2018 and 2017 pretax earnings (loss) include $22.8 million, $3.0 million and $117.0 million, respectively, in impairment & divestiture charges related to goodwill, intangibleassets, tangible assets and the cumulative effect of foreign currency rate changes of which $14.0 million, $0.7 million and $69.0 million, respectively, are not deductible for income tax purposes.(3) Incremental valuation allowances of $1.7 million and $20.4 million were recorded in fiscal 2019 and 2018, respectively, due to uncertainty regarding utilization of foreign operating losscarryforwards, which were partially offset by a reduction of $2.9 million and $11.8 million of valuation allowances for fiscal 2019 and 2018, respectively. These amounts exclude valuationallowances related to foreign tax credits that are categorized with tax reform.(4) During fiscal 2019, legislative changes and additional guidance related to the Act resulted in tax benefit of $5.8 million related to the fiscal 2018 tax year.(5) During fiscal 2018 and 2017, the Company generated a net expense of $1.5 million and a net benefit of $14.9 million, the result of taxable liquidations of foreign subsidiaries.
50

ACTUANT CORPORATIONNOTES TO CONSOLIDATED FINANCIAL STATEMENTS-(Continued)
Temporary differences and carryforwards that gave rise to deferred tax assets and liabilities include the following items (in thousands):
August 31,
2019 2018Deferred income tax assets:
Operating loss and tax credit carryforwards $ 88,198 $ 38,414Compensation related liabilities 7,752 8,821Postretirement benefits 9,289 8,659Inventory 629 520Book reserves and other items 11,465 17,499
Total deferred income tax assets 117,333 73,913Valuation allowance (73,255) (32,426)
Net deferred income tax assets 44,078 41,487Deferred income tax liabilities:
Depreciation and amortization (26,248) (23,517)Other items (862) (611)
Deferred income tax liabilities (27,110) (24,128)Net deferred income tax asset (1) $ 16,968 $ 17,359
(1) The net deferred income tax asset is reflected on the balance sheet in two categories: an asset of $18.4 million and $21.3 million for fiscal 2019 and 2018, respectively, is included in"Other long-term assets" and a liability of $1.6 million and $3.9 million for fiscal 2019 and 2018, respectively, is included in "Deferred income taxes".
The Company has $68.8 million of state loss carryforwards, which are available to reduce future state tax liabilities. These state net operating loss carryforwards expire atvarious times through 2039. The Company also has $85.3 million of foreign loss carryforwards which are available to reduce certain future foreign tax liabilities.Approximately one-half of the foreign loss carryforwards are not subject to any expiration dates, while the other balances expire at various times through 2029. The valuationallowance represents a reserve for deferred tax assets, including loss carryforwards and foreign tax credits, for which utilization is uncertain.
Changes in the Company’s gross liability for unrecognized tax benefits, excluding interest and penalties, are as follows (in thousands):
2019 2018 2017Beginning balance $ 24,359 $ 31,446 $ 29,174Increases based on tax positions related to the current year 2,169 2,599 6,057Increase for tax positions taken in a prior period 1,422 359 297Decrease for tax positions taken in a prior period — (349) (627)Decrease due to lapse of statute of limitations (3,212) (9,163) (4,008)Decrease due to settlements (324) — —Changes in foreign currency exchange rates (247) (533) 553Ending balance $ 24,167 $ 24,359 $ 31,446
Substantially all of these unrecognized tax benefits, if recognized, would impact the effective income tax rate. As of August 31, 2019, 2018 and 2017, the Companyrecognized $3.7 million, $3.0 million and $2.9 million, respectively for interest and penalties related to unrecognized tax benefits. The Company recognizes interest andpenalties related to underpayment of income taxes as a component of income tax expense. With few exceptions, the Company is no longer subject to U.S. federal, state andforeign income tax examinations by tax authorities in major tax jurisdictions for years prior to fiscal 2009. The Company believes it is reasonably possible that the total amountof unrecognized tax benefits could decrease by up to $2.4 million throughout fiscal 2020.
The Company’s policy is to remit earnings from foreign subsidiaries only to the extent the remittance does not result in an incremental U.S. tax liability. The Companydoes not currently provide for the additional U.S. and foreign income taxes which would become payable upon remission of undistributed earnings of foreign subsidiaries. If allundistributed earnings were remitted, an additional income tax provision of $5.4 million would have been necessary as of August 31, 2019.
51

ACTUANT CORPORATIONNOTES TO CONSOLIDATED FINANCIAL STATEMENTS-(Continued)
Earnings (loss) before income taxes from continuing operations, are summarized as follows (in thousands):
Year Ended August 31,
2019 2018 2017Domestic $ (715) $ 5,337 $ (10,023)Foreign 19,439 13,859 (107,866)
$ 18,724 $ 19,196 $ (117,889)
Both domestic and foreign pre-tax earnings from continuing operations are impacted by changes in operating earnings, acquisition and divestiture activities, restructuringcharges and the related benefits, growth investments, debt levels and the impact of changes in foreign currency exchange rates. In fiscal 2019, domestic and foreign earningsincluded non-cash impairment and other divestiture costs of $9.0 million and $13.8 million, respectively. In fiscal 2018, foreign earnings included $3.0 million of non-cashimpairment & divestiture charges. In fiscal 2017, domestic earnings included $7.8 million of director and officer transition charges and foreign earnings included $117.0 millionof non-cash impairment & divestiture charges. Approximately 70% - 80% of pre-tax earnings from continuing operations (excluding impairment & divestiture charges) weregenerated in foreign jurisdictions with tax rates different than the U.S. federal income tax rate.
Cash paid for income taxes, net of refunds, totaled $15.4 million, $1.5 million (refund) and $11.8 million during the years ended August 31, 2019, 2018 and 2017,respectively.
Note 13. Capital Stock and Share RepurchasesThe authorized common stock of the Company as of August 31, 2019 consisted of 168,000,000 shares of Class A common stock, $0.20 par value, of which 81,920,679
and 60,465,111 shares were issued and outstanding, respectively; 1,500,000 shares of Class B common stock, $0.20 par value, none of which are outstanding; and 160,000shares of cumulative preferred stock, $1.00 par value (“preferred stock”), none of which have been issued. Holders of both classes of the Company’s common stock are entitledto dividends, as the Company’s Board of Directors may declare out of funds legally available, subject to any contractual restrictions on the payment of dividends or otherdistributions on the common stock. If the Company were to issue any of its preferred stock, no dividends could be paid or set apart on shares of common stock, unless paid incommon stock, until dividends on all of the issued and outstanding shares of preferred stock had been paid or set apart for payment and provision had been made for anymandatory sinking fund payments.
The Company's Board of Directors approved four separate authorizations (September 2011, March 2014, October 2014 and March 2015) to repurchase up to 7,000,000shares each of the Company’s outstanding common stock. During the year ended August 31, 2019, the Company repurchased 1,016,134 shares for $22.5 million. At August 31,2019, cumulative shares repurchased under these authorizations totaled 21,455,568, leaving 6,544,432 shares authorized for future buy backs.
52

ACTUANT CORPORATIONNOTES TO CONSOLIDATED FINANCIAL STATEMENTS-(Continued)
Earnings Per ShareThe following table sets forth the computation of basic and diluted loss per share (in thousands, except per share amounts):
Year Ended August 31,
2019 2018 2017Numerator:
Net earnings (loss) from continuing operations $ 8,067 $ 4,746 $ (95,275)Net (loss) earnings from discontinued operations (257,212) (26,394) 29,062Net loss (249,145) (21,648) (66,213)
Denominator: Weighted average common shares outstanding - basic 61,151 60,441 59,436Net effect of dilutive securities - stock based compensation plans 456 587 —Weighted average common shares outstanding - diluted 61,607 61,028 59,436
Earnings (loss) per common share from continuing operations: Basic $ 0.13 $ 0.08 $ (1.60)Diluted $ 0.13 $ 0.08 $ (1.60)
(Loss) earnings per common share from discontinued operations: Basic $ (4.21) $ (0.44) $ 0.49Diluted $ (4.18) $ (0.43) $ 0.49
Loss per common share: Basic $ (4.07) $ (0.36) $ (1.11)Diluted $ (4.04) $ (0.35) $ (1.11)
Anti-dilutive securities- stock based compensation plans (excluding from earnings per sharecalculation) (1) 1,239 1,477 4,482
(1) As a result of the impairment and divestiture charges which caused a net loss from continuing operations in fiscal 2017, shares from stock based compensation plans are excluded from thecalculation of diluted loss per share, as the result would be anti-dilutive.
Note 14. Stock PlansShare based awards may be granted to key employees and directors under the Actuant Corporation 2017 Omnibus Incentive Plan (the “Plan”). At August 31, 2019,
4,325,000 shares of Class A common stock were authorized for issuance under the Plan plus an additional 1,800,000 shares being registered to cover shares, if any, that becomeissuable, pursuant to the terms of the Plan, upon the expiration, cancellation or forfeiture of existing awards under our previously registered stock plans, of which3,212,656 shares were available for future award grants. The Plan permits the Company to grant share-based awards, including stock options, restricted stock, restricted stockunits and performance shares (the "Performance Shares") to employees and directors. Options generally have a maximum term of ten years, an exercise price equal to 100% ofthe fair market value of the Company’s common stock at the date of grant and generally vest 50% after three years and 100% after five years. The Company’s restricted stockgrants prior to 2017 generally have similar vesting provisions as options while grants thereafter generally vest in equal installments over a three-year period. The PerformanceShares include a three-year performance period, with vesting based 50% on achievement of an absolute free cash flow conversion target and 50% on the Company’s totalshareholder return ("TSR") relative to the S&P 600 SmallCap Industrial index. The provisions of share-based awards may vary by individual grant with respect to vestingperiod, dividend and voting rights, performance conditions and forfeitures.
53

ACTUANT CORPORATIONNOTES TO CONSOLIDATED FINANCIAL STATEMENTS-(Continued)
A summary of restricted stock and performance shares activity during fiscal 2019 is as follows:
Number of
Shares Weighted-Average Fair Value
at Grant Date (Per Share)Outstanding on August 31, 2018 1,153,737 $25.25
Granted 705,602 22.75Forfeited (117,899) 24.24Vested (460,614) 25.49
Outstanding on August 31, 2019 1,280,826 $23.87
A summary of stock option activity during fiscal 2019 is as follows:
Shares
Weighted-AverageExercise Price
(Per Share)
Weighted-AverageRemaining Contractual
Term Aggregate
Intrinsic ValueOutstanding on September 1, 2018 1,769,076 $ 25.40
Granted — — Exercised (84,277) 19.72 Forfeited (19,566) 24.44 Expired (58,690) 20.77
Outstanding on August 31, 2019 1,606,543 $ 25.88 4.1 $ 0.5 million
Exercisable on August 31, 2019 1,298,308 $ 26.01 3.5 $ 0.5 million
Intrinsic value is the difference between the market value of the stock at August 31, 2019 and the exercise price which is aggregated for all options outstanding andexercisable. A summary of the weighted-average grant-date fair value of options, total intrinsic value of options exercised, and cash receipts from options exercised issummarized below (in thousands, except per share amounts):
Year Ended August 31,
2019 2018 2017Weighted-average fair value of options granted (per share) N/A N/A $ 11.88Intrinsic value of options exercised $ 429 $ 5,284 2,208Cash receipts from exercise of options 1,404 15,140 7,762
The Company generally records compensation expense over the vesting period for restricted stock awards based on the market value of the Company's Class A common
stock on the grant date and utilized an expected forfeiture rate of 10%, 10% and 11%, for fiscal years ended August 31, 2019, 2018 and 2017, respectively. The fair value ofPerformance Shares with market vesting conditions is determined utilizing a Monte Carlo simulation model. Stock based compensation expense is determined using a binomialpricing model for options. Assumptions used to determine the fair value of each option were based upon historical data and standard industry valuation practices andmethodology. There were no options granted in both fiscal 2019 and 2018. The following weighted-average assumptions were used in fiscal year 2017:
Fiscal Year Ended August 31, 2017Dividend yield 0.15 %Expected volatility 38.12 %Risk-free rate of return 2.42 %Expected forfeiture rate 11 %Expected life 7.4 years
As of August 31, 2019, there was $18.9 million of total unrecognized compensation cost related to share-based awards, including stock options, restricted stock, restrictedstock units and performance shares, which will be recognized over a weighted average period of 1.9 years. The total fair value of share-based awards that vested during the fiscalyears ended August 31, 2019 and 2018 was $11.9 million and $14.3 million, respectively.
54

ACTUANT CORPORATION
NOTES TO CONSOLIDATED FINANCIAL STATEMENTS-(Continued)
Note 15. Business Segment, Geographic and Customer InformationThe Company is a global manufacturer of a broad range of industrial products and solutions. The IT&S reportable segment is primarily engaged in the design,
manufacture and distribution of branded hydraulic and mechanical tools and in providing services and tool rental to the industrial, maintenance, infrastructure, oil & gas, energyand other markets. The Other segment is included for purposes of reconciliation of the respective balances below to the consolidated financial statements. All operations withinthe EC&S operating segment are considered discontinued operations and are therefore excluded from all disclosures herein.
The following tables summarize financial information by reportable segment and product line (in thousands):
Year Ended August 31,
2019 2018 2017Net Sales by Reportable Segment & Product Line
Industrial Tools & Services Segment Product $ 433,703 $ 439,405 $ 396,381Service & Rental 175,812 151,680 156,201
609,515 591,085 552,582
Other Operating Segment 45,243 50,218 64,009
$ 654,758 $ 641,303 $ 616,591
Operating Profit (Loss)
Industrial Tools & Services $ 101,411 $ 99,432 $ 95,825Other Operating Segment (11,821 ) (5,690 ) (130,396 )General Corporate (42,076 ) (43,536 ) (50,281 )
$ 47,516 $ 50,206 $ (84,852 )
Depreciation and Amortization: Industrial Tools & Services $ 14,762 $ 15,301 $ 15,025Other Operating Segment 3,408 3,122 5,886General Corporate 2,047 1,982 2,014
$ 20,217 $ 20,405 $ 22,925
Capital Expenditures:
Industrial Tools & Services $ 9,945 $ 7,799 $ 8,614Other Operating Segment 3,917 1,295 5,411General Corporate 1,061 1,927 3,213
$ 14,923 $ 11,021 $ 17,238
August 31,
2019 2018Assets:*
Industrial Tools & Services $ 553,615 $ 589,926Other Operating Segment 54,484 76,506General Corporate 230,597 249,852
$ 838,696 $ 916,284*Excludes "Assets from discontinued operations" as of August 31, 2019 and 2018, respectively.
In addition to the impact of changes in foreign currency exchange rates, the comparability of segment and product line information is impacted by acquisition/divestitureactivities, impairment and divestiture charges, restructuring costs and related benefits. Corporate assets, which are not allocated, principally represent cash and cash equivalents,capitalized debt issuance costs and deferred income taxes.
55

ACTUANT CORPORATIONNOTES TO CONSOLIDATED FINANCIAL STATEMENTS-(Continued)
The following tables summarize net sales and property, plant and equipment by geographic region (in thousands):
Year Ended August 31,
2019 2018 2017Net Sales:
United States $ 249,644 $ 236,036 $ 230,513United Kingdom 30,127 35,388 42,875Kazakhstan 30,081 19,814 22,989Germany 26,445 30,643 27,611Australia 25,749 30,796 36,076Saudi Arabia 21,625 20,749 22,089Brazil 18,779 17,900 15,456Canada 18,686 20,172 17,458China 18,548 19,239 18,323All other 215,074 210,566 183,201
$ 654,758 $ 641,303 $ 616,591
August 31,
2019 2018Property, Plant and Equipment, net:
United States $ 21,047 $ 17,040China 12,179 13,442UAE 8,734 7,876United Kingdom 2,983 3,663Brazil 2,851 2,923Netherlands 2,720 3,530Kazakhstan 2,635 3,056All other 3,580 3,444
$ 56,729 $ 54,974
The Company’s largest customer accounted for less than 3% of sales in each of the last three fiscal years. Export sales from domestic operations were 7.4%, 7.9% and6.0% of total net sales from continuing operations in fiscal 2019, 2018 and 2017, respectively. Note 16. Commitments and Contingencies
The Company had outstanding letters of credit of $18.2 million and $23.6 million at August 31, 2019 and 2018, respectively, the majority of which relate to commercialcontracts and self-insured workers' compensation programs.
As part of the Company's global sourcing strategy, we have entered into agreements with certain suppliers that require the supplier to maintain minimum levels ofinventory to support certain products for which we require a short lead time to fulfill customer orders. We have the ability to notify the supplier that they no longer needmaintain the minimum level of inventory should we discontinue manufacture of a product during the contract period, however, we must purchase the remaining minimuminventory levels the supplier was required to maintain within a defined period of time.
The Company is a party to various legal proceedings that have arisen in the normal course of business. These legal proceedings typically include product liability,breaches of contract, employment, personal injury and other disputes. The Company has recorded reserves for loss contingencies based on the specific circumstances of eachcase. Such reserves are recorded when it is probable a loss has been incurred and can be reasonably estimated. In the opinion of management, resolution of these contingenciesis not expected to have a material adverse effect on the Company’s financial position, results of operations or cash flows.
The Company remains contingently liable for lease payments under leases of businesses that it previously divested or spun-off in the event that such businesses are unableto fulfill their future lease payment obligations. The discounted present
56

ACTUANT CORPORATIONNOTES TO CONSOLIDATED FINANCIAL STATEMENTS-(Continued)
value of future minimum lease payments for these leases at August 31, 2019 was $9.1 million using a weighted average discount rate of 1.9%.The Company has facilities in numerous geographic locations that are subject to environmental laws and regulations. Environmental expenditures over the past three years
have not been material. Soil and groundwater contamination has been identified at certain facilities that we operate or formerly owned or operated. We are also a party tocertain state and local environmental matters, have provided environmental indemnifications for certain divested businesses and retain responsibility for certain potentialenvironmental liabilities. Management believes that such costs will not have a material adverse effect on the Company’s financial position, results of operations or cash flows.
As previously disclosed, in October 2018, the Company filed a voluntary self-disclosure ("VSD") with the U.S. Treasury Department’s Office of Foreign Assets Control(“OFAC”) regarding transactions related to otherwise authorized sales of tools and other products totaling approximately $0.5 million by certain of its foreign subsidiaries totwo Iranian distributors. It is possible that certain limited transactions relating to the authorized sales fell outside the scope of General License H under the Iranian Transactionand Sanctions Regulations, 31 C.F.R. Part 560. The VSD also included information about additional transactions by certain of the Company's Dutch subsidiaries with acounterparty in Estonia that may have been in violation of E.O. 13685, as certain sales of products and services may have been diverted to the Crimea region of Ukraine. OFACis currently reviewing the Company’s disclosures to determine whether any violations of U.S. economic sanctions laws may have occurred and, if so, to determine theappropriate enforcement response. At this time, the Company cannot predict when OFAC will conclude its review of the VSD or the nature of its enforcement response.
Additionally, the Company has self-disclosed the sales to its Estonian customer to relevant authorities in the Netherlands as potentially violating applicable sanctions lawsin that country and the European Union. The investigation by authorities in the Netherlands is ongoing and also may result in penalties. At this time, the Company cannotpredict when the investigation will be completed or reasonably estimate what penalties, if any, will be assessed.
While there can be no assurance of the ultimate outcome of the above matters, the Company currently believes that there will be no material adverse effect on theCompany's financial position, results of operations or cash flows.
57

Note 17. Guarantor Subsidiaries
As discussed in Note 7, “Debt” on April 16, 2012, Actuant Corporation (the “Parent”) issued $300.0 million of 5.625% Senior Notes, of which $287.6 million remainsoutstanding as of August 31, 2019. Certain material, domestic wholly owned subsidiaries (the “Guarantors”) fully and unconditionally guarantee the 5.625% Senior Notes on ajoint and several basis. There are no significant restrictions on the ability of the Guarantors to make distributions to the Parent.
Certain assets, liabilities and expenses have not been allocated to the Guarantors and the subsidiaries that do not guarantee the 5.625% Senior Notes (the "non-Guarantors") and therefore are included in the Parent column in the accompanying consolidating financial statements. These items are of a corporate or consolidated nature andinclude, but are not limited to, tax provisions and related assets and liabilities, certain employee benefit obligations, prepaid and accrued insurance and corporate indebtedness.Intercompany activity primarily includes loan activity, purchases and sales of goods or services, investments and dividends. Intercompany balances also reflect certain non-cashtransactions including transfers of assets and liabilities between the Parent, Guarantor and non-Guarantor, allocation of non-cash expenses from the Parent to the Guarantors andnon-Guarantors, non-cash intercompany dividends and the impact of foreign currency rate changes.
The following tables present the results of operations, financial position and cash flows of the Parent, the Guarantors and the non-Guarantors and the eliminationsnecessary to arrive at the information for the Company on a consolidated basis. As a result of the refinancing of the Senior Credit Facility in March 2019, certain domesticsubsidiaries that were previously Guarantors of the Senior Notes are now non-Guarantors. As such, prior period financial information has been recast to reflect the currentParent, Guarantor, and non-Guarantor structure.
58

ACTUANT CORPORATION
NOTES TO CONSOLIDATED FINANCIAL STATEMENTS-(Continued)
CONDENSED CONSOLIDATING STATEMENTS OF OPERATIONS AND COMPREHENSIVE INCOME (LOSS)(in thousands)
Year Ended August 31, 2019
Parent Guarantors Non-Guarantors Eliminations ConsolidatedNet sales $ 167,009 $ 70,621 $ 417,128 $ — $ 654,758Cost of products sold 46,220 44,007 271,879 — 362,106
Gross profit 120,789 26,614 145,249 — 292,652Selling, administrative and engineering expenses 85,399 20,095 103,737 — 209,231Amortization of intangible assets 1,272 2,600 5,050 — 8,922Restructuring charges 562 1,402 2,192 — 4,156Impairment & divestiture charges — 6,243 16,584 — 22,827
Operating profit (loss) 33,556 (3,726) 17,686 — 47,516Financing costs (income), net 28,716 — (553) — 28,163Intercompany (income) expense, net (15,020) 21,573 70,086 (76,639) —Intercompany dividends (447,637) (39,208) — 486,845 —Other (income) expense, net (435) 1 1,063 — 629
Earnings (loss) before income tax (benefit) expense 467,932 13,908 (52,910) (410,206) 18,724Income tax (benefit) expense (5,113) (2,395) 18,165 — 10,657
Earnings (loss) from continuing operations 473,045 16,303 (71,075) (410,206) 8,067Loss from discontinued operations (3,148) (93,730) (83,695) (76,639) (257,212)
Net earnings (loss) before equity in loss of subsidiaries 469,897 (77,427) (154,770) (486,845) (249,145)Equity in loss of subsidiaries (719,042) (28,354) 11,064 736,332 —
Net loss (249,145) (105,781) (143,706) 249,487 (249,145)Comprehensive loss $ (246,572) $ (105,781) $ (137,292) $ 243,073 $ (246,572)
59

ACTUANT CORPORATIONNOTES TO CONSOLIDATED FINANCIAL STATEMENTS-(Continued)
CONDENSED CONSOLIDATING STATEMENTS OF OPERATIONS AND COMPREHENSIVE LOSS(in thousands)
Year Ended August 31, 2018
Parent Guarantors Non-Guarantors Eliminations ConsolidatedNet sales $ 159,411 $ 65,128 $ 416,764 $ — $ 641,303Cost of products sold 29,811 41,674 286,534 — 358,019
Gross profit 129,600 23,454 130,230 — 283,284Selling, administrative and engineering expenses 81,028 22,540 106,688 — 210,256Amortization of intangible assets 1,272 2,892 5,116 — 9,280Restructuring charges 6,109 661 3,785 10,555Impairment & divestiture charges (benefit) 4,217 — (1,230) — 2,987
Operating profit (loss) 36,974 (2,639) 15,871 — 50,206Financing costs (income), net 31,752 — (880) — 30,872Intercompany (income) expense, net (17,087) 16,276 (46,961) 47,772 —Intercompany dividends — (28,822) — 28,822 —Other (income) expense, net (826) 18 946 — 138
Earnings before income tax (benefit) expense 23,135 9,889 62,766 (76,594) 19,196Income tax (benefit) expense (35,134) 21,689 27,895 — 14,450
Earnings (loss) from continuing operations 58,269 (11,800) 34,871 (76,594) 4,746(Loss) earnings from discontinued operations (5,951) 9,342 (77,557) 47,772 (26,394)
Net earnings (loss) before equity in (loss) earnings ofsubsidiaries 52,318 (2,458) (42,686) (28,822) (21,648)
Equity in (loss) earnings of subsidiaries (73,966) (54,385) 613 127,738 —Net loss (21,648) (56,843) (42,073) 98,916 (21,648)
Comprehensive income (loss) $ 31,368 $ (56,843) $ 9,555 $ 47,288 $ 31,368
60

ACTUANT CORPORATIONNOTES TO CONSOLIDATED FINANCIAL STATEMENTS-(Continued)
CONDENSED CONSOLIDATING STATEMENTS OF EARNINGS AND COMPREHENSIVE LOSS(in thousands)
Year Ended August 31, 2017
Parent Guarantors Non-Guarantors Eliminations ConsolidatedNet sales $ 145,222 $ 74,008 $ 397,361 $ — $ 616,591Cost of products sold 35,244 45,994 274,983 — 356,221
Gross profit 109,978 28,014 122,378 — 260,370Selling, administrative and engineering expenses 76,816 24,958 106,354 — 208,128Amortization of intangible assets 1,272 2,892 4,933 — 9,097Director & officer transition charges 7,784 — — — 7,784Restructuring charges 634 19 2,581 — 3,234Impairment & divestiture charges — — 116,979 — 116,979
Operating profit (loss) 23,472 145 (108,469) — (84,852)Financing costs (income), net 30,005 — (784) — 29,221Intercompany (income) expense, net (23,302) 84,562 (67,796) 6,536 —Intercompany dividends — (231,689) (5,623) 237,312 —Other expense (income), net 3,303 (26) 539 — 3,816
Earnings (loss) before income tax (benefit) expense 13,466 147,298 (34,805) (243,848) (117,889)Income tax (benefit) expense (4,623) (18,477) 486 — (22,614)
Net earnings (loss) from continuing operations 18,089 165,775 (35,291) (243,848) (95,275)Net (loss) earnings from discontinued operations (6,362) 9,791 19,097 6,536 29,062
Net earnings (loss) before equity in (loss) earnings ofsubsidiaries 11,727 175,566 (16,194) (237,312) (66,213)
Equity in (loss) earnings of subsidiaries (77,940) (67,668) 316 145,292 —Net (loss) earnings (66,213) 107,898 (15,878) (92,020) (66,213)
Comprehensive (loss) income $ (41,651) $ 90,011 $ 43,818 $ (133,829) $ (41,651)
61

ACTUANT CORPORATION
NOTES TO CONSOLIDATED FINANCIAL STATEMENTS-(Continued)
CONDENSED CONSOLIDATING BALANCE SHEETS(in thousands)
August 31, 2019
Parent Guarantors Non-Guarantors Eliminations ConsolidatedASSETS Current assets
Cash and cash equivalents $ 47,581 $ — $ 163,570 $ — $ 211,151Accounts receivable, net 20,322 11,358 94,203 — 125,883Inventories, net 26,737 6,566 43,884 — 77,187Assets from discontinued operations 295 145,239 140,044 — 285,578Other current assets 12,116 1,797 16,613 — 30,526
Total current assets 107,051 164,960 458,314 — 730,325Property, plant & equipment, net 8,515 5,193 43,021 — 56,729Goodwill 38,847 57,342 164,226 — 260,415Other intangibles, net 5,611 8,451 38,313 — 52,375Investment in subsidiaries 1,323,587 912,297 417,022 (2,652,906) —Intercompany receivable — — 979,889 (979,889) —Other long-term assets 27,510 (13,424) 10,344 — 24,430
Total assets $ 1,511,121 $ 1,134,819 $ 2,111,129 $ (3,632,795) $ 1,124,274
LIABILITIES & SHAREHOLDERS' EQUITY Current liabilities
Trade accounts payable $ 23,678 $ 3,231 $ 50,005 $ — $ 76,914Accrued compensation and benefits 11,495 1,657 13,269 — 26,421Current maturities of debt 7,500 — — — 7,500Income taxes payable — — 4,838 — 4,838Liabilities from discontinued operations 1,217 29,292 113,254 — 143,763Other current liabilities 17,556 2,388 21,021 — 40,965
Total current liabilities 61,446 36,568 202,387 — 300,401Long-term debt 452,945 — — — 452,945Deferred income taxes (4) — 1,568 — 1,564Pension and post-retirement benefit liabilities 12,005 — 8,208 — 20,213Other long-term liabilities 44,621 114 3,237 — 47,972Intercompany payable 638,929 340,960 — (979,889) —Shareholders’ equity 301,179 757,177 1,895,729 (2,652,906) 301,179
Total liabilities and shareholders’ equity $ 1,511,121 $ 1,134,819 $ 2,111,129 $ (3,632,795) $ 1,124,274
62

ACTUANT CORPORATIONNOTES TO CONSOLIDATED FINANCIAL STATEMENTS-(Continued)
CONDENSED CONSOLIDATING BALANCE SHEETS(in thousands)
August 31, 2018
Parent Guarantors Non-Guarantors Eliminations ConsolidatedASSETS Current assets
Cash and cash equivalents $ 67,945 $ — $ 182,545 $ — $ 250,490Accounts receivable, net 19,969 15,634 87,658 — 123,261Inventories, net 22,646 5,121 44,253 — 72,020Assets from discontinued operations (1,144) 255,676 314,401 — 568,933Other current assets 6,953 2,421 23,155 — 32,529
Total current assets 116,369 278,852 652,012 — 1,047,233Property, plant & equipment, net 7,634 4,481 42,859 — 54,974Goodwill 38,847 57,342 183,943 — 280,132Other intangible assets, net 6,884 17,294 47,479 — 71,657Investment in subsidiaries 1,836,879 918,050 301,782 (3,056,711) —Intercompany receivables — — 937,259 (937,259) —Other long-term assets 14,972 50 16,199 — 31,221
Total assets $ 2,021,585 $ 1,276,069 $ 2,181,533 $ (3,993,970) $ 1,485,217
LIABILITIES & SHAREHOLDERS' EQUITY Current liabilities
Trade accounts payable $ 16,091 $ 2,646 $ 50,847 $ — $ 69,584Accrued compensation and benefits 19,643 1,774 14,575 — 35,992Current maturities of debt 30,000 — — — 30,000Income taxes payable — — 4,091 — 4,091Liabilities from discontinued operations 17,839 20,384 122,350 — 160,573Other current liabilities 17,380 6,017 30,371 — 53,768
Total current liabilities 100,953 30,821 222,234 — 354,008Long-term debt 502,695 — — — 502,695Deferred income taxes 2,415 — 1,532 — 3,947Pension and post-retirement benefit liabilities 7,765 — 6,192 — 13,957Other long-term liabilities 45,483 265 6,150 — 51,898Intercompany payable 803,562 133,697 — (937,259) —Shareholders’ equity 558,712 1,111,286 1,945,425 (3,056,711) 558,712
Total liabilities and shareholders’ equity $ 2,021,585 $ 1,276,069 $ 2,181,533 $ (3,993,970) $ 1,485,217
63

ACTUANT CORPORATION
NOTES TO CONSOLIDATED FINANCIAL STATEMENTS-(Continued)
CONDENSED CONSOLIDATING STATEMENTS OF CASH FLOWS(in thousands)
Year Ended August 31, 2019
Parent Guarantors Non-Guarantors Eliminations ConsolidatedOperating Activities
Cash provided by (used in) operating activities - continuing operations $ 182,274 $ 107,127 $ (6,856) $ (241,642) $ 40,903Cash (used in) provided by operating activities - discontinued operations (163,135) 147,274 136,264 (107,461) 12,942
Cash provided by operating activities 19,139 254,401 129,408 (349,103) 53,845Investing Activities Capital expenditures (2,292) (2,042) (10,589) — (14,923)Proceeds from sale of property, plant and equipment 2 — 1,460 — 1,462Intercompany investment 47,104 — (49,366) 2,262 —
Cash provided by (used in) investing activities - continuing operations 44,814 (2,042) (58,495) 2,262 (13,461)Cash provided by (used in) investing activities - discontinued operations 21,039 (3,288) 30,988 (24,232) 24,507
Cash provided by (used in) investing activities 65,853 (5,330) (27,507) (21,970) 11,046Financing Activities Payment for redemption of term loan (200,000) — — — (200,000)Proceeds from issuance of term loan 200,000 — — — 200,000Principal Repayments on term loan (72,500) — — — (72,500)Purchase of treasury shares (22,481) — — — (22,481)Taxes paid related to the net share settlement of equity awards (1,872) — — — (1,872)Stock option exercises, related tax benefits and other 1,900 — — — 1,900Cash dividends (2,439) — — — (2,439)Payment of debt issuance costs (2,125) — — — (2,125)Intercompany dividends paid — (30,465) (85,941) 116,406 —Intercompany loan activity (5,839) — (21,894) 27,733 —Intercompany capital contribution — (42,539) (80,880) 123,419 —
Cash used in financing activities - continuing operations (105,356) (73,004) (188,715) 267,558 (99,517)Cash (used in) provided by financing activities - discontinued operations — (176,067) 72,552 103,515 —
Cash used in financing activities (105,356) (249,071) (116,163) 371,073 (99,517)Effect of exchange rate changes on cash — — (4,713) — (4,713)Net decrease in cash and cash equivalents (20,364) — (18,975) — (39,339)Cash and cash equivalents—beginning of period 67,945 — 182,545 — 250,490Cash and cash equivalents—end of period $ 47,581 $ — $ 163,570 $ — $ 211,151
64

ACTUANT CORPORATIONNOTES TO CONSOLIDATED FINANCIAL STATEMENTS-(Continued)
CONDENSED CONSOLIDATING STATEMENTS OF CASH FLOWS(in thousands)
Year Ended August 31, 2018
Parent Guarantors Non-Guarantors Eliminations ConsolidatedOperating Activities
Cash provided by operating activities - continuing operations $ 66,416 $ 11,374 $ 60,866 $ (66,740) $ 71,916Cash provided by operating activities - discontinued operations (3,123) 13,399 23,944 (43) 34,177
Cash provided by operating activities 63,293 24,773 84,810 (66,783) 106,093Investing Activities Capital expenditures (2,822) (2,320) (5,879) — (11,021)Proceeds from sale of property, plant and equipment — — 104 — 104Intercompany investment (11,754) — — 11,754 —Rental asset buyout for Viking divestiture — — (27,718) — (27,718)Proceeds from sale of business, net of transaction costs 198 — 8,704 — 8,902Cash paid for business acquisitions, net of cash acquired — (1,732) (21,486) — (23,218)
Cash provided by (used in) investing activities - continuing operations (14,378) (4,052) (46,275) 11,754 (52,951)Cash provided by (used in) investing activities - discontinued operations — (2,664) (7,137) 1 (9,800)
Cash used in investing activities (14,378) (6,716) (53,412) 11,755 (62,751)Financing Activities Principal repayments on term loan (30,000) — — — (30,000)Taxes paid related to the net share settlement of equity awards (1,284) — — — (1,284)Stock option exercises, related tax benefits and other 15,681 — — — 15,681Cash dividends (2,390) — — — (2,390)Intercompany dividends paid — — (28,822) 28,822 —Intercompany loan activity 2,041 (18,057) 105,386 (89,370) —Intercompany capital contribution — — 100 (100) —
Cash used in financing activities - continuing operations (15,952) (18,057) 76,664 (60,648) (17,993)Cash used in financing activities - discontinued operations — — (115,676) 115,676 —
Cash used in financing activities (15,952) (18,057) (39,012) 55,028 (17,993)Effect of exchange rate changes on cash — — (4,430) — (4,430)Net decrease in cash and cash equivalents 32,963 — (12,044) — 20,919Cash and cash equivalents—beginning of period 34,982 — 194,589 $ — 229,571Cash and cash equivalents—end of period $ 67,945 $ — $ 182,545 $ — $ 250,490
65

ACTUANT CORPORATIONNOTES TO CONSOLIDATED FINANCIAL STATEMENTS-(Continued)
CONDENSED CONSOLIDATING STATEMENTS OF CASH FLOWS(in thousands)
Year Ended August 31, 2017
Parent Guarantors Non-Guarantors Eliminations ConsolidatedOperating Activities
Cash provided by operating activities - continuing operations $ 112,557 $ (93,067) $ (201,903) $ 230,505 $ 48,092Cash provided by operating activities - discontinued operations (23,697) 14,820 42,748 6,536 40,407
Cash provided by operating activities 88,860 (78,247) (159,155) 237,041 88,499Investing Activities Capital expenditures (2,697) (1,824) (12,717) — (17,238)Proceeds from sale of property, plant and equipment — — 448 — 448Intercompany investment 2,882 78,154 (26,600) (54,436) —
Cash provided by (used in) investing activities - continuing operations 185 76,330 (38,869) (54,436) (16,790)Cash provided by (used in) investing activities - discontinued operations — (3,436) (7,399) — (10,835)
Cash used in investing activities 185 72,894 (46,268) (54,436) (27,625)Financing Activities Principal Repayments on term loan (18,750) — — — (18,750)Redemption of 5.625% senior notes (500) — — — (500)Taxes paid related to the net share settlement of equity awards (1,065) — — — (1,065)Stock option exercises, related tax benefits and other 8,265 — — — 8,265Cash dividends (2,358) — — — (2,358)Intercompany dividends paid — — 231,688 (231,688) —Intercompany loan activity (47,780) — 47,780 — —Intercompany capital contribution — — (54,436) 54,436 —
Cash used in financing activities - continuing operations (62,188) — 225,032 (177,252) (14,408)Cash used in financing activities - discontinued operations — 5,353 (742) (5,353) (742)
Cash used in financing activities (62,188) 5,353 224,290 (182,605) (15,150)Effect of exchange rate changes on cash — — 4,243 — 4,243Net decrease in cash and cash equivalents 26,857 — 23,110 — 49,967Cash and cash equivalents—beginning of period 8,125 $ — 171,479 — 179,604Cash and cash equivalents—end of period $ 34,982 $ — $ 194,589 $ — $ 229,571
66

ACTUANT CORPORATION
NOTES TO CONSOLIDATED FINANCIAL STATEMENTS-(Continued)
Note 18. Director & Officer Transition Charges
During the year-ended August 31, 2017, the Company recorded separation and transition charges of $7.8 million in connection with the retirement of one director of theCompany's Board of Directors and the transition of the Executive Vice President/Chief Financial Officer. The charges were mainly comprised of compensation expense foraccelerated equity vesting, severance, outplacement, legal, signing bonus and relocation costs.
Note 19. Quarterly Financial Data (Unaudited)Quarterly financial data for fiscal 2019 and fiscal 2018 is as follows:
Year to date August 31, 2019
First Second Third Fourth TotalNet sales $ 158,551 $ 159,788 $ 178,095 $ 158,324 $ 654,758Gross profit 70,312 71,316 81,954 69,070 292,652Net (loss) earnings from continuing operations (16,423) 765 26,858 (3,133) 8,067Net (loss) earnings per share from continuing operations:
Basic $ (0.27) $ 0.01 $ 0.44 $ (0.05) $ 0.13Diluted $ (0.27) $ 0.01 $ 0.43 $ (0.05) $ 0.13
Year to date August 31, 2018
First Second Third Fourth TotalNet sales $ 155,767 $ 148,601 $ 170,466 $ 166,469 $ 641,303Gross profit 68,704 62,216 79,003 73,361 283,284Net (loss) earnings from continuing operations (2,841) (21,568) 17,827 11,328 4,746Net (loss) earnings per share from continuing operations :
Basic $ (0.05) $ (0.36) $ 0.29 $ 0.19 $ 0.08Diluted $ (0.05) $ (0.36) $ 0.29 $ 0.18 $ 0.08
The total of the individual quarters may not equal the annual or year-to-date total due to rounding.
During the year ended August 31, 2019, the Company recognized impairment and divestiture charges of $22.8 million of which $23.5 million was recorded in the firstquarter, $6.1 million in the second quarter, a benefit of $13.0 million in the third quarter and a charge of $6.2 million in the fourth quarter (see Note 6, "Goodwill, IntangibleAssets and Long-Lived Assets").
During the second quarter of fiscal 2018, the Company recognized impairment and divestiture charges of $3.0 million (see Note 5, "Divestiture Activities").
67

ACTUANT CORPORATIONSCHEDULE II—VALUATION AND QUALIFYING ACCOUNTS
(in thousands)
Additions Deductions
Balance atBeginning of
Period
Charged toCosts and
Expenses (Income) Acquisition/(Divestiture)
AccountsWritten Off
LessRecoveries Other
Balance atEnd ofPeriod
Allowance for losses—Trade accounts receivable August 31, 2019 $ 4,958 $ 1,114 $ — $ (833) $ (98) $ 5,141August 31, 2018 10,488 (1,732) 76 (3,571) (303) 4,958August 31, 2017 6,936 3,792 883 (1,187) 64 10,488
Valuation allowance—Income taxes August 31, 2019 $ 32,426 $ 43,693 $ — $ (2,864) $ — $ 73,255August 31, 2018 16,758 27,504 — (11,836) — 32,426August 31, 2017 2,487 14,874 — (603) — 16,758
68

Item 9. Changes in and Disagreements with Accountants on Accounting and Financial DisclosureNone.
Item 9A. Controls and ProceduresDisclosure Controls and Procedures
The Company’s management, with the participation of the Company’s Chief Executive Officer and Chief Financial Officer, have evaluated the effectiveness of theCompany’s disclosure controls and procedures (as such term is defined in Rules 13a-15(e) and 15d-15(e) under the Securities Exchange Act of 1934, as amended (“theExchange Act”)) as of the end of the period covered by this report. Based on such evaluation, the Company’s Chief Executive Officer and Chief Financial Officer haveconcluded that, as of the end of such period, the Company’s disclosure controls and procedures are effective in recording, processing, summarizing, and reporting, on a timelybasis, information required to be disclosed by the Company in the reports that it files or submits under the Exchange Act, and that information is accumulated andcommunicated to the Chief Executive Officer and Chief Financial Officer, as appropriate, to allow timely discussions regarding required disclosure.
Management’s Report on Internal Control Over Financial ReportingThe Company’s management is responsible for establishing and maintaining adequate internal control over financial reporting, as such term is defined in Exchange Act
Rule 13a-15(f). The Company’s management, with the participation of the Company’s Chief Executive Officer and Chief Financial Officer, has evaluated the effectiveness ofthe Company’s internal control over financial reporting based on the framework in Internal Control-Integrated Framework (2013) issued by the Committee of SponsoringOrganizations of the Treadway Commission. Based on this evaluation, the Company’s management has concluded that, as of August 31, 2019, the Company’s internal controlover financial reporting was effective.
Because of its inherent limitations, internal control over financial reporting may not prevent or detect misstatements. Also, projections of any evaluation of theeffectiveness to future periods are subject to the risk that the controls may become inadequate because of changes in conditions, or that the degree of compliance with thepolicies or procedures may deteriorate.
PricewaterhouseCoopers LLP, an independent registered public accounting firm, has audited the Company’s effectiveness of internal controls over financial reporting asof August 31, 2019, as stated in their report which is included herein.
Changes in Internal Control Over Financial ReportingThere were no changes in the Company’s internal control over financial reporting during the fourth quarter of fiscal 2019 that materially affected, or are reasonably likely
to materially affect, the Company’s internal control over financial reporting. Item 9B. Other Information
None.
69

PART III Item 10. Directors; Executive Officers and Corporate Governance
Information about the Company’s directors is incorporated by reference from the “Election of Directors” section of the Company’s Proxy Statement for its AnnualMeeting of Shareholders to be held on January 28, 2020 (the “2020 Annual Meeting Proxy Statement”). Information about compliance with Section 16(a) of the Exchange Actis incorporated by reference from the “Other Information—Section 16(a) Beneficial Ownership Reporting Compliance” section in the Company’s 2020 Annual Meeting ProxyStatement. Information about the Company’s Audit Committee, including the members of the committee, and the Company’s Audit Committee financial experts, is incorporatedby reference from the “Election of Directors” and “Corporate Governance Matters” sections of the Company’s 2020 Annual Meeting Proxy Statement. Information about theCompany’s executive officers required by this item is contained in the discussion entitled “Executive Officers of the Registrant” in Part I hereof.
The Company has adopted a code of ethics that applies to its senior executive team, including its Chief Executive Officer, Chief Financial Officer and CorporateController. The code of ethics is posted on the Company’s website and is available free of charge at www.enerpactoolgroup.com. The Company intends to satisfy therequirements under Item 5.05 of Form 8-K regarding disclosure of amendments to, or waivers from, provisions of its code of ethics that apply to the Chief Executive Officer,Chief Financial Officer or Corporate Controller by posting such information on the Company’s website.
Item 11. Executive Compensation
The information required by this item is incorporated by reference from the “Election of Directors,” “Corporate Governance Matters” and the “Executive Compensation”sections (other than the subsection thereof entitled “Report of the Audit Committee”) of the 2020 Annual Meeting Proxy Statement. Item 12. Security Ownership of Certain Beneficial Owners and Management and Related Stockholder Matters
The information required by this item is incorporated by reference from the “Certain Beneficial Owners” and “Executive Compensation—Equity Compensation PlanInformation” sections of the 2020 Annual Meeting Proxy Statement. Item 13. Certain Relationships and Related Transactions, and Director Independence
The information required by this item is incorporated by reference from the “Certain Relationships and Related Party Transactions” section of the 2020 Annual MeetingProxy Statement. Item 14. Principal Accountant Fees and Services
The information required by this item is incorporated by reference from the “Other Information—Independent Public Accountants” section of the 2020 Annual MeetingProxy Statement.
70

PART IV Item 15. Exhibits, Financial Statement Schedules
(a) Documents filed as part of this report:1. Consolidated Financial Statements
See “Index to Consolidated Financial Statements” set forth in Item 8, “Financial Statements and Supplementary Data” for a list of financial statements filed aspart of this report.
2. Financial Statement SchedulesSee “Index to Financial Statement Schedule” set forth in Item 8, “Financial Statements and Supplementary Data.”
3. ExhibitsSee “Index to Exhibits” beginning on page 74, which is incorporated herein by reference.
Item 16. Form 10-K Summary
None.
71

SIGNATURESPursuant to the requirements of Section 13 or 15(d) of the Securities Exchange Act of 1934, the Registrant has duly caused this report to be signed on its behalf
by the undersigned, thereunto duly authorized.
ACTUANT CORPORATION(Registrant)
By: /S/ RICK T. DILLON Rick T. Dillon Executive Vice President and Chief Financial Officer (Principal Financial Officer)
Dated: October 28, 2019
POWER OF ATTORNEY
KNOWN ALL MEN BY THESE PRESENTS, that each person whose signature appears below constitutes and appoints Randal W. Baker and Rick T. Dillon,and each of them, his true and lawful attorneys-in-fact and agents, with full power of substitution and resubstitution, for him and in his name, place and stead, in anyand all capacities, to sign any and all amendments to this report, and to file the same, with all and any other regulatory authority, granting unto said attorneys-in-factand agents, and each of them, full power and authority to do and perform each and every act and thing requisite and necessary to be done in and about the premises,as fully to all intents and purposes as he might or could do in person, hereby ratifying and confirming all that said attorneys-in-fact and agents or any of them, ortheir substitutes, may lawfully do or cause to be done by virtue hereof.
72

Pursuant to the requirements of the Securities Exchange Act of 1934, this report has been signed below by the following persons on behalf of the registrant and in thecapacities and on the dates indicated.*
Signature Title
/s/ RANDAL W. BAKER President and Chief Executive Officer, Director
Randal W. Baker
/s/ ALFREDO ALTAVILLA DirectorAlfredo Altavilla
/s/ J. PALMER CLARKSON Director
J. Palmer Clarkson
/s/ DANNY L. CUNNINGHAM DirectorDanny L. Cunningham
/s/ E. JAMES FERLAND Chairman of the Board of Directors
E. James Ferland
/s/ RICHARD D. HOLDER DirectorRichard D. Holder
/s/ SIDNEY S. SIMMONS Director
Sidney S. Simmons
/s/ HOLLY A. VAN DEURSEN DirectorHolly A. Van Deursen
/s/ RICK T. DILLON Executive Vice President and Chief Financial Officer (Principal Financial Officer)
Rick T. Dillon
/s/ BRYAN R. JOHNSON Vice President of Finance and Principal Accounting OfficerBryan R. Johnson
* Each of the above signatures is affixed as of October 28, 2019.
73

ACTUANT CORPORATION(the “Registrant”)
(Commission File No. 1-11288)ANNUAL REPORT ON FORM 10-K
FOR THE FISCAL YEAR ENDED AUGUST 31, 2019INDEX TO EXHIBITS
Exhibit Description Incorporated Herein By Reference To Filed
Herewith Furnished Herewith
2.1
Securities Purchase Agreement, dated as of July 8, 2019, byand between Actuant Corporation, BRWS Parent LLC,Actuant France SAS and Actuant Holdings AB.
Exhibit 2.1 to the Registrant's Current Reporton Form 8-K filed on July 9, 2019
3.1
(a) Amended and Restated Articles of Incorporation
Exhibit 4.9 to the Registrant's Form 10-Q forthe quarter ended February 28, 2001
(b) Amendment to Amended and Restated Articles ofIncorporation
Exhibit 3.1(b) of the Registrant's Form 10-Kfor the fiscal year ended August 31, 2003
(c) Amendment to Amended and Restated Articles ofIncorporation
Exhibit 3.1 to the Registrant's Form 10-K forthe fiscal year ended August 31, 2004
(d) Amendment to Amended and Restated Articles ofIncorporation
Exhibit 3.1 to the Registrant's Form 8-K filedon July 18, 2006
(e) Amendment of Amended and Restated Articles ofIncorporation
Exhibit 3.1 to the Registrant's Form 8-K filedon January 14, 2010
3.2
Amended and Restated Bylaws, as amended
Exhibit 3.1 of the Registrant's Form 8-K filedon July 23, 2015
4.1
Indenture dated April 16, 2012 by and among ActuantCorporation, the subsidiary guarantors named therein and U.S.Bank National Association as trustee relating to $300 millionActuant Corporation 5 5/8% Senior Notes due 2022
Exhibit 4.1 to the Registrant's Current Reporton Form 8-K filed on April 18, 2012
4.2 Description of Registered Securities X
74

Exhibit Description Incorporated Herein By Reference To Filed
Herewith Furnished Herewith
10.1
Senior Credit Facility Agreement, dated March 29, 2019,between Actuant Corporation, the foreign subsidiaryborrowers party thereto, the lenders party thereto, JPMorganChase Bank, N.A., as Administrative Agent, Wells FargoBank, National Association, Bank of America, N.A.,SunTrustBank, and PNC Bank, National Association, as Co-Syndication Agents and BMO Harris Bank, N.A., asDocumentation Agent.
Exhibit 10.1 of the Registrant's Current Reporton Form 8-K filed on April 2, 2019
10.2*
Outside Directors’ Deferred Compensation Plan (conformedthrough the second amendment)
Exhibit 10.1 to the Registrant's Form 10-Q forthe quarter ended November 30, 2014
10.3*
Actuant Corporation Deferred Compensation Plan (conformedthrough the fourth amendment)
Exhibit 10.2 to the Registrant's Form 10-Q forthe quarter ended November 30, 2014
10.4*
Actuant Corporation 2010 Employee Stock Purchase Plan
Exhibit B to the Registrant's Definitive ProxyStatement, dated December 4, 2009
10.5*
(a) Actuant Corporation 2017 Omnibus Incentive Plan
Exhibit A to the Registrant's Definitive ProxyStatement dated December 5, 2016
(b) First Amendment to the Actuant Corporation 2017Omnibus Incentive Plan
Exhibit A to the Registrant's Definitive ProxyStatement dated December 4, 2017
10.6*
Actuant Corporation 2009 Omnibus Incentive Plan,conformed through the Second Amendment thereto
Exhibit 99.1 to the Registrant's Form 8-K filedon January 17, 2013
10.7*
(a) Amended and Restated Actuant Corporation 2001 OutsideDirectors’ Stock Plan
Exhibit A to the Registrant's Definitive ProxyStatement, dated December 5, 2005
(b) First Amendment to the Amended and Restated ActuantCorporation 2001 Outside Directors’ Stock Plan datedDecember 25, 2008
Exhibit 10.10 to the Registrant's Form 10-Q forthe quarter ended November 30, 2008
10.8*
Actuant Corporation Supplemental Executive Retirement Plan(conformed through the first amendment)
Exhibit 10.3 to the Registrant's Form 10-Q forthe quarter ended November 30, 2014
10.9*
Actuant Corporation Senior Officer Severance Plan
Exhibit 10.1 to the Registrant's Current Reporton Form 8-K filed on July 31, 2019
10.10*
Form of Indemnification Agreement for Directors andOfficers
Exhibit 10.1 to the Registrant's Form 8-K filedon August 2, 2018
75

Exhibit Description Incorporated Herein By Reference To Filed
Herewith Furnished Herewith
10.11*
Form of Amended and Restated Actuant Corporation Changein Control Agreement
Exhibit 10.1 to the Registrant’s Form 8-K filedon August 1, 2017
10.12*
Actuant Corporation Executive Officer Bonus Plan
Exhibit B to the Registrant's Definitive ProxyStatement dated December 3, 2012
10.13
(a) Form of NQSO Award (Director) under ActuantCorporation 2009 Omnibus Incentive Plan*
Exhibit 10.1(a) to the Registrant's Form 10-Qfor the quarter ended February 28, 2014
(b) Form of NQSO Award (Officer) under ActuantCorporation 2009 Omnibus Incentive Plan*
Exhibit 10.1(b) to the Registrant's Form 10-Qfor the quarter ended February 28, 2014
10.14
(a) Form RSA Award (Director) under Actuant Corporation2009 Omnibus Incentive Plan*
Exhibit 10.2(a) to the Registrant's Form 10-Qfor the quarter ended February 28, 2014
(b) Form of RSA Award (Officer) under Actuant Corporation2009 Omnibus Incentive Plan*
Exhibit 10.2(b) to the Registrant's Form 10-Qfor the quarter ended February 28, 2014
10.15
(a) Form of RSU Award (Director) under Actuant Corporation2009 Omnibus Incentive Plan*
Exhibit 10.3(a) to the Registrant's Form 10-Qfor the quarter ended February 28, 2014
(b) Form of RSU Award (Officer) under Actuant Corporation2009 Omnibus Incentive Plan*
Exhibit 10.3(b) to the Registrant's Form 10-Qfor the quarter ended February 28, 2014
10.16*
(a) Form RSA Award (Director) under Actuant Corporation2017 Omnibus Incentive Plan
Exhibit 10.14 to the Registrant's Form 10-K forthe fiscal year ended August 31, 2018
10.17
(a) Form of RSU Award (Director) under Actuant Corporation2017 Omnibus Incentive Plan*
Exhibit 10.15(a) to the Registrant's Form 10-Kfor the fiscal year ended August 31, 2018
(b) Form of RSU Award (Officer) under Actuant Corporation2017 Omnibus Incentive Plan*
Exhibit 10.15(b) to the Registrant's Form 10-Kfor the fiscal year ended August 31, 2018
10.18
(a) Form of PSU Award - Total Shareholder Return (Officer)under Actuant Corporation 2017 Omnibus Incentive Plan*
Exhibit 10.16(a) to the Registrant's Form 10-Kfor the fiscal year ended August 31, 2018
(b) Form of PSU Award - Free Cash Flow (Officer) underActuant Corporation 2017 Omnibus Incentive Plan*
Exhibit 10.16(b) to the Registrant's Form 10-Kfor the fiscal year ended August 31, 2018
10.19*
Offer letter dated February 24, 2016 between ActuantCorporation and Randal W. Baker
Exhibit 10.1 to the Registrant's Form 8-K filedon March 1, 2016
76

Exhibit Description Incorporated Herein By Reference To Filed
Herewith Furnished Herewith
10.20*
Offer Letter by and between Actuant Corporation and Rick T.Dillon
Exhibit 10.1 to Registrant's Form 8-K filed onNovember 18, 2016
10.21*
Offer Letter by and between Actuant Corporation and AndréL. Williams dated September 11, 2017
Exhibit 10.23 of the Registrant’s Form 10-Kfor the fiscal year ended August 31, 2017
10.22*
Offer letter by and between Actuant Corporation and JohnJeffery Schmaling dated January 18, 2018
Exhibit 10.3 of the Registrant's Form 10-Q forthe quarter ended February 28, 2018.
10.23*
Offer letter by and between Actuant Corporation and FabrizioR. Rasetti dated April 12, 2018
Exhibit 10.1 of the Registrant's Form 10-Q forthe quarter ended May 31, 2018.
10.24*
Retention Incentives Agreement, dated as of April 11, 2019,between Actuant Corporation and Roger A. Roundhouse
Exhibit 10.2 of the Registrant's Form 10-Q forthe quarter ended May 31, 2019
10.25*
Retirement Agreement and Release dated as of July 17, 2019between Actuant Corporation and André L. Williams
Exhibit 10.1 to the Registrant's Current Reporton Form 8-K filed on July 22, 2019
10.26
Agreement by and between Actuant Corporation andSoutheastern Capital Management dated March 20, 2018
Exhibit 10.1 of Registrant's Form 8-K filed onMarch 21, 2018
14
Code of Ethics Applicable to Senior Financial Executives
Exhibit 14 of the Registrant’s Form 10-K forthe fiscal year ended August 31, 2017
21 Subsidiaries of the Registrant X
23 Consent of PricewaterhouseCoopers LLP X
24
Power of Attorney
See signature pageof this report
31.1
Certification of Chief Executive Officer pursuant to Section302 of the Sarbanes-Oxley Act of 2002
X
31.2
Certification of Chief Financial Officer pursuant to Section302 of the Sarbanes-Oxley Act of 2002
X
32.1
Certification of Chief Executive Officer pursuant to Section906 of the Sarbanes-Oxley Act of 2002
X
77

Exhibit Description Incorporated Herein By Reference To Filed
Herewith Furnished Herewith
32.2
Certification of Chief Financial Officer pursuant to Section906 of the Sarbanes-Oxley Act of 2002
X
101
The following materials from the Actuant Corporation Form10-K for the year ended August 31, 2019 formatted inExtensible Business Reporting Language (XBRL): (i) theConsolidated Statements of Operations, (ii) the ConsolidatedStatements of Comprehensive Income (Loss), (iii) theConsolidated Balance Sheets, (iv) the ConsolidatedStatements of Cash Flows and (v) the Notes to ConsolidatedFinancial Statements.
X
* Management contract or compensatory plan or arrangement.
78

Exhibit 4.2
Description of Registered Securities
Actuant Corporation (the “Company”) has one class of securities registered under Section 12 of the Securities Exchange Act of 1934, as amended (the “Exchange Act”),which is its Class A Common Stock, $.20 par value (“Class A Common”). Shares of the Class A Common are listed for trading on the New York Stock Exchange (the “NYSE”)under the symbol “ATU”.
The following is a summary of selected provisions of the Company’s Restated Articles of Incorporation, as amended (the “Articles”), its Amended and Restated Bylaws,as amended (the “Bylaws”), and of the Wisconsin Business Corporation Law (the “WBCL”). This summary is not complete and is subject to, and qualified in its entirety byreference to, the Articles and the Bylaws, which have been filed as exhibits to the Company’s most recent Annual Report on Form 10-K filed with the Securities and ExchangeCommission, and the WBCL.
The authorized capital stock of the Company as of August 31, 2019 consisted of 168,000,000 shares of Class A Common of which 60,465,111 shares were issued andoutstanding and 21,455,568 were held as treasury shares; 1,500,000 shares of Class B Common Stock, $.20 par value (“Class B Common”), none of which were issued andoutstanding; and 160,000 shares of Cumulative Preferred Stock, $1.00 par value (“Preferred Stock”), none of which have been issued. Class A Common and Class B Commonare collectively referred to herein as “Common Stock.” Although no shares of Preferred Stock or Class B Common are outstanding, and all previously outstanding shares ofClass B Common were converted into shares of Class A Common many years ago, the Company’s Board of Directors is authorized to issue shares of Preferred Stock or Class BCommon without any action on the part of the Company’s shareholders, except to the extent that shareholder approval is required under the applicable rules of the NYSE.Accordingly, this summary includes a discussion of the Preferred Stock and Class B Common because the rights of holders of shares of Class A Common would be affected ifshares of Preferred Stock and Class B Common were to be issued.
Preferred Stock
The Preferred Stock may be issued in one or more series providing for such designations, preferences, relative rights, dividend rates, voting, liquidation, redemption, andconversion rights, and such other terms and conditions as the Company’s Board of Directors may determine and which shall be stated in the resolution providing for thedesignation and issue of such series, subject to the limitations described below, without further approval by holders of Common Stock. If any shares of Class B Common wereoutstanding, any voting rights conferred on holders of Preferred Stock would be limited, with respect to the election of directors, to the power to vote together with holders ofClass A Common in electing a “maximum minority” of the Board of Directors, as described under “-Common Stock” below.
If the Company issues any shares of Preferred Stock, the Company would be permitted to pay dividends or make other distributions upon the Common Stock (except fordistributions payable in shares of Common Stock) only after paying or setting apart funds for payment of current dividends and any accrued but unpaid dividends upon theoutstanding shares of Preferred Stock, at the rate or rates designated for each series of outstanding Preferred Stock. Dividends on the Preferred Stock are cumulative, so that ifat any time the full amount of all dividends accrued on the Preferred Stock is not paid, the deficiency must be paid before any dividends or other distributions are paid or setapart on the Common Stock, other than dividends or distributions paid in Common Stock.
In the event of voluntary or involuntary liquidation of the Company, the holders of any outstanding Preferred Stock would be entitled to receive all accrued dividends onthe Preferred Stock and the liquidation amount specified for each series of Preferred Stock before any amount may be distributed to holders of the Common Stock. Under theArticles, each series of preferred stock will, with respect to dividend rights and rights on liquidation, rank prior in right of payment to the Common Stock and on a parity in rightof payment with each other series of Preferred Stock.
Under the Articles, all shares of Preferred Stock shall be identical except as to the following relative rights and preferences, as to which the Company’s Board of Directorsmay establish variations between different series not inconsistent with other provisions in the Articles: (i) the dividend rate, (ii) the price at and terms and conditions on whichshares may be redeemed, (iii) the amount payable upon shares in the event of voluntary or involuntary liquidation, (iv) sinking fund provisions for the redemption or purchase ofshares, (v) the terms and conditions on which shares may be converted into Common Stock, if the shares of any series are issued with the privilege of conversion and (vi) votingrights, if any, subject to the provisions regarding voting rights summarized herein.

Common Stock
The rights and preferences of shares of Class A Common and Class B Common are identical, except as to voting power with respect to the election of directors andconversion rights.
On all matters other than the election of directors, the holders of Class A Common and Class B Common possess equal voting power of one vote per share, voting as asingle class of stock, unless otherwise required by the WBCL. In the election of the Company’s Board of Directors, the holders of Class A Common, voting together as a singleclass with the holders of any Preferred Stock which has voting power, are entitled to elect a “maximum minority” of the number of directors to be elected. As a result of the“maximum minority” provision, the holders of the Class B Common, voting as a separate class, are entitled to elect the balance of the directors, constituting a “minimummajority” of the number of directors to be elected. If an even number of directors is to be elected, the holders of Class B Common will be entitled to elect two more directorsthan the holders of Class A Common and any Preferred Stock having voting power; if the number of directors to be elected is an odd number, the holders of Class B Commonwill be entitled to elect one more director than the holders of Class A Common and any Preferred Stock having voting power. In the event there are no shares of Class BCommon outstanding, holders of Class A Common, together with holders of any Preferred Stock having voting power, shall elect all of the directors to be elected. A director,once elected and duly qualified, may be removed only by the requisite affirmative vote of the holders of that class of stock by which such director was elected.
Holders of shares of Class A common stock and Class B common stock are ratably entitled to such dividends as the Company’s Board of Directors may declare out offunds legally available therefore, except as described below in the case of stock dividends. If the Company were to issue any shares of Preferred Stock, no dividends could bepaid or set apart for payment on shares of Common Stock, unless paid in Common Stock, until full cumulative dividends accrued on all of the issued and outstanding shares ofPreferred Stock had been paid or set apart for payment. Stock dividends on shares of Class A Common may be paid only in shares of Class A Common and stock dividends onshares of Class B Common may be paid only in shares of Class B Common.
In the event that the Company issues any shares of Class B Common, any holder of shares of Class B Common may convert any or all of those shares into Class ACommon on a share-for-share basis. If the Company issues any shares of Class B Common and the number of outstanding shares of Class B Common is reduced to less than500,000 shares, adjusted to reflect any stock splits, stock dividends or similar transactions, all of the outstanding shares of Class B Common would be automatically convertedinto shares of Class A Common on a share-for-share basis. Holders of shares of Class A Common do not have any conversion rights.
In the event of the Company’s dissolution or liquidation, the holders of shares of Class A Common and of shares of Class B Common would be entitled to share ratably inall of assets remaining after payment of the Company’s liabilities and satisfaction of the rights of any series of Preferred Stock that may be outstanding. There are noredemption or sinking fund provisions with respect to the Common Stock.
Under the WBCL, when the Company receives the consideration for which its Board of Directors authorized the issuance of shares, the shares issued for that considerationare fully paid and nonassessable. Former Section 180.0622(2)(b) of the WBCL imposed personal liability on shareholders of Wisconsin corporations for debts owed toemployees for services performed, but not exceeding six months service in any one case. Pursuant to 2005 Wisconsin Act 474, Section 180.0622(2)(b) of the WBCL wasrepealed effective June 14, 2006 and is not applicable to obligations incurred by the Company on or after such date.
General
The Articles provide that the affirmative vote of two-thirds of all shares entitled to vote thereon (and/or of each class which shall be entitled to vote thereon as a class) isrequired in order to constitute shareholder approval or adoption of a merger, consolidation, or liquidation of the Company, sale, lease, exchange or other disposition of all orsubstantially all of its assets, amendment of the Articles or the Bylaws, or removal of a director.
The Company’s directors are currently elected to serve one-year terms. As permitted by the WBCL, the Articles provide that the Bylaws (which may be amended by theCompany’s Board of Directors or by the shareholders) may provide for the division of the Company’s Board of Directors into two or three classes of directors and for the termsand manner of election not inconsistent with the applicable provisions of the WBCL. If the Bylaws were amended to so classify the Board of Directors and any shares of Class BCommon were outstanding, each class of directors will contain as nearly as possible an equal number of directors elected by the holders of shares of Class A Common and anyoutstanding Preferred Stock, voting as a single class, and will also contain as nearly as possible an equal number of directors elected by holders of Class B Common, subject tothe right of the holders of the shares of Class B Common to elect the minimum majority of the Board of Directors as described above.
Holders of capital stock of the Company do not have preemptive or other subscription rights to purchase or subscribe for unissued stock or other securities of theCompany.
Certain statutory provisions
Wisconsin law, under which the Company is incorporated, contains certain provisions that may be important when considering the rights of holders of shares of Class ACommon. The description set forth below is intended as a summary only. For complete information, please review the applicable provisions of the WBCL.
These provisions of the WBCL, the ability to issue additional shares of Common Stock and Preferred Stock without further shareholder approval (except as required underapplicable rules of the NYSE), and certain other provisions of the Articles and Bylaws (discussed above) could have the effect, among others, of discouraging take-overproposals for the Company, delaying or preventing a change in control, or impeding a business combination between the Company and any of its major shareholders.
Business combination statute
Sections 180.1140 to 180.1144 of the WBCL regulate a broad range of business combinations between a resident domestic corporation and an “interested stockholder.” A“business combination” is defined to include any of the following transactions:
• a merger or shareexchange,
• a sale, lease, exchange, mortgage, pledge, transfer or other disposition of assets equal to 5% or more of the aggregate market value of the stock or assets of thecorporation or 10% of its earning power or income,
• the issuance or transfer of stock or rights to purchase stock with a market value equal to 5% or more of the outstandingstock,
• the adoption of a plan of liquidation ordissolution,
• any reclassification of securities or recapitalization of the resident domestic corporation, or any other transaction, if the effect is to increase the proportionateshare of its securities owned by the interested stockholder, and
• receipt by an interested stockholder of the benefit of a loan, advance, guarantee, pledge or other financial assistance provided by or through the corporation orits subsidiary, unless the benefit is received proportionately by all shareholders.
A “resident domestic corporation” is defined to mean a Wisconsin corporation that has a class of voting stock that is registered or traded on a national securities exchangeor that is registered under Section 12(g) of the Exchange Act and that, as of the relevant date, satisfies any of the following: (i) its principal offices are located in Wisconsin, (ii)it has significant business operations located in Wisconsin, (iii) more than 10% of the holders of record of its shares are residents of Wisconsin or (iv) more than 10% of itsshares are held of record by residents of Wisconsin. As of August 31, 2019, the Company would be a resident domestic corporation for purposes of these statutory provisions.
An “interested stockholder” is defined to mean a person who beneficially owns, directly or indirectly, at least 10% of the voting power of the outstanding voting stock of acorporation or who is an affiliate or associate of the corporation and beneficially owned at least 10% of the voting power of the then outstanding voting stock within the priorthree years.
Under this law, the Company cannot engage in a business combination with an interested stockholder for a period of three years following the date such person becomesan interested stockholder, unless the Company’s Board of Directors approved the business combination or the acquisition of the stock that resulted in the person becoming aninterested stockholder before the acquisition. The Company may engage in a business combination with an interested stockholder after the expiration of the three-year periodwith respect to that interested stockholder only if one or more of the following conditions is satisfied: (i) the Company’s Board of Directors approved the acquisition of thestock before the date on which the interested stockholder acquired the shares, (ii) the business combination is approved by a majority of the Company’s outstanding voting stocknot beneficially owned by the interested stockholder or (iii) the consideration to be received by the Company’s shareholders meets certain fair price requirements of the statutewith respect to form and amount.
Fair price statute
The WBCL also provides, in Sections 180.1130 to 180.1133, that certain mergers, share exchanges or sales, leases, exchanges or other dispositions of assets in atransaction involving a “significant shareholder” and a resident domestic corporation, such as the Company, require a supermajority vote of shareholders in addition to anyapproval otherwise required, unless shareholders receive a fair price for their shares that satisfies a statutory formula. A “significant shareholder” for this

purpose is defined as a person or group who beneficially owns, directly or indirectly, 10% or more of the voting stock of the Company, or is an affiliate of the Company andbeneficially owned, directly or indirectly, 10% or more of the voting stock of the Company within the prior two years. Any business combination to which the statute appliesmust be approved by 80% of the voting power of the Company’s stock and at least two-thirds of the voting power of the Company’s stock not beneficially held by thesignificant shareholder who is party to the relevant transaction or any of its affiliates or associates, in each case voting together as a single group, unless:
(a) the aggregate value of the per share consideration is equal to the highest of:• the highest per share price paid for any shares of Common Stock of the Company by the significant shareholder in the transaction in which it became a
significant shareholder or within two years before the date of the business combination,• the market value per share of the Company’s shares on the date of commencement of any tender offer by the significant shareholder, the date on which the
person became a significant shareholder or the date of the first public announcement of the proposed business combination, whichever is highest, or• the highest preferential amount per share in a liquidation or dissolution to which holders of the shares would be entitled,
and
(b) the significant shareholder offers either cash or the same form of consideration used by the significant shareholder to acquire the largest number of shares it acquired.
Section 180.1132(2)(c) of the WBCL permits a corporation to elect to not be governed by Sections 180.1130 to 180.1134 (Section 180.1134 is described below) upon theamendment to its articles of incorporation to so provide if such amendment is approved by specified supermajority votes of the shareholders. The Articles include no suchprovision.
Defensive action restrictions
Section 180.1134 of the WBCL provides that, in addition to the vote otherwise required by law or the articles of incorporation of a resident domestic corporation, theapproval of the holders of a majority of the shares entitled to vote on the proposal is required before the corporation can take certain action while a takeover offer is being madeor after a takeover offer has been publicly announced and before it is concluded. This statute requires shareholder approval for the corporation to do either of the following: (i)acquire more than 5% of its outstanding voting shares at a price above the market price from any individual or organization that owns more than 3% of the outstanding votingshares and has held such shares for less than two years, unless a similar offer is made to acquire all voting shares and all securities which may be converted into voting shares or(ii) sell or option assets of the corporation which amount to 10% or more of the market value of the corporation, unless the corporation has at least three directors who are notofficers or employees and a majority of the directors who are not officers or employees vote not to have this provision apply to the corporation.
Control share voting restrictions
Under Section 180.1150 of the WBCL, unless otherwise provided in the articles of incorporation or otherwise specified by the corporation’s board of directors, the votingpower of shares of a resident domestic corporation held by any person, or group of persons acting together, including shares issuable upon conversion of convertible securitiesor upon exercise of options or warrants, in excess of 20% of the voting power in the election of directors is limited (in voting on any matter) to 10% of the full voting power ofthose shares. This restriction does not apply to shares acquired directly from the resident domestic corporation, shares acquired before April 22, 1986, shares acquired in certainspecified transactions, or shares acquired in a transaction in which the corporation’s shareholders have approved restoration of the full voting power of the otherwise restrictedshares. In addition, this restriction does not apply if the corporation’s articles of incorporation include a provision that the restriction of this statute will not apply or its board ofdirectors adopt a resolution specifying that the restriction does not apply. The Articles include no such provision.
Constituency or stakeholder provision
Under Section 180.0827 of the WBCL, in discharging his or her duties as a director or officer and in determining what he or she believes to be in our best interests, adirector or officer may, in addition to considering the effects of any action on shareholders, consider the effects of the action on employees, suppliers, customers, thecommunities in which we operate and any other factors that the director or officer considers pertinent.

Exhibit 21
NAME OF SUBSIDIARY: STATE/COUNTRY OF INCORPORATION:Hydratight Angola Lda AngolaActuant Australia Pty. Ltd. AustraliaActuant Energy Pty. Ltd. AustraliaCortland Company Australia Pty. Ltd. AustraliaHydratight (Asia Pacific) Pty. Ltd. AustraliaHydratight Equipamentos Servicos e Industria Ltda. BrazilPower Packer do Brazil Ltda. BrazilTurotest Medidores Ltda. BrazilActuant Canada Corporation CanadaActuant Changchun Co. Ltd. ChinaActuant China Industries Co. Ltd. ChinaActuant China Ltd. ChinaActuant Shanghai Trading Co. Ltd. ChinaActuant Cyprus Ltd CyprusActuant International Holdings, Inc. DelawareActuant UK Holdings, LLC DelawareCortland Company, Inc DelawareATU Worldwide Holdings II LLC DelawareHydratight Operations, Inc. DelawareMaxima Holding Company Inc. DelawareMaxima Holdings Europe, Inc DelawareMaxima Technologies & Systems, LLC. DelawarePower Packer North America, Inc. DelawareEngineered Components and Systems, LLC DelawareEngineered Components and Systems II, LLC DelawareVersa Technologies, Inc. DelawareWeasler Engineering, Inc DelawareCrossControl OY FinlandActuant Europe Holdings SAS FranceActuant France SAS FranceHydratight SAS FranceYvel SAS FranceActuant GmbH GermanyHydratight Injectaseal Deutschland GmbH GermanyActuant Global Sourcing, Ltd. Hong KongActuant International Services, Ltd. Hong KongEC&S Holdings Hong Kong Ltd. Hong KongMastervolt Asia Ltd. Hong KongActuant Hungary Holding Kft. HungaryActuant Hungary Kft. HungaryATU Hungary Holding Kft. HungaryWeasler Engineering Kft. HungaryActuant India Pvt. Ltd. IndiaEngineered Solutions LP IndianaEnerpac SpA ItalyEnerpac Co. Ltd Japan

AE Investments I Ltd. JerseyAE Investments II Ltd. JerseyActuant Holdings Kazakhstan LLP KazakhstanActuant JV Kazakhstan LLP KazakhstanHydratight Operating Company Kazakhstan LLP KazakhstanMT&S Europe, S.a.r.l. LuxembourgCrossControl Sdn. Bhd. MalaysiaActuant Mexico Holdings S. de R.L. de C.V. MexicoInstrumentos Stewart Warner de Mexico S.A. de C.V. MexicoActuant Europe CV NetherlandsApplied Power Europa BV NetherlandsATU Euro Finance BV NetherlandsATU Global Holdings CV NetherlandsATU Global Holdings II BV NetherlandsBML Global Holdings CV NetherlandsEnerpac BV NetherlandsEnerpac Heavy Lifting Technology BV NetherlandsEngineered Solutions Holdings CV NetherlandsHydratight BV NetherlandsPower Packer Europa BV NetherlandsWeasler Engineering BV NetherlandsActuant Investments, Inc. NevadaATU M.E. Investments, LLC NevadaATU Worldwide Holdings I Inc. New YorkBW Elliott Mfg. Co., LLC New YorkEnerpac AS NorwaySelantic AS NorwayVenice Holdings AS NorwayVenice Norge AS NorwayHydratight Arabia Limited Saudi ArabiaActuant Asia Pte. Ltd. SingaporeEnerpac Asia Pte. Ltd. SingaporeActuant Operations Singapore Pte Ltd. SingaporeVenice (Singapore) Pte Ltd. SingaporeVenice Holdings (Singapore) Pte Ltd. SingaporeEnerpac Africa (Pty) Ltd. South AfricaActuant Korea Ltd. South KoreaActuant Middle East Holdings, S.L. SpainEnerpac Spain, S.L. SpainEngineered Components and Systems Holding Spain SL SpainLarzep, S.A. SpainMaxima Technologies, S.L. SpainActuant Holdings AB SwedenActuant Sweden HB SwedenCrossCo Investment AB SwedenCrossControl AB SwedenEnerpac Scandinavia AB SwedenEngineered Components and Systems Holdings Alfta AB SwedenEqualizer International Inc. TexasPSL Holdings, Inc. Texas

Hydratight Ltd. TrinidadErgun Hidrolik Sanayi VE Ticaret A.S. TurkeyActuant Acquisitions Ltd. UKActuant Acquisitions Finance Ltd. UKActuant Energy Ltd. UKActuant Finance Ltd UKActuant Global Financing Limited UKActuant Ltd. UKActuant International Ltd. UKActuant Operations UK Ltd. UKAE Holdings Ltd. UKATU Asia Holdings Ltd. UKATU Investments Ltd UKBML PN Ltd UKCAM 1 Ltd UKCortland UK Holdings Ltd. UKD.L. Ricci Ltd. UKEqualizer Flange Integrity Systems Ltd. UKEqualizer International Ltd. UKHT Global Holdings Limited UKHydratight Ltd. UKHydratight Operations, Ltd. UKMirage Machines Limited UKVenice Fundco Ltd. UKVenice Topco Ltd. UKEnerpac Middle East FZE United Arab Emirates
Hydratight FZE United Arab Emirates

Exhibit 23
CONSENT OF INDEPENDENT REGISTERED PUBLIC ACCOUNTING FIRM
We hereby consent to the incorporation by reference in the Registration Statements on Form S-8 (No. 333-215592, 333-53704, 333-89068, 333-102523, 333-102524, 333-112008, 33-118811, 333-131186, 333-131187, 333-156734, 333-179007, 333-186146, 333-164304, and 333-164303) of Actuant Corporation of our report dated October 28,2019 relating to the financial statements and financial statement schedule and the effectiveness of internal control over financial reporting, which appears in this Form 10-K.
/s/ PricewaterhouseCoopers LLP
Milwaukee, WisconsinOctober 28, 2019
Exhibit 31.1
CERTIFICATION
I, Randal W. Baker, certify that:
1. I have reviewed this annual report on Form 10-K of ActuantCorporation;
2. Based on my knowledge, this report does not contain any untrue statement of a material fact or omit to state a material fact necessary to make the statements made, inlight of the circumstances under which such statements were made, not misleading with respect to the period covered by this report;
3. Based on my knowledge, the financial statements, and other financial information included in this report, fairly present in all material respects the financial condition,results of operations and cash flows of the registrant as of, and for, the periods presented in this report;
4. The registrant’s other certifying officer and I are responsible for establishing and maintaining disclosure controls and procedures (as defined in Exchange Act Rules13a-15(e) and 15d-15(e)) and internal control over financial reporting (as defined in Exchange Rules 13a-15(f) and 15d-15(f)) for the registrant and have:
a) Designed such disclosure controls and procedures, or caused such disclosure controls and procedures to be designed under our supervision, to ensure thatmaterial information relating to the registrant, including its consolidated subsidiaries, is made known to us by others within those entities, particularly duringthe period in which this report is being prepared;
b) Designed such internal control over financial reporting, or caused such internal control over financial reporting to be designed under our supervision, toprovide reasonable assurance regarding the reliability of financial reporting and the preparation of financial statements for external purposes in accordancewith generally accepted accounting principles;
c) Evaluated the effectiveness of the registrant’s disclosure controls and procedures and presented in this report our conclusions about the effectiveness of thedisclosure controls and procedures, as of the end of the period covered by this report based on such evaluations; and
d) Disclosed in this report any change in the registrant’s internal control over financial reporting that occurred during the registrant’s most recent fiscal quarter(the registrant’s fourth fiscal quarter in the case of an annual report) that has materially affected, or is reasonably likely to materially affect, the registrant’sinternal control over financial reporting; and
5. The registrant’s other certifying officer and I have disclosed, based on our most recent evaluation of internal control over financial reporting, to the registrant’sauditors and the audit committee of the registrant’s board of directors (or persons performing the equivalent functions):
a) All significant deficiencies and material weaknesses in the design or operation of internal control over financial reporting which are reasonably likely toadversely affect the registrant’s ability to record, process, summarize and report financial information; and
b) Any fraud, whether or not material, that involves management or other employees who have a significant role in the registrant’s internal control over financialreporting
Date: October 28, 2019
/s/ Randal W. Baker
Randal W. BakerPresident and Chief Executive Officer

Exhibit 31.2
CERTIFICATION
I, Rick T. Dillon, certify that:
1. I have reviewed this annual report on Form 10-K of ActuantCorporation;
2. Based on my knowledge, this report does not contain any untrue statement of a material fact or omit to state a material fact necessary to make the statements made, inlight of the circumstances under which such statements were made, not misleading with respect to the period covered by this report;
3. Based on my knowledge, the financial statements, and other financial information included in this report, fairly present in all material respects the financial condition,results of operations and cash flows of the registrant as of, and for, the periods presented in this report;
4. The registrant’s other certifying officer and I are responsible for establishing and maintaining disclosure controls and procedures (as defined in Exchange Act Rules13a-15(e) and 15d-15(e)) and internal control over financial reporting (as defined in Exchange Rules 13a-15(f) and 15d-15(f)) for the registrant and have:
a) Designed such disclosure controls and procedures, or caused such disclosure controls and procedures to be designed under our supervision, to ensure thatmaterial information relating to the registrant, including its consolidated subsidiaries, is made known to us by others within those entities, particularly duringthe period in which this report is being prepared;
b) Designed such internal control over financial reporting, or caused such internal control over financial reporting to be designed under our supervision, toprovide reasonable assurance regarding the reliability of financial reporting and the preparation of financial statements for external purposes in accordancewith generally accepted accounting principles;
c) Evaluated the effectiveness of the registrant’s disclosure controls and procedures and presented in this report our conclusions about the effectiveness of thedisclosure controls and procedures, as of the end of the period covered by this report based on such evaluation; and
d) Disclosed in this report any change in the registrant’s internal control over financial reporting that occurred during the registrant’s most recent fiscal quarter(the registrant’s fourth fiscal quarter in the case of an annual report) that has materially affected, or is reasonably likely to materially affect, the registrant’sinternal control over financial reporting; and
5. The registrant’s other certifying officer and I have disclosed, based on our most recent evaluation of internal control over financial reporting, to the registrant’sauditors and the audit committee of the registrant’s board of directors (or persons performing the equivalent functions):
a) All significant deficiencies and material weaknesses in the design or operation of internal control over financial reporting which are reasonably likely toadversely affect the registrant’s ability to record, process, summarize and report financial information; and
b) Any fraud, whether or not material, that involves management or other employees who have a significant role in the registrant’s internal control over financialreporting
Date: October 28, 2019
/s/ Rick T. Dillon
Rick T. DillonExecutive Vice President andChief Financial Officer

Exhibit 32.1
WRITTEN STATEMENT OF THE CHIEF EXECUTIVE OFFICER
Pursuant to 18 U.S.C. ss.1350, I, the undersigned President and Chief Executive Officer of Actuant Corporation (the “Company”), hereby certify, based on myknowledge, that the Annual Report on Form 10-K of the Company for the annual period ended August 31, 2019 (the “Report”) fully complies with the requirements of Sections13(a) or 15(d) of the Securities Exchange Act of 1934 and that information contained in the Report fairly presents, in all material respects, the financial condition and results ofoperations of the Company as of and for the periods covered in the Report.
Date: October 28, 2019
/s/ Randal W. Baker Randal W. Baker
A signed original of this written statement required by Section 906, or other document authenticating, acknowledging, or otherwise adopting the signature that appears in typedform within the electronic version of this written statement required by Section 906, has been provided to Actuant Corporation and will be retained by Actuant Corporation andfurnished to the Securities and Exchange Commission or its staff upon request.
The foregoing certification is being furnished to the Securities and Exchange Commission as an exhibit to the Form 10-K and shall not be considered filed as part of the Form10-K.

Exhibit 32.2
WRITTEN STATEMENT OF THE CHIEF FINANCIAL OFFICER
Pursuant to 18 U.S.C. ss.1350, I, the undersigned Executive Vice President and Chief Financial Officer of Actuant Corporation (the “Company”), hereby certify, based onmy knowledge, that the Annual Report on Form 10-K of the Company for the annual period ended August 31, 2019 (the “Report”) fully complies with the requirements ofSections 13(a) or 15(d) of the Securities Exchange Act of 1934 and that information contained in the Report fairly presents, in all material respects, the financial condition andresults of operations of the Company as of and for the periods covered in the Report.
Date: October 28, 2019
/s/ Rick T. Dillon Rick T. Dillon
A signed original of this written statement required by Section 906, or other document authenticating, acknowledging, or otherwise adopting the signature that appears in typedform within the electronic version of this written statement required by Section 906, has been provided to Actuant Corporation and will be retained by Actuant Corporation andfurnished to the Securities and Exchange Commission or its staff upon request.
The foregoing certification is being furnished to the Securities and Exchange Commission as an exhibit to the Form 10-K and shall not be considered filed as part of the Form10-K.