Embed Size (px)
Citation preview

MASTERCLASSFOREX
START 2
1
Laser-Focused System to Unlock Profits from FOREX

www.optionsinfinity.com
FOREX MASTERCLASS - Macro Overview
2
1. Intro to FOREX 1. The 3-Principle Method2. Chart Setup3. Executed Trade Example
1. Finding the Trade2. Entering the Trade3. Exiting the Trade4. THE EDGE
PART 2:PART 1: Part 3:

PART 2: Micro Overview
Regression Channels
Measured Moves
Fibonacci Extensions
Setting them up in your charts

THE 3 PRINCIPLES
To Unlock Profits from FOREX
ManagementEntry Exit

www.optionsinfinity.com
Entry and Exit - The 3 Principles
5
1. Regression Channels 2. Measured Moves 3. Fibonacci Extensions
ManagementEntry Exit

Principle 1:
Regression Channels
ManagementEntry Exit

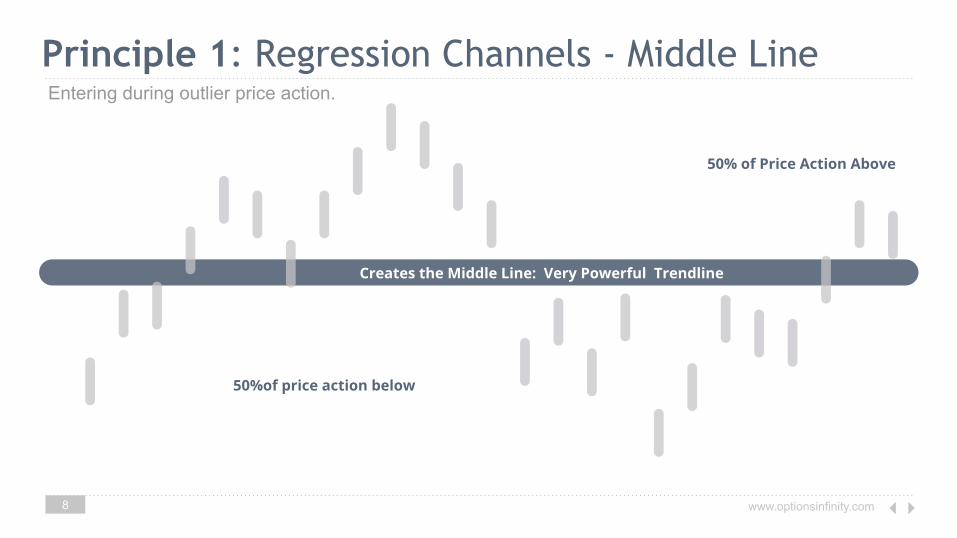
Principle 1: Quick OverviewThe regression line is calculated by taking 50% of the price above the line and 50%
below the line. This may be done over any timeframe. This line become a very
powerful trend line.
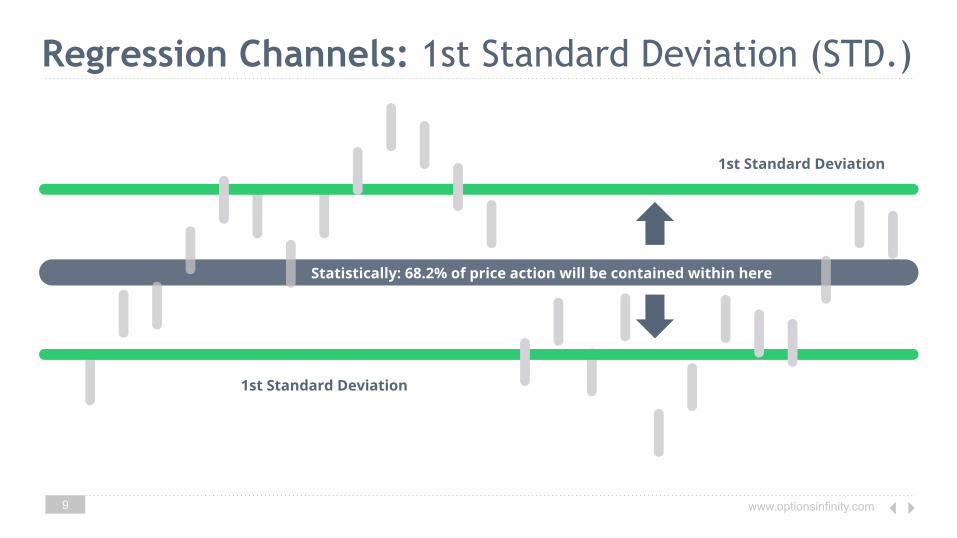
Now if you take 1 standard deviation of this line statistics say that 68.2% of price will be
contained within that channel and at 2 standard deviations 95.4% of price will be
contained within that channel. 95.4%!
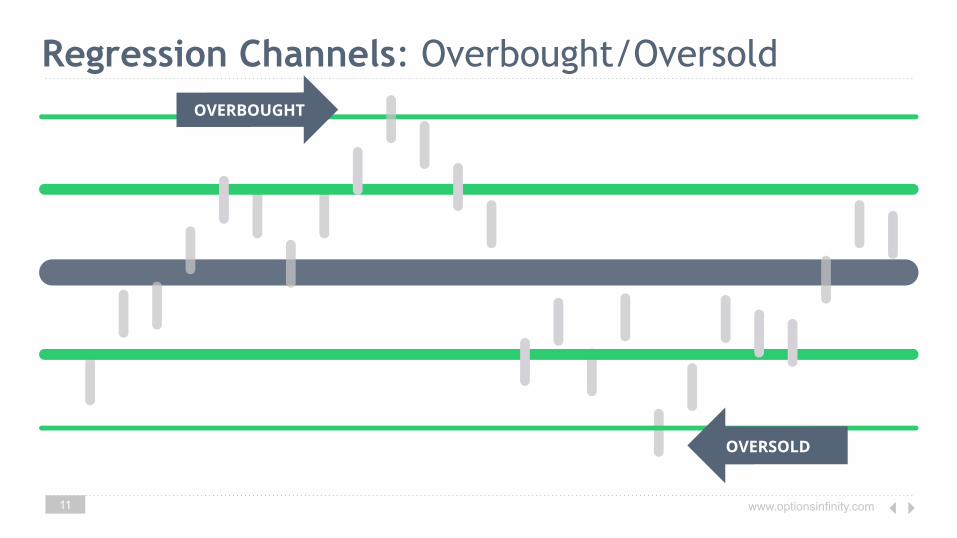
This is the best principle for determining overbought and oversold markets. I used to
plot this by hand knowing the power of this principle. Nowadays any trading platform
will calculate it for you and place it on your chart. How convenient.
www.optionsinfinity.com
Principle 1: Regression Channels - Middle Line
8
50%of price action below
Entering during outlier price action.
Creates the Middle Line: Very Powerful Trendline
50% of Price Action Above
www.optionsinfinity.com
Regression Channels: 1st Standard Deviation (STD.)
9
1st Standard Deviation
Statistically: 68.2% of price action will be contained within here
1st Standard Deviation

www.optionsinfinity.com
Regression Channels: 2nd Standard Deviation
10
2nd Standard Deviation
Statistically: 95.4% of price action will be contained within here
2nd Standard Deviation
www.optionsinfinity.com
Regression Channels: Overbought/Oversold
11
OVERBOUGHT
OVERSOLD

www.optionsinfinity.com
Regression Channels: 1st & 2nd USD/JPY
12

www.optionsinfinity.com
Regression Channels - Chart Setup
13
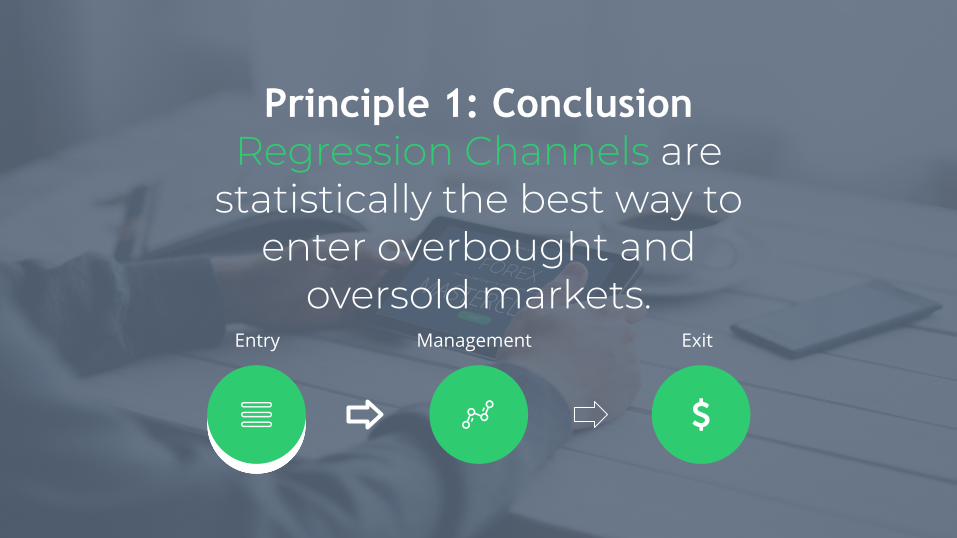
Principle 1: ConclusionRegression Channels are
statistically the best way to enter overbought and
oversold markets.ManagementEntry Exit

Principle 2:
Measured Moves
ManagementEntry Exit
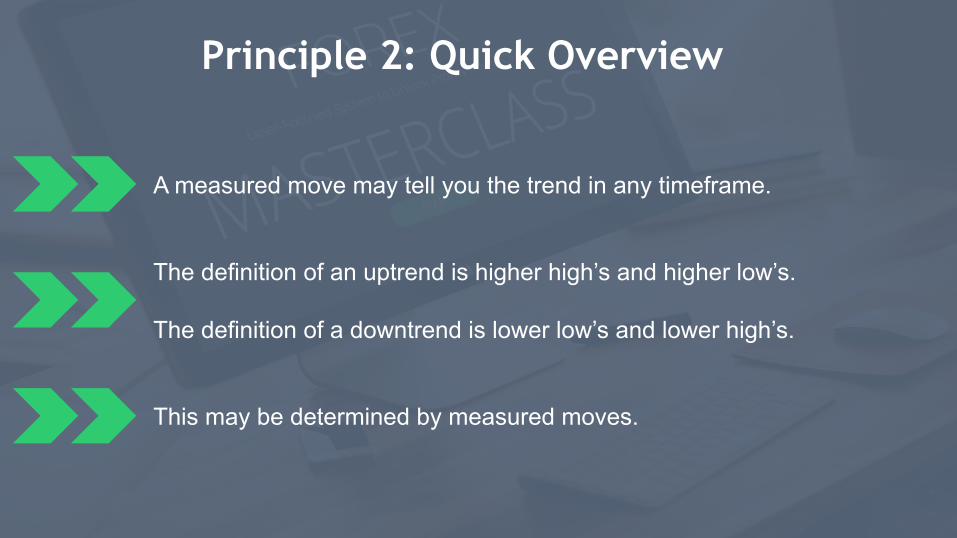
Principle 2: Quick Overview
A measured move may tell you the trend in any timeframe. The definition of an uptrend is higher high’s and higher low’s.
The definition of a downtrend is lower low’s and lower high’s.
This may be determined by measured moves.

www.optionsinfinity.com
Measured Moves: Trade with the Trend
17
A
B
C
D A
B
C
D

www.optionsinfinity.com
Measured Moves - Uptrend
18
BULLISH MEASURED MOVE | Higher Highs and Higher LOWS.
A
B
C
D

www.optionsinfinity.com
Measured Moves - Downtrend
19
BEARISH MEASURED MOVE | Lower Lows and Lower Highs.
A
B
C
D
www.optionsinfinity.com
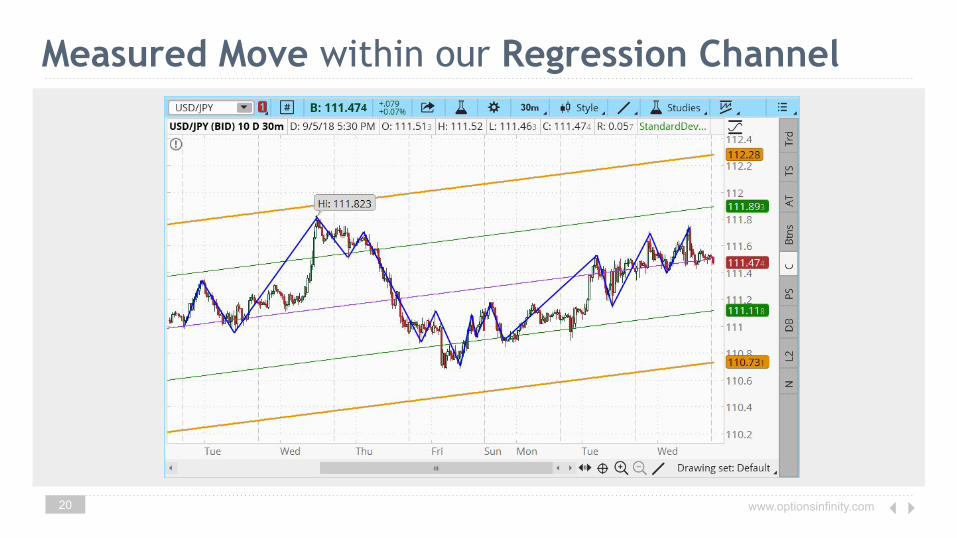
Measured Move within our Regression Channel
20
Measured moves within our Regression Channel.

Principle 2: ConclusionMeasured Moves are the
best way to quantify a trend once you’re in a trade.
ManagementEntry Exit

Principle 3:
Fibonacci Extensions
ManagementEntry Exit

Principle 3: Quick Overview
(.618)^2 = .382 .618Sq. root (.618) = .786 } Used for
Retracements
}1/.382 = 2.6181/.618 = 1.6181/.786 = 1.272
Used for Extensions

www.optionsinfinity.com
Fibonacci Extensions
24
PRICE: Fibonacci Plotting Point: Fibonacci Extensions:
A
B
C
1.61 EXTENSION (target)
1.27 EXTENSION (target)
2.61 EXTENSION (target)

www.optionsinfinity.com
Fibonacci Extensions - USD/JPY
25
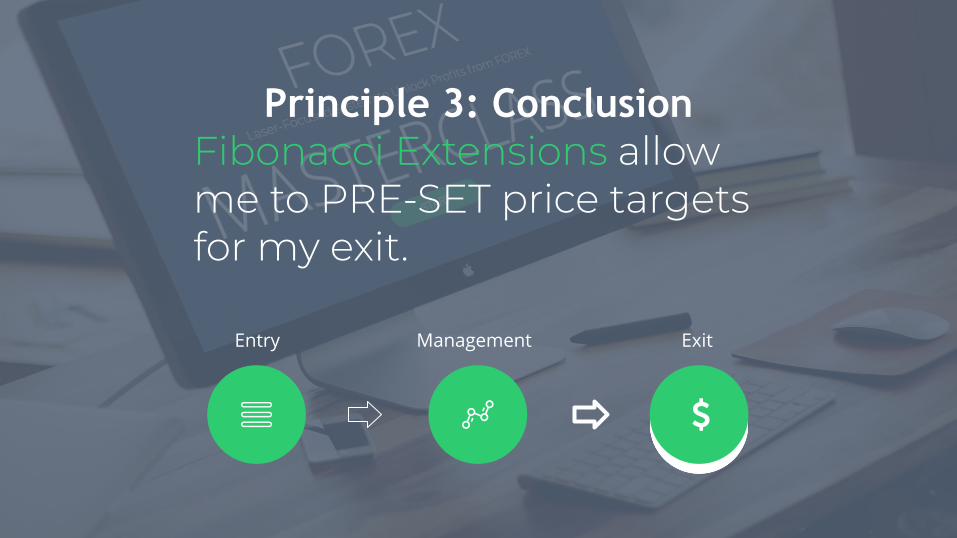
Principle 3: ConclusionFibonacci Extensions allow me to PRE-SET price targets for my exit.
ManagementEntry Exit

www.optionsinfinity.com
Fibonacci Extensions - USD/JPY
27
www.optionsinfinity.com
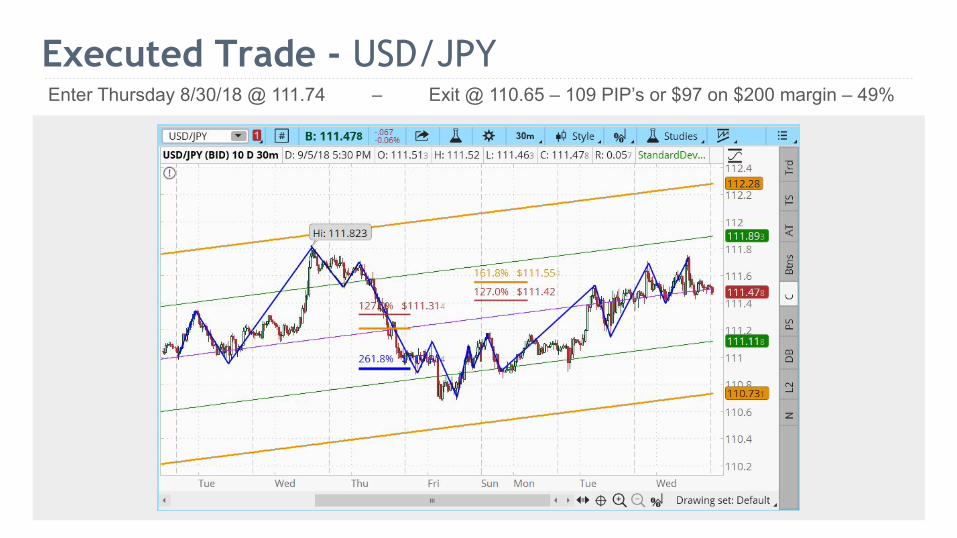
Executed Trade - USD/JPY
28
Enter Thursday 8/30/18 @ 111.74 – Exit @ 110.65 – 109 PIP’s or $97 on $200 margin – 49%
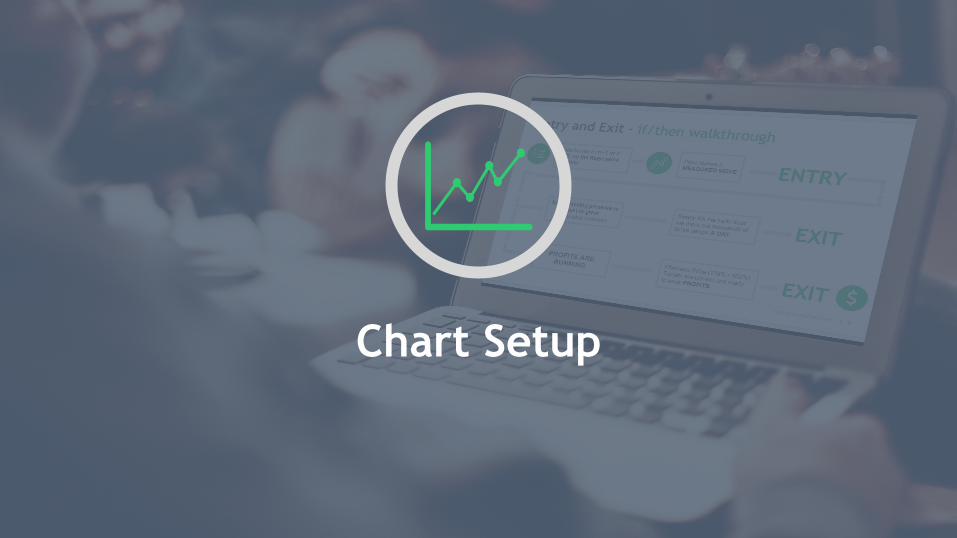
Chart Setup

www.optionsinfinity.com
Chart Setup
30
Measured moves within our Regression Channel.

www.optionsinfinity.com
Chart Setup - Candlesticks
31
Measured moves within our Regression Channel.

www.optionsinfinity.com
Chart Setup – Auto Adjust Regression Channel
32
Measured mes within our Regression Channel.

www.optionsinfinity.com
Chart Setup – Regression Channel 1&2 Std. Dev.
33
Measured moves within our Regression Channel.

www.optionsinfinity.com
Chart Setup – Measured Moves
34
Measured moves within our Regression Channel.

www.optionsinfinity.com
Chart Setup – Fibonacci Extensions
35
Measured moves within our Regression Channel.

Continue to MASTERCLASS Part 3


